Author Contributions
S.Z.: conceptualization, software, methodology, investigation, resources, writing—original draft, writing—reviewing and editing, visualization; R.Z.: conceptualization, supervision, project administration, funding acquisition, writing—reviewing and editing; H.Z.: supervision, methodology, writing—reviewing and editing; X.M. (Xingmin Meng): supervision, project administration, resources; Z.Z.: conceptualization, software, writing—reviewing and editing, supervision; X.M. (Xiangpei Meng): investigation, resources; H.W.: investigation, resources; Y.Z.: methodology, resources; J.L.: data curation, resources. All authors have read and agreed to the published version of the manuscript.
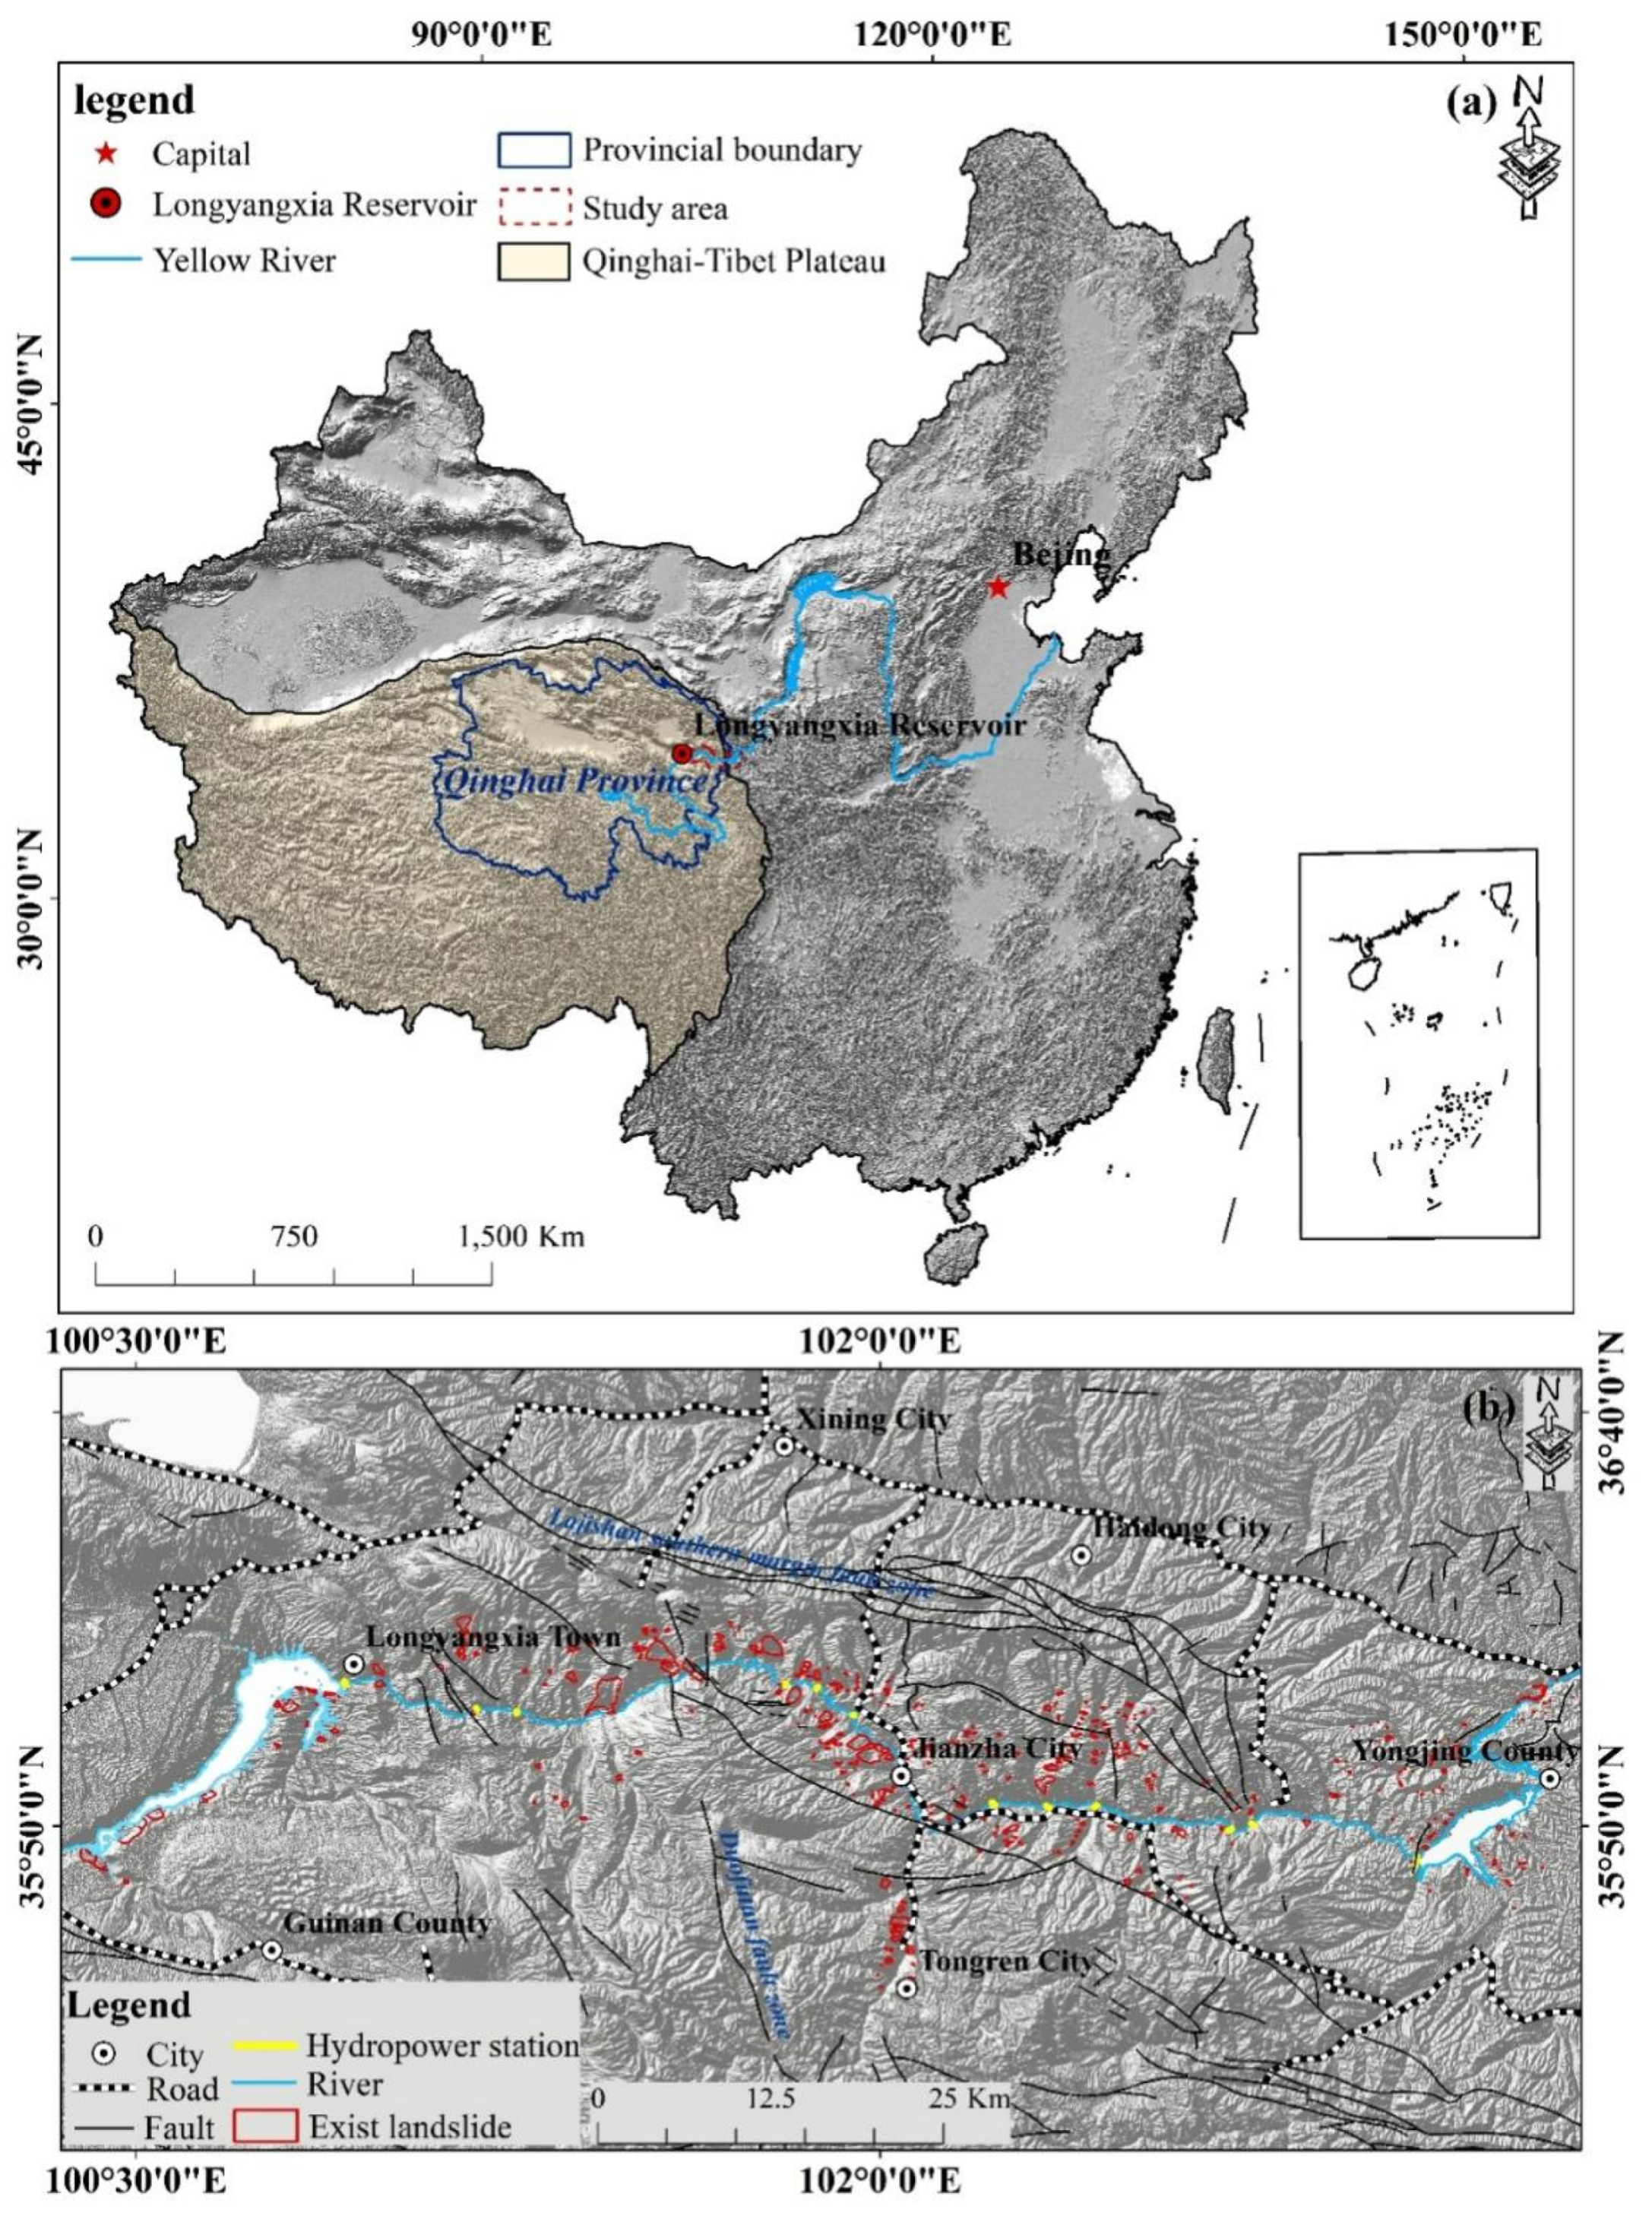
Figure 1.
(a) Geographical location of Longyangxia Reservoir in China. The red solid line is the border of Qinghai Province, the blue shaded area is the Qinghai–Tibet Plateau, and the red triangle is the location of Longyangxia Reservoir. (b) Geological disasters, faults, and hydropower stations in the upper reaches of the Yellow River.
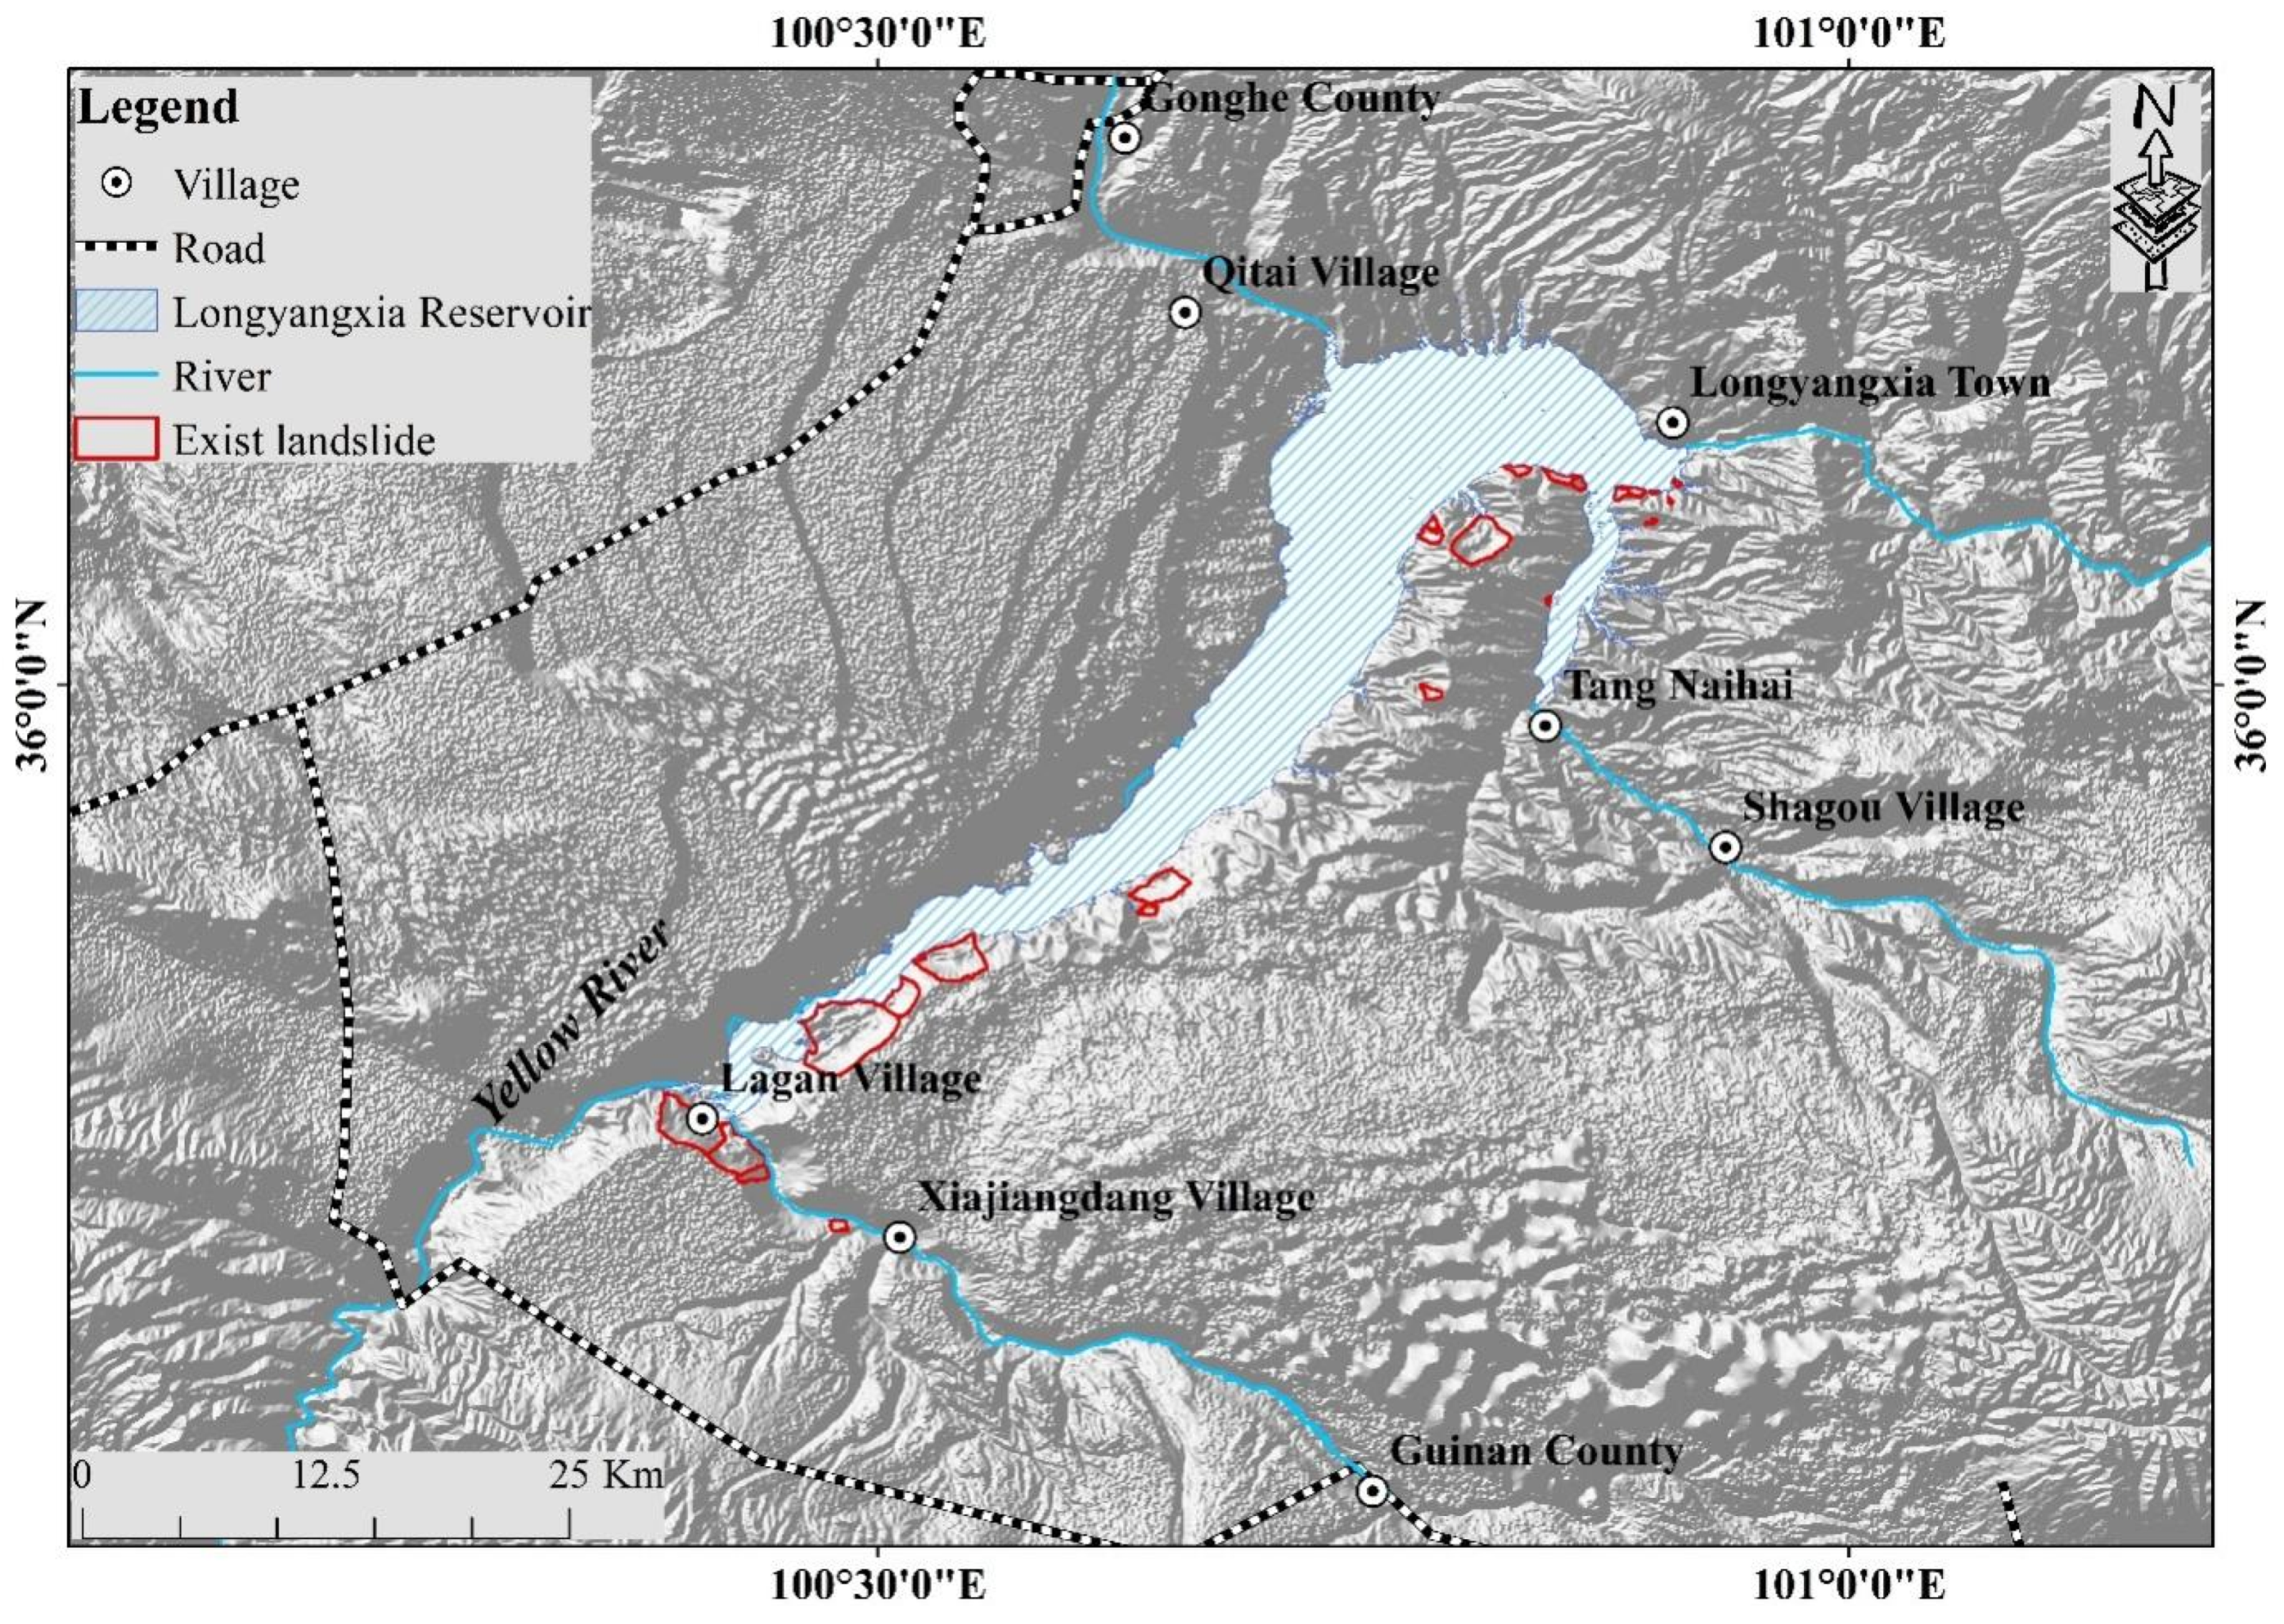
Figure 2.
Longyangxia Reservoir landslide.
Figure 2.
Longyangxia Reservoir landslide.
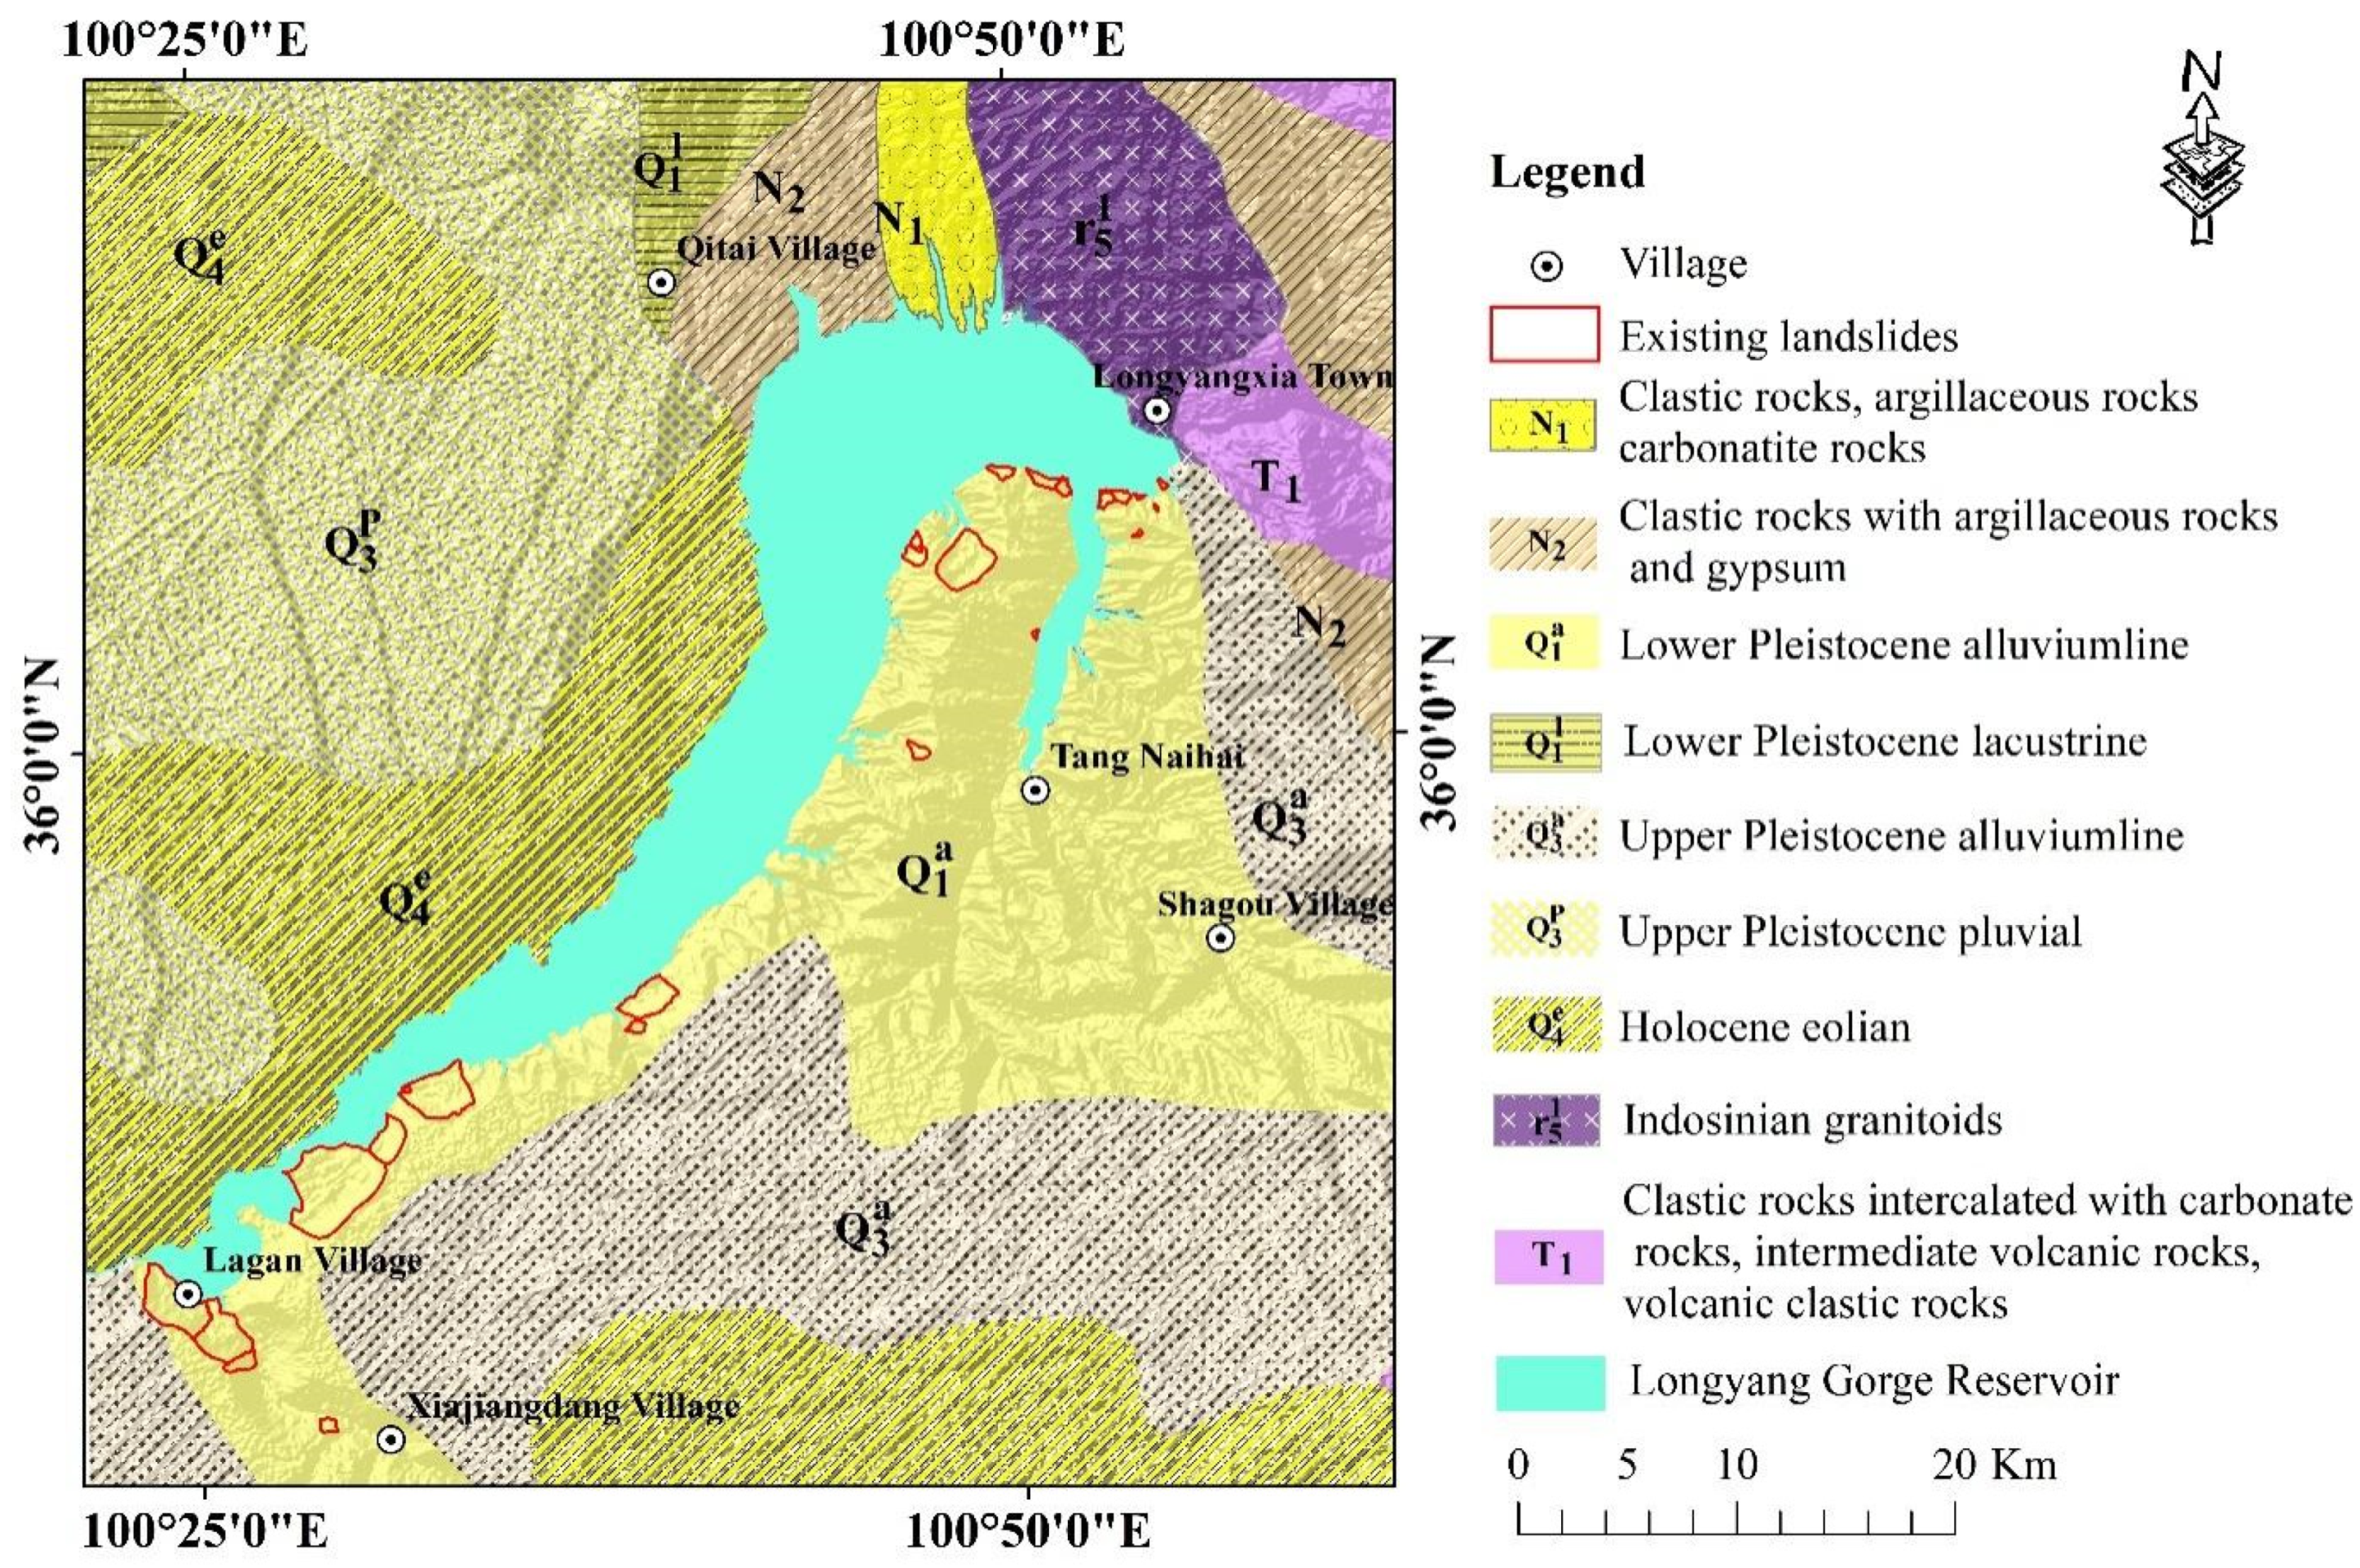
Figure 3.
Geological map of the Longyangxia Reservoir area is digitized from reference [
3].
Figure 3.
Geological map of the Longyangxia Reservoir area is digitized from reference [
3].
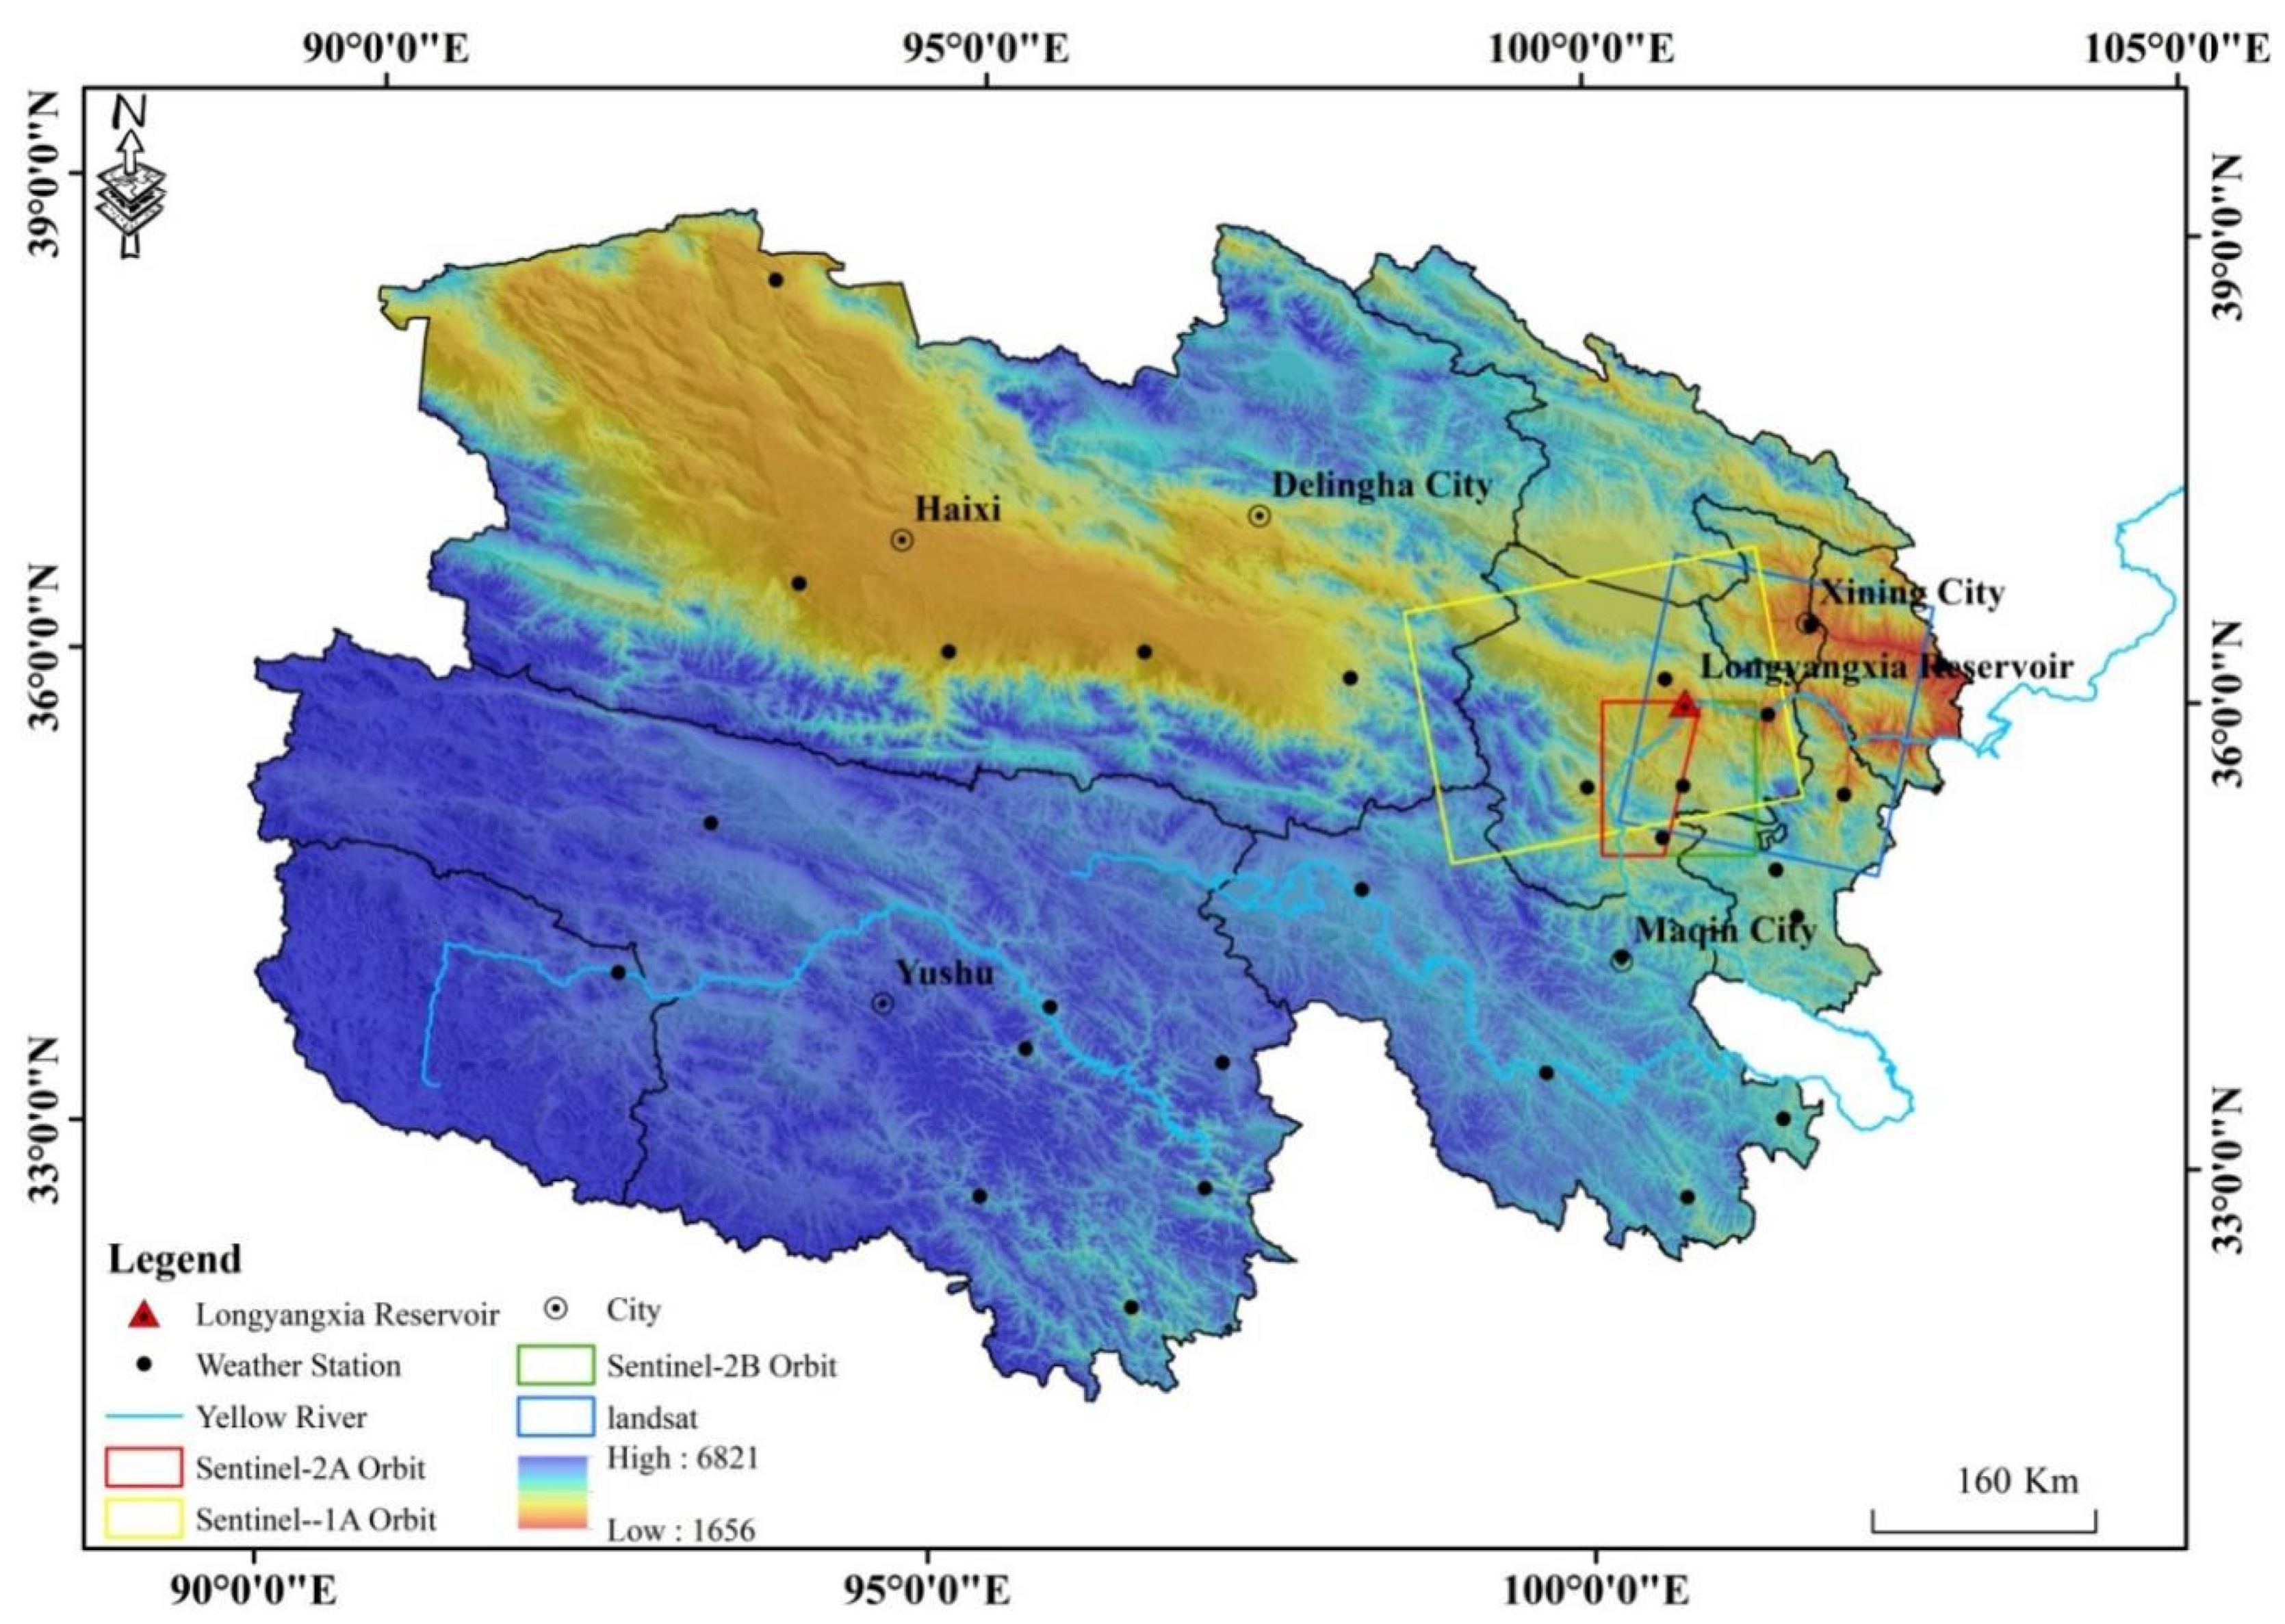
Figure 4.
Track coverage of the SAR image and multisource remote sensing image data in the study area.
Figure 4.
Track coverage of the SAR image and multisource remote sensing image data in the study area.
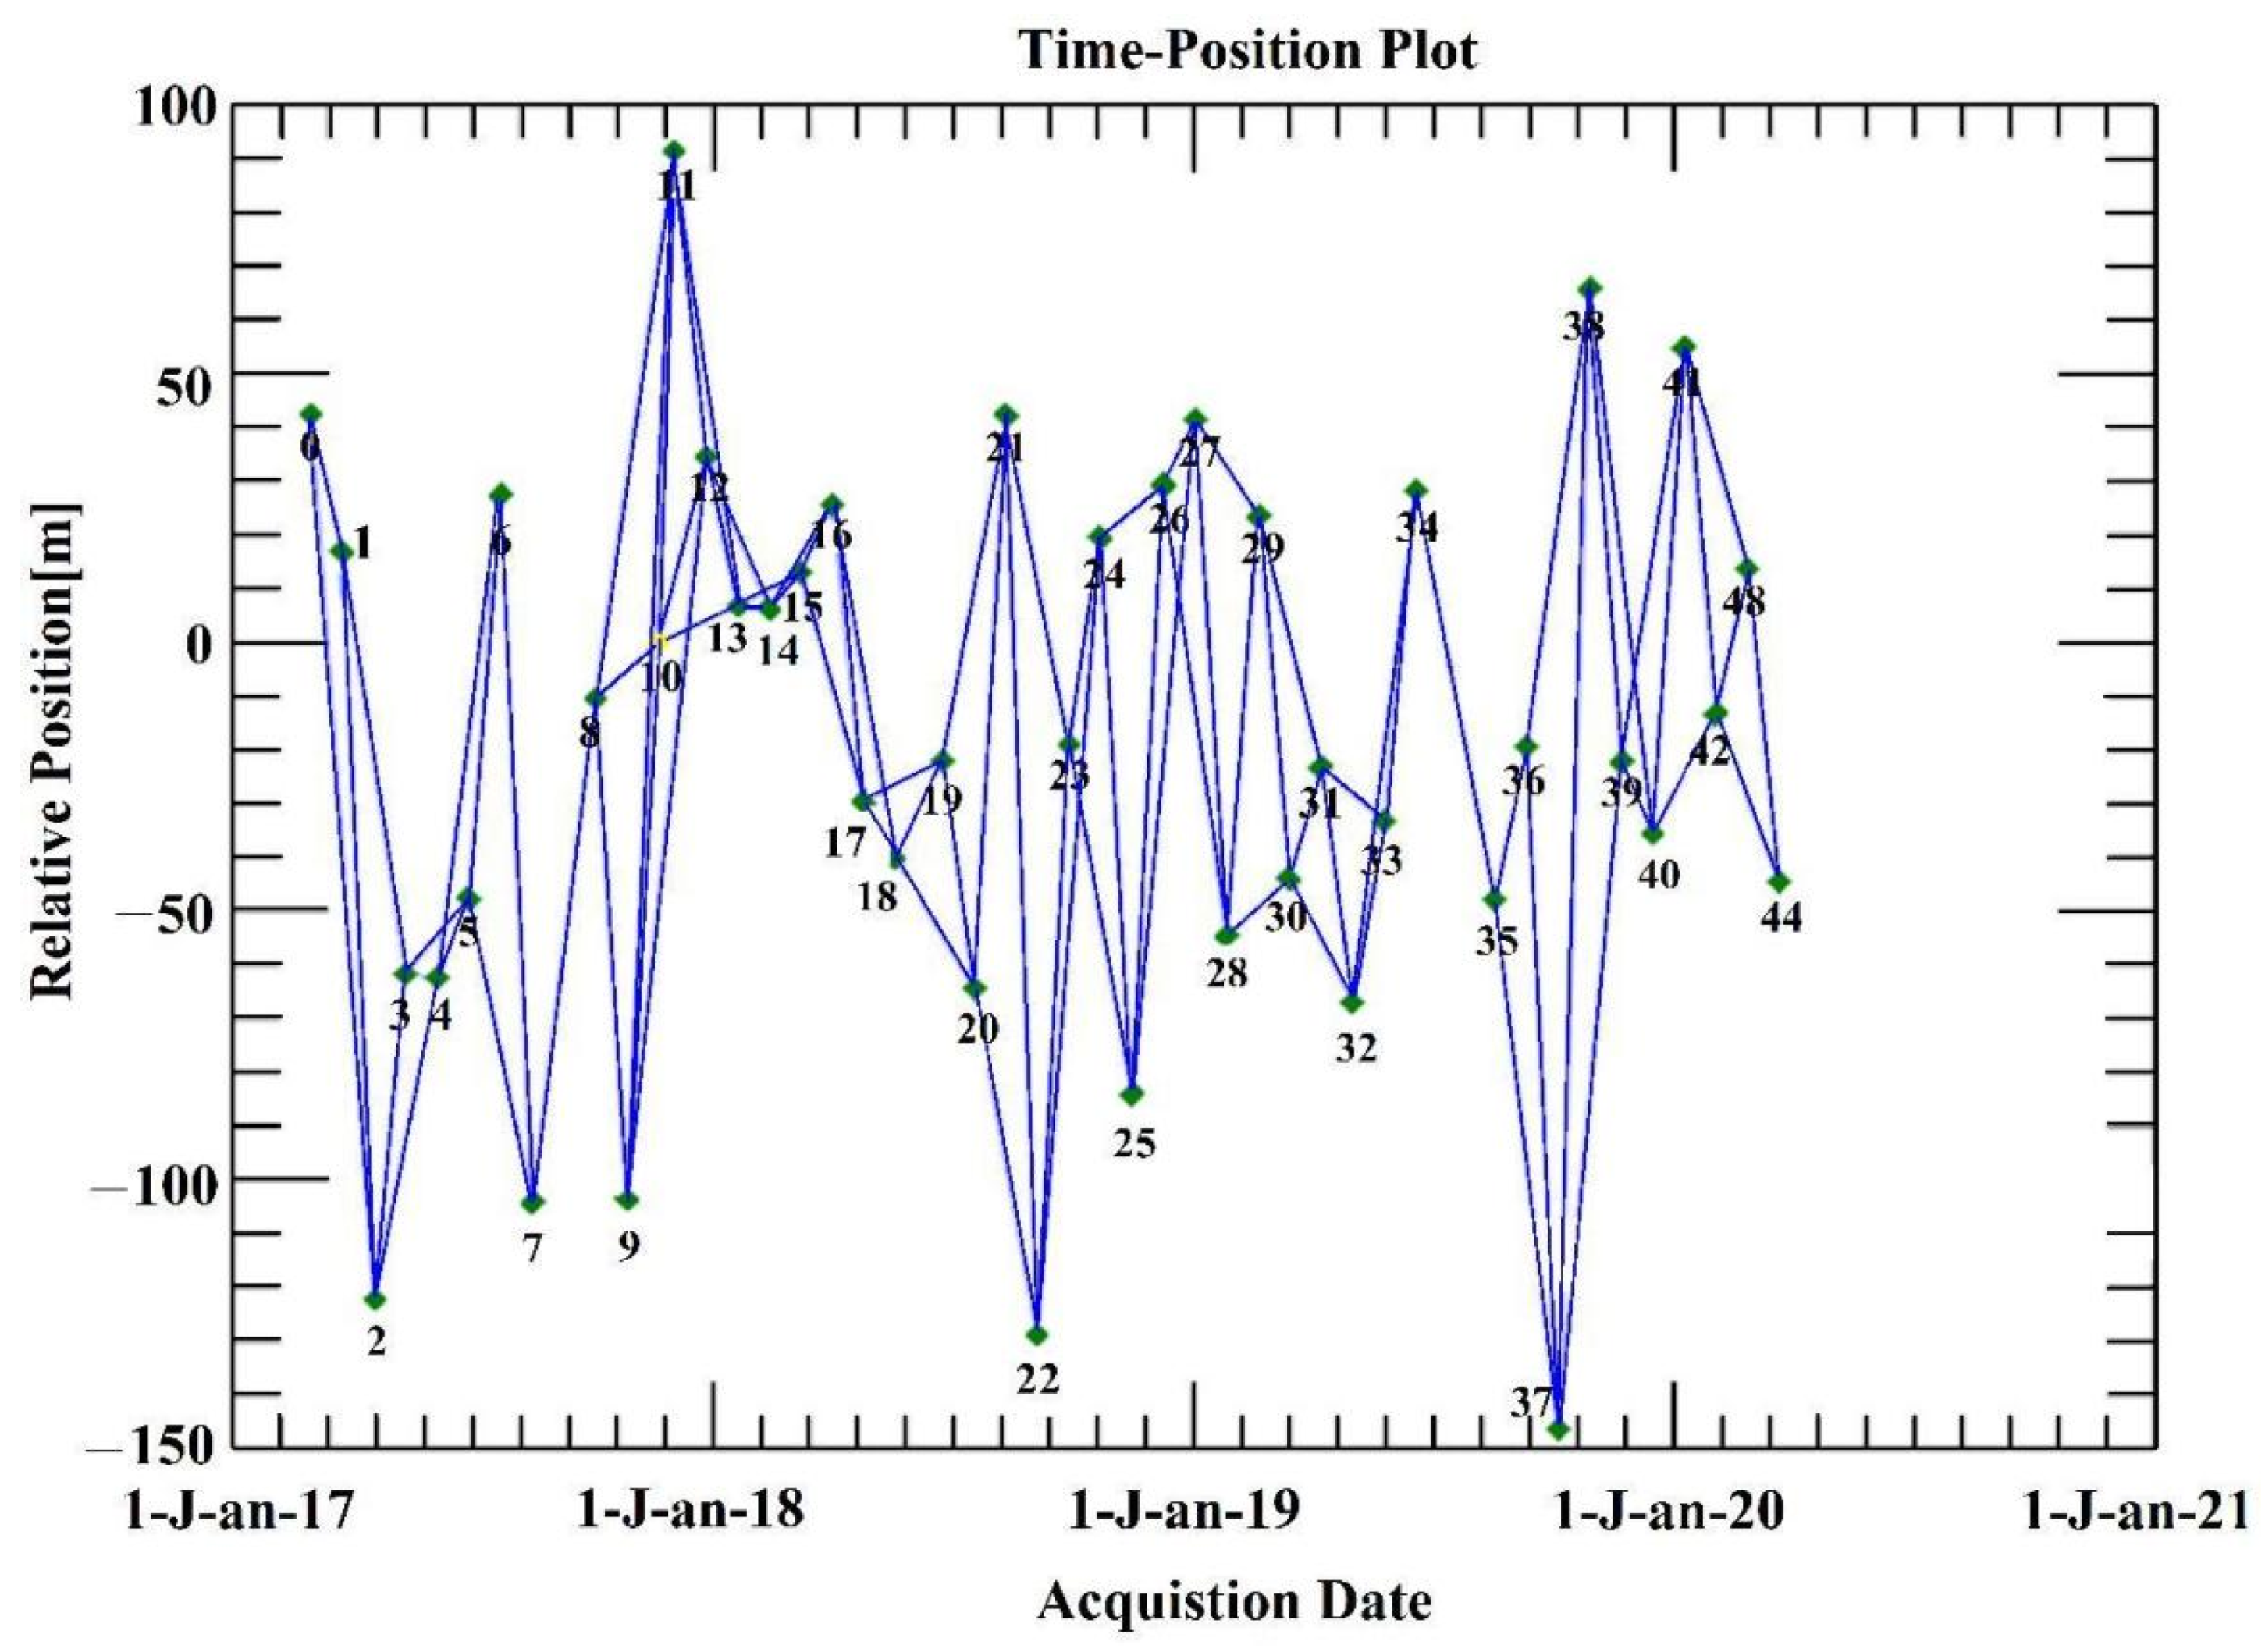
Figure 5.
Spatiotemporal baseline of the SAR images.
Figure 5.
Spatiotemporal baseline of the SAR images.
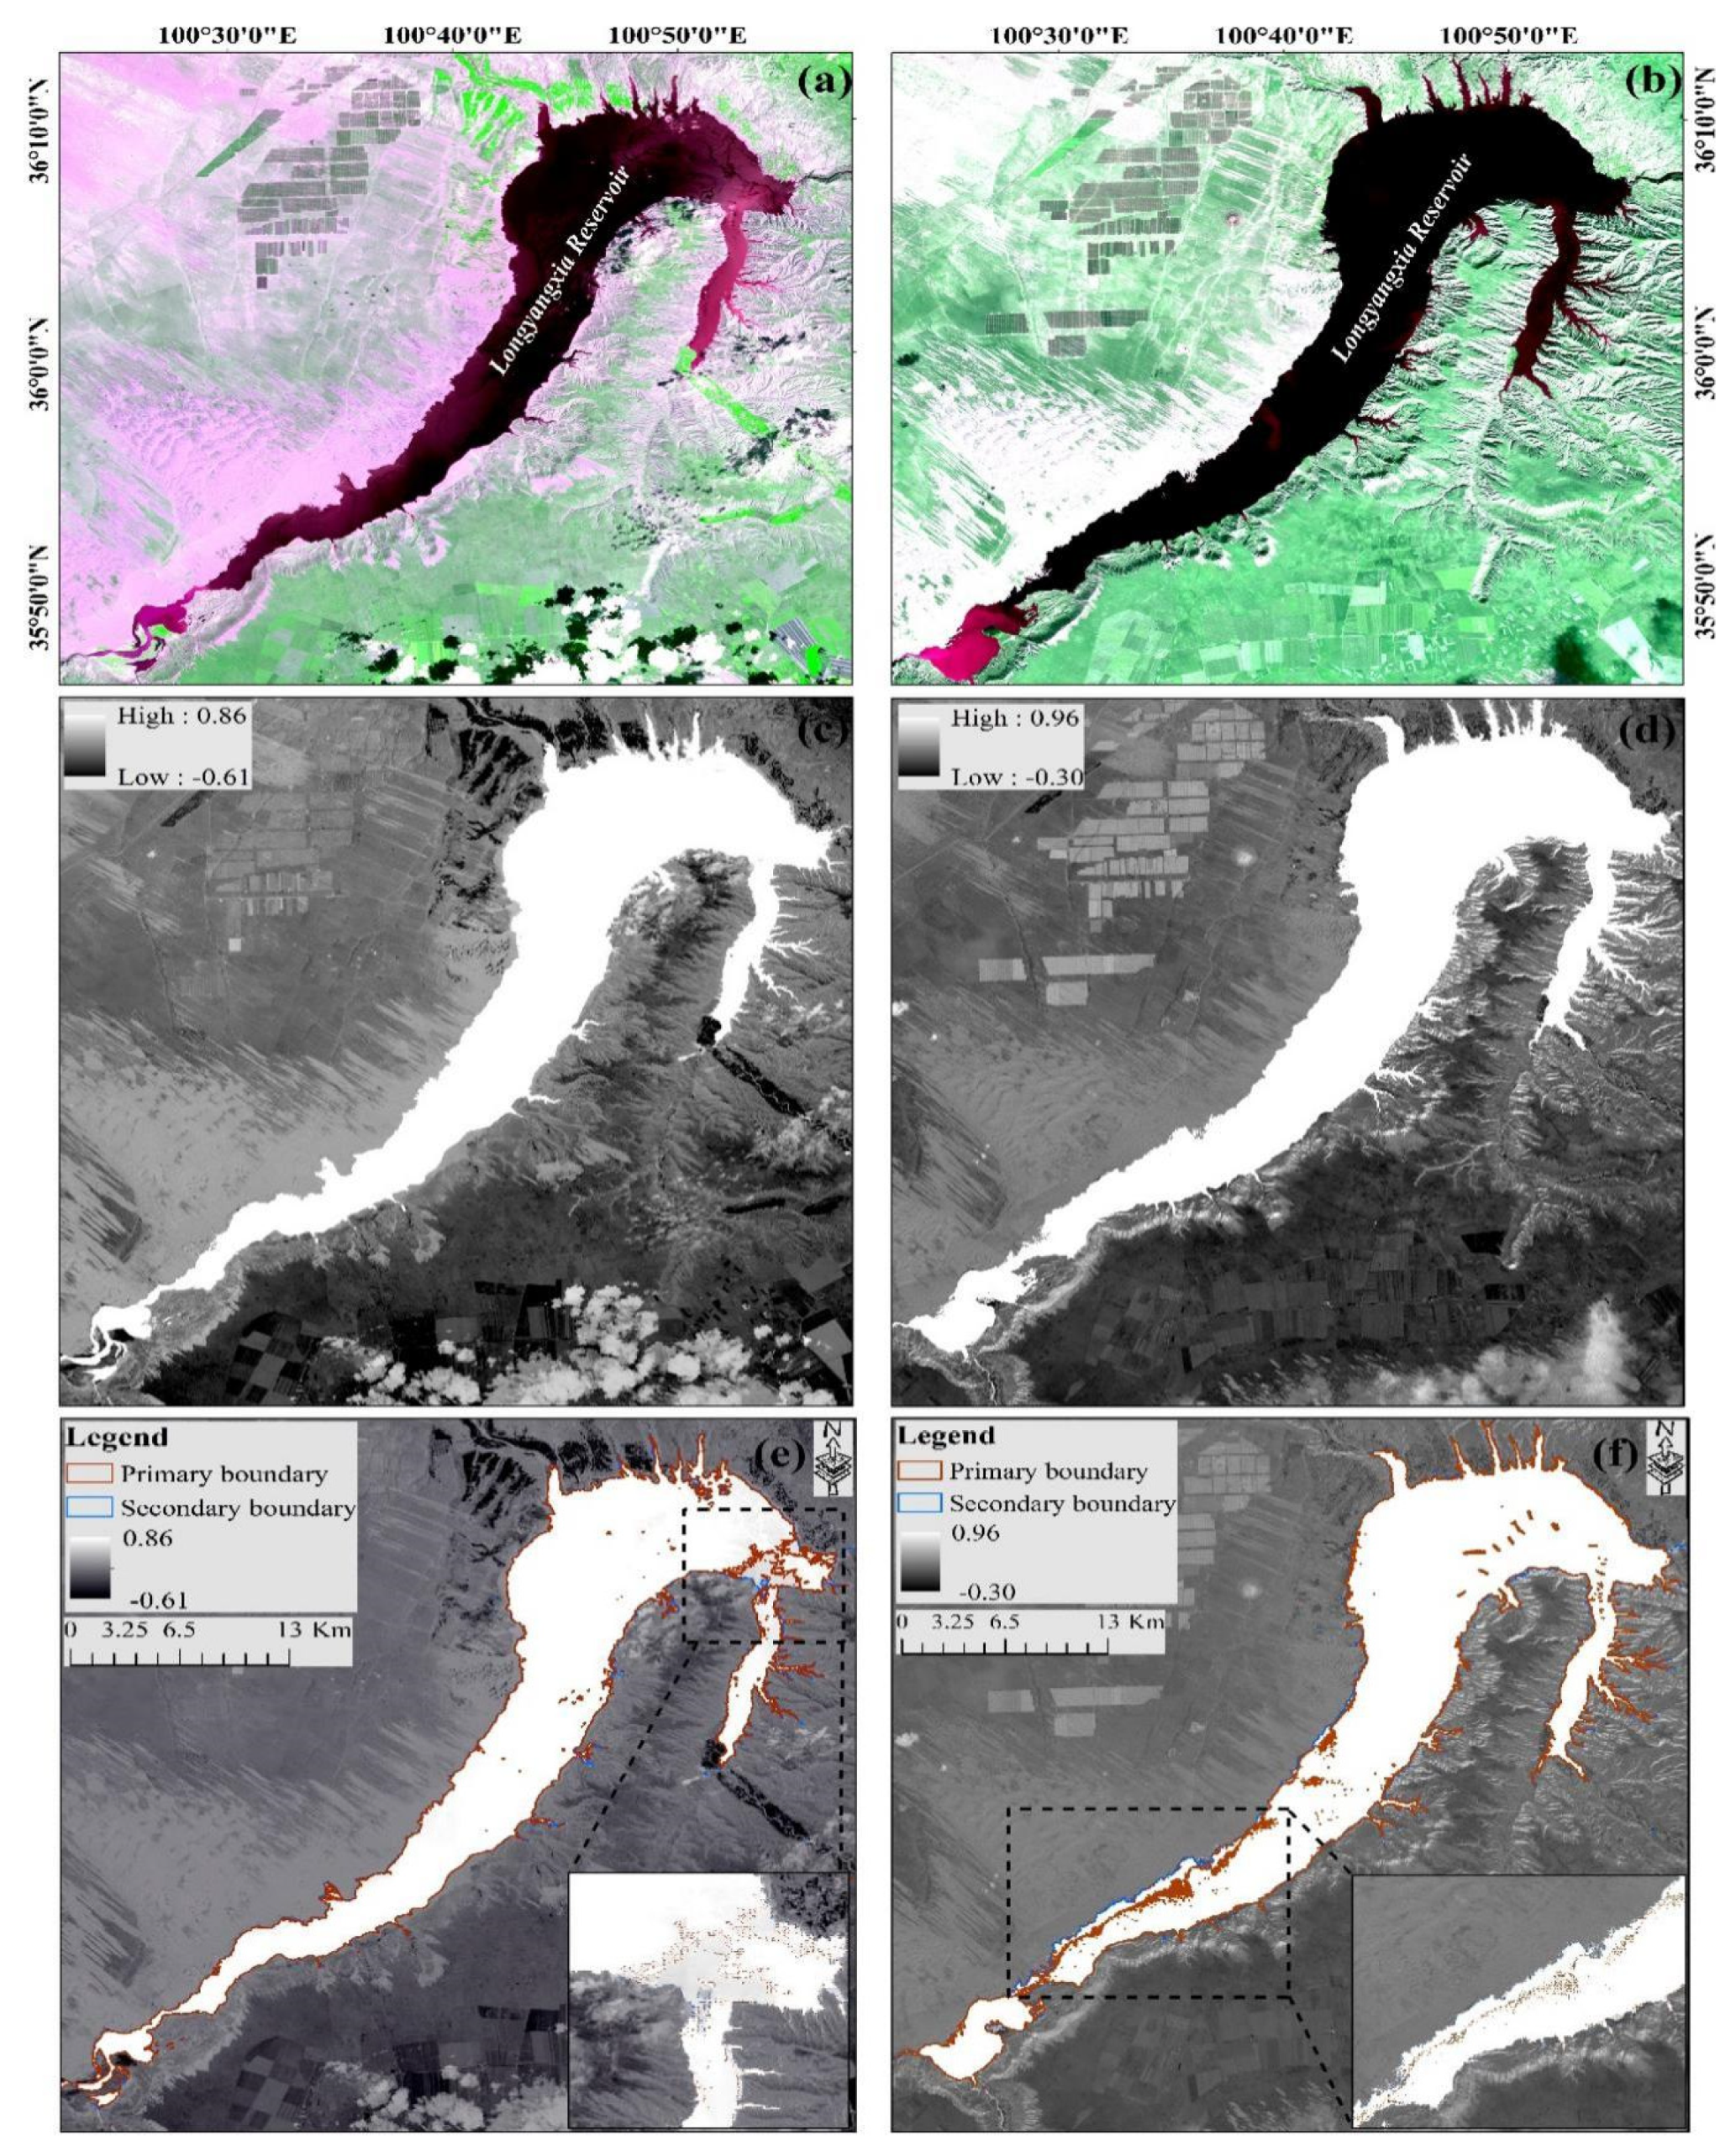
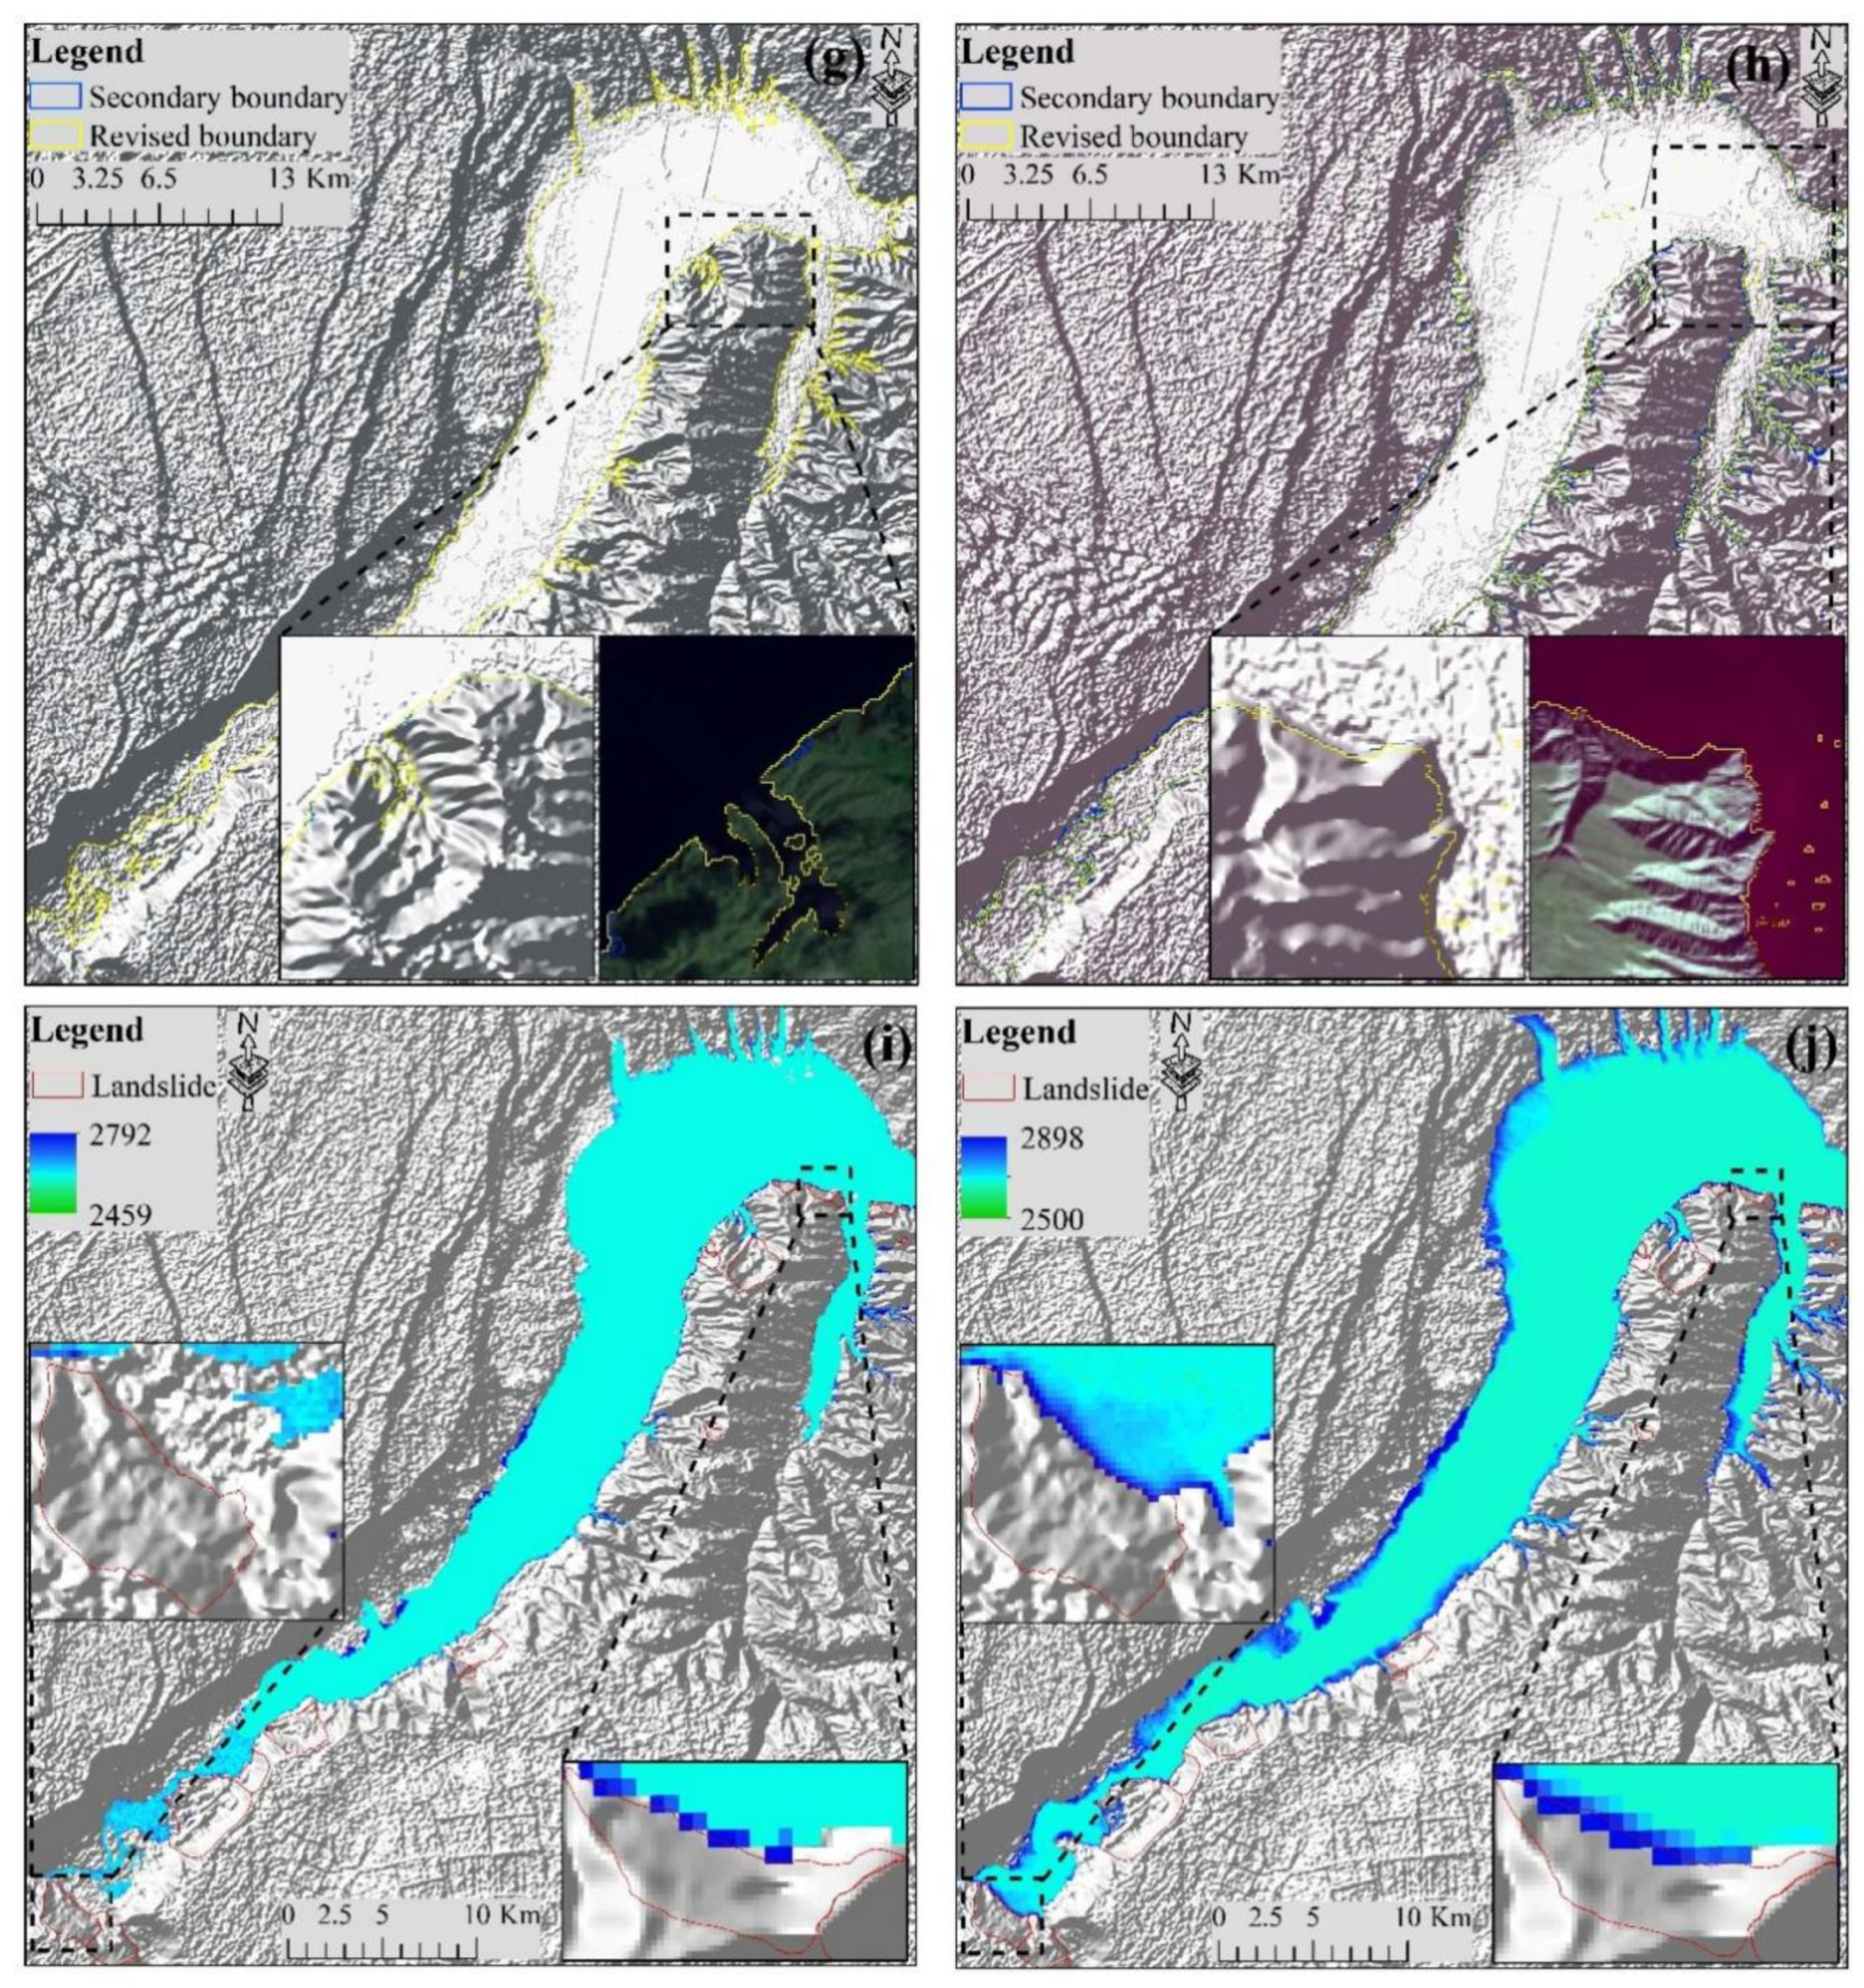
Figure 6.
Using NDWI to extract the water level of Longyangxia Reservoir, taking 16 July 2017 and 26 October 2019 as examples. (a) False color Landsat image on 16 July 2017; (b) False color Landsat image on 26 October 2019; (c) NDWI binarized image on 16 July 2017; (d) NDWI binarized image on 26 October 2019; (e) Water body boundaries under different segmentation thresholds on 16 July 2017; (f) Water bodies under different segmentation thresholds on 26 October 2019; (g) DEM shadow modeling to remove the water body that was erroneously extracted from the water body boundary on 16 July 2017; (h) DEM shadow modeling to remove the water body that was erroneously extracted from the water body boundary on 26 October 2019; (i) Water body boundary clipping DEM and specific slope water level data on 16 July 2017; (j) Water body boundary clipping DEM and specific slope water level data on 26 October 2019.
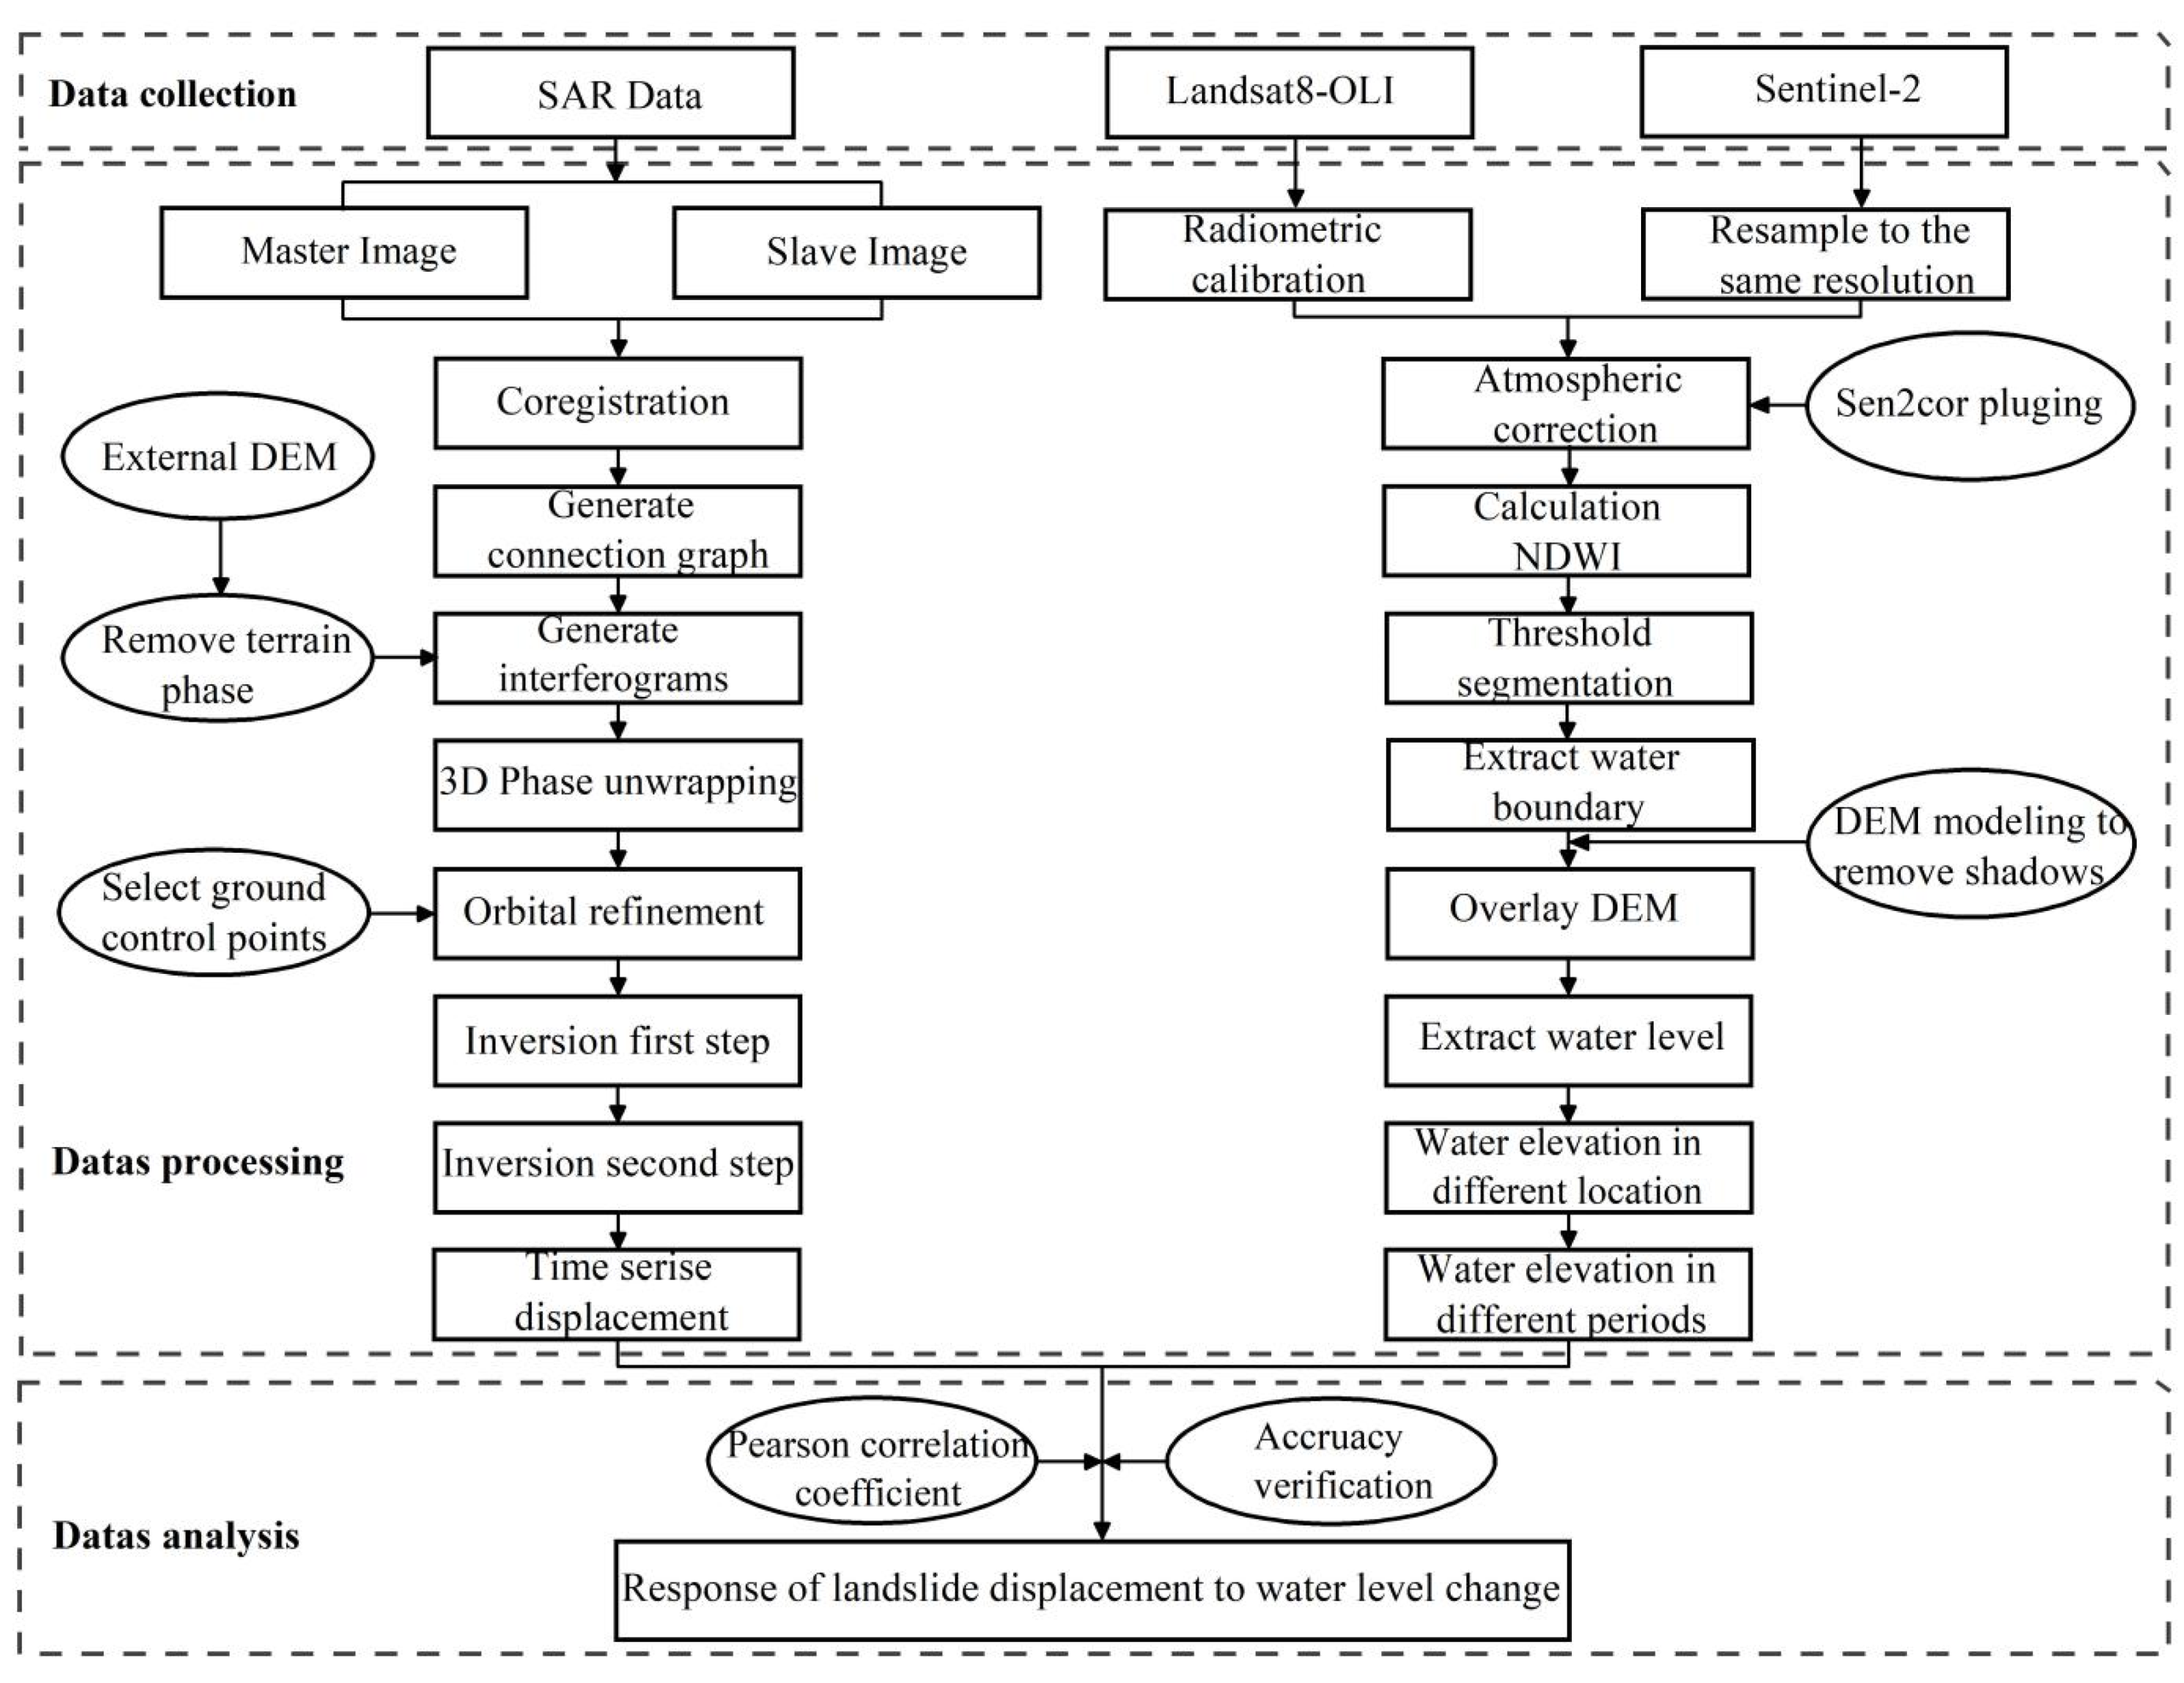
Figure 7.
Flow chart of the application of SBAS-InSAR technology and water level extraction.
Figure 7.
Flow chart of the application of SBAS-InSAR technology and water level extraction.
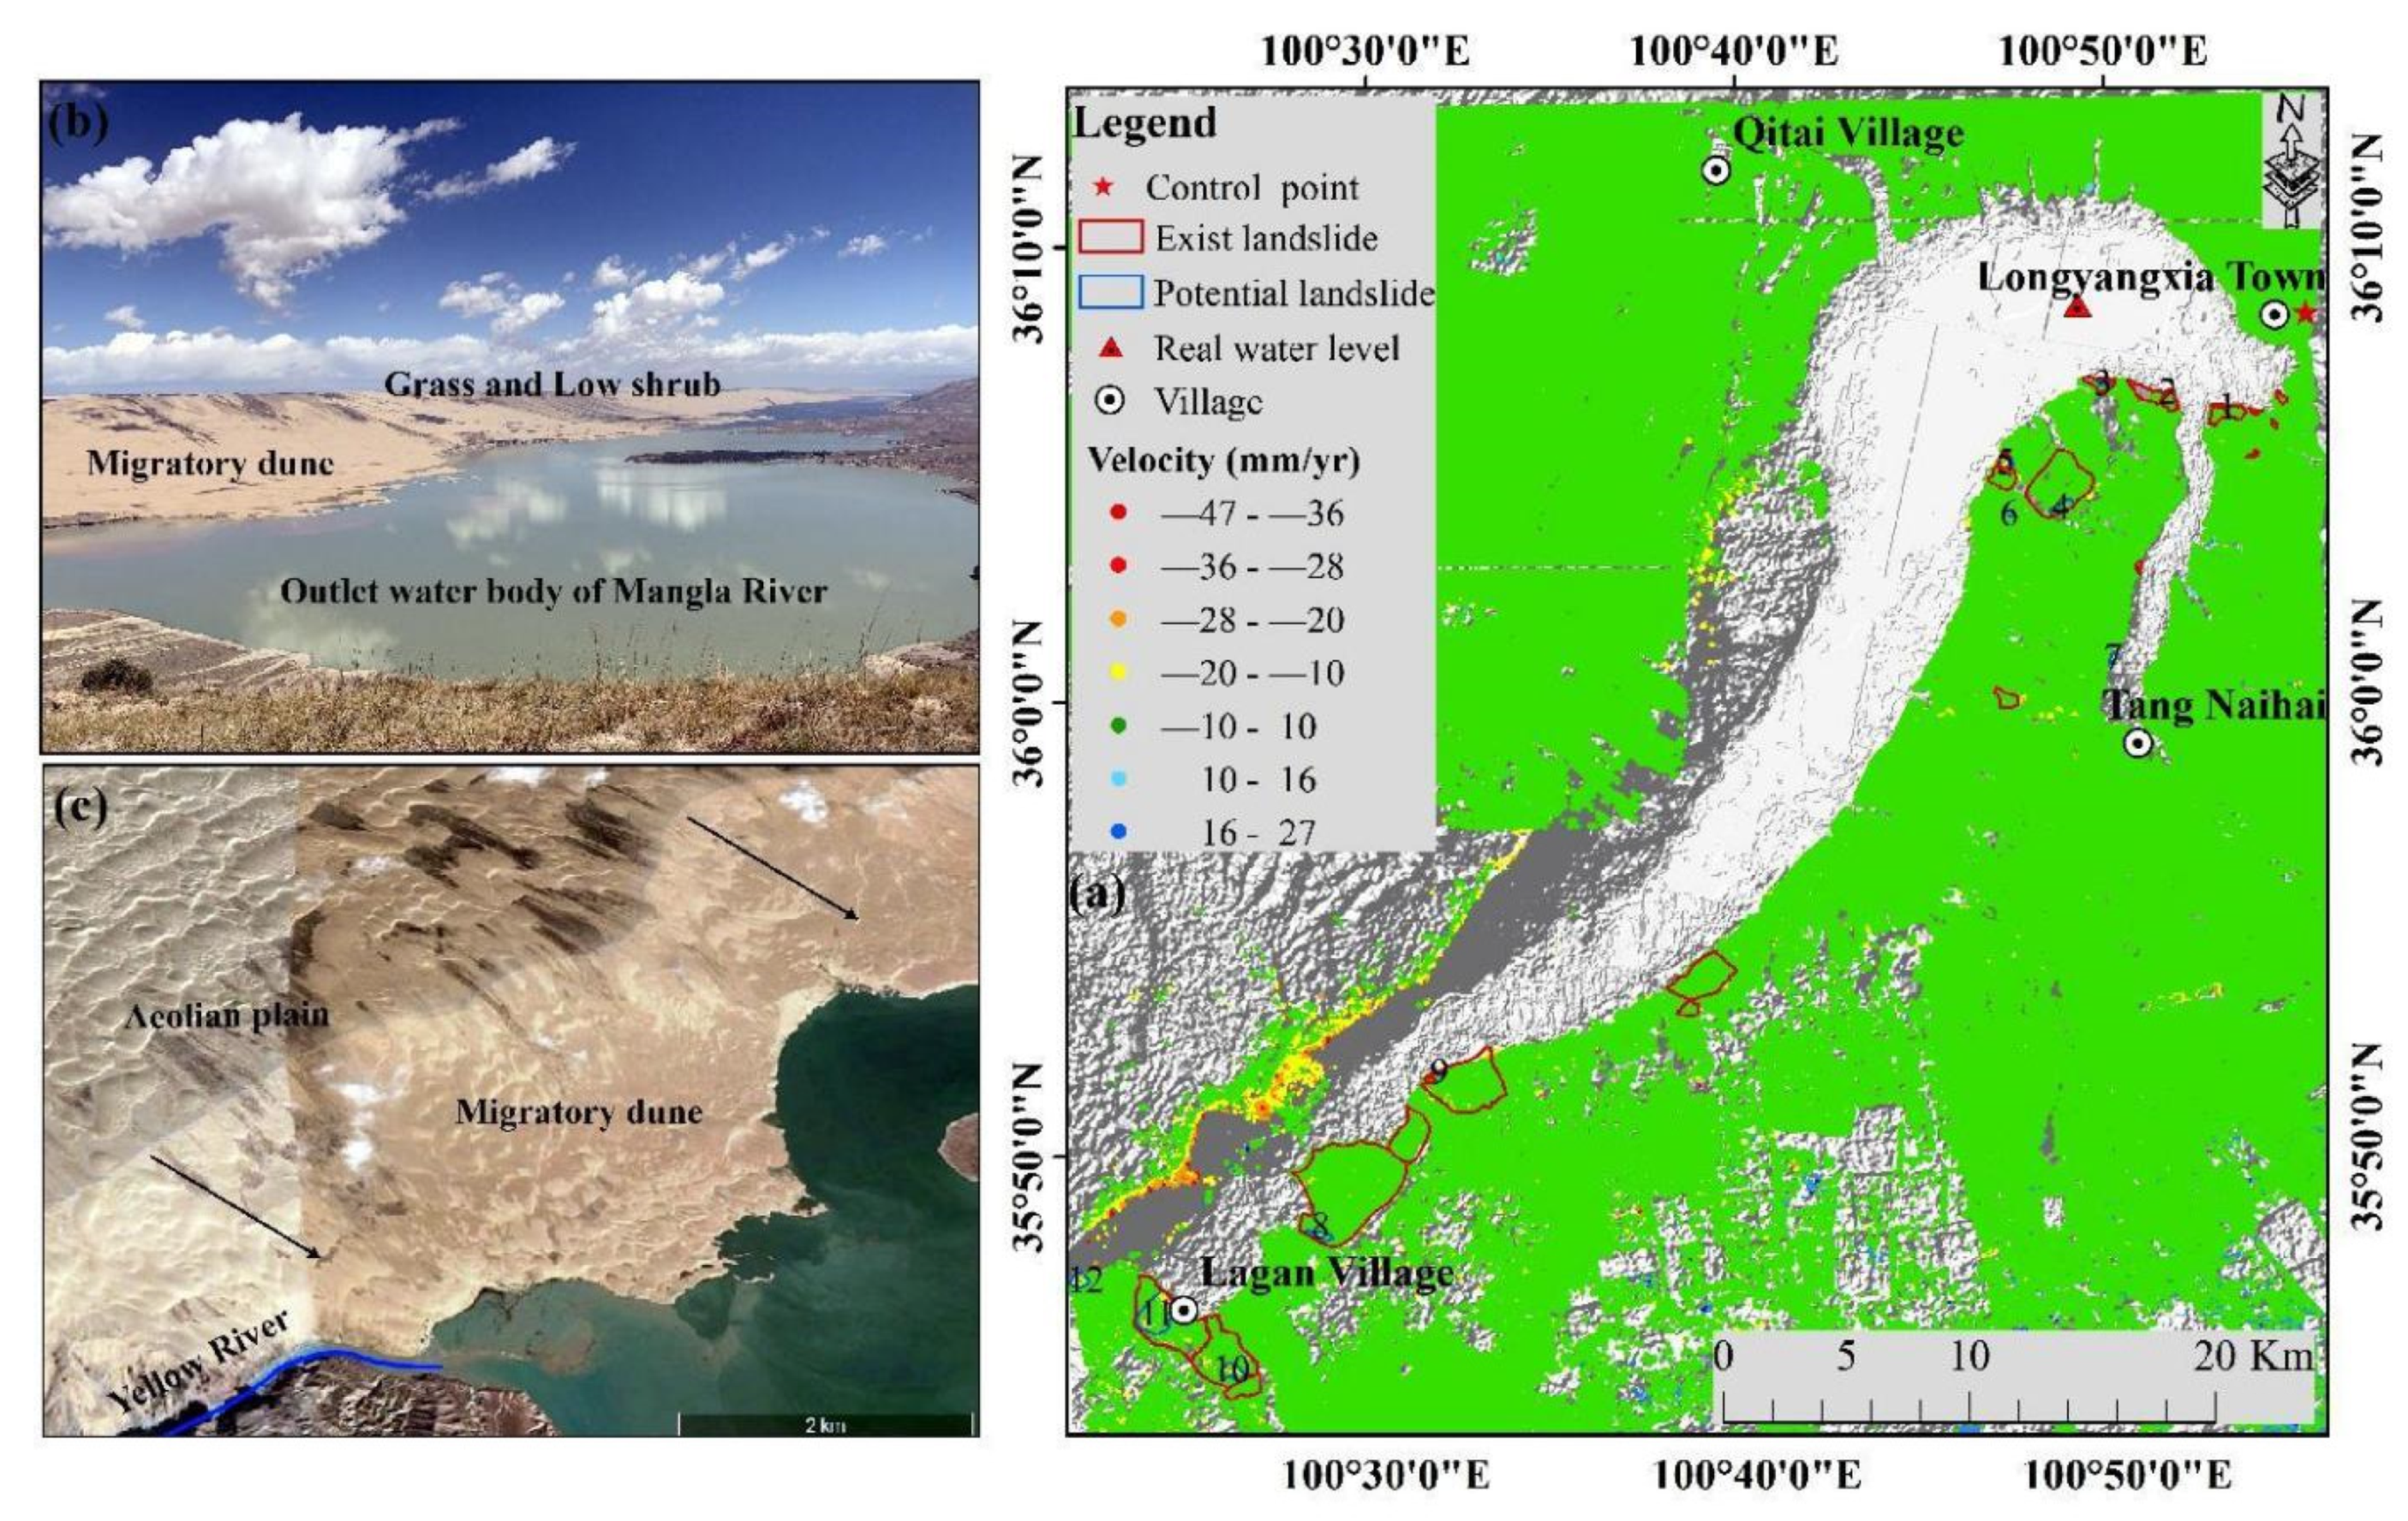
Figure 8.
(a) Average displacement rate of Longyangxia Reservoir from 1 March 2017 to 21 March 2020; (b) eolian sand and shrub vegetation on the north bank of the reservoir; (c) sand dune landforms on the north bank.
Figure 8.
(a) Average displacement rate of Longyangxia Reservoir from 1 March 2017 to 21 March 2020; (b) eolian sand and shrub vegetation on the north bank of the reservoir; (c) sand dune landforms on the north bank.
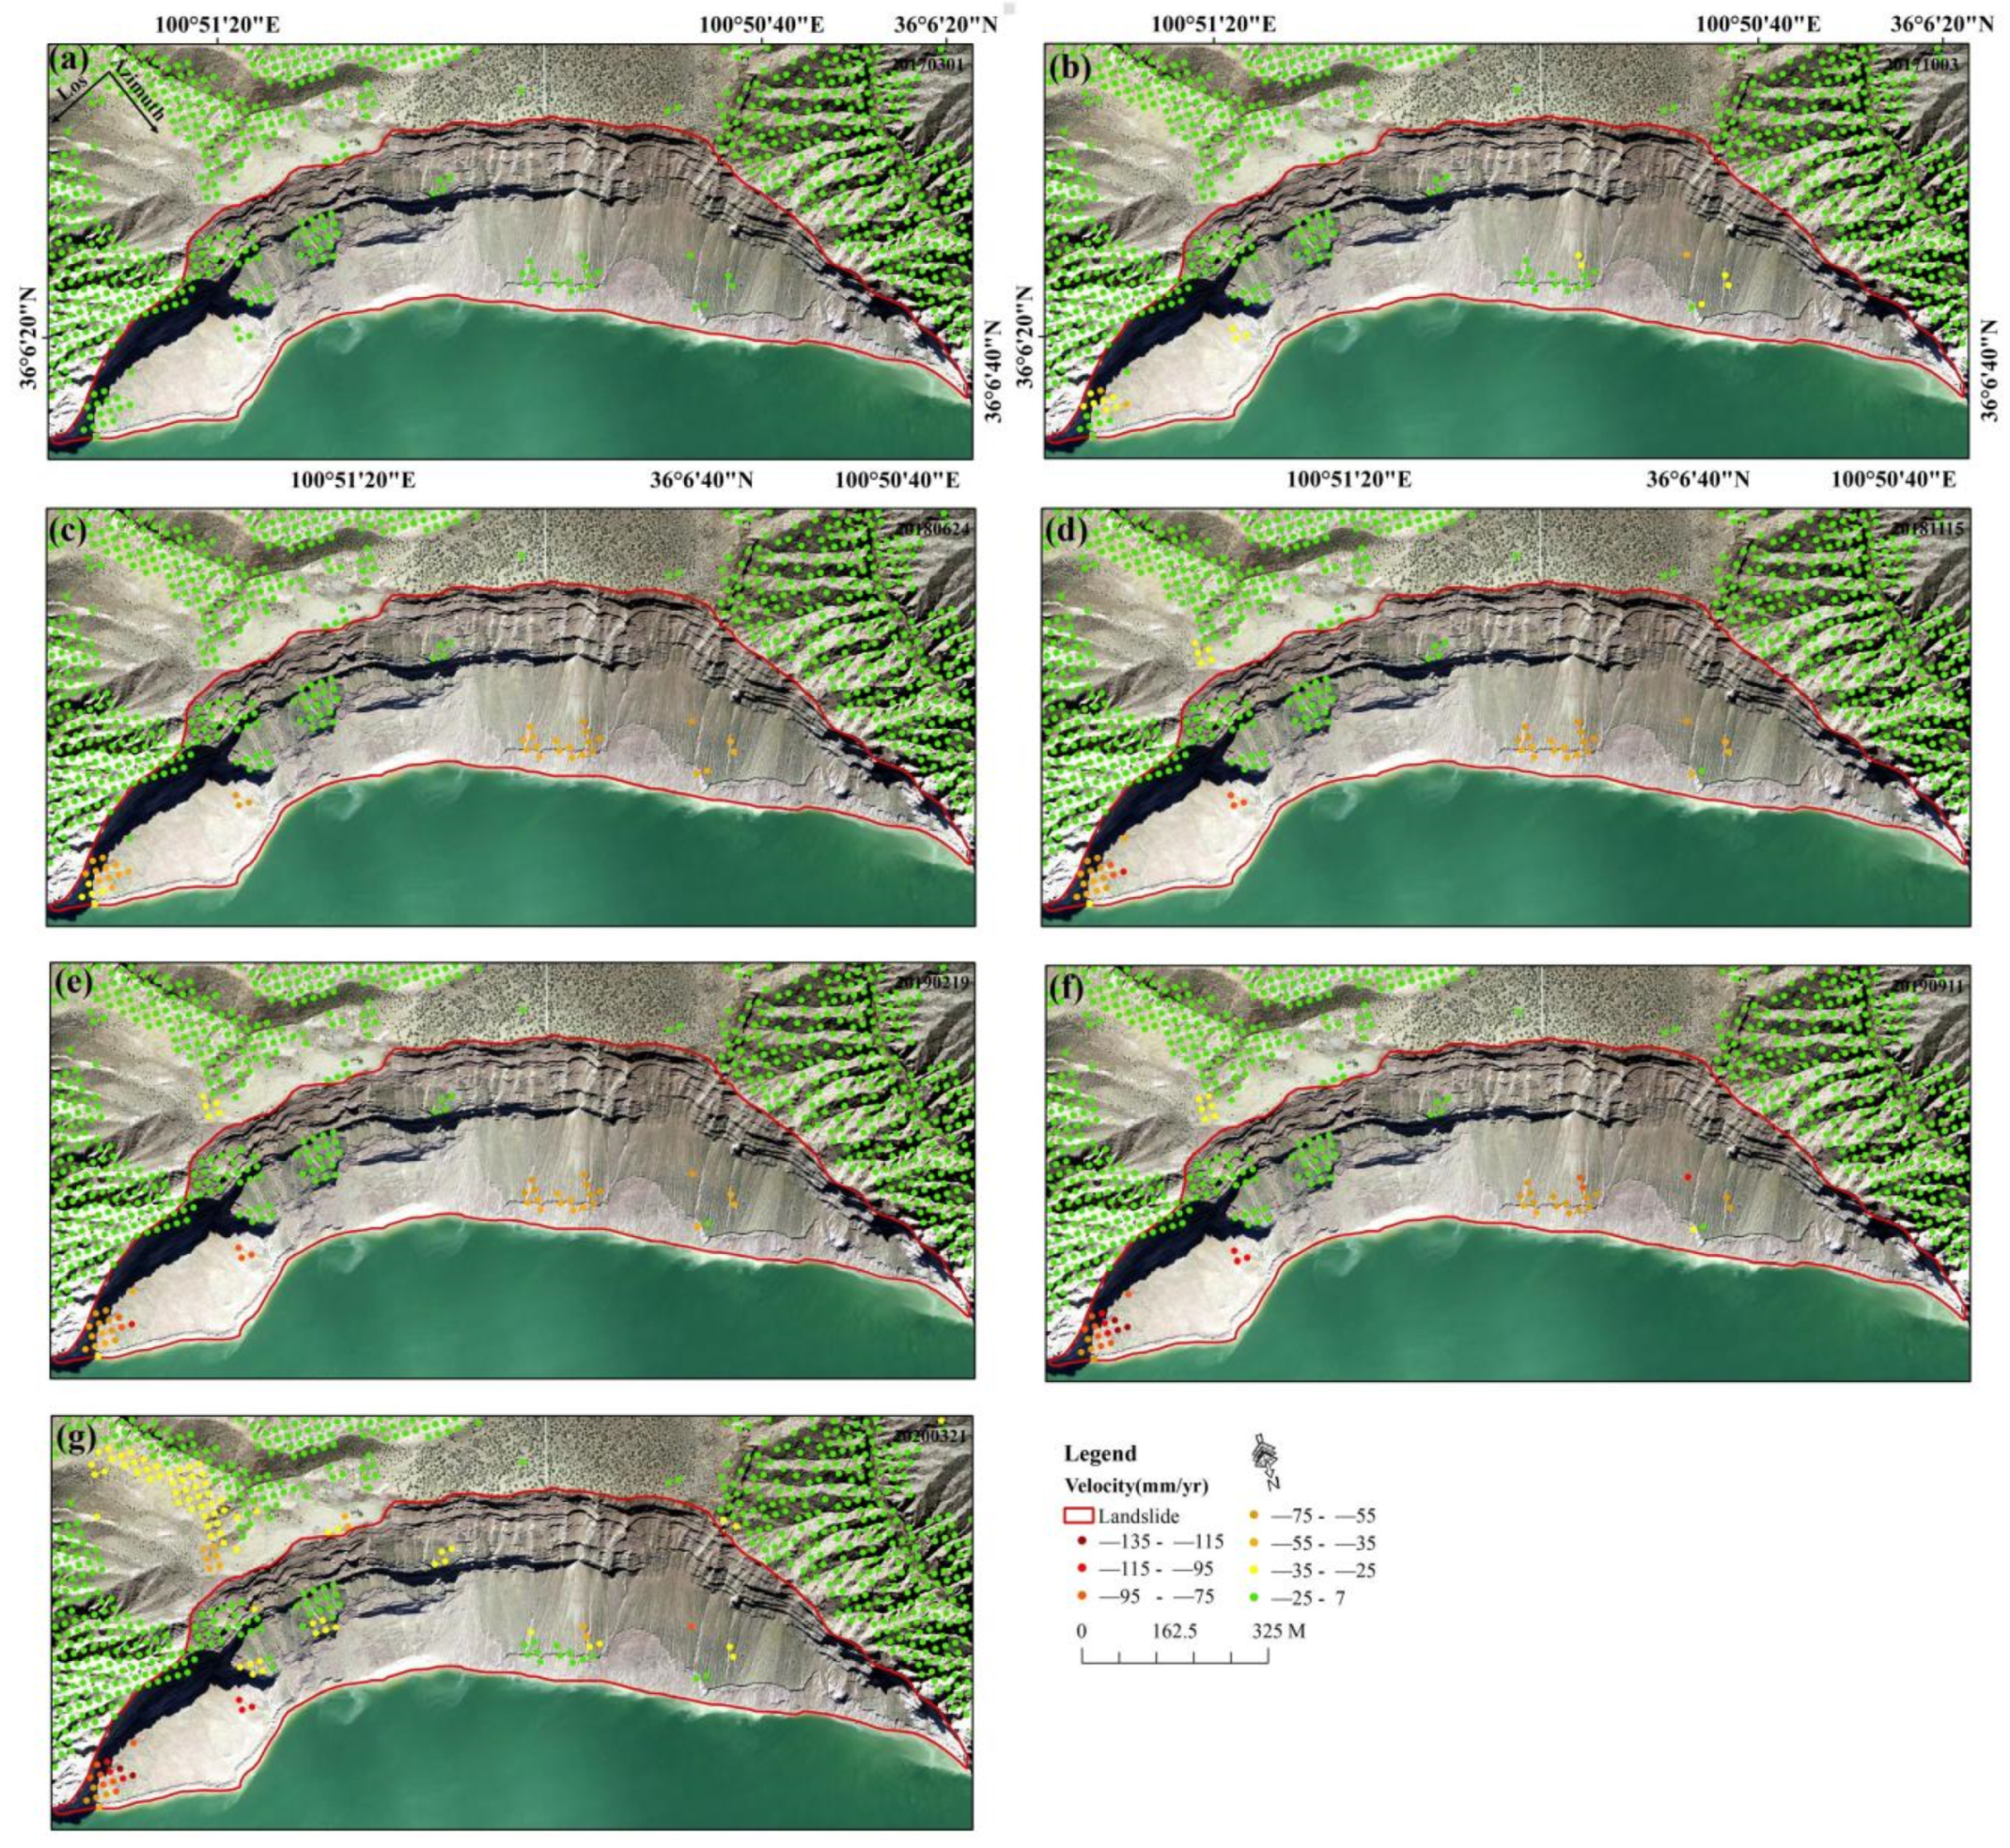
Figure 9.
Spatial deformation characteristics of Chaxi landslide. (a) Cumulative displacement of Chaxi landslide on March 1, 2017, (b) Cumulative displacement of the Chaxi landslide on February 12, 2018, (c) Cumulative displacement of Chaxi landslide on August 11, 2018, (d) Cumulative displacement of Chaxi landslide on May 2, 2019, (e) Cumulative displacement of Chaxi landslide on August 18, 2019, (f) Cumulative displacement of Chaxi landslide on October 5, 2019, (g) Cumulative displacement of Chaxi landslide on March 21, 2020.
Figure 10.
Spatial deformation characteristics of the Chana landslide. (a) Cumulative displacement of Chana landslide on 1 March 2017, (b) Cumulative displacement of Chana landslide on 3 October 2017, (c) Cumulative displacement of Chana landslide on 24 June 2018, (d) Cumulative displacement of Chana landslide on 15 November 2018, (e) Cumulative displacement of Chana landslide on 19 February 2019, (f) Cumulative displacement of Chana landslide on 11 September 2019, (g) Cumulative displacement of Chana landslide on 21 March 2020.
Figure 11.
(a) Deformation velocity of the Chana landslide. (b) A small landslide on the eastern side, (c) collapse position and scattered rocks in the central part, and (d) isolated soil blocks on the western side.
Figure 11.
(a) Deformation velocity of the Chana landslide. (b) A small landslide on the eastern side, (c) collapse position and scattered rocks in the central part, and (d) isolated soil blocks on the western side.
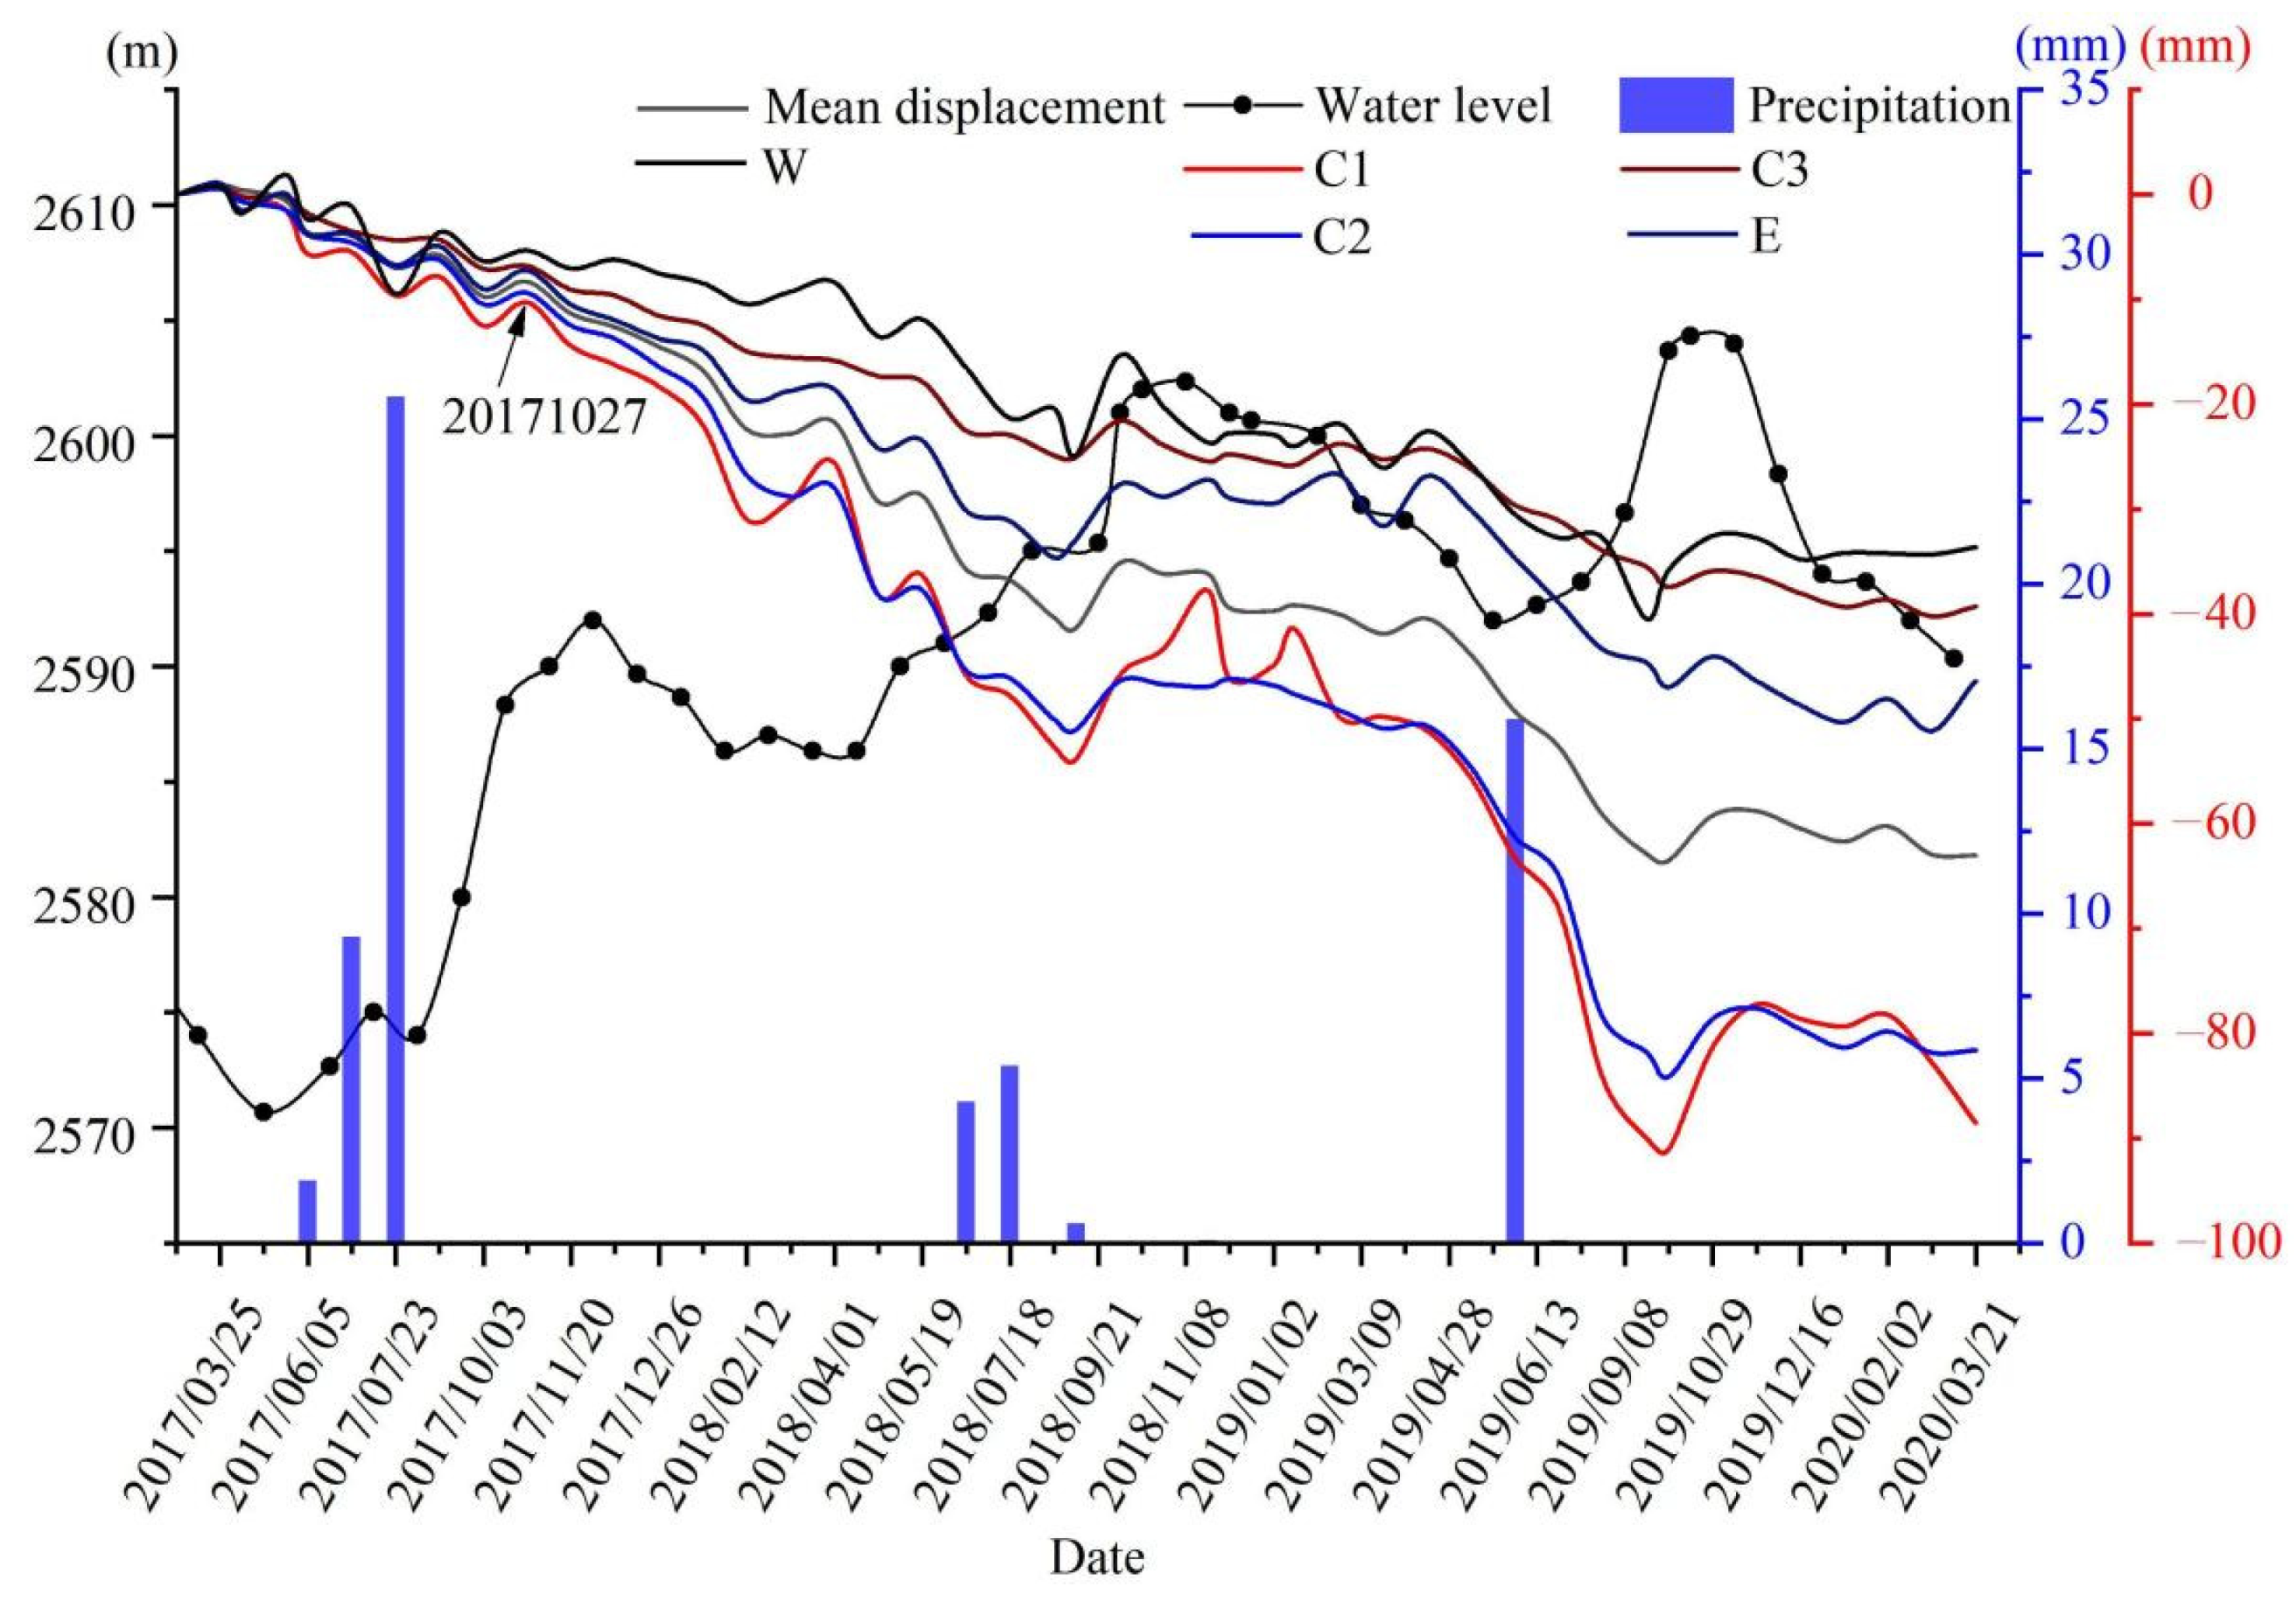
Figure 12.
Time series of precipitation, water level, and deformation for Chana landslide.
Figure 12.
Time series of precipitation, water level, and deformation for Chana landslide.
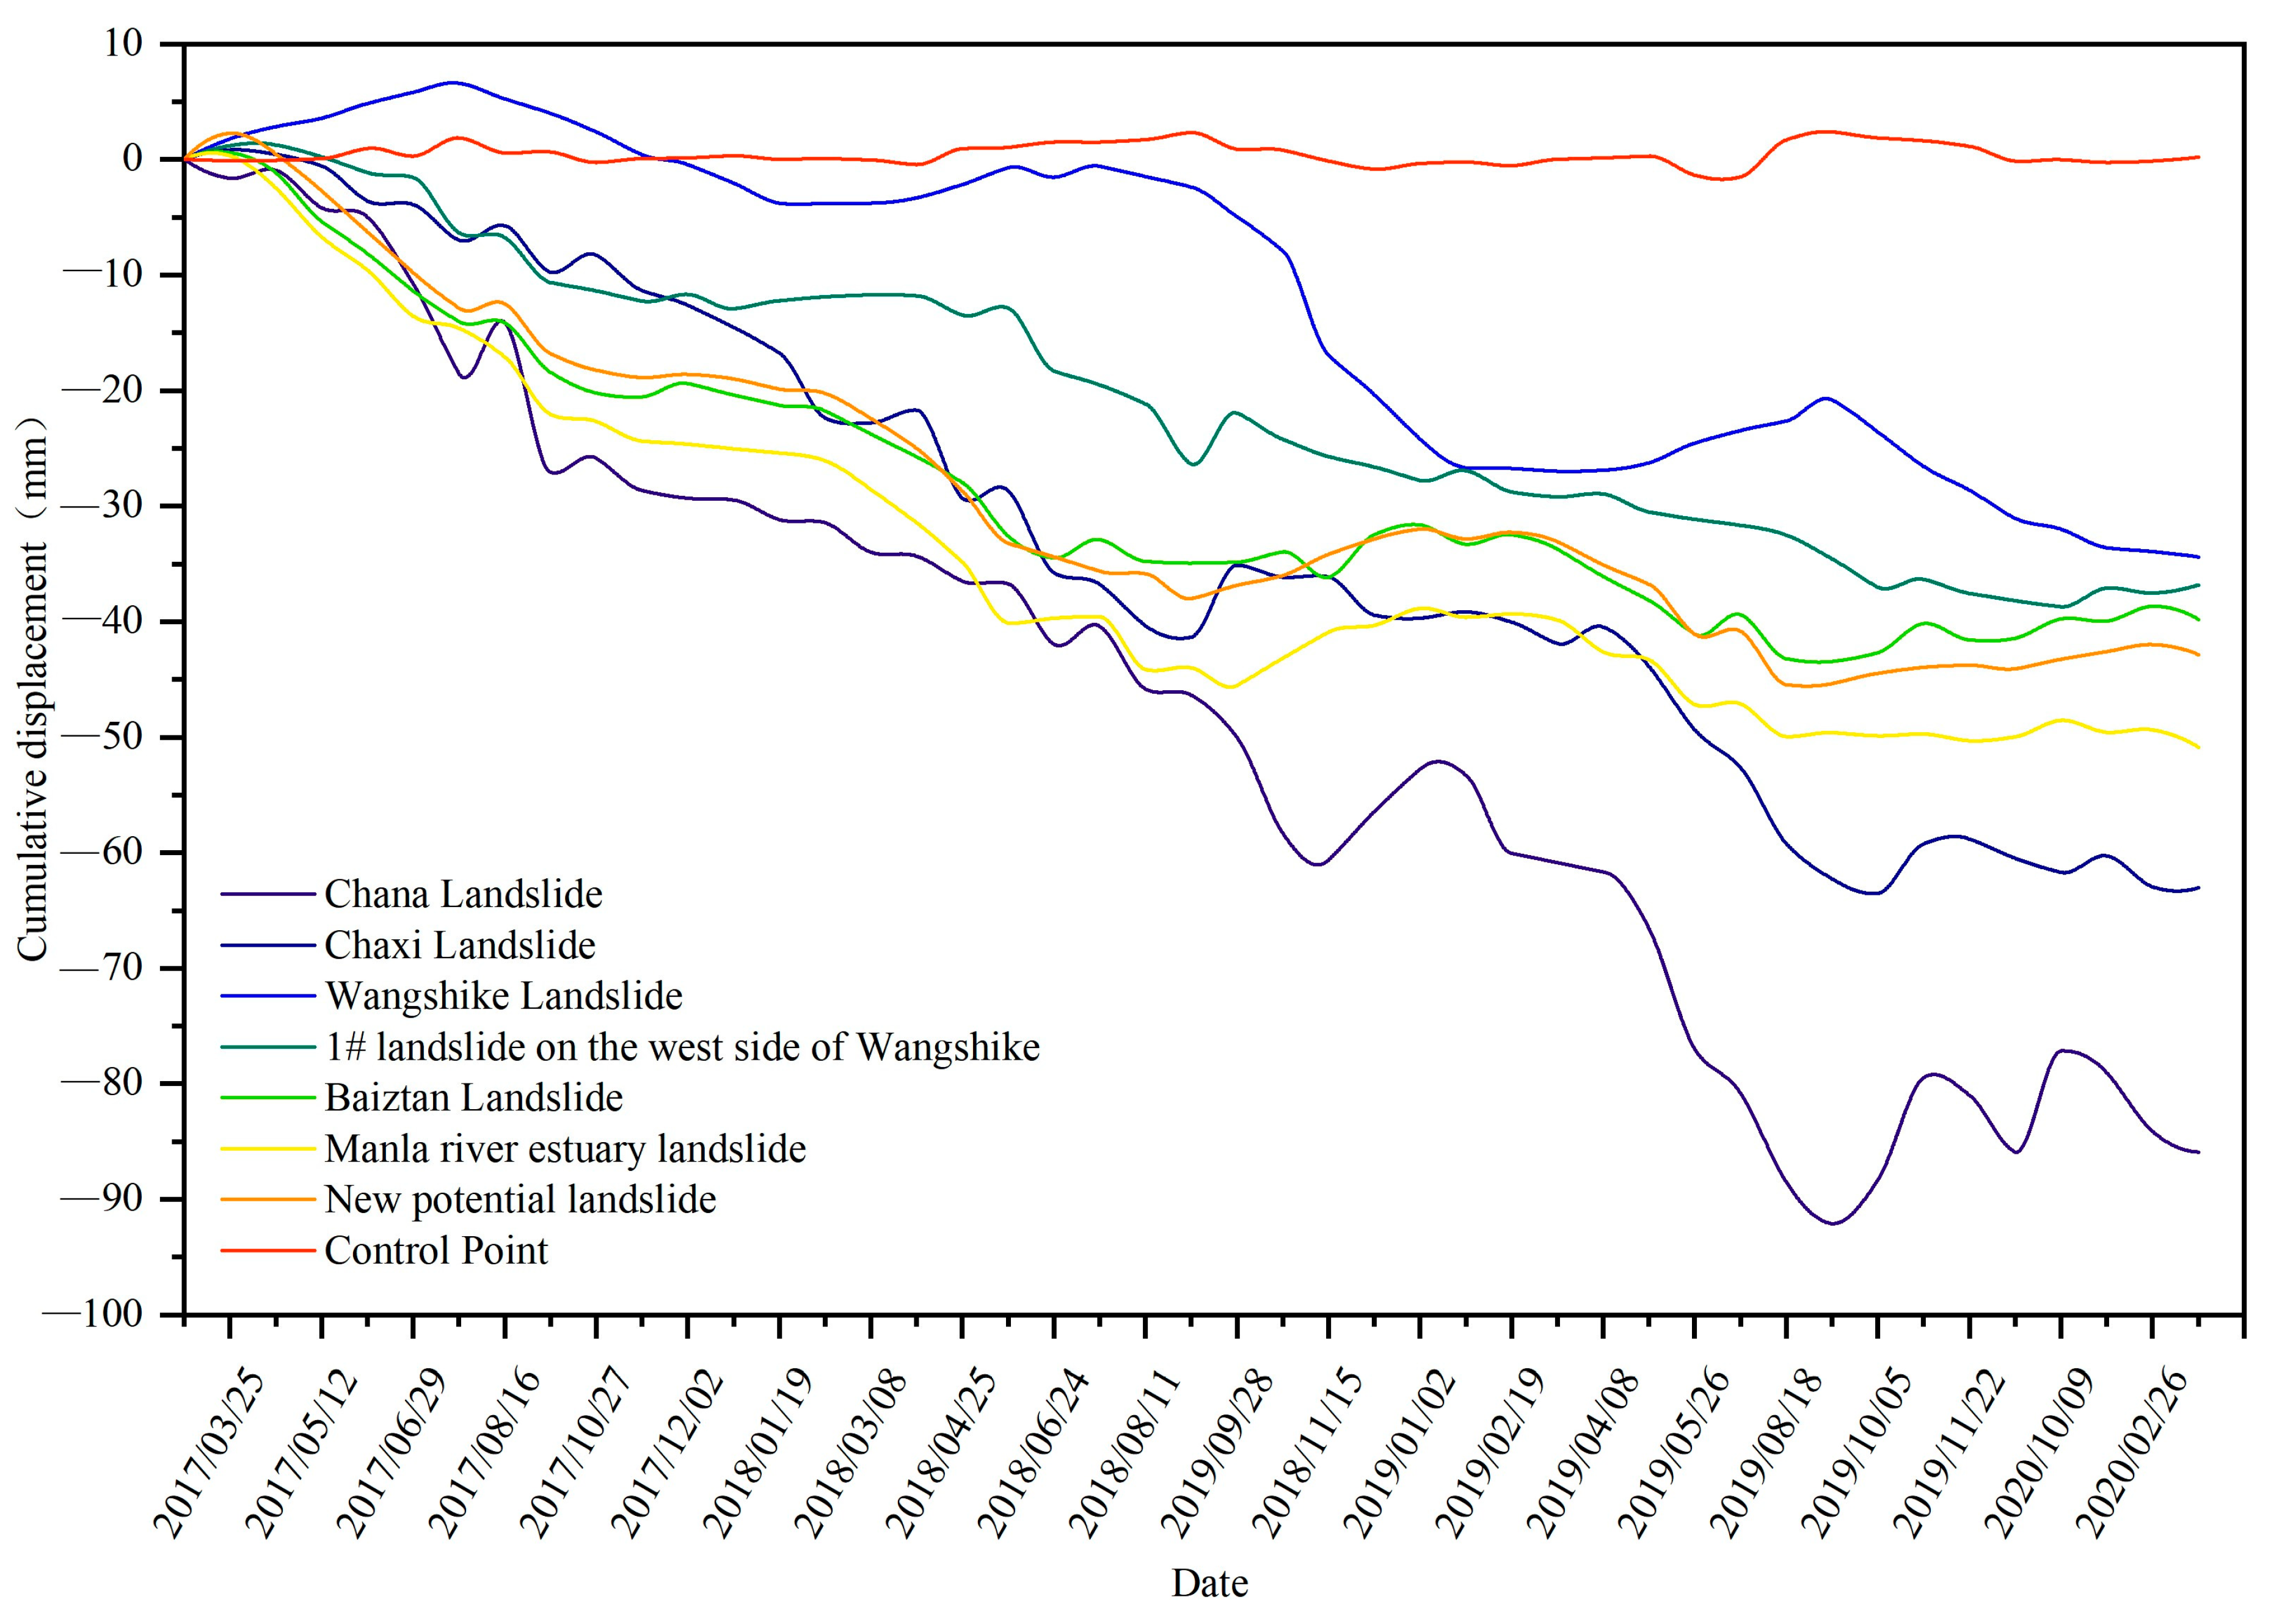
Figure 13.
Cumulative displacement of landslides in the Longyangxia Reservoir area.
Figure 13.
Cumulative displacement of landslides in the Longyangxia Reservoir area.
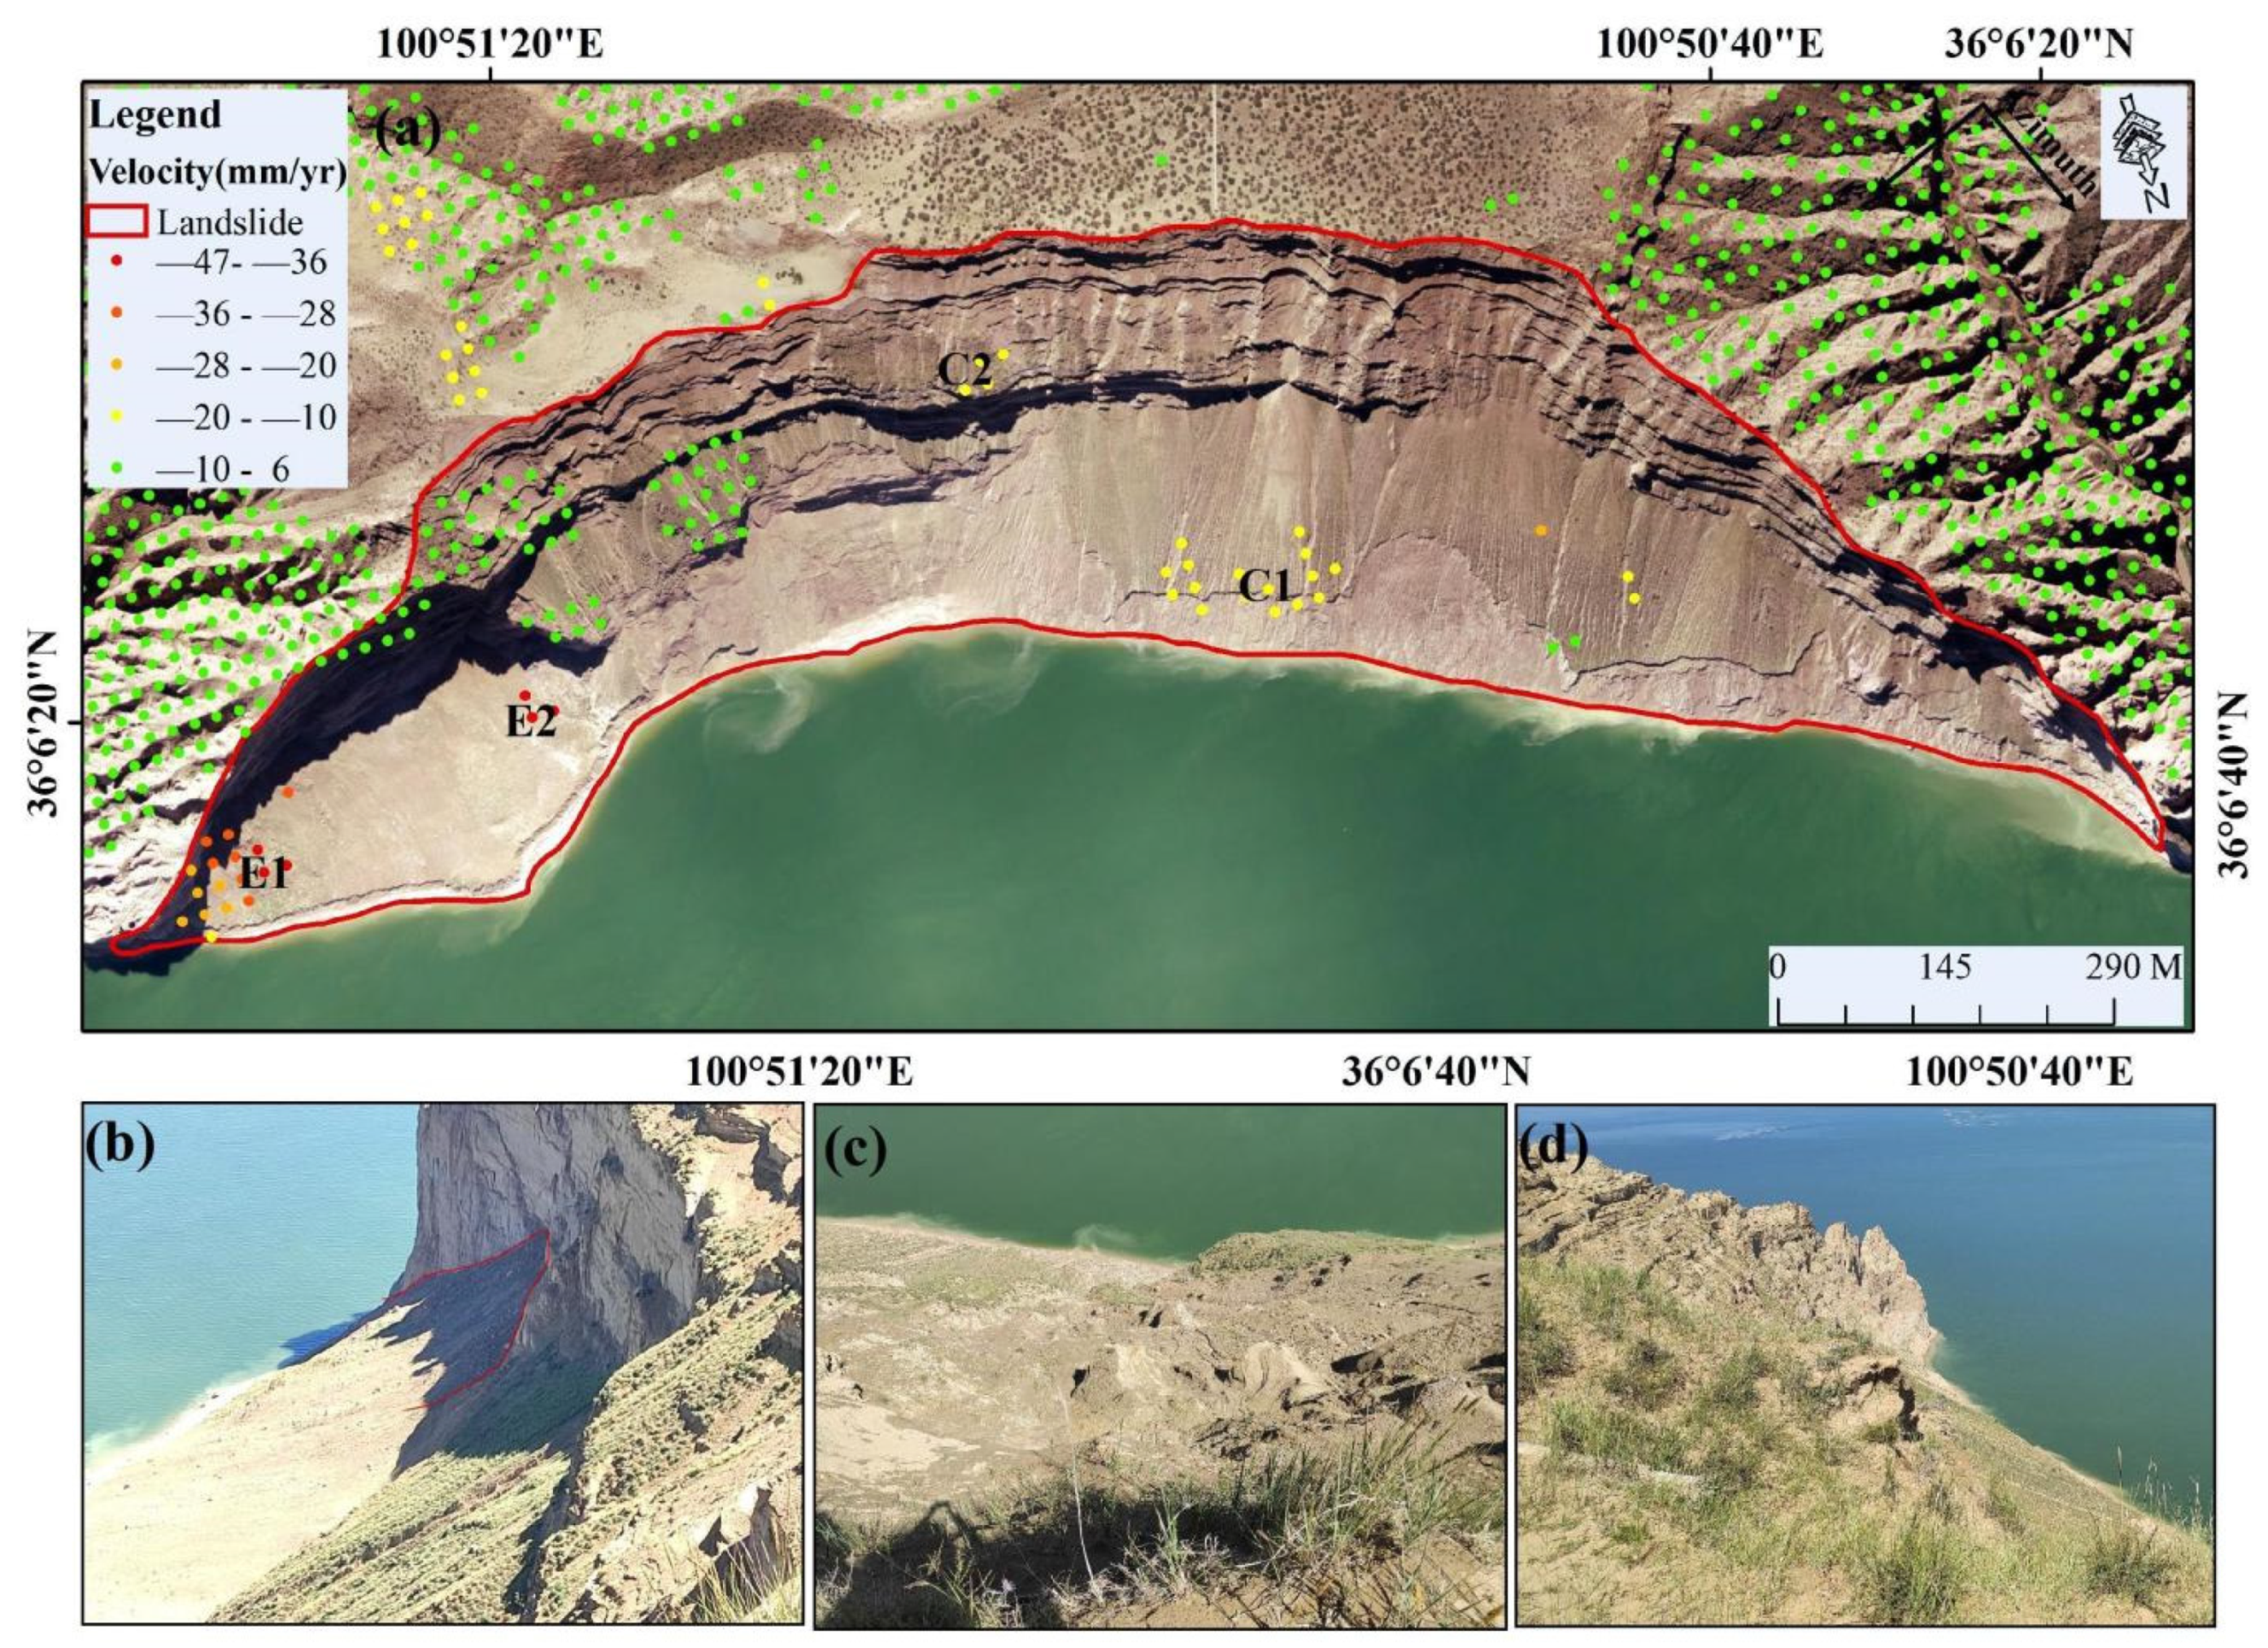
Figure 14.
(a) Deformation velocity of Chaxi landslide, (b) partial collapse of the rear edge, (c) small landslides in the center, and (d) exposed soil in the western part.
Figure 14.
(a) Deformation velocity of Chaxi landslide, (b) partial collapse of the rear edge, (c) small landslides in the center, and (d) exposed soil in the western part.
Figure 15.
Time series of precipitation, water level, and deformation for the Chaxi landslide.
Figure 15.
Time series of precipitation, water level, and deformation for the Chaxi landslide.
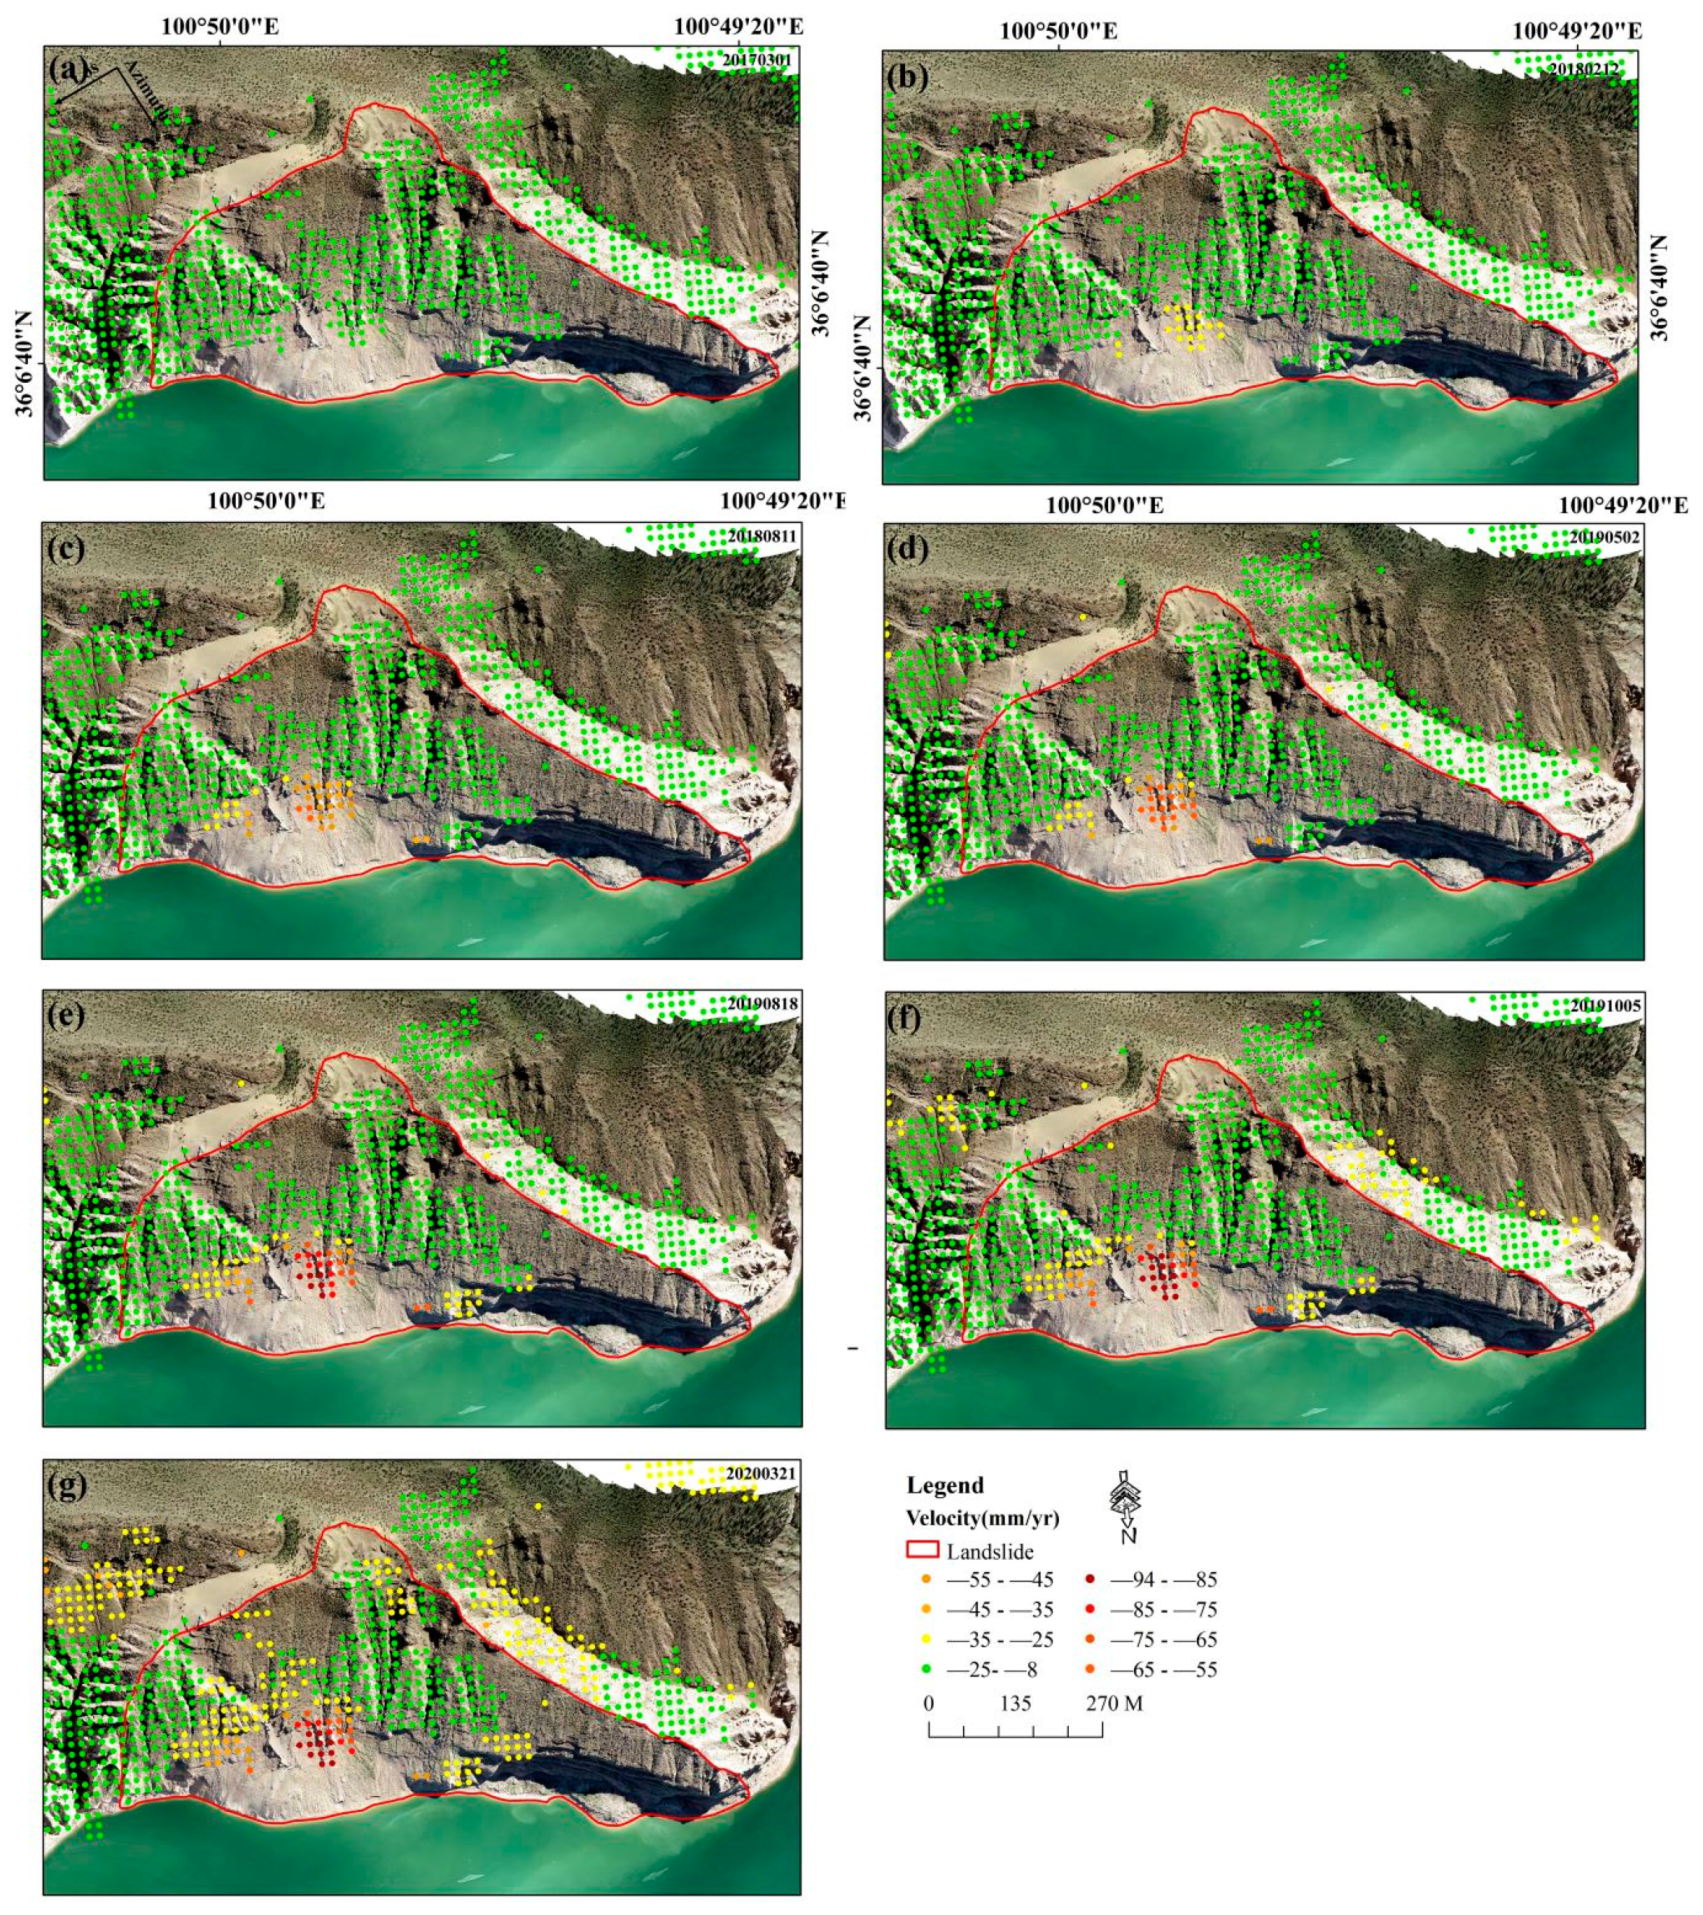
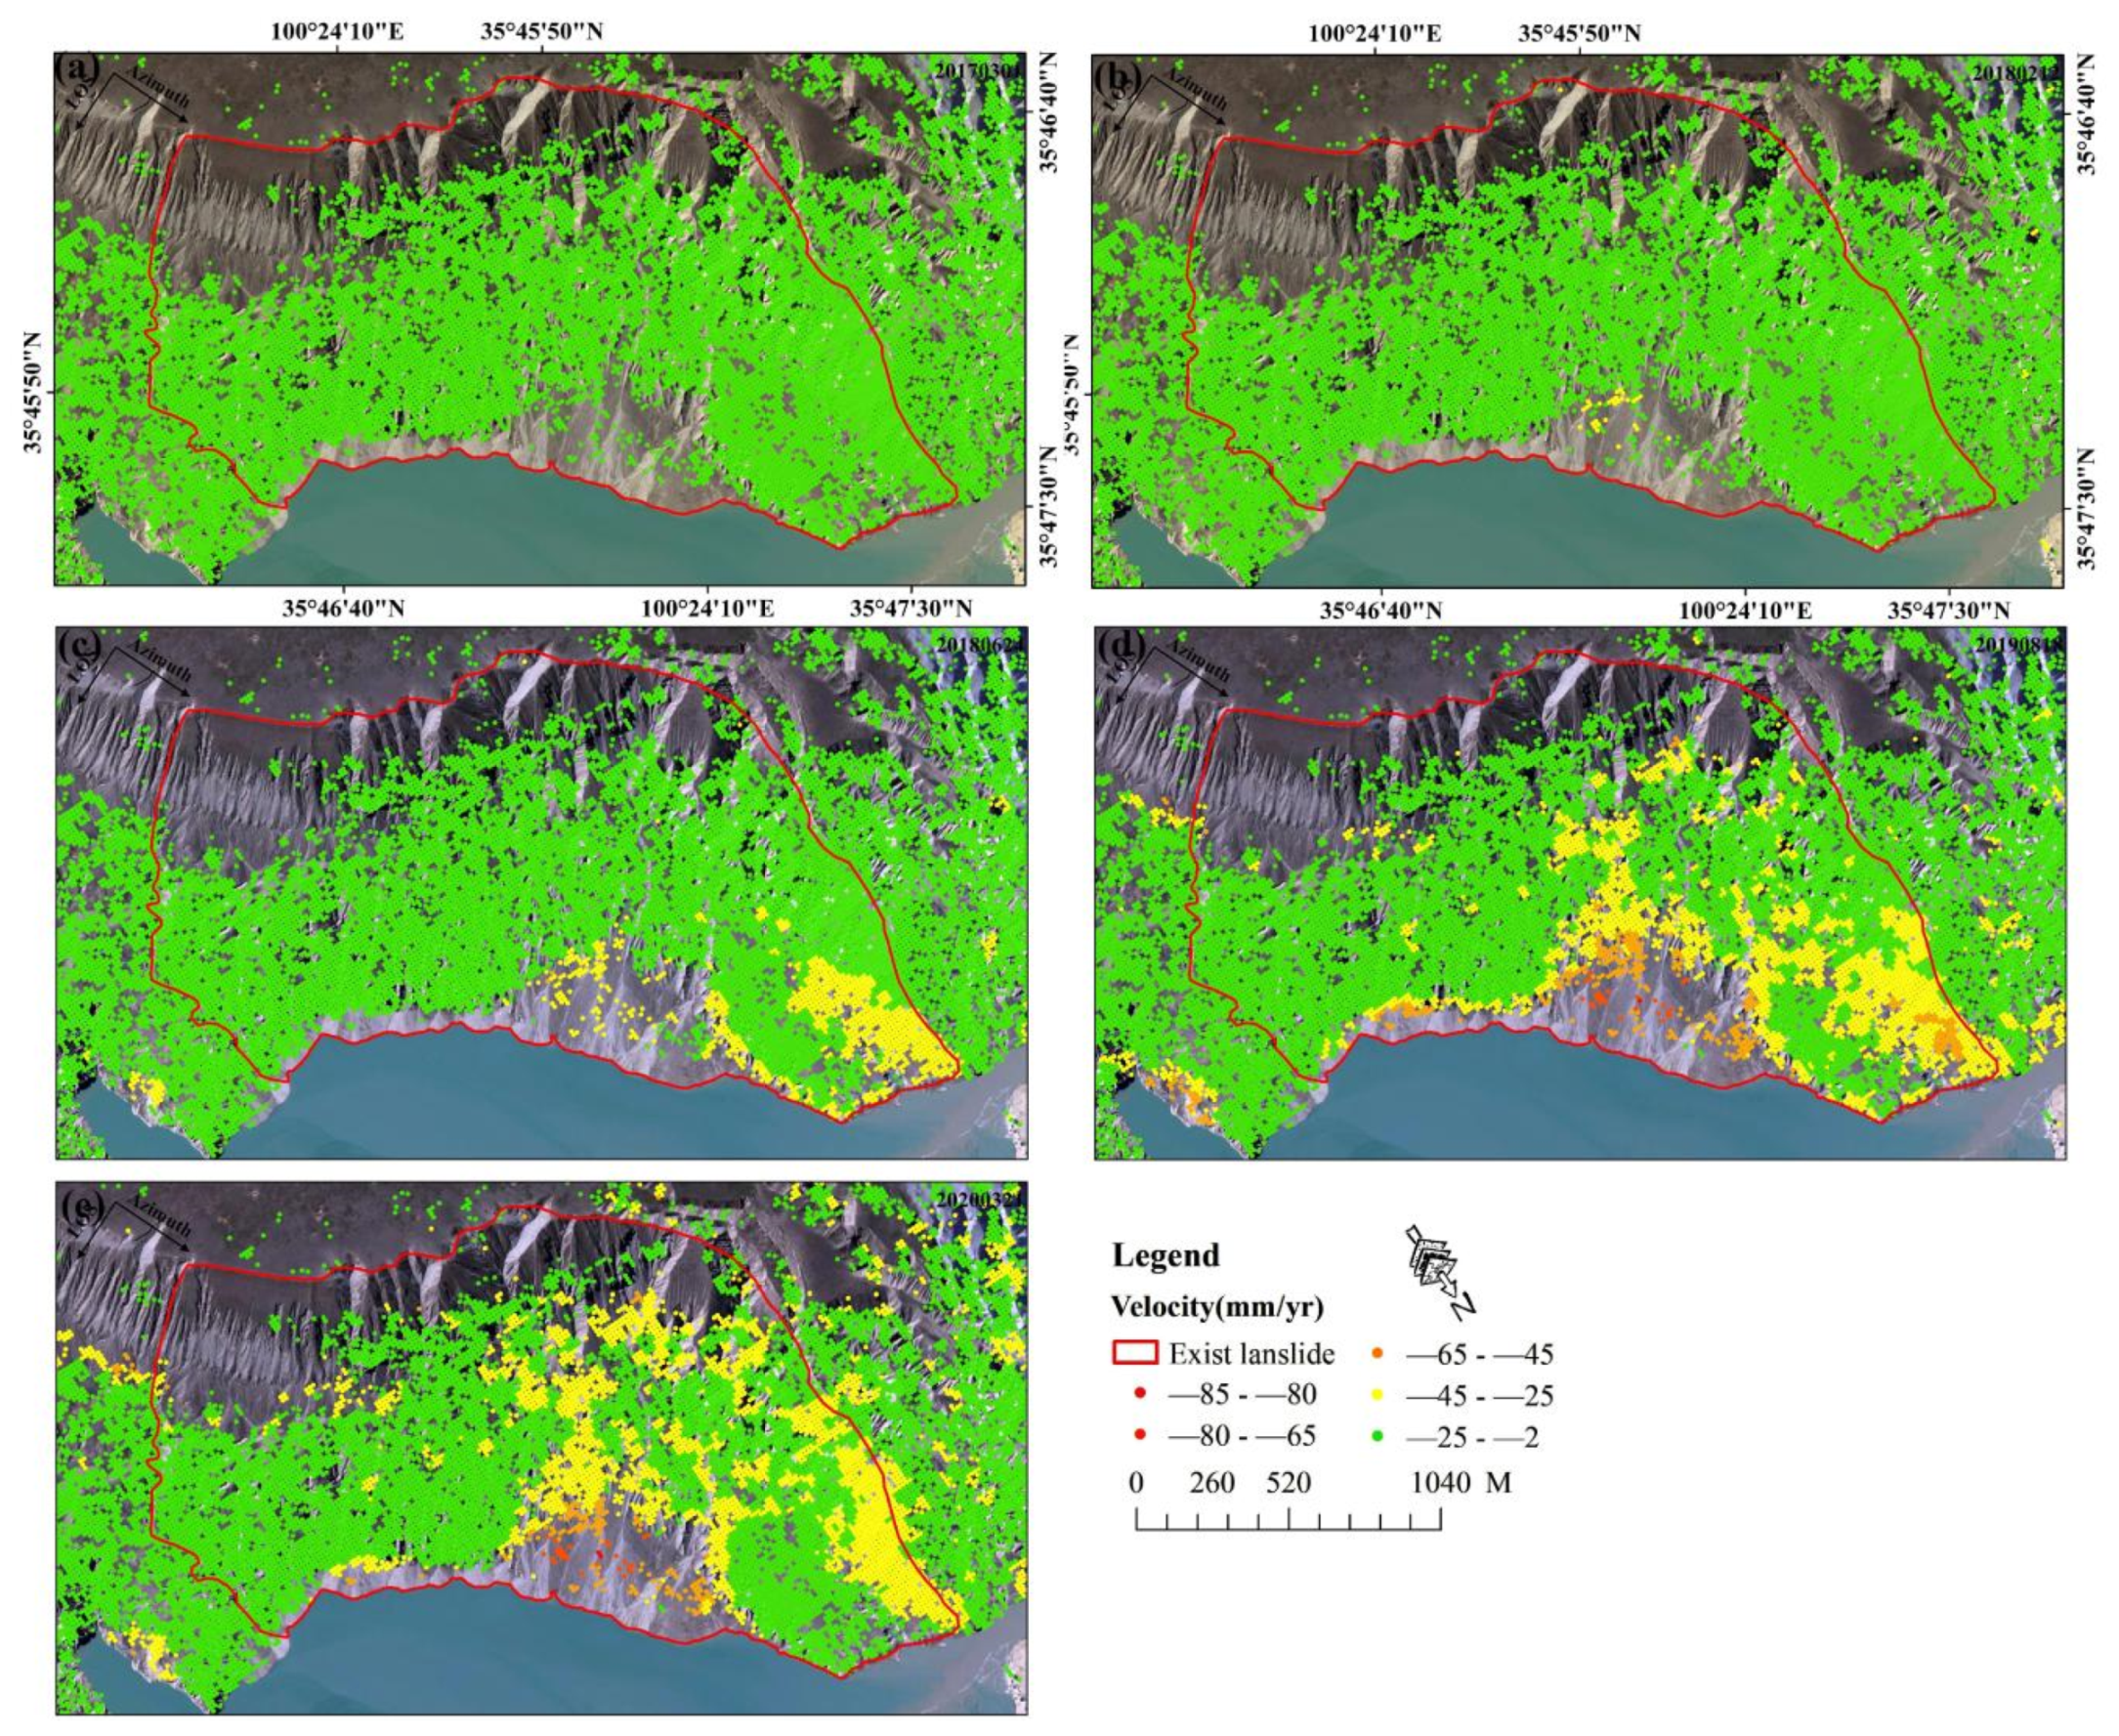
Figure 16.
Spatial deformation characteristics of the Mangla River Estuary landslide. (a) Cumulative displacement of Mangla River Estuary landslide on 1 March 2017, (b) Cumulative displacement of Mangla River Estuary landslide on 12 February 2018, (c) Cumulative displacement of Mangla River Estuary landslide on 24 June 2018, (d) Cumulative displacement of Mangla River Estuary landslide on 18 August 2019, (e) Cumulative displacement of Mangla River Estuary landslide on 21 March 2020.
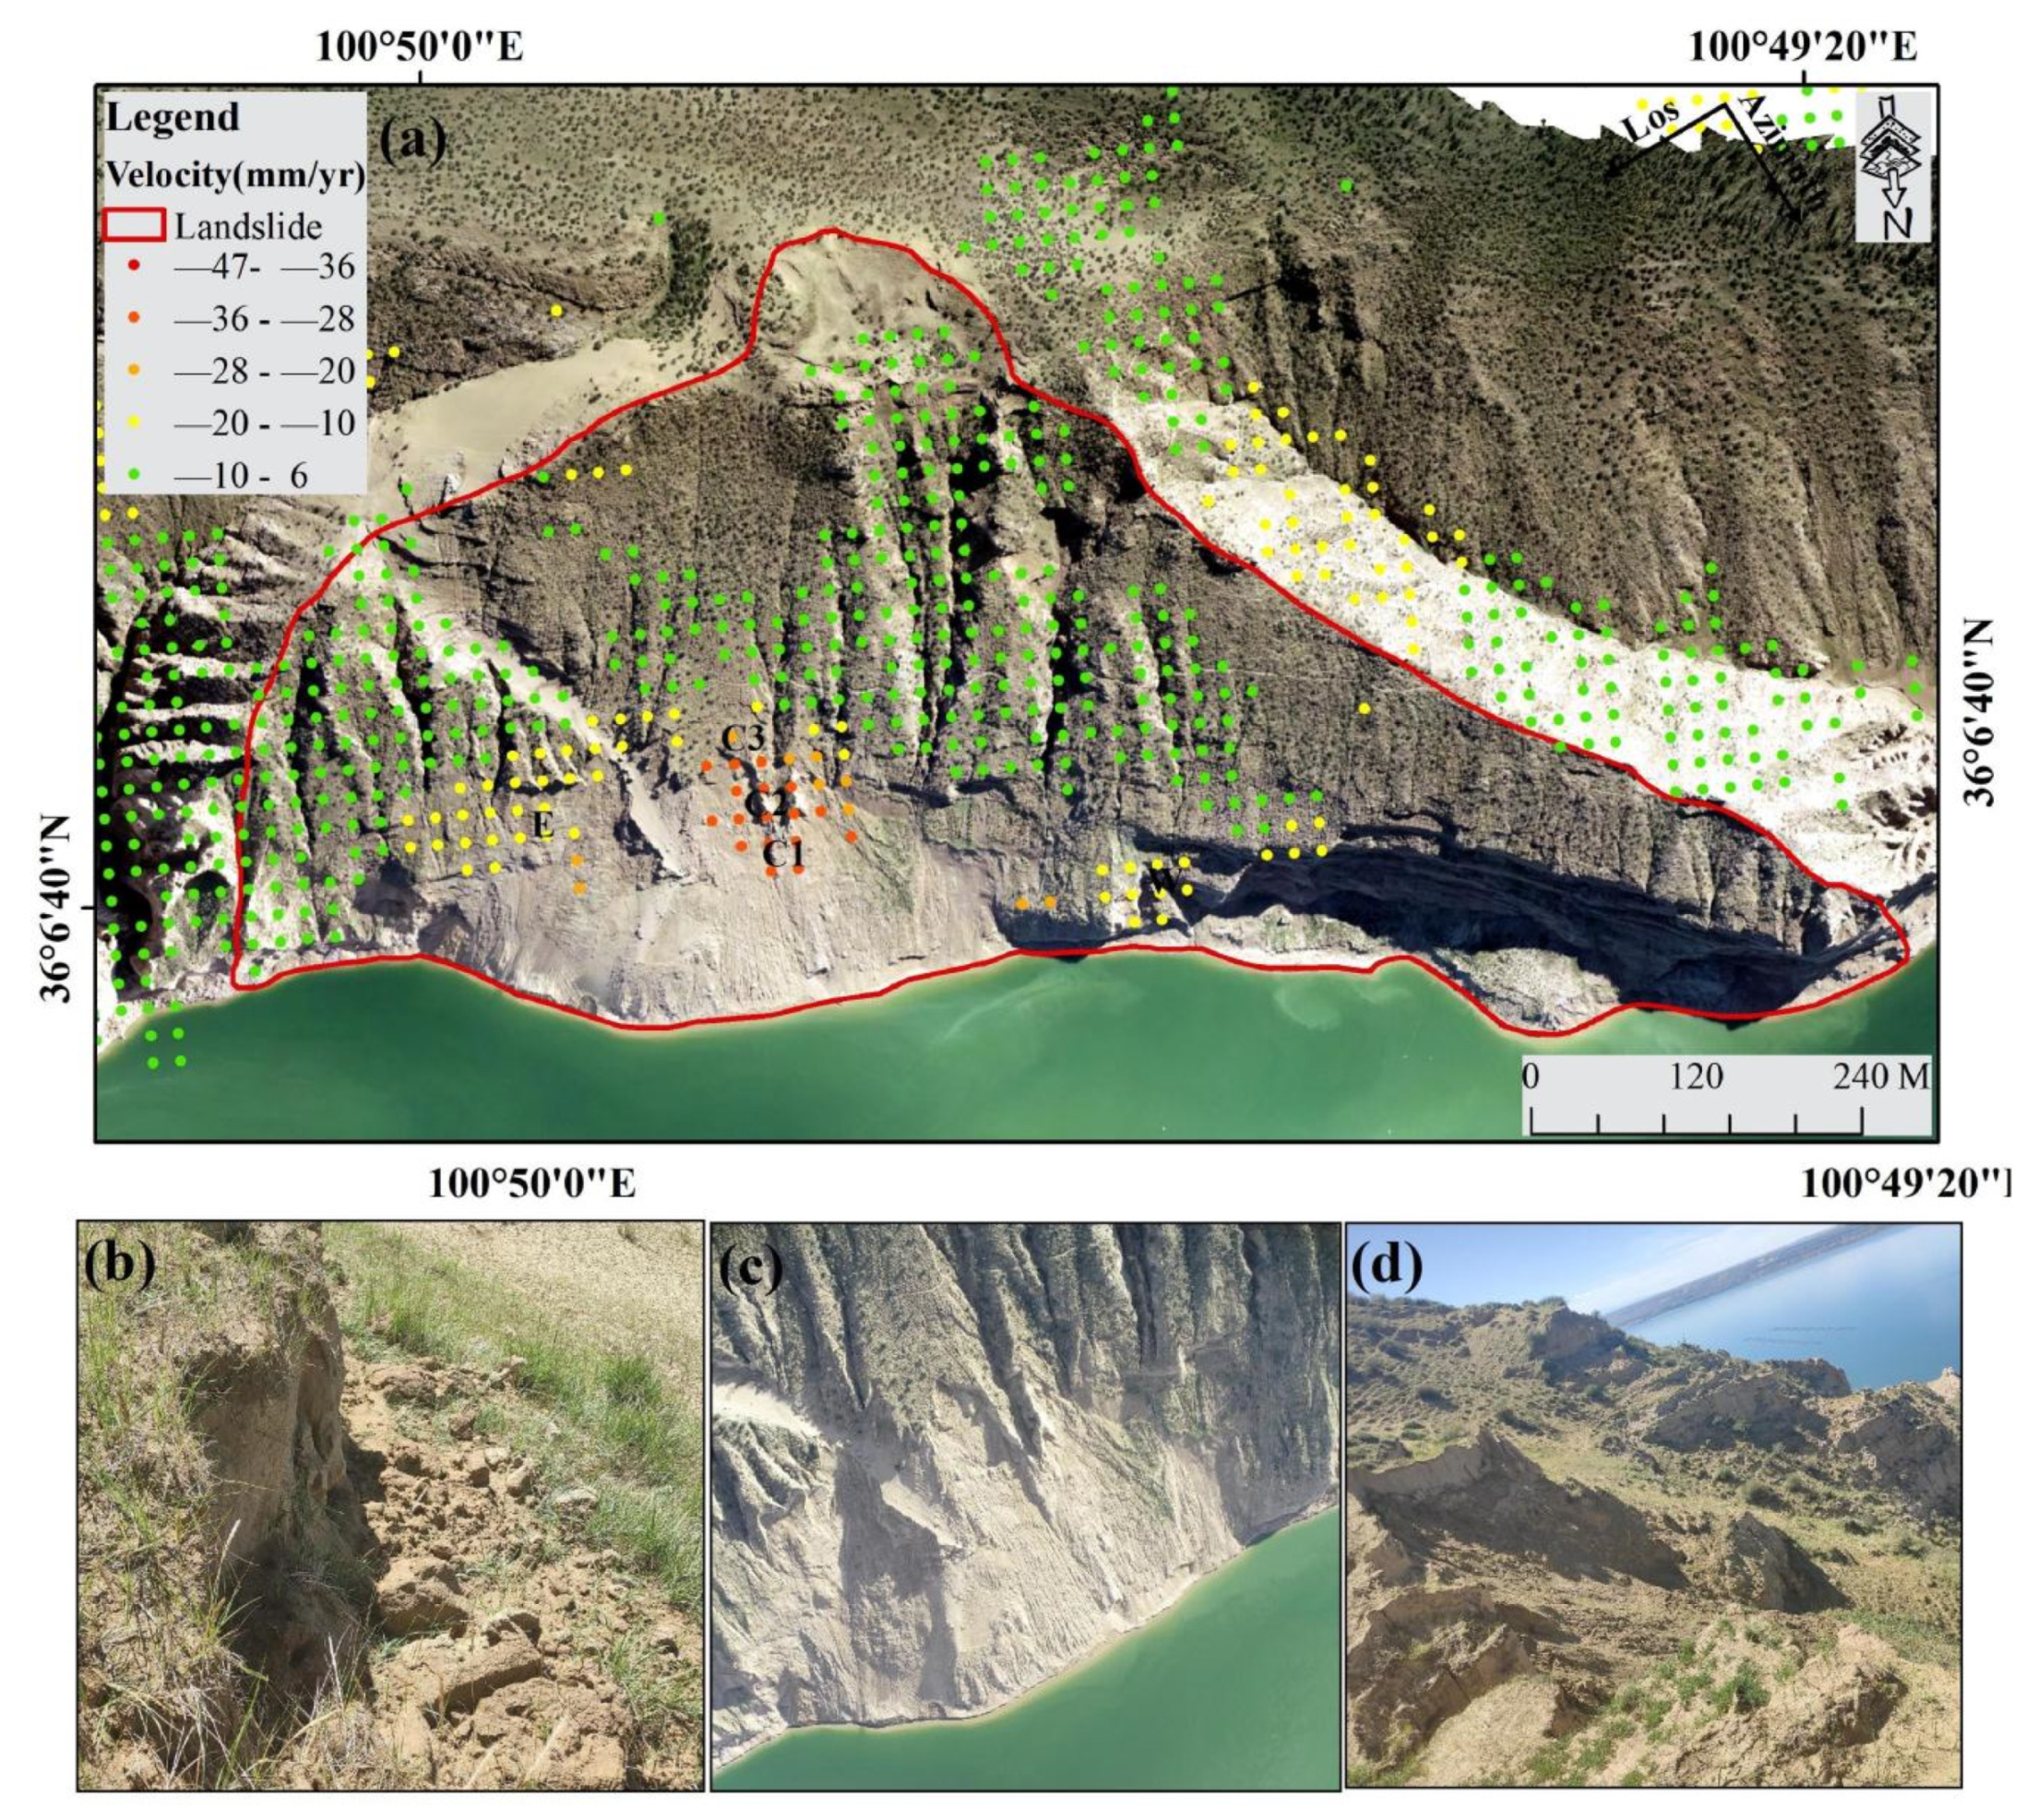
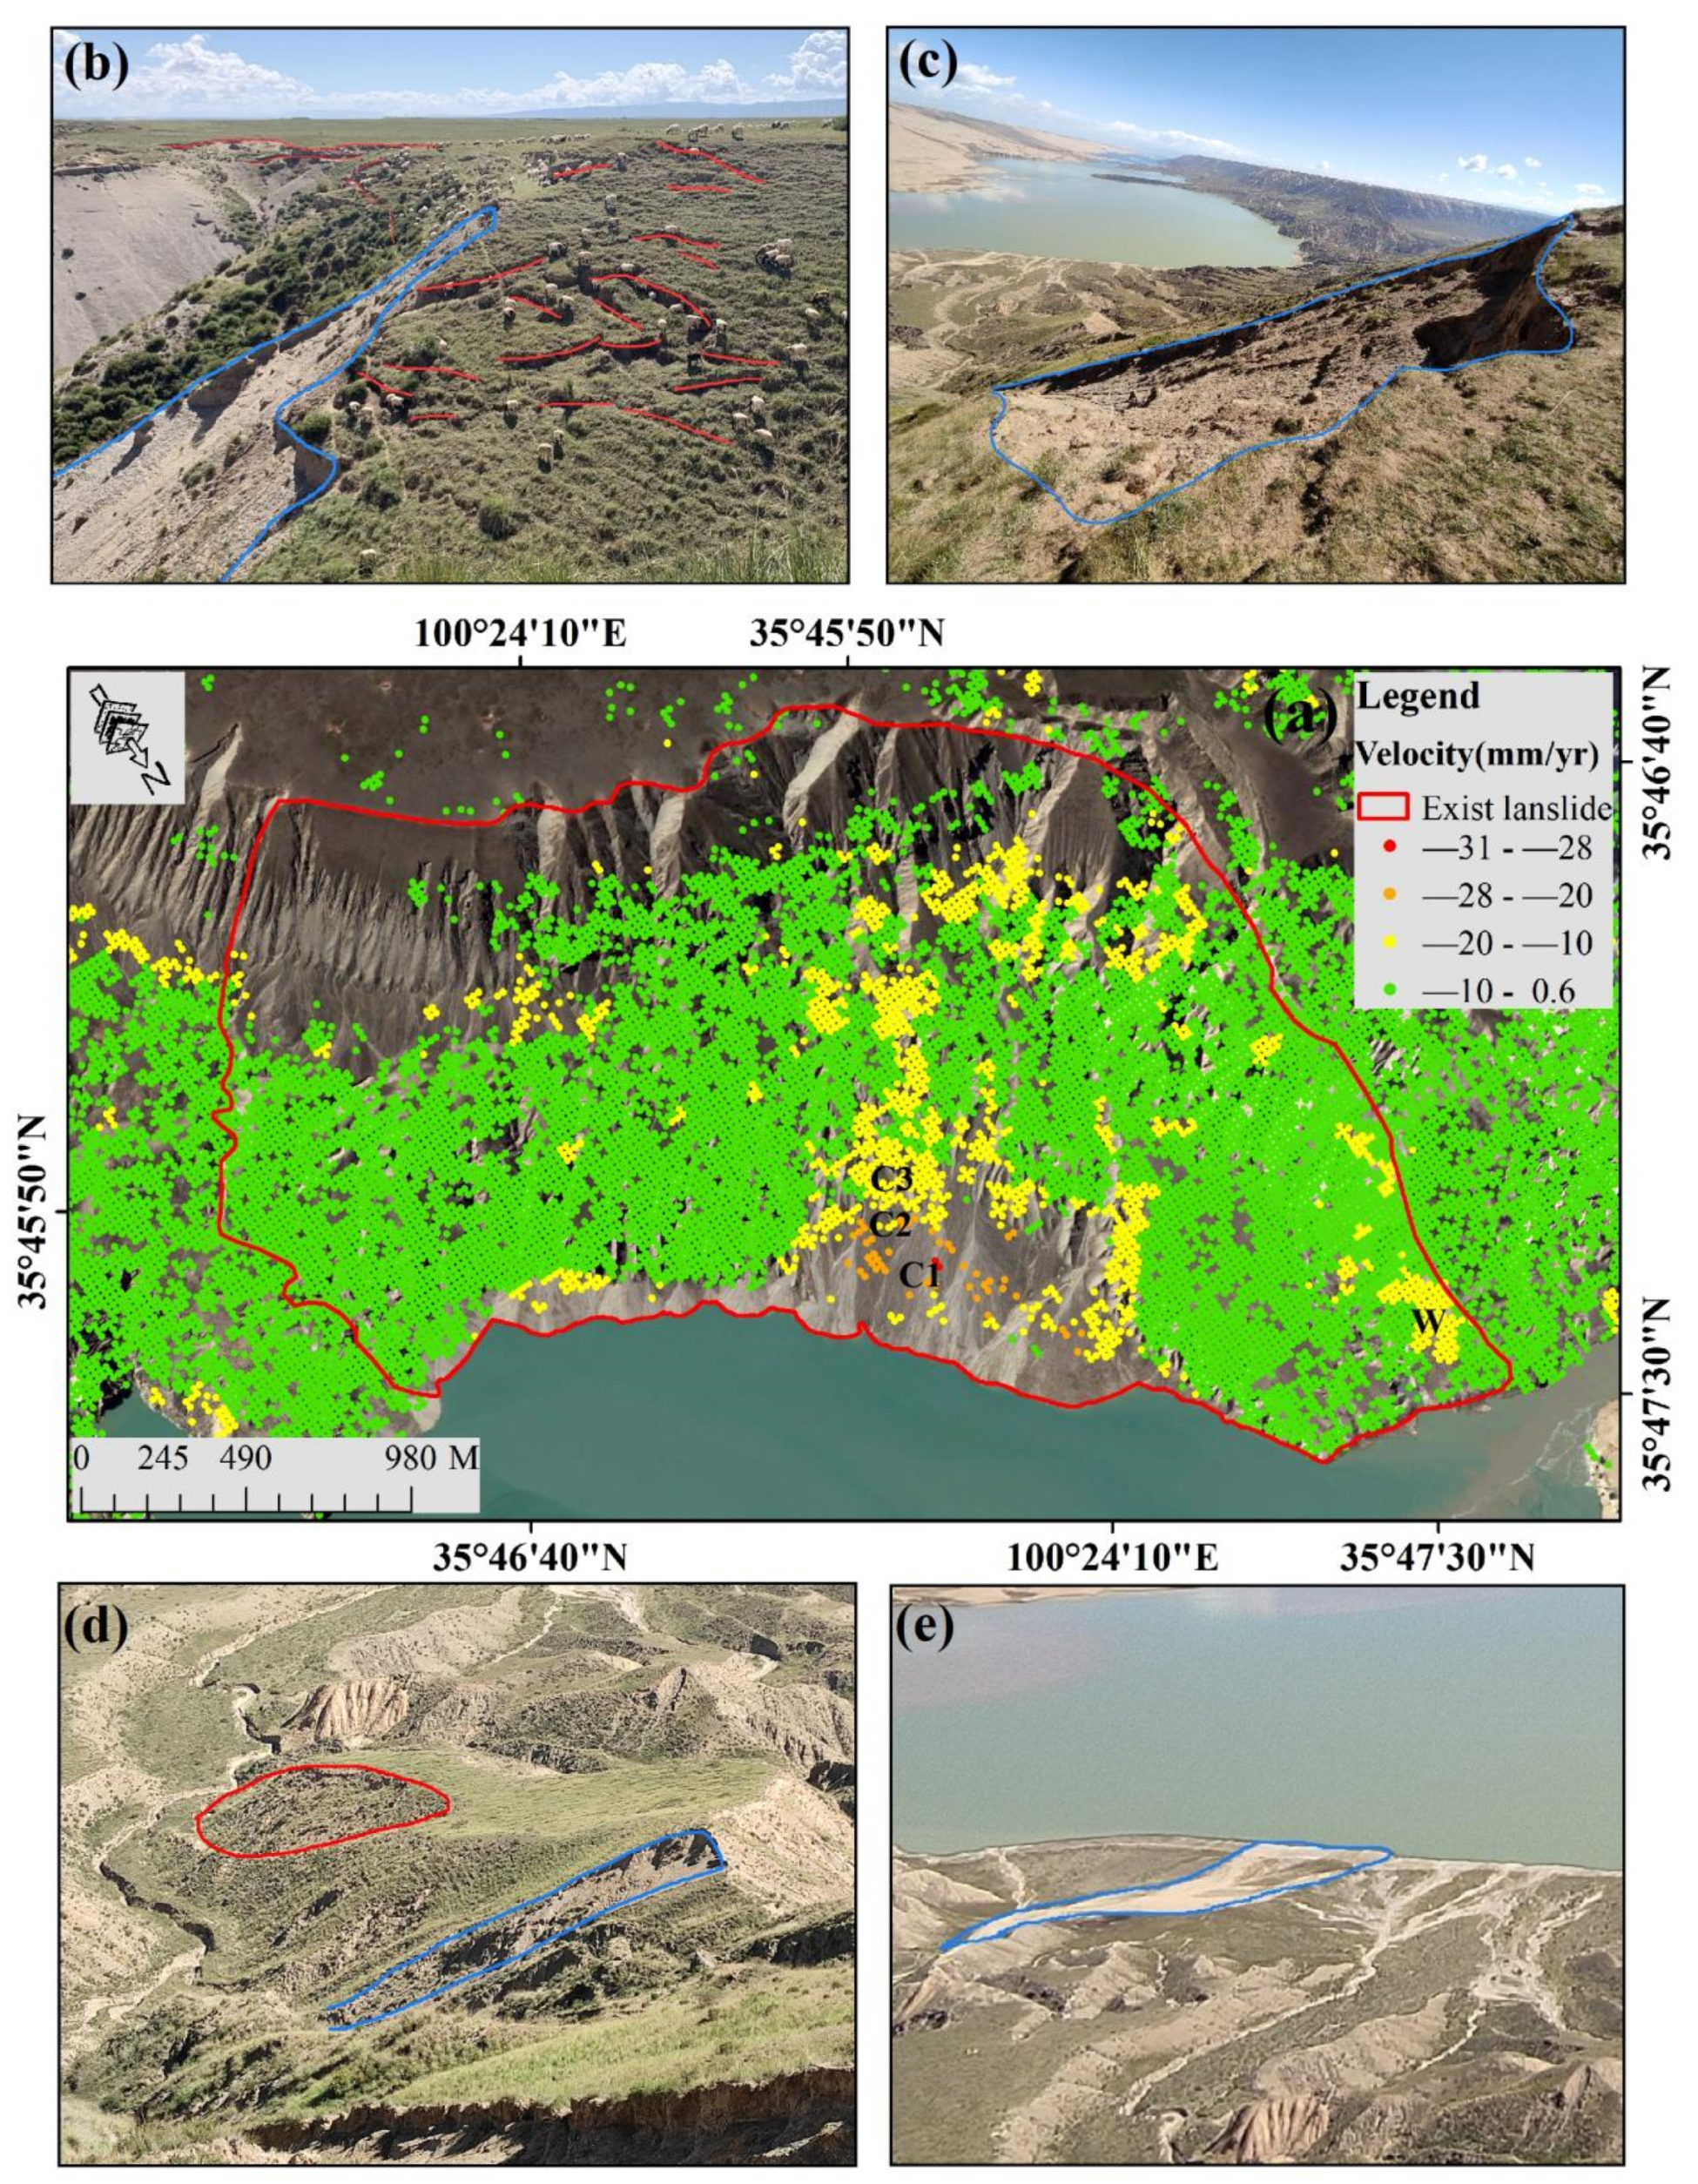
Figure 17.
(a) Deformation velocity of the Mangla River Estuary landslide, (b) unstable area at the rear edge, (c) secondary landslide, (d) potential deformation zone and small landslide in the center of the landslide, and (e) soil flow in the eastern part of the landslide. Red solid lines indicate tensile cracks and potential settlement areas, and blue lines indicate actual landslides.
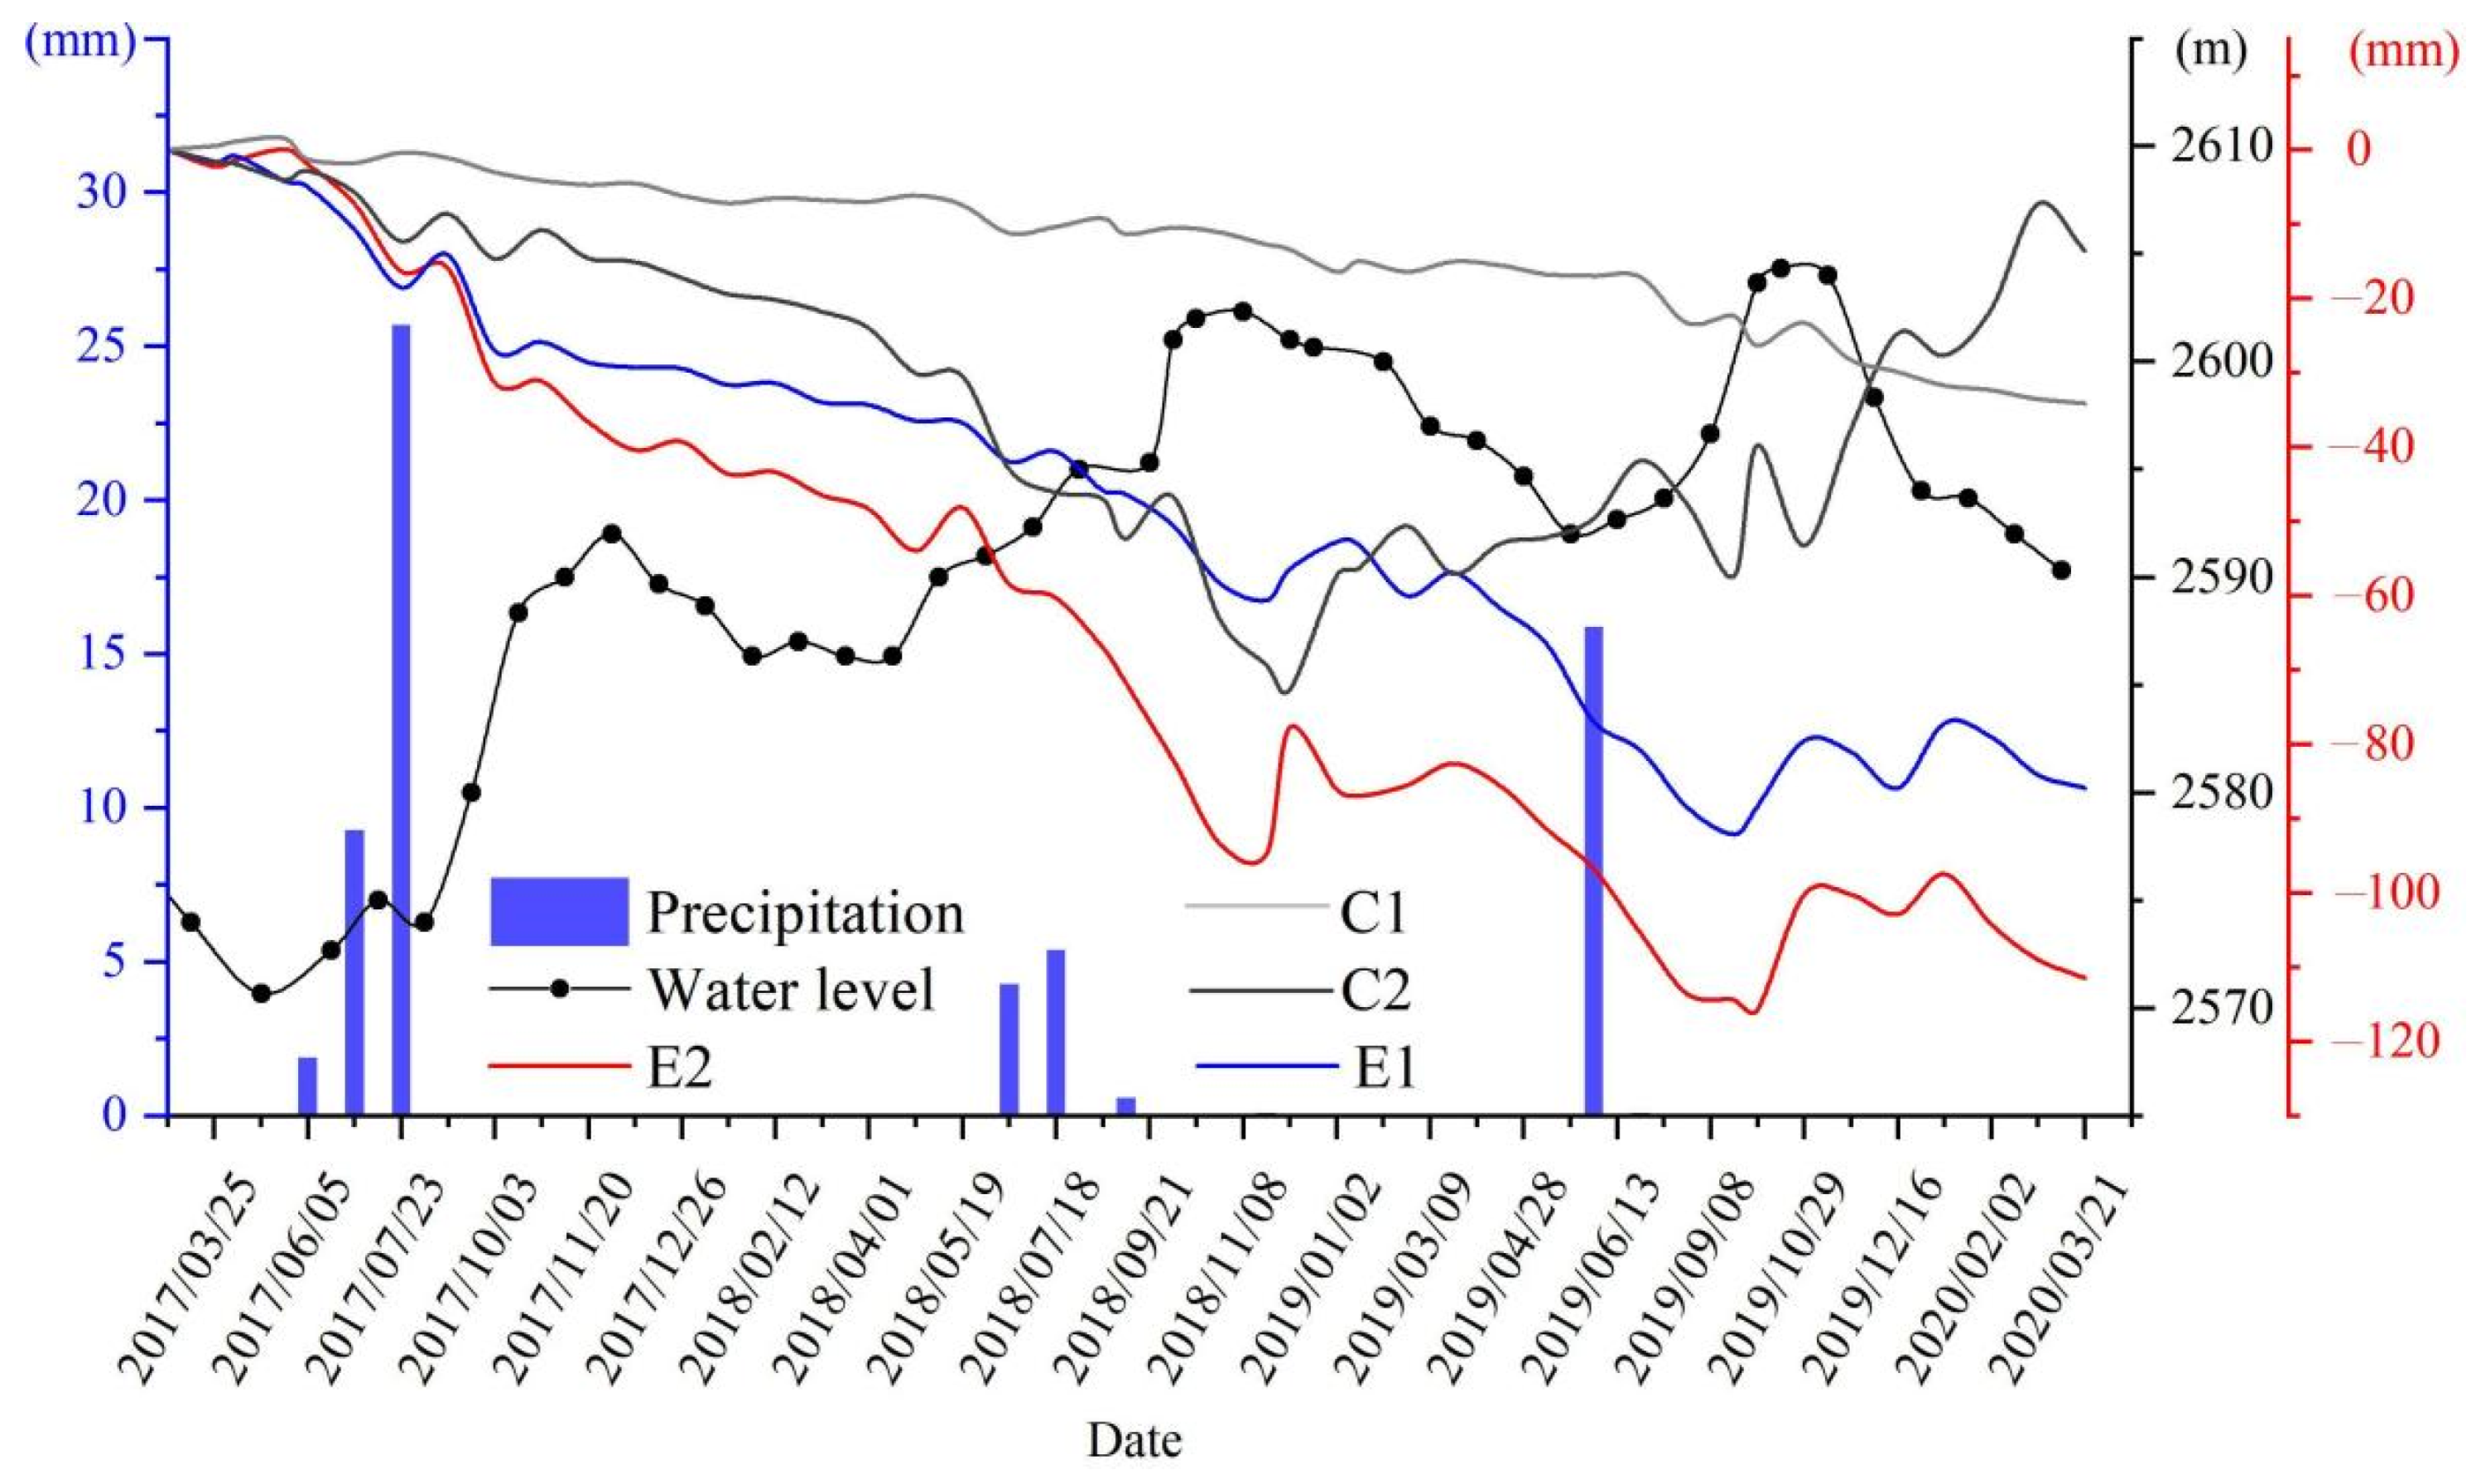
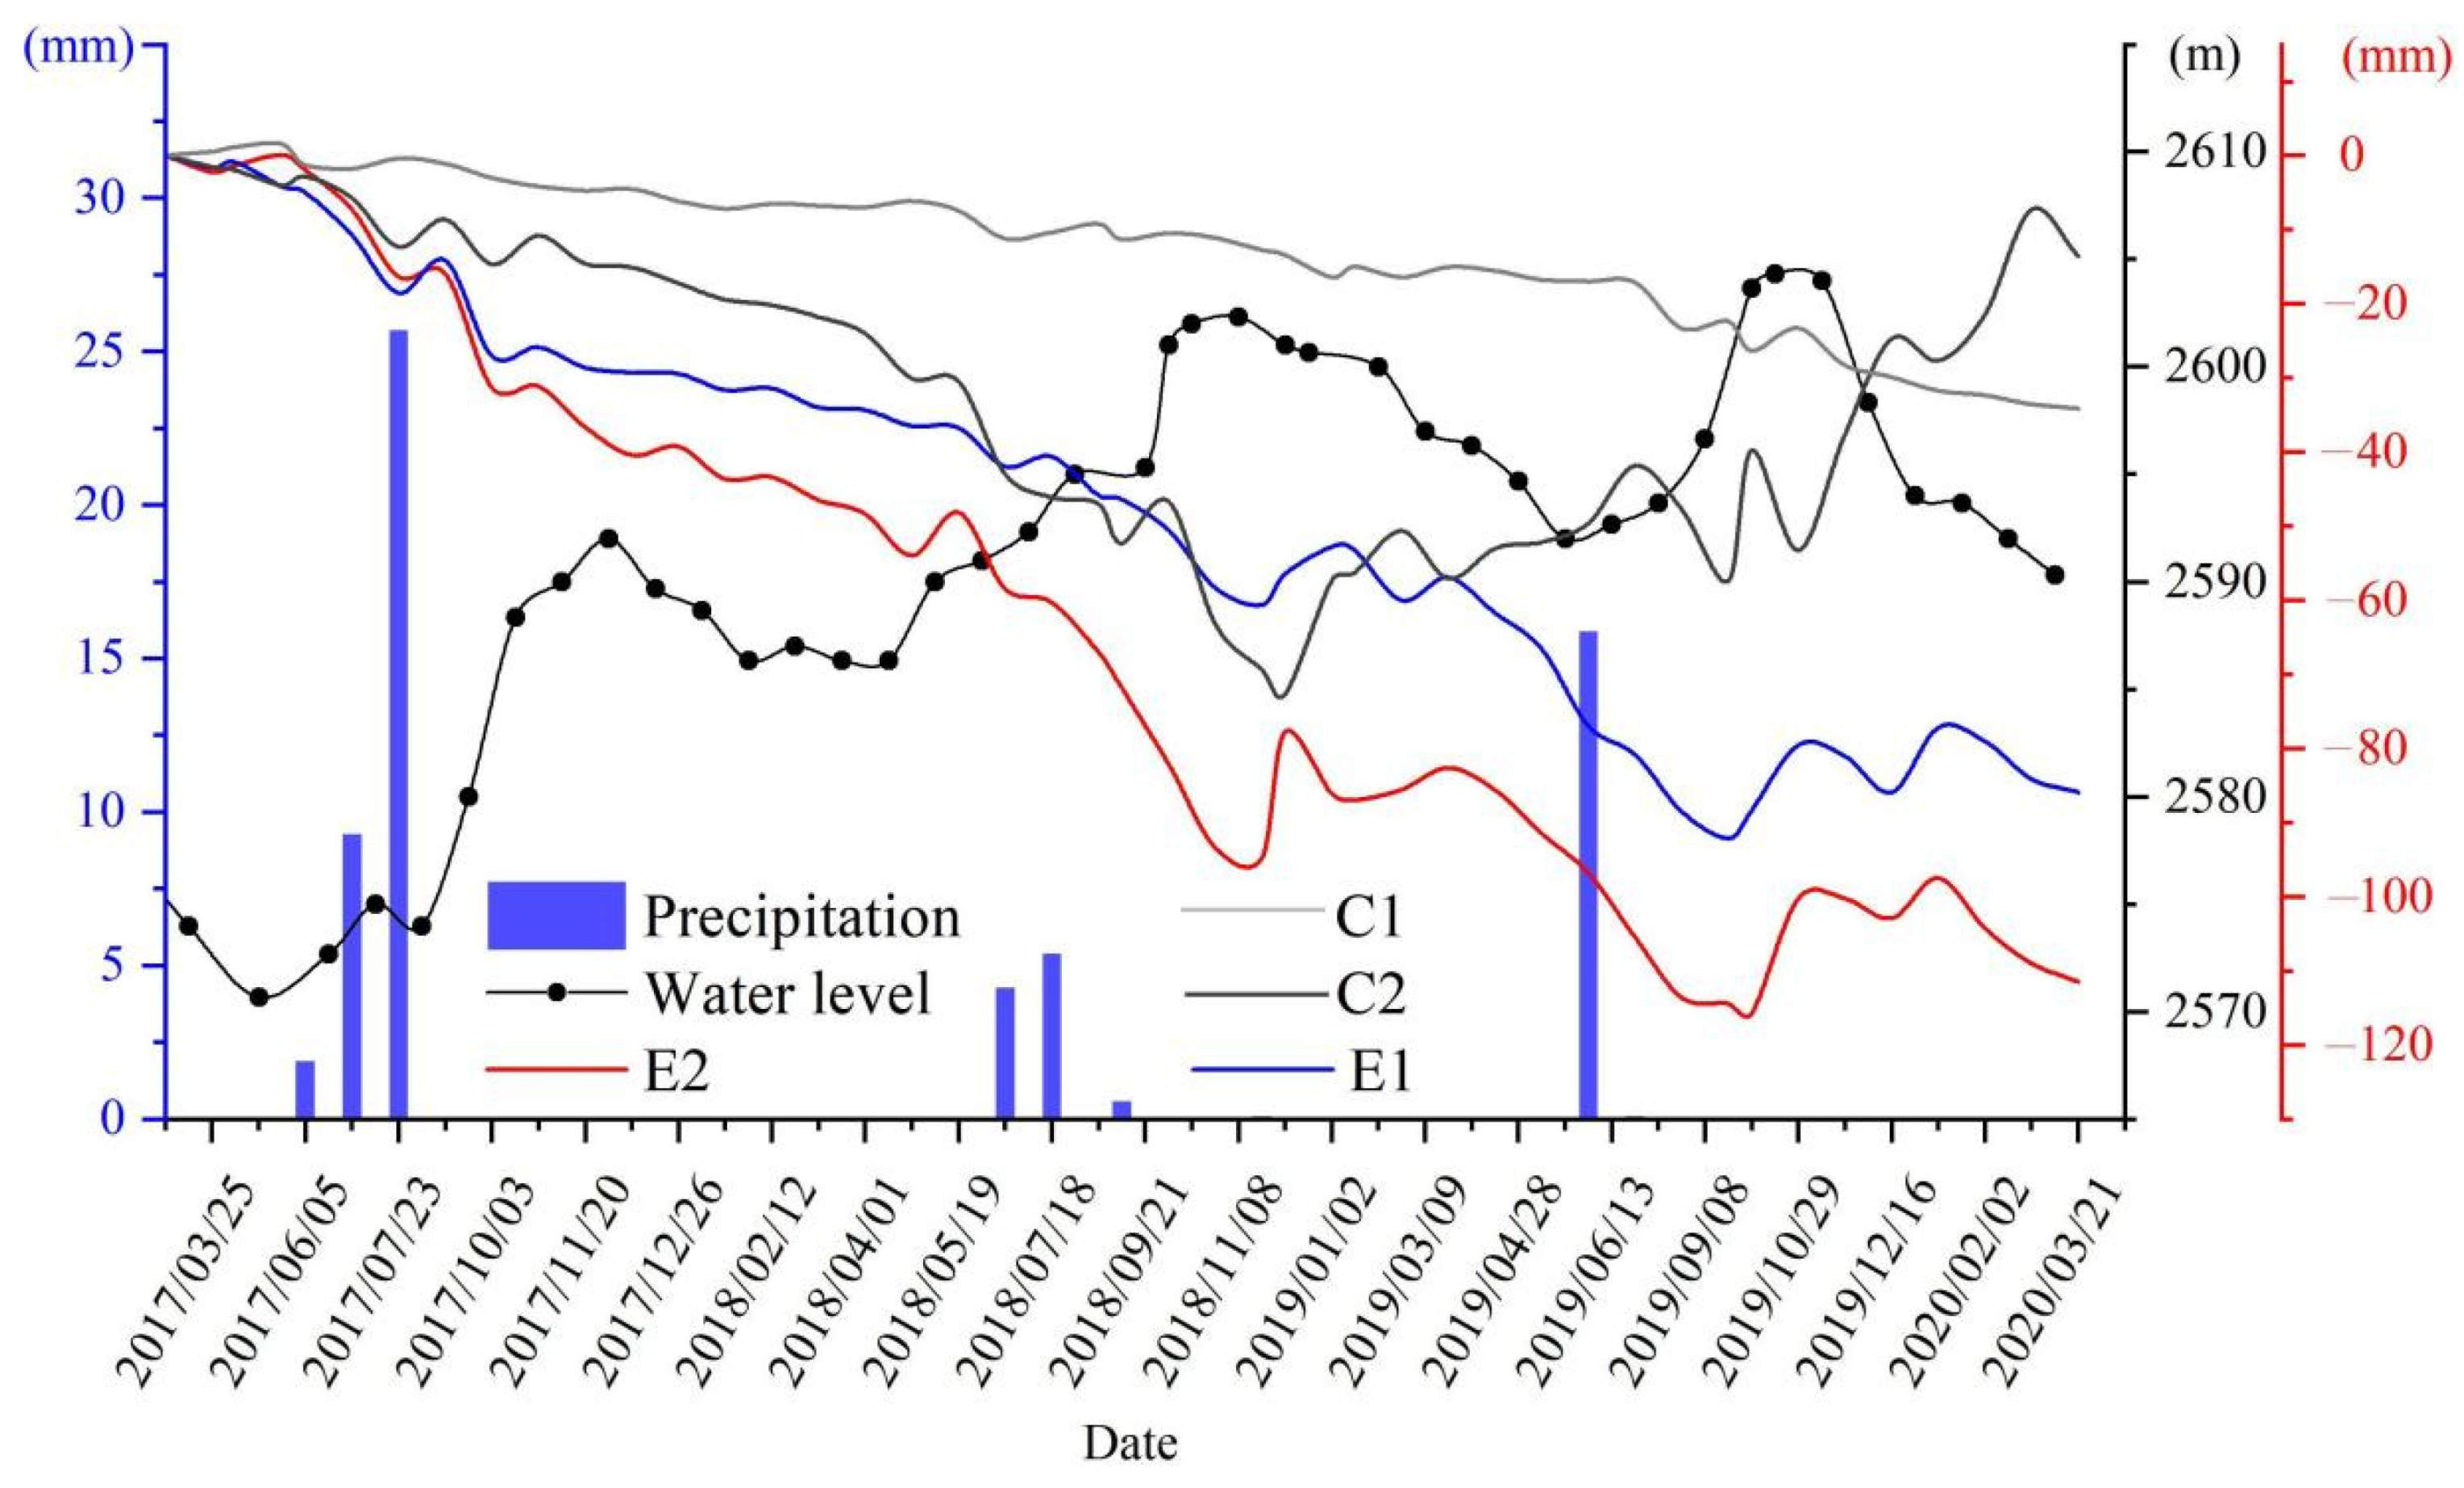
Figure 18.
Time series of precipitation, water level, and deformation for the Mangla River Estuary landslide.
Figure 18.
Time series of precipitation, water level, and deformation for the Mangla River Estuary landslide.
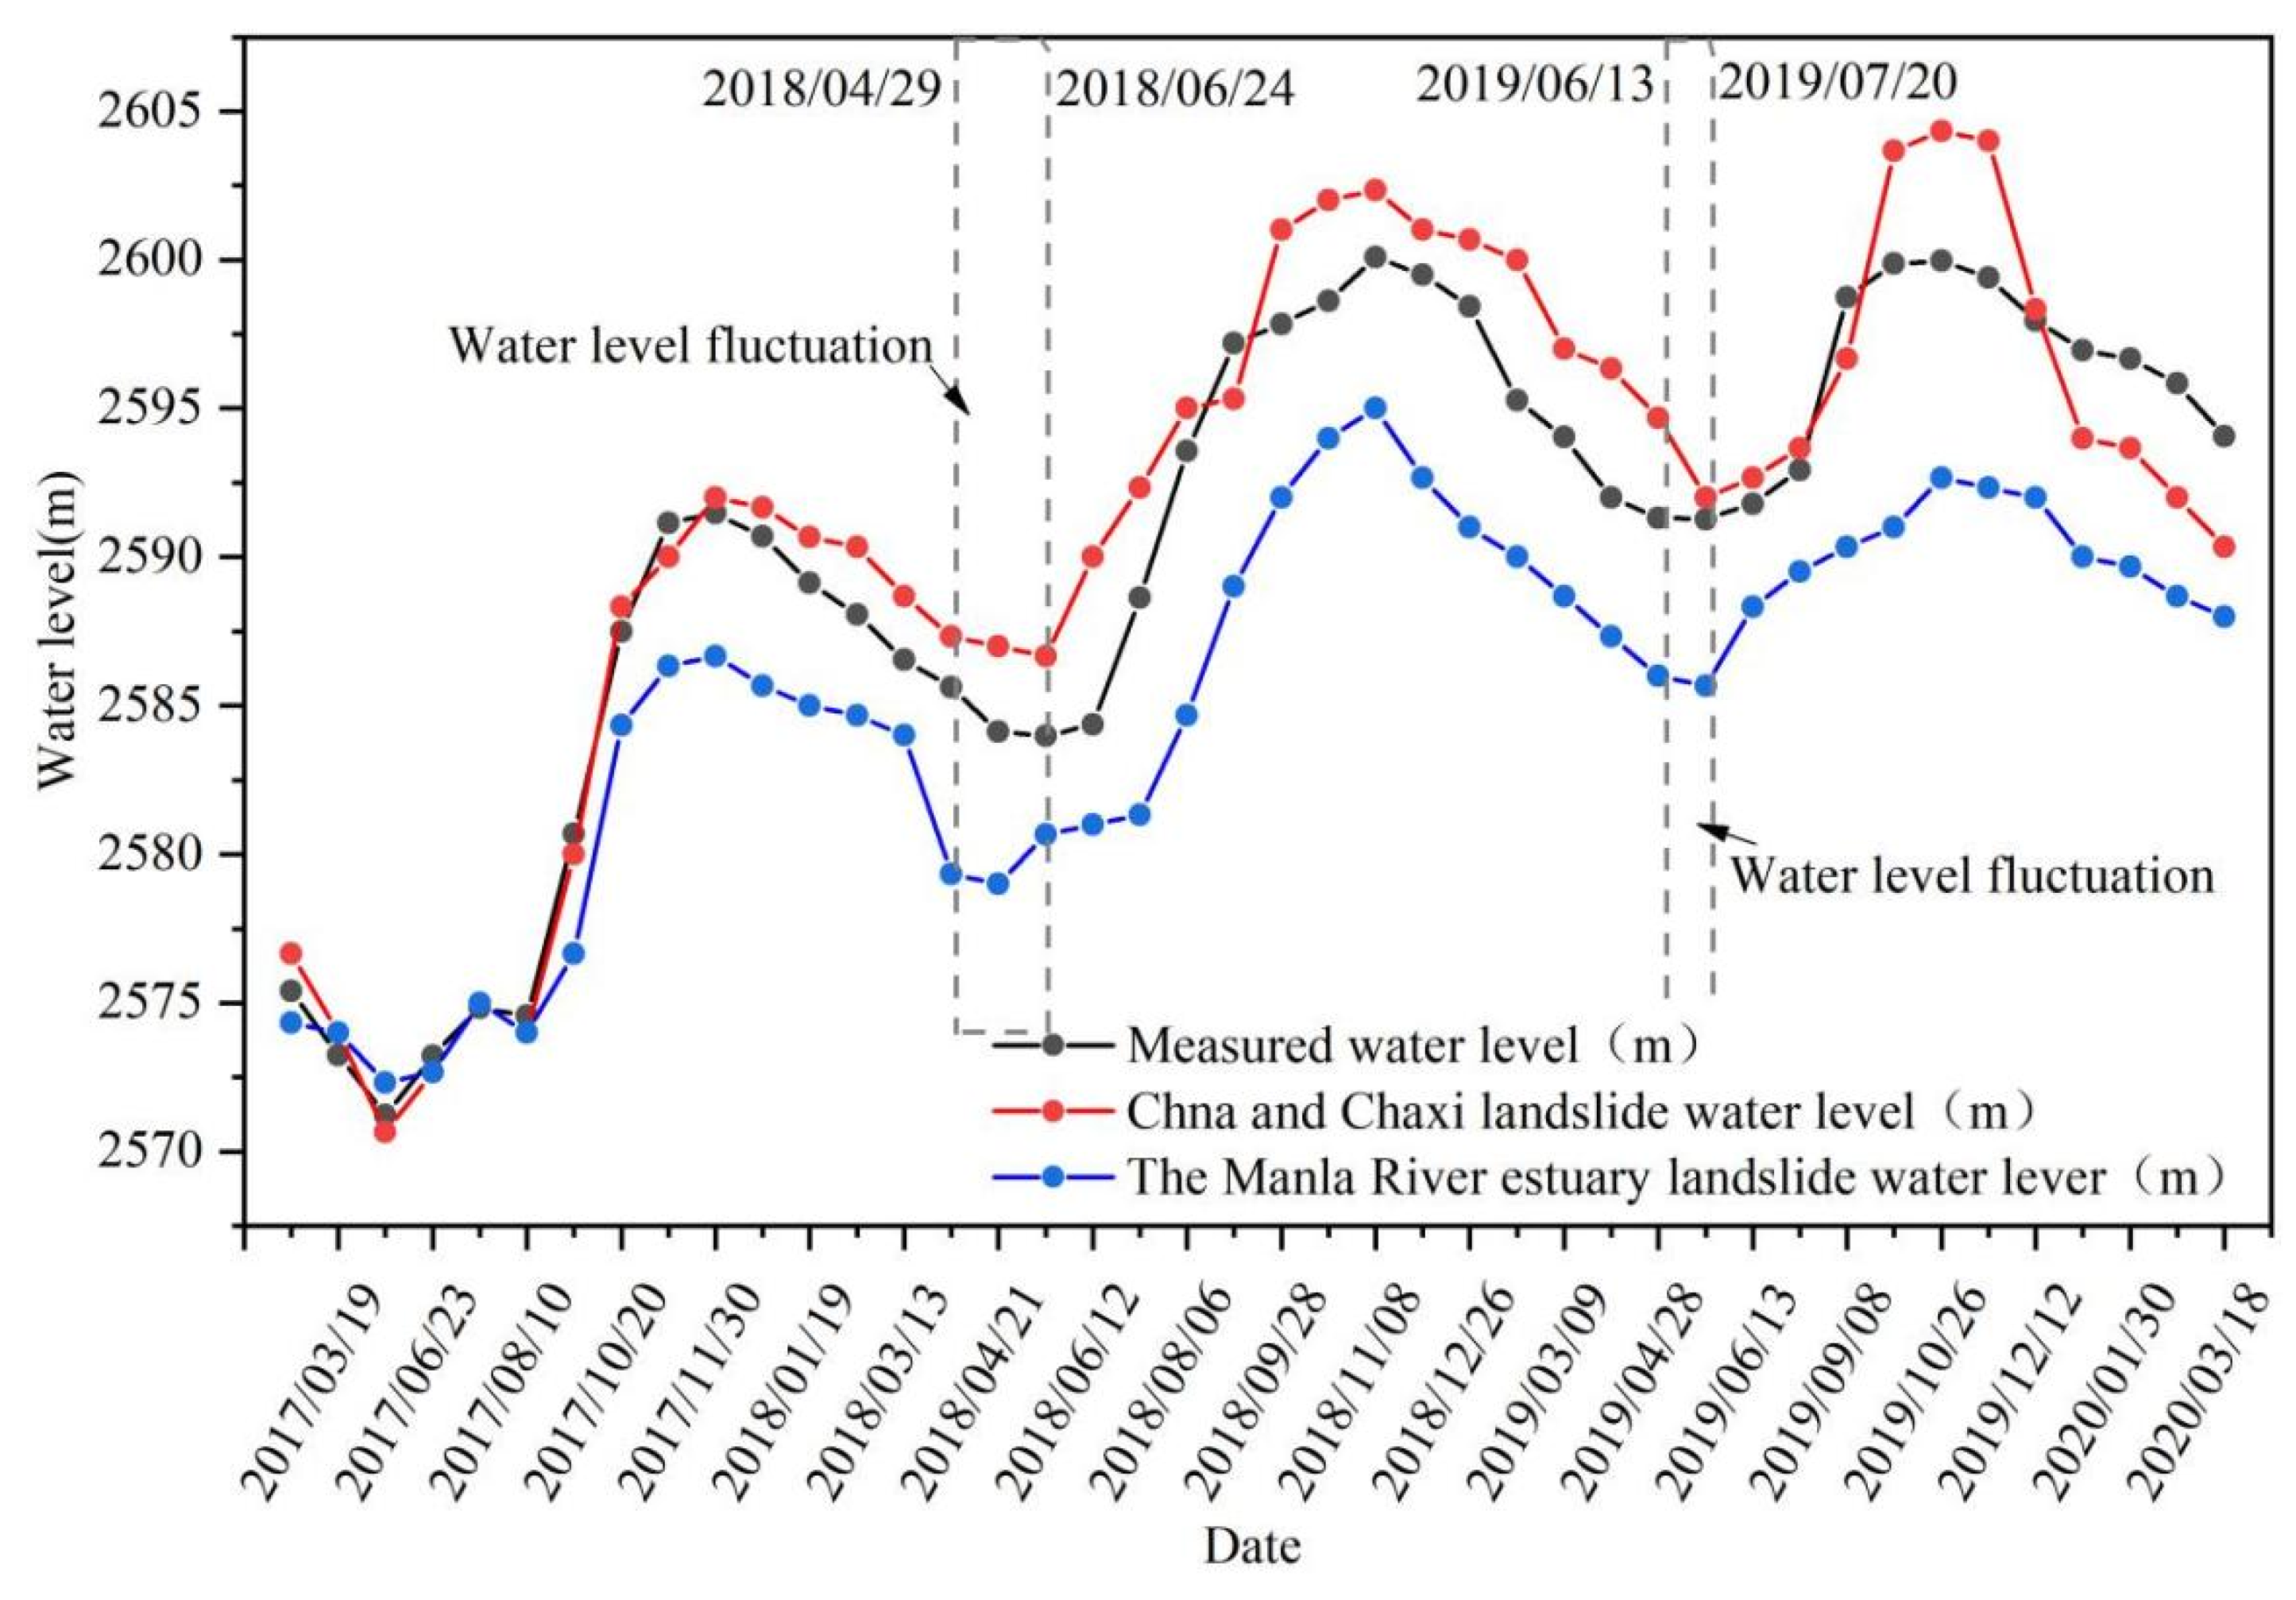
Figure 19.
Time series of the Chana, Chaxi, and Mangla River estuary landslide water levels, and the measured water level.
Figure 19.
Time series of the Chana, Chaxi, and Mangla River estuary landslide water levels, and the measured water level.
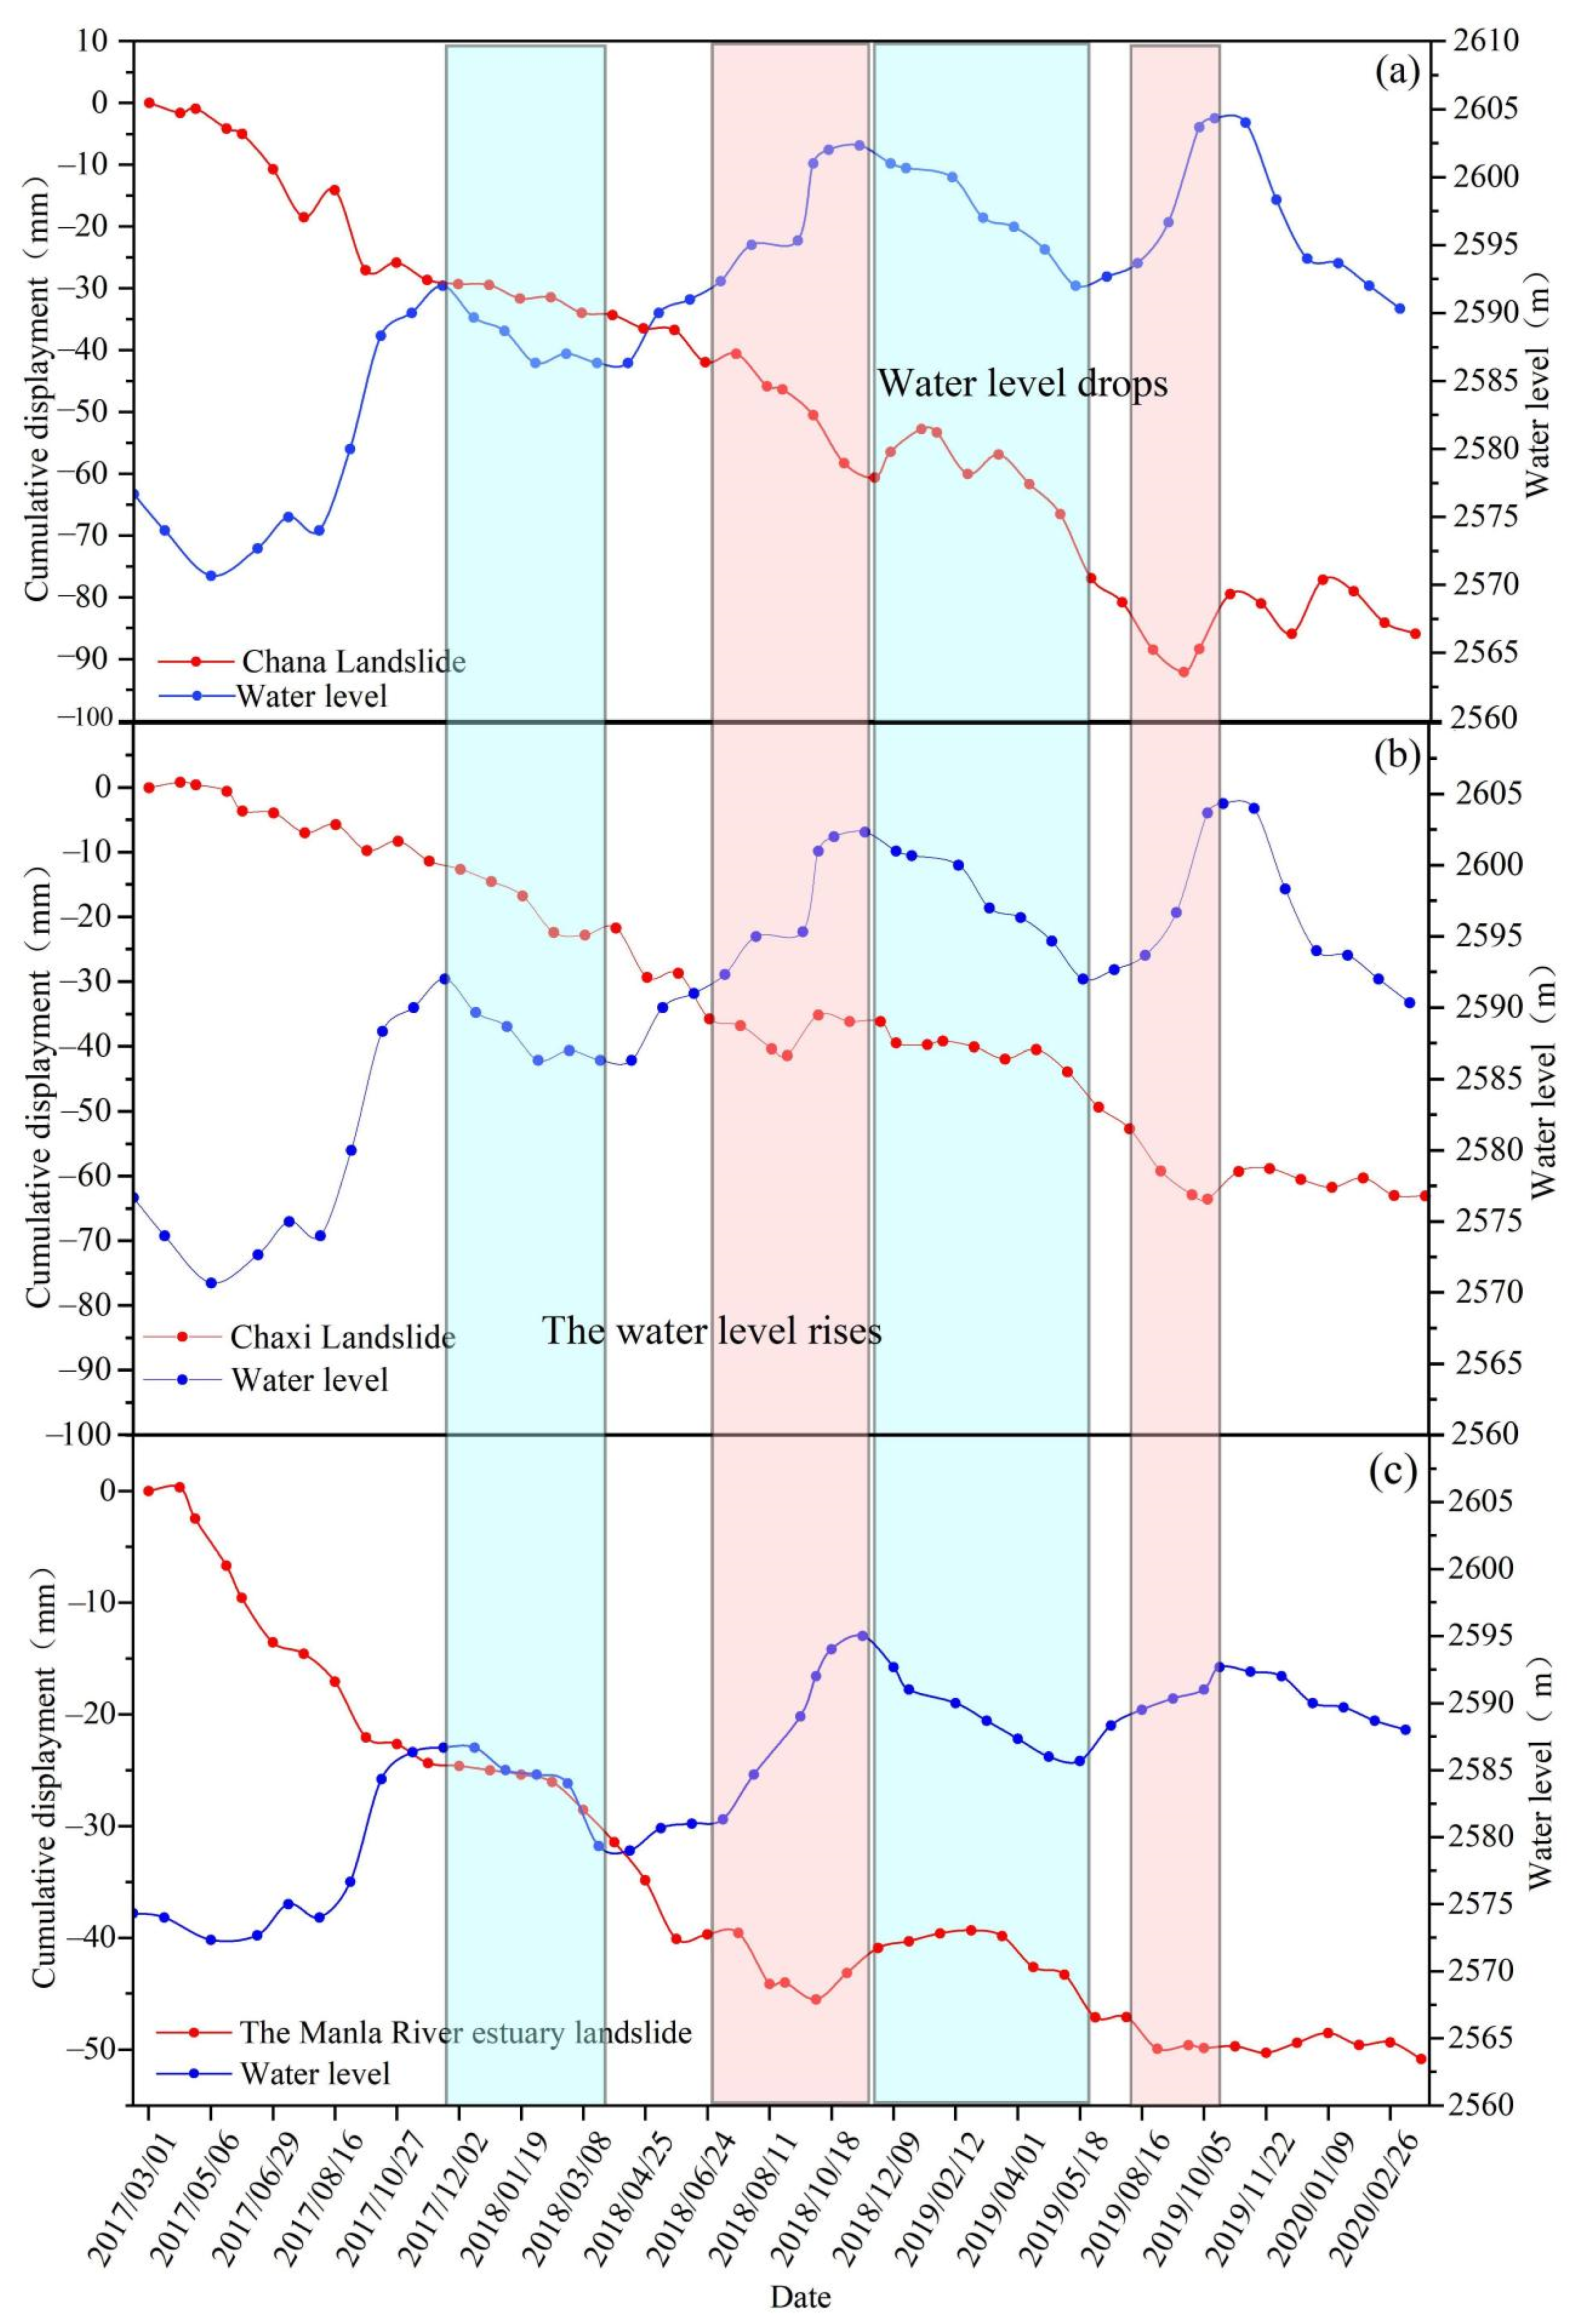
Figure 20.
Water level and landslide displacement time series. (a) The Chana landslide, (b) Chaxi landslide, and (c) Mangla River Estuary landslide.
Figure 20.
Water level and landslide displacement time series. (a) The Chana landslide, (b) Chaxi landslide, and (c) Mangla River Estuary landslide.
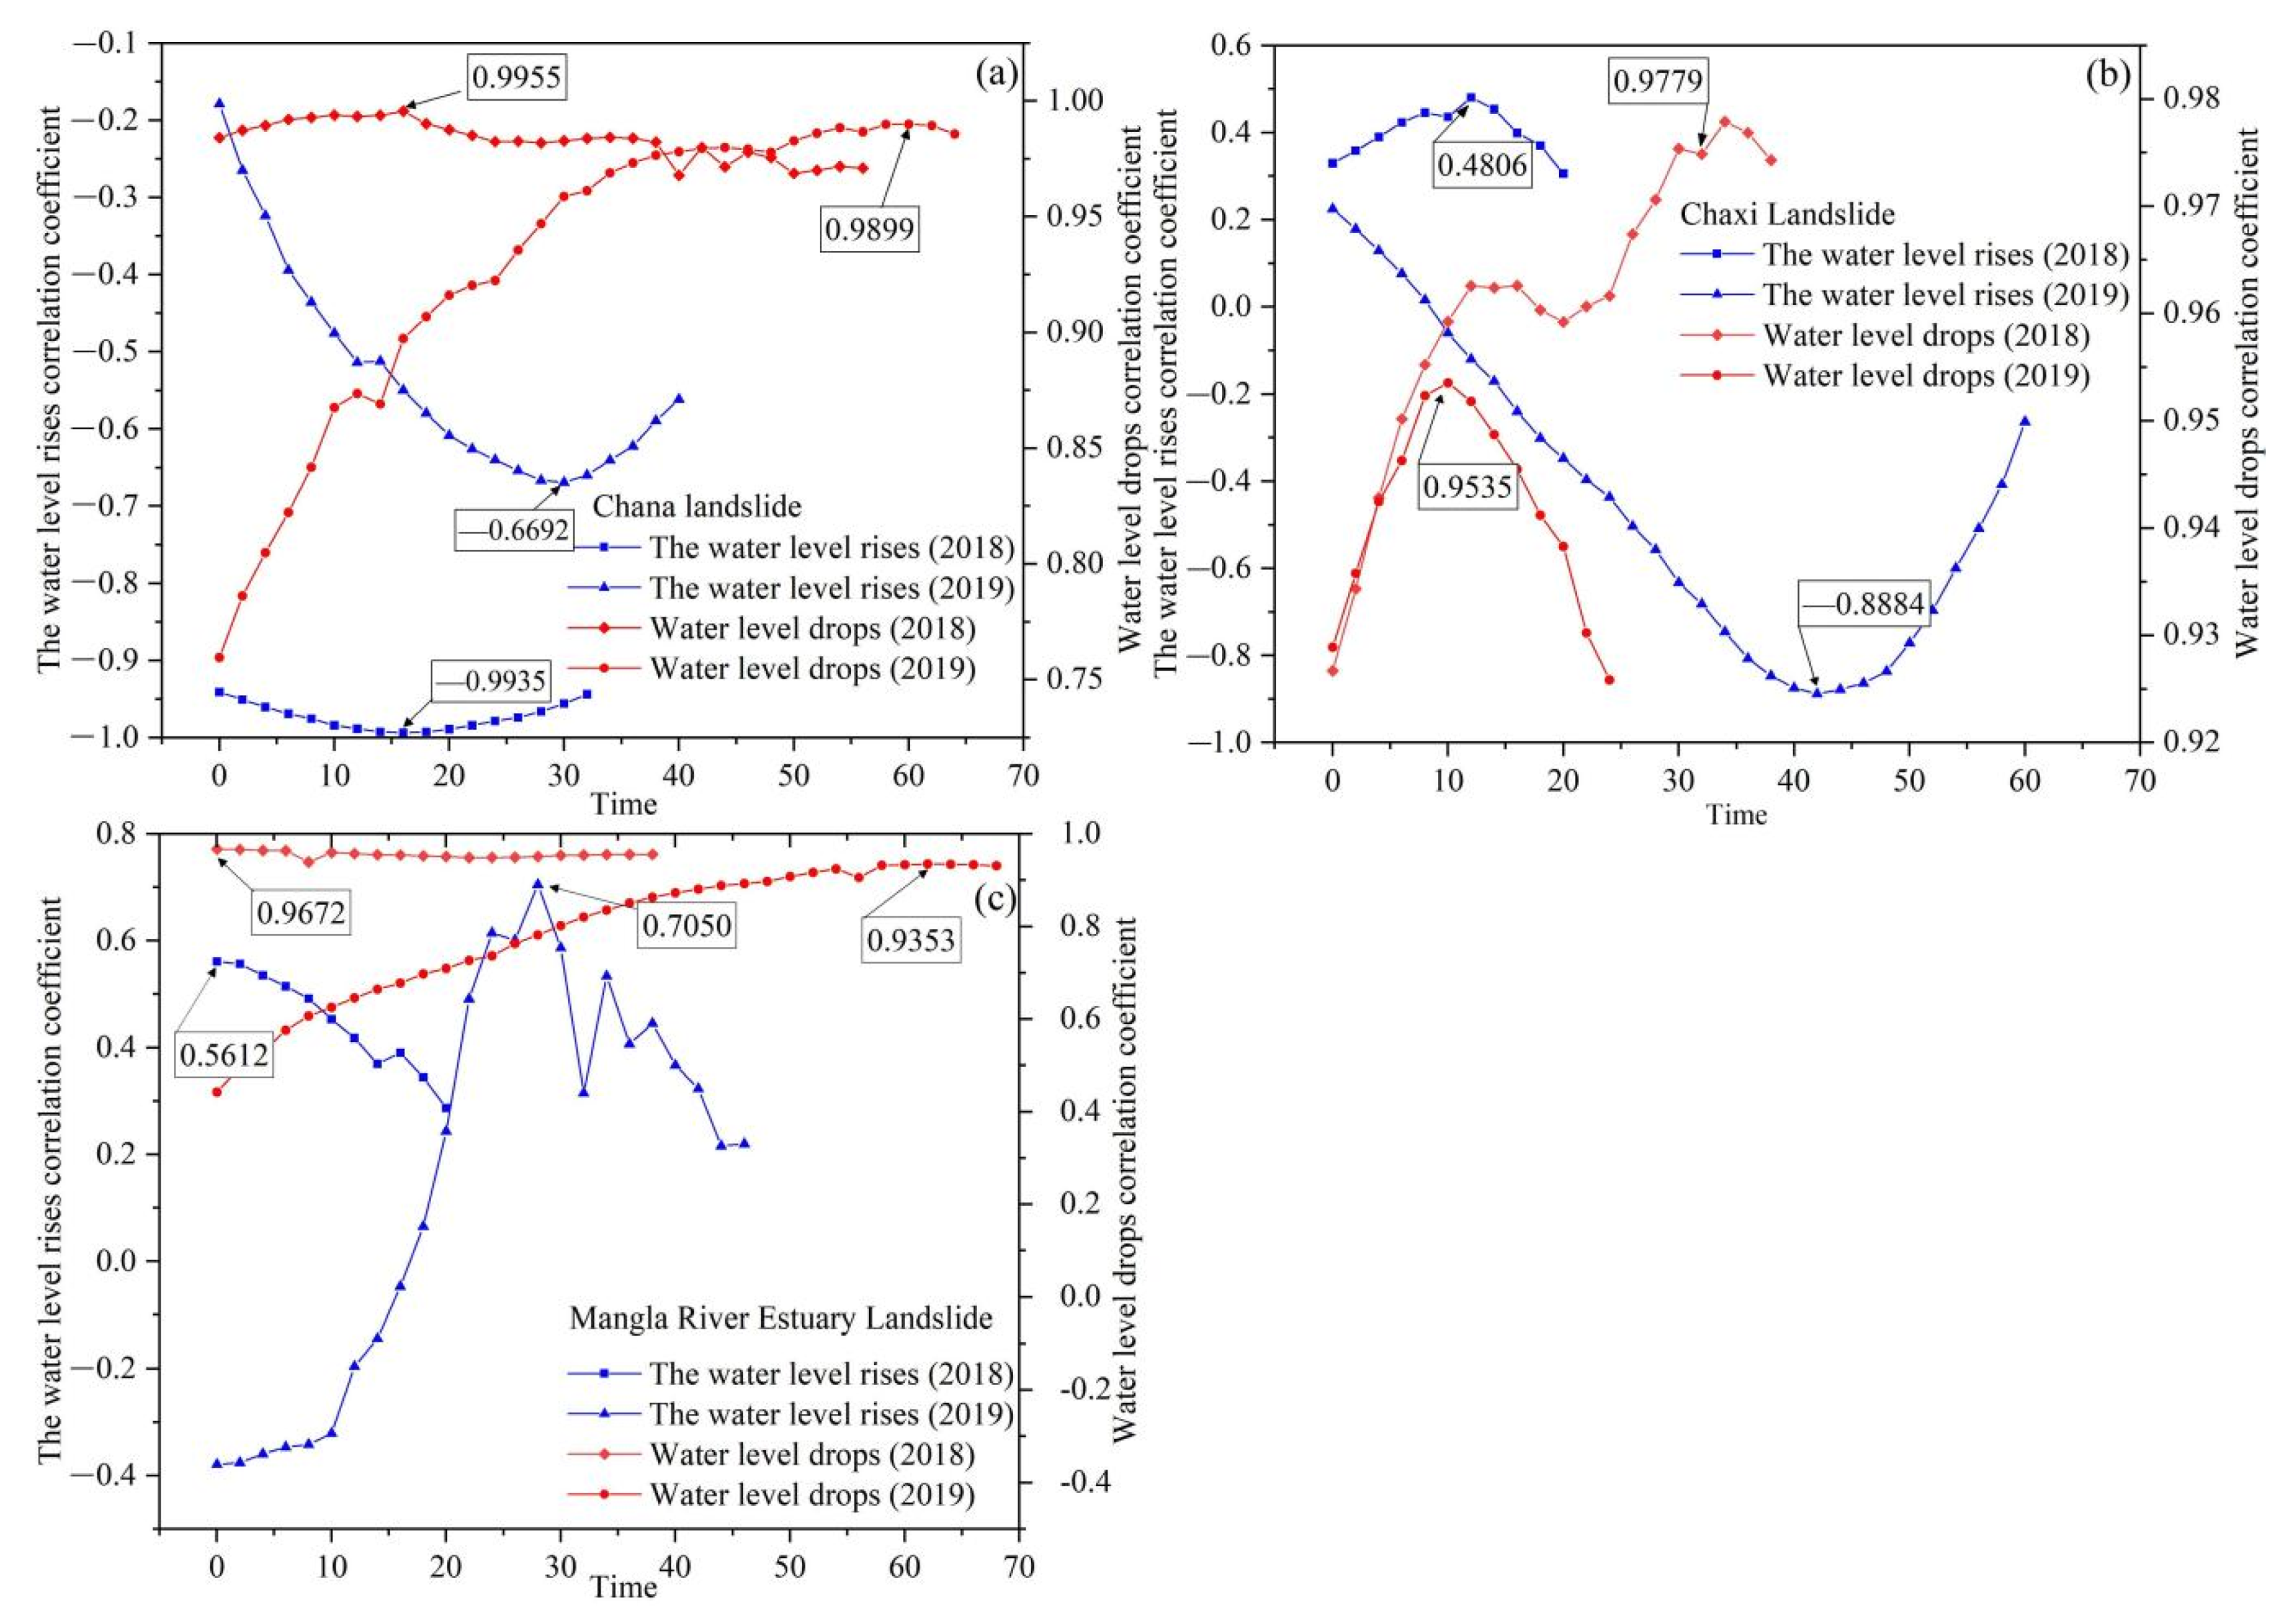
Figure 21.
Correlation between landslide displacement and water level change. (a) Correlation coefficient between the displacement of the Chana landslide and the water level. (b) Correlation coefficient between the displacement of the Chaxi landslide and the water level fluctuation. (c) Indicates the correlation coefficient between the displacement of the Mangla River estuary slope and the water level.
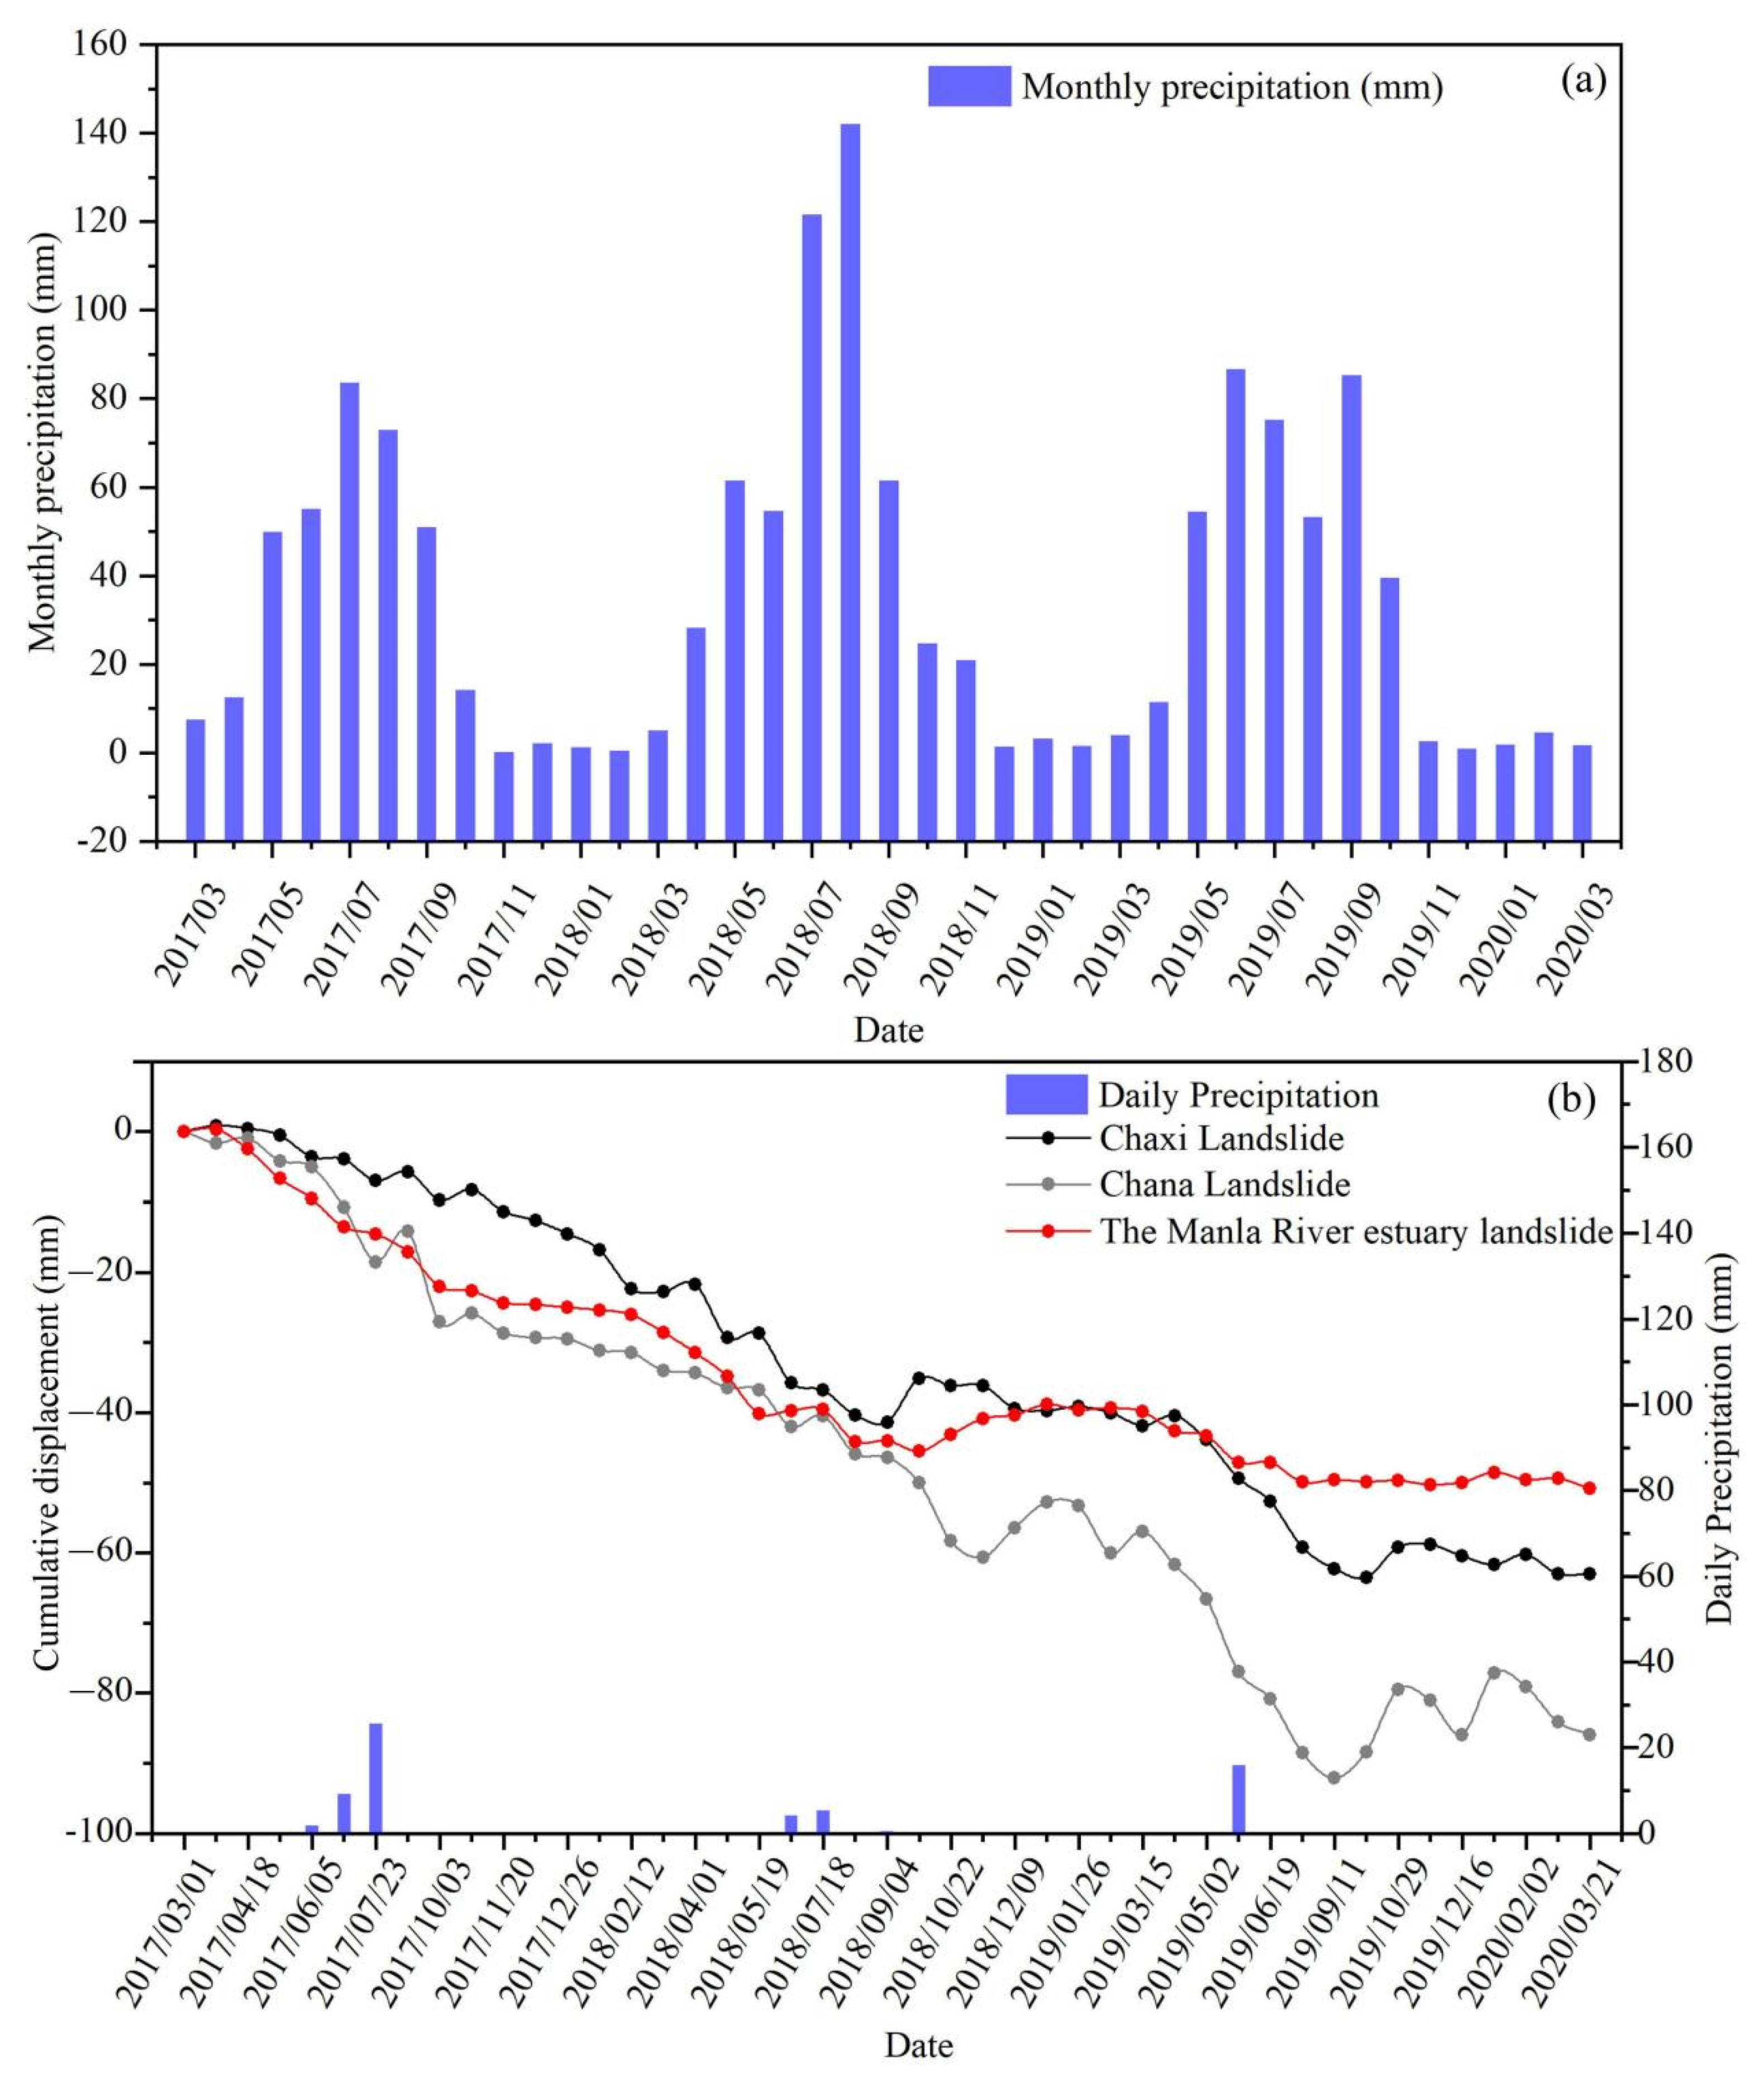
Figure 22.
Relationship between precipitation and landslide deformation. (a) Monthly precipitation at the Longyangxia Reservoir; (b) landslide cumulative displacement and daily precipitation, from 2017 to 2020.
Figure 22.
Relationship between precipitation and landslide deformation. (a) Monthly precipitation at the Longyangxia Reservoir; (b) landslide cumulative displacement and daily precipitation, from 2017 to 2020.
Table 1.
Sentinel-1A data parameters.
Table 1.
Sentinel-1A data parameters.
| SAR Sensor | Sentinel-1A |
|---|
| Orbit direction | Ascending |
| Polarization mode | vv |
| Resolution | 5 m × 20 m |
| Number of images | 45 |
| Sequentially | 1 March 2017–21 March 2020 |
Table 2.
Sentinel-2 data parameters.
Table 2.
Sentinel-2 data parameters.
| Number | Date | Platform | Sun Azimuth Angle Mean | Orbit Number | Orbit Direction | Resolution (m) |
|---|
| 1 | 2018/4/21 | Sentinel-2A | 146.9 | 4 | Descending | 10, 20, 60 |
| 2 | 2018/5/13 | Sentinel-2B | 147.81 | 47 | Descending | 10, 20, 60 |
| 3 | 2018/6/20 | Sentinel-2A | 127.38 | 4 | Descending | 10, 20, 60 |
| 4 | 2018/8/6 | Sentinel-2A | 135.19 | 4 | Descending | 10, 20, 60 |
| 5 | 2018/9/28 | Sentinel-2A | 160.55 | 47 | Descending | 10, 20, 60 |
| 6 | 2018/10/18 | Sentinel-2A | 164.94 | 47 | Descending | 10, 20, 60 |
| 7 | 2018/12/9 | Sentinel-2B | 163.87 | 4 | Descending | 10, 20, 60 |
| 8 | 2019/4/28 | Sentinel-2B | 142.33 | 4 | Descending | 10, 20, 60 |
| 9 | 2019/5/18 | Sentinel-2B | 134.2 | 4 | Descending | 10, 20, 60 |
| 10 | 2019/10/5 | Sentinel-2B | 163.1 | 47 | Descending | 10, 20, 60 |
| 11 | 2019/12/12 | Sentinel-2A | 166.2 | 47 | Descending | 10, 20, 60 |
| 12 | 2020/2/17 | Sentinel-2A | 154.12 | 4 | Descending | 10, 20, 60 |
Table 3.
Landsat8 OLI data parameters.
Table 3.
Landsat8 OLI data parameters.
| SAR Sensor | Landsat8 OLI |
|---|
| Sequentially | 15 February 2017–18 March 2020 |
| WRS Path | 132 |
| WRS Row | 35 |
| Resolution | 30 |
| Select time interval | 1–7 days |
Table 4.
Water levels of Chaxi, Chana, and Manla River Estuary landslides in the Longyangxia reservoir area.
Table 4.
Water levels of Chaxi, Chana, and Manla River Estuary landslides in the Longyangxia reservoir area.
| Number | Date | Real Water Level (m) | Chaxi and Chana Landslide (m) | Manla River Estuary Landslide (m) | Number | Date | Real Water Level (m) | Chaxi and Chana Landslide (m) | Manla River Estuary Landslide (m) |
|---|
| 1 | 2017/2/15 | 2575.4 | 2576.67 | 2574.33 | 22 | 2018/9/28 | 2597.84 | 2601 | 2592 |
| 2 | 2017/3/19 | 2573.25 | 2574.00 | 2574 | 23 | 2018/10/18 | 2598.62 | 2602 | 2594 |
| 3 | 2017/5/6 | 2571.22 | 2570.67 | 2572.33 | 24 | 2018/11/8 | 2600.09 | 2602.33 | 2595 |
| 4 | 2017/6/23 | 2573.21 | 2572.67 | 2572.67 | 25 | 2018/12/9 | 2599.48 | 2601 | 2592.67 |
| 5 | 2017/7/16 | 2574.84 | 2575.00 | 2575 | 26 | 2018/12/26 | 2598.43 | 2600.67 | 2591 |
| 6 | 2017/8/10 | 2574.56 | 2574.00 | 2574 | 27 | 2019/2/12 | 2595.28 | 2600 | 2590 |
| 7 | 2017/9/27 | 2580.68 | 2580.00 | 2576.67 | 28 | 2019/3/9 | 2594.03 | 2597 | 2588.67 |
| 8 | 2017/10/20 | 2587.5 | 2588.33 | 2584.33 | 29 | 2019/4/1 | 2591.99 | 2596.33 | 2587.33 |
| 9 | 2017/11/14 | 2591.14 | 2590.00 | 2586.33 | 30 | 2019/4/23 | 2591.32 | 2594.67 | 2586 |
| 10 | 2017/11/30 | 2591.47 | 2592 | 2586.67 | 31 | 2019/5/18 | 2591.27 | 2592 | 2585.67 |
| 11 | 2017/12/23 | 2590.69 | 2591.67 | 2585.67 | 32 | 2019/6/13 | 2591.79 | 2592.67 | 2588.33 |
| 12 | 2018/1/17 | 2588.06 | 2590.67 | 2585 | 33 | 2019/8/16 | 2592.93 | 2593.67 | 2589.5 |
| 13 | 2018/2/9 | 2586.54 | 2590.33 | 2584.67 | 34 | 2019/9/8 | 2598.74 | 2596.67 | 2590.33 |
| 14 | 2018/3/13 | 2585.61 | 2588.67 | 2584 | 35 | 2019/9/28 | 2599.87 | 2603.67 | 2591 |
| 15 | 2018/3/29 | 2584.12 | 2587.33 | 2579.33 | 36 | 2019/10/26 | 2599.96 | 2604.33 | 2592.67 |
| 16 | 2018/4/21 | 2583.98 | 2587 | 2579 | 37 | 2019/11/20 | 2599.4 | 2604 | 2593.67 |
| 17 | 2018/5/13 | 2584.37 | 2586.67 | 2580.67 | 38 | 2019/12/12 | 2597.96 | 2598.33 | 2592 |
| 18 | 2018/6/20 | 2588.63 | 2590 | 2581 | 39 | 2020/1/7 | 2596.96 | 2594 | 2590 |
| 19 | 2018/7/12 | 2588.63 | 2592.33 | 2581.33 | 40 | 2020/1/30 | 2596.66 | 2593.67 | 2589.67 |
| 20 | 2018/8/6 | 2593.57 | 2595 | 2584.67 | 41 | 2020/2/17 | 2595.83 | 2592 | 2588.67 |
| 21 | 2018/9/21 | 2597.19 | 2595.33 | 2589 | 42 | 2020/3/18 | 2594.06 | 2590.33 | 2588 |
Table 5.
List of potential landslides.
Table 5.
List of potential landslides.
| Order | Landslide Name | Longitude | Latitude |
|---|
| 1 | Longyang Landslide | 100°53′19.31′′E | 36°6′5.10′′N |
| 2 | Chana landslide | 100°51′37.58′′E | 36°6′25.33′′N |
| 3 | Chaxi Landslide | 100°49′51.36′′E | 36°6′39.63′′N |
| 4 | Wangshike Landslide | 100°48′29.40′′E | 36°3′55.24′′N |
| 5 | 1# landslide on the west side of Wangshike | 100°47′11.38′′E | 36°4′58.28′′N |
| 6 | 2# landslide on the west side of Wangshike | 100°47′13.39′′E | 36°3′50.30′′N |
| 7 | Guantang Village Landslide | 100°50′6.74′′E | 36°0′41.12′′N |
| 8 | Baiztan Landslide | 100°28′26.89′′E | 35°48′6.80′′N |
| 9 | Landslide on the right side of Baiztan | 100°31′21.55′′E | 35°51′40.77′′N |
| 10 | Mangla River Landslide | 100°25′56.72′′E | 35°45′10.75′′N |
| 11 | Mangla River Estuary Landslide | 100°23′56.22′′E | 35°46′32.48′′N |
| 12 | New potential landslide | 100°20′59.86′′E | 35°47′5.38′′N |
Table 6.
Daily displacement of Chana, Chaxi, and Mangla River Estuary landslides.
Table 6.
Daily displacement of Chana, Chaxi, and Mangla River Estuary landslides.
| Date | Chana Landslide | Chaxi Landslide | Mangla River Estuary Landslide |
|---|
| Water Level Rise (mm) | Water Level Drops (mm) | Water Level Rise (mm) | Water Level Drops (mm) | Water Level Rise (mm) | Water Level Drops (mm) |
|---|
| 2018 | −0.14 | −0.05 | 0.00 | −0.11 | −0.01 | −0.07 |
| 2019 | 0.10 | −0.16 | 0.00 | −0.07 | 0.00 | −0.02 |
Table 7.
Cumulative displacement and annual cumulative displacement of the Chana, Chaxi, and Mangla River Estuary landslides in summer.
Table 7.
Cumulative displacement and annual cumulative displacement of the Chana, Chaxi, and Mangla River Estuary landslides in summer.
| Date | Summer Cumulative Displacement (mm) | Annual Cumulative Displacement (mm) |
|---|
| Chana Landslide | Chaxi Landslide | Mangla River Estuary Landslide | Chana Landslide | Chaxi Landslide | Mangla River Estuary Landslide |
|---|
| 2018 | −3.89 | −4.59 | −4.43 | −23.3 | −25.18 | −13.84 |
| 2019 | −7.66 | −6.55 | −2.82 | −33.13 | −20.77 | −11.09 |


 ,
, 


