Technical Note

Validation of Recent Altimeter Missions at Non-Dedicated Tide Gauge Stations in the Southeastern North Sea

1
GFZ, Helmholtz Centre Potsdam, Geodesy, 14473 Potsdam, Germany
2
BfG, The German Federal Institute of Hydrology, 56002 Koblenz, Germany
3
Institute of Geodesy and Geoinformation Science, Technische Universität Berlin, 10623 Berlin, Germany
*
Author to whom correspondence should be addressed.
Submission received: 8 November 2021 / Revised: 22 December 2021 / Accepted: 23 December 2021 / Published: 5 January 2022
(This article belongs to the Special Issue Coastal Area Observations Based on Satellite Altimetry Data)

Abstract

:
Consistent calibration and monitoring is a basic prerequisite for providing a reliable time series of global and regional sea-level variations from altimetry. The precisions of sea-level measurements and regional biases for six altimeter missions (Jason-1/2/3, Envisat, Saral, Sentinel-3A) are assessed in this study at 11 GNSS-controlled tide gauge stations in the German Bight (SE North Sea) for the period 2002 to 2019. The gauges are partly located at the open water, and partly at the coast close to mudflats. The altimetry is extracted at virtual stations with distances from 2 to 24 km from the gauges. The processing is optimized for the region and adjusted for the comparison with instantaneous tide gauge readings. An empirical correction is developed to account for mean height gradients and slight differences of the tidal dynamics between the gauge and altimetry, which improves the agreement between the two data sets by 15–75%. The precision of the altimeters depends on the location and mission and ranges from 1.8 to 3.7 cm if the precision of the gauges is 2 cm. The accuracy of the regional mission biases is strongly dependent on the mean sea surface heights near the stations. The most consistent biases are obtained based on the CLS2011 model with mission-dependent accuracies from 1.3 to 3.4 cm. Hence, the GNSS-controlled tide gauges operated operationally by the German Waterway and Shipping Administration (WSV) might complement the calibration and monitoring activities at dedicated CalVal stations.

1. Introduction

Coastal zones are exposed to manifold natural and anthropogenic forces that are potentially threatening habitats and societies. Among them, extreme sea levels and long-term sea-level rise are of special concern [1,2] and require substantial investments in coastal protection measures.
For more than a century, the coastal sea level has been observed with tide gauges. They are well maintained and have a proven record of accuracy [3,4]. Tide gauges deliver localized high-resolution sea-level data which are valuable for operational purpose, but also for monitoring surges, extremes, or tsunamis [2,5]. A number of studies employed this data to characterize global sea-level rise [6,7] or local effects such as coastal subsidence [5,8].
Since more than three decades, radar altimetry has been used for sea-level research and increasingly for operational applications [2,9]. Over the years, a multitude of satellites have been and are still used to continuously observe the instantaneous sea level globally. This requires the harmonization and intercalibration of contemporaneous and consecutive missions. The precision of altimeter missions and biases between the missions have been assessed on a global basis [10,11,12]; however, these values are not necessarily valid for regional applications. In coastal areas, the precision is frequently diminished and geographically correlated orbit errors induce regional inhomogeneous mission biases [13,14]. There exist only a few continuously operated, dedicated CalVal stations for altimetry [15,16,17,18]. However, globally distributed tide gauge stations have been used to monitor the precision and long-term sea-level trends observed by altimetry [19,20,21].
Our study area is the German Bight, located on the European continental shelf in the southeastern corner of the North Sea. It covers an area of about 77,000 km2 and is very shallow with maximum water depths of about 50 m. The Wadden Sea with its mudflats spans about 10–12 km off the coast and is bordered by the chain of the Frisian Islands. Altimeter data might help to improve storm surge and climate models used by local authorities for sea-level forecasts, marine safety and search and rescue, as well as for the monitoring of drifting pollutants like oil spills.
Here, we aim to assess the accuracy of recent altimeter missions in the German Bight by comparing altimetry with tide gauges controlled by global navigation satellite systems (GNSS) measurements. In contrast to previous work in the region [22,23,24,25], our study is more comprehensive, as it evaluates six altimeter missions and uses data from 11 high-rate tide gauge stations since 2002. The focus is on the mission biases and the precision of the instantaneous height measurements. CalVal at non-dedicated stations can be hampered by poorly known differences in ocean dynamics between the two sensor locations. Therefore, an empirical model is introduced to align the two data sets. For an assessment of altimetric accuracy on seasonal to decadal time scales in the region, the reader is referred to [26].
The paper is structured as follows: Section 2 provides a description of the used data sets. Since the data are not exactly collocated in space, it must be corrected for systematic effects related to this. An empirical position correction for this purpose is described in Section 3. The precision of the altimetry measurements and regional mission biases are derived in Section 4. Finally, the performance of the non-dedicated tide gauge stations for calibration and monitoring of altimeter data are discussed in Section 5.

2. Data

We compare the ellipsoidal heights from multi-mission altimetry to data from 11 absolutely referenced tide gauge stations located in the German Bight (8 coastal and 3 open water stations). The altimeter heights are interpolated to 11 virtual stations, which are located on exact repeat ground tracks nearby the tide gauge stations. The names of these virtual stations, the corresponding altimeter missions and collocated tide gauge stations are given in Table 1, and the positions are shown in Figure 1. Note that the three virtual stations close to the offshore research platforms FINO1 and FINO3 share the same names. In the following we describe the specifics of the satellite and in-situ data. For our assessment we use standard statistical quantities (RMS of height differences and explained variances) to assess the altimeters’ accuracy.

2.1. Altimetry

Instantaneous sea surface heights are derived from six altimeter missions—Jason-1 (15 January 2002–14 February 2012), Jason-2 (12 July 2008–27 September 2019), Jason-3 (since 18 February 2016), Envisat (18 June 2002–29 March 2012), Saral (since 14 March 2013) and Sentinel-3A (since 5 April 2016)—at 11 virtual stations, which are located close to the tide gauges. The altimeter data originate from the operational geophysical records (GDR) or non-time-critical (NTC) data files, which are homogenized and processed within GFZ’s Altimeter Data System (ADS) [27]. They are based on the standard OCEAN retracker (SAMOSA2 for Sentinel-3A) and the most recent revisions of the data.
For several reasons, altimetry data near the coast are less accurate than in the open ocean. Due to inhomogeneous backscatter conditions near the coasts, part of the signals may be distorted. In addition, many correction models are less accurate near the coast. In general, we adopted correction models suited for coastal regions and preferably available for all analyzed missions. Not all of those are included with the GDRs. In particular, this includes GNSS-based ionospheric corrections [28], wet tropospheric corrections from GPD+ (combined radiometer, ECMWF model and GPS) [29], EOT11a [30] for loading tides and a sea state bias estimated consistently for all missions. An overview of the applied correction models is given in Table 2. Since the data shall be compared to the instantaneous absolutely referenced tide gauge data, they are transposed to the World Geodetic System 1984 (WGS84) ellipsoid in the ITRF2014 mean tide system; accordingly, corrections for ocean tides, pole tides and dynamic atmosphere are not applied.
While most applications rely on 1 Hz sampled altimeter heights, our analyses are based on high-frequency sampled data instead (40 Hz for Saral, 20 Hz for all other missions). Since coastal altimeter data are frequently corrupted by the inclusion of single invalid measurements, an extended outlier detection and elimination improves the accuracy of the data in the region considerably. We use the revised data up to 11 km from the virtual stations to estimate median and spatial root mean square (RMS) values for each overflight. In a second step, for each virtual station and mission, the temporal RMS of the median values is used to detect and eliminate additional outliers in the times series (3σ-criterion).

2.2. Tide Gauges

We use high-frequency tide gauge data of the period 2002 to end of 2019 originating from 11 stations operated by the German Waterway and Shipping Administration (WSV). The gauge positions are shown in Figure 1. Sea surface heights relative to the WGS84 ellipsoid (ITRF2014, conventional tide free) are provided every minute and are absolutely referenced by collocated permanent GNSS measurements originating from the network of The German Federal Institute of Hydrology (BfG) [33]. The data are quality edited (outlier removal and short-term temporal smoothing) by the WSV. Three gauges are located in open water: Helgoland Binnenhafen and the research platforms FINO1 and FINO3. Seven are located at the coast: Borkum Südstrand, Wangerooge Nord, LT Alte Weser, Dwarsgat, Cuxhaven, Zehnerloch, Wittdün and Hörnum, with several of them being located at the landward side of islands or in the Wadden Sea. For most gauges, continuous measurements are available throughout the whole period. However, this is not the case for the FINO platforms. FINO1 data have only been available since March 2013 and have degraded quality for the last two years, and FINO3 data have only been available since June 2015. In addition, we use the FINO data provided by Bundesamt für Seeschifffahrt und Hydrographie (BSH), which are not absolutely referenced and are patchy but span different time periods. These series are called Fino1 (since March 2013) and Fino3 (March 2013–February 2014) in the following sections.
For comparison with the altimetry, the tide gauge data are linearly interpolated to the time of the satellite overpass. Inter- and extrapolation is only performed if there is a measurement available within 2.5 min.

2.3. Models of the Mean Sea Surface

To account for sea surface gradients between to the virtual and tide gauge stations, a precise mean sea surface model is needed. Here we assess the performance of global up to date models: CLS2011, CLS2015 [34,35], DTU2018 and DTU2021 [36,37], and additionally the frequently used European Gravimetric quasigeoid model EGG2008 [38].

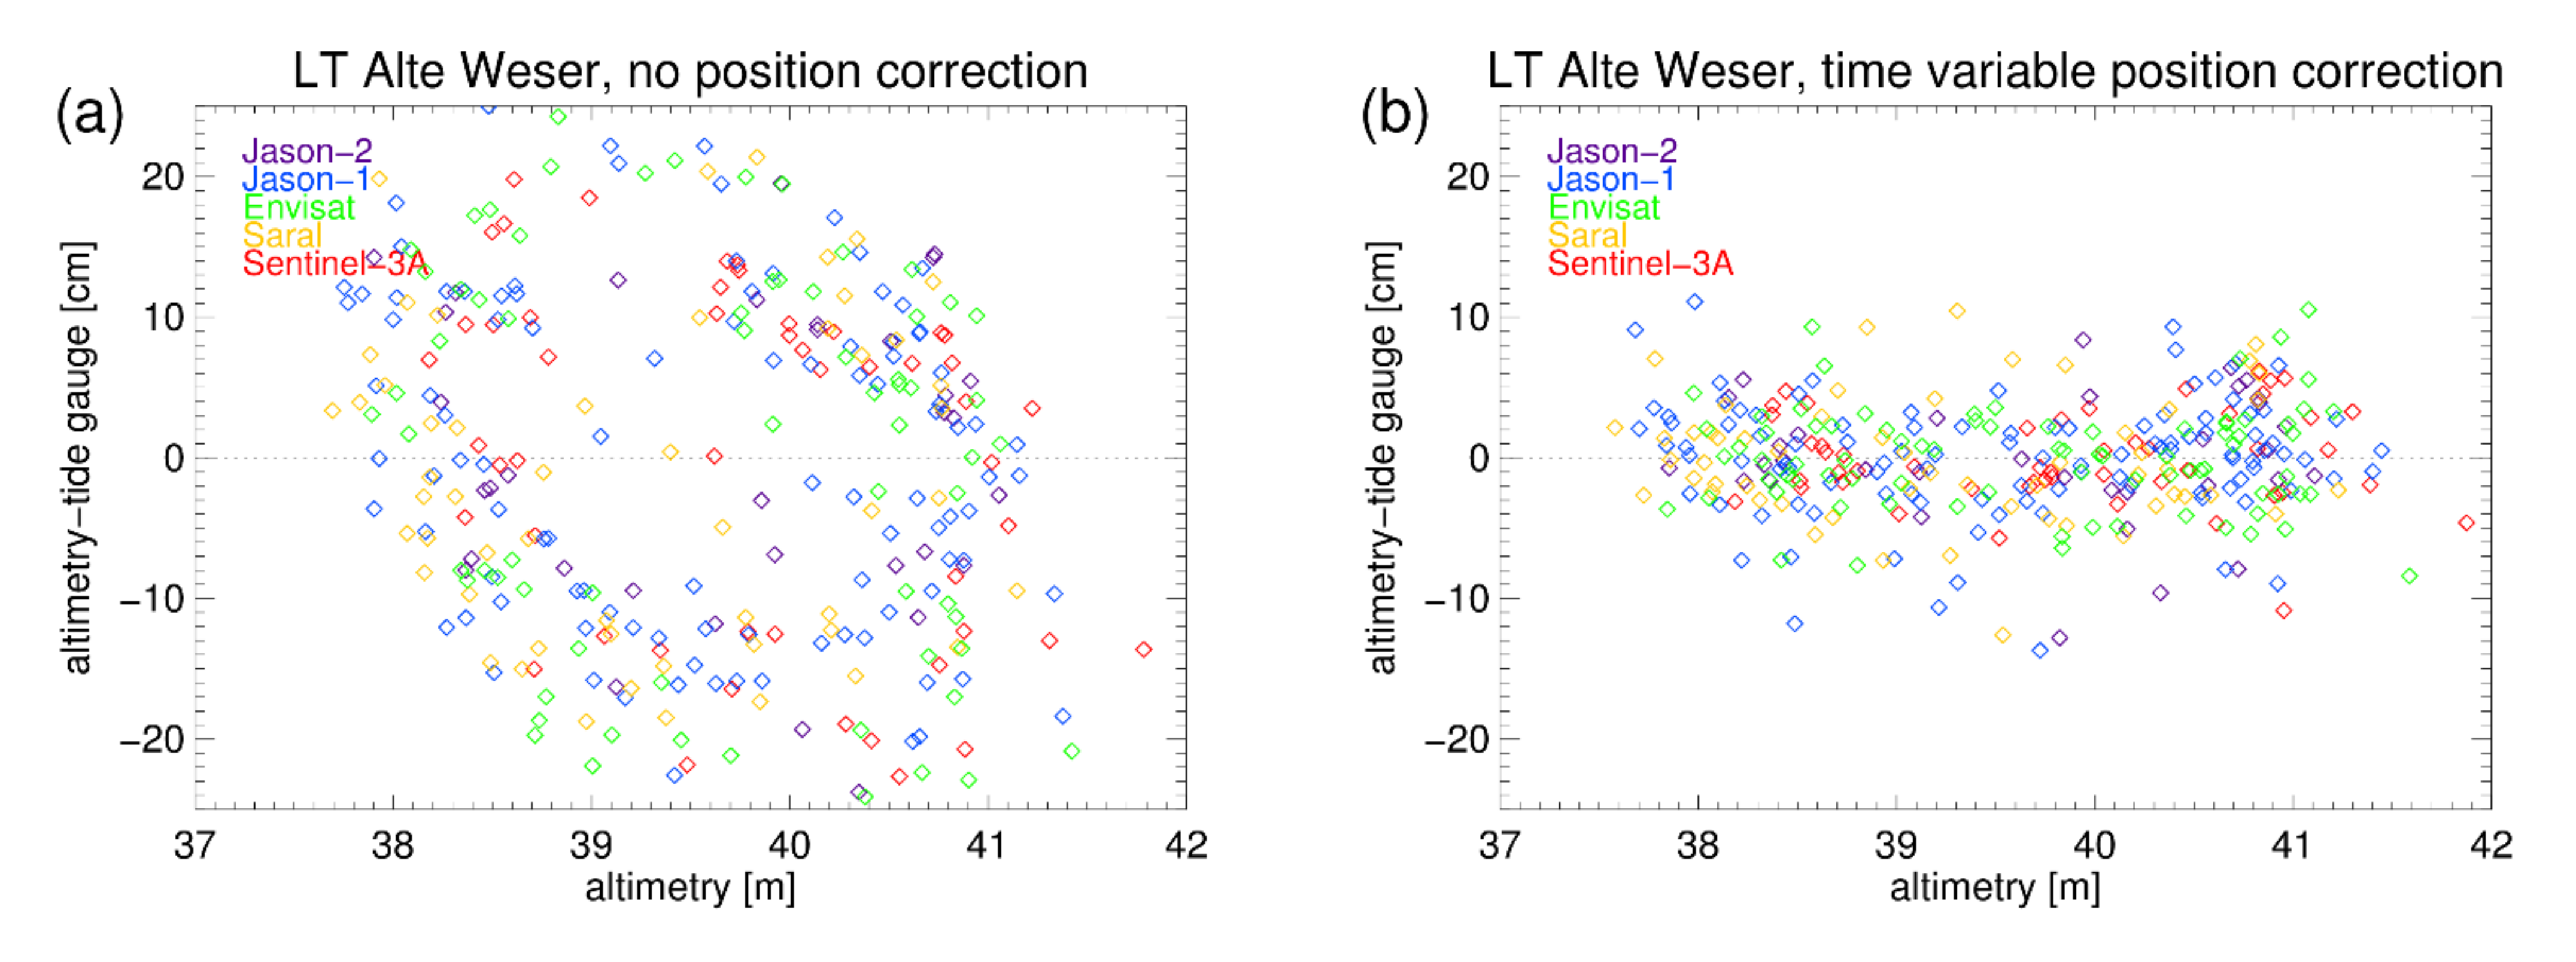
3. Position Corrections

A comprehensive overview about calibration and validation of altimetry is given by [39]. Tide gauges that are not directly located in the altimeters nadir can be used for indirect calibration. The technique and error sources of indirect calibration of altimeter data are discussed by [40,41]. In the German Bight, the instantaneous sea level is dominated by semi-diurnal tides with tidal ranges between 1 and 4 m with substantial contributions from wind-driven surges on synoptic time scales. Here, we present a method to account for systematic differences between the altimeter and tide gauge data, which are related to the distance between both measurements’ locations. Since we are using tide gauge stations that are not dedicated for CalVal, tide gauge and altimetry data are in fact collocated in time but not necessarily in space. This may give rise to systematic mean and time variable differences between the two data sets. Mean differences are related to the differences of the mean sea surface heights (MSSH) between the two measurement locations [42]. The MSSH is composed of the mean geoid and the ocean dynamic topography. However, the geoid is the dominating quantity and may differ by up to 10 cm on spatial scales of 10 km in the region. The sea-level anomaly (SLA), i.e., the time variable component of the SSH, may as well differ between the measurement locations in a systematic way, e.g., due to coastal waves and transient currents. Since these mean and time variable differences are not related to the accuracy of the sensors they should be eliminated before the comparison of the two sea-level data sets if feasible. The observed SSH differences ΔSSHobs (SSHGauge−SSHAlti) between the two locations can be described as follows:
ΔSSHobs = Biasregional + ΔMSSH + ΔSLA + ε
where the mean position correction is ΔMSSH (MSSHGauge−MSSHAlti), the time variable position correction is ΔSLA (SLAGauge−SLAAlti) and the combined measurement error is ε for both sensors. The regional bias includes not only the global component due to the altimeter measurement itself, but also a regional component, which is mainly related to the orbit model (geographically correlated error), but also to other applied correction models. Accordingly, we define the absolute accuracy of the altimeter measurements via the consistency of the regional bias estimates at various stations in the region after correcting for the terms ΔMSSH and ΔSLA. On the contrary, the combined precision of the measurements ε is independent of the temporal mean differences. It can be assessed based on the observed time variable SLA difference between the two sensors corrected for the systematic time variable position correction (ΔSLA).
ΔSLAobs = ΔSLA + ε

3.1. Mean Position Correction (ΔMSSH)

The mean position correction can be estimated from high-resolution geoid, quasigeoid or MSSH models. To assess the accuracy the correction and to select the model that fits best in the region, we derived the mean position corrections for 10 station pairs from five up-to-date models: the quasi geoid model EGG2008, and the MSSH models CLS2011, CLS2015, DTU2018 and DTU2021. Data from the tide gauges Dwarsgat, Cuxhaven and Zehnerloch were not included in the analysis since there are only a few collocated altimeter measurements from a limited number of missions available. At the FINO platforms, only the absolute reference sensors (FINO) are used. The RMS of the mean position corrections for every station pair estimated from these models is shown in Figure 2. The RMS value is between 1 and 5 cm, with higher values near complex coastal structures and for larger distances between both stations (e.g., near the island Sylt).
To find the model most suitable in the region, we calculated the mean regional bias for each mission based on all station pairs. The number of accurate collocated stations depends on the mission and varies between three and eight pairs (cf. Table 4). The standard deviation of these mission biases is shown in Figure 3. The closest agreement for all missions is found for the CLS2011 model. The most recent models CLS2018 and DTU2021 show far less consistent results (not shown). Therefore, we calculated the mean position correction based on the CLS2011 model.

3.2. Time Variable Position Correction (ΔSLA)

Systematic time variable SLA differences between the virtual and tide gauge stations could be corrected based on a combined tide and surge model. Since we did not have model data with the sufficient spatial and temporal resolution available, we chose to develop an empirical correction. The time variable SLA differences in the German Bight on scales of up to 15 km are mainly related to phase and amplitude differences of the dominant M2 tidal wave. Figure 4 is a sketch highlighting the systematic changes in the difference between the tide gauge and altimeter in case of a 5 min shift and an amplitude difference of 5% for a M2 tidal wave with a 1 m amplitude. The small differences in our example give rise to extra RMS differences of 4 cm that are not related to measurement precision. They fluctuate in correspondence with the M2 wave, which cannot be adequately sampled by the altimeter giving rise to aliasing. There is a clear dependence of the differences from the absolute sea level. Here we describe and apply an empirical method to estimate time shifts for the tide gauge and scaling factors for the SLA series for every station pair making use of this relation.
We shift the gauge series every minute relative to the altimeter series and calculate a regression to estimate a mean bias and scaling factor for each station and altimeter mission separately. The criterion for the optimal time shift and scaling is the minimum value of the RMS differences. Choosing maximum correlation coefficients as criterion instead leads to almost the same results. This method efficiently reduces the systematic differences between the two data sets (e.g., for station LT Alte Weser, Figure 5). It works well for signals propagating as Kelvin waves counterclockwise along the coast and should not only capture signals from the dominating M2 tide, but also from the other diurnal and semi-diurnal components.
Note that a minimum of 15–20 measurement pairs is necessary for a reliable estimation of the parameters. Applying the time variable position correction implies that sea-level anomalies related to surges or longer period processes are scaled as well and might be distorted.

4. Results

In this section the precision of the altimeter measurements and regional mission biases are assessed with respect to the tide gauge data.

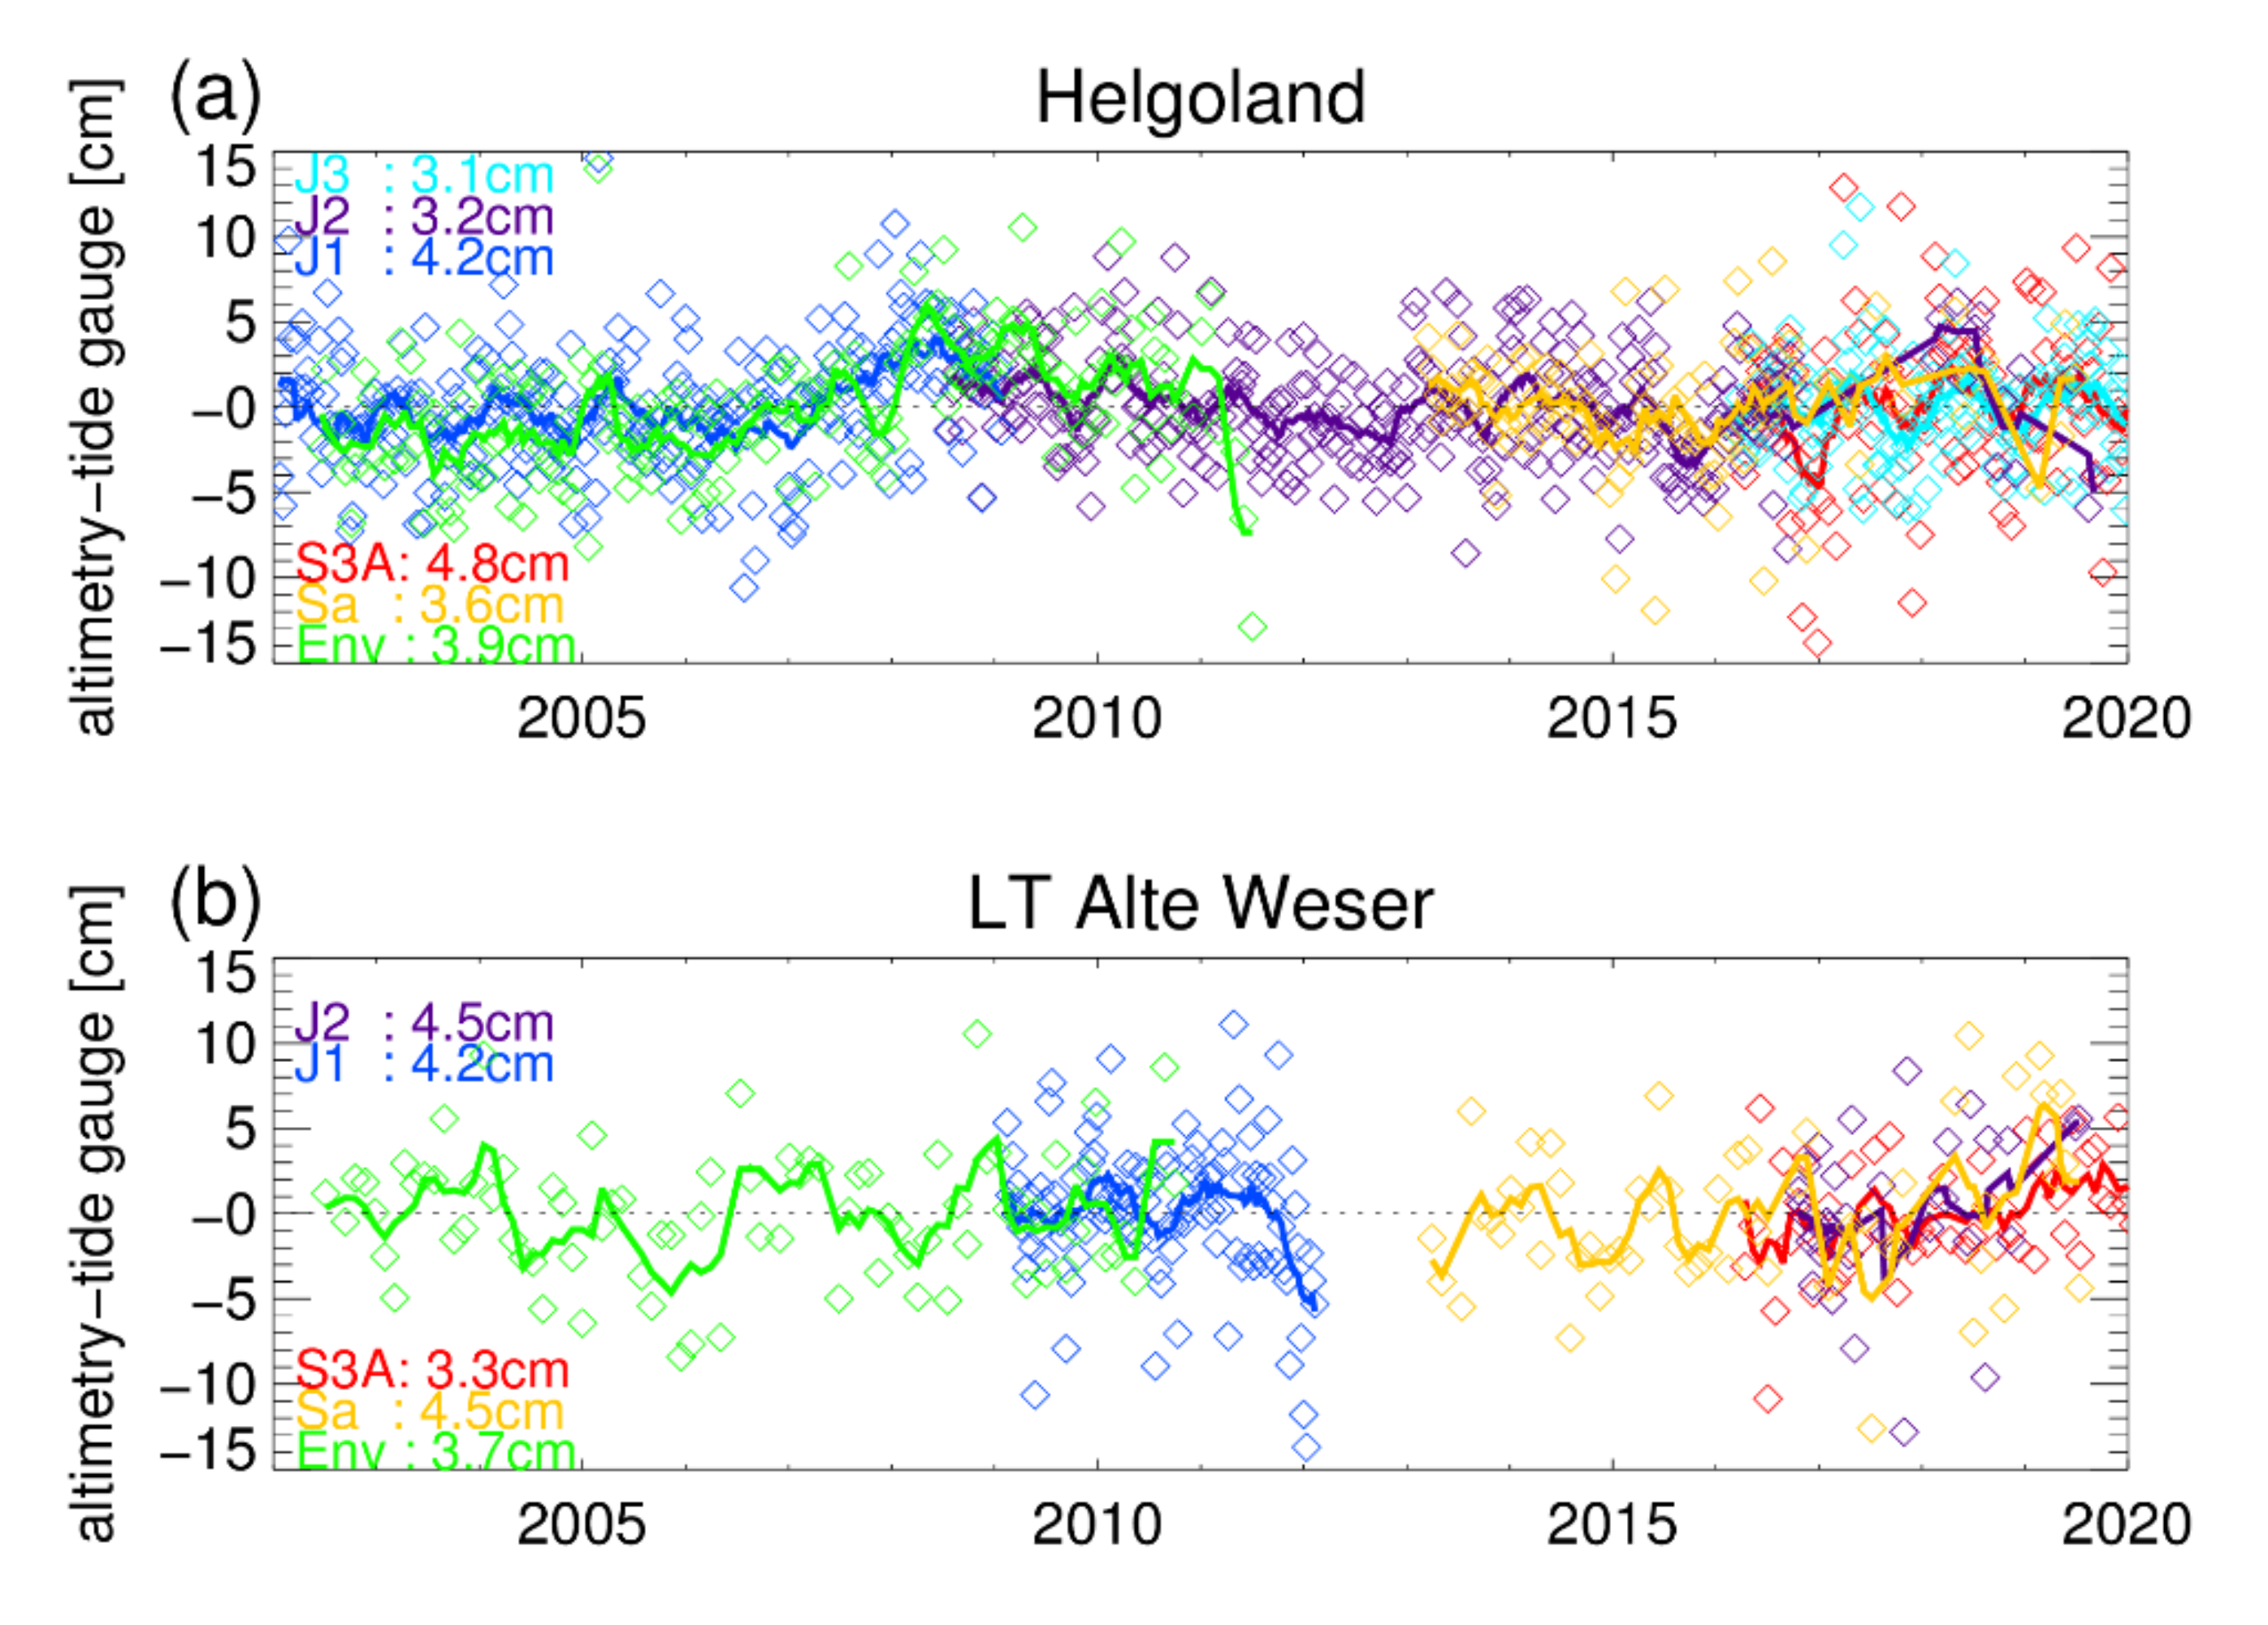
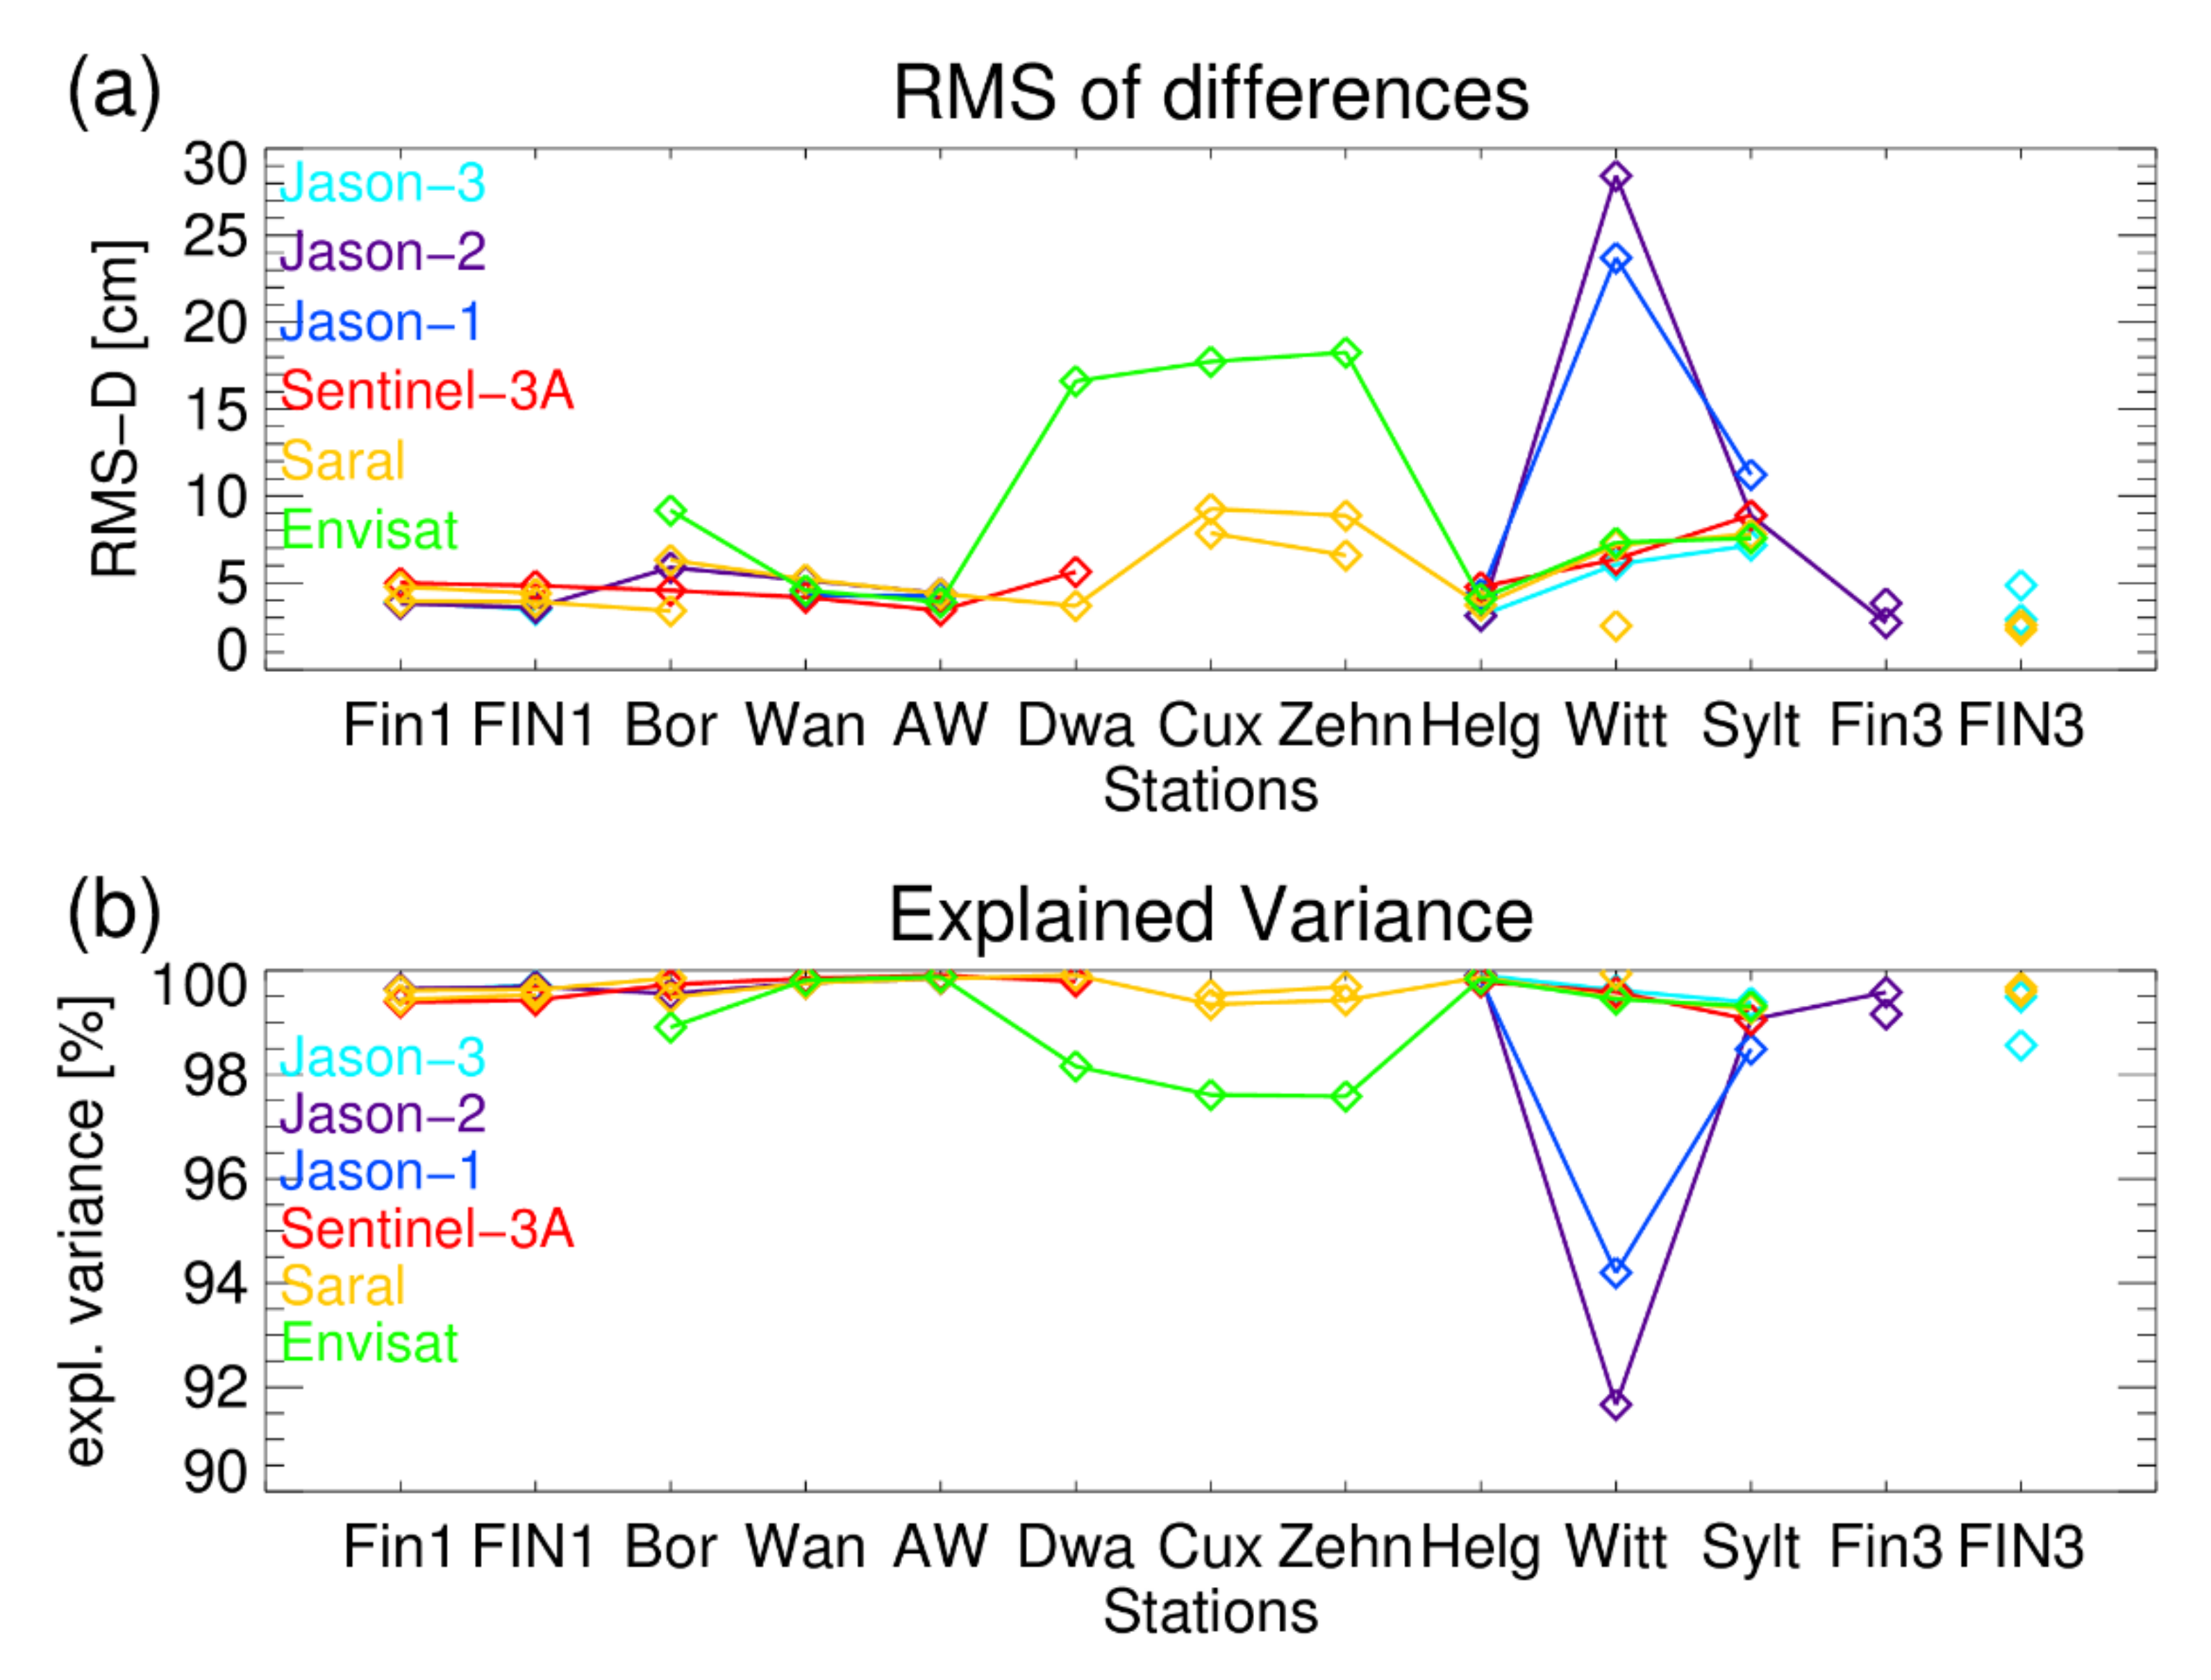
4.1. Relative Precision

The analysis is based on the collocated tide gauge and altimetry sea-level anomaly series for each station. We calculated the amount of variance of the tide gauge series explained by the altimetry series as well as the RMS of the difference series (RMS-D). The time variable position correction was applied, and depending on the station pair, it decreases the RMS-D by 15–75%. Figure 6 shows the remaining difference series for two stations in the open water (Helgoland) and close to the coast (LT Alte Weser). There is a high agreement between the two data sets, and the RMS-D for Helgoland and LT Alte Weser is less than 5 cm for all missions.
Apart from the short-term variability that we are mainly interested in, there seem to be seasonal and interannual signals in the difference series. These signals could originate from aliasing of the remaining high-frequency ocean dynamics (tides and surges). However, possible sources also exist at this frequency spectrum. These include changes in the ocean dynamics on the relevant spatial scales as well as vertical land movements at the tide gauge (e.g., due to atmospheric loading or contemporary ice mass loss). Even though the tide gauges are absolutely referenced by GNSS, they are not corrected for seasonal or drift signals.
The explained variance and RMS-D counterclockwise along the coast for all missions is shown in Figure 7. The explained variance is more than 90% everywhere, and at most stations it is even more than 98%. The RMS-D is less than 5 cm almost everywhere, and even at Dwarsgat (mouth of river Weser) the RMS-D is still less than 10 cm for the recent missions. The best agreement between tide gauge and altimetry is found at the open water stations Fino1, FINO3 and Helgoland and for the Sentinel-3A and Envisat missions at the coastal station LT Alte Weser. For most coastal stations and for older missions (Envisat, Jason-1), the agreement is diminished. At the virtual stations Zehnerloch, Dwarsgat and Wittdün, the data are frequently missing and exhibits excessive internal RMS of the high-frequency data. This suggests problems to retrack the height at these locations reliably, especially for the older missions. At Dwarsgat there are no valid data for low water, and at Wittdün data are missing, especially during winter for high sea states. The first tests suggest that the data outcome and the RMS-D can be improved by using different (ICE1, SEAICE) retrackers (not shown). At the virtual stations SYLT, Wittdün and BORKUM, the time variable position correction has high values, indicating that the tidal dynamics differ considerably between tide gauge and the virtual station. In fact, the corresponding tide gauge stations are located on the landward side of islands and are therefore less suitable for the validation of altimetry.
To estimate the precision for each mission, we picked the stations with the lowest RMS-D, assuming that the precision is constant over the area more than 8 km away from the coast. The corresponding numbers for the best fitting stations for each mission are listed in Table 3. The best fitting stations are often stations where the tide gauge and virtual station are very close to each other. The minimal RMS-D is between 2.7 and 4.2 cm with lower values for more recent missions. The RMS-D incorporates errors of tide gauge and altimetry as well as uncorrected position errors. Focusing on stations with excellent agreement and assigning a precision of 2.0 (1.5) cm to the tide gauge measurements, we can estimate an upper bound for the precision of the altimetry measurements in the German Bight. Based on the RMS-D values given in Table 3, our precision estimates range between better than 3.7 (3.9) cm for Jason-1 and better than 1.8 (2.2) cm for Jason-3.

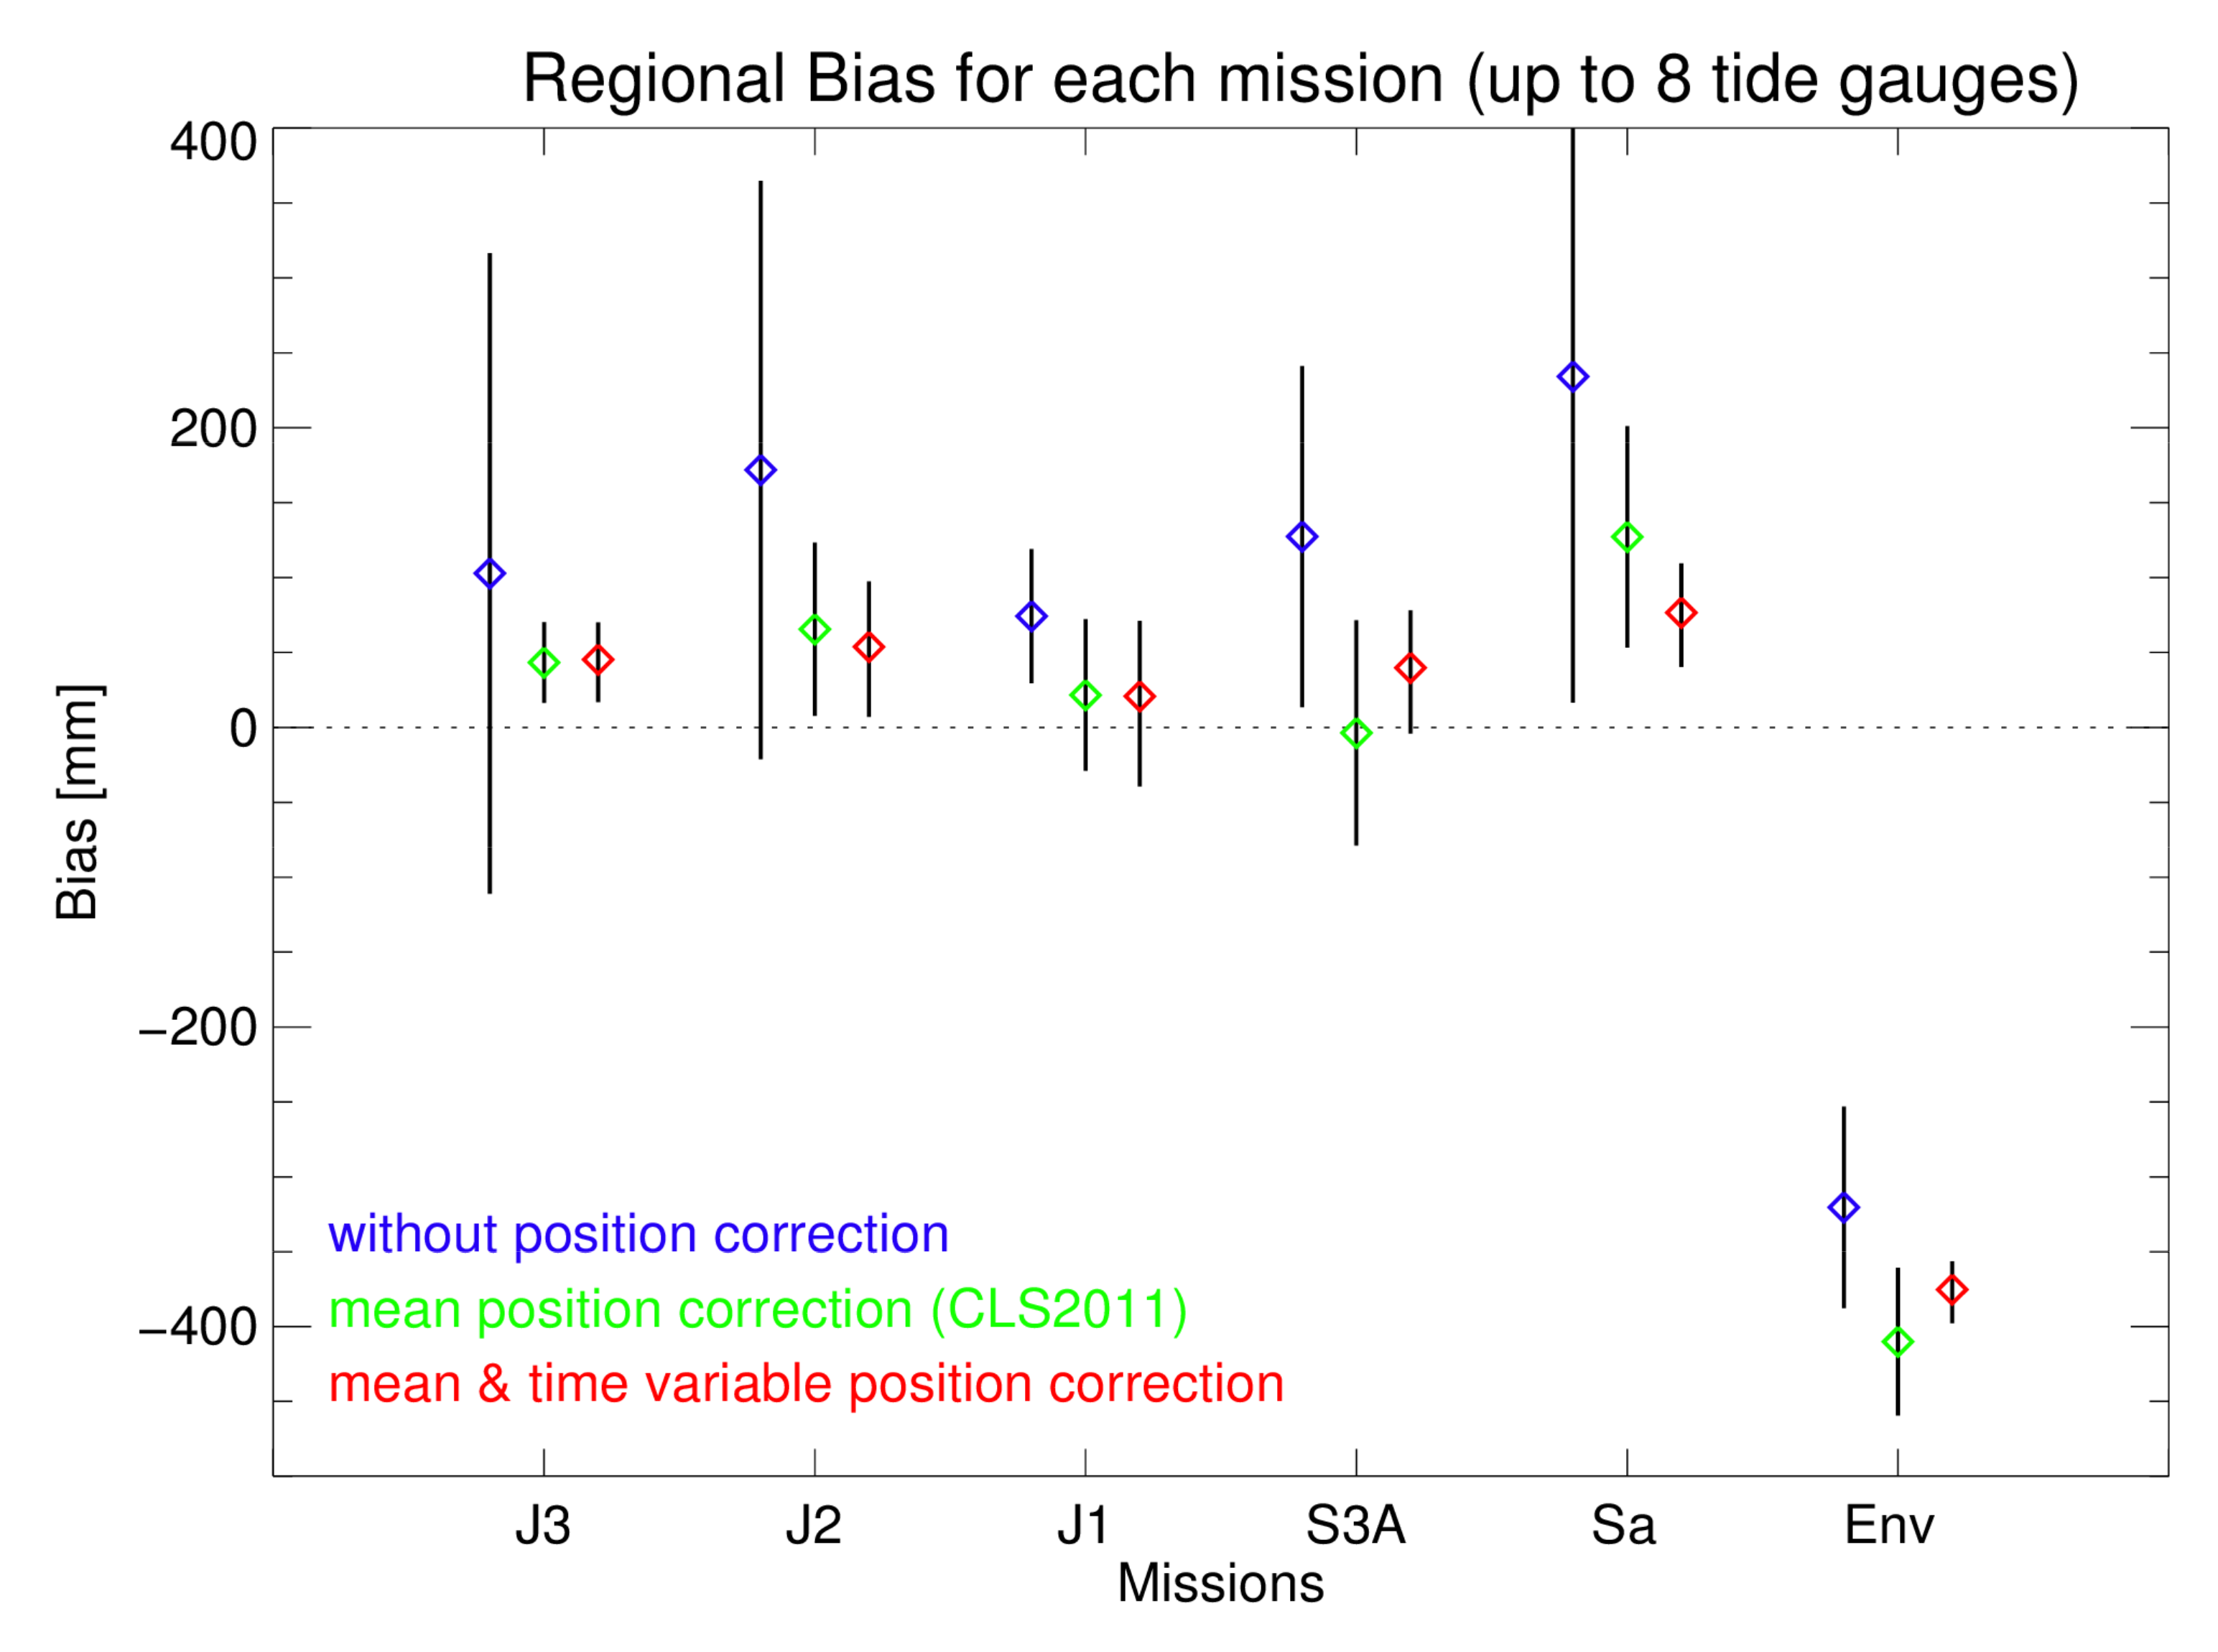
4.2. Regional Mission Biases

Every altimeter mission is subject to global mean bias, which is related to internal sensor delays. In addition, there are regional biases that are dominated by geographically correlated orbit errors with possible contributions from regional biases of correction models. Here, the regional mission biases are estimated relative to the absolute referenced tide gauge stations. The accuracy of the regional mission biases corresponds to the variance of the biases estimated at different stations. We omitted three station pairs with minor agreement of the time variable component (Zehnerloch/Cuxhaven, Dwarsgat) from the analysis. Depending on the mission, there were still three to eight collocated tide gauges available. Figure 8 shows the resulting regional mission biases derived with and without position corrections. Both position corrections influence the bias values and diminish the uncertainty considerably from 10–20 cm to 1.3–3.4 cm. The regional biases and the corresponding error margins are given in Table 4.

5. Discussion

We estimated the absolute regional biases and altimetric measurement precision in the German Bight for six altimeter missions based on collocated tide gauge stations. The precision of the altimeter measurements was estimated from the RMS-D relative to 11 tide gauge stations. In addition to sensor errors, the RMS-D depends on the distance between two sensor locations and on the scales of the local sea-level dynamics. The RMS-D can be considerably diminished (up to 75%) by applying the time variable position correction. The RMS-D values range between 2.7 and 4.2 cm at the best fitting stations; the values are given for each mission separately in Table 3. These values are comparable with the results at Corsica [15], where RMS-D values between 3.0 and 3.3 cm are observed. The results for Sentinel-3A at Helgoland are considerably improved relative to the study by [23] (4.8 cm vs. 6.5 cm) and much better than the mean values for the northwestern European shelfs from [21]. From our analyses, we estimated the altimeters’ precision to be at least 1.8 to 3.7 cm depending on the mission. The precision should further improve when using updated coastally adjusted retrackers like SAMOSA+ and ALES+ [24,25,26].
Regional mission biases were derived relative to eight GNSS-referenced tide gauge stations with good agreement between altimetry and gauge data (Table 4). The biases range between −39 cm and 4.4 cm. The absolute numbers differ by several cm from the values derived at dedicated CalVal stations. However, apart from orbit-related geographically correlated errors, the biases are to some extend dependent on the chosen retracker and correction models (especially sea state bias). The bias estimated at Helgoland for Sentinel-3A by [23] agrees within a few mm with our estimation. Having applied the mean and time variable position corrections, the accuracy of the regional mission biases is between 1.3 and 3.4 cm. This is in the same order of magnitude as the less than 2 cm reported by [43] but considerably more than the 0.5 cm reached at Corsica [15]. The analysis shows that the accuracy is very sensitive to the MSSH model used for the mean position corrections. The best results are obtained with the CLS2011 model, followed closely by the DTU2018 model. The most recent models CLS2015 and DTU2021 are far less suited for this application. Hence, the accuracy of the biases could be further increased by either eliminating problematic stations more stringent from the analysis and by enhanced MSSH models.
The presented empirical time variable position correction is a powerful tool to adjust for differences in the ocean dynamic between altimeter and tide gauge measurements. It facilitates the monitoring of satellite altimeter stability, the estimation of biases and of measurement precision in regions where the tides are not adequately known on small spatial scales. The method could be easily applied in similar coastal regions where the sea level is dominated by tides. Hence, the study shows that altimetry in the German Bight is sufficiently accurate to deliver valuable information for regional applications of local authorities. The operational tide gauges operated by the German Waterway and Shipping Administration (WSV) could complement the results obtained at dedicated CalVal stations.

Author Contributions

Conceptualization, S.E., T.S., R.W. and T.A.; methodology, S.E., T.S. and X.H.; software, T.S., S.E. and R.W.; formal analysis, S.E. and J.I.; data curation, J.I., T.S. and R.W.; writing—original draft preparation, S.E., T.S.; writing—review and editing, S.E., T.S., R.W. and T.A.; visualization, S.E.; funding acquisition, R.W. and T.A. All authors have read and agreed to the published version of the manuscript.

Funding

This Research was funded by The German Federal Institute of Hydrology (BfG) as part of the study‚ Vorstudie zur operationellen Nutzbarkeit von Satellitenaltimetrie im Geschäftsbereich des BMVI.

Institutional Review Board Statement

Not applicable.

Informed Consent Statement

Not applicable.

Data Availability Statement

Tide gauge data are available upon request via BfG ([email protected]) and after registration from BSH http://fino.bsh.de/ (accessed on 3 January 2022); GNSS data are available upon request from BfG ([email protected]); satellite altimeter data are available after registration from: https://aviso-data-center.cnes.fr/ (accessed on 3 January 2022) and https://navigator.eumetsat.int/ (accessed on 3 January 2022) and upon request from ESA ([email protected]).

Acknowledgments

We thank the German Waterway and Shipping Administration (WSV), Bundesamt für Seeschifffahrt und Hydrographie (BSH), the Initiative FINO and BfG for providing quality edited sea level from their tide gauge stations and The German Federal Institute of Hydrology (BfG) for providing levelling data from their GNSS network.

Conflicts of Interest

The authors declare no conflict of interest.

References

  1. Strauss, B.H.; Kulp, S.A.; Rasmussen, D.J.; Levermann, A. Unprecedented Threats to Cities from Multi-Century Sea Level Rise. Environ. Res. Lett. 2021, 16, 114015. [Google Scholar] [CrossRef]
  2. Benveniste, J.; Cazenave, A.; Vignudelli, S.; Fenoglio-Marc, L.; Shah, R.; Almar, R.; Andersen, O.; Birol, F.; Bonnefond, P.; Bouffard, J.; et al. Requirements for a Coastal Hazards Observing System. Front. Mar. Sci. 2019, 6, 348. [Google Scholar] [CrossRef] [Green Version]
  3. Aarup, T.; Wöppelmann, G.; Woodworth, P.L.; Hernandez, F.; Vanhoorne, B.; Schöne, T.; Thompson, P.R. Comments on the Article “Uncertainty and Bias in Electronic Tide-Gauge Records: Evidence from Collocated Sensors” by Stella Pytharouli, Spyros Chaikalis, Stathis C. Stiros in Measurement (Volume 125, September 2018). Measurement 2019, 135, 613–616. [Google Scholar] [CrossRef] [Green Version]
  4. Illigner, J.; Sofian, I.; Abidin, H.Z.; Syafi’i, M.A.; Schöne, T. Coastal Sea Level Monitoring in Indonesia: Connecting the Tide Gauge Zero to Leveling Benchmarks. In Proceedings of the IAG 150 Years; Rizos, C., Willis, P., Eds.; Springer International Publishing: Cham, Switzerland, 2016; pp. 451–457. [Google Scholar] [CrossRef]
  5. Ponte, R.M.; Carson, M.; Cirano, M.; Domingues, C.M.; Jevrejeva, S.; Marcos, M.; Mitchum, G.; van de Wal, R.S.W.; Woodworth, P.L.; Ablain, M.; et al. Towards Comprehensive Observing and Modeling Systems for Monitoring and Predicting Regional to Coastal Sea Level. Front. Mar. Sci. 2019, 6, 437. [Google Scholar] [CrossRef]
  6. Douglas, B.C. Global Sea Rise: A Redetermination. Surv. Geophys. 1997, 18, 279–292. [Google Scholar] [CrossRef]
  7. Church, J.A.; White, N.J. Sea-Level Rise from the Late 19th to the Early 21st Century. Surv. Geophys. 2011, 32, 585–602. [Google Scholar] [CrossRef] [Green Version]
  8. Zoysa, R.S.; Schöne, T.; Herbeck, J.; Illigner, J.; Haghighi, M.; Simarmata, H.; Porio, E.; Rovere, A.; Hornidge, A.-K. The ‘Wickedness’ of Governing Land Subsidence: Policy Perspectives from Urban Southeast Asia. PLoS ONE 2021, 16, e0250208. [Google Scholar] [CrossRef]
  9. Cipollini, P.; Calafat, F.M.; Jevrejeva, S.; Melet, A.; Prandi, P. Monitoring Sea Level in the Coastal Zone with Satellite Altimetry and Tide Gauges. Surv. Geophys. 2017, 38, 33–57. [Google Scholar] [CrossRef] [PubMed] [Green Version]
  10. Watson, C.S.; White, N.J.; Church, J.A.; King, M.A.; Burgette, R.J.; Legresy, B. Unabated Global Mean Sea-Level Rise over the Satellite Altimeter Era. Nat. Clim. Change 2015, 5, 565–568. [Google Scholar] [CrossRef]
  11. Prandi, P.; Meyssignac, B.; Ablain, M.; Spada, G.; Ribes, A.; Benveniste, J. Local Sea Level Trends, Accelerations and Uncertainties over 1993–2019. Sci. Data 2021, 8, 1. [Google Scholar] [CrossRef] [PubMed]
  12. Fenoglio-Marc, L.; Schöne, T.; Illigner, J.; Becker, M.; Manurung, P. Khafid Sea Level Change and Vertical Motion from Satellite Altimetry, Tide Gauges and GPS in the Indonesian Region. Mar. Geod. 2012, 35, 137–150. [Google Scholar] [CrossRef]
  13. Rudenko, S.; Neumayer, K.H.; Dettmering, D.; Esselborn, S.; Schöne, T.; Raimondo, J.C. Improvements in Precise Orbits of Altimetry Satellites and Their Impact on Mean Sea Level Monitoring. IEEE Trans. Geosci. Remote Sens. 2017, 55, 3382–3395. [Google Scholar] [CrossRef] [Green Version]
  14. Esselborn, S.; Rudenko, S.; Schöne, T. Orbit-Related Sea Level Errors for TOPEX Altimetry at Seasonal to Decadal Timescales. Ocean Sci. 2018, 14, 205–223. [Google Scholar] [CrossRef] [Green Version]
  15. Bonnefond, P.; Exertier, P.; Laurain, O.; Guinle, T.; Féménias, P. Corsica: A 20-Yr Multi-Mission Absolute Altimeter Calibration Site. Adv. Space Res. 2019, 68, 1171–1186. [Google Scholar] [CrossRef]
  16. Haines, B.; Desai, S.D.; Kubitschek, D.; Leben, R.R. A Brief History of the Harvest Experiment: 1989–2019. Adv. Space Res. 2020, 68, 1161–1170. [Google Scholar] [CrossRef]
  17. Mertikas, S.P.; Donlon, C.; Féménias, P.; Mavrocordatos, C.; Galanakis, D.; Tripolitsiotis, A.; Frantzis, X.; Tziavos, I.N.; Vergos, G.; Guinle, T. Fifteen Years of Cal/Val Service to Reference Altimetry Missions: Calibration of Satellite Altimetry at the Permanent Facilities in Gavdos and Crete, Greece. Remote Sens. 2018, 10, 1557. [Google Scholar] [CrossRef] [Green Version]
  18. Watson, C.; White, N.; Church, J.; Burgette, R.; Tregoning, P.; Coleman, R. Absolute Calibration in Bass Strait, Australia: TOPEX, Jason-1 and OSTM/Jason-2. Mar. Geod. 2011, 34, 242–260. [Google Scholar] [CrossRef]
  19. Mitchum, G.T. An Improved Calibration of Satellite Altimetric Heights Using Tide Gauge Sea Levels with Adjustment for Land Motion. Mar. Geod. 2000, 23, 145–166. [Google Scholar] [CrossRef]
  20. Valladeau, G.; Legeais, J.F.; Ablain, M.; Guinehut, S.; Picot, N. Comparing Altimetry with Tide Gauges and Argo Profiling Floats for Data Quality Assessment and Mean Sea Level Studies. Mar. Geod. 2012, 35, 42–60. [Google Scholar] [CrossRef]
  21. Sánchez-Román, A.; Pascual, A.; Pujol, M.-I.; Taburet, G.; Marcos, M.; Faugère, Y. Assessment of DUACS Sentinel-3A Altimetry Data in the Coastal Band of the European Seas: Comparison with Tide Gauge Measurements. Remote Sens. 2020, 12, 3970. [Google Scholar] [CrossRef]
  22. Fenoglio, L.; Dinardo, S.; Uebbing, B.; Buchhaupt, C.; Gärtner, M.; Staneva, J.; Becker, M.; Klos, A.; Kusche, J. Advances in NE-Atlantic Coastal Sea Level Change Monitoring by Delay Doppler Altimetry. Adv. Space Res. 2020, 68, 571–592. [Google Scholar] [CrossRef]
  23. Fenoglio, L.; Dinardo, S.; Buchhaupt, C.; Uebbing, B.; Scharroo, R.; Kusche, J.; Becker, M.; Benveniste, J. Calibrating CryoSat-2 and Sentinel-3A Sea Surface Heights Along the German Coast. In Proceedings of the Fiducial Reference Measurements for Altimetry; Mertikas, S.P., Pail, R., Eds.; Springer International Publishing: Cham, Switzerland, 2020; pp. 15–22. [Google Scholar] [CrossRef]
  24. Passaro, M.; Dinardo, S.; Quartly, G.D.; Snaith, H.M.; Benveniste, J.; Cipollini, P.; Lucas, B. Cross-Calibrating ALES Envisat and CryoSat-2 Delay–Doppler: A Coastal Altimetry Study in the Indonesian Seas. Adv. Space Res. 2016, 8, 289–303. [Google Scholar] [CrossRef] [Green Version]
  25. Dinardo, S.; Fenoglio-Marc, L.; Becker, M.; Scharroo, R.; Fernandes, M.J.; Staneva, J.; Grayek, S.; Benveniste, J. A RIP-Based SAR Retracker and Its Application in North East Atlantic with Sentinel-3. Adv. Space Res. 2021, 68, 892–929. [Google Scholar] [CrossRef]
  26. Dettmering, D.; Müller, F.L.; Oelsmann, J.; Passaro, M.; Schwatke, C.; Restano, M.; Benveniste, J.; Seitz, F. NorthSEAL: A New Dataset of Sea Level Changes in the North Sea from Satellite Altimetry. Earth Syst. Sci. Data Discuss. 2021, 13, 1–28. [Google Scholar] [CrossRef]
  27. Schöne, T.; Esselborn, S.; Rudenko, S.; Raimondo, J.-C. Radar Altimetry Derived Sea Level Anomalies–The Benefit of New Orbits and Harmonization. In System Earth via Geodetic-Geophysical Space Techniques; Flechtner, F.M., Gruber, T., Güntner, A., Mandea, M., Rothacher, M., Schöne, T., Wickert, J., Eds.; Springer: Berlin/Heidelberg, Germany, 2010; pp. 317–324. ISBN 978-3-642-10227-1. [Google Scholar]
  28. Dach, R.; Schaer, S.; Arnold, D.; Kalarus, M.S.; Prange, L.; Stebler, P.; Villiger, A.; Jäggi, A. CODE Final Product Series for the IGS. IGS Datensatz Astron. Inst. Univ. Bern. 2020. Available online: https://www.aiub.unibe.ch/download/CODE (accessed on 3 January 2022).
  29. Lázaro, C.; Fernandes, M.J.; Vieira, T.; Vieira, E. A Coastally Improved Global Dataset of Wet Tropospheric Corrections for Satellite Altimetry. Earth Syst. Sci. Data Discuss. 2019, 12, 1–31. [Google Scholar] [CrossRef]
  30. Savcenko, R.; Bosch, W.; Dettmering, D.; Seitz, F. EOT11a-Global Empirical Ocean Tide Model from Multi-Mission Satellite Altimetry, with Links to Model Results. DGFI Rep. 2012, 89, 49. Available online: https://epic.awi.de/id/eprint/36001/1/DGFI_Report_89.pdf (accessed on 3 January 2022).
  31. Rudenko, S.; Schöne, T.; Neumayer, K.-H.; Esselborn, S.; Raimondo, J.-C.; Dettmering, D. GFZ VER11 SLCCI Precise Orbits of Altimetry Satellites ERS-1, ERS-2, Envisat, TOPEX/Poseidon, Jason-1 and Jason-2 in the ITRF2008. GFZ Data Serv. 2016. [Google Scholar] [CrossRef]
  32. McCarthy, D.D. IERS Conventions (1996). IERS Tech. Note 1996, 21, 1–95. Available online: https://www.iers.org/TN21 (accessed on 3 January 2022).
  33. Esch, C.; Artz, T.; Sudau, A. The BfG-GNSS Monitoring Network–Delivering a Continuous Georeferencing Service for Waterway Management Tasks. In Proceedings of the FIG e-Working Week 2021, Virtually in The Netherlands. 20–25 June 2021; p. 14. Available online: https://fig.net/resources/proceedings/fig_proceedings/fig2021/papers/ts05.4/TS05.4_esch_11010.pdf (accessed on 3 January 2022).
  34. Schaeffer, P.; Faugére, Y.; Legeais, J.F.; Ollivier, A.; Guinle, T.; Picot, N. The CNES_CLS11 Global Mean Sea Surface Computed from 16 Years of Satellite Altimeter Data. Mar. Geod. 2012, 35, 3–19. [Google Scholar] [CrossRef]
  35. Pujol, M.-I.; Schaeffer, P.; Faugère, Y.; Raynal, M.; Dibarboure, G.; Picot, N. Gauging the Improvement of Recent Mean Sea Surface Models: A New Approach for Identifying and Quantifying Their Errors. J. Geophys. Res. Oceans 2018, 123, 5889–5911. [Google Scholar] [CrossRef]
  36. Andersen, O.; Knudsen, P.; Stenseng, L. The DTU13 MSS (Mean Sea Surface) and MDT (Mean Dynamic Topography) from 20 Years of Satellite Altimetry. In Proceedings of the IGFS 2014; Jin, S., Barzaghi, R., Eds.; Springer International Publishing: Cham, Switzerland, 2016; pp. 111–121. ISBN 978-3-319-39819-8. [Google Scholar] [CrossRef]
  37. Andersen, O.; Knudsen, P.; Stenseng, L. A New DTU18 MSS Mean Sea Surface–Improvement from SAR Altimetry. In Proceedings of the 25 Years of Progress in Radar Altimetry Symposium, Ponta Delgada, Azores, Portugal, 24–29 September 2018; p. 172. Available online: https://orbit.dtu.dk/en/publications/a-new-dtu18-mss-mean-sea-surface-improvement-from-sar-altimetry (accessed on 3 January 2022).
  38. Denker, H. The European Gravimetric Quasigeoid EGG2008. AGU Spring Meet. Abstr. 2009, 73, CG73A-03. Available online: http://adsabs.harvard.edu/abs/2009AGUSMCG73A.03D (accessed on 3 January 2022).
  39. Quartly, G.D.; Chen, G.; Nencioli, F.; Morrow, R.; Picot, N. An Overview of Requirements, Procedures and Current Advances in the Calibration/Validation of Radar Altimeters. Remote Sens. 2021, 13, 125. [Google Scholar] [CrossRef]
  40. Bonnefond, P.; Haines, B.J.; Watson, C. In situ Absolute Calibration and Validation: A Link from Coastal to Open-Ocean Altimetry. In Coastal Altimetry; Vignudelli, S., Kostianoy, A.G., Cipollini, P., Benveniste, J., Eds.; Springer: Berlin/Heidelberg, Germany, 2011; pp. 259–296. ISBN 978-3-642-12796-0. [Google Scholar] [CrossRef]
  41. Mertikas, S.P.; Donlon, C.; Cullen, R.; Tripolitsiotis, A. Scientific and Operational Roadmap for Fiducial Reference Measurements in Satellite Altimetry Calibration & Validation. In Proceedings of the Fiducial Reference Measurements for Altimetry; Mertikas, S.P., Pail, R., Eds.; Springer International Publishing: Cham, Switzerland, 2020; pp. 105–109. [Google Scholar] [CrossRef]
  42. Dong, X.; Woodworth, P.; Moore, P.; Bingley, R. Absolute Calibration of the TOPEX/POSEIDON Altimeters Using UK Tide Gauges, GPS, and Precise, Local Geoid-Differences. Mar. Geod. 2002, 25, 189–204. [Google Scholar] [CrossRef]
  43. Mertikas, S.P.; Donlon, C.; Femenias, P.; Mavrocordatos, C.; Galanakis, D.; Guinle, T.; Boy, F.; Tripolitsiotis, A.; Frantzis, X.; Tziavos, I.N.; et al. Absolute Calibration of Sentinel-3A and Jason-3 Altimeters with Sea-Surface and Transponder Techniques in West Crete, Greece. In Proceedings of the Fiducial Reference Measurements for Altimetry; Mertikas, S.P., Pail, R., Eds.; Springer International Publishing: Cham, Switzerland, 2020; pp. 41–47. [Google Scholar] [CrossRef]
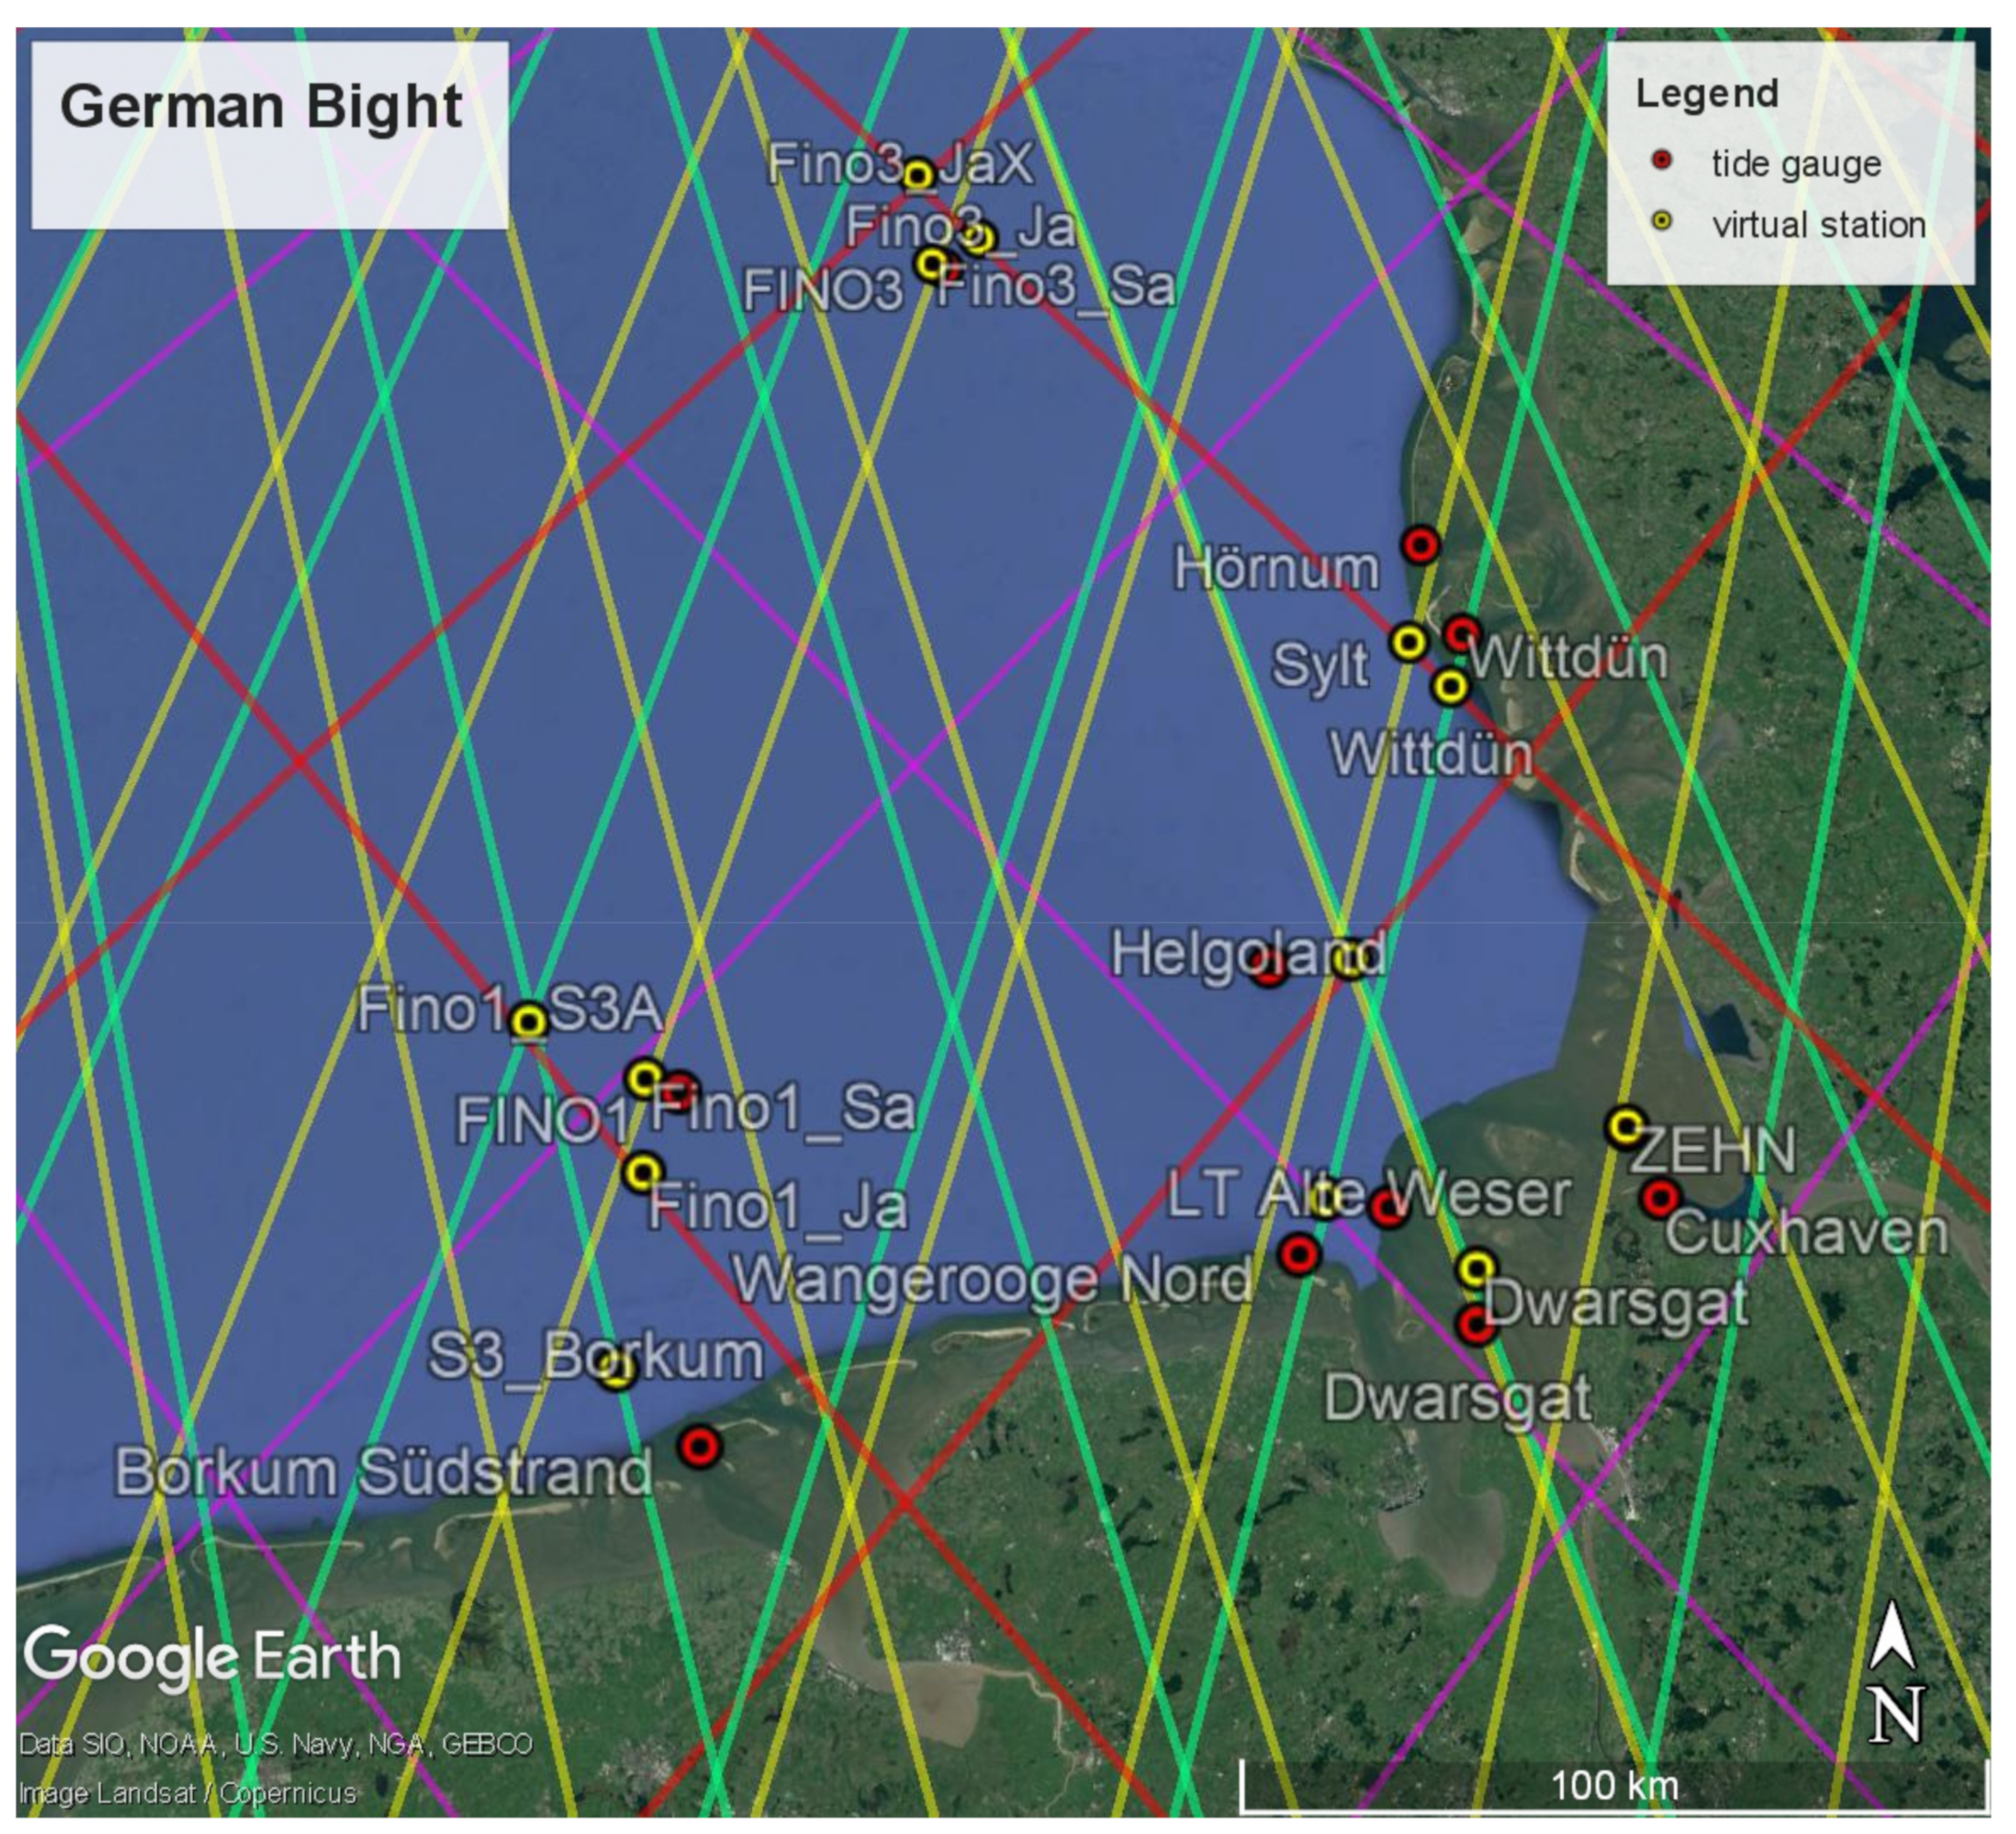
Figure 1. Positions of virtual altimetry (yellow), tide gauge (red) stations and ground tracks during exact repeat periods for Jason in standard (red) and interleaved phases (purple), Envisat/Saral (yellow) and Sentinel-3A (green).
Remotesensing 14 00236 g001
Figure 2. RMS of mean position corrections derived from one quasigeoid and four MSSH models for the virtual/tide gauge station pairs at FINO1 (F1), Borkum Südhafen (Bor), Wangerooge Nord (Wan), LT Alte Weser (AW), Helgoland Binnenhafen (Hel), Wittdün (Wit), Sylt (Syl) and FINO3 (F3).
Remotesensing 14 00236 g002
Figure 3. Standard deviation of (regional) mission biases for all station pairs with Jason-3 (J3), Jason-2 (J2), Jason-1 (J1), Sentinel-3A (S3A), Saral (Sa) and Envisat (Env) for three different models of the SSH (color coded). The number of collocated station pairs depends on the mission (3–8, cf. Table 4).
Remotesensing 14 00236 g003
Figure 4. Sketch showing (a) two idealized M2 sea-level series with a slightly different phase (5 min offset) and amplitude (1 m/1.05 m), and (b) the difference between the two series in dependence on the sea level for amplitude scaling (blue) and amplitude scaling plus time shift (red).
Remotesensing 14 00236 g004
Figure 5. Difference between altimetry and tide gauge as function of absolute height for the five missions available at station LT Alte Weser (a) without and (b) with time variable position correction (Δt: 14–19 min., scaling factor: 1.02–1.06).
Remotesensing 14 00236 g005
Figure 6. Difference between altimetry and tide gauge at stations (a) Helgoland (open water) and (b) LT Alte Weser (coastal) for up to six missions (color coded) with time variable position correction applied. Diamonds mark single measurements, thick lines are the 3 months box-car filter, RMS-D values are given at the left-hand side and missions are color coded.
Remotesensing 14 00236 g006
Figure 7. (a) RMS-D (cm) and (b) explained variance (%) counterclockwise along the coast for FINO1 (Fin1, FIN1), Borkum Südstrand (Bor), Wangerooge Nord (Wan), LT Alte Weser (AW), Dwarsgat (Dwa), Cuxhaven (Cux), Zehnerloch (Zehn), Helgoland Binnenhafen (Helg), Wittdün (Witt), Sylt (Sylt) and FINO3 (Fin3, FIN3). Missions are color coded.
Remotesensing 14 00236 g007
Figure 8. Regional mission biases and error margins for all missions derived from all collocated station pairs, without (blue), with mean (green), with mean and time variable (red) position correction for Jason-3 (J3), Jason-2 (J2), Jason-1 (J1), Sentinel-3A (S3A), Saral (Sa) and Envisat (Env).
Remotesensing 14 00236 g008
Table 1. Virtual positions, the available missions, collocated tide gauges and the distance between both for Jason-1 (J1), Jason-2 (J2), Jason-3 (J3), Envisat (Env), Saral/AltiKa (Sa) and Sentinel-3A (S3A). FINO platforms are equipped with two gauge sensors (FINO/Fino) with different measurement periods.
Virtual StationMissionsDistance [km]Tide Gauges
Alte WeserJ1, J2, Env, Sa, S3A8.9
8.7
LT Alte Weser
Wangerooge Nord
BORKUMJ2, Env, Sa, S3A15.9Borkum Südstrand
DwarsgatJ2, Env, Sa, S3A7.4Dwarsgat
FINO1(Ja, Sa, S3A)J2, J3, Sa, S3A12.2, 5.0, 24.6FINO1, Fino1
FINO3(Ja, JaX, Sa)J2, J3, Sa7.4, 17.1, 1.9FINO3, Fino3
HelgolandJ1, J2, J3, Env, Sa, S3A12.7Helgoland
SYLTJ1, J2, J3, Env, Sa, S3A15.9Hörnum
WittdünJ1, J2, J3, Env, Sa, S3A8.1Wittdün
ZEHNEnv, Sa5.0
14.7
Zehnerloch
Cuxhaven
Table 2. Correction models applied for the instantaneous sea surface heights from different missions.
Correction ModelEnvisat
(GDR-V3)
Saral
(GDR-F)
Sentinel-3A
(SAR, Marine Baseline 004)
Jason-1/-2/-3 (GDR-E/D/D)
OrbitGFZ VER11 [31]CNES Rev_FGMVCNES Rev_E/F/F
IonosphereGIM CODE (GNSS) [28]
Dry troposphereECMWF
Wet troposphereGPD+ [29]ECMWFGPD+
Earth tidesIERS Conventions [32]
Loading tidesEOT11A Loading [30]
Sea state bias4-parameter model (GFZ)
Table 3. RMS-D, explained variance, number of values and distance between the gauge and virtual station for each mission for the best fitting station pair. The altimeter precision is estimated assuming that tide gauges have a precision of 2 cm (1.5 cm).
MissionStationRMS-D
[cm]
Explained
Variance [%]
Distance
[km]
CountPrecision
[cm]
Jason-3FINO32.7992138<1.8 (2.2)
Jason-2Helgoland3.110013301<2.4 (2.7)
Jason-1Helgoland4.210013245<3.7 (3.9)
Sentinel-3ALT Alte Weser3.3100952<2.6 (2.9)
SaralFino13.1100249<2.4 (2.7)
EnvisatLT Alte Weser3.7100981<3.1 (3.4)
Table 4. Absolute regional mission biases for each mission and number of contributing gauges for Jason-3 (J3), Jason-2 (J2), Jason-1 (J1), Sentinel-3A (S3A), Saral (Sa) and Envisat (Env).
J3J2J1EnvSaS3A
Bias (mm)43 ± 1344 ± 2012 ± 34−391 ± 1673 ± 3136 ± 28
No. gauges553587
Publisher’s Note: MDPI stays neutral with regard to jurisdictional claims in published maps and institutional affiliations.

