
CO2 Injection Deformation Monitoring Based on UAV and InSAR Technology: A Case Study of Shizhuang Town, Shanxi Province, China

 , , ,
, , , 
Abstract
:1. Introduction
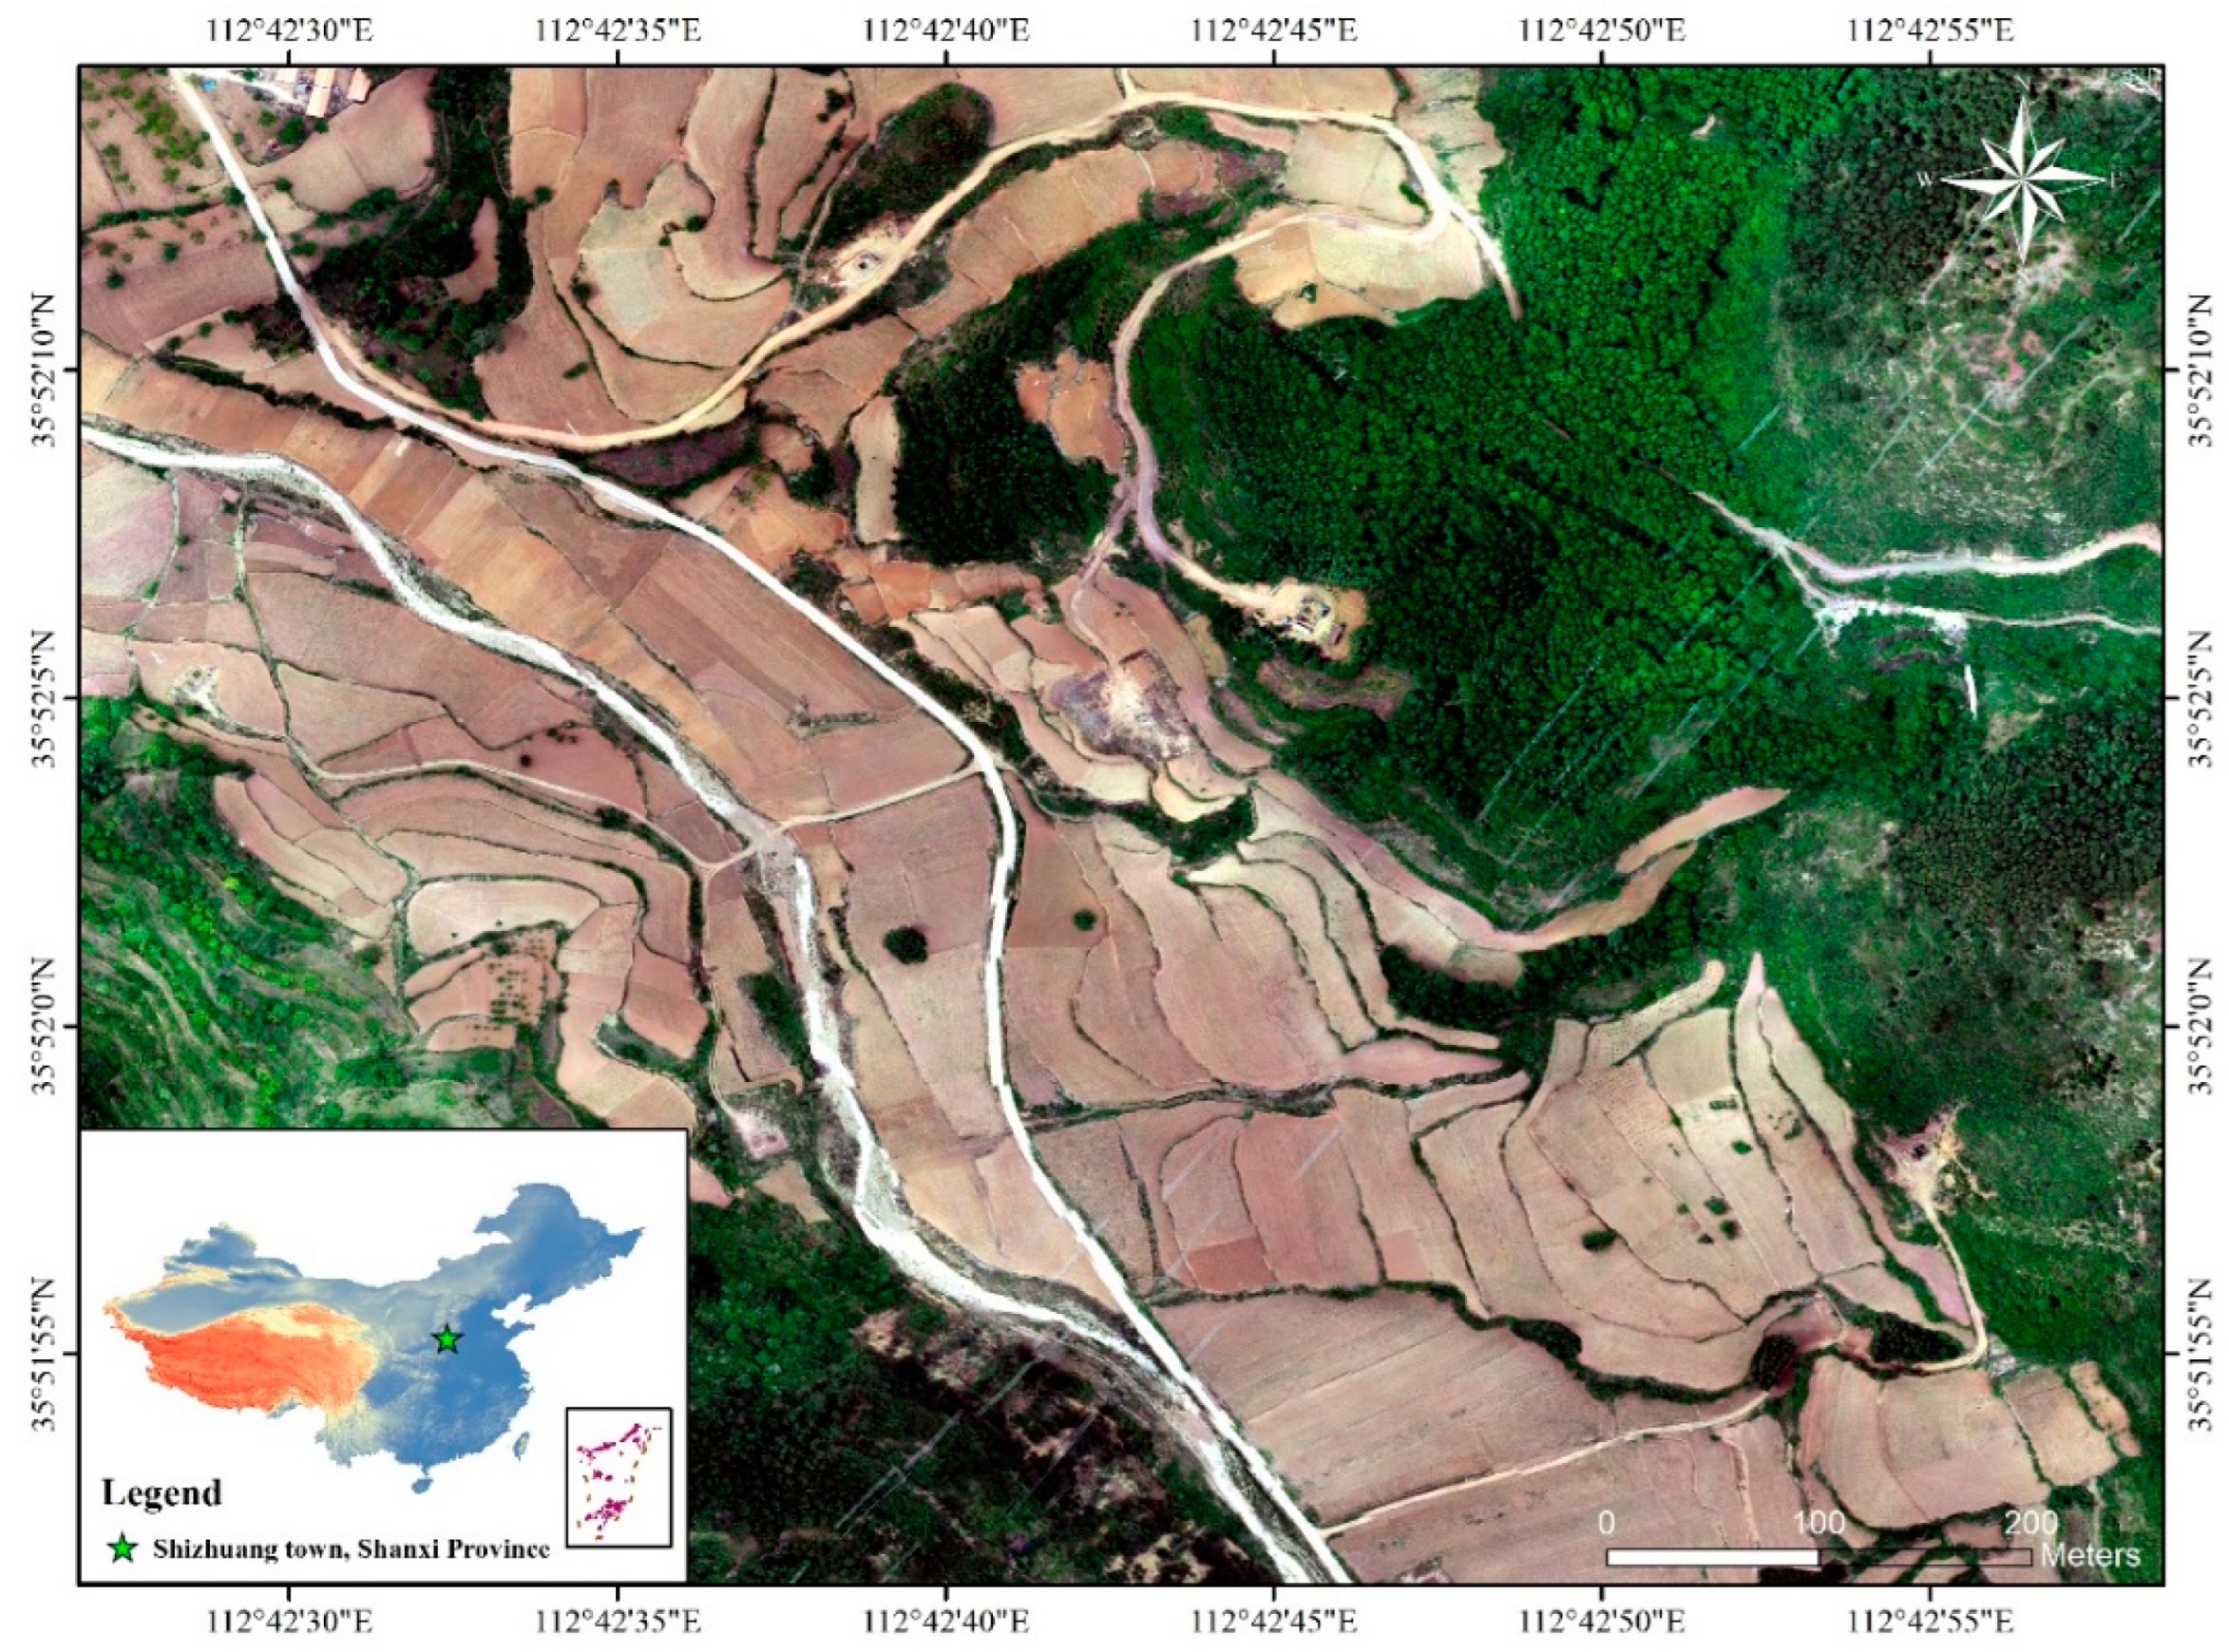
2. Study Area
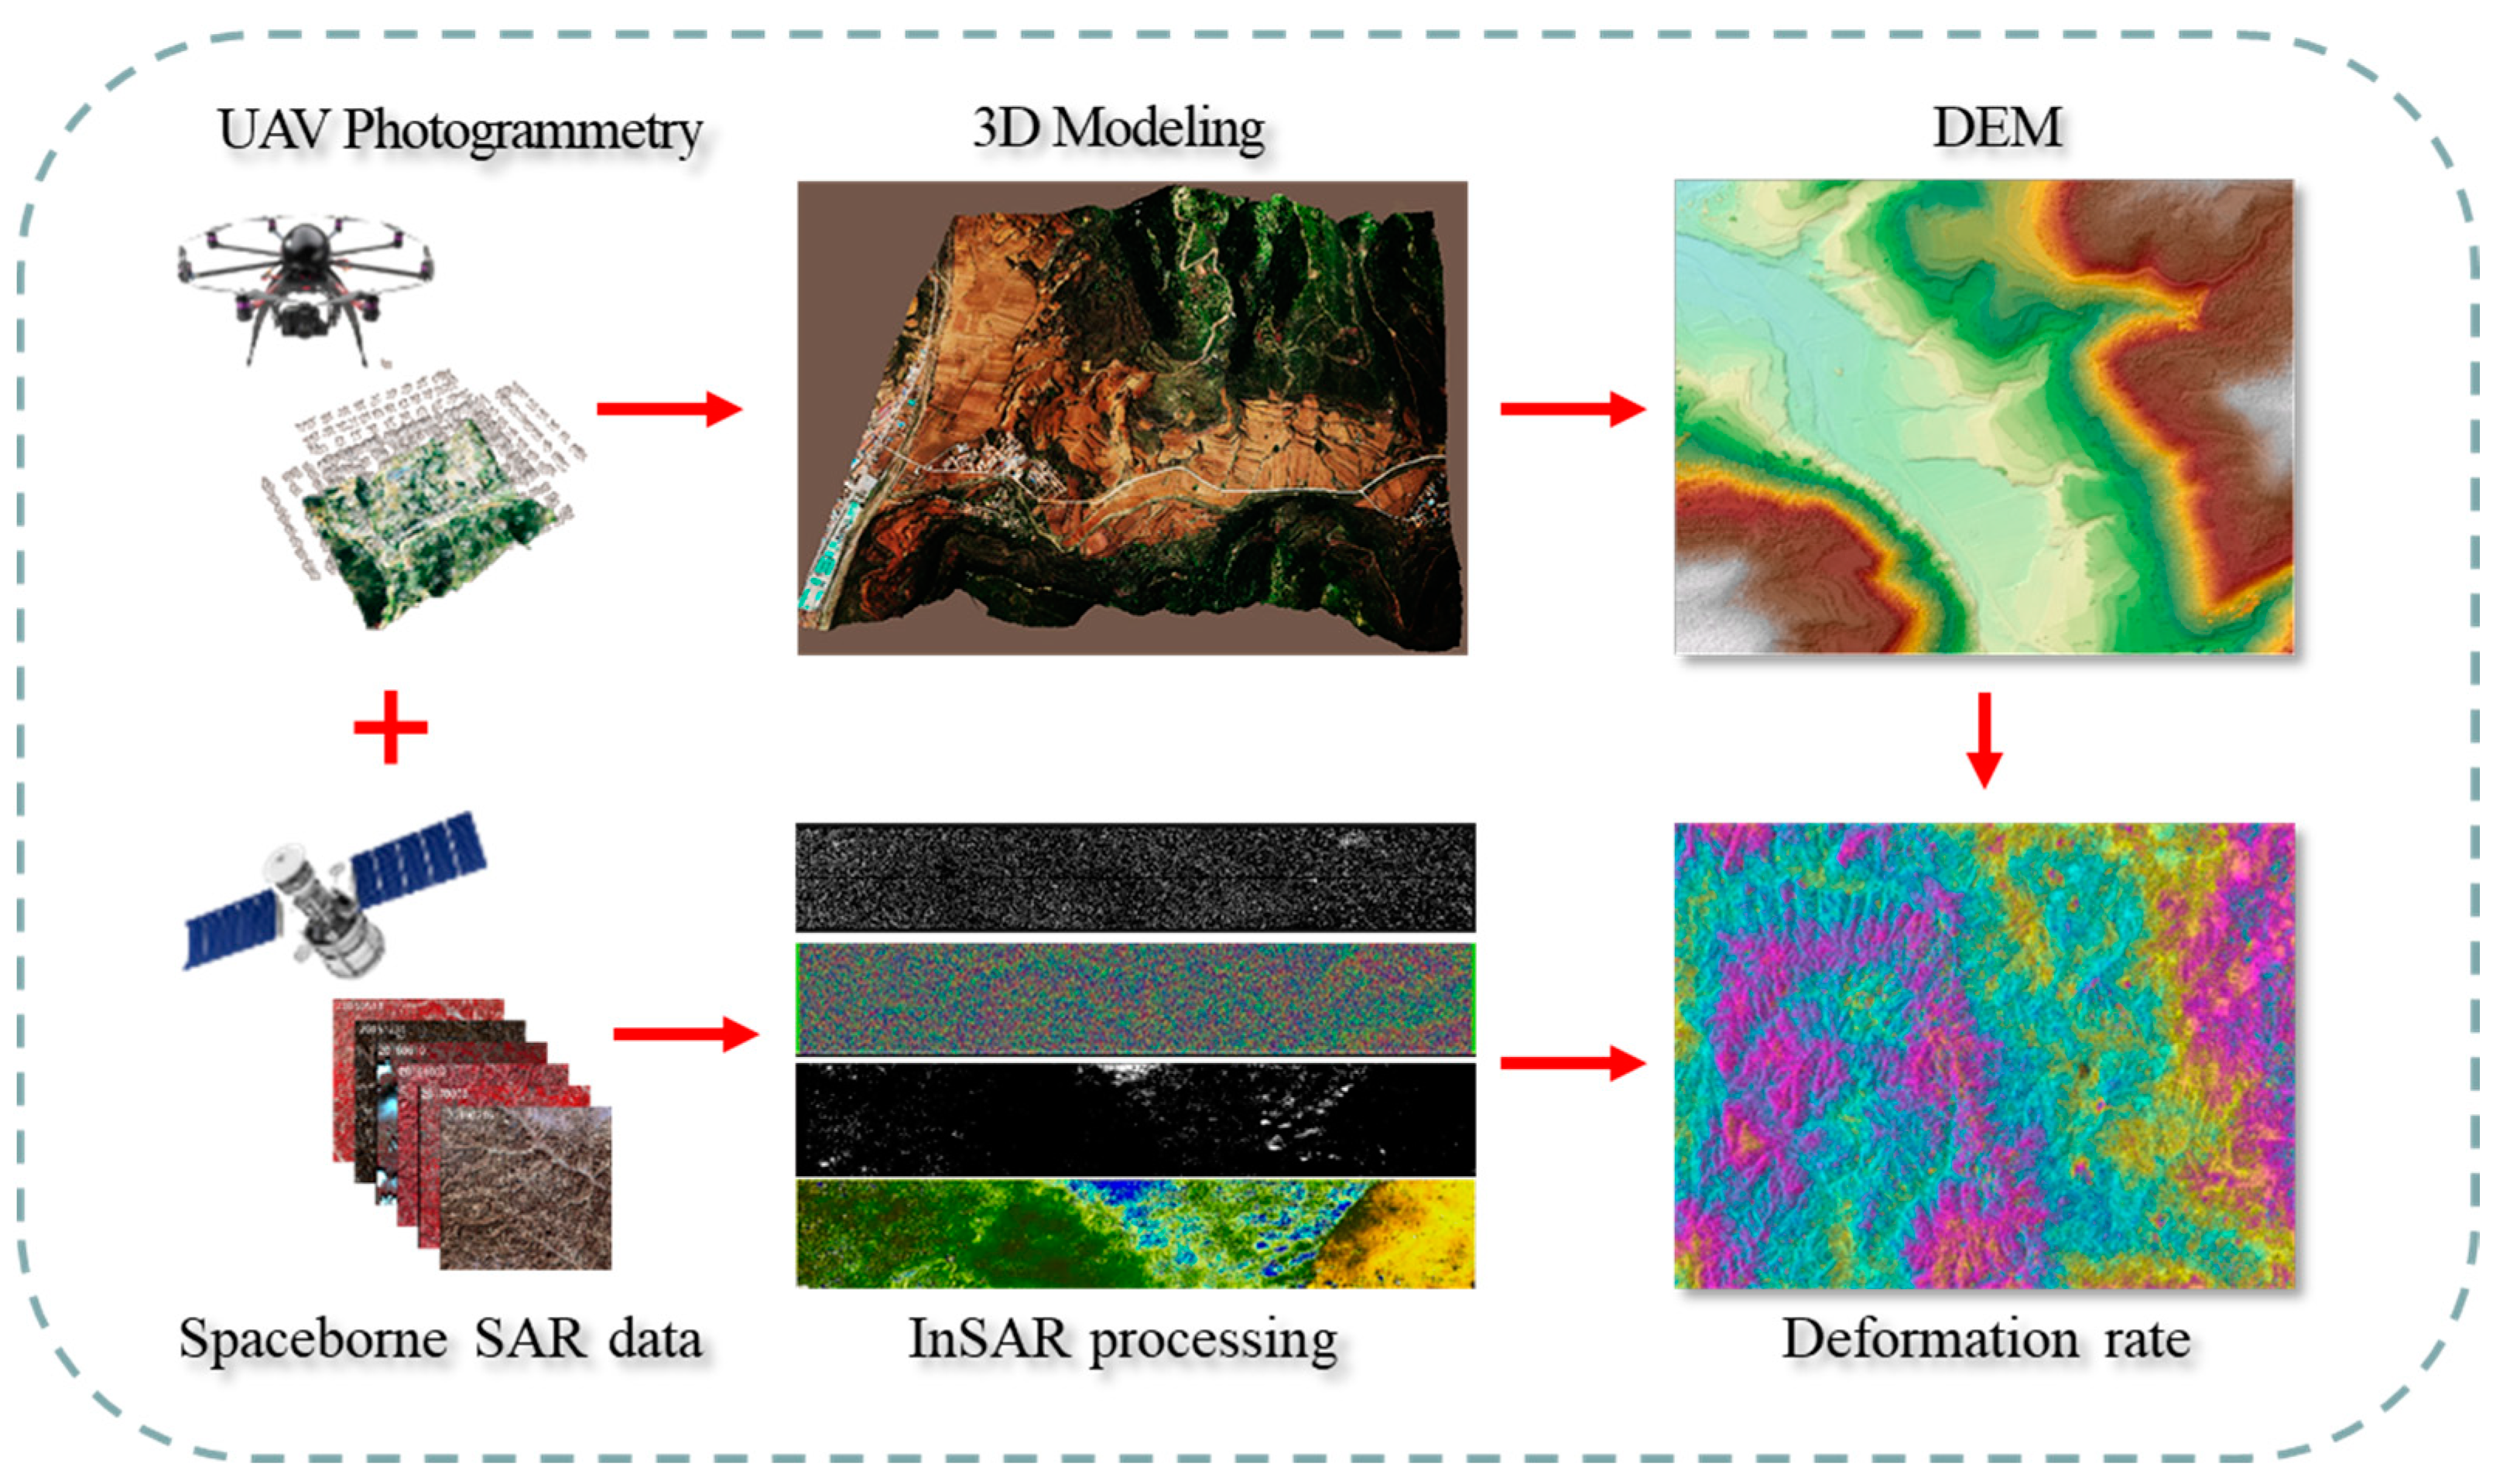
3. Materials and Methods
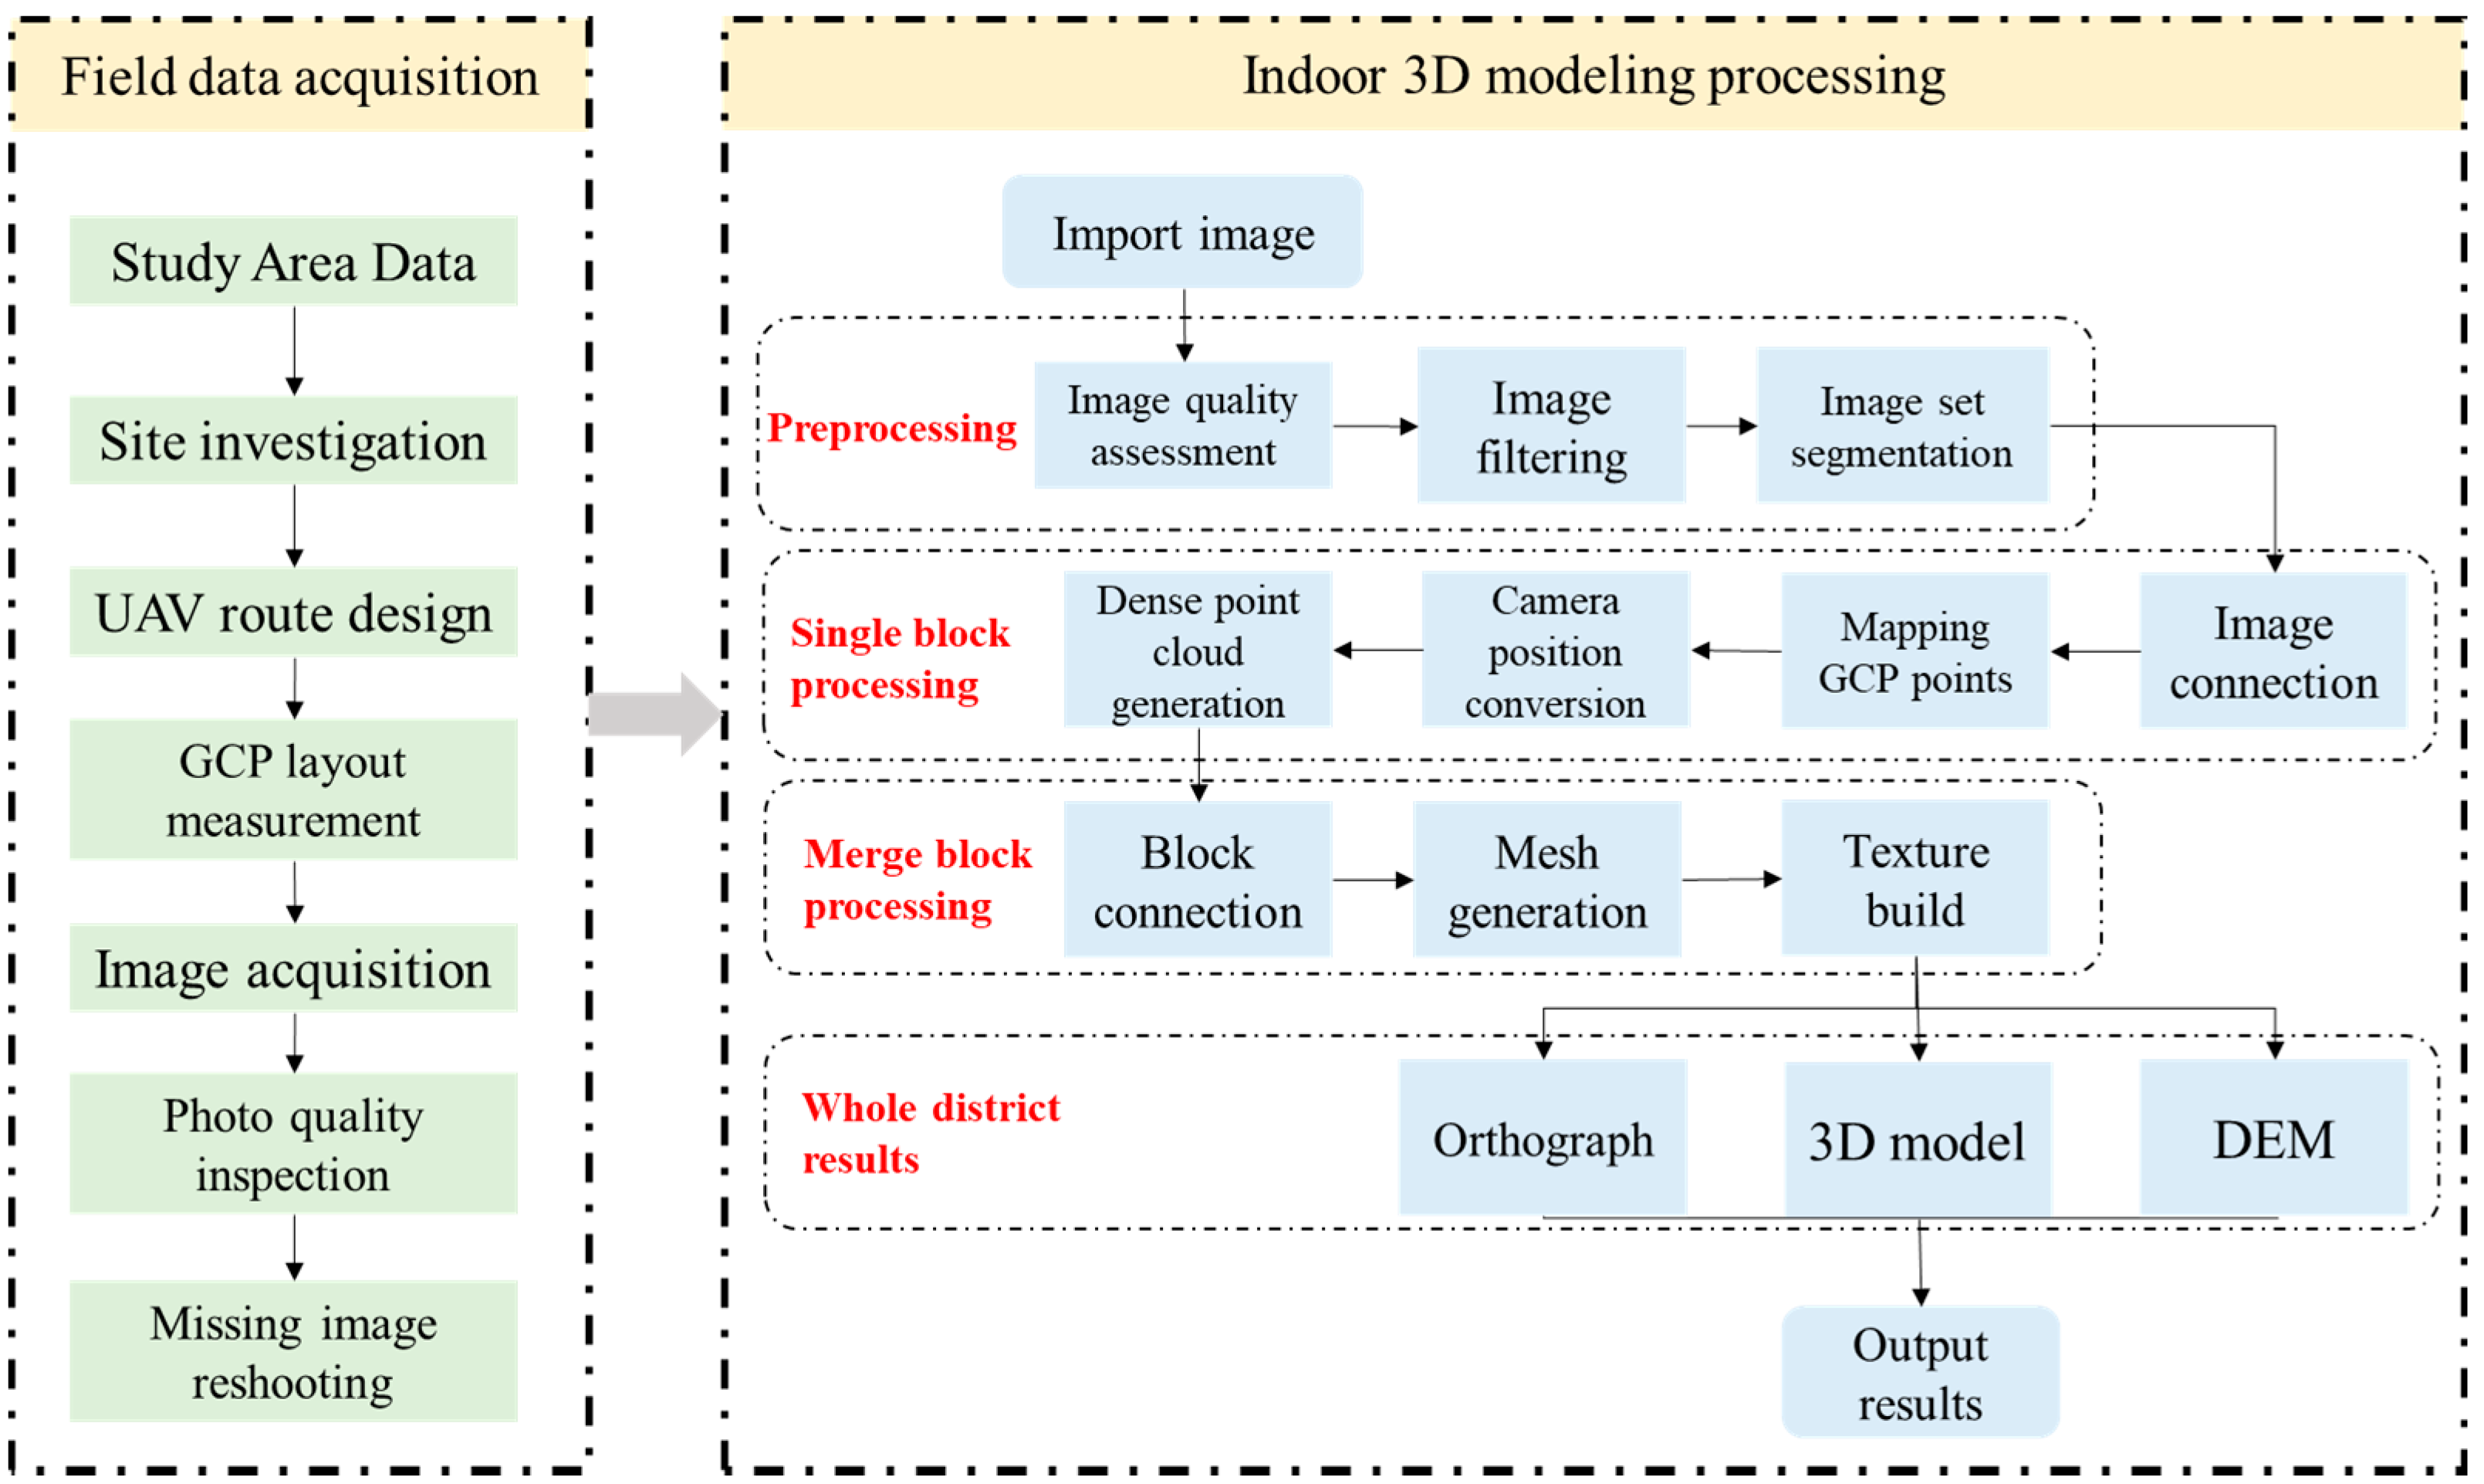
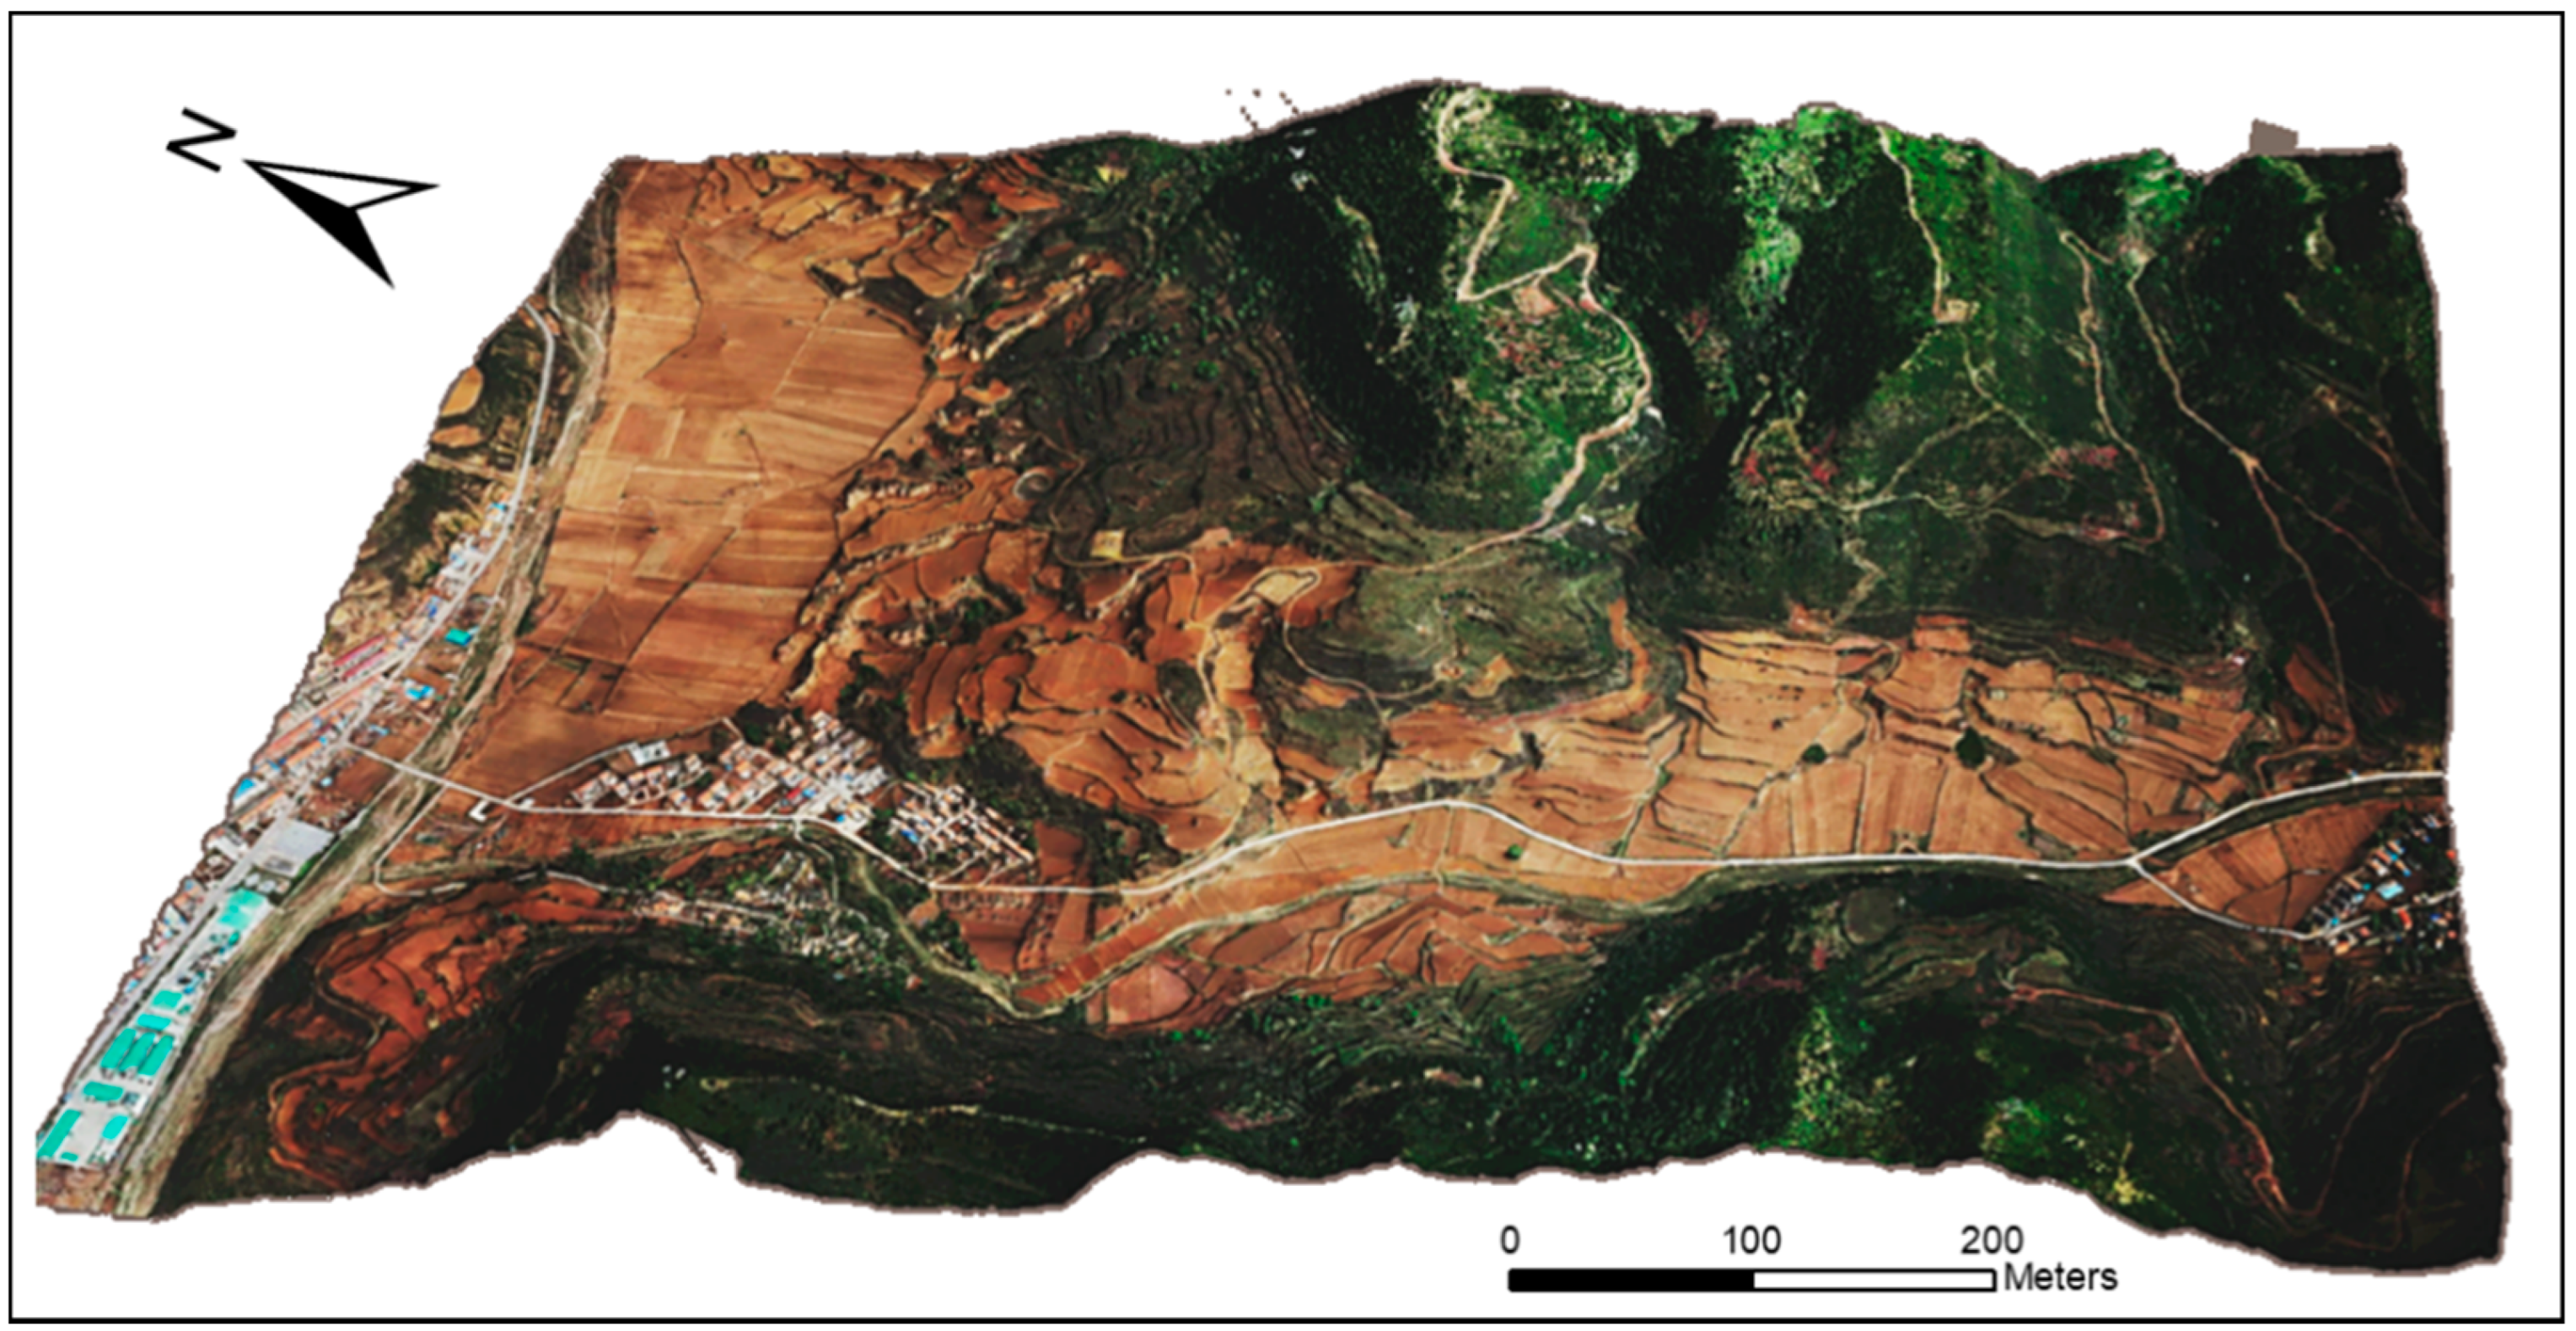
3.1. UAV 3D Surface Model Construction for DEM Extraction
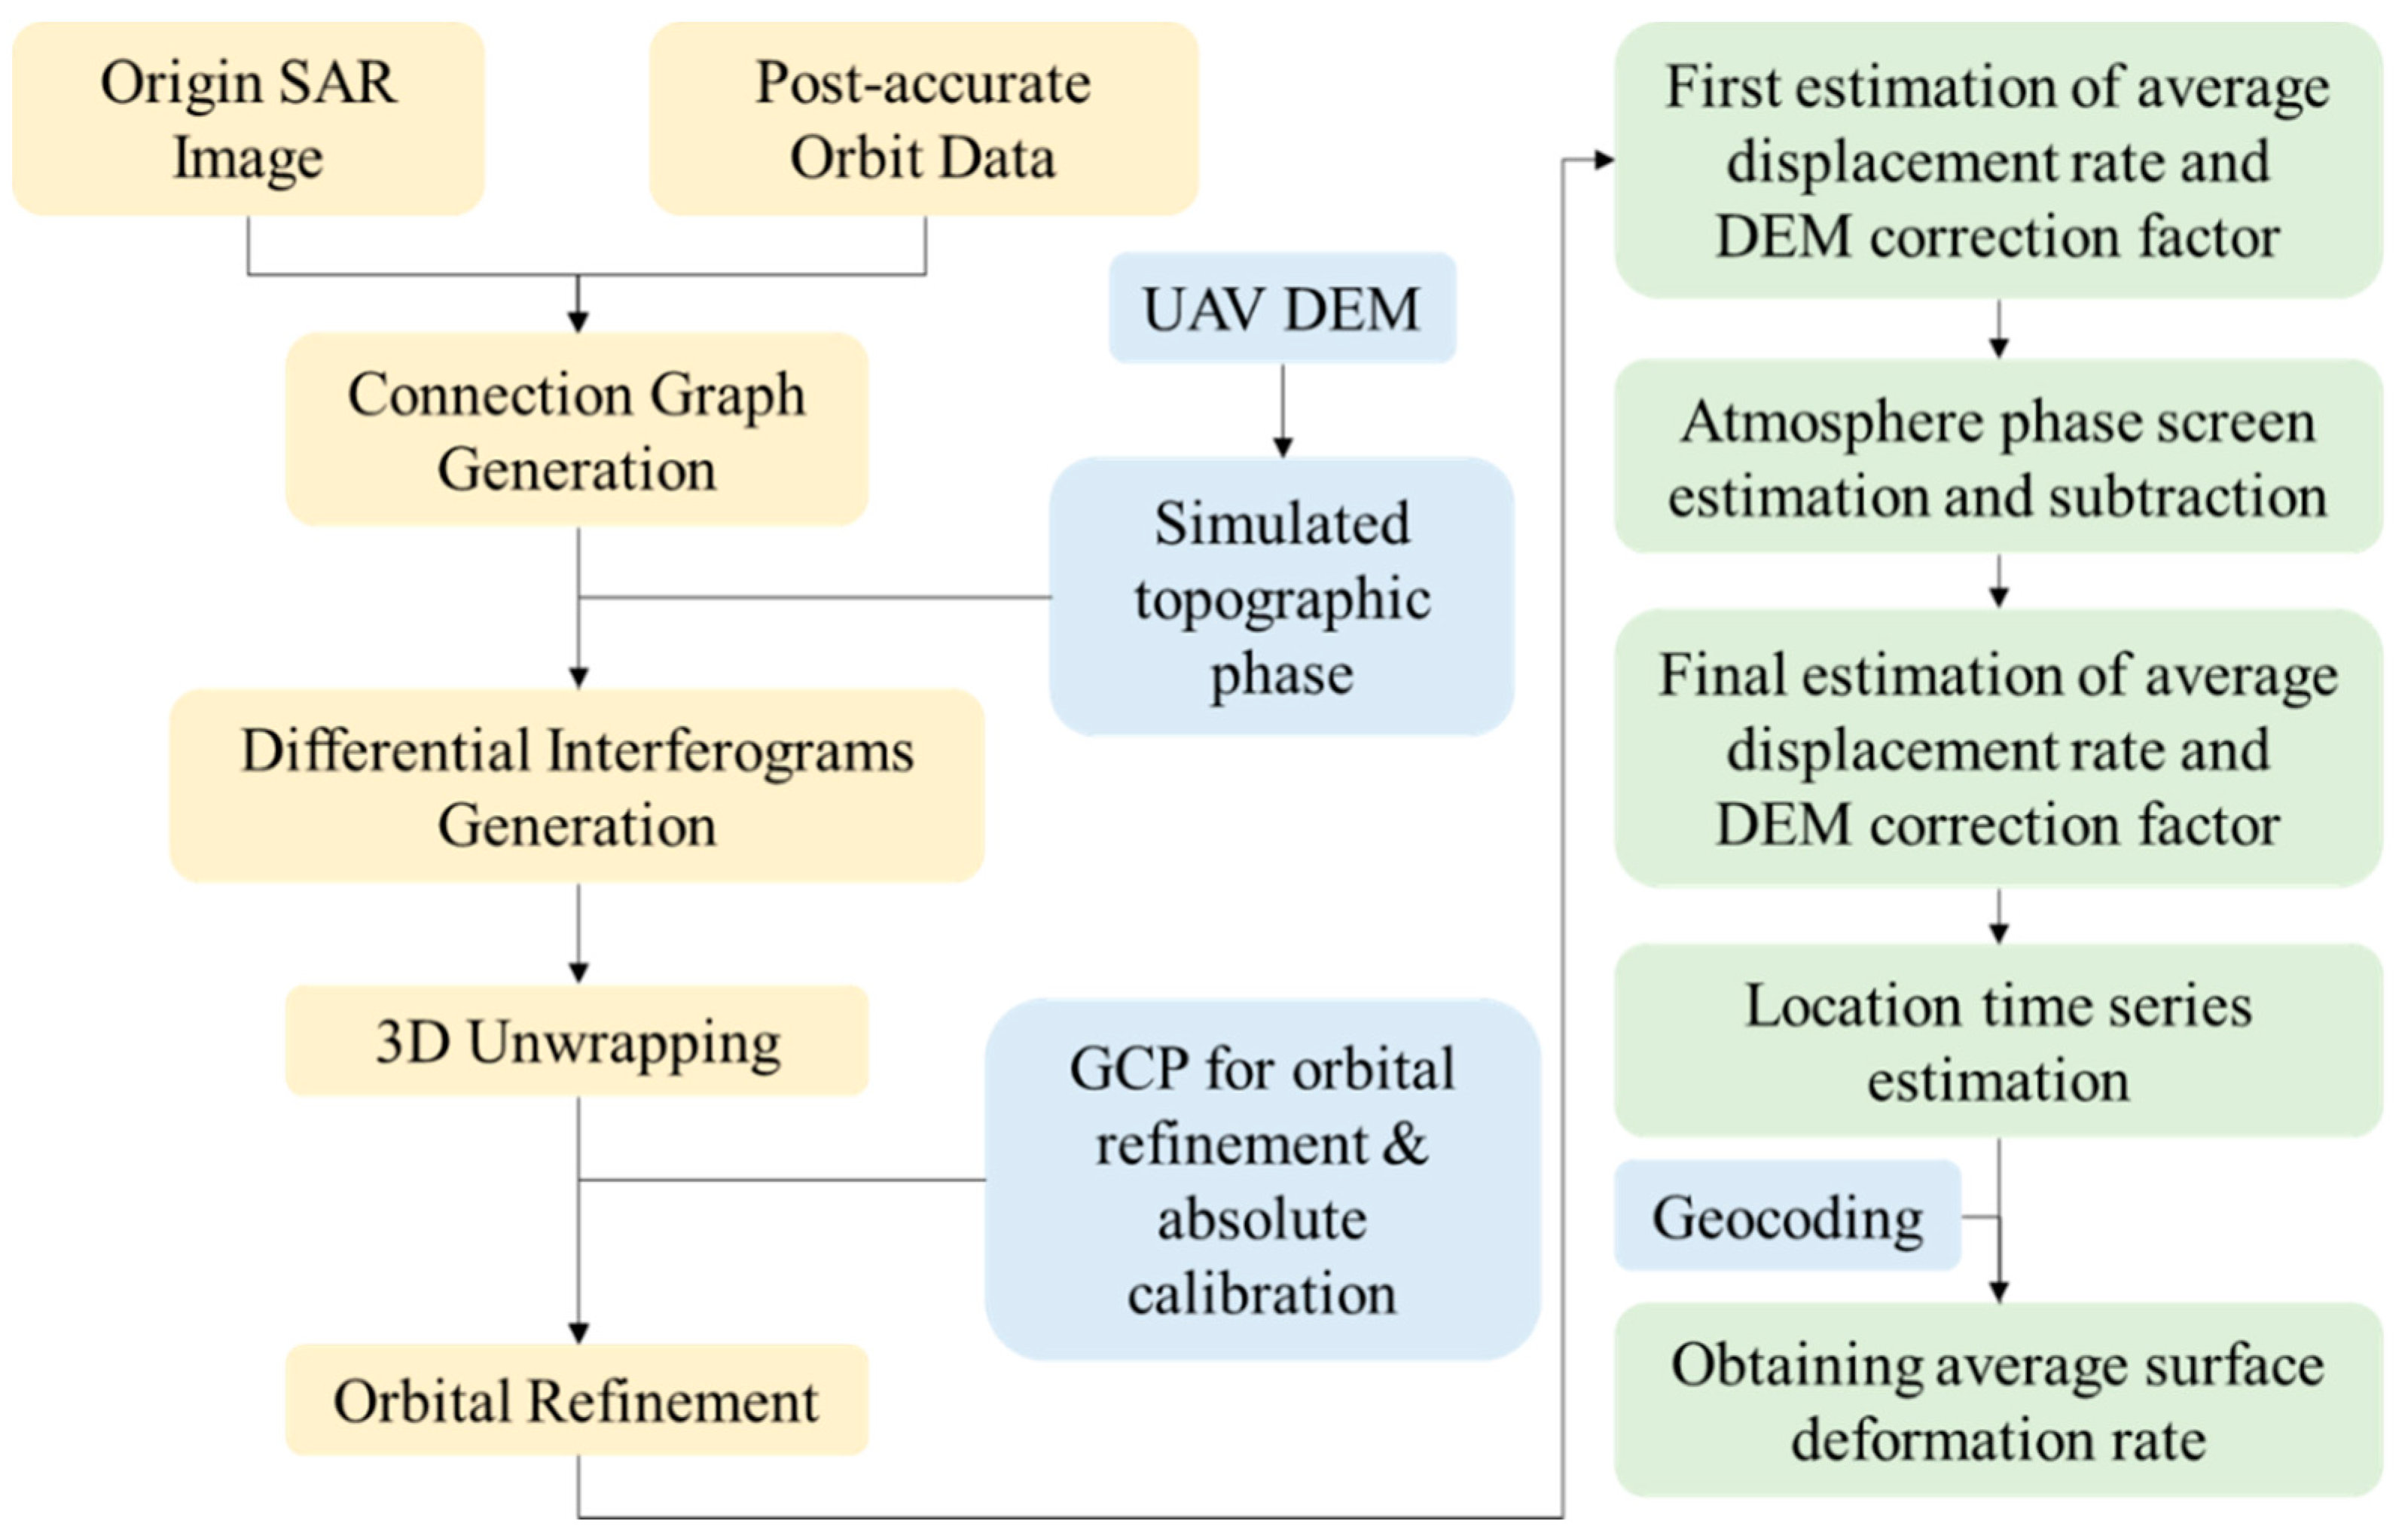
3.2. InSAR Surface Deformation Information Based on UAV High-Precision DEM
4. Results
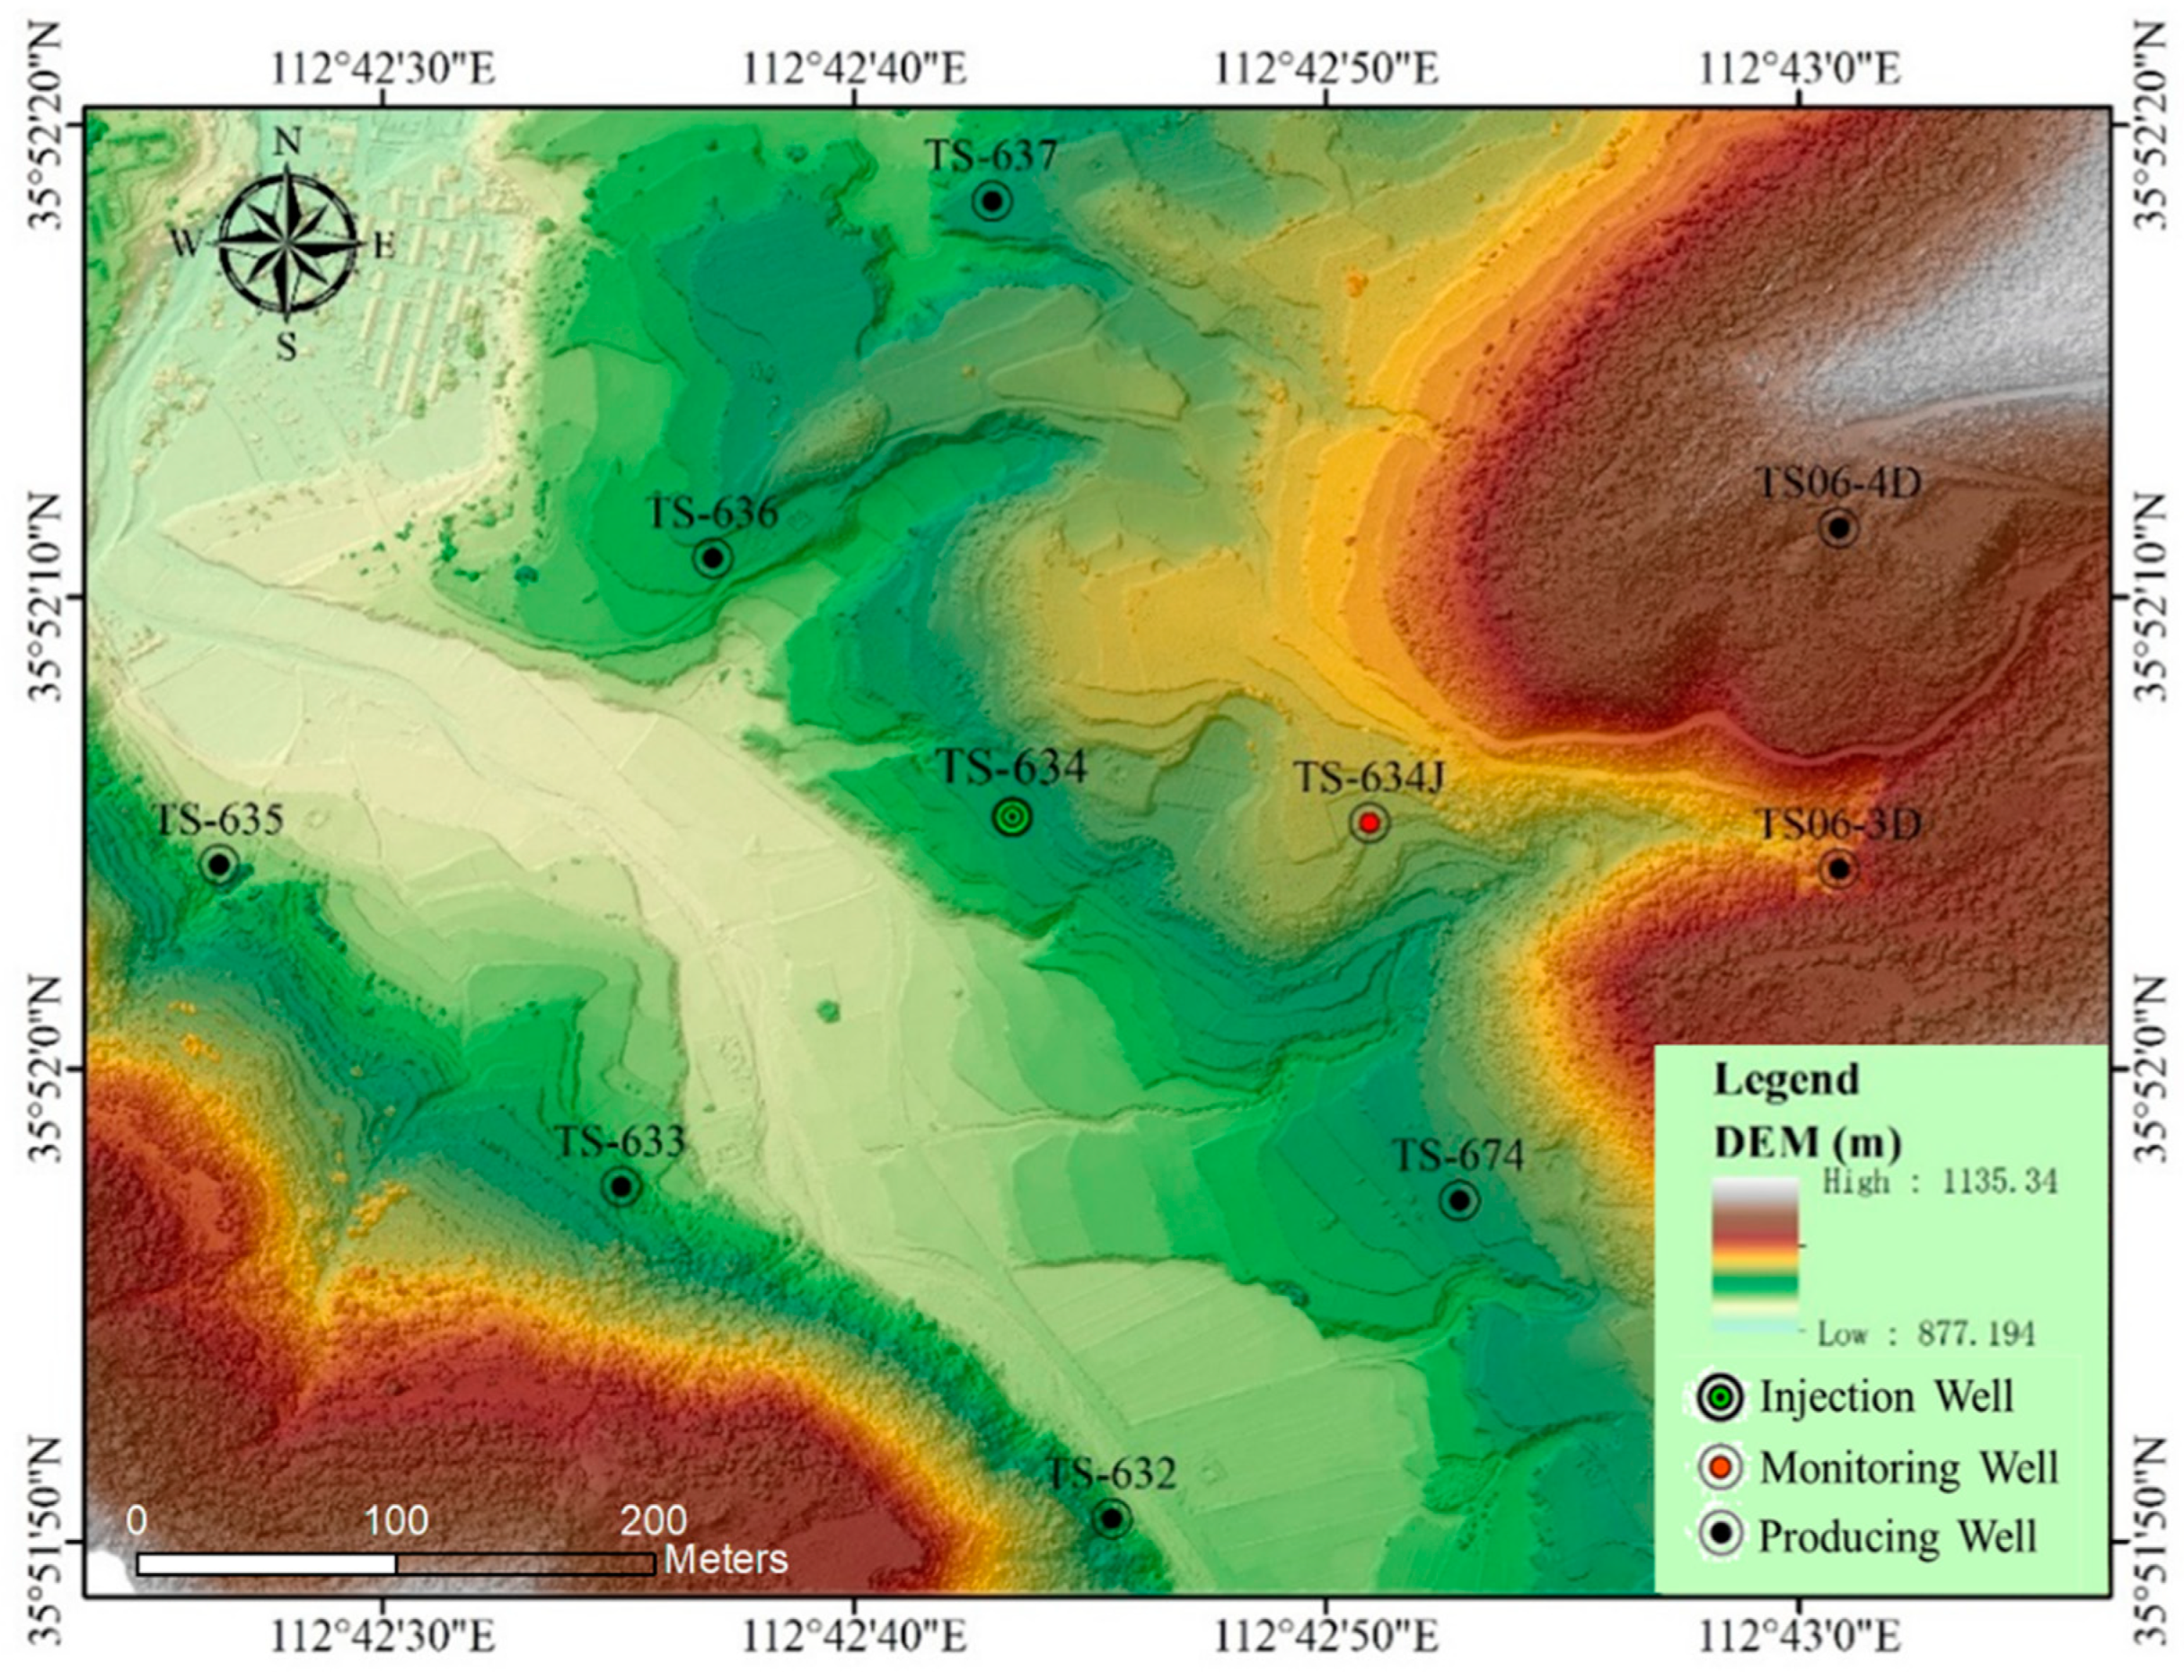
4.1. DEM Extraction by UAV
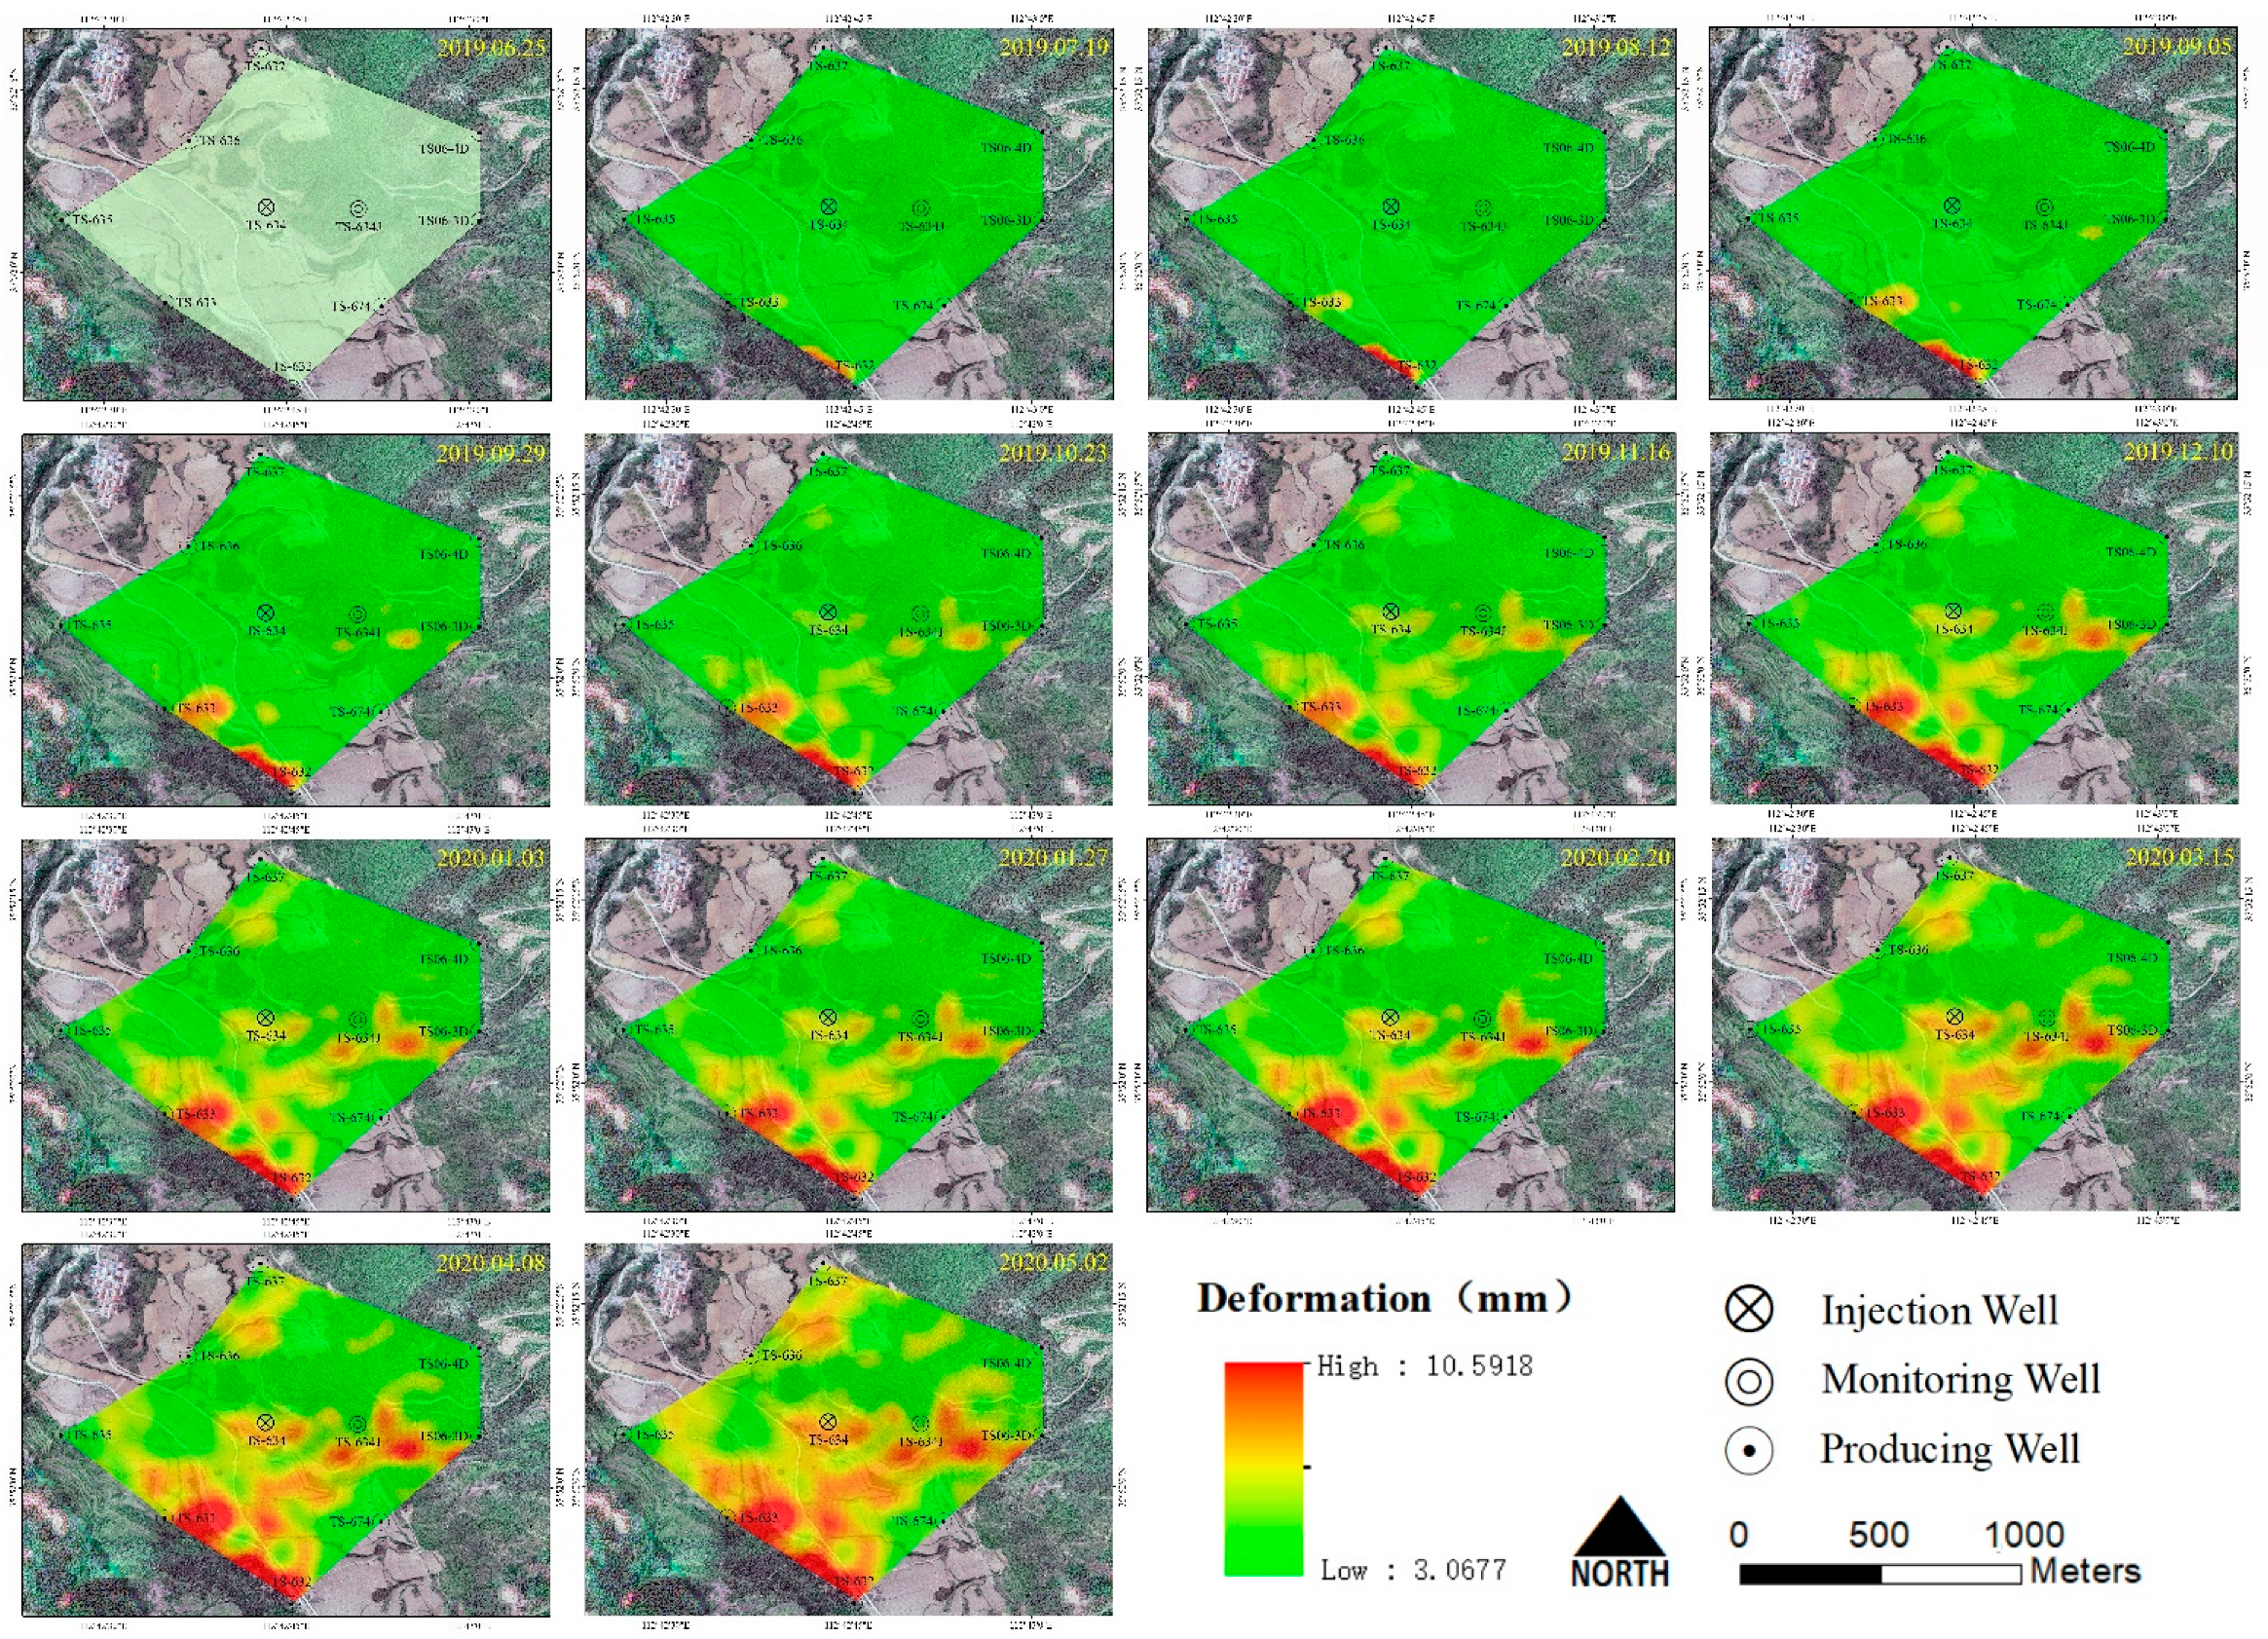
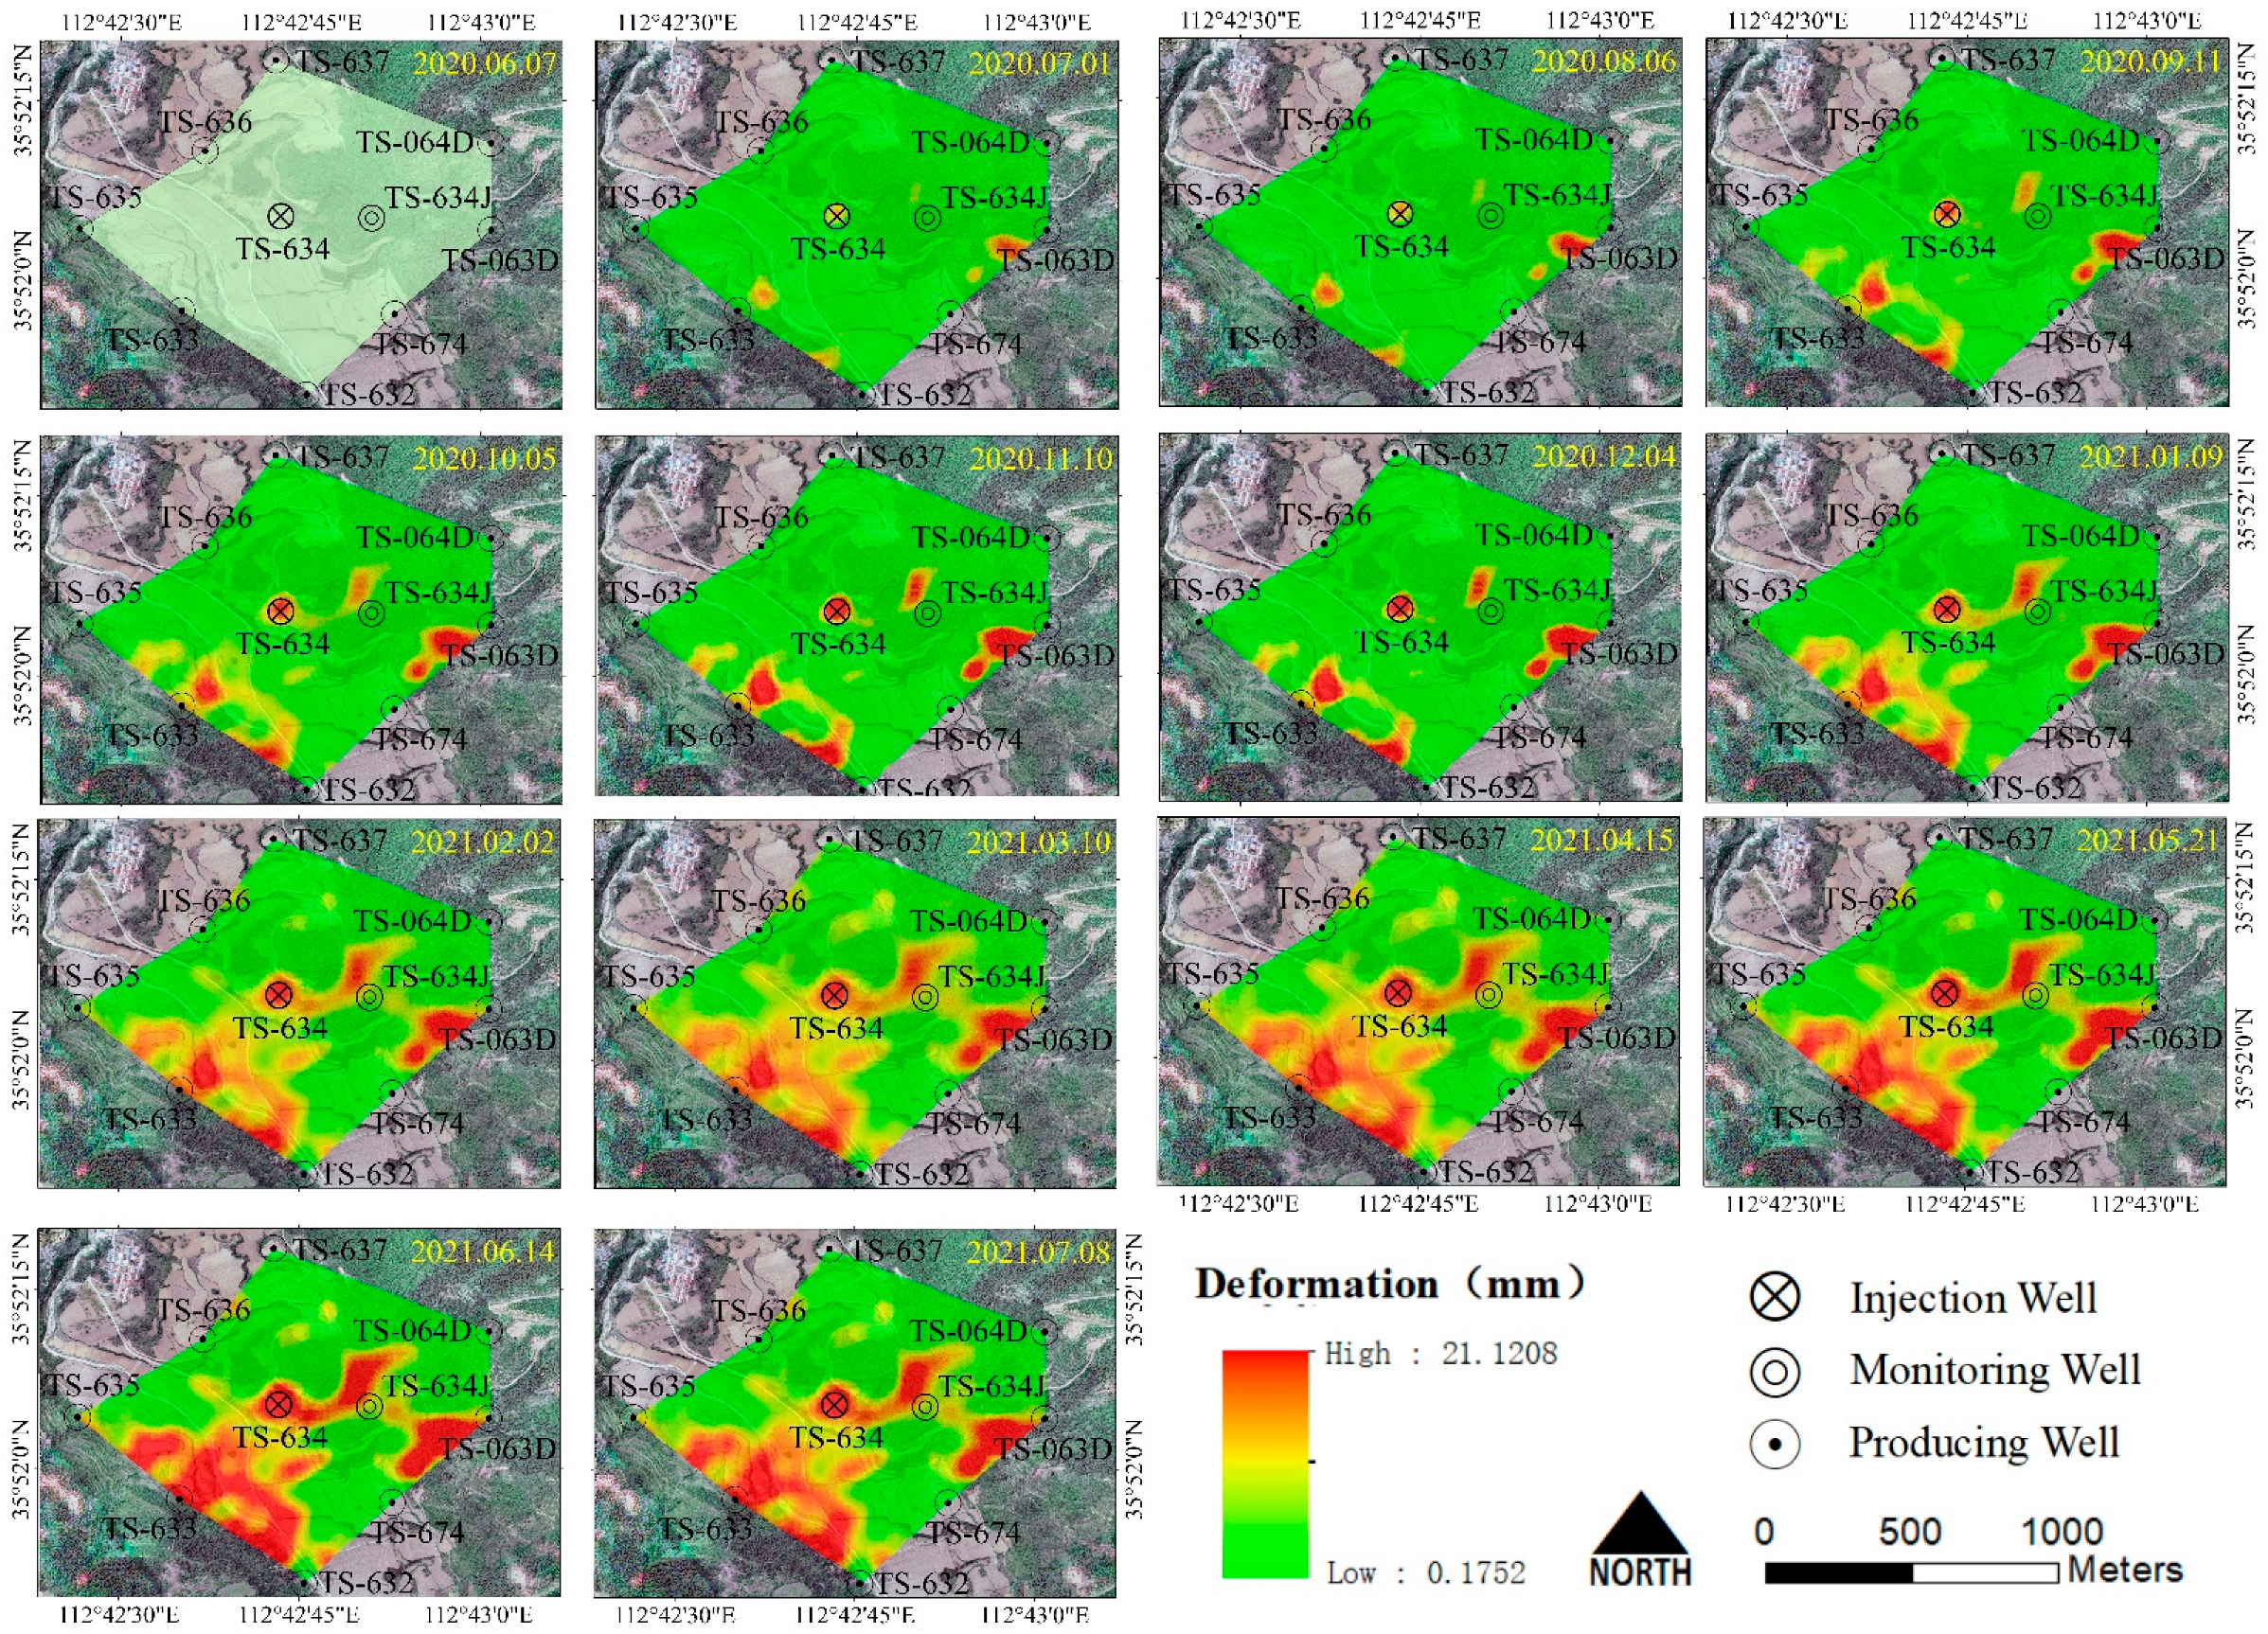
4.2. Temporal InSAR Monitoring of the Study Area
4.3. Verification of Multiple Monitoring Methods
5. Discussion
6. Conclusions
Author Contributions
Funding
Acknowledgments
Conflicts of Interest
References
- IPCC. Working Group I Climate Change 2021: The Physical Science Basis I; IPCC: Paris, France, 2021. [Google Scholar]
- Ryu, J.S.; Jacobson, A.D. CO2 evasion from the Greenland Ice Sheet: A new carbon-climate feedback. Chem. Geol. 2012, 320–321, 80–95. [Google Scholar] [CrossRef]
- Pohl, A.; Nardin, E.; Vandenbroucke, T.R.A.; Donnadieu, Y. High dependence of Ordovician ocean surface circulation on atmospheric CO2 levels. Palaeogeogr. Palaeoclimatol. Palaeoecol. 2016, 458, 39–51. [Google Scholar] [CrossRef]
- Wang, Z.; Yin, J.J.; Pu, J.; Xiao, Q.; Zhang, T.; Li, J. Flux and influencing factors of CO2 outgassing in a karst spring-fed creek: Implications for carbonate weathering-related carbon sink assessment. J. Hydrol. 2021, 596, 125710. [Google Scholar] [CrossRef]
- Yang, D.; Zhang, H.; Li, J. Changes in concentrations of fine and coarse particles under the CO2-induced global warming. Atmos. Res. 2019, 230, 104637. [Google Scholar] [CrossRef]
- Lee, Z.H.; Sethupathi, S.; Lee, K.T.; Bhatia, S.; Mohamed, A.R. An overview on global warming in Southeast Asia: CO2 emission status, efforts done, and barriers. Renew. Sustain. Energy Rev. 2013, 28, 71–81. [Google Scholar] [CrossRef]
- Anderson, T.R.; Hawkins, E.; Jones, P.D. CO2, the greenhouse effect and global warming: From the pioneering work of Arrhenius and Callendar to today’s Earth System Models. Endeavour 2016, 40, 178–187. [Google Scholar] [CrossRef] [PubMed] [Green Version]
- Wang, N.; Akimoto, K.; Nemet, G.F. What went wrong? Learning from three decades of carbon capture, utilization and sequestration (CCUS) pilot and demonstration projects. Energy Policy 2021, 158, 112546. [Google Scholar] [CrossRef]
- Li, Z.; Wang, F.; Shu, C.M.; Wen, H.; Wei, G.; Liang, R. Damage effects on coal mechanical properties and micro-scale structures during liquid CO2-ECBM process. J. Nat. Gas Sci. Eng. 2020, 83, 103579. [Google Scholar] [CrossRef]
- Zhang, Y.; Chi, Y.; Xing, W.; Liu, S.; Song, Y. Competitive Adsorption/Desorption of CH4/CO2/N2 Mixture on Anthracite from China for ECBM Operation. Energy Procedia 2017, 105, 4289–4294. [Google Scholar] [CrossRef]
- Norhasyima, R.S.; Mahlia, T.M.I. Advances in CO2 utilization technology: A patent landscape review. J. CO2 Util. 2018, 26, 323–335. [Google Scholar] [CrossRef]
- Niu, Q.; Wang, Q.; Wang, W.; Chang, J.; Chen, M.; Wang, H.; Cai, N.; Fan, L. Responses of multi-scale microstructures, physical-mechanical and hydraulic characteristics of roof rocks caused by the supercritical CO2-water-rock reaction. Energy 2022, 238, 121727. [Google Scholar] [CrossRef]
- Leung, D.Y.C.; Caramanna, G.; Maroto-Valer, M.M. An overview of current status of carbon dioxide capture and storage technologies. Renew. Sustain. Energy Rev. 2014, 39, 426–443. [Google Scholar] [CrossRef] [Green Version]
- Ren, B.; Ren, S.; Zhang, L.; Chen, G.; Zhang, H. Monitoring on CO2 migration in a tight oil reservoir during CCS-EOR in Jilin Oilfield China. Energy 2016, 98, 108–121. [Google Scholar] [CrossRef]
- Saleem, U.; Dewar, M.; Chaudhary, T.N.; Sana, M.; Lichtschlag, A.; Alendal, G.; Chen, B. Numerical modelling of CO2 migration in heterogeneous sediments and leakage scenario for STEMM-CCS field experiments. Int. J. Greenh. Gas Control 2021, 109, 103339. [Google Scholar] [CrossRef]
- Akai, T.; Kuriyama, T.; Kato, S.; Okabe, H. Numerical modelling of long-term CO2 storage mechanisms in saline aquifers using the Sleipner benchmark dataset. Int. J. Greenh. Gas Control 2021, 110, 103405. [Google Scholar] [CrossRef]
- Zhang, X.; Zheng, Y.; Guo, Z.; Ma, Y.; Wang, Y.; Gu, T.; Yang, T.; Jiao, L.; Liu, K.; Hu, Z. Effect of CO2 solution on Portland cement paste under flowing, migration, and static conditions. J. Nat. Gas Sci. Eng. 2021, 95, 104179. [Google Scholar] [CrossRef]
- Appriou, D.; Bonneville, A.; Zhou, Q.; Gasperikova, E. Time-lapse gravity monitoring of CO2 migration based on numerical modeling of a faulted storage complex. Int. J. Greenh. Gas Control 2020, 95, 102956. [Google Scholar] [CrossRef]
- Verkerke, J.L.; Williams, D.J.; Thoma, E. Remote sensing of CO2 leakage from geologic sequestration projects. Int. J. Appl. Earth Obs. Geoinf. 2014, 31, 67–77. [Google Scholar] [CrossRef] [Green Version]
- Chen, Y.; Guerschman, J.P.; Cheng, Z.; Guo, L. Remote sensing for vegetation monitoring in carbon capture storage regions: A review. Appl. Energy 2019, 240, 312–326. [Google Scholar] [CrossRef]
- Onuma, T.; Ohkawa, S. Detection of surface deformation related with CO2 injection by DInSAR at In Salah, Algeria. Energy Procedia 2009, 1, 2177–2184. [Google Scholar] [CrossRef] [Green Version]
- Zhang, T.; Zhang, W.; Yang, R.; Liu, Y.; Jafari, M. CO2 capture and storage monitoring based on remote sensing techniques: A review. J. Clean. Prod. 2021, 281, 124409. [Google Scholar] [CrossRef]
- Emilien, A.-V.; Thomas, C.; Thomas, H. UAV & satellite synergies for optical remote sensing applications: A literature review. Sci. Remote Sens. 2021, 3, 100019. [Google Scholar] [CrossRef]
- Bemis, S.P.; Micklethwaite, S.; Turner, D.; James, M.R.; Akciz, S.; Thiele, S.T.; Bangash, H.A. Ground-based and UAV-Based photogrammetry: A multi-scale, high-resolution mapping tool for structural geology and paleoseismology. J. Struct. Geol. 2014, 69, 163–178. [Google Scholar] [CrossRef]
- de Almeida, D.R.A.; Broadbent, E.N.; Ferreira, M.P.; Meli, P.; Zambrano, A.M.A.; Gorgens, E.B.; Resende, A.F.; de Almeida, C.T.; do Amaral, C.H.; Corte, A.P.D.; et al. Monitoring restored tropical forest diversity and structure through UAV-borne hyperspectral and lidar fusion. Remote Sens. Environ. 2021, 264, 112582. [Google Scholar] [CrossRef]
- Qadir, Z.; Ullah, F.; Munawar, H.S.; Al-Turjman, F. Addressing disasters in smart cities through UAVs path planning and 5G communications: A systematic review. Comput. Commun. 2021, 168, 114–135. [Google Scholar] [CrossRef]
- Sun, S.; Wang, B. Low-altitude UAV 3D modeling technology in the application of ancient buildings protection situation assessment. Energy Procedia 2018, 153, 320–324. [Google Scholar] [CrossRef]
- Teng, T.; Chen, X.; Li, P. Application of Unmanned Aerial Vehicle Remote Sensing Monitoring Technology on CO2 Sequestration and Leakage Risk Assessment. Bull. Soil Water Conserv. 2018, 38, 136–142. [Google Scholar] [CrossRef]
- Shi, J.; Zeng, L.; Zhao, X.; Zhang, Y.; Wang, J. Characteristics of natural fractures in the upper Paleozoic coal bearing strata in the southern Qinshui Basin, China: Implications for coalbed methane (CBM) development. Mar. Pet. Geol. 2020, 113, 104152. [Google Scholar] [CrossRef]
- Chen, B.; Stuart, F.M.; Xu, S.; Gyӧre, D.; Liu, C. Evolution of coal-bed methane in Southeast Qinshui Basin, China: Insights from stable and noble gas isotopes. Chem. Geol. 2019, 529, 119298. [Google Scholar] [CrossRef]
- Song, Y.; Ma, X.; Liu, S.; Jiang, L.; Hong, F.; Qin, Y. Accumulation conditions and key technologies for exploration and development of Qinshui coalbed methane field. Pet. Res. 2018, 3, 320–335. [Google Scholar] [CrossRef]
- Chen, S.; Tang, D.; Tao, S.; Xu, H.; Li, S.; Zhao, J.; Ren, P.; Fu, H. In-situ stress measurements and stress distribution characteristics of coal reservoirs in major coalfields in China: Implication for coalbed methane (CBM) development. Int. J. Coal Geol. 2017, 182, 66–84. [Google Scholar] [CrossRef]
- Ni, X.; Zhao, Z.; Wang, Y.; Wang, L. Optimisation and application of well types for ground development of coalbed methane from no. 3 coal seam in shizhuang south block in Qinshui basin, Shanxi province. China. J. Pet. Sci. Eng. 2020, 193, 107453. [Google Scholar] [CrossRef]
- Loschetter, A.; Rohmer, J.; Raucoules, D.; De Michele, M. Sizing a geodetic network for risk-oriented monitoring of surface deformations induced by CO2 injection: Experience feedback with InSAR data collected at In-Salah, Algeria. Int. J. Greenh. Gas Control 2015, 42, 571–582. [Google Scholar] [CrossRef]
- Cigna, F.; Sowter, A. The relationship between intermittent coherence and precision of ISBAS InSAR ground motion velocities: ERS-1/2 case studies in the UK. Remote Sens. Environ. 2017, 202, 177–198. [Google Scholar] [CrossRef]
- Pepe, A.; Calò, F. A review of interferometric synthetic aperture RADAR (InSAR) multi-track approaches for the retrieval of Earth’s Surface displacements. Appl. Sci. 2017, 7, 1264. [Google Scholar] [CrossRef] [Green Version]
- Qu, T.; Lu, P.; Liu, C.; Wan, H. Application of time series insar technique for deformation monitoring of large-scale landslides in mountainous areas of western China. Int. Arch. Photogramm. Remote Sens. Spat. Inf. Sci.—ISPRS Arch. 2016, XLI-B1, 89–91. [Google Scholar] [CrossRef] [Green Version]


Publisher’s Note: MDPI stays neutral with regard to jurisdictional claims in published maps and institutional affiliations. |
© 2022 by the authors. Licensee MDPI, Basel, Switzerland. This article is an open access article distributed under the terms and conditions of the Creative Commons Attribution (CC BY) license (https://creativecommons.org/licenses/by/4.0/).
Share and Cite
Zhang, T.; Zhang, W.; Yang, R.; Cao, D.; Chen, L.; Li, D.; Meng, L. CO2 Injection Deformation Monitoring Based on UAV and InSAR Technology: A Case Study of Shizhuang Town, Shanxi Province, China. Remote Sens. 2022, 14, 237. https://0-doi-org.brum.beds.ac.uk/10.3390/rs14010237
Zhang T, Zhang W, Yang R, Cao D, Chen L, Li D, Meng L. CO2 Injection Deformation Monitoring Based on UAV and InSAR Technology: A Case Study of Shizhuang Town, Shanxi Province, China. Remote Sensing. 2022; 14(1):237. https://0-doi-org.brum.beds.ac.uk/10.3390/rs14010237
Chicago/Turabian StyleZhang, Tian, Wanchang Zhang, Ruizhao Yang, Dan Cao, Longfei Chen, Dewei Li, and Lingbin Meng. 2022. "CO2 Injection Deformation Monitoring Based on UAV and InSAR Technology: A Case Study of Shizhuang Town, Shanxi Province, China" Remote Sensing 14, no. 1: 237. https://0-doi-org.brum.beds.ac.uk/10.3390/rs14010237