Article

Quantitative Analysis on Coastline Changes of Yangtze River Delta Based on High Spatial Resolution Remote Sensing Images

1
School of Geography and Ocean Science, Nanjing University, Nanjing 210023, China
2
State Key Laboratory of Resources and Environmental Information System, Institute of Geographical Sciences and Natural Resources Research, CAS, Beijing 100101, China
*
Author to whom correspondence should be addressed.
Submission received: 30 September 2021 / Revised: 6 January 2022 / Accepted: 7 January 2022 / Published: 11 January 2022
(This article belongs to the Special Issue Remote Sensing Application in Coastal Geomorphology and Processes)

Abstract

:
The coastline situation reflects socioeconomic development and ecological environment in coastal zones. Analyzing coastline changes clarifies the current coastline situation and provides a scientific basis for making environmental protection policies, especially for coastlines with significant human interference. As human activities become more intense, coastline types and their dynamic changes become more complicated, which needs more detailed identification of coastlines. High spatial resolution images can help provide detailed large spatial coverage at high resolution information on coastal zones. This study aims to map the position and status of the Yangtze River Delta (YRD) coastline using an NDWI threshold method based on 2 m Gaofen-1/Ziyuan-3 imagery and analyze coastline change and coastline type distribution characteristics. The results showed that natural and artificial coastlines in the YRD region accounted for 42.73% and 57.27% in 2013 and 41.56% and 58.44% in 2018, respectively. The coastline generally advanced towards the sea, causing a land area increase of 475.62 km2. The changes in the YRD coastline mainly resulted from a combination of large-scale artificial construction and natural factors such as silt deposition. This study provides a reference source for large spatial coverage at high resolution remote sensing coastline monitoring and a better understanding of land use in coastal zone.

1. Introduction

The coastal zone is one of the areas with the most intensive and active human activities. Rapid economic development since the 20th century and a large percentage of world population puts coastal zone areas under intense pressure from both natural and anthropogenic processes [1,2]. Changes in the position of the coastline can be a good indicator of those processes. Investigating the driving factors of coastline changes helps us to better understand coastal zones and improve management through sustainable strategies [1].
The interaction between natural processes and human activities causes either coastline progradation or recession [1]. Natural environmental factors influencing coastline position are known, including siltation [1], tides [3], ocean currents [4], and sea level rise [5,6]. In recent decades, intensive human activities have changed coastal zones significantly by multiple means, including sea enclosure and reclamation [7], harbor construction [8] and fishpond construction [9]. More attention needs to be paid to the role of anthropogenic factors in bringing about coastline changes and their interactions with natural factors.
Coastline mapping via remote sensing imagery is one of the main methods in coastline change researches [10,11]. This is due to the advantages of remote sensing data with large spatial coverage, long time span and good comparability with other data sources [12]. With a range of research purposes, study spatial scales and time spans, various satellite imageries have been employed to extract coastline changes, including Landsat [13], SPOT [14], MODIS [15], etc. Among those data sources, Landsat satellite imagery with a 30 m resolution is one of the most commonly used. One reason for this is the large time span of the Landsat imagery since 1972, which makes long time sequence studies convenient [16]. Although its spatial resolution of 30 m is applicable for regional or national studies, it is not detailed enough to pick up small-scale artificial constructions along coastline like spur dikes, which can be as narrow as 2 m or docks with a width of 20 m.
Currently, studies have been conducted on coastline extraction using high spatial resolution imagery. For example, Dai et al. (2019) employed QuickBird and WorldView-2 data to extract a 2 m resolution coastline data product of the Arctic region [17]. Chinese remote sensing satellite Gaofen-1 images with 2 m resolution were also applied in the coastline study of Zhejiang Province, China [18]. These studies verified that high-resolution images are able to generate more detailed information on coastline shapes and land surface texture. More studies using high-resolution images should be conducted, especially for areas with complex coastlines and coastline changes due to the interaction between natural processes and intensive human activities.
Yangtze River Delta is one of the most developed regions in China’s rapid socioeconomic development over the past several decades. The area comprises a combination of rocky, muddy, and sandy coastlines, together with various artificial coastlines [19], and this diversity makes its mapping and monitoring challenging. With the need for comprehensive and precise environmental monitoring of the coastline environment, there is an urgent need for quantitative studies of coastline change using high-resolution remote sensing imagery. There have been many studies on the Yangtze River estuary from other views such as hydrology [20,21], or in a single province/municipality like Zhejiang [18] or Shanghai [7]. However, the detailed coastline types of Yangtze River Delta, the changes over time, and the driving factors still lack comprehensive study. Therefore, a detailed and accurate study on the change of Yangtze River Delta coastline and the regional variation within Yangtze River Delta using high spatial resolution images is needed.
Gaofen-1 (GF-1) [22] and Ziyuan-3 (ZY-3) [23] are Chinese remote sensing satellites launched in 2013 and 2012, respectively. With their 2 m fusion imagery and good coverage of the coastal area of China, they provide a potential opportunity to detect coastline changes in Yangtze River Delta with high accuracy. In this study, we used a Normalized Difference Water Index (NDWI) [24] based on GF-1 and ZY-3 2 m fusion images to extract and classify Yangtze River Delta coastlines in 2013 and 2018. The objectives of the present study are to map and classify the Yangtze River Delta coastline of 2013 and 2018 using GF-1/ZY-3 satellite imagery, to calculate coastline length and coastal zone area changes, and to analyze distribution characteristics of coastline types and the natural and anthropogenic factors behind coastline change.

2. Materials and Methods
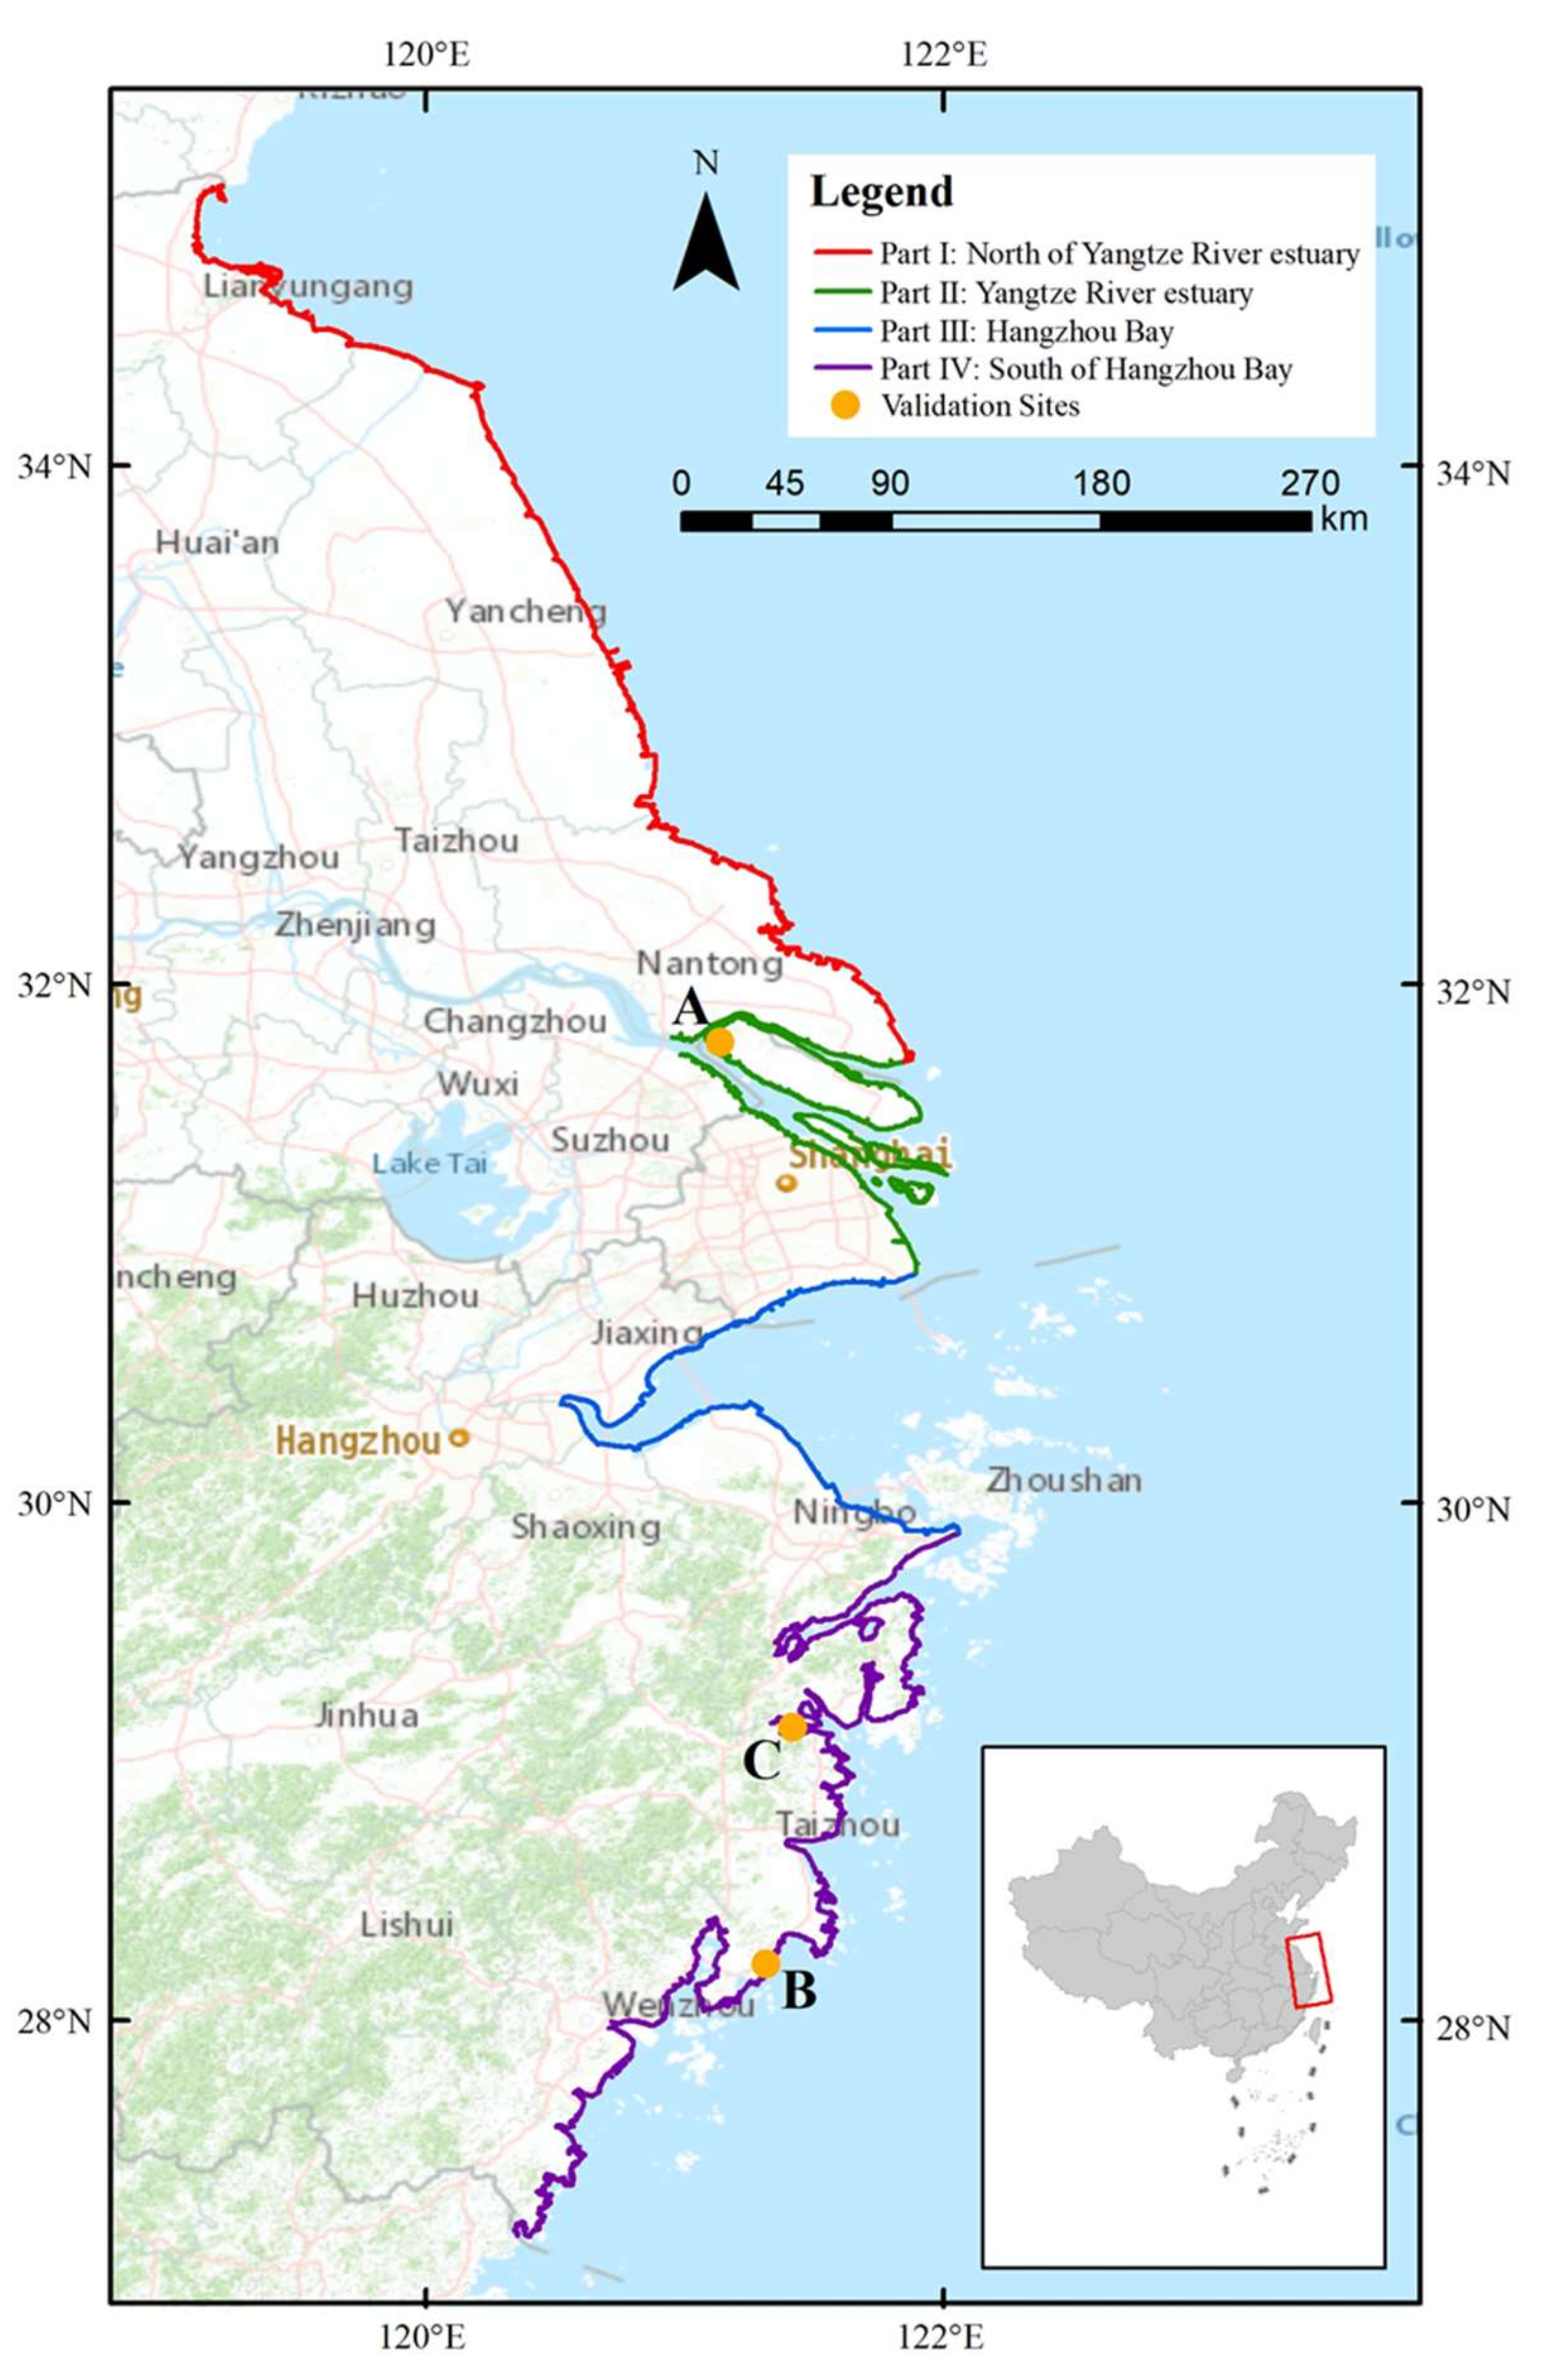
2.1. Study Area

The Yangtze River Delta region includes Jiangsu Province, Shanghai City, and Zhejiang Province. It is one of the most developed area in China, accounting for 24.1% of the nationwide GDP in 2020 [25]. The coastlines of Yangtze River Delta are located between 27.17°N to 35.09°N latitude and 119.19°E to 122.14°E longitude, starting from Lianyungang city, Jiangsu Province to Wenzhou city, Zhejiang Province (Figure 1). Different natural conditions and various human land uses in the Yangtze River Delta region lead to different coastline types from north to south.
To examine Yangtze River Delta coastline changes in both overall and different regions, the study area is divided into four parts based on the natural conditions and artificial development situation [19,26] (Figure 1): Part I: North of Yangtze River estuary area, Part II: Yangtze River estuary area, Part III: Hangzhou Bay area, and Part IV: South of Hangzhou Bay area. Part I, North of Yangtze River is mainly composed of a long muddy coastline, along with small rocky and sandy coastlines. Part II, Yangtze River estuary coastline, consists of riverbank part six islands in the estuary. Yangtze River is the largest river of China. The coastlines of this area are mainly artificial and muddy coastlines, and natural change is mainly controlled by alluvial siltation or erosion of the Yangtze River [26]. Part III, Hangzhou Bay is outside the estuary of the Qiantang River, which is the largest river in Zhejiang Province. Within the area, the coastline is mostly artificial coastline and muddy coastline shaped by the sediment entering the sea at Yangtze River estuary, the strong tides and waves of Hangzhou Bay [27]. Part IV is south of Hangzhou Bay coastline. It has all kinds of coastlines with large amount distributions with rocky and muddy coastlines. Note that shorelines of islands in Zhejiang Province are not included in the study area.

2.2. Remote Sensing Data

The extraction and classification of coastline in the study used Gaofen-1/Ziyuan-3 satellite imagery with a resolution of 2 m in 2013 and 2018. The Gaofen-1 (GF-1) satellite was launched into orbit on 26 April 2013, and then continuously provides remote sensing image sequences with high spatial, spectral, and temporal resolutions. The GF-1 satellite carries a panchromatic/multispectral sensor (PMS, 2 m/8 m) and a multispectral sensor (WFV, 16 m) [22]. Later, GF-2 extended the spatial resolution to 0.8 m. The Ziyuan-3 (ZY-3) satellite was first launched into orbit on 9 January 2012, and started to acquire images from 11 January 2012. The ZY-3 satellite is equipped with four cameras, including a nadir panchromatic camera (TDI CCD, 2.1 m), a forward and a backward panchromatic camera (TDI CCD, 3.5 m), and a nadir multispectral camera (5.8 m) [23]. The images used in the study are 2 m spatial resolution GF-1 or ZY-3 fusion images because panchromatic images after fusion have both high spatial resolution and multispectral features.
Forty-six scenes of GF-1/ZY-3 images were used for coastline extraction in 2013, and fifty-one scenes were used for 2018 (Source: China Center for Resources Satellite Date and Application, http://36.112.130.153:7777/DSSPlatform/productSearch.html, accessed on 28 September 2021). Standard preprocessing of imagery, including geometric rectification, atmospheric rectification and radiation rectification, was performed. Three ZY-3 5.8 m or GF-1 8 m multispectral images were used to substitute the 2 m images with high clouds for extraction. One scene of Sentinel-2 image of 10 m spatial resolution was used to extract and classify the coastline of the northern part of Shanghai in 2018 due to the absence of GF-1 and ZY-3 images.

2.3. The Classification System of Coastlines

A classification system is needed to determine the coastline type of the study area. In this study, the classification system of coastline types is set up with basic coastline types and coastal zone land use classification systems as references [28]. The coastline consists of natural and artificial coastlines in the study area. Natural coastlines are divided into rocky coastlines, sandy coastlines, and muddy coastlines according to the composition of the shore material. Artificial coastline types are set up based on the usage of coastlines, coastal zone land use situations and previous studies [18,19,29], including 7 types: protection coastlines, farmland coastlines, salt pan coastlines, aquaculture coastlines, urban and industry coastlines, port coastlines, and reclamation coastlines. Detailed interpretation and classification standards of the coastline are shown in Table 1.

2.4. The Coastline Extraction Method

Coastline extraction includes the following three steps: (1) calculating Normalized Difference Water Index (NDWI) of the study area in 2013 and 2018 based on GF-1/ZY-3 images. (2) Selecting an NDWI threshold for each image to discriminate water and non-water. (3) Extracting coastline and postprocessing.
Several water indices, such as Normalized Difference Water Index (NDWI) [24], Modified Normalized Difference Water Index (MNDWI) [30] and Automated Water Extraction Index (AWEI) [31], have been developed for water/non-water detection. In this study, we chose NDWI to discriminate between water and non-water pixels because it is easy to use and requires no training data. NDWI has been successfully applied in coastline extraction in previous studies [13,17]. NDWI is calculated using the following equation.
NDWI = Green NIR / Green + NIR
where Green and NIR are the visible green and near infrared (NIR) bands, respectively. In ZY-3/GF-1 satellite imagery, Band 2 (Green) and Band 4 (NIR) were used [24]. Water bodies have low reflection in the near-infrared and mid-infrared wavelength ranges, while the reflectance of vegetation in the near-infrared band is generally the strongest. Therefore, the NDWI calculation using the Green band and NIR band can enhance the contrast between vegetation part and waterbody in the image [24]. In the calculation result, pixels with positive NDWI values indicate water, and negative values indicate a non-water or land surface.
The land–water threshold of NDWI is not a fixed value and usually varies with images [32]. Manual determination or adjustment of the threshold on each image is often performed [33]. In this study, a histogram distribution of NDWI values was first constructed after NDWI calculation for each image, and an appropriate threshold was determined according to the histogram. Particularly, by observing the histogram, usually a value near zero at the bottom of a histogram between two peaks that represent water and land was identified first. Then, a threshold of each image was adjusted according to visual interpretation with a standard (Table 1) to distinguish water and land as correctly as possible.
As tidal variation at the observation time of the used images would influence the derived coastlines, the standard was made with consideration of tidal variation impact. The tidal level varies over time, and the derived coastline depends on the observation time of the images used. DEM data and tidal level data are usually used to reduce the deviation of tides by horizontally adjusting the extracted coastline according to tidal level data and the surface slope acquired from DEM data [17]. However, for the high-resolution image (2 m) in our study, this method is not practical due to the lack of a high-resolution DEM.
In our study, we set specific ground standards (listed in Table 1) to locate the coastline and reduce tidal variation for natural coastlines. For example, on a muddy coastline, vegetation below the mean high tide level is more frequently submerged by the sea, leading to much lower vegetation density [1]. Therefore, muddy coastlines are located at a significant difference between abundant vegetation and sparse vegetation. For artificial coastlines, we took the instant waterline extracted from images as the coastline simply because we think tide variation has less impact on artificial coastlines due to the form and size of artificial constructions. For example, the protective constructions outside most artificial coastlines have a relatively small range influenced by tides. When multiple coastline types occur in one image, multiple thresholds were selected accordingly based on the corresponding coastline interpretation standards in Table 1. In high resolution imagery, differences between various coastline types can be figured out more easily, and also specific ground marks for different coastline types. Therefore, this method is adaptive to complicated coastline type distribution and more applicable for the study area.
After the extraction with a threshold for each image, extracted lines on each image need to be merged. Each two images have an overlap between them, on which two lines would intersect with each other. A proper intersect point is selected to be the connection point of two line parts. The whole coastline of one year is then connected one by one and finally assembled. After the merge, extracted coastlines were labeled as its type based on visual interpretation according to the interpretation and classification standard in Table 1. Thus, the coastline of the Yangtze River Delta with coastline type classification is generated. The extraction results and all the following calculations were performed under a projected coordinate system of ‘New Beijing 3 Degree Gauss Kruger CM 120E’.

2.5. Coastline Change Analysis

Based on the extracted coastlines, we calculated the change in coastline length, and the progradation and recession of coastal areas between 2013 and 2018 as follows. Changes in length were classified and plotted according to the study area division of four parts or coastline type classification. Change rates of coastline length were calculated by dividing the difference between the length of 2018 and 2013 by the length of 2013. Area changes in the coastal zone were calculated for each part of the Yangtze River Delta by calculating intersected areas between coastlines of 2013 and 2018. One intersection area is taken as a recession area when it is within the land area of 2013; otherwise, it is taken as a progradation area.

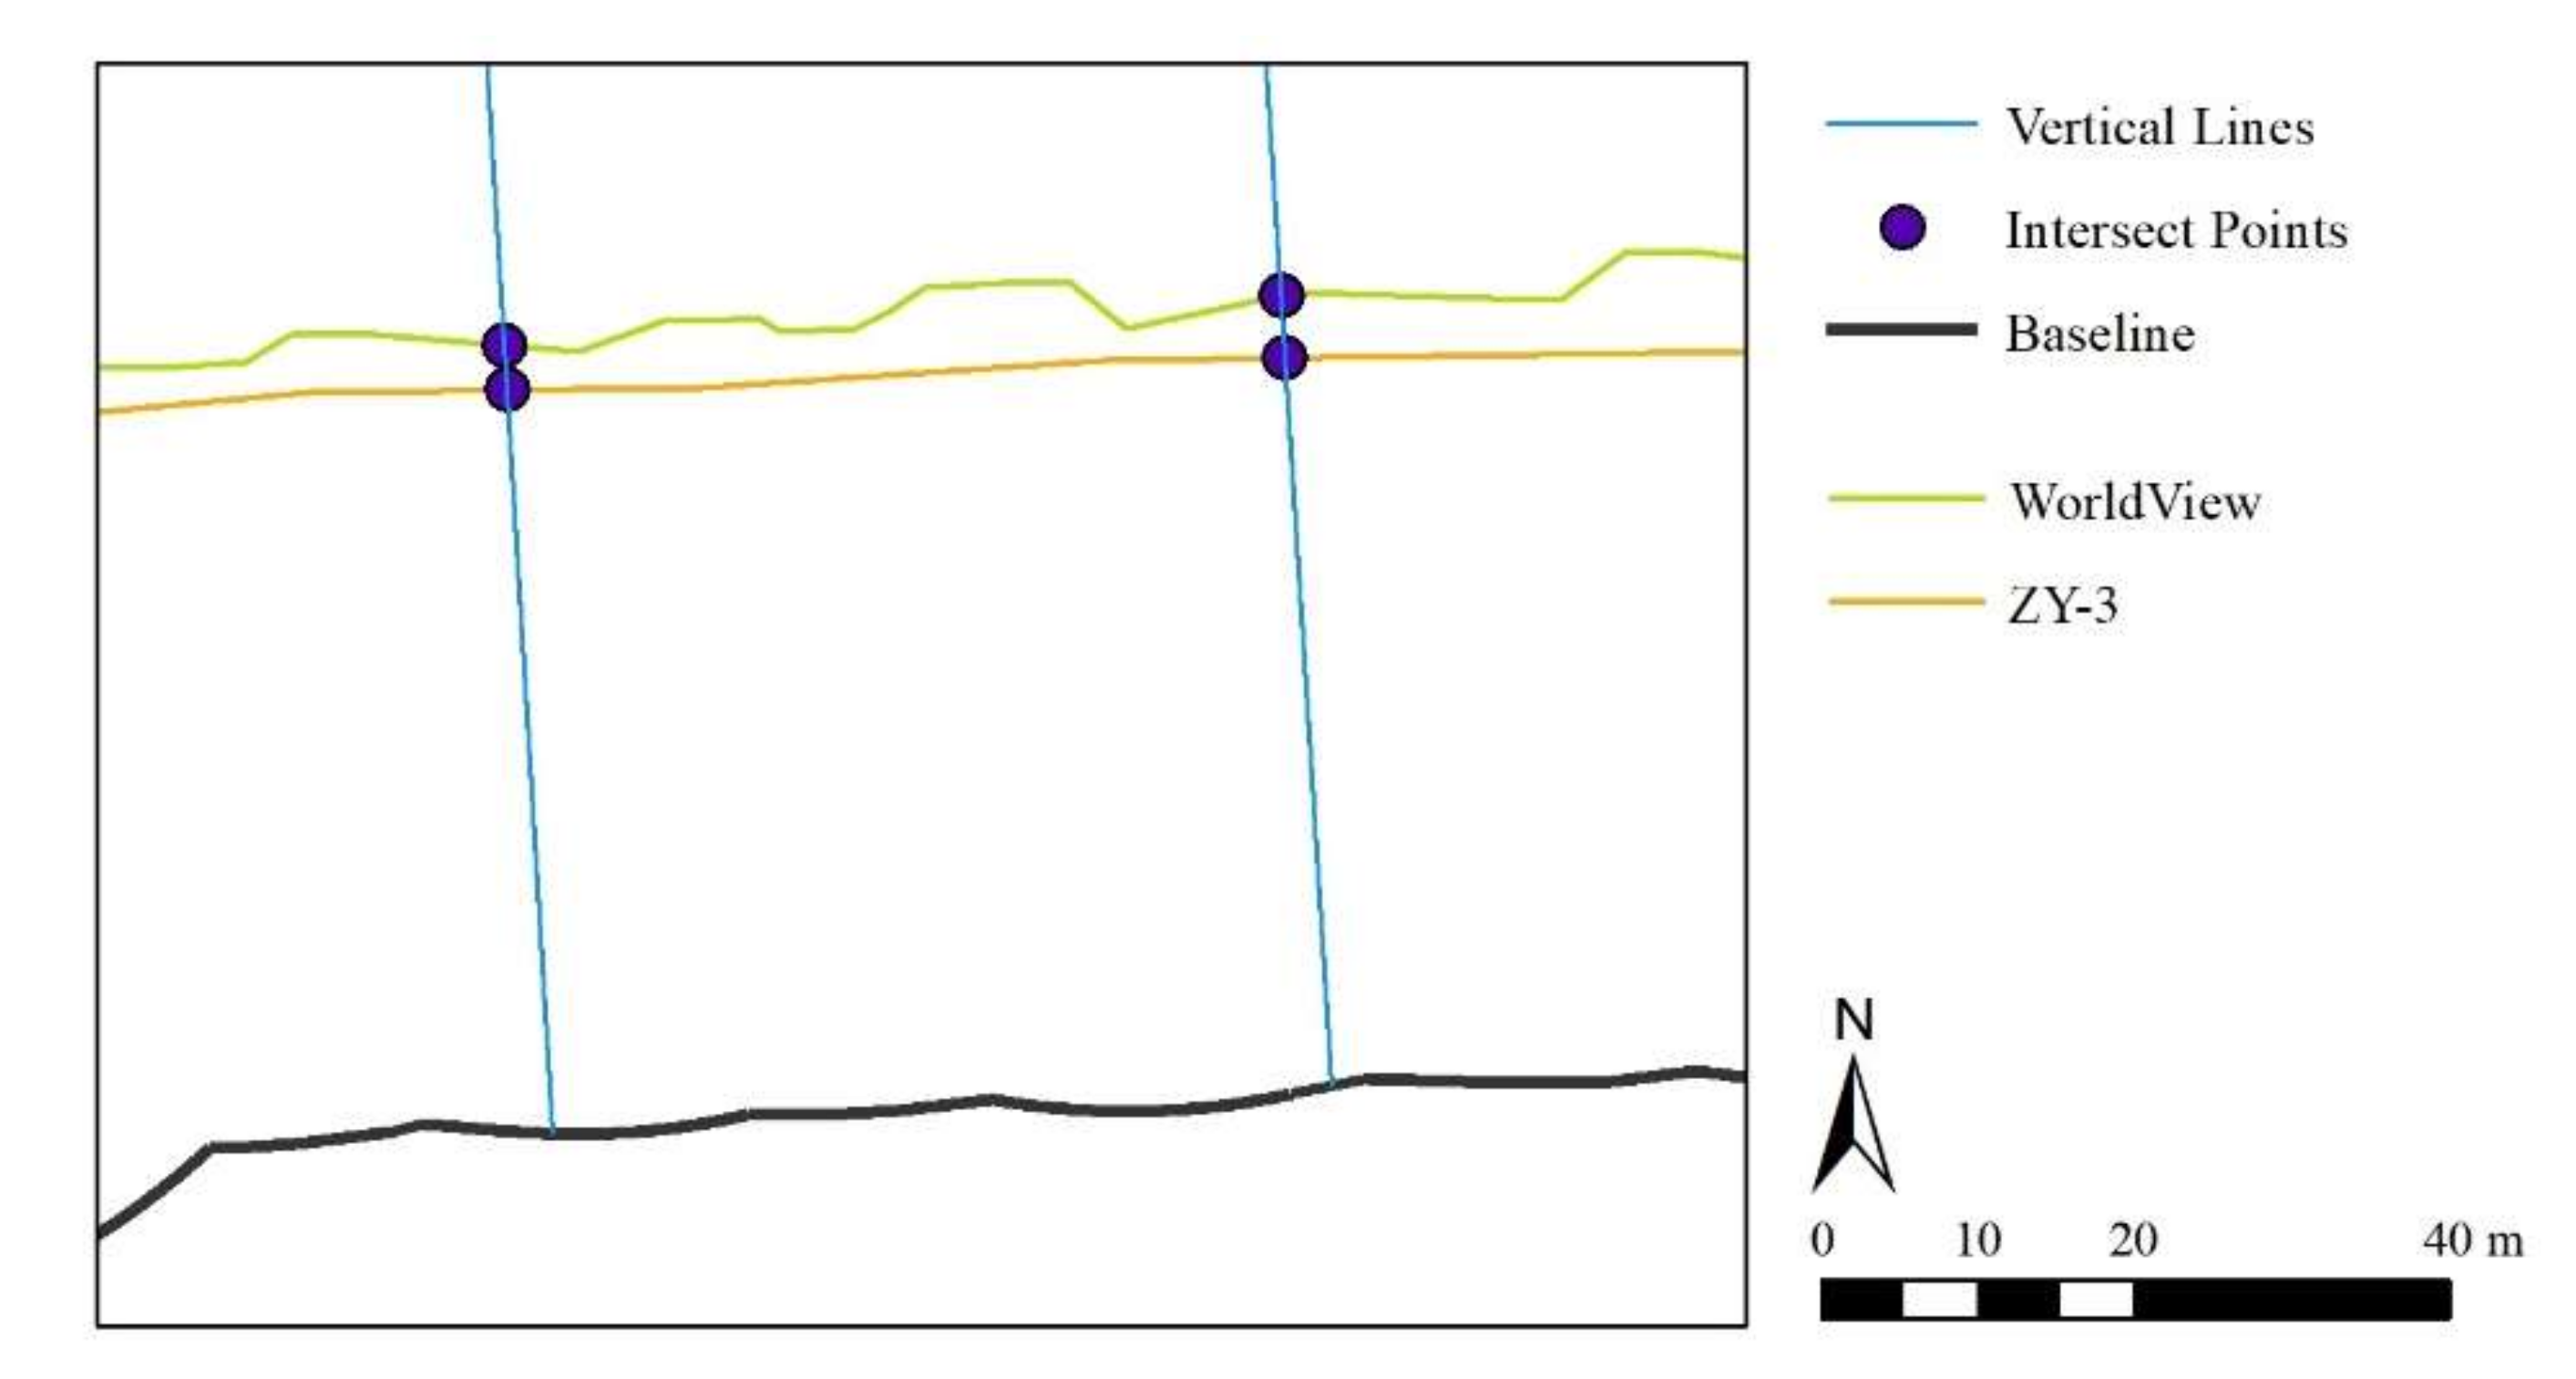
2.6. Accuracy Validation of the Coastline Extraction

To calculate the accuracy, the deviation between the extracted coastlines was calculated using DSAS (Digital Shoreline Analysis System) module in ArcGIS software. The DSAS module was originally used for calculating coastline changing rates [34]. In this method, coastlines derived from Worldview-2 by visual interpretation are used as ground truth. The WorldView-2 with a higher resolution (0.5 m) than GF is acceptable to evaluate the accuracy of coastline extraction. Visual interpretation on satellite images is also often used to substitute field investigation, for example Jin et al. (2021) [35]. Worldview imagery has already been merged in Google Earth Pro, and each validation site of our study is within a single image of ZY-3. Baselines are created by setting a buffer zone with proper distance from the ground truth. The boundary of one side of the buffer zone is selected as the baseline to ensure that all coastline results to be compared are on the same side of the boundary. Then, equidistant lines are created vertically to the baseline, which is roughly parallel to the coastline. The interval between each vertical line is 50 m. Each vertical line intersects with the extraction results and thus has intersection points. The deviation between different extracted coastlines can be measured by the distance between intersect points on different extraction results (Figure 2).
Two statistical parameters, mean absolute deviation and standard deviation, were then calculated based on the deviation data acquired from DSAS module. The mean absolute deviation was calculated by adding the absolute value of deviation on each vertical line together and then dividing the sum by the number of vertical lines. Three validation sites (Figure 1, Table 2) that cover artificial coastlines and main natural coastlines were selected to perform accuracy validation. Lengths of coastlines at validation sites accounts for 1.01% of total length, which is not large, but is representative enough as samples.

3. Results

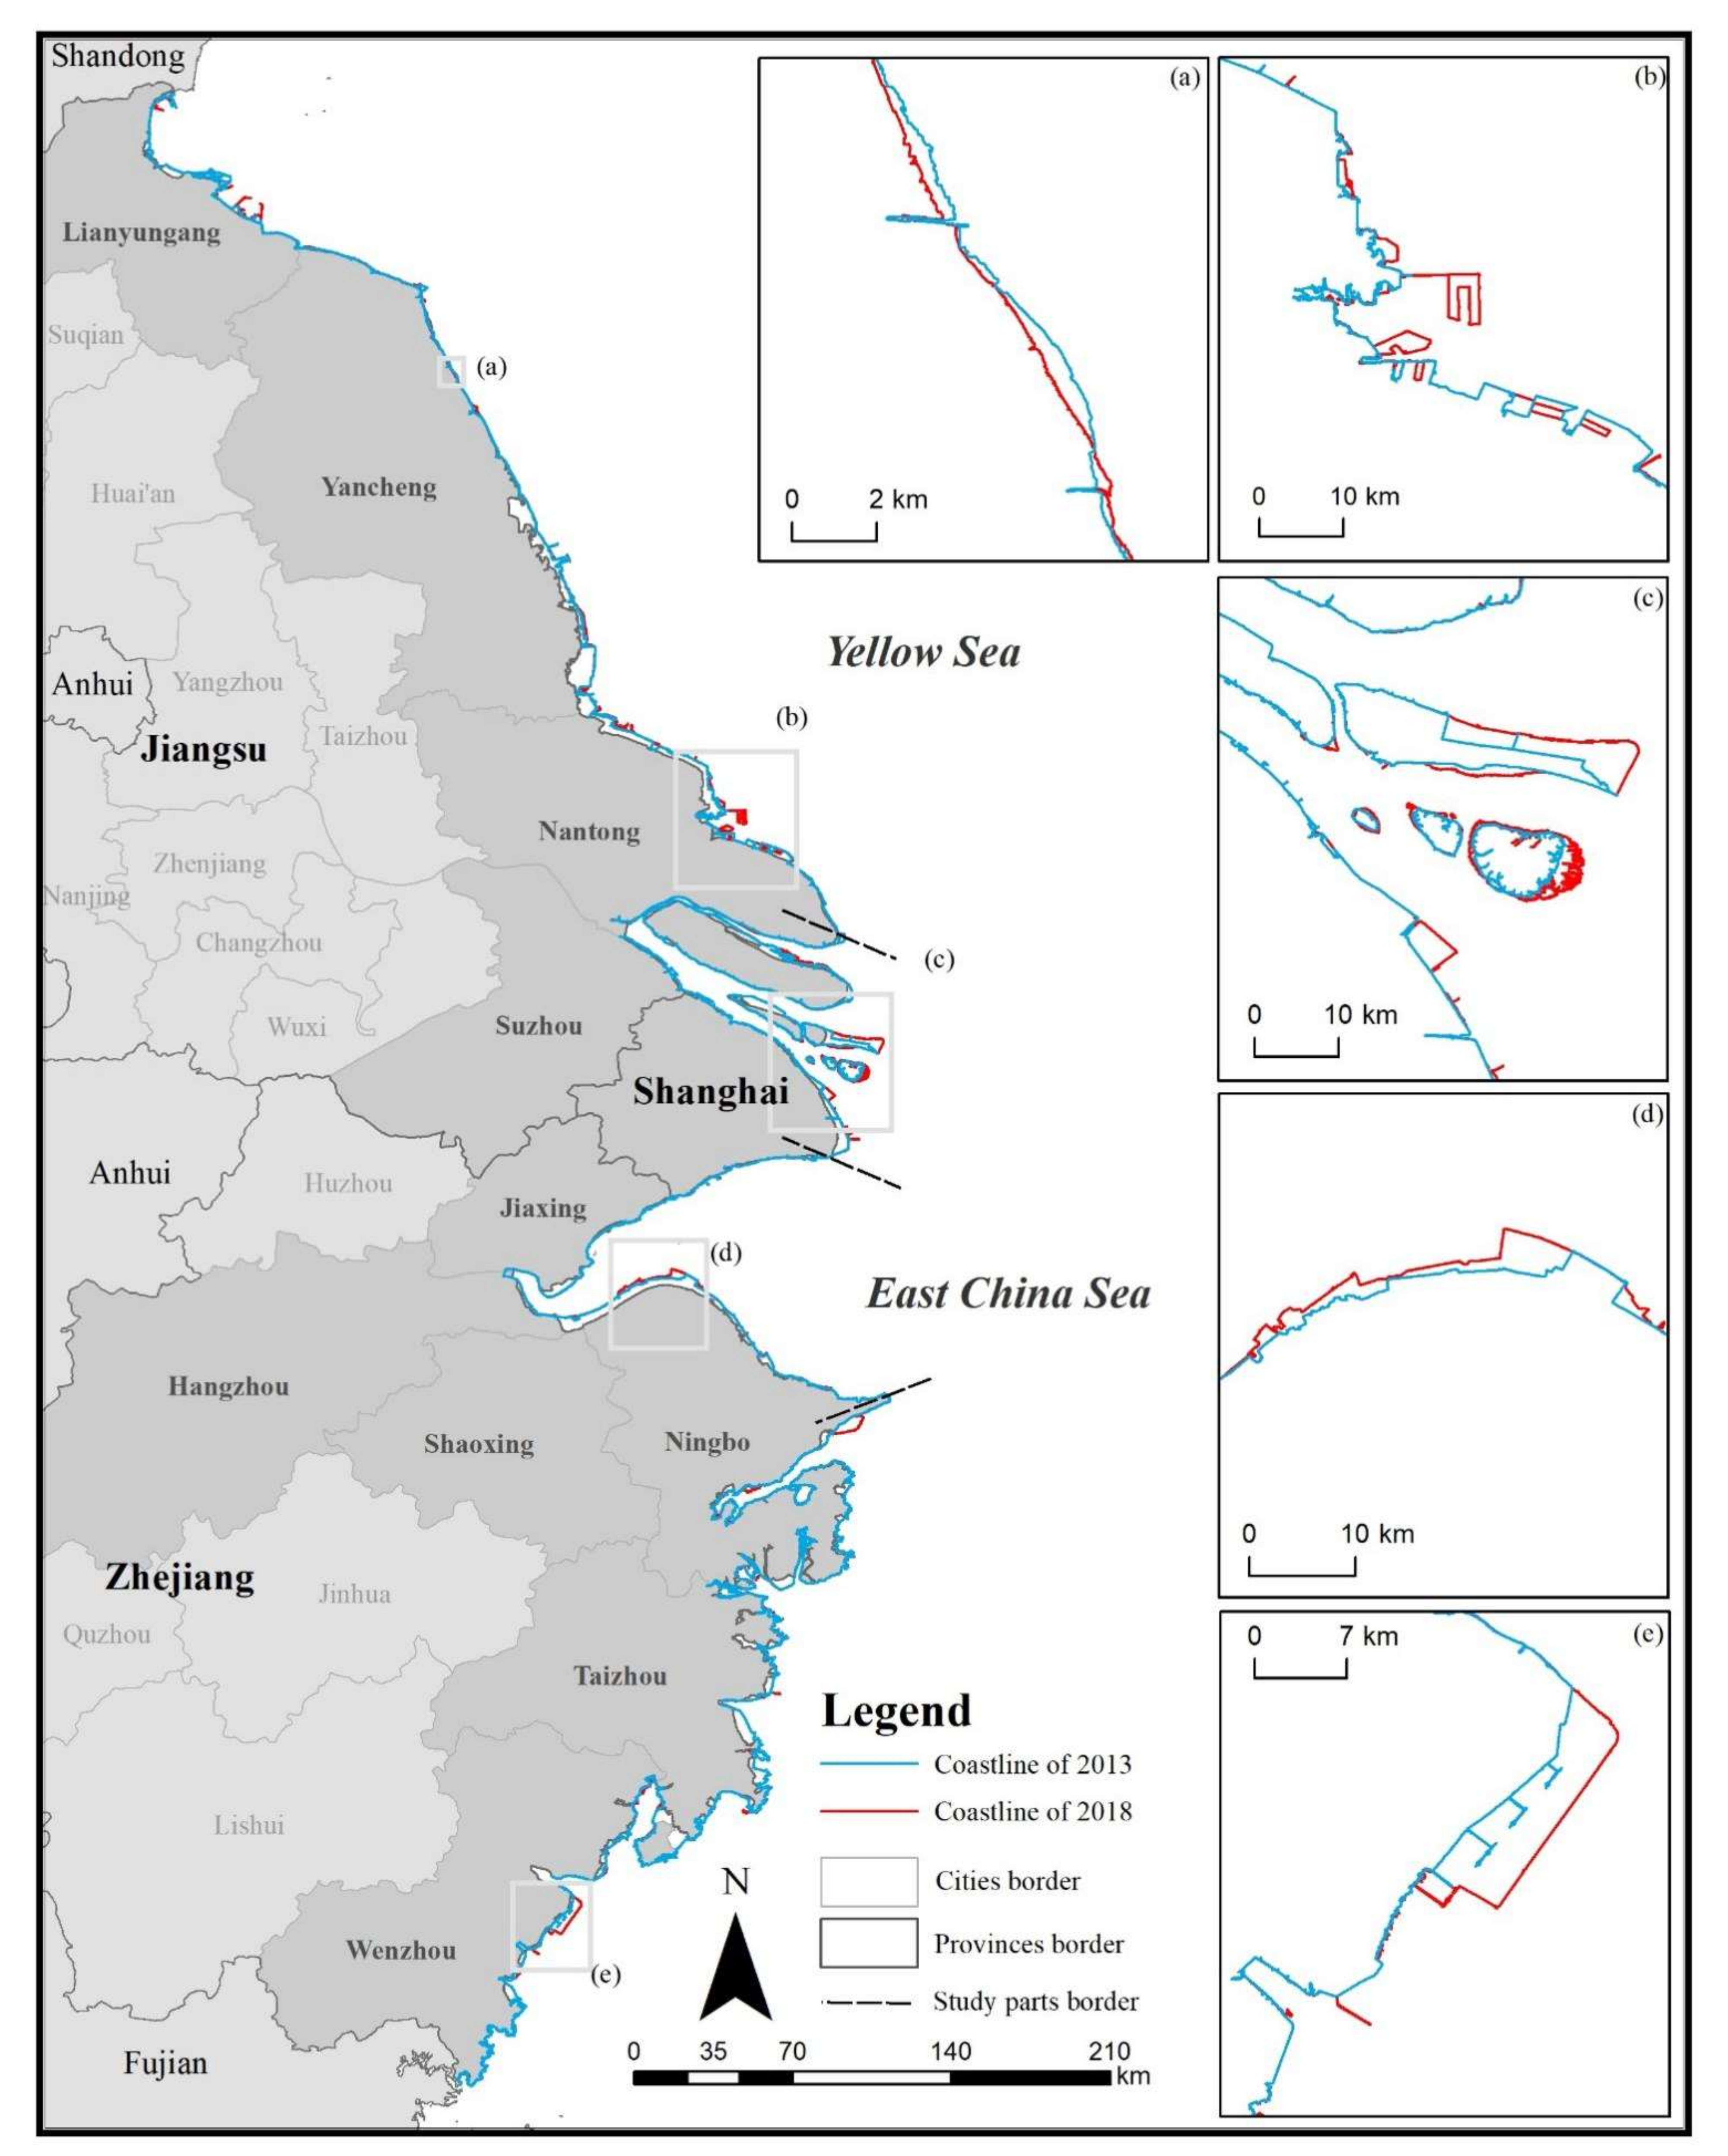
3.1. The Extracted Coastlines in 2013 and 2018

The extracted coastlines of Yangtze River Delta in 2013 and 2018 are shown in Figure 3. The lengths of the whole coastline and the four parts in 2013 and 2018 are shown in Table 3. The total length of the coastline experienced an increase of 70.94 km (1.33%). The natural coastlines decreased 33.21 km, while the artificial coastline increased 104.15 km from 2013 to 2018. The small figures (a–e) in Figure 3 illustrate some typical coastline changes, including port construction, reclamation and silt accretion. Among the four parts, Hangzhou Bay has the shortest coastline. South of Hangzhou Bay has the longest coastline of the four parts but is the only part with a decline in length of 114.55 km (5.44%). The coastline of Yangtze River estuary, which is composed of both continental and island coastlines, has a small latitudinal span but considerable length with an increase of 67.63 km (5.08%) within 5 years. The length of North of Yangtze River estuary part increased 113 km (8.41%). Results show that the coastlines of the four parts changed greatly even within five years. All parts increased in length except south of Hangzhou Bay.
The length chart of different coastline types in Yangtze River Delta and its four parts in 2013 and 2018 is shown in Figure 4. Generally, artificial coastlines are larger than natural coastlines in the whole study area and each part. The distribution of different coastline types varies in different parts of Yangtze River Delta. Muddy coastline is the main natural coastline type occupying more than 90% of natural coastlines in part I, II, and III. Only in part IV is rocky coastline the main natural coastline type, followed by muddy coastline. The artificial coastline distribution has many more differences in each part. Coastline distribution differences indicate different industry emphases of each part. Part III had the highest proportion of port coastline (28%, 133.73 km) and a high proportion of urban and industrial coastline (14%, 68.75 km) in 2013. Part I, III, and IV have long aquaculture coastline as a reflection of traditional aquaculture in coastal areas.
For the change from 2013 to 2018, muddy coastline increases in all parts, with the largest growth in Part III at 17.16 km. Rocky coastline mainly in Part IV experienced a large decrease of 53.62 km. Changes in artificial coastlines vary in different parts. While the distribution of artificial coastline reflects the economic development diversity of different regions, changes in different types of artificial coastlines represent regional industry development trends. For example, port coastline in all parts increased differently, which indicates the developing international trade of Yangtze River Delta coastal provinces. Among them, the outstanding growth of Part I represents mass investment in port development in Jiangsu Province.

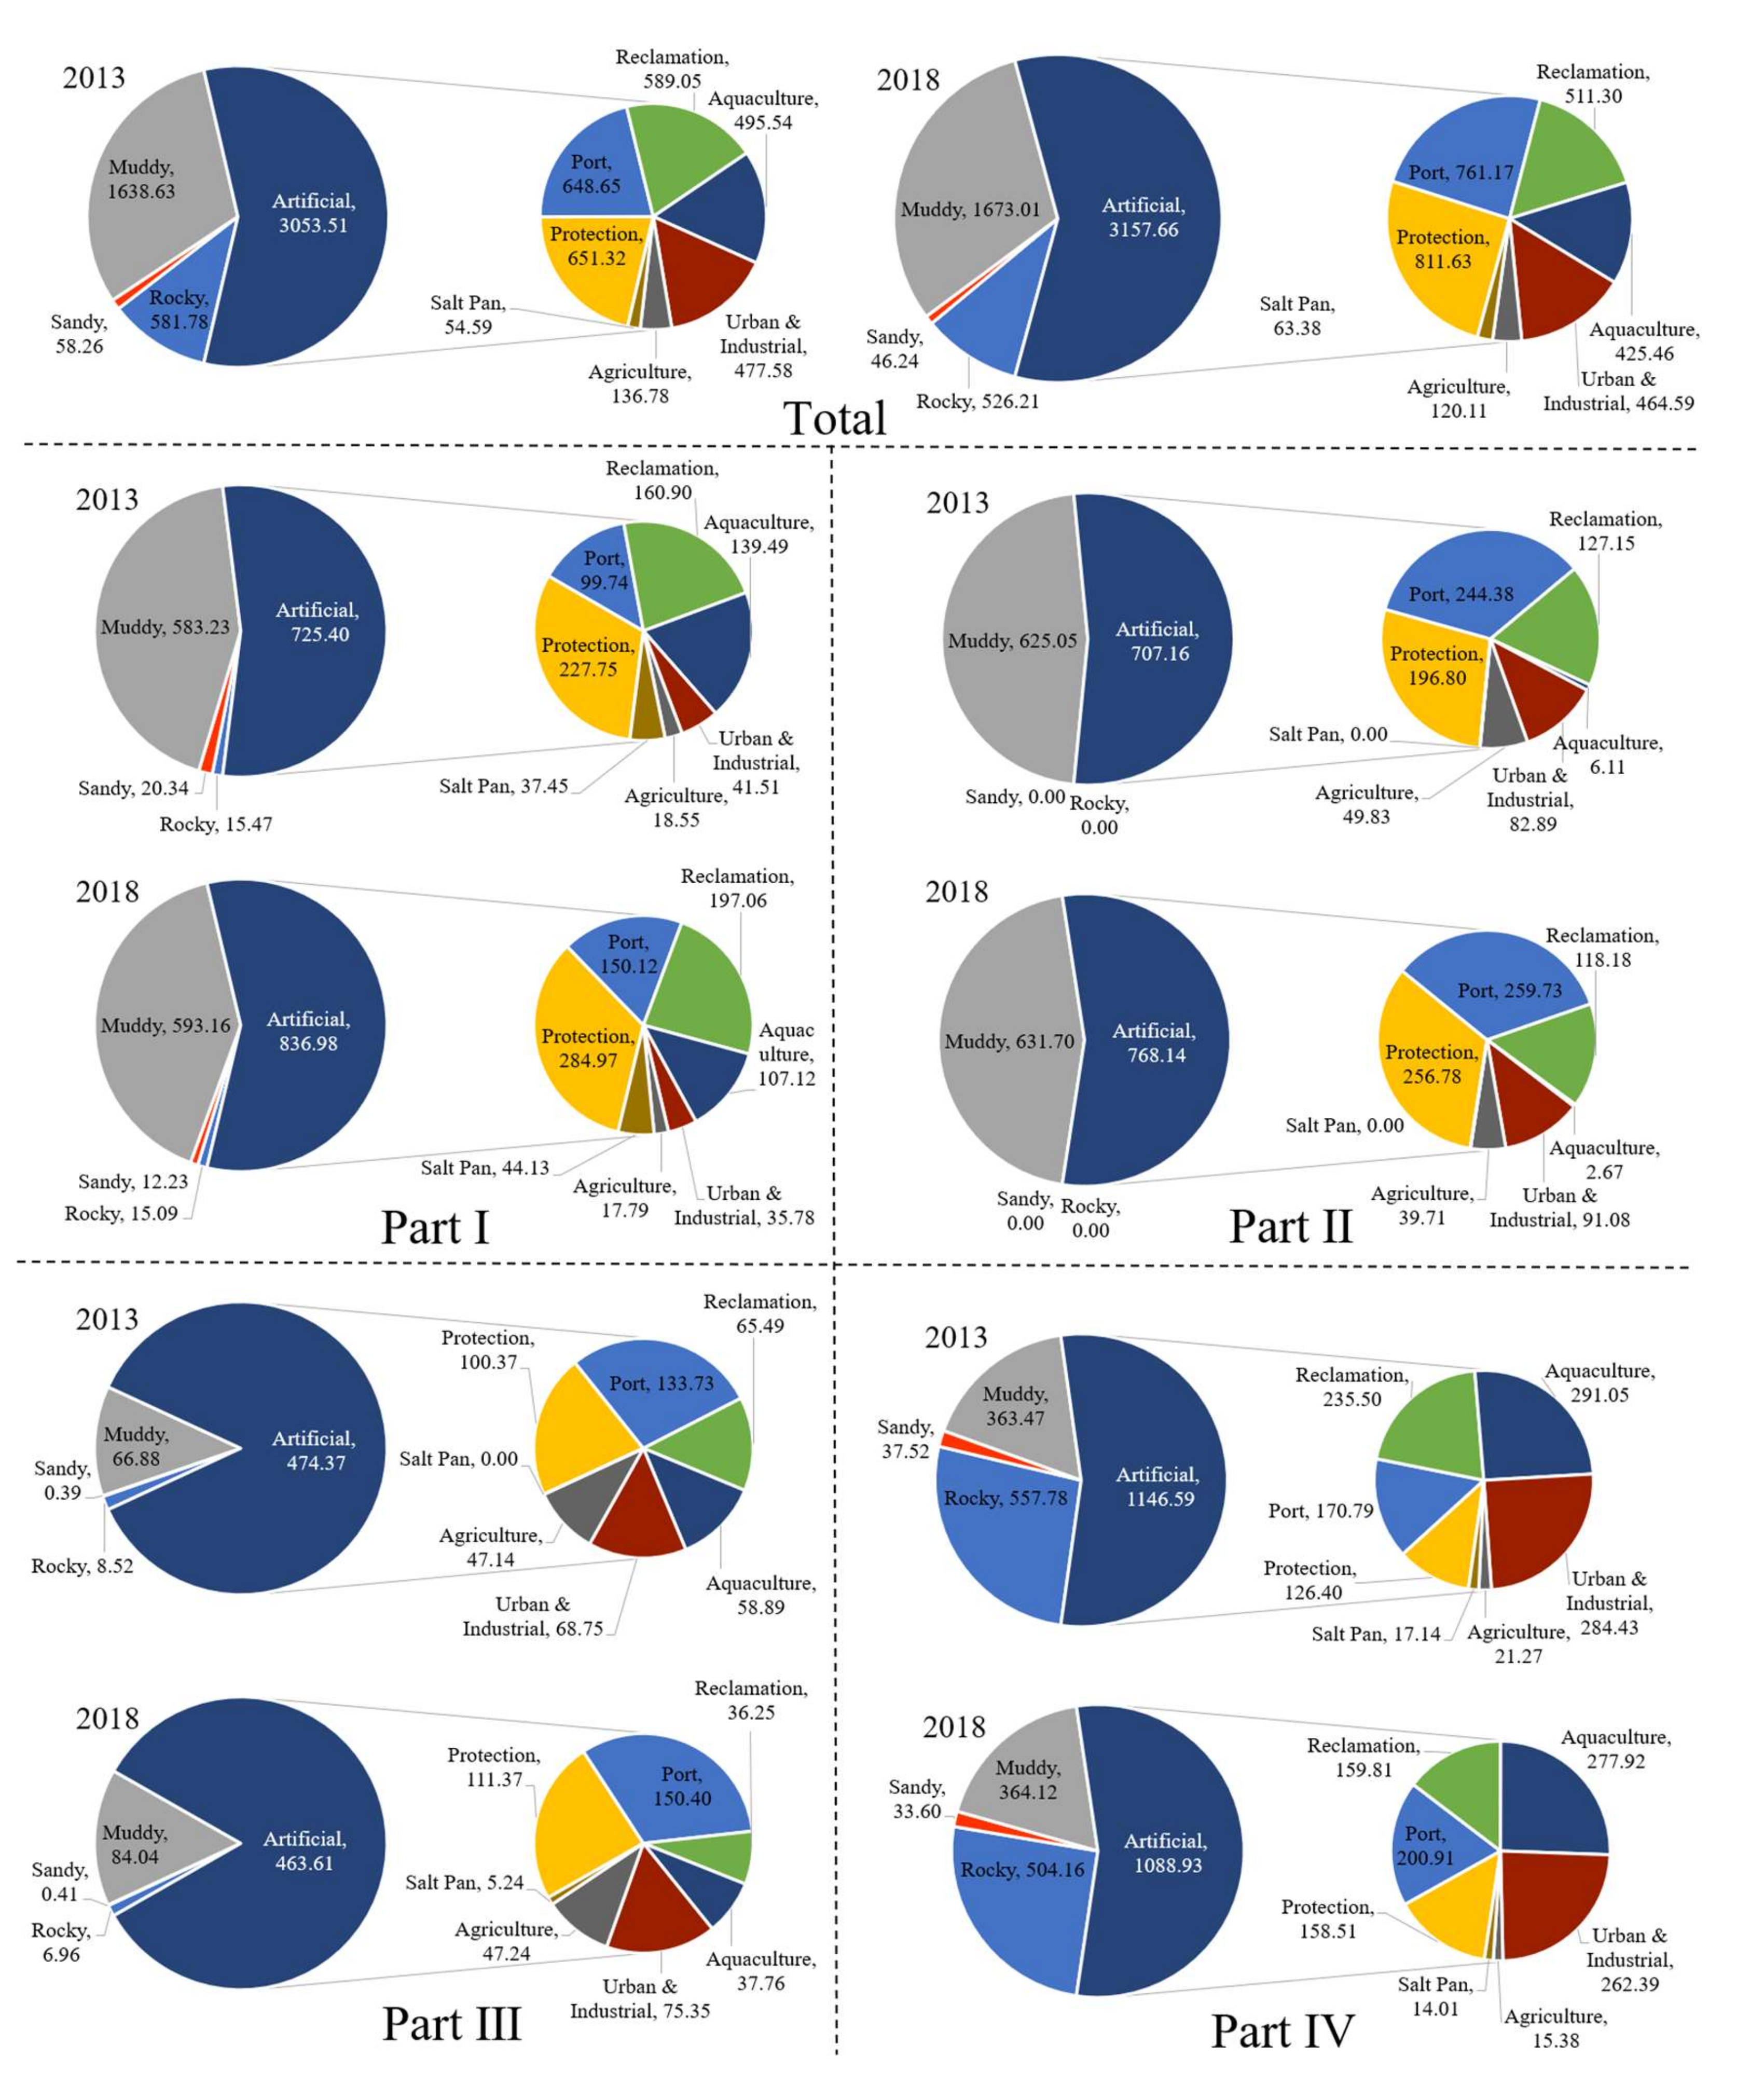
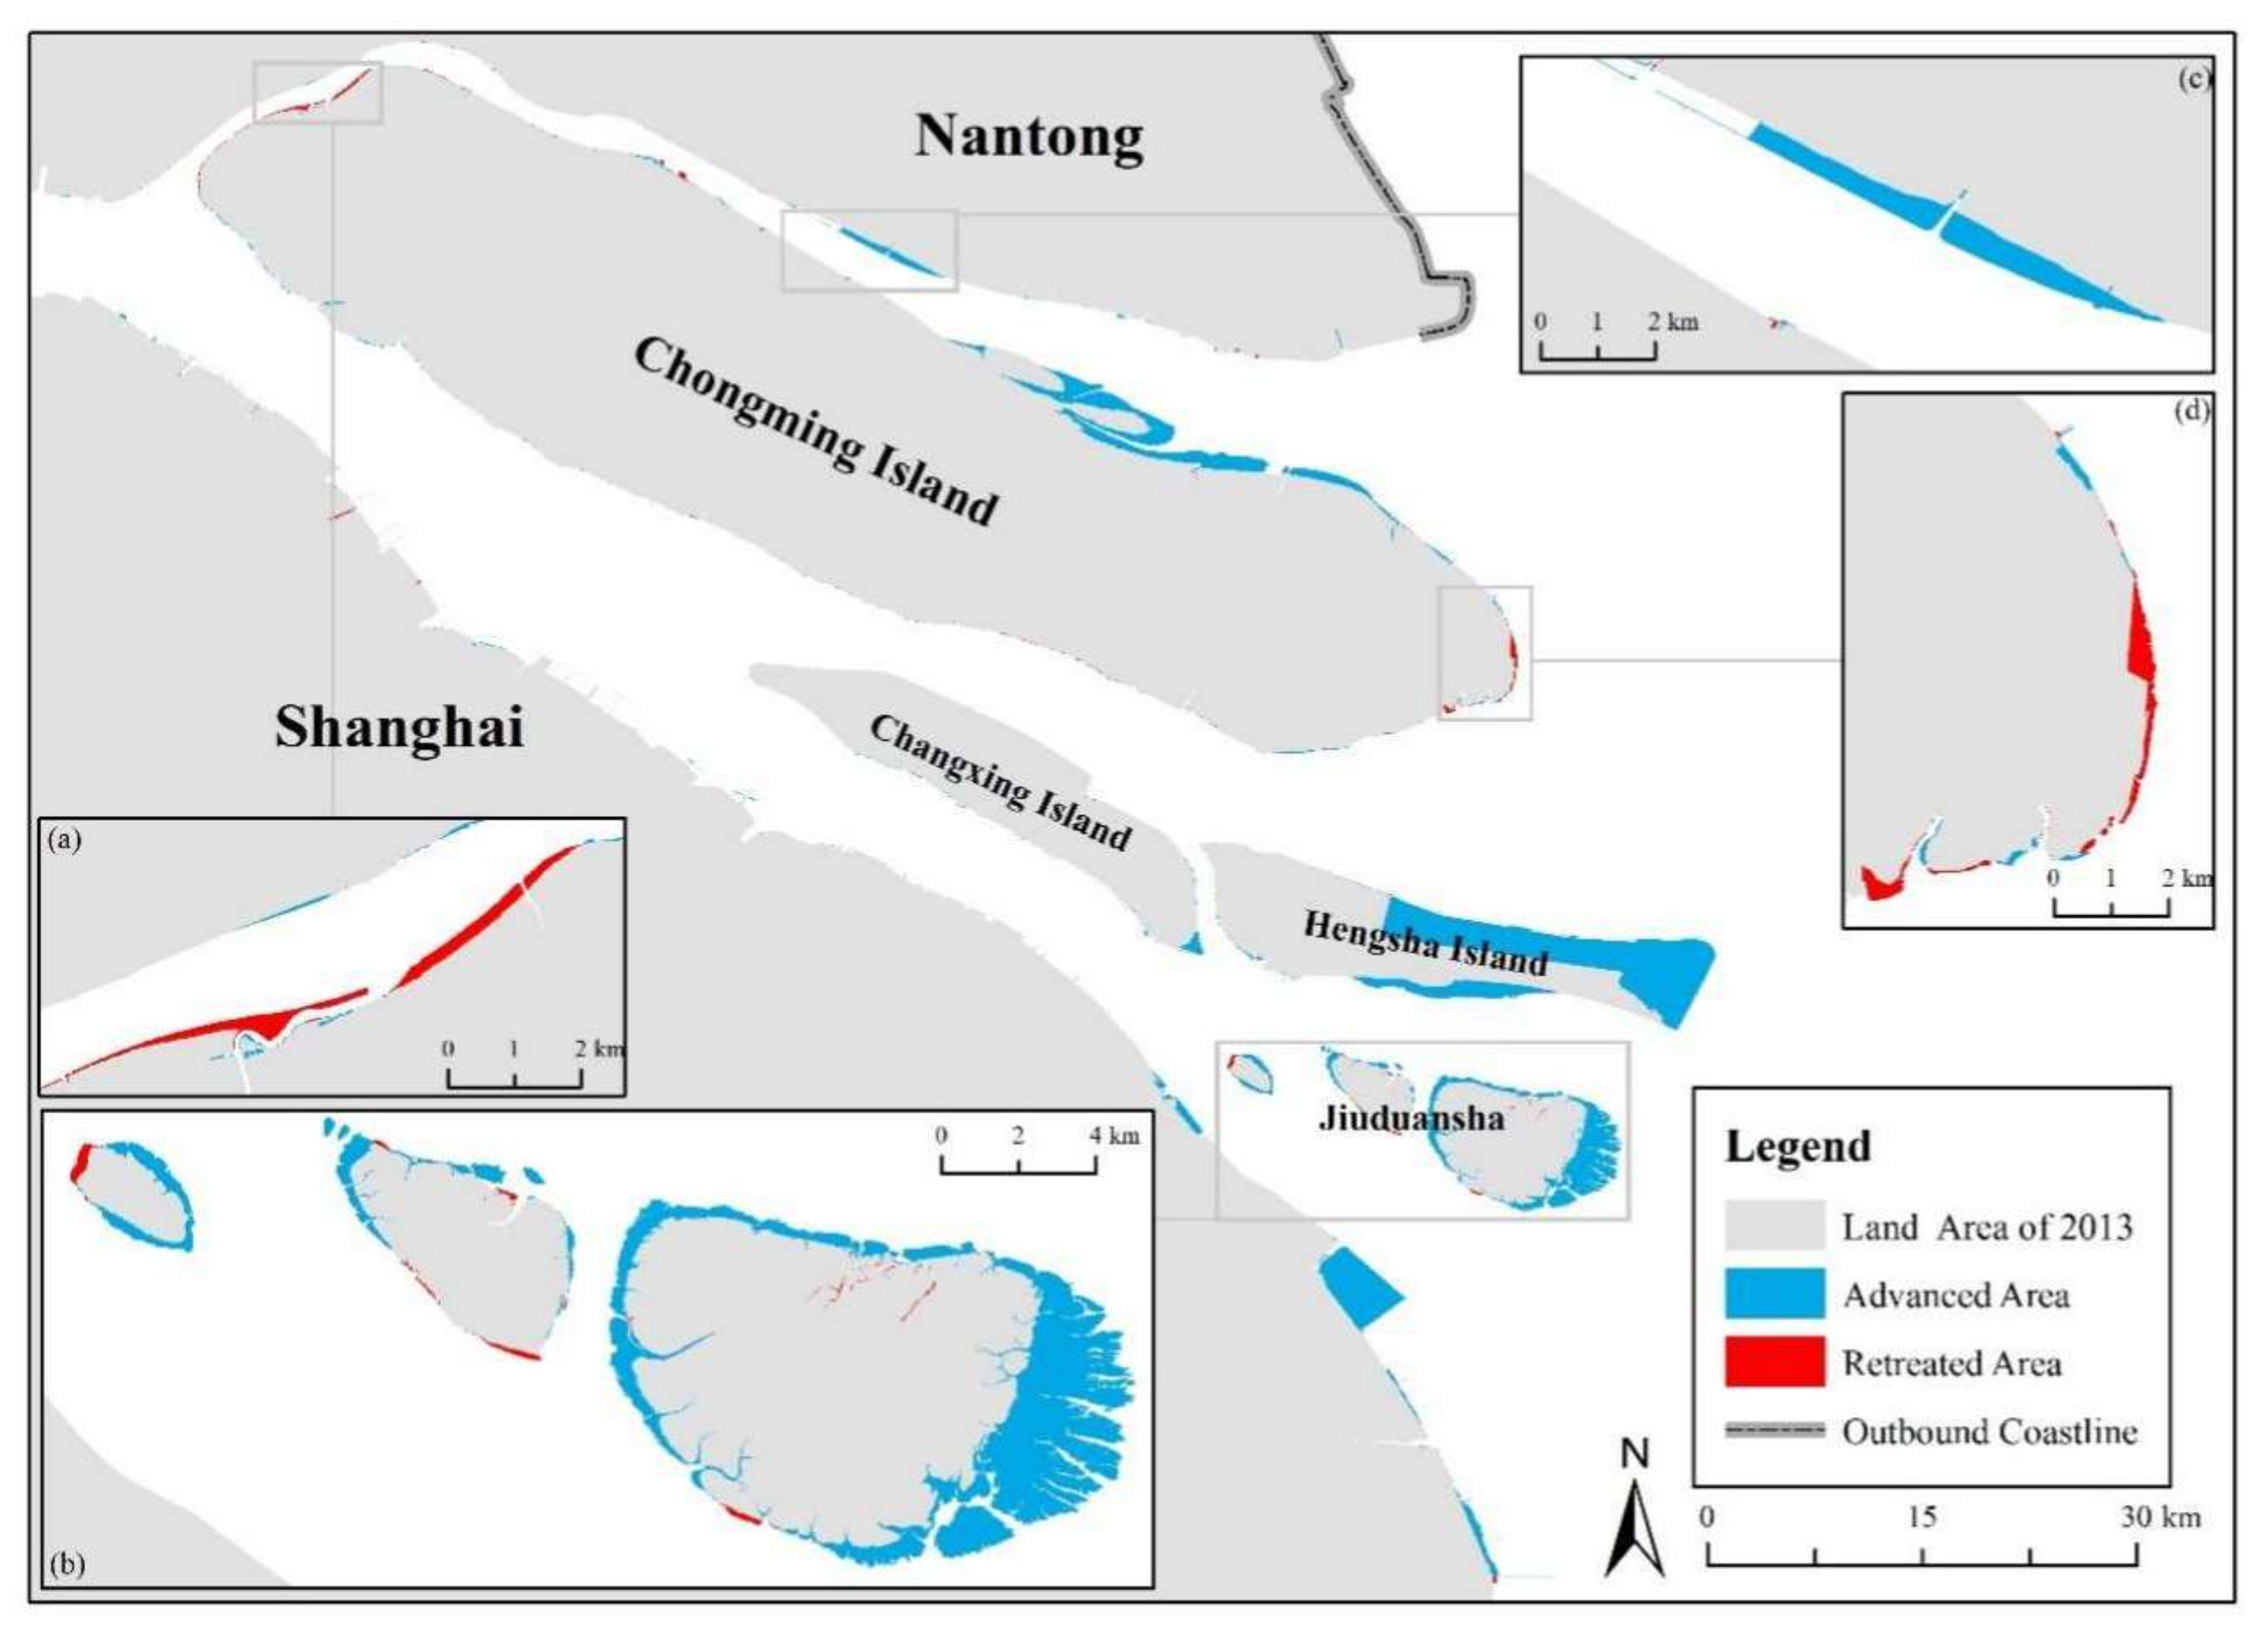
3.2. Coastal Area Changes

The progradation and recession areas along coastlines within the five years are shown in Table 4. From Table 4, we can see that each part of the Yangtze River Delta has far more progradation area than recession area. The coastline in the north of the Yangtze River estuary retreated the most among the four parts, while in the south of Hangzhou Bay, the coastline progressed the most.
The Yangtze River estuary is the central area of Yangtze River Delta and has complex changes in the natural environment and artificial construction; thus, it is a widely studied area in ecology, environment and economic and social development [1]. Therefore, we illustrate the changes in the Yangtze River estuary from 2013 to 2018 (Figure 5) as an example to show natural forces, artificial constructions and their interactions on coastline change. The whole part has the tendency of expansion towards east and sea. The main silt accretion locations are in north-east of Chongming Island and in Jiuduansha Wetland National Nature Reserve (Figure 5b). Land reclamation construction at the eastern end of Hengsha Island increased the area of Hengsha Island by 54.28 km2. The coastal zone of the Pudong New Area also has a large scale of finished or ongoing land reclamation construction. In addition, artificial construction influenced slit accretion in the estuary, which is typical outside Dongtan Wetland Park at the eastern end of Chongming Island (Figure 5d).

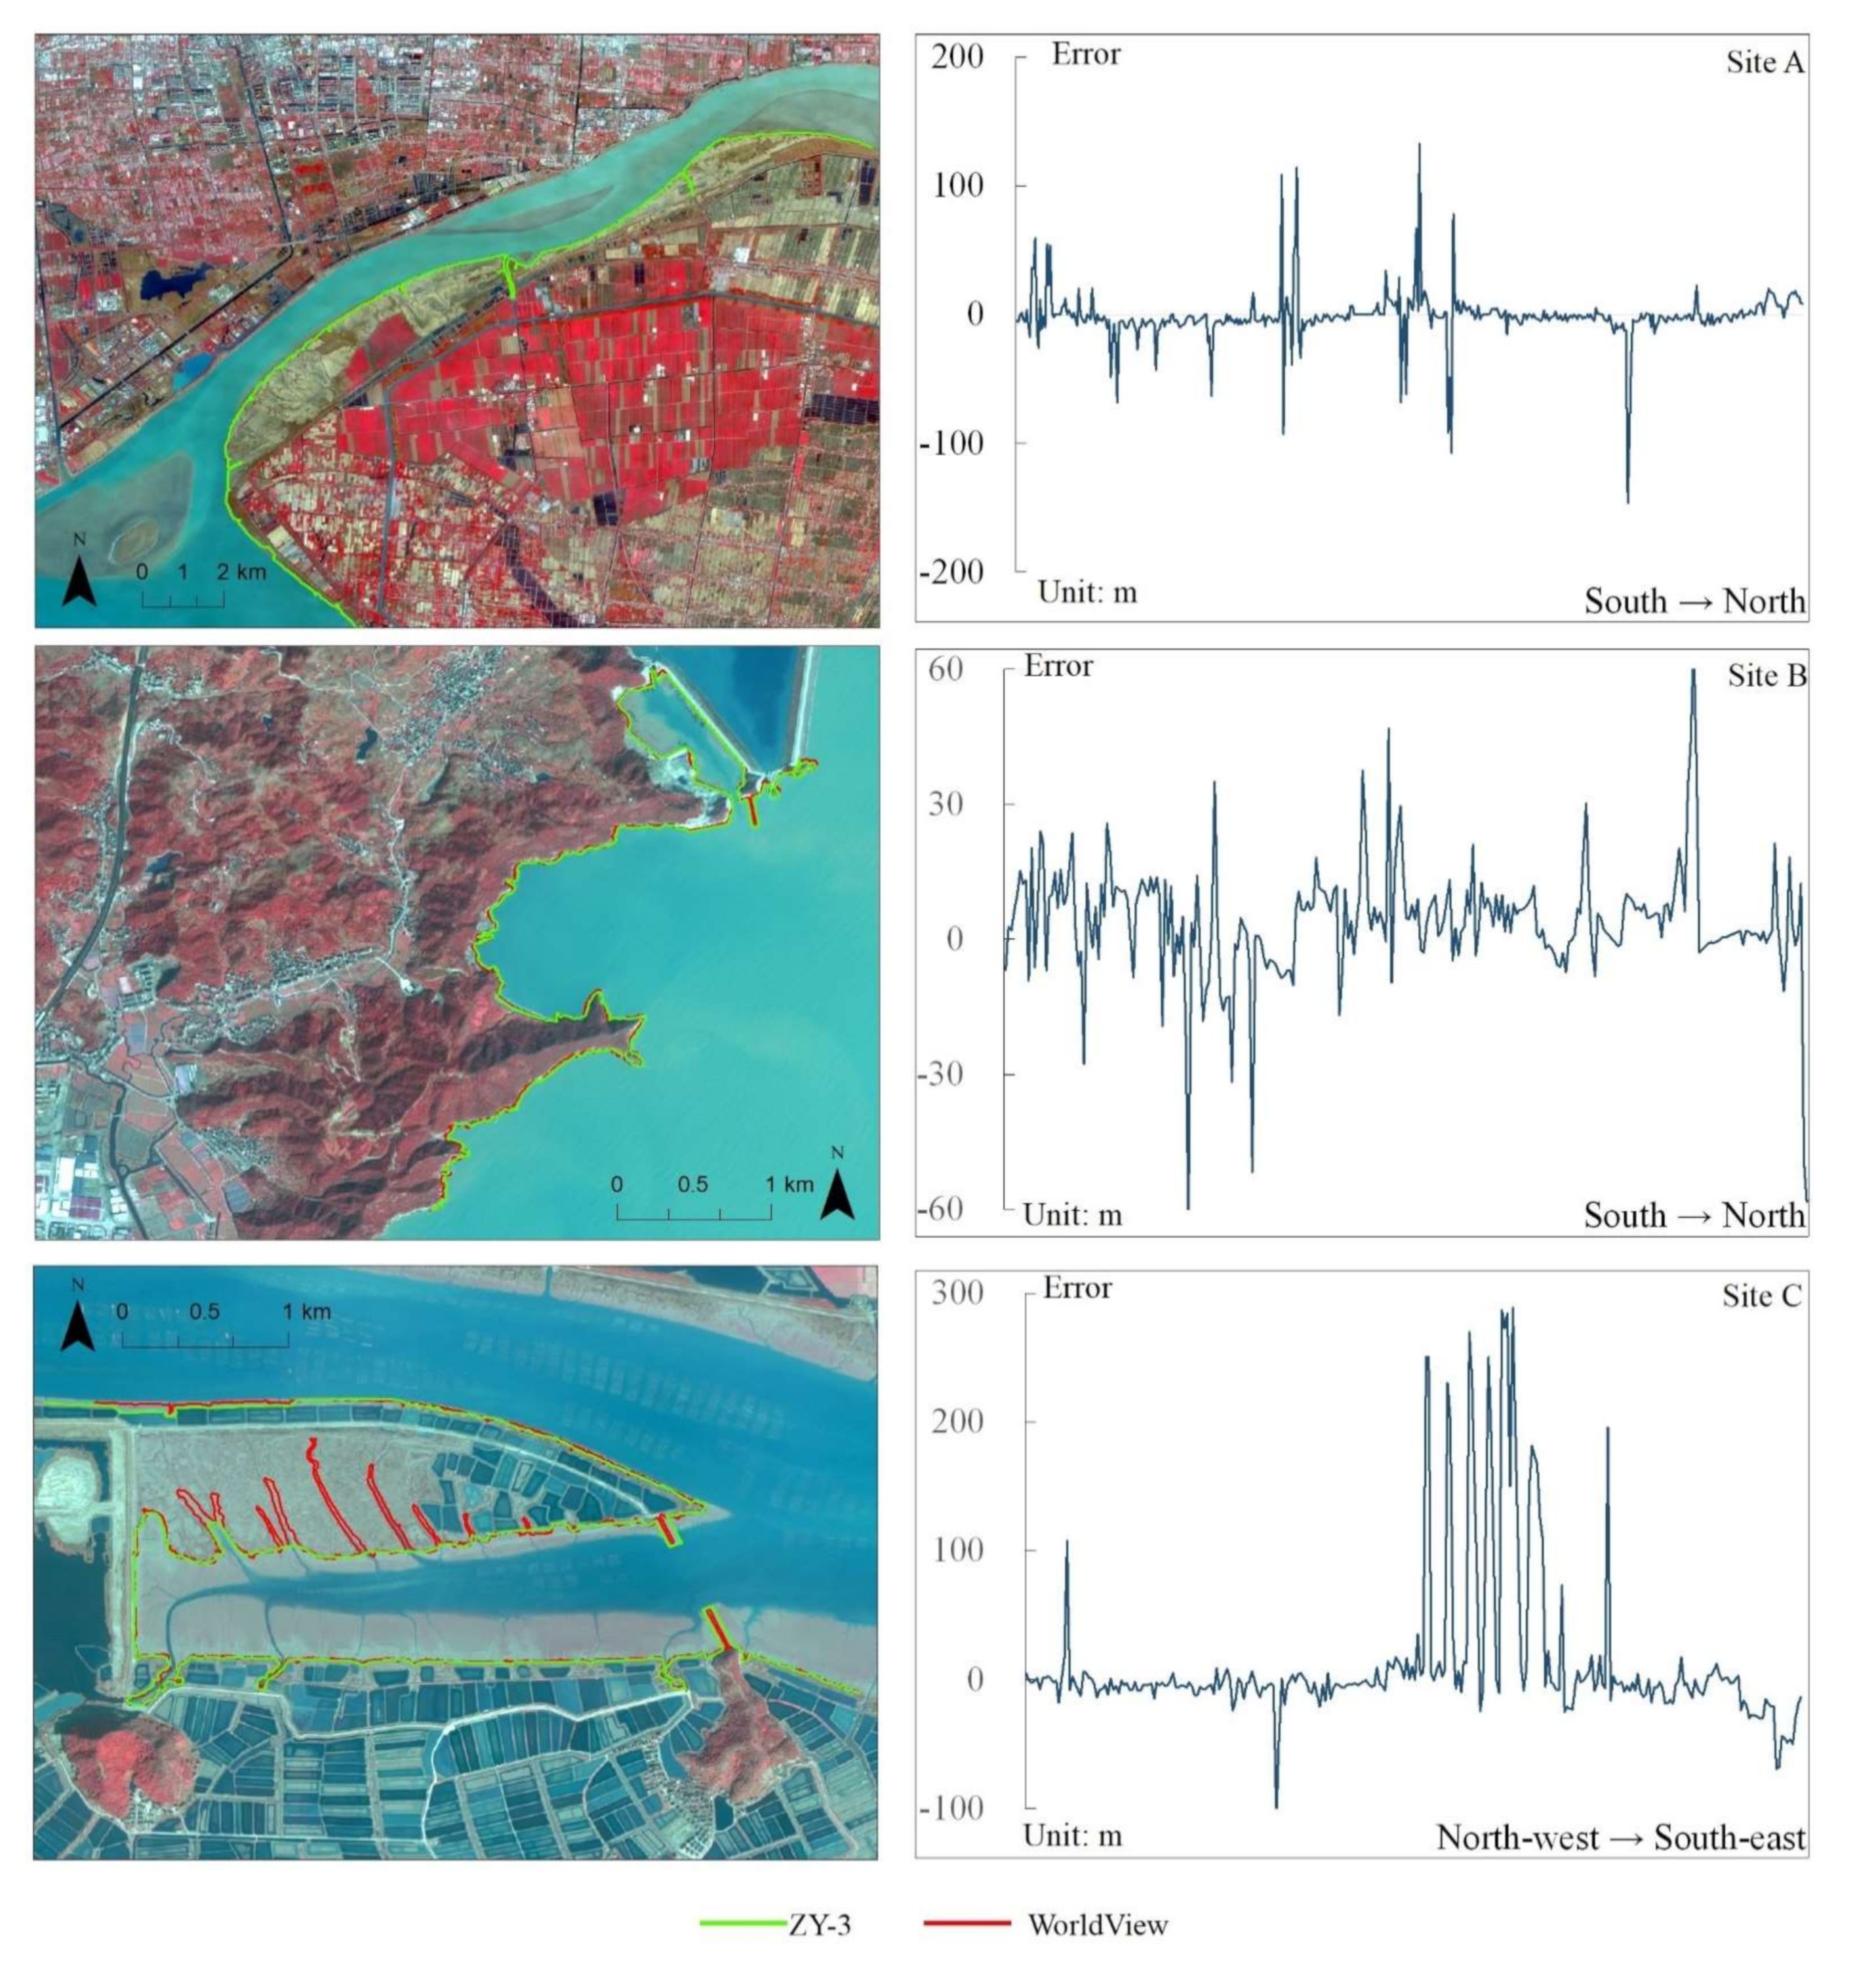
3.3. The Accuracy Validation Results

The extracted coastline results and deviation value charts are shown in Figure 6. The accuracy data of GF-1/ZY-3 in the three selected areas are listed in Table 5. In charts, the deviation value (vertical axis) at each vertical line (horizontal axis) is presented following the order of baseline, thus showing the spatial distribution of deviation on the extraction results.
At Site A, most long straight muddy coastlines and artificial constructions are well extracted. However, several peaks still exist, indicating possible problem on artificial construction extraction with high resolution imagery. At Site B, deviation values are overall at a low level. Boats in northern ports coastline can also be easily determined and manually corrected on high-resolution images. At Site C, extraction result of ZY-3 has high errors in the middle because of the twisted muddy coastline, which is contributed by channels of mudflats or fish ponds. In conclusion, the results show that the GF-1/ZY-3 image has good performance in coastline extraction.
In charts on the right, the deviation value (vertical axis) at each vertical line (horizontal axis) is measured by the distance between intersecting points on different extraction results (See details in Section 2.6). Deviation values are presented following the order of baseline, thus showing the spatial distribution of deviation on the extraction results. It is clear that the blue line (ZY-3) has the lowest deviation.

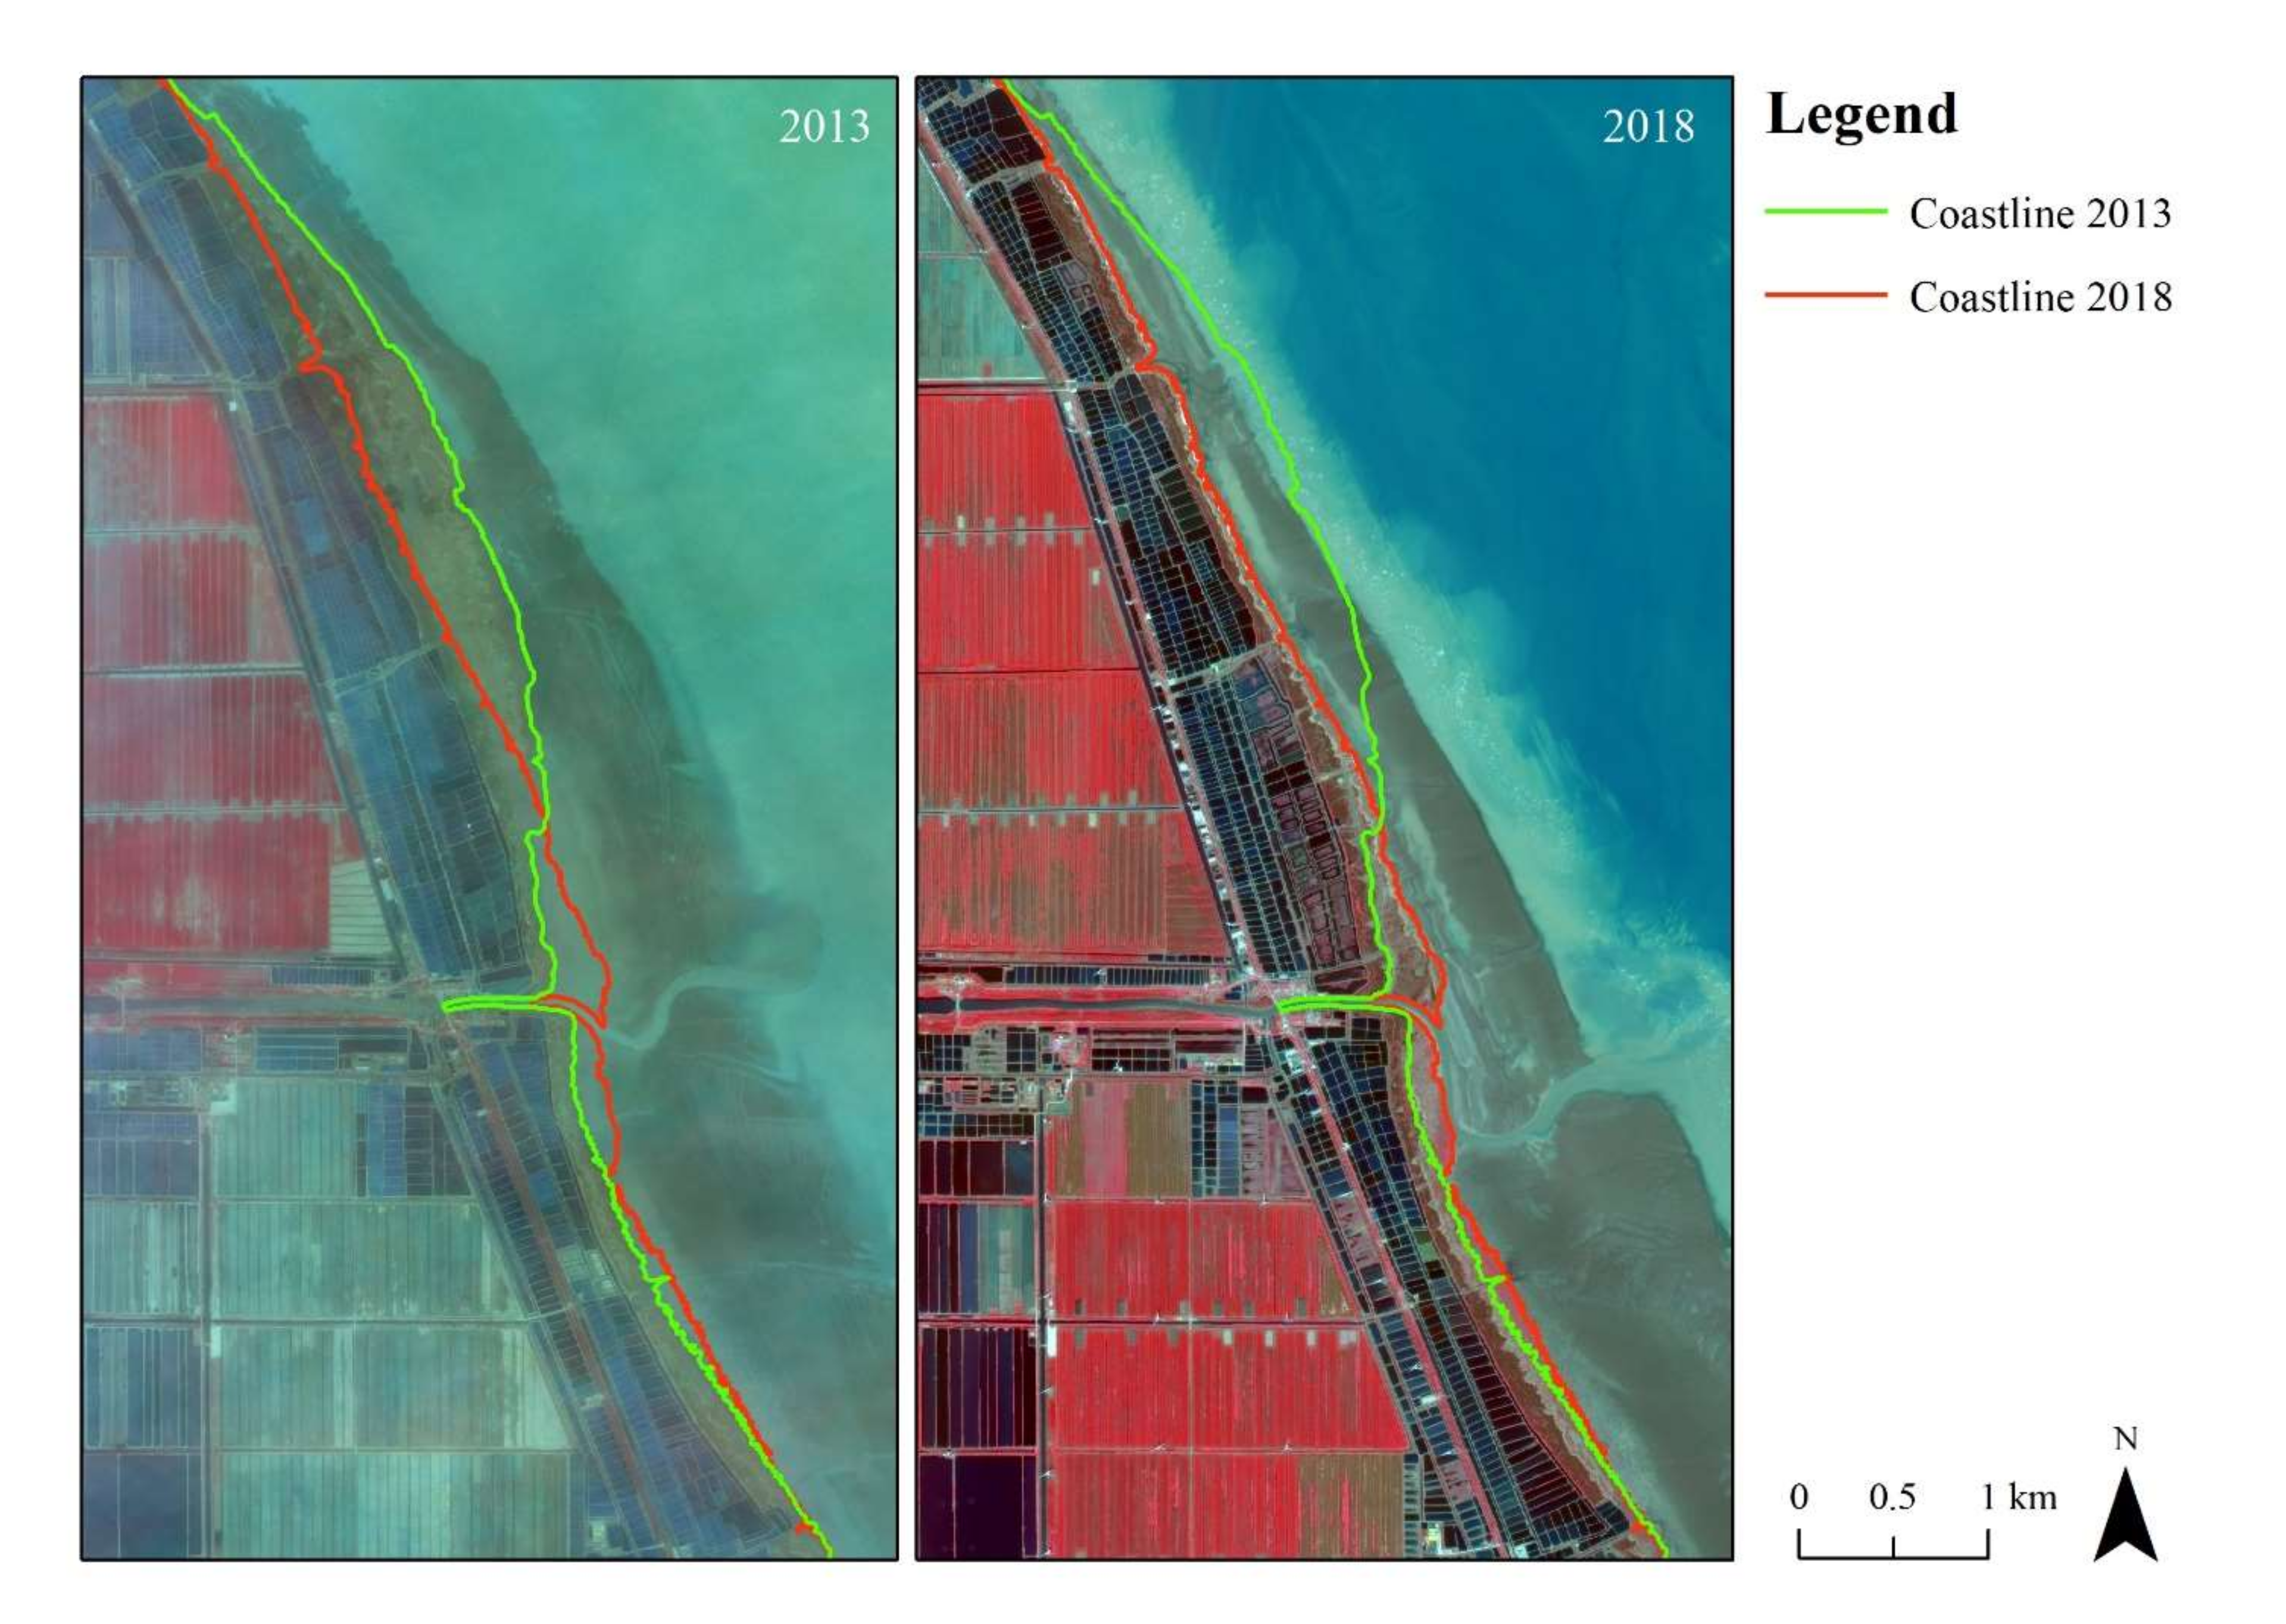
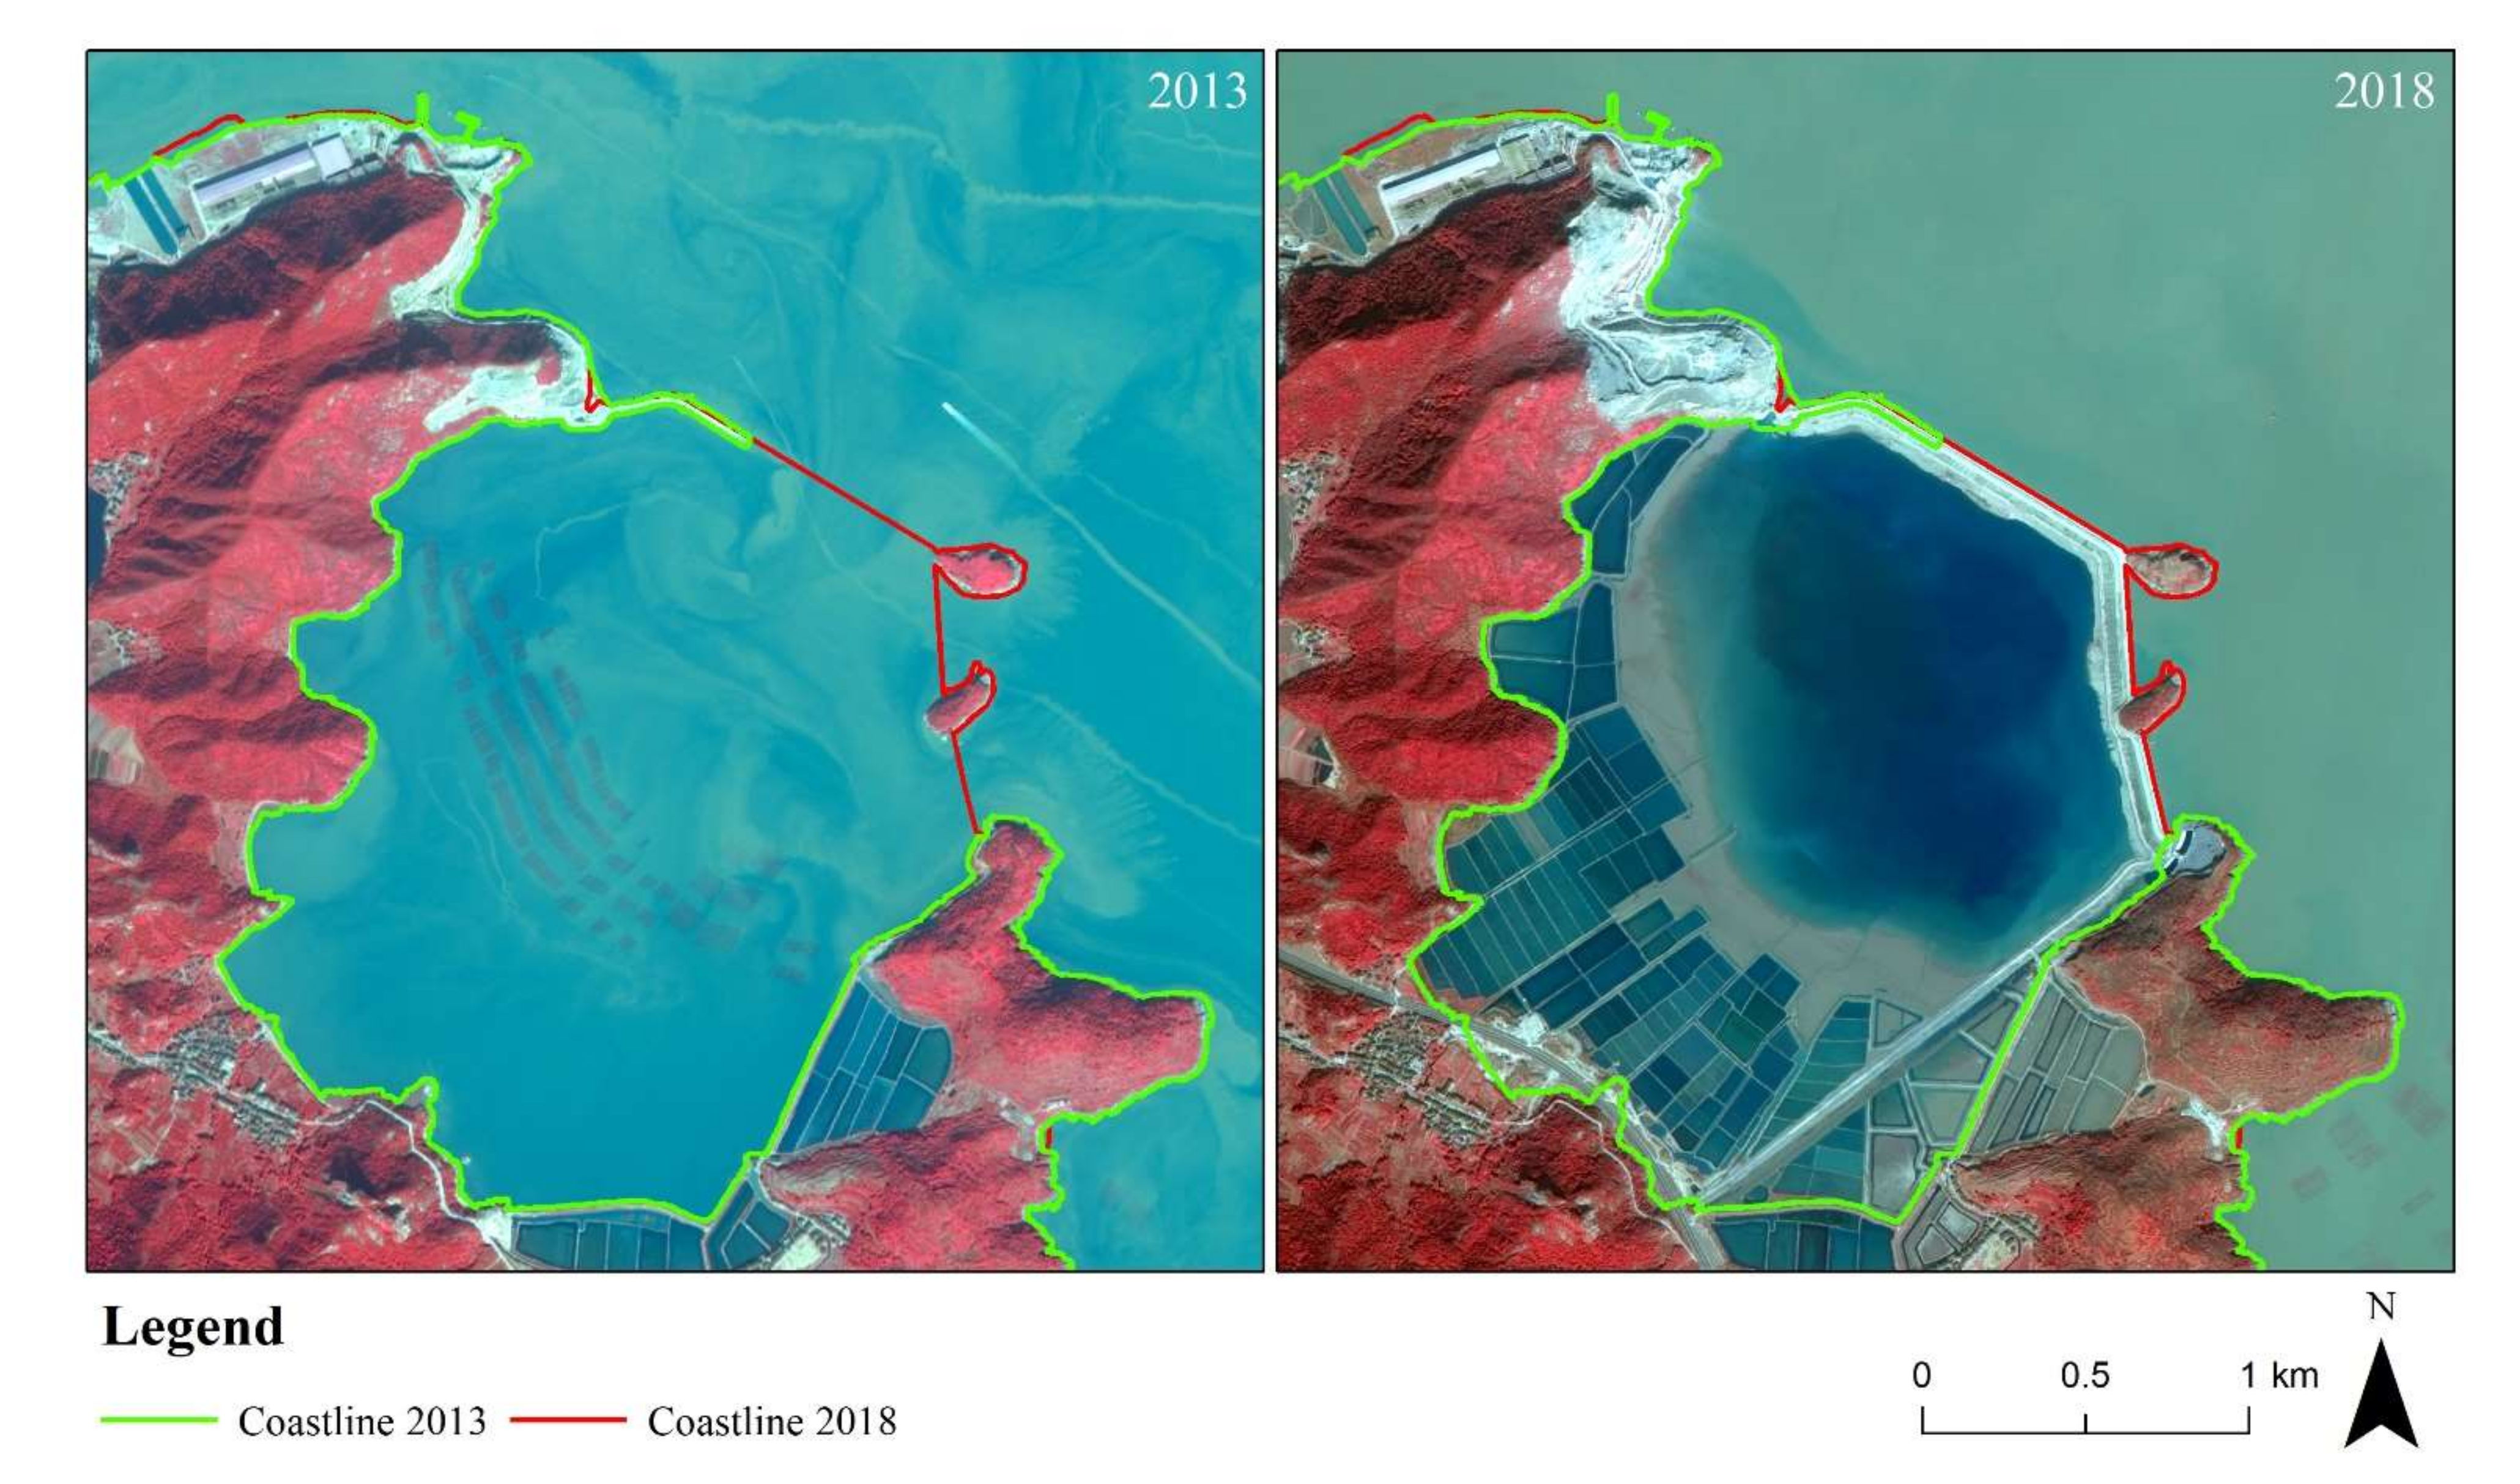
3.4. Typical Coastline Changes

The coastline of Yangtze River Delta is influenced by natural and anthropogenic forces and their interactions. The natural coastline change is mainly reflected in the accretion or erosion of silt, distributed in several places along the entire Yangtze River Delta coastline. On the coastline of Part I, erosion retreat (blue part in Figure 7), which is large in this area, and siltation growth (red part in Figure 7) are both present on the straight muddy coastline (Figure 7). The former Yellow River mouth was at the north Jiangsu coastline until 1855 and discharged sediment here. Since 1855, this part of coastline has experienced continuous erosion by tides and waves [26]. Meanwhile, with the dynamic changes of artificial coastline, which are mainly protective and reclamation constructions, artificial construction plays an important role in muddy coastline change by intercepting sediment and creating a suitable sedimentary environment [36], reflecting the interaction of natural and anthropogenic factors.
Port, reclamation and protective constructions reflect the land use change in coastal zones. Port construction is widely carried out across the Yangtze River Delta. Among the four parts, Part I, north of the Yangtze River estuary area, has the largest increase of 50.38 km in the port coastline. Large-scale port coastlines are an important reflection of export-oriented economic development. Reclamation constructions are in all parts of Yangtze River Delta. In Zhejiang Province, especially in the south of Hangzhou Bay, such as Taizhou and Wenzhou, coastal cities lack development space due to the mountainous interior area, leading to large-scale reclamation constructions that enlarge land that can be built on. In addition, reclamation construction tends to simplify the morphology of the coastline, resulting in an increase in area and a decrease in coastline length (Figure 8).

4. Discussion

4.1. Applicability and Limitations

Coastline change detection is useful for monitoring the ecology of coastal zone areas for purposes of sustainable management. High spatial resolution satellite imagery reveals more detail when detecting coastline changes. In this study, we used an NDWI-thresholding method to map the coastlines, which is adaptive to the characteristics of high-resolution images in coastline extraction. Some small-scale artificial constructions used to go unidentified in satellite imagery of 30 m, but now can be recognized in high spatial resolution satellite imagery.
Choosing an appropriate threshold for each type of coastline is important to accurately detect coastlines. In this study, thresholds were determined referring to the histogram of NDWI with manual adjustment. Usually, one threshold was set for each image. However, more than one threshold in one scene may be needed to address complicated situations when multiple coastline types occur in one scene of an image. Using just one threshold makes it difficult to correctly detect coastlines of different coastline types due to their different characteristics and interpretation standards. Thus, different thresholds were selected to detect coastlines according to the interpretation standard of different coastline types. Currently, automatic methods of threshold decision, such as the AWEI method, have been applied [10]. Although the accuracy cannot be ensured on every image compared with manual selection, automated methods are capable of situations with more scenes of images. Higher resolution brings higher capabilities, but also more complexity to extraction. In further studies, other extraction methods, such as the object-oriented method [18], can be applied to high-resolution imagery to improve efficiency.
Any satellite image-derived coastline will be biased by tidal fluctuations at the time of observation for the images. DEM-adjustment approach is widely used and reliable, but not practical in this study due to the lack of high-resolution DEM data. We thus set standards for the determination of thresholds for different coastline types to reduce the tide impact. This method is also adapted in accuracy validation, where WorldView images were used as ground truth. The WorldView images were interpreted according to the standard in the study to avoid or reduce tidal fluctuations. Currently, high-resolution DEM data like ArcticDEM [17] with 2 m resolution has been developed, but is still limited to Arctic regions. In the future, improved DEM data with high resolution or advanced methods can be developed to improve the accuracy of coastline extraction using high-resolution imagery.
Analysis of coastline changes can be further performed from different perspectives. For example, transitions between different types of coastlines can be analyzed to examine land use change in coastal zone. Data about the economics of different industries from government or other sources can be introduced to establish relationships with various artificial coastlines and conduct further study.
When carrying out the accuracy validation, we used WorldView images as ground truth, which is a practical method in remote sensing studies. However, on-the-spot investigation is still necessary in future work. Remote sensing images capture only a random moment on one day, which means that dynamic shoreline changes caused by tidal fluctuations will make the shoreline at the same location look different in different images. Such daily changes have little impact on long time series studies, but they may help us better understand coastline change mechanisms and thus help with remote sensing studies.

4.2. Comparison with Other Yangtze River Delta Studies

The Yangtze River Delta has long been a focus of coastal area and coastline change research. For example, Suo used an object-oriented method on GF-1 imagery to extract and classify Zhejiang Province coastline in 2016 [18]. In their study, they extracted some large islands of Zhoushan, although here we did not include all islands for analysis due to limitations on image coverage. Moreover, Zhejiang Province’s marine economic development occurred early, and its coastal use is diverse and includes the usage of island coastlines, so coastline studies in this area are not comprehensive and are limited to only the coastline of the mainland. The spatial scale, study area division, image resolution and extraction methods vary, making it difficult to obtain data for comparison.
The length of coastline in each part of Yangtze River Delta in our study greatly deviates from the figures given in the historical documents and previous studies. One possible reason is a scaling effect [37]. According to a previous study [37], the coastline length of continental China decreases with increasing yardstick, which is a parameter in fractal theory [38]. In this theory, a basic model for the solution of the fractal dimension in complex curves was proposed as follows:
L G = M × G 1 D
In which G is the length of yardstick. LG is the coastline length under a certain yardstick G. M is an indeterminate constant. D is the fractal dimension of the coastline. Be aware that fractal dimension D is greater than 1, so from the equation, we can easily determine that as the yardstick increases, the length of the measured coastline decreases.
In satellite images, the yardstick can be equal to the minimal grid size of the image, which decreases when the spatial resolution increases. The theory can also be understood as high spatial resolution satellite imagery reveals more details than before. For example, some small ports were unable to be identified but can now be clearly seen in high spatial resolution imagery, causing the coastline length to be larger than ever.
There have been many studies of hydrographic [21], dynamic mechanisms [39] or long time series [16,40] focusing on the Yangtze River estuary area. The detailed extraction results of the Yangtze River estuary for 2013 and 2018 obtained in this study can be helpful for other studies by providing an extra time interval of high-quality data.

5. Conclusions

The coastlines of Yangtze River Delta region and its four parts in 2013 and 2018 were mapped and classified based on high spatial resolution GF-1/ZY-3 imagery. The main conclusions are as follows:
(1) The overall length of Yangtze River Delta coastline at our scale of reference was 5332.17 km in 2013 with 42.73% natural and 57.27% artificial coastlines and 5403.11 km in 2018 with 41.56% natural and 58.44% artificial coastlines. Muddy coastlines account for most of the total length of natural coastlines. Various artificial coastline types exist in the study area, mainly including protection coastlines, port coastlines and reclamation coastlines. From 2013 to 2018, the natural coastline decreased by 33.21 km, and the artificial coastline increased by 104.15 km, with the total length of the coastline increasing by 70.94 km. Within the short time span of five years, the coastline of Yangtze River Delta has undergone significant changes, with the growth of the artificial coastline being the main feature.
(2) The coastline length increases between 2013 and 2018 were mainly driven by the construction of protection and port coastlines. The reduction in total coastline length is mostly contributed by the decrease in reclamation, aquaculture and rocky coastlines. Changes in the different types of coastlines also have distinct regional characteristics, reflecting regional economic development and natural processes.
(3) In the Yangtze River Delta region, the land area advancing out to the sea is 508.57 km2, and the area lost by coastline retreat is 32.96 km2. In general, the sediment and erosion of muddy coastlines and the construction of artificial coastlines are the main reasons for coastal land changes in Yangtze River Delta. Different types of coastlines also interact with each other to influence the changes. For example, reclamation or protective constructions on the coastline tend to intercept sediments and thus create more muddy coastlines. In conclusion, the large variation in the pattern of change in the Yangtze River Delta coastline is mainly the result of interactions between rapid regional economic development and different natural coastline characteristics.
(4) GF-1/ZY-3 shows high performance in coastline extraction and classification. More details on the high spatial resolution images helped threshold selection and artificial construction extraction and mapping. Meanwhile, problems and large errors still exist in complicated coastline situations such as twisted muddy coastline and artificial construction of small scales.

Author Contributions

L.Y. provided the original data; Q.W. and S.M. jointly decided and performed the coastline extraction and classification works. Q.W. designed and performed the accuracy validation. C.Z. organized the article framework. Q.W. and H.H. wrote the manuscript; L.Y., M.G. and L.Z. helped on the revision and discussion; L.Y. and C.Z. provided supervision. All authors have read and agreed to the published version of the manuscript.

Funding

This study is supported by the Leading Funds for the First Class Universities (020914912203), and the National Natural Science Foundation of China (Project No. 41971054).

Data Availability Statement

The data presented in this study are available on request from the corresponding author. The data are not publicly available due to data usage protocol.

Acknowledgments

We would like to thank Professor Jonathan M. Adams from the School of Geography and Oceanography, Nanjing University, for helping with English language editing on this article. We would like to thank Jianxin Wang and Ziyong Fang for their work done before the early stages of the study.

Conflicts of Interest

The authors declare no conflict of interest.

References

  1. Wu, T.; Hou, X. Review of research on coastline changes. Acta Ecol. Sin. 2016, 36, 1170–1182. [Google Scholar]
  2. Yang, L.; Shen, F.X.; Zhang, L.; Cai, Y.Y.; Yi, F.X.; Zhou, C.H. Quantifying influences of natural and anthropogenic factors on vegetation changes using structural equation modeling: A case study in Jiangsu Province, China. J. Clean Prod. 2021, 280, 13. [Google Scholar] [CrossRef]
  3. Moore, L.J.; McNamara, D.E.; Murray, A.B.; Brenner, O. Observed changes in hurricane-driven waves explain the dynamics of modern cuspate shorelines. Geophys. Res. Lett. 2013, 40, 5867–5871. [Google Scholar] [CrossRef]
  4. Williams, D.D.; Kraus, N.C. Shoreline Change by Waves, Wind, and Tidal Current, Corpus Christi Bay, Texas. In Proceedings of the 4th International Symposium on Coastal Engineering and Science of Coastal Sediment Processes, Hauppauge, NY, USA, 21–23 June 1999; pp. 2219–2234. [Google Scholar]
  5. List, J.H.; Sallenger, A.H.; Hansen, M.E.; Jaffe, B.E. Accelerated relative sea-level rise and rapid coastal erosion: Testing a causal relationship for the Louisiana barrier islands. Mar.Geol. 1997, 140, 347–365. [Google Scholar] [CrossRef]
  6. Zhou, X.Y.; Zheng, J.H.; Doong, D.J.; Demirbilek, Z. Sea level rise along the East Asia and Chinese coasts and its role on the morphodynamic response of the Yangtze River Estuary. Ocean Eng. 2013, 71, 40–50. [Google Scholar] [CrossRef]
  7. Zhang, Y.Z.; Chen, R.S.; Wang, Y. Tendency of land reclamation in coastal areas of Shanghai from 1998 to 2015. Land Use Policy 2020, 91, 104370. [Google Scholar] [CrossRef]
  8. Liang, S.; Liu, W.; Cao, Y.; Wu, W. Exploitation of Port Coastline Resources and Its Spatial Effects Along the Yangtze River. Resour. Environ. Yangtze Basin 2019, 28, 2672–2680. [Google Scholar]
  9. Ai, B.; Zhang, R.; Zhang, H.; Ma, C.L.; Gu, F.G. Dynamic process and artificial mechanism of coastline change in the Pearl River Estuary. Reg. Stud. Mar. Sci. 2019, 30, 100715. [Google Scholar] [CrossRef]
  10. Li, W.Y.; Gong, P. Continuous monitoring of coastline dynamics in western Florida with a 30-year time series of Landsat imagery. Remote Sens. Environ. 2016, 179, 196–209. [Google Scholar] [CrossRef]
  11. Xu, N.; Gong, P. Significant coastline changes in China during 1991-2015 tracked by Landsat data. Sci. Bull. 2018, 63, 883–886. [Google Scholar] [CrossRef] [Green Version]
  12. Wu, T.; Hou, X.Y.; Xu, X.L. Spatio-temporal characteristics of the mainland coastline utilization degree over the last 70 years in China. Ocean. Coast. Manag. 2014, 98, 150–157. [Google Scholar] [CrossRef]
  13. Sagar, S.; Roberts, D.; Bala, B.; Lymburner, L. Extracting the intertidal extent and topography of the Australian coastline from a 28 year time series of Landsat observations. Remote Sens. Environ. 2017, 195, 153–169. [Google Scholar] [CrossRef]
  14. Li, X.J.; Damen, M.C.J. Coastline change detection with satellite remote sensing for environmental management of the Pearl River Estuary, China. J. Mar. Syst. 2010, 82, S54–S61. [Google Scholar] [CrossRef]
  15. Ahmed, K.R.; Akter, S. Analysis of landcover change in southwest Bengal delta due to floods by NDVI, NDWI and K-means cluster with landsat multi-spectral surface reflectance satellite data. Remote Sens. Appl. Soc. Environ. 2017, 8, 168–181. [Google Scholar] [CrossRef]
  16. Chu, Z.X.; Yang, X.H.; Feng, X.L.; Fan, D.J.; Li, Y.K.; Shen, X.; Miao, A.Y. Temporal and spatial changes in coastline movement of the Yangtze delta during 1974-2010. J. Asian Earth Sci. 2013, 66, 166–174. [Google Scholar] [CrossRef]
  17. Dai, C.L.; Howat, I.M.; Larour, E.; Husby, E. Coastline extraction from repeat high resolution satellite imagery. Remote Sens. Environ. 2019, 229, 260–270. [Google Scholar] [CrossRef]
  18. Suo, A.; Ma, H.; Li, F.; Wei, B.; Lin, Y.; Zhao, J. Coastline carrying capacity monitoring and assessment based on GF-1 satellite remote sensing images. EURASIP J. Image Video Process. 2018, 2018, 84. [Google Scholar] [CrossRef] [Green Version]
  19. Hou, X.; Wu, T.; Hou, W.; Chen, Q.; Wang, Y.; Yu, L. Characteristics of coastline changes in mainland China since the early 1940s. Sci. China Earth Sci. 2016, 59, 1791–1802. [Google Scholar] [CrossRef]
  20. Wei, W.; Tang, Z.H.; Dai, Z.J.; Lin, Y.F.; Ge, Z.P.; Gao, J.J. Variations in tidal flats of the Changjiang (Yangtze) estuary during 1950s-2010s: Future crisis and policy implication. Ocean. Coast. Manag. 2015, 108, 89–96. [Google Scholar] [CrossRef]
  21. Li, X.; Zhou, Y.X.; Zhang, L.P.; Kuang, R.Y. Shoreline change of Chongming Dongtan and response to river sediment load: A remote sensing assessment. J. Hydrol. 2014, 511, 432–442. [Google Scholar] [CrossRef]
  22. Zhaoguang, B. Technical Characteristics of Gaofen-1 Satellite. Aerosp. China 2013, 1, 5–9. [Google Scholar]
  23. Li, D. Chinas First Civilian Three-line-array Stereo Mapping Satellite: ZY-3. Acta Geod. Cartogr. Sin. 2012, 41, 317–322. [Google Scholar]
  24. McFeeters, S.K. The use of the Normalized Difference Water Index (NDWI) in the delineation of open water features. Int. J. Remote Sens. 1996, 17, 1425–1432. [Google Scholar] [CrossRef]
  25. National Bureau of Statistics of China. Statistical Communiqué of the People’s Republic of China on the 2020 National Economic and Social Development; National Bureau of Statistics of China: Beijing, China, 2021. [Google Scholar]
  26. Wang, Y.; Aubrey, D.G. The Characteristics of the China Coastline. Cont. Shelf Res. 1987, 7, 329–349. [Google Scholar] [CrossRef]
  27. Liao, T.; Cai, T.; Liu, Y.; Xia, X. Continental shoreline change in Zhejiang during the last one hundred years. J. Mar. Sci. 2016, 34, 25–33. [Google Scholar]
  28. Di, X.; Hou, X.; Wu, L. Land Use Classification System for China’s Coastal Zone Based on Remote Sensing. Resour. Sci. 2014, 36, 463–472. [Google Scholar]
  29. Suo, A.; Cao, K.; Ma, H.; Wang, Q.; Yu, Y. Discussion on Classification System of Coastline. Sci. Geogr. Sin. 2015, 35, 933–937. [Google Scholar]
  30. Xu, H. Modification of normalised difference water index (NDWI) to enhance open water features in remotely sensed imagery. Int. J. Remote Sens. 2007, 27, 3025–3033. [Google Scholar] [CrossRef]
  31. Feyisa, G.L.; Meilby, H.; Fensholt, R.; Proud, S.R. Automated Water Extraction Index: A new technique for surface water mapping using Landsat imagery. Remote Sens. Environ. 2014, 140, 23–35. [Google Scholar] [CrossRef]
  32. Liu, Y.B.; Song, P.; Peng, J.; Ye, C. A physical explanation of the variation in threshold for delineating terrestrial water surfaces from multi-temporal images: Effects of radiometric correction. Int. J. Remote Sens. 2012, 33, 5862–5875. [Google Scholar] [CrossRef]
  33. Murray, N.J.; Phinn, S.R.; Clemens, R.S.; Roelfsema, C.M.; Fuller, R.A. Continental Scale Mapping of Tidal Flats across East Asia Using the Landsat Archive. Remote Sens. 2012, 4, 3417–3426. [Google Scholar] [CrossRef] [Green Version]
  34. Himmelstoss, E.A.; Henderson, R.E.; Kratzmann, M.G.; Farris, A.S. Digital Shoreline Analysis System (DSAS) Version 5.0 User Guide; Open-File Report 2018–1179; U.S. Geological Survey: Reston, VA, USA, 2018; 110p. [Google Scholar] [CrossRef] [Green Version]
  35. Jin, S.; Liu, Y.X.; Fagherazzi, S.; Mi, H.; Qiao, G.; Xu, W.X.; Sun, C.; Liu, Y.C.; Zhao, B.X.; Fichot, C.G. River body extraction from sentinel-2A/B MSI images based on an adaptive multi-scale region growth method. Remote Sens. Environ. 2021, 255, 21. [Google Scholar] [CrossRef]
  36. Zuo, S.H.; Li, J.F.; Chen, S.L.; Shi, S.Q. Study of delta coastal erosion and protection engineering measures in China-Taking the Yellow River delta and the Yangtze River delta as examples. Chin. J. Geol. Hazard Control. 2006, 17, 97–101. [Google Scholar]
  37. Gao, Y.; Su, F.; Zhou, C.; Yang, X.; Sun, X.; Zhang, D. Scale Effects of China Mainland Coastline Based on Fractal Theory. Acta Geogr. Sin. 2011, 66, 331–339. [Google Scholar]
  38. Mandelbrot, B. How long is the coast of britain? Statistical self-similarity and fractional dimension. Science 1967, 156, 636–638. [Google Scholar] [CrossRef] [Green Version]
  39. Wang, Y.-H.; Ridd, P.V.; Wu, H.-L.; Wu, J.-X.; Shen, H.-T. Long-term morphodynamic evolution and the equilibrium mechanism of a flood channel in the Yangtze Estuary (China). Geomorphology 2008, 99, 130–138. [Google Scholar] [CrossRef]
  40. Wang, Y.H.; Dong, P.; Oguchi, T.; Chen, S.L.; Shen, H.T. Long-term (1842-2006) morphological change and equilibrium state of the Changjiang (Yangtze) Estuary, China. Cont. Shelf Res. 2013, 56, 71–81. [Google Scholar] [CrossRef]
Figure 1. Location and division of the study area.
Remotesensing 14 00310 g001
Figure 2. Illustration of accuracy validation.
Remotesensing 14 00310 g002
Figure 3. Extracted coastlines of Yangtze River Delta in 2013 and 2018: (a) port construction in Lianyungang city, (b) port construction in Nantong city, (c) reclamation construction and silt accretion in Yangtze River estuary, (d) reclamation construction in Ningbo city, and (e) reclamation in Wenzhou city.
Remotesensing 14 00310 g003
Figure 4. Pie chart of length of different coastline types in Yangtze River Delta and its four parts in 2013 and 2018 (Unit: km).
Remotesensing 14 00310 g004
Figure 5. Yangtze River Estuary coastline change from 2013 to 2018: (a) typical land erosion, (b) Jiuduansha Wetland National Nature Reserve, (c) typical land expansion and (d) Dongtan Wetland Park.
Remotesensing 14 00310 g005
Figure 6. The extracted coastlines of GF-1/ZY-3 and ground truth of WorldView (left) and the deviation distribution charts (right).
Remotesensing 14 00310 g006
Figure 7. Coastline silt sediment and erosion in Jiangsu Province.
Remotesensing 14 00310 g007
Figure 8. Coastline straightening in Zhejiang Province.
Remotesensing 14 00310 g008
Table 1. Coastline classification system of the Yangtze River Delta.
Coastline TypeDescriptionIdentification StandardImagery with the Extracted Coastlines in Blue Color
Rocky CoastlineFormed by the submergence and wave action of the land mountains or hills that directly intersect the sea, mainly found on peninsulas, headlands, and islands.Obvious land-water boundary between bare rock and the sea Remotesensing 14 00310 i001
Sandy CoastlineBright white on standard false-color composite images, and the beach below the high-tide level is darker on images because it is wetter due to intermittent or frequent flooding by water.Land-water boundary or boundary between the bright-white and darker part of sand beach when flooded part exists Remotesensing 14 00310 i002
Muddy CoastlineLandward side of the muddy coastline is generally covered with vegetation whose coverage is seasonally slightly influenced, and vegetation shows red on standard false-color composite images.Significant difference between the abundance of vegetation and the sparseness of vegetation Remotesensing 14 00310 i003
Protection CoastlineProtection construction having no other significant function or land use. Part of the protective construction are designed between low tide and high tide level, in which case only part above high tide is considered as land.Land-water boundary of the protective construction Remotesensing 14 00310 i004
Farmland CoastlineFarmland shows red under the false color band combination with a regular distribution and uniform internal texture. Coastline with protective construction is considered to be a farmland coastline if there is a regular distribution of vegetation areas fit the above description.Land-water boundary of the protective construction of farmland Remotesensing 14 00310 i005
Salt Pan CoastlineSalt pan evaporation pools are generally small squares and of continuous regular distribution. Evaporation pools are smaller than fishponds and with a variety of different colors, distinguishing evaporation pools from fishponds.Land-water boundary of the protective construction of the salt pan area Remotesensing 14 00310 i006
Aquaculture CoastlineAquaculture ponds are usually long, regular and clustered in layout, which distinguishes salt pan evaporation pools from aquaculture ponds.Outer boundary of aquaculture ponds, or at the land-water boundary of the corresponding protection construction of the aquaculture area Remotesensing 14 00310 i007
Urban and Industrial CoastlineCombining urban area and industrial area, this coastline type is identified by land use inside the coastline.Land-water boundary of the protective construction of urban and industrial area Remotesensing 14 00310 i008
Port CoastlineIncluding all port related area including dock, dock ramp bridge and harbor district.Land-water boundary of features like dock or the protective construction of port area Remotesensing 14 00310 i009
Reclamation CoastlineReclamation coastline is artificial emergent coastline under construction or already constructed for the purpose of enclosing the ocean and creating new land, where the internal use has not yet been determined.Land-water boundary for the protection construction of the enclosed sea Remotesensing 14 00310 i010
Table 2. The location and coastline types for the validation sites.
LocationCoastline TypesCoastline Length in 2018 (Unit: km)
Site AWest end of Chongming IslandSilt deposits and protective
constructions
25.14
Site BNortheast of Yuhuan City, Taizhou City, Zhejiang Province.Mostly rocky coastline, port
construction located in north end of
selected area
13.60
Site CZhengyu harbor, Taizhou City, Zhejiang Province Muddy deposits with twisted contour, aquaculture ponds and protective
constructions
15.89
Table 3. Coastline length (km) of the Yangtze River Delta.
NaturalArtificialTotal
Part I2013619.05 725.40 1344.45
2018620.47 836.98 1457.45
Part II2013625.05 707.16 1332.21
2018631.70 768.14 1399.84
Part III201375.79 474.37 550.16
201891.40 463.61 555.02
Part IV2013958.77 1146.59 2105.35
2018901.88 1088.93 1990.81
Total20132278.66 (42.73%)3053.51 (57.27%)5332.17
20182245.45 (41.56%) 3157.66 (58.44%)5403.11
Table 4. The progradation and recession area along coastlines for the four parts of the Yangtze River Delta within the five years (Unit: km2).
Increased AreaDecreased AreaNet Change AreaRecession Area/
Progradation Area
North of Yangtze River Estuary+123.27−17.40+105.880.14
Yangtze River Estuary+139.16−8.30+130.860.06
Hangzhou Bay+54.34−2.07+52.280.04
South of Hangzhou Bay+191.80−5.19+186.610.03
Total+508.57−32.96+475.610.06
Table 5. Accuracy validation results using GF-1/ZY-3.
Site ASite BSite C
Mean Absolute Deviation (m)2.098.9326.88
Standard Deviation (m)19.6312.9461.80
Publisher’s Note: MDPI stays neutral with regard to jurisdictional claims in published maps and institutional affiliations.

