Article

Comparison of Classification Algorithms for Detecting Typical Coastal Reclamation in Guangdong Province with Landsat 8 and Sentinel 2 Images

1
School of Marine Sciences, Sun Yat-sen University, Zhuhai 519082, China
2
Southern Marine Science and Engineering Guangdong Laboratory (Zhuhai), Zhuhai 519080, China
3
Guangdong Provincial Key Laboratory of Marine Resources and Coastal Engineering, Guangzhou 510275, China
4
Surveying and Mapping Institute, Lands and Resource Department of Guangdong Province, Guangzhou 510663, China
5
Key Laboratory of Natural Resources Monitoring in Tropical and Subtropical Area of South China, Ministry of Natural Resources, Guangzhou 510663, China
*
Author to whom correspondence should be addressed.
Submission received: 9 November 2021 / Revised: 22 December 2021 / Accepted: 12 January 2022 / Published: 14 January 2022
(This article belongs to the Special Issue Remote Sensing Application in Coastal Geomorphology and Processes)

Abstract

:
Coastal reclamation in Guangdong Province is highly concentrated and is growing rapidly. However, intensive reclamation use has resulted in serious influence on the coastal ecosystem, directly and indirectly. The current conditions and spatial distribution of reclamations must be detected for coastal preservation and management using efficient technology. This study aims to find a suitable method and data to map reclamations accurately at a large scale. Pixel-based and object-oriented classification methods were applied in extracting the three typical types of coastal reclamation, namely, ports, aquaculture ponds, and salt pans, in Guangdong Province from Landsat 8 and Sentinel 2 images. The algorithms of a support vector machine, random forest, decision tree, and rule-based algorithm were performed. Classification results were compared with statistical measures to assess the performance of different algorithms. The results indicated that all of the algorithms could obtain classification results with high accuracy, whereas the object-oriented algorithm showed less efficiency than other algorithms in classifying ports with complicated features. High-resolution data were not always superior to lower-resolution data in the reclamation classification. Generally speaking, applying the rule-based object-oriented algorithm in Sentinel 2A MSI images is relatively efficient at detecting the reclamation use in coastal Guangdong considering its actual situation. The mapping of reclamations in the whole of coastal Guangdong shows that they present obvious agglomeration characteristics in the space. The aquaculture ponds are mainly distributed in the coastal zones of western Guangdong and eastern Guangdong, with the largest area of 77,963 ha. The other types of ports are mainly distributed in the coastal zones of the Pearl River Delta, with an area of 8146 ha, while salt pans are mainly distributed in the coastal zones of Jiangmen, Zhuhai, and Zhongshan, with a total area of 4072 ha. The results can provide key supporting data for decision making in coastal management and preservation.

Graphical Abstract

1. Introduction

Since the policy of reform and opening-up was launched in 1978, more than 750,000 ha of wetland has been encroached upon due to reclamation in China’s coastal zone [1,2]. As reported by Zhang and Su, a total area of about 487 km2 in the top ten provinces was reclaimed from the sea between 2002 and 2007 [3]. This caused an adverse impact on the coastal marine environment [4]. For example, Liu found that the increase in reclamation area would cause irreversible damage to the marine ecosystem [5]. Guo made a comprehensive analysis about the process of reclamation in Shenzhen and showed that reclamation could result in the instability of beaches, strengthened troughs, and reduced tidal influx [6]. For sustainable development, the scale and growth rate of reclamation should be restrained to protect the marine ecosystem; it is of great practical significance to accurately monitor the current status and track the dynamic change of coastal reclamation.
Although the traditional field survey served the research community of reclamation monitoring for many decades, it is limited by spatial and temporal coverage. Previous studies indicated that remote sensing could provide a synoptic view of coastal reclamation over a variety of spatial and temporal scales. Many research endeavors have proven this. For example, remote sensing images and topographic maps were used to restore the changes made to the Karnataka coast in India from 1910 to 2005 [7]. Landsat images were used to monitor the spatiotemporal patterns of coastal wetlands and reclamation in the Yangtze Estuary from the 1960s to 2015 [8]. As for the extraction of reclamation information, relevant research has mainly focused on the application of two typical methods, namely, pixel-based and object-oriented algorithms. Pixel-based algorithms assign each pixel to a class according to its spectral similarities [9]. Several pixel-based methods, such as support vector machine (SVM), random forest (RF), and decision tree (DT), have been gradually applied to mapping reclamation areas or detecting the reclamation change [10,11,12]. In comparison, object-oriented methods perform classification based on image objects [13]. The two main steps are listed as follows: (1) an image is preliminarily separated into many non-intersecting and homogeneous objects, considering the similarities of each pixel [14]; (2) the segmented objects are classified into different types through a series of algorithms according to their textural and contextual information as well as spectral information [15]. For instance, Suo developed an object-oriented method to extract and evaluate the inventory resources of reclamation in Yingkou City, China [16]. Huang and Wei used an object-oriented method to extract the artificial land aquaculture bases of 14 coastal cities in Guangdong Province from 2015 to 2019 with Sentinel 1 data [17].
These two types of methods have been successfully applied in reclamation classification, and most studies have mainly focused on using one method to identify reclamation in coastal zones or detect its temporal variations. These classification methods have actually shown some deficiencies in different types of reclamation separation. Pixel-based classification has been proven to be suitable for reclamation classification using medium-resolution images but is limited by only utilizing spectral information without considering the texture and contextual information [18], which results in lower accuracy when a certain type of reclamation shows typical characteristics of a texture with a few differences in spectral information. Moreover, each pixel-based algorithm also shows different efficiencies in identifying different types of reclamation. While object-oriented methods have commonly been applied to high-resolution images, such as QuickBird and IKONOS, with a spatial resolution less than 2 m [19,20]. Actually, those high-resolution satellite images correspond to a relatively long revisit period, high cost, and difficulty in capture. Additionally, when different reclamation objects present similar texture patterns or the same type of reclamation object shows different texture information, this usually results in the misclassification of reclamation by using object-oriented methods. In contrast, medium-resolution satellite sensors, such as Landsat 8 OLI and Sentinel 2A/2B MSI, provide data with larger coverage and higher frequency, which are freely available, without missing important information. Timely acquisition of large-scale reclamation-related information is particularly significant to the evaluation of the coastal eco-environment and the management of coastal resources. Whether object-oriented methods can obtain reasonable results in reclamation classification with medium-resolution images such as those collected by Landsat and Sentinel is to be validated.
Regarding different types of coastal reclamation, they show great differences both in spectral features and texture patterns; knowing what data and which classification algorithm are relatively efficient in classifying reclamations is essential for our understanding of their distribution characteristics, this is important to further facilitate policymaking for environmental protection. However, few studies have attempted to assess the efficiency of classification algorithms in detecting typical coastal reclamations at a large scale. In this study, different algorithms were tested for extracting coastal reclamations from Sentinel 2A MSI and Landsat 8 OLI data, respectively. It aims to find a suitable method and data to map reclamations accurately at a large scale. The specific contents are to: (1) apply different algorithms to different satellite images; (2) evaluate and compare the classification efficiency of different algorithms; (3) map the distribution pattern of coastal reclamations with the optimal algorithm. This study will provide good illustrations for selecting suitable data and clarify the feasibility of each algorithm. The results can provide a basic dataset for resource investigation, ecological preservation, and coastal management.
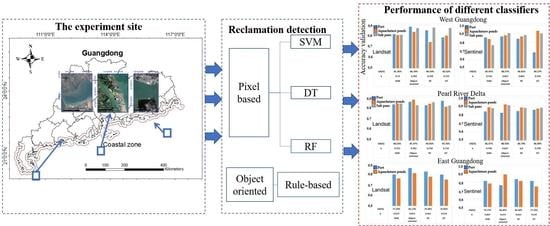
2. Study Area and Materials

2.1. Study Area

This study takes Guangdong Province as an example to observe the current status of coastal reclamation and validate the applicability of representative classification algorithms. Guangdong Province is located in the south gate of China bounded by 20°13′~25°31′ N and 109°39′~117°19′ E. It has 3368 km of mainland coastlines and 1805 km of island coastlines. Its climate is characterized by subtropical monsoon with a southerly wind in summer and northerly wind in winter [21]. The features of a rugged terrain and geographical location make it form the special landscape of ‘eight outlets into the sea’ along the Pearl River. Gross Domestic Product (GDP) of Guangdong Province surpassed the 11 trillion yuan mark in 2020, ranking no.1 for 32 consecutive years in China. Moreover, Guangdong–Hong Kong–Macao Greater Bay Area links Hong Kong and Macao with nine municipalities in Guangdong Province and is growing into a world-class city cluster. To meet the needs of coordinated economic development and land use under rapid urbanization, land reclamation from the sea has turned out to be an important means of expanding land space. According to a statistical report, coastal reclamation in Guangdong Province covered an area of about 1500 km2 from 1949 to 1989 and about 307 km2 from 1990 to 1997 [22]. The average annual rate of reclamation was about 44 km2, an increase of 16% compared with the period from1949 to 1989. From 2000 to 2008, the reclamation area in the coastal zone of Guangdong Province was about 188 km2, mainly distributed in the Pearl River Delta. Since 1990, reclamation activities in the coastal zone of Guangdong Province have been concentrated in cities within the Pearl River Delta, including Shenzhen, Guangzhou, Zhuhai, and Jiangmen.
Coastal reclamation has resulted in the emergence of many environmental problems. The Guangdong provincial government promulgated the Marine Function Zoning of Guangdong (2011–2020), which emphasized that the scale of reclamation for construction in Guangdong would be controlled within 23,000 ha, equivalent to about 8.5 Macao [23]. To observe the main types of reclamation and discuss their distribution pattern in coastal Guangdong, we restrained the study area within the 10 km buffer regions along the coastline both to the seaward and the landward side. On the other hand, Guangdong Province can be separated as western Guangdong, the Pearl River Delta, eastern Guangdong, and northern Guangdong, with dissimilarities in their economic development and geographical features. This study focuses on the former three sub-regions considering the spatial distribution of reclamation, as shown in Figure 1. West Guangdong includes Zhanjiang, Maoming, and Yangjiang City. The Pearl River Delta includes Jiangmen, Zhongshan, Zhuhai, Guangzhou, Dongguan, Shenzhen, and Huizhou City. East Guangdong includes Jieyang, Shantou, and Shanwei City.

2.2. Data Materials and Preprocessing

Cloud-free Landsat 8 OLI and Sentinel 2A MSI data at low tide times were acquired between September and December 2019, as listed in Table 1. Landsat 8 OLI data were downloaded from the website of the United States Geological Survey (USGS) (http://www.usgs.gov (accessed on 20 March 2020)), and Sentinel 2A data were downloaded from the website of the European Space Agency (https://www.copernicus.eu/en (accessed on 20 March 2020)).
Radiometric calibration was first carried out to eliminate the errors produced by variations in sensor performance and characteristics over time. The Fast Line-of-sight Atmospheric Analysis of Spectral Hypercubes (FLAASH) tool was then implemented in Landsat 8 OLI data to obtain surface reflectance. Sentinel 2A MSI data used in this study are the product of Level-2A, which was already atmospherically corrected. Geometric correction and seamless mosaic were performed for all images. Finally, subset images covering the study area were extracted to observe reclamation. All this preprocessing was conducted using ENVI (Environment for Visualizing Images) software from Exelis Visual Information Solutions, USA.

3. Methodology

In this study, the performance of four classification algorithms, namely, random forest (RF), support vector machine (SVM), decision tree (DT), and the rule-based object-oriented methods, were tested. They drew great attention to image classification and were proven to be mature and suitable for land-use extraction from high- and medium-resolution images [24,25,26]. The four algorithms were applied to derive reclamations from Landsat 8 OLI and Sentinel 2A MSI images in this study. The optimal algorithm was determined according to statistical analysis, which was then used to map the main types of reclamation in the coastal zone of Guangdong Province. The main steps are illustrated in Figure 2, and the main methodology is briefed in the following subsections.

3.1. Establishing the Interpretation Keys

To extract the reclamation information from satellite images, specific types of reclamation were defined as follows: brackish water aquaculture ponds, salt pans, and ports according to the Chinese State Oceanic Administration (HT/Y123-2009) that describes the present situation of integrated coastal zone development in Guangdong Province [22]. With high-resolution imagery acquired from Google Earth, the spectral, texture, tone characteristics, and actual situation were analyzed to establish the interpretation keys for each type of reclamation. Features of different reclamation types in false-color composites are listed in Table 2.

3.2. Description for Algorithms

In this study, both pixel-based and object-oriented algorithms were evaluated. All operations were conducted using ENVI and ArcGIS software. A brief description of each algorithm is given below.

3.2.1. Support Vector Machine (SVM)

SVM is a machine learning method, which is mainly based on the theory of Vapnik–Chervonenkis Dimension and the principle of minimizing structural risk [27]. It can locate an optimal hyperplane and maximize the margin between two classes [28]. It is a supervised model that starts with the definition of the training samples. The objective of training is to derive an appropriate function that describes the relationship between the input and output. A classifier (f(x)) can be expressed as
f ( x ) = i = 1 l c i k ( x , x i )
where x i , i = 1, 2… l are training data, k is a kernel function, and c i is constant [29]. SVM can also transform non-linear problems to linear problems by constructing a discrimination function in a high-dimensional space; therefore, it can avoid the risk of dimensional disaster [30].

3.2.2. Decision Tree

Decision tree (DT) can improve classification accuracy by integrating complicated terrain features with spectral attributes. It has the ability of classifying images with various resolutions rapidly without statistical assumptions [31]. The main process of DT is to create a set of rules for determining land-cover type and assigning each pixel to a class; this relies on training sites and the values of input imagery that are usually defined by the user [32]. Therein, training sites (samples) refer to those small areas extracted from the imagery, and rules are commonly set from representative features characterizing different land-use types in the study area. In recent years, DT algorithms have been widely applied in detecting landscape dynamics.

3.2.3. Random Forest

Random forest (RF) was introduced by Breiman [33]. It is regarded as a non-parametric ‘ensemble learning’ algorithm [34,35]. It is an improvement over the bagged decision tree. The key of RF is the creation of decision trees to form the forest. This contains two consecutive steps. First, each tree is built using randomly selected samples. Each tree in the forest is trained with different samples of the same size. Second, two-thirds of the training data is used for calibration, while the remaining one-third is saved for validation. A quality measure was assigned for the selection of attributes, and the Gini index was adopted here [36]. It measures the impurity of an attribute with respect to different classes. For a given training set T and a random pixel belonging to class C i , the Gini index can be written as
j 1 ( f ( C i , T ) / | T | ) ( f ( C j , T ) / | T | )
where f ( C i , T ) / | T | is the probability that the selected case belongs to class C i .

3.2.4. Rule-Based, Object-Oriented Classifier

Different from the pixel-based classification methods, a rule-based, object-oriented classifier firstly segments or groups pixels to obtain homogeneous image objects, which can usually avoid the limitation of the ‘salt and pepper effect’ generated by the pixel-based methods. Rule-based algorithms can effectively improve classification by combining rich features, especially when applied to high-resolution images [37,38]. Features such as primitive spectrum, shape, texture, and spatial relationship can be integrated into analysis process to improve segmentation accuracy [39]. Then, universal methods, such as a region-growing algorithm, can be applied in the segmented objects to realize meaningful classification.

3.3. Statistical Measures

3.3.1. Confusion Matrix

The accuracy of classification results from different algorithms was measured with the indices, namely, overall accuracy (OA), producer’s accuracy (PA), and user’s accuracy (UA). They were calculated from a confusion matrix by comparing the classification results with the ground-truth data. OA is defined as the proportion of all reference pixels that are classified correctly (in the sense that the class assignment of the classification agrees with the ground-truth data). PA refers to the proportion that a pixel classified as one category in the ground-truth data is also classified as the same category in the classification map. UA is defined as the conditional probability that a pixel classified as one category in the classification result is placed in the same category in the ground-truth data. UA and PA are related to the commission and omission errors in image classification, respectively [40]. Since OA, PA, and UA give no information about what types are classified with high accuracy and cannot reflect the agreement between the classification sets and the ground-truth data for each class of reclamation, the Kappa coefficient was further used to reflect this agreement [41]. In this study, visual interpretation of 0.5 m resolution images from Google Earth were used as ground-truth data to calculate the OA, PA, UA, and Kappa coefficient. The confusion matrix is described in Table 3.

3.3.2. McNemar’s Test

McNemar’s test was used to determine the binary distinction between correct and incorrect class assignments by different classifiers [42]. It is a non-parametric and standardized normal test based upon confusion matrices in a 2 × 2 dimension. As for the same classifier, McNemar’s test can be expressed in the following equation
Z = f 12 f 21 f 12 + f 21
where f12 refers to the pixels that are correctly classified in image 1 but misclassified in image 2. f21 denotes pixels that are correctly classified in image 2 but misclassified in image 1. With this test, two classifications may exhibit different accuracies at the 95% confidence level if Z > |1.96|. To validate the suitability of classifiers for Landsat 8 OLI and Sentinel 2A MSI data, statistical significance parameters for correct and incorrect classifications are defined in Table 4.

4. Results

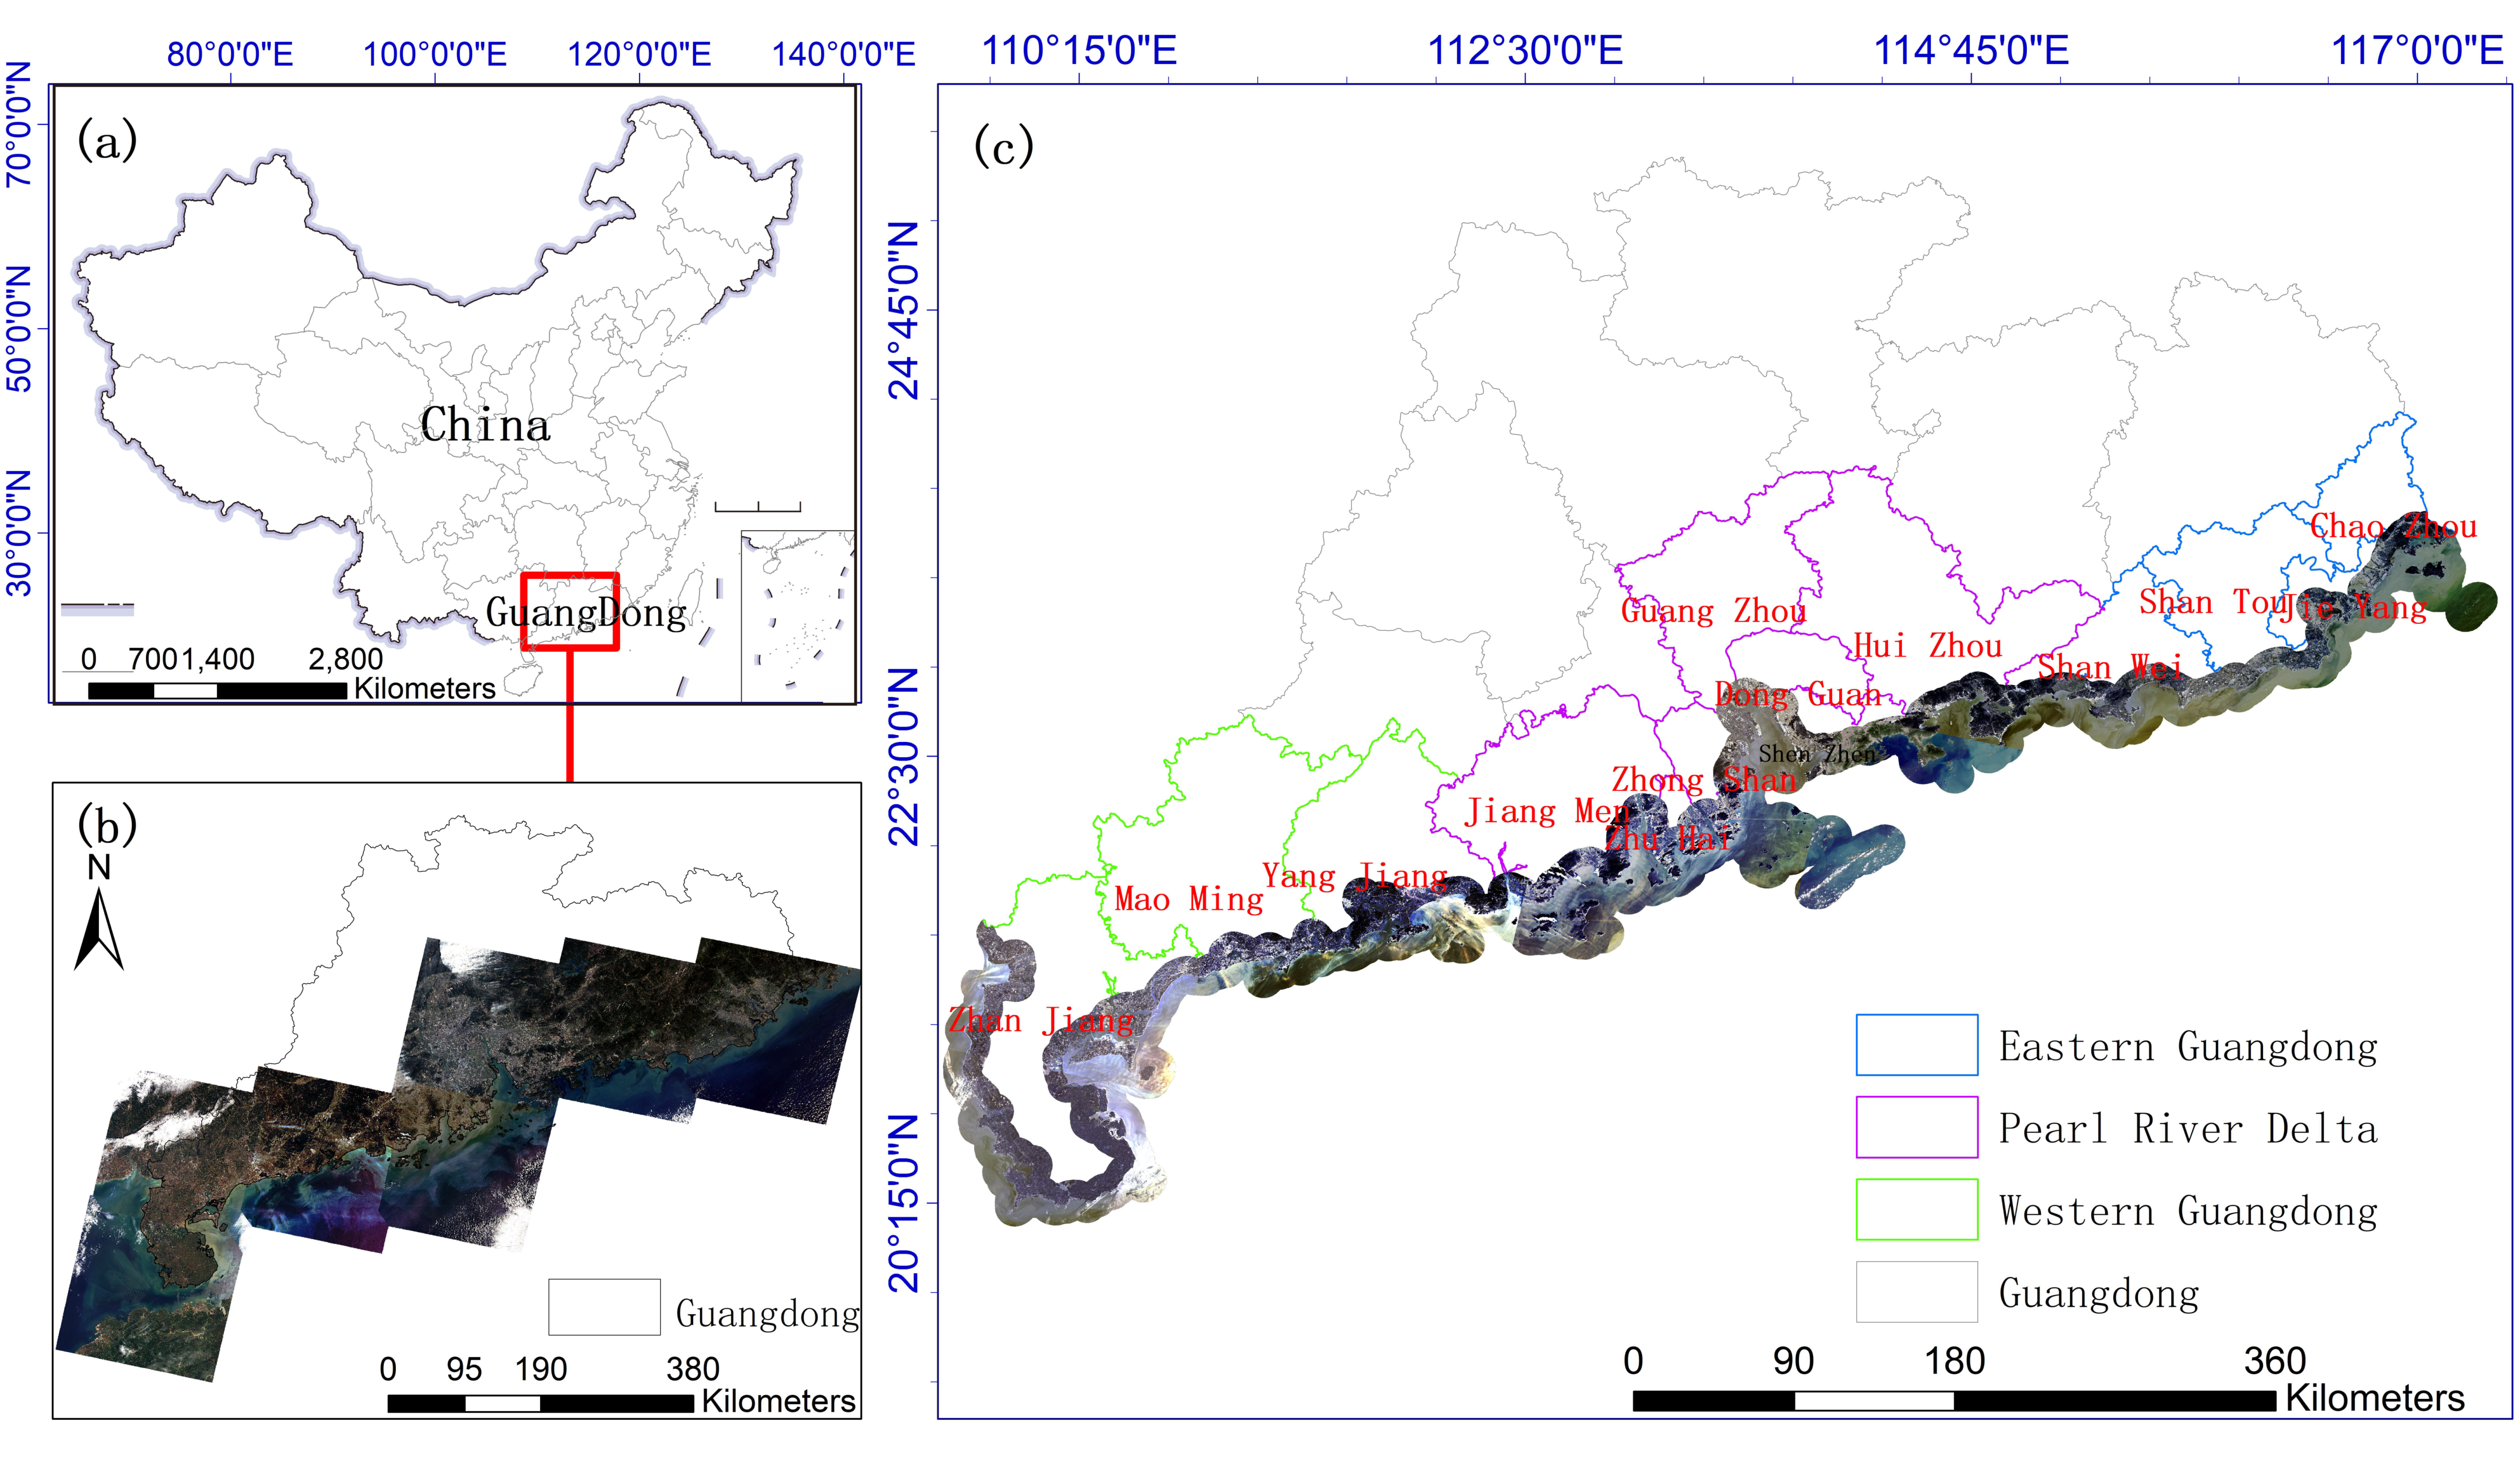
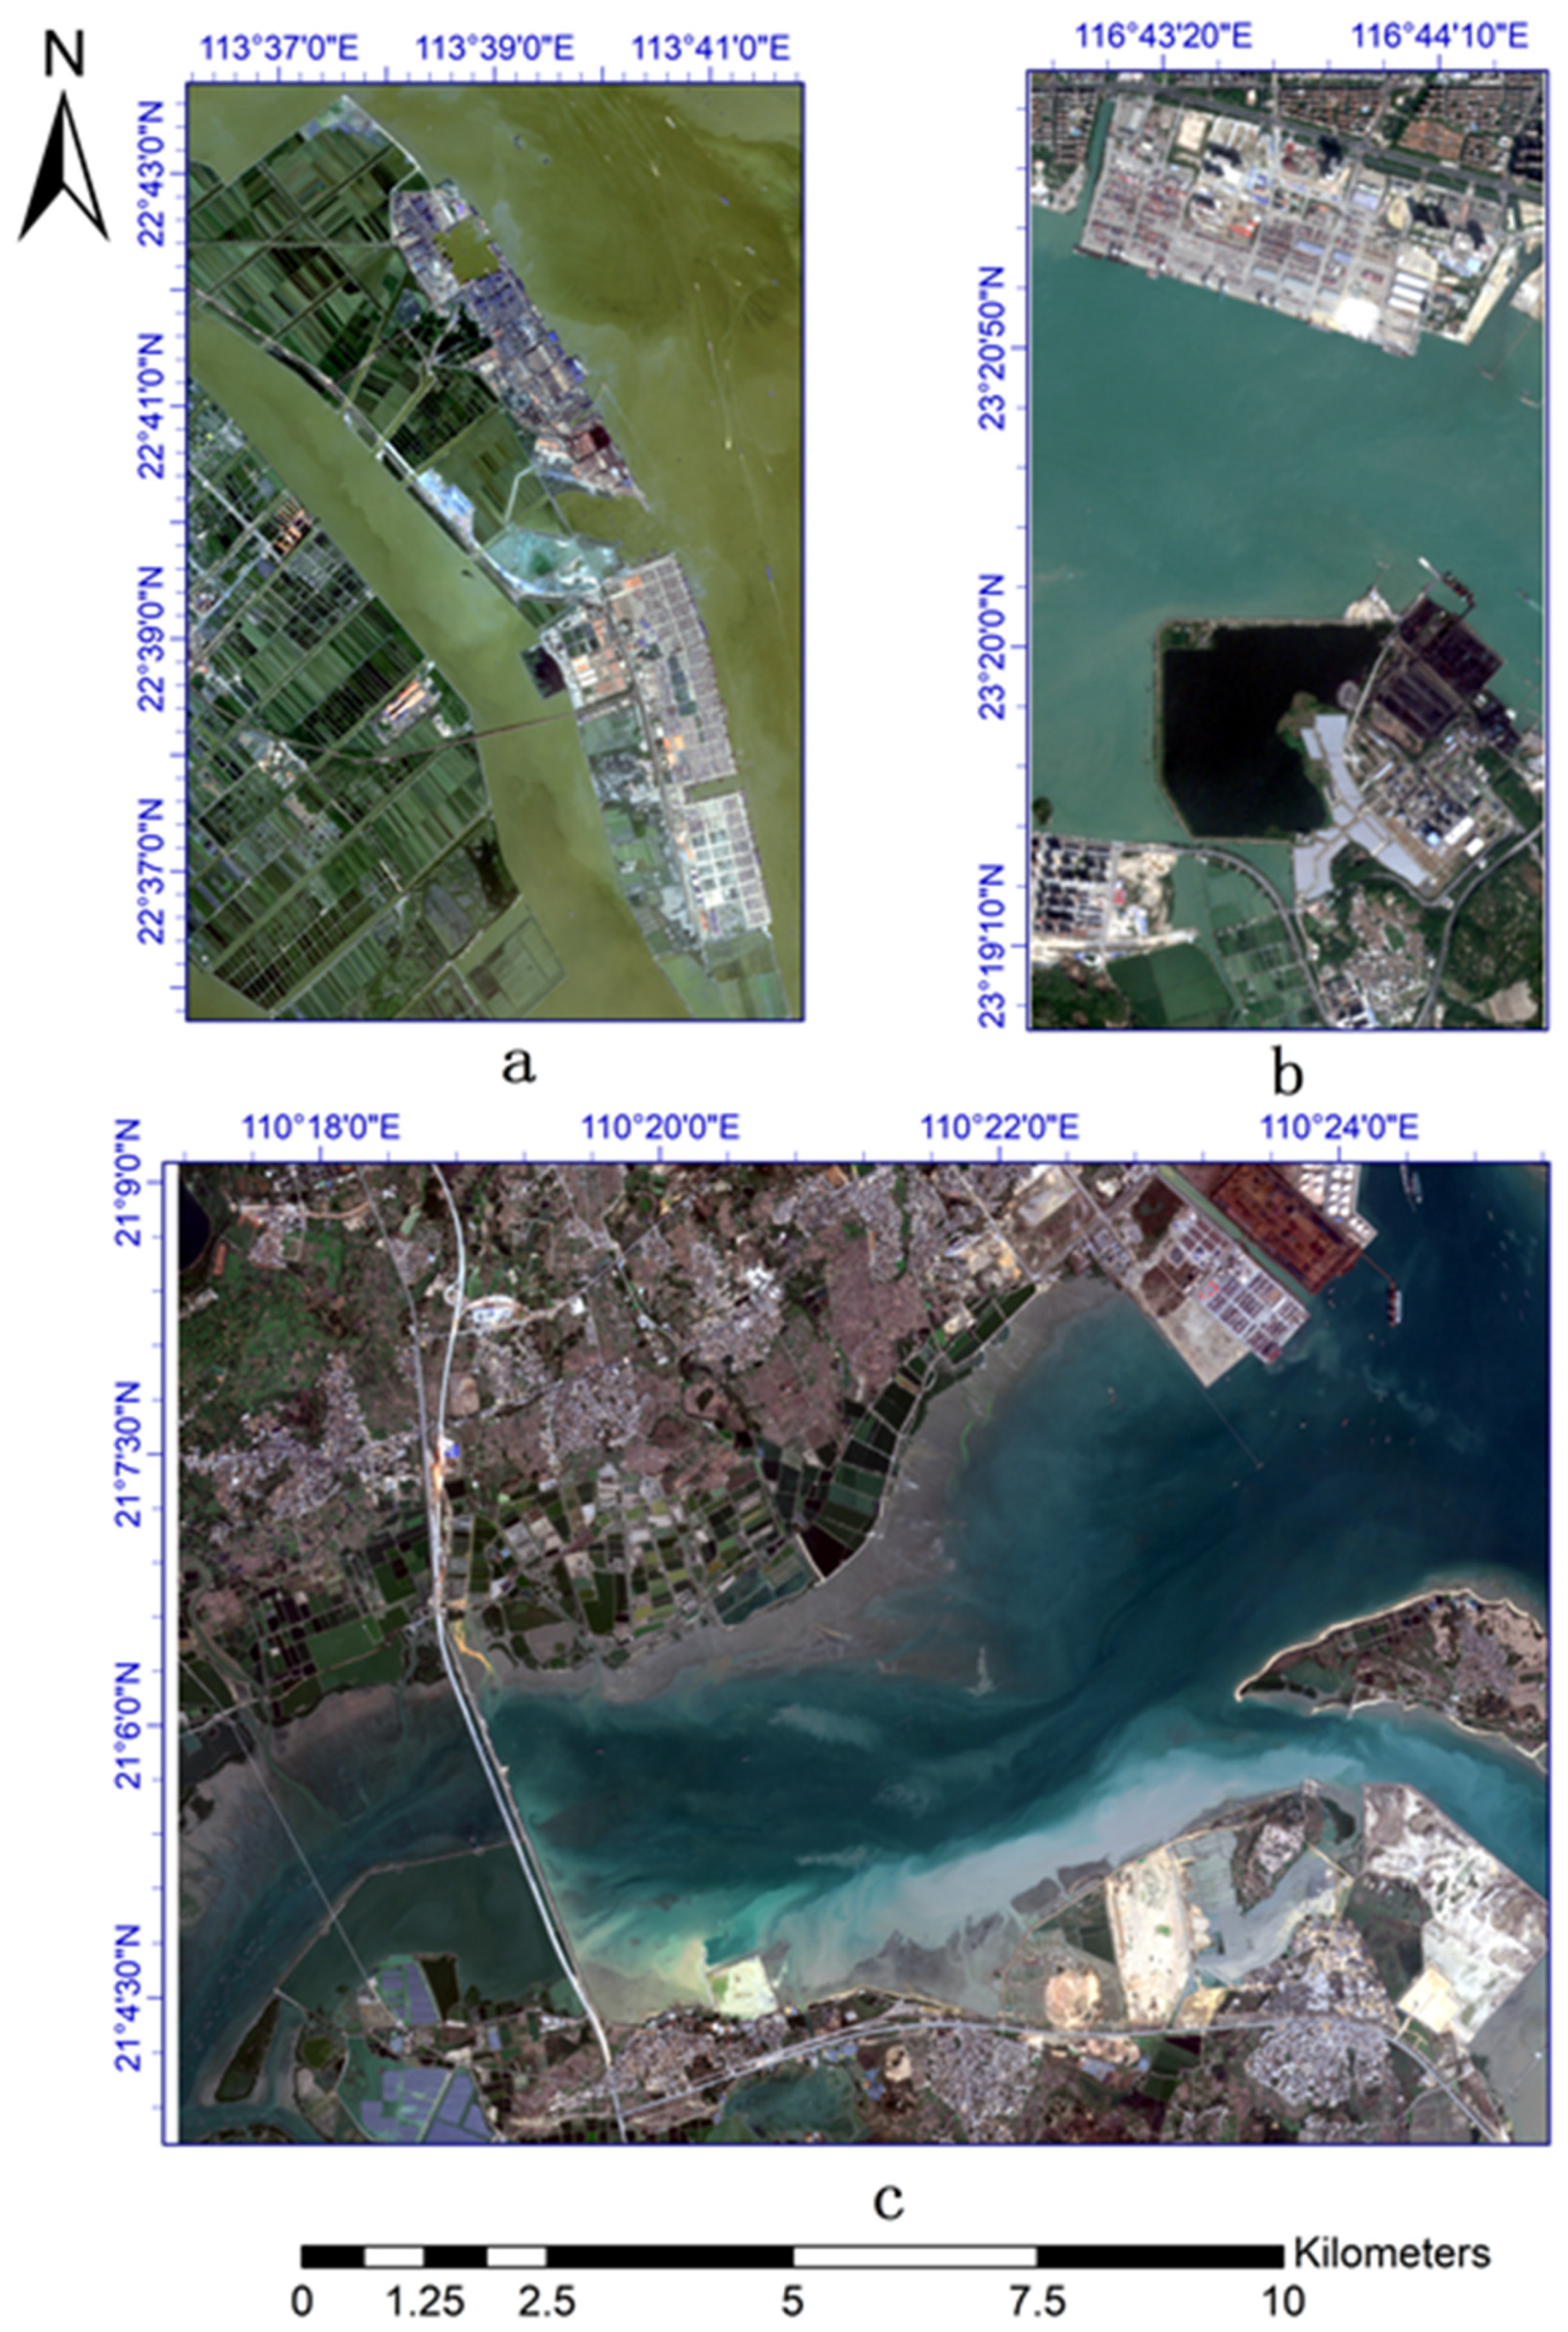
Three representative regions in west Guangdong, the Pearl River Delta, and east Guangdong were selected as examples to perform the four classification methods, as shown in 
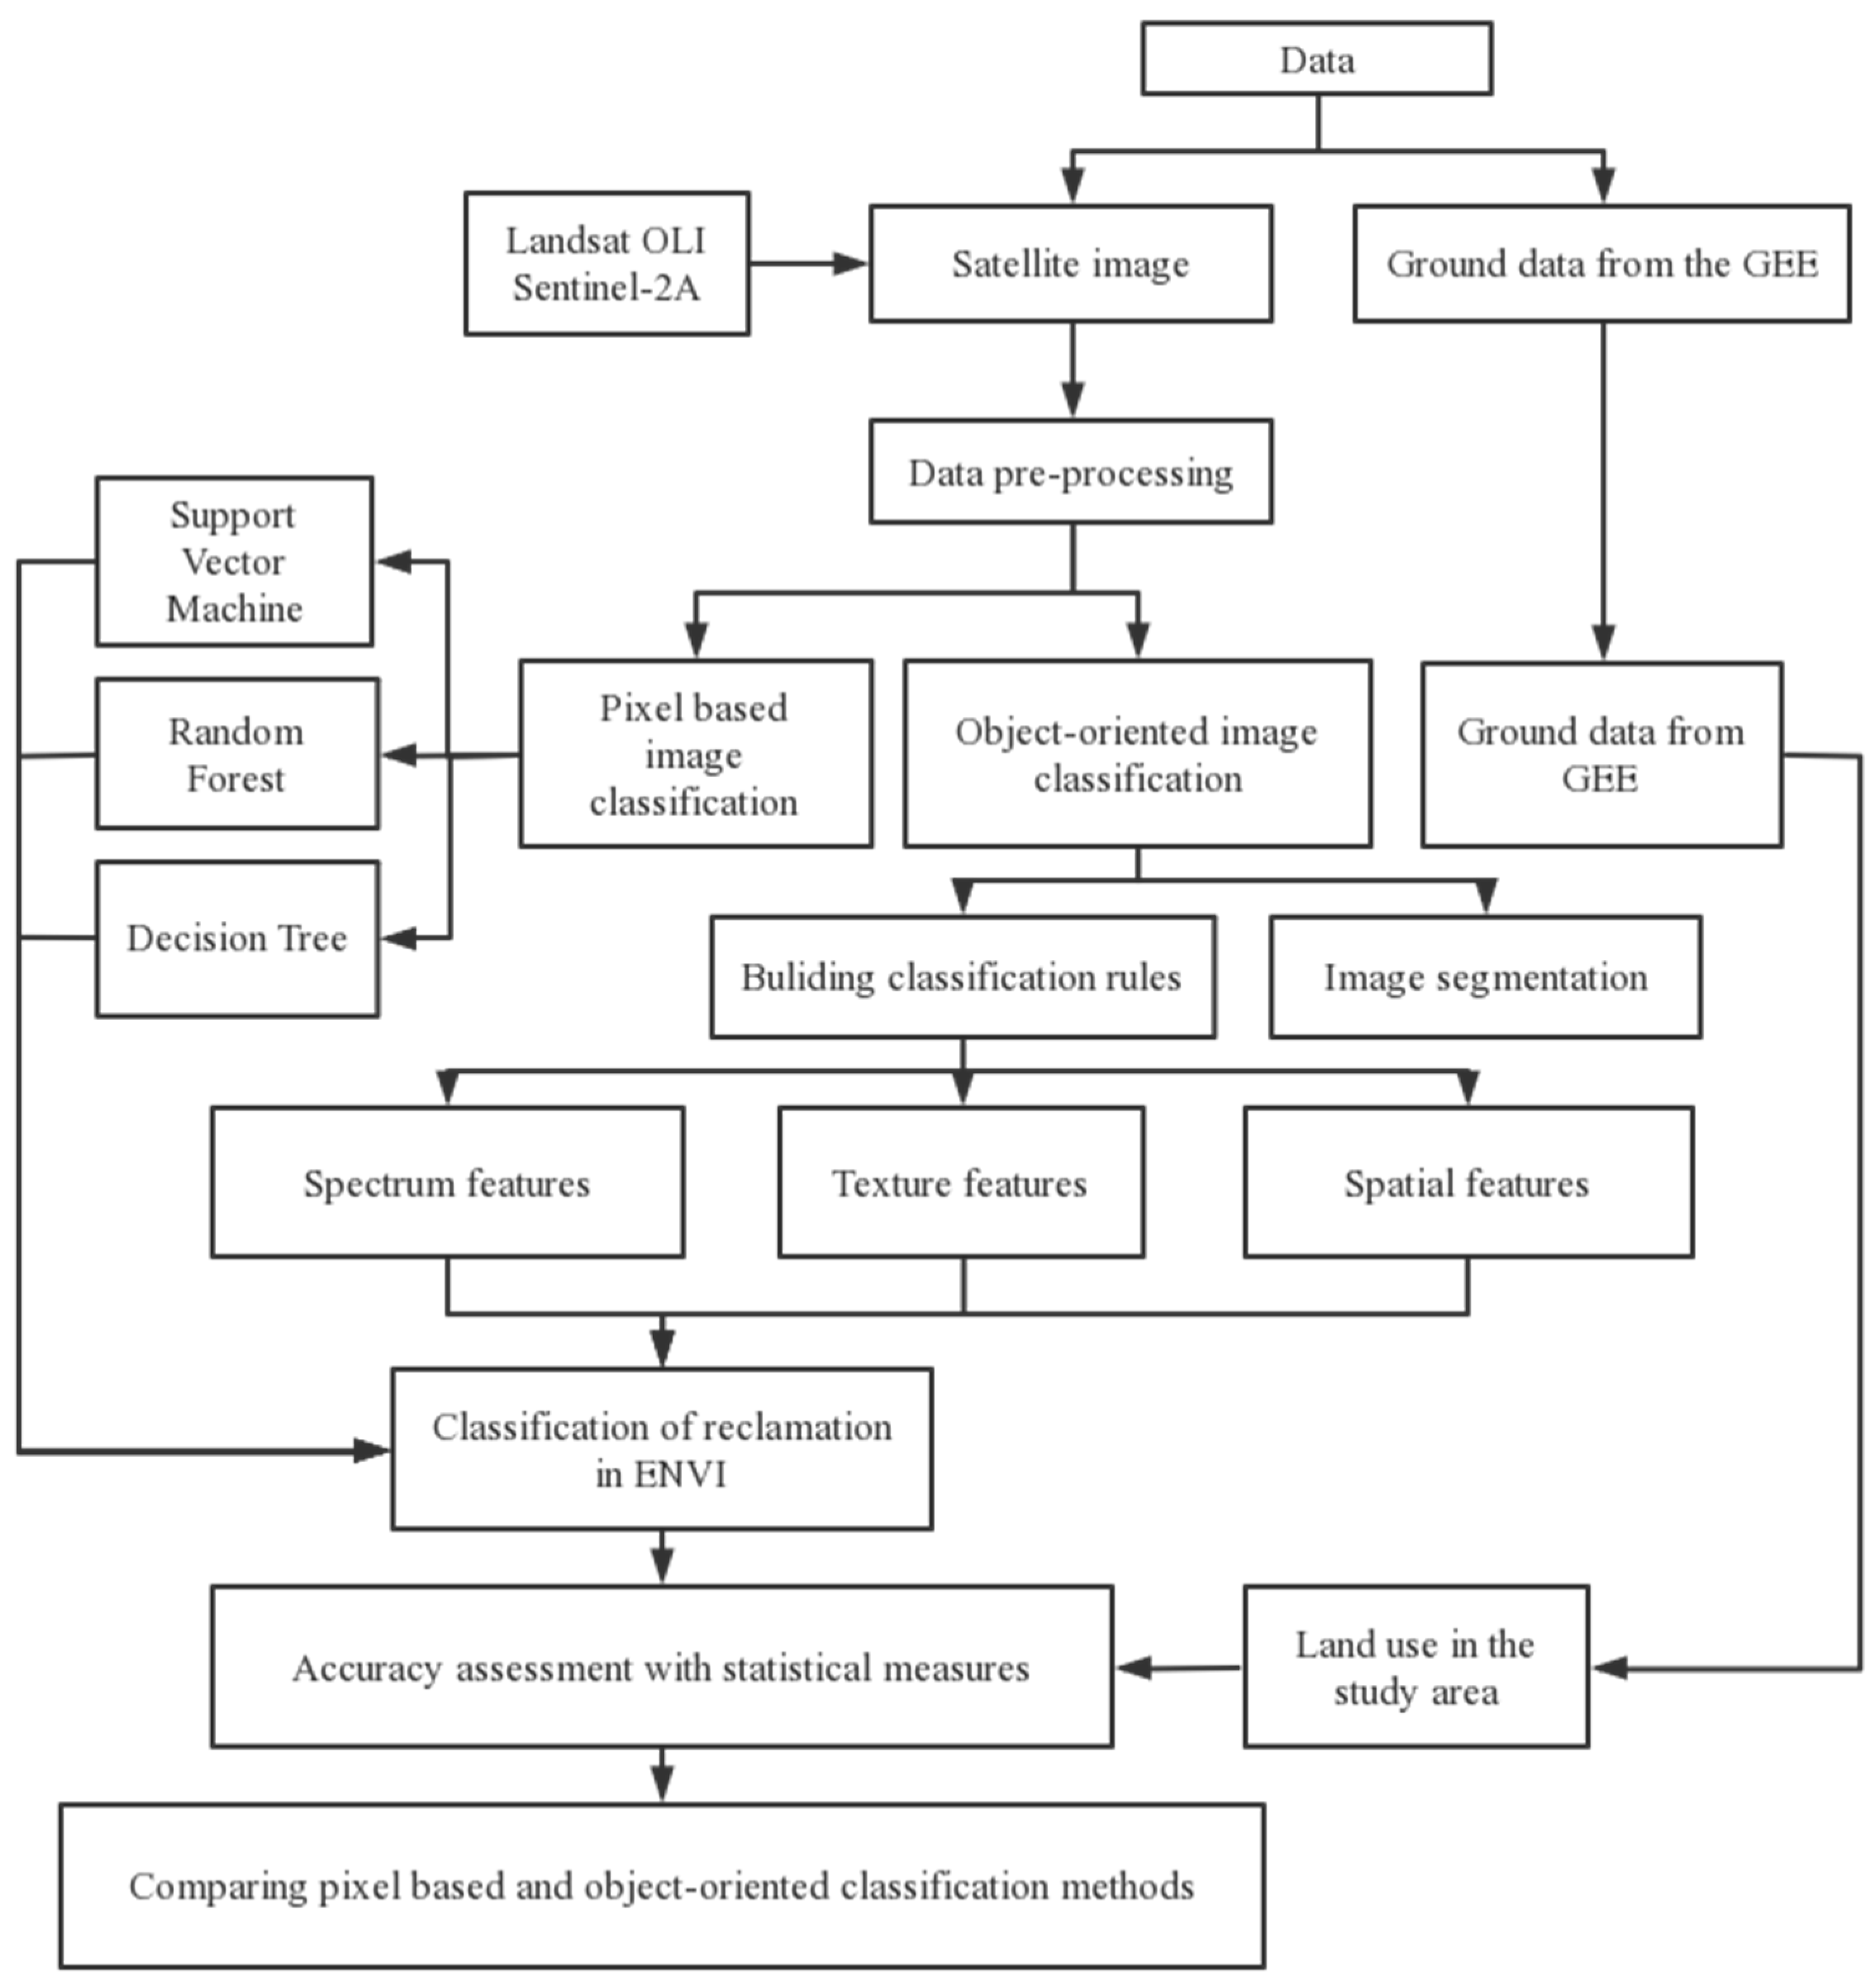
Figure 3. False-color composites were used for the selection of training data by referring to the established interpretation keys. The training data for ports, aquaculture ponds, and salt pans were interpreted manually in ENVI software. The spectral, texture, and spatial features were accordingly extracted and analyzed to support the classification algorithms with ENVI software. Table 5 shows the spectral ranges of reclamation in the three bands of blue, green, and red, variations in texture and area, which were counted with the training samples; some other bands and measurement indices, such as the Normalized Difference Built-up Index (NDBI) and Normalized Difference Water Index (NDWI), were further applied for identifying different types of reclamation that they may have similar spectral reflectance, and those values were not shown in this Table. As can be seen from Table 5, training samples of ports present relatively greater differences in spectral reflectance and texture features, while salt pans show relatively less difference in these features. Since the spectral characteristics of ports and the areas of both aquaculture ponds and salt pans in different areas are greatly varied, a rule-based object-oriented algorithm was applied for retrieving the reclamations’ classifications because of its flexibility, and a series of rules can be set according to the characteristics of reclamations in specific areas. The four algorithms were applied to extract the reclamations’ information from Landsat 8 OLI and Sentinel 2A MSI data in 2019. After preliminary classification, a majority analysis was implemented, and obvious errors were further eliminated. To assess the efficiency of the four algorithms in reclamation classification, reference samples were manually and randomly interpreted from the images with the resolution of 0.5m acquired in Google Earth. Referring to related research [43] and considering the total area and distribution characteristics of the reclamations in the three sun-regions, a total of 170, 113, and 32 reference samples were selected, respectively, as validation sites in west Guangdong, the Pearl River Delta, and east Guangdong. The number of verification sites for each reclamation type was assigned by referring to its proportion in each sub-region. Details about the verification sites are listed in Table 6. Values of all the accuracy indices for different classification algorithms and different images are shown in Table 7, Table 8 and Table 9.

4.1. Accuracy Evaluation

4.1.1. Application to Sentinel 2A MSI Data

As shown in Table 7, Table 8 and Table 9, the OA ranges from 83.05% to 88.57% when the algorithms were applied to Sentinel 2A MSI data over west Guangdong. The object-oriented classifier performed the best with the highest OA of 88.57%, while SVM performed poorest with the lowest OA of 83.05%. With respect to the Pearl River Delta, the OA varies from 86.47% to 88.50%. It can be seen that the object-oriented classifier produces the highest accuracy with the largest OA of 88.50%, and SVM has the lowest OA of 86.47%. The four classifiers demonstrated the poorest performance over east Guangdong among the three regions. OA was generally lower than those obtained in the other two regions. The object-oriented classifier remained the best with the highest OA of 84.40%, while the DT algorithm performed the poorest with the lowest OA of 77.32%. From the perspective of the Kappa coefficient, the object-oriented classifier obtained the highest value among all four algorithms. Its best performance was observed in the Pearl River Delta, with the highest value of 0.827, and its lowest value of 0.672 was in east Guangdong. It can be concluded that SVM performs poorest in west Guangdong and the Pearl River Delta, while DT retrieved the lowest value of 0.533 in east Guangdong.
Considering the accuracy index of PA, it measures the probability that the reference data for each corresponding reclamation category are correctly classified from the image. Evidently, four classifiers used in this study successfully distinguished the three types of reclamation use from each other, which shows some differences in different regions. For instance, in the application of all four classifiers to detecting the aquaculture ponds, the PA ranges from 84.14% to 93.75%, from 87.05% to 91.86%, and from 74.95% to 89.67% in west Guangdong, the Pearl River Delta, and east Guangdong, respectively. In comparison, DT shows the highest value of 93.75%, and SVM shows the lowest value of 84.14% in west Guangdong. The object-oriented method is the best, with the highest value of 91.86%, and DT performs the poorest, with the lowest value of 87.05% in the Pearl River Delta. If the four algorithms were applied in the extraction of salt pans, then PA ranges between the values of 76.95% and 91.07%, and 83.36% and 90.94%, in west Guangdong and the Pearl River Delta, respectively. Generally speaking, the object-oriented method can obtain the most accurate results, while SVM shows the lowest accuracy in these two regions. As for the type of ports, the DT algorithm shows inefficiency when it was applied in both west Guangdong and east Guangdong, with values of 68.55% and 77.32%, respectively. The four algorithms show very little difference in the PA values when they were applied in the Pearl River Delta. Additionally, the values of PA for the port classification are always lower than those for the other two types. In particular, the PA values of aquaculture ponds and salt pans are more stable than ports when applying an object-oriented classifier in the three regions.
Furthermore, from the perspective of the accuracy index UA, which is used to detect the proportion of pixels classified accurately, this presents the greatest difference among the four algorithms for classifying the three types of reclamation in different regions. In west Guangdong, RF and DT achieved a higher accuracy than SVM and the object-oriented method with values of 91.20% and 90.43%, respectively, for the classification of ports. SVM and the object-oriented method were better than RF and DT in the classification of aquaculture ponds, with values of 93.76% and 87.01%, respectively. Obviously, SVM was inefficient in extracting salt pans, with the lowest value of only 70.00%. In the Pearl River Delta, it was found that SVM reached the highest value of 95.53% when it was used for the extraction of ports, while it was the poorest in the extraction of aquaculture ponds. All four algorithms showed efficiency in classifying all types, with the values ranging between 80.48% and 95.53%. In east Guangdong, all four algorithms, particularly SVM and DT, showed lower inefficiency in the classification of ports, and these methods had great consistency in the extraction of aquaculture ponds, and the UA values were, overall, higher than 85%.

4.1.2. Application to Landsat 8 OLI Data

Regarding the reclamation classification from Landsat 8 OLI images, in west Guangdong, the object-oriented approach yielded the highest OA value of 86.39% and Kappa coefficient of 0.783, followed by RF with an OA value of 84.50% and Kappa coefficient of 0.749, and then followed by DT with an OA value of 82.62% and Kappa coefficient of 0.737; the poorest was SVM, with the lowest OA value of 81.36% and Kappa coefficient of 0.72. In the Pearl River Delta, the object-oriented approach yielded the highest OA value of 85.47% and Kappa coefficient of 0.782, followed by SVM with an OA value of 84.05% and Kappa coefficient of 0.758, and then followed by RF with an OA value of 83.76% and Kappa coefficient of 0.754, so the poorest classifier was DT, with an OA value of 81.36% and Kappa coefficient of 0.72. Applying those classifiers in east Guangdong, the object-oriented approach yielded the highest OA value of 83.13% and Kappa coefficient of 0.653, followed by RF with an OA value of 79.48% and Kappa coefficient of 0.562, and then followed by the SVM with an OA value of 83.76% and Kappa coefficient of 0.754; the DT performed poorest, with an OA value of 81.36% and Kappa coefficient of 0.72.
Compared with the accuracy indices of the PA and UA, the results indicate that there is great variation in the results from different methods in different regions. In west Guangdong, RF showed the lowest PA and UA values when it was applied to the classification of aquaculture ponds, yet it obtained the highest UA value of ports. In the Pearl River Delta, SVM showed the most efficiency in the classification of ports yet the most inefficiency in classifying aquaculture ponds when only considering the accuracy index of UA. The object-oriented method performed best when classifying aquaculture ponds compared with the accuracy index of PA. In east Guangdong, SVM was unable to obtain a desirable classification of ports whether considering the accuracy index of PA or UA, and all four algorithms showed inefficiency in classifying ports, with UA values less than 75%. They can all be efficient in classifying aquaculture ponds in terms of UA index.
According to the comparison presented above, both the OA and PA of aquaculture ponds and salt pans derived from Sentinel 2A MSI data (resolution 10 m) are generally higher than those derived from Landsat 8 OLI data (resolution 30 m). However, on the contrary, the PA of ports classified by the object-oriented method from Sentinel 2A MSI data was always lower than that obtained from Landsat 8 OLI. We also made a comparison of reclamation classification results among the three regions and found that there were some differences in the statistical measures. Almost all of the algorithms generally achieved lower accuracies of reclamation classification in east Guangdong. Additionally, it was found that the accuracy of ports was abnormally high in the Pearl River Delta, especially when we applied SVM to perform the classification.
Furthermore, based on Equation (3), McNemar’s test with p < 0.05 was performed; the values of Z also confirmed that the object-oriented method could achieve significantly better classification results from Sentinel 2 MSI data than those from Landsat 8 OLI data. The values of McNemar’s test presented some differences among the three regions as follows: Z = 9.35, p < 0.05 for west Guangdong, Z = 5.01, p < 0.05 for the Pearl River Delta, and Z = 9.8, p < 0.05 for east Guangdong.

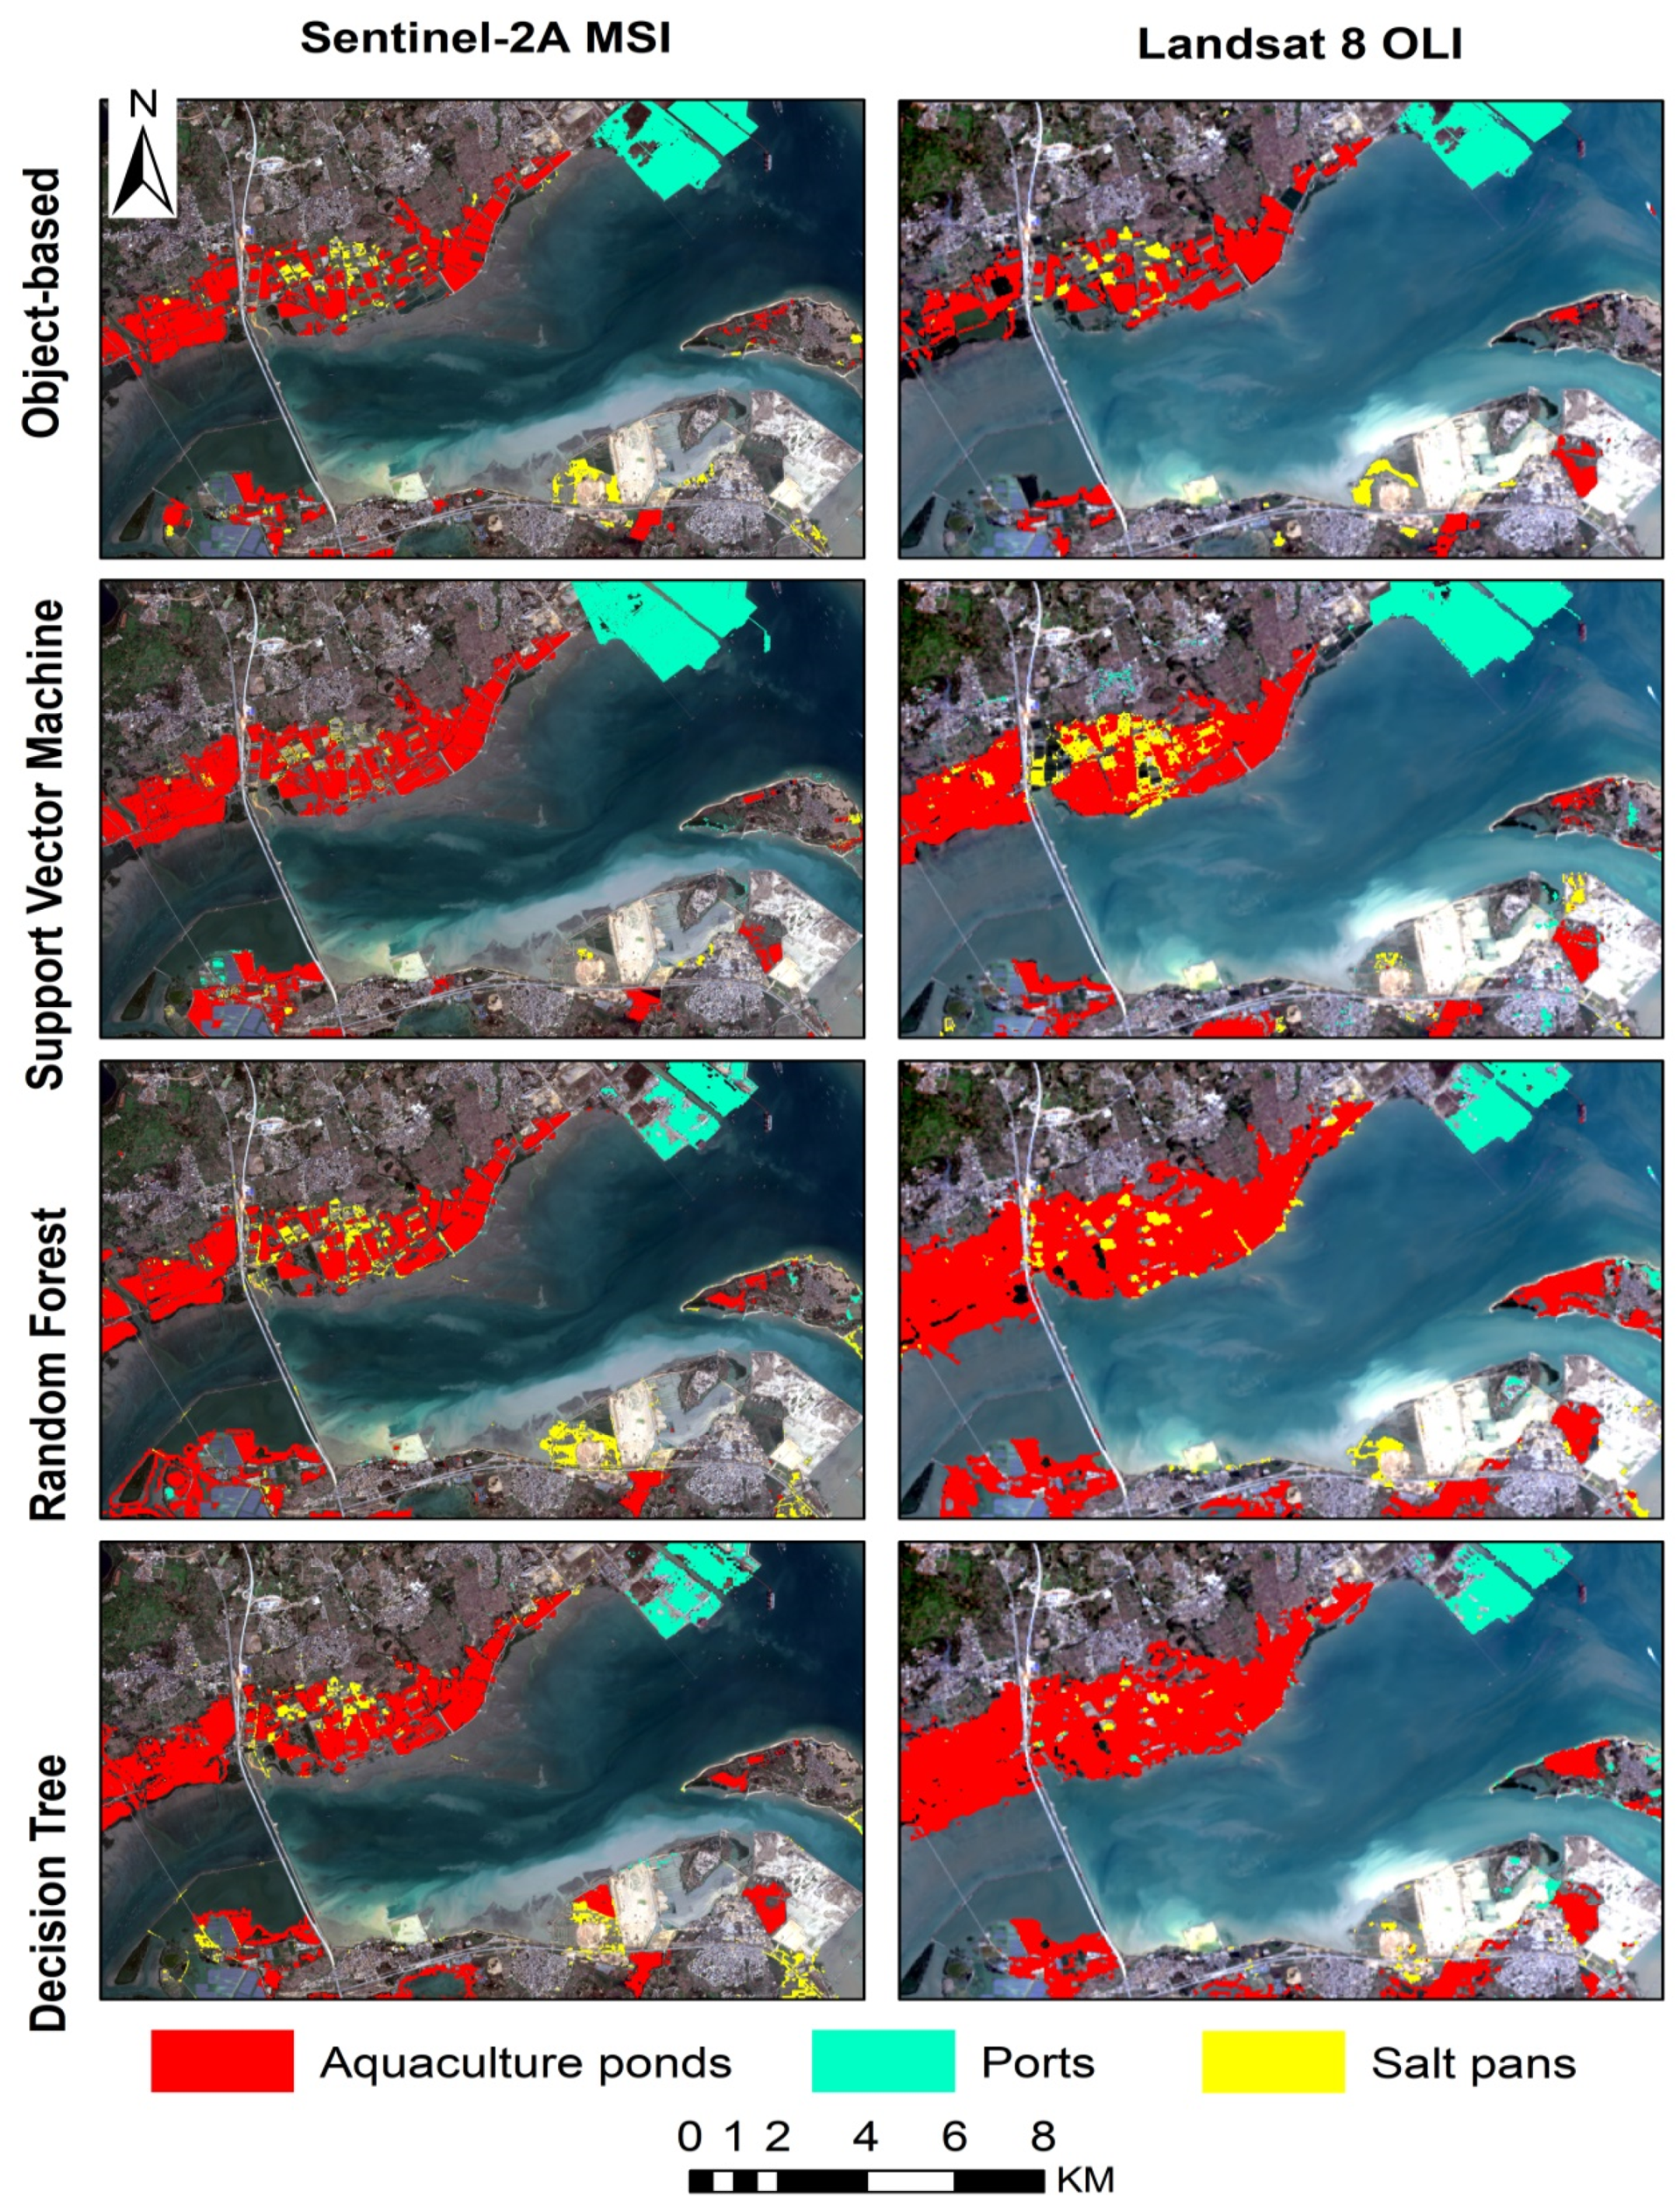
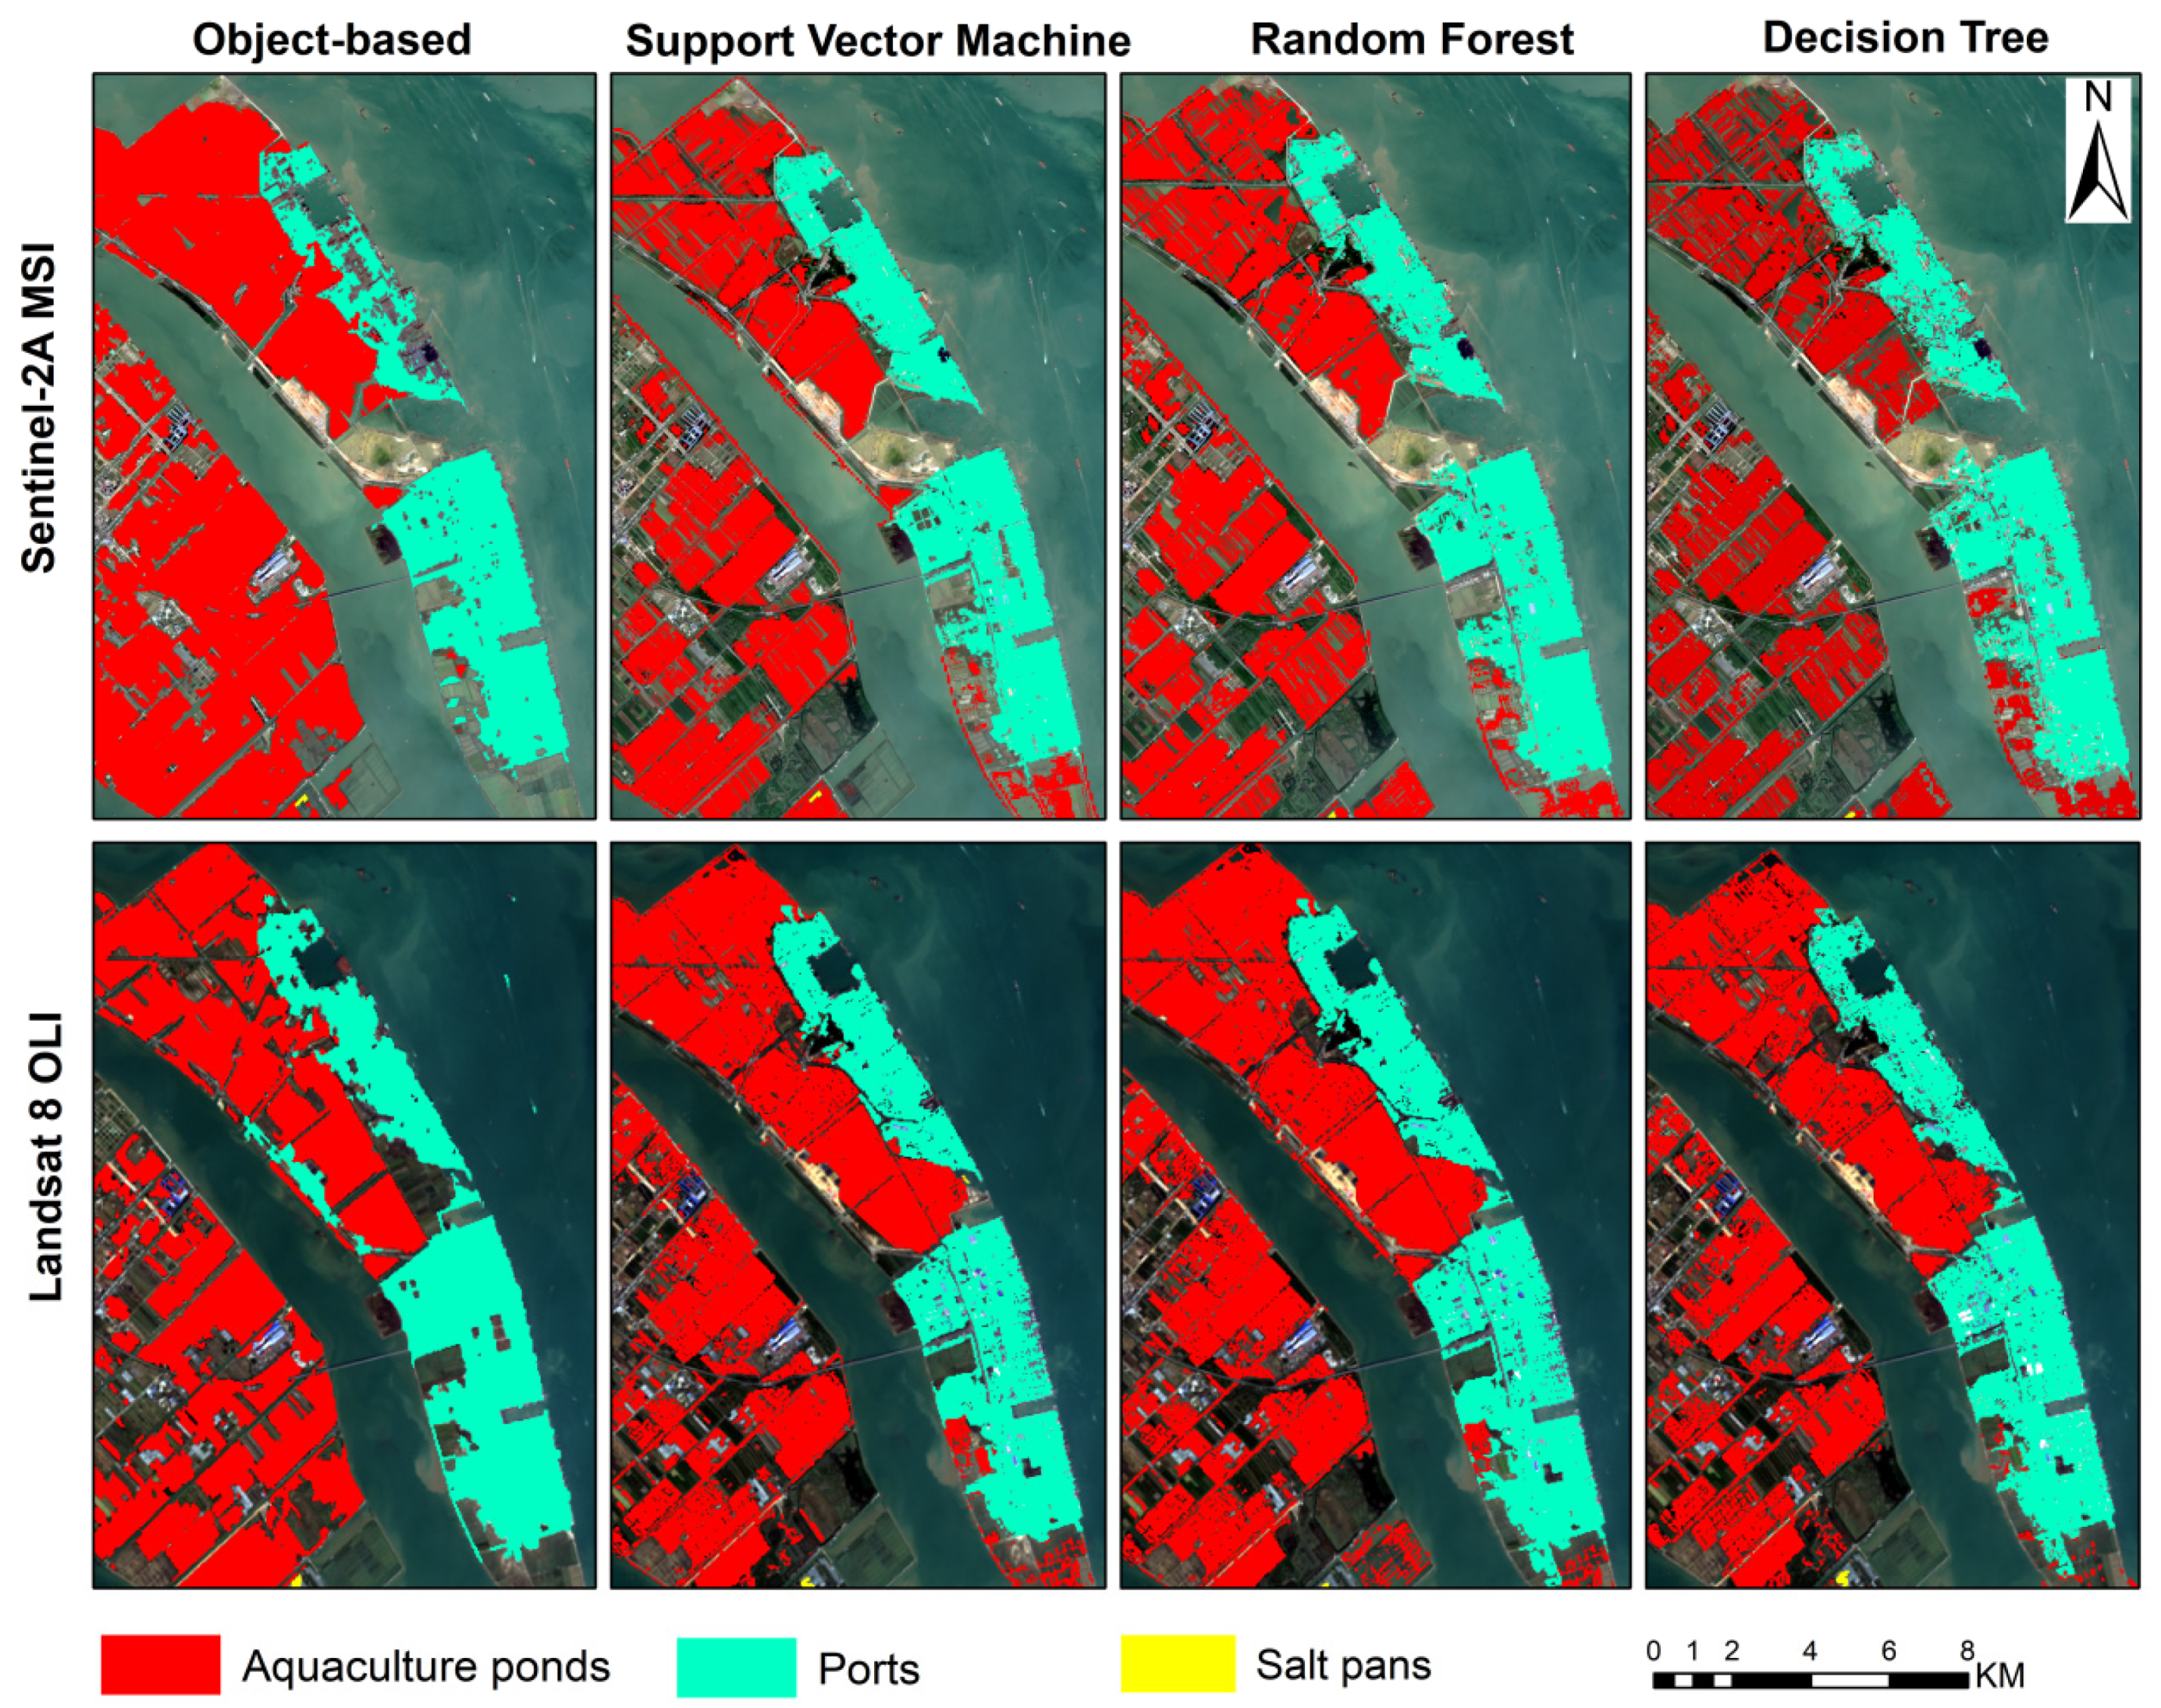
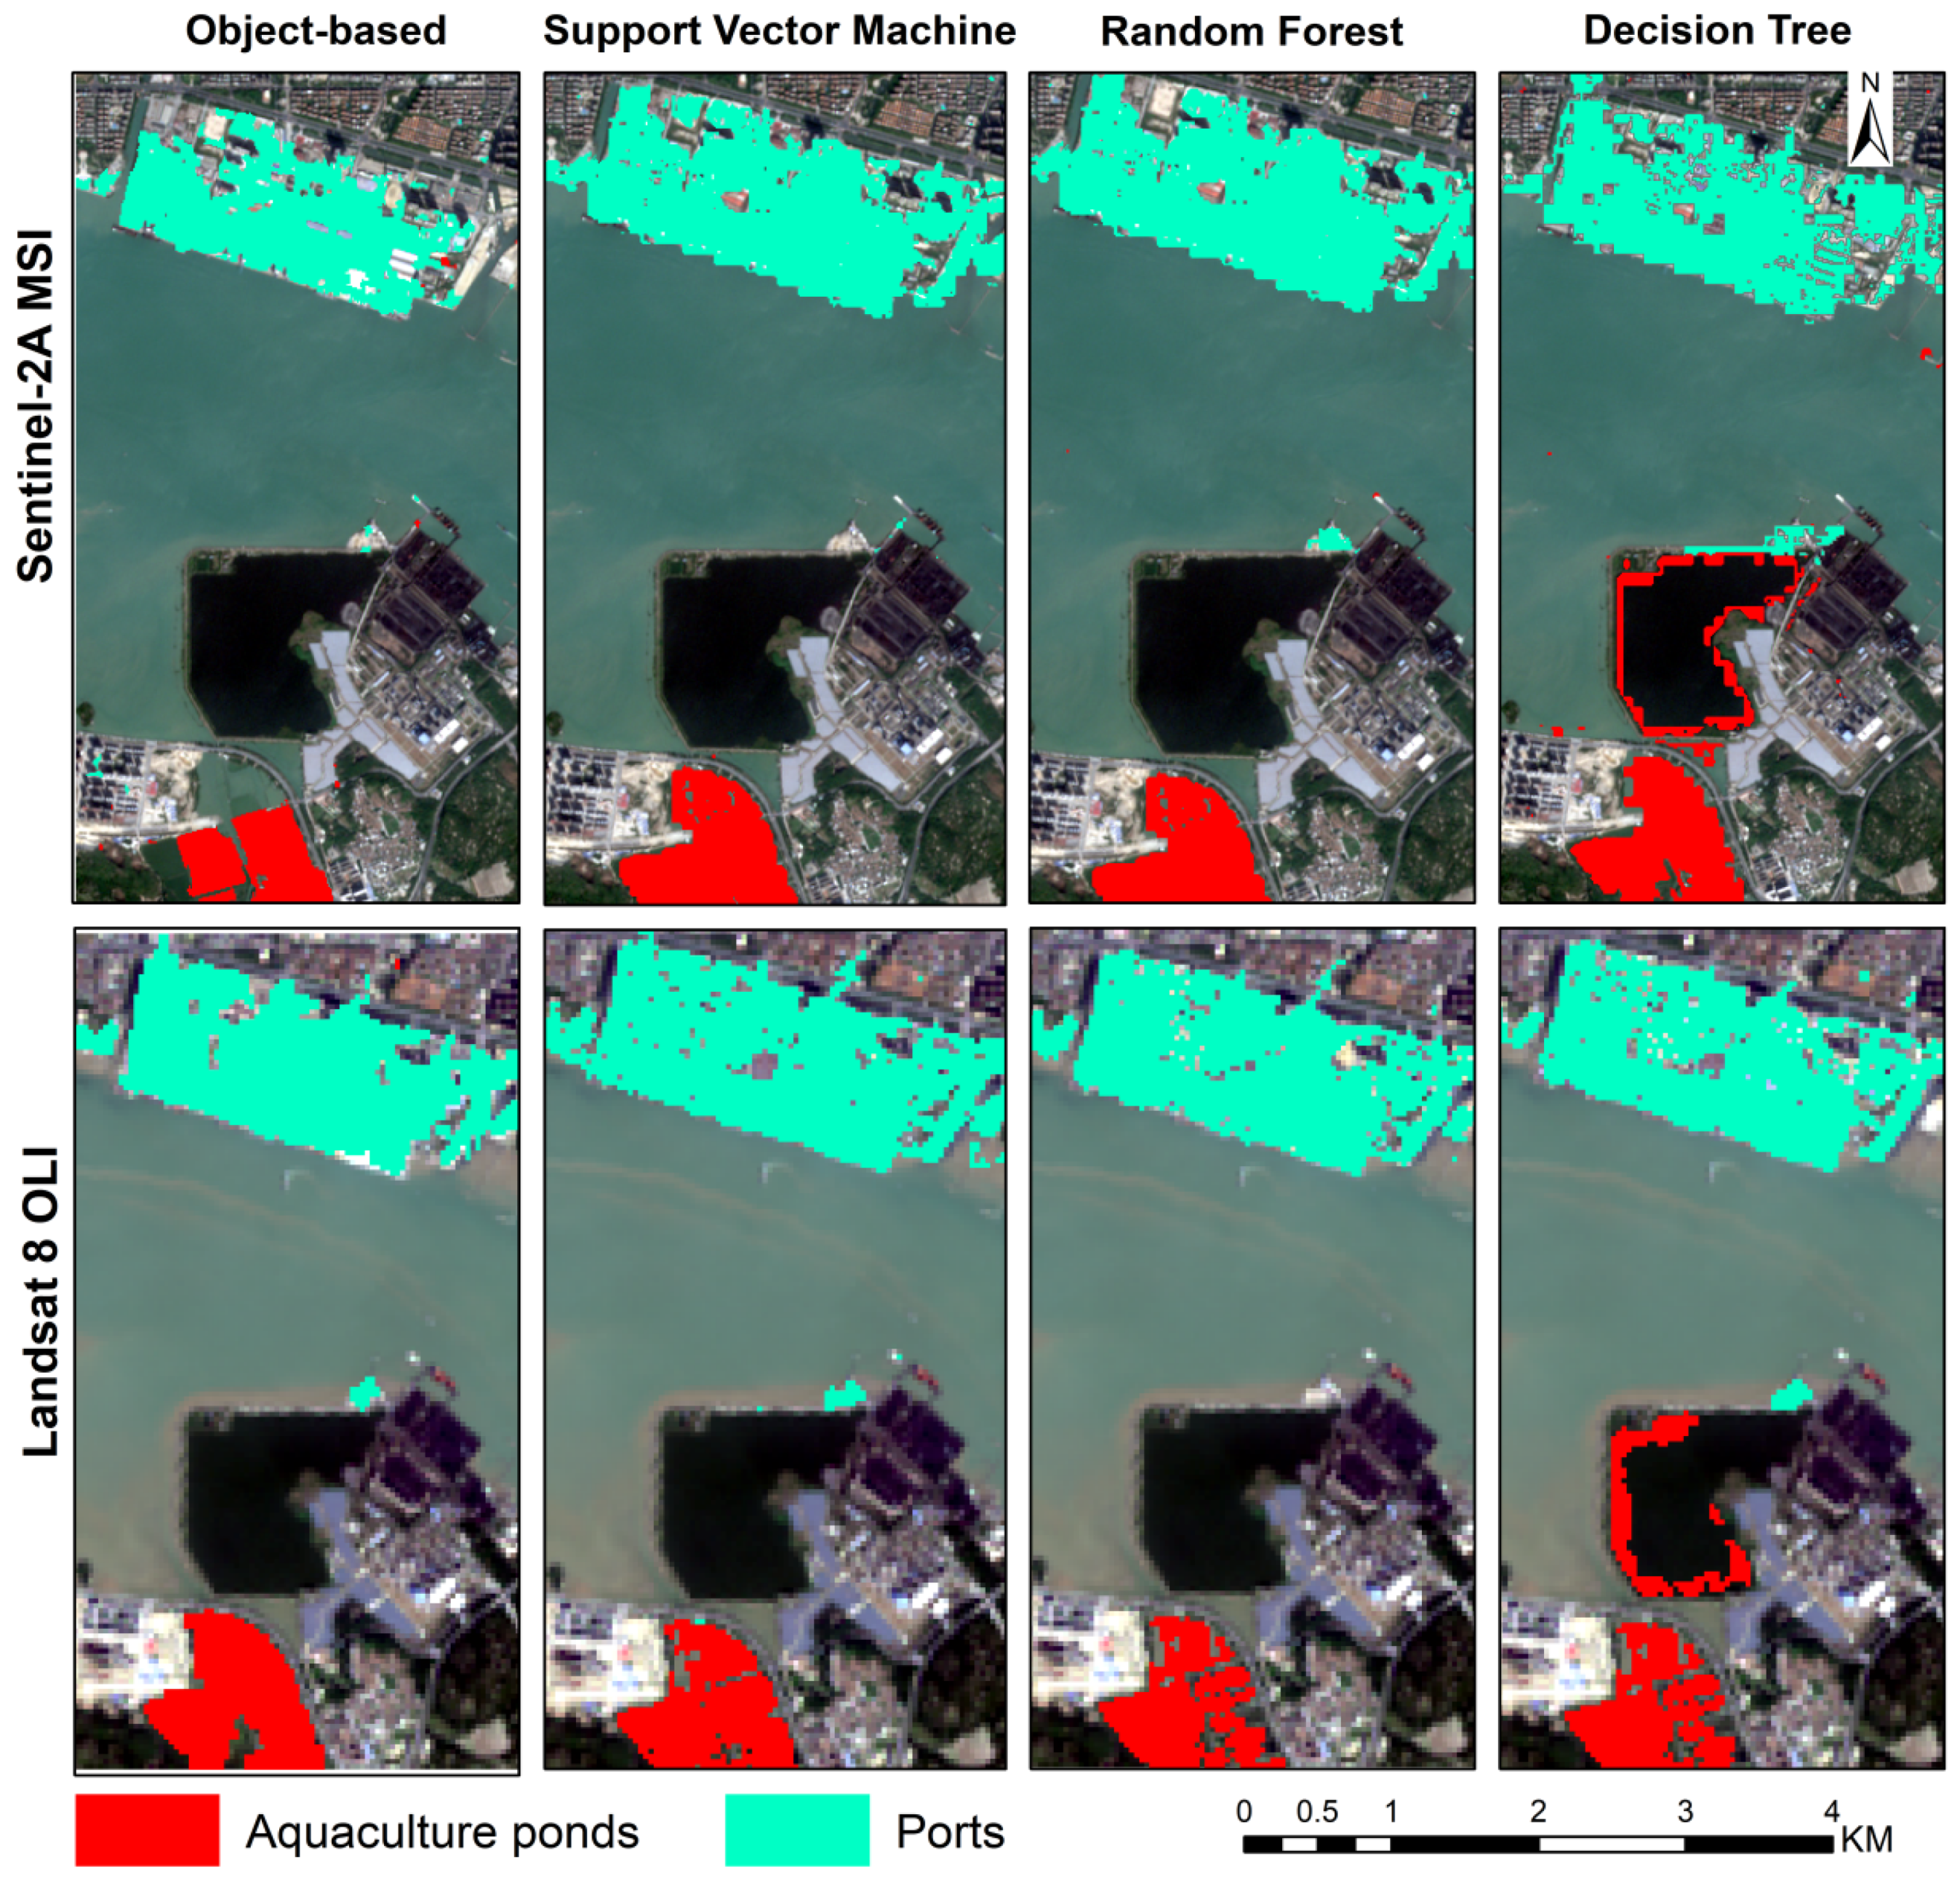
4.2. Detailed Comparison of the Classification Pattern

Figure 4, Figure 5 and Figure 6 show classification results from different algorithms with Landsat 8 OLI and Sentinel 2A MSI data. Based on visual inspection, the pixel-based algorithms mistakenly classified mixed pixels around the edges of coastal reclamation, resulting in the increase in reclamation areas. As shown in Figure 4, the water body enclosed for use is easy to be identified as aquaculture, while ports are difficult to be distinguished from urban lands in west Guangdong. It can be found that relatively complete port patches can be derived from Landsat 8 OLI data, whereas those derived from the object-oriented method using Sentinel 2A MSI data are most fragmented in the Pearl River Delta (Figure 5). These differences may be caused during image segmentation because ports in the higher-resolution image present complicated characteristics. There is no obvious difference between reclamation classifications from Landsat 8 OLI and Sentinel 2A MSI data using the three pixel-based classifiers over east Guangdong. As shown in Figure 6, there is no apparent discrepancy between reclamation classifications from Landsat 8 OLI and Sentinel 2A MSI with the object-oriented and DT classifiers. In addition, SVM and RF classifiers can obtain similar results whether from Landsat 8 OLI or from Sentinel-2A MSI. Observed port patches from Sentinel-2A MSI data are more fragmented than those from Landsat 8 OLI data.

5. Discussion

5.1. Spatial Pattern of Reclamation over Coastal Guangdong

The shape and optical characteristics of aquaculture ponds and salt pans are relatively simple, and the object-oriented classifier is, overall, accurate in extracting the reclamations of aquaculture ponds and salt pans considering the values of OA, UA, PA, and Kappa coefficient, as stated above. Additionally, the values of these accuracy indices for Sentinel 2A MSI data are generally higher than those for Landsat 8 OLI images. The pattern of those two types from Sentinel 2A MSI data is clearer, and the location of those two types is more precise than Landsat 8 OLI. Therefore, the object-oriented classifier was used in the Sentinel 2A MSI data to map the coastal reclamation use of aquaculture ponds and salt pans in Guangdong Province with uniform classification rules, and there were dissimilar characteristics of shapes and spectral reflectance in some ports in different regions, and ports derived from Landsat 8 images were more accurate overall than Sentinel 2A MSI data. We adopted different classification rules for east Guangdong, the Pearl River Delta, and west Guangdong to extract ports from Landsat 8 OLI data. All the retrieved classifications were finally merged and used as the final classification result of reclamation uses. A total area of the different reclamation uses in each coastal city was calculated and is shown in Table 10, and the distribution pattern of the derived reclamation use overlaid with the remote sensing image is shown in Figure 7.
Since there is a great difference in the development strategy and locational conditions among the Pearl River Delta, eastern Guangdong, and western Guangdong—for example, the Pearl River Delta has been developed rapidly, while eastern Guangdong and western Guangdong are mainly oriented to maintain the development of agriculture and fisheries—the spatial distribution of the reclamation use reflects this actual situation and is consistent with previous studies [3,23]. This indicates that aquaculture ponds are almost all along coastal Guangdong and account for the largest proportion. As shown, aquaculture ponds are concentrated in the eastern and the western region of Guangdong. They are widely distributed in Zhanjiang, Jiangmen, and Shantou, with areas of 18,650 ha, 11,592 ha, and 9519 ha, respectively. The reclamation area used as ports is concentrated in the urban agglomeration of the Pearl River Delta, ranking first in terms of the total area, and 66% of the total reclamation ports are distributed in Guangzhou, Shenzhen, Dongguan, and Zhuhai City. This distribution pattern indicates that the dominant type of reclamation is highly correlated with the level of economic development and transportation demand. Most of the ports are concentrated in economically developed areas, such as the Pearl River Delta region, while aquaculture ponds and salt pans are mainly concentrated in rural areas within eastern and western Guangdong. Combining the status of economic development and the distribution pattern of the dominant reclamation type in a region, suggestions for urban growth and territorial development in the coastal zone of Guangdong Province can be further proposed.

5.2. Limitations of Reclamation Classification

As described before, the object-oriented classifier first divides the image pixels into the homogeneous objects and then classifies these objects into corresponding types based on the spectral, spatial, textural, relational, and contextual information. SVM, RF, and DT, which are pixel-based classifiers, cannot integrate multiple features (such as the Digital Elevation Model (DEM), spectral information, the result of Iterative Self-organizing Data Analysis Technique (ISODATA), the result of Minimum Noise Fraction (MNF), abundance, and so on) into the training dataset. Object-oriented methods have been proved to have higher overall accuracy (OA) than pixel-based classification algorithms, especially for high-resolution data [44]. However, we found that the object-oriented algorithm showed less efficiency than other algorithms in classifying ports. The main reason for this is that the features of ports vary greatly; though most ports’ shapes are of a regular rectangle, parts of ports for special purposes have a unique spectral characteristic and different sizes. This situation makes it necessary to separately set up specific classification rules for different ports. For example, a port located in East Guangdong, which is used to transport coal, cannot be identified under the uniform rules set in the object-oriented classifier; meanwhile, the features of aquaculture ponds and salt pans are relatively simple—with little change in different regions, it is easier to obtain specific classification rules.
Analyzing the features of image-interpretation keys and the traits of the object-oriented method, we can find that lots of shades formed by the containers in the ports exhibit dissimilar colors, and tall buildings in the port present shadows in the high-resolution image; this greatly influences the results of homogeneous object segmentation and correspondingly lowers the accuracy of classification results. For example, sometimes, the shape of ports in the classification results from Sentinel 2A MSI data wasn’t derived entirely, and the pattern of those ports was broken. Therefore, it can be concluded that the high-resolution Sentinel 2A MSI data were not always superior to lower-resolution Landsat 8 OLI data in the classification of reclamation use.
Considering that typical reclamation uses can be selected in the training samples and the impact of land covers distributed inland can be rescued, we selected a smaller example area in east Guangdong than the other two regions. This led to fewer training samples and may have caused lower accuracy in applying classification algorithms in east Guangdong. Furthermore, we found that the ports are dominant objects with remarkable distinguishing features in the Pearl River Delta, which resulted in higher accuracies in the classification of ports in this area. Overall, considering the actual condition that aquaculture is dominant while ports and salt pans are in the minority in Guangdong Province, it is the best choice to apply the object-oriented method in Sentinel 2A MSI data when mapping reclamation use, and this was also validated with the result of McNemar’s test. There is speculation that this methodology framework can also be applied to other coastal zones where reclamation is mainly aquaculture ponds, ports, and salt pans. However, limited by the short time series of Sentinel 2A MSI data, it cannot achieve the long temporal change of reclamation uses at a large scale; improving the performance of classification algorithms applied in Landsat 8 OLI data is expected to offer the dynamics and show the environmental influence of reclamation uses with long time series.

6. Conclusions

Accurately identifying and mapping reclamation uses at a large scale is meaningful to regulating the use of sea resources. In this study, remote sensing was induced to retrieve reclamation information; four typical classifiers were used in Landsat 8 OLI and Sentinel 2A MSI data to derive the reclamation use, and a series of accuracy indices, namely, overall accuracy, producer accuracy, user accuracy, Kappa coefficient, and McNemar’s test, were calculated to provide a reference for choosing suitable methods and data. The results validated that the object-oriented classifier, overall, performs the best in reclamation classification, with relatively high-resolution Sentinel 2A MSI images. McNemar’s test confirmed that the differences in classification performances among the sub-regions were statistically significant for the Sentinel 2A MSI and Landsat 8 OLI data using object-oriented algorithms. It can also be concluded that high-resolution data were not always superior to low-resolution data in identifying the reclamation uses when the reclamation objects presented complicated and varying attributes.
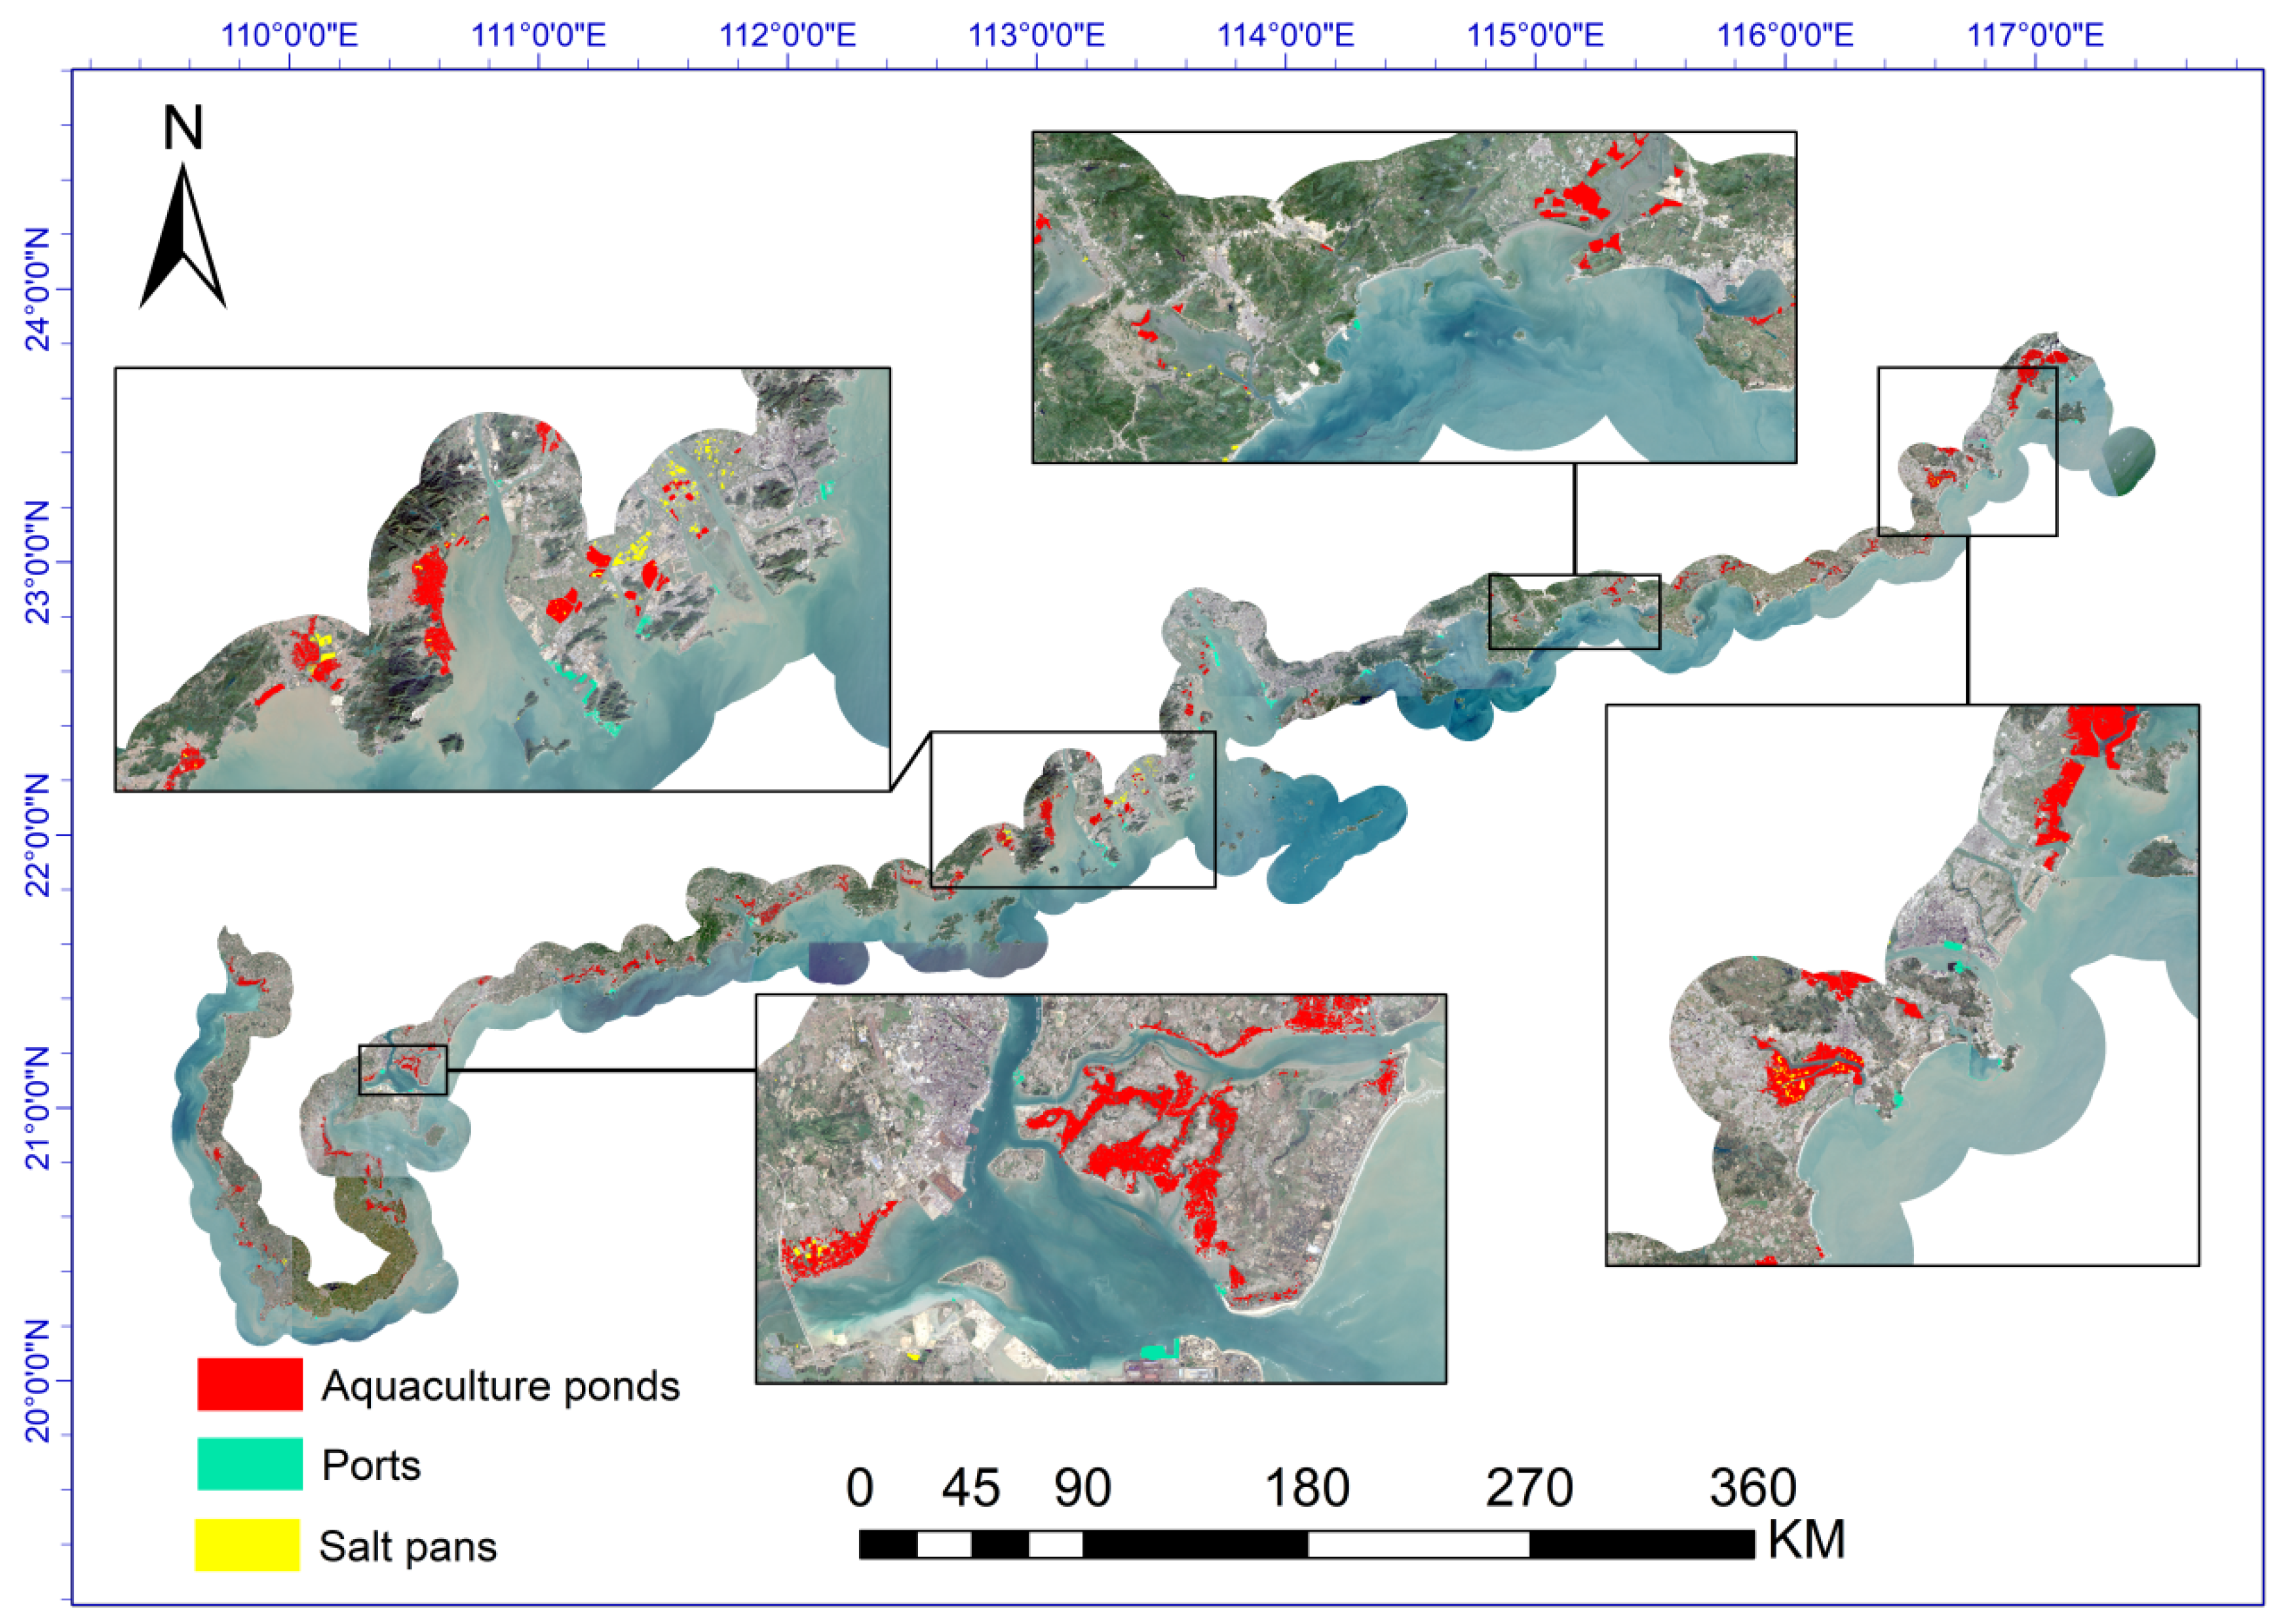
The object-oriented classifier was used to derive the reclamation area and to identify the types from Sentinel 2A MSI images in coastal Guangdong. The result shows that the spatial distribution of reclamation use presents geographical characteristics; aquaculture ponds, with a total area of 77,963 ha, are dominant in the three types of reclamation use. They are mainly distributed in both the western and eastern parts of Guangdong. Ports, with a total area of 8146 ha, are mainly distributed in the Pearl River Delta. Salt pans, with a total area of 4072 ha, are mainly distributed in Jiangmen, Zhuhai, and Zhongshan. The classification pattern of reclamation use is highly consistent with the actual situation of coastal Guangdong.
However, considering the extensive ongoing coastal reclamation in China, monitoring the dynamics of coastal reclamation at local, regional, and national scales is of great importance for sustainable management. As is noted in ‘Outline Development Plan for the Guangdong–Hong Kong–Macao Greater Bay Area’, which was promulgated by the CPC Central Committee and the State Council in 2019 February, ‘green development and ecological protection’ is one of the basic principles for promoting the sustainable development of the Greater Bay Area; it is significant to choose suitable data and a classifier to detect the spatiotemporal change of the main reclamation uses in Guangdong. This study will provide a good reference and basic data for the strategy of the Outline Development Plan.

Author Contributions

Conceptualization, B.A.; methodology, K.H. and B.A.; validation, K.H. and B.A.; writing—original draft, K.H. and B.A.; writing—review and editing, K.H., B.A., J.Z., S.S., Z.J. and X.L. All authors have read and agreed to the published version of the manuscript.

Funding

This work is supported by the National Natural Science Foundation of China (42071261), the Science and Technology Program of Guangdong Province, China (2018B020207002), and the Marine Economy Development Foundation of Guangdong Province (GDNRC (2020)051).

Institutional Review Board Statement

Not applicable.

Informed Consent Statement

Not applicable.

Acknowledgments

The authors thank the anonymous reviewers for their suggestions and comments.

Conflicts of Interest

The authors declare no conflict of interest.

References

  1. Tian, B.; Wu, W.; Yang, Z.; Zhou, Y. Drivers, trends, and potential impacts of long-term coastal reclamation in China from 1985 to 2010. Estuar. Coast. Shelf Sci. 2016, 170, 83–90. [Google Scholar] [CrossRef]
  2. Wu, W.; Yang, Z.; Tian, B.; Huang, Y.; Zhou, Y.; Zhang, T. Impacts of coastal reclamation on wetlands: Loss, resilience, and sustainable management. Estuar. Coast. Shelf Sci. 2018, 210, 153–161. [Google Scholar] [CrossRef]
  3. Zhang, J.; Su, F.; Ding, Z. Sea reclamation status of countries around the South China Sea from 1975 to 2010. Sustainability 2017, 9, 878. [Google Scholar] [CrossRef] [Green Version]
  4. Crain, C.M.; Halpern, B.S.; Beck, M.W.; Kappel, C.V. Understanding and Managing Human Threats to the Coastal Marine Environment. Ann. N. Y. Acad. Sci. 2009, 1162, 39–62. [Google Scholar] [CrossRef] [PubMed]
  5. Liu, Y.; Jin, Y.; Zhou, A. Index system of ecological impact assessment and strategies for sustainable development of tidal flat reclamation on Zhejiang Province. J. Mar. Sci. 2006, 26, 78–82. [Google Scholar]
  6. Guo, W.; Da-Kui, Z. Reclamation and its impact on marine environment in Shenzhen Area, China. J.-Nanjing Univ. Nat. Sci. Ed. 2005, 41, 286. [Google Scholar]
  7. Kumar, A.; Narayana, R.C.; Jayappa, R.S. Shoreline changes and morphology of spits along southern karnataka, west coast of india: A remote sensing and statistics-based approach. Geomorphology 2010, 120, 133–152. [Google Scholar] [CrossRef]
  8. Chen, L.; Ren, C.; Zhang, B.; Li, L.; Wang, Z.; Song, K. Spatiotemporal dynamics of coastal wetlands and reclamation in the yangtze estuary during past 50 years(1960s–2015). Chin. Geogr. Sci. 2018, 28, 386–399. [Google Scholar] [CrossRef] [Green Version]
  9. Gao, Z.; Liu, X.; Ning, J.; Lu, Q. Analysis on changes in coastline and reclamation area and its causes based on 30-year satellite data in China. Trans. Chin. Soc. Agric. Eng. 2014, 30, 140–147. [Google Scholar]
  10. Fu, T.; Zhang, L.; Chen, B. Monitoring of Land Cover Change based on Google Earth Engine Platform:A Case Study of Sulawesi Island. Remote Sens. Technol. Appl. 2021, 36, 55–64. [Google Scholar]
  11. Wang, Y.; Xie, H.; Mei, Q. Spatial pattern evolution analysis of Lianyungang Island reclamation based on Landsat. Sci. Technol. Inf. 2018, 16, 3. [Google Scholar]
  12. Shen, Y.; Xiao, D.; Fei, T. On Monitoring the Land-Use of Coastal Zone in Shenzhen by Remote Sensing. Ocean Dev. Manag. 2016, 33, 24–31. [Google Scholar]
  13. Blaschke, T.; Lang, S.; Lorup, E.; Strobl, J.; Zeil, P. Object-oriented image processing in an integrated GIS/remote sensing environment and perspectives for environmental applications. Environ. Inf. Plan. Politics Public 2000, 2, 555–570. [Google Scholar]
  14. Pal, N.R.; Pal, S.K. A review on image segmentation techniques. Pattern Recognit. 1993, 26, 1277–1294. [Google Scholar] [CrossRef]
  15. Qian, J.; Zhou, Q.; Hou, Q. Comparison of pixel-based and object-oriented classification methods for extracting built-up areas in arid zone. In Proceedings of the ISPRS Workshop on Updating Geo-Spatial Databases with Imagery & the 5th ISPRS Workshop on DMGISs, Urumchi, China, 28–29 August 2007; Volume 8, pp. 163–171. [Google Scholar]
  16. Suo, A.; Wang, P.; Yan, D.; Yu, Y.; Zhang, M. Study on monitoring and analysis of existing sea reclamation resource based on high resolution satellite remote sensing imagery-A case in south coast of Ying Kou. Acta Oceanol. Sin. 2016, 38, 54–63. [Google Scholar]
  17. Huang, S.; Wei., C. Spatial-Temporal Changes in Aquaculture Ponds in Coastal Cities of Guangdong Province: An Empirical Study Based on Sentinel-1 Data during 2015–2019. Trop. Geogr. 2021, 41, 622–634. [Google Scholar]
  18. Shackelford, A.K.; Davis, C.H. A combined fuzzy pixel-based and object-based approach for classification of high-resolution multispectral data over urban areas. IEEE Trans. Geosci. Remote Sens. 2003, 41, 2354–2363. [Google Scholar] [CrossRef] [Green Version]
  19. Zhuang, C. A Object-oriented Classification Information Extraction Technology Research Of Coastal Zone. Environ. Ecol. Three Gorges 2009, 2, 27–30. [Google Scholar]
  20. Tian, X.; Zhang, J.; Zhang, Y. Land Use /Land Cover Classification of Coastal Zone Using Object-Oriented Method Based on IKONOS Imagery. Remote Sens. Inf. 2007, 5, 44–47. [Google Scholar]
  21. Zhang, L.; Chen, Y.; Wu, H.; Duan, H. Summary of the Climate of Guangdong Province in 2020. Guangdong Meteorol. 2021, 43, 1–5. [Google Scholar]
  22. Xie, L.; Wang, F.; Liu, H. Study on the process of the sea reclamation and its environmental impact in Guangdong province. Jiangsu Sci. Technol. Inf. 2015, 37, 67–70. [Google Scholar]
  23. Ruan, B.; Zeng, L.; Qiu, Y. Evolution Analysis of Reclamation in Guangdong Province during 2006–2015. Ocean Dev. Manag. 2020, 37, 4. [Google Scholar]
  24. Petropoulos, G.P.; Kalaitzidis, C.; Vadrevu, K.P. Support vector machines and object-based classification for obtaining land-use/cover cartography from Hyperion hyperspectral imagery. Comput. Geosci. 2012, 41, 99–107. [Google Scholar] [CrossRef]
  25. Chen, W.; Li, X.; Wang, L. Fine land cover classification in an open pit mining area using optimized support vector machine and worldview-3 imagery. Remote Sens. 2020, 12, 82. [Google Scholar] [CrossRef] [Green Version]
  26. Pradhan, B. A comparative study on the predictive ability of the decision tree, support vector machine and neuro-fuzzy models in landslide susceptibility mapping using GIS. Comput. Geosci. 2013, 51, 350–365. [Google Scholar] [CrossRef]
  27. Andrew, A.M. An Introduction to Support Vector Machines and Other Kernel-based Learning Methods. Kybernetes 2003, 30, 103–115. [Google Scholar]
  28. Fragou, S.; Kalogeropoulos, K.; Stathopoulos, N.; Louka, P.; Srivastava, P.K.; Karpouzas, S.; Petropoulos, G.P. Quantifying Land Cover Changes in a Mediterranean Environment Using Landsat TM and Support Vector Machines. Forests 2020, 11, 750. [Google Scholar] [CrossRef]
  29. Mandalia, H.M.; Salvucci, D.D. Using support vector machines for lane-change detection. PsycEXTRA Dataset 2005, 49, 1965–1969. [Google Scholar] [CrossRef]
  30. Ding, H.; Bian, Z. Theory of support vector machine and its applications in remote sensing image processing. Comput. Eng. Des. 2008, 5, 1231–1234. [Google Scholar]
  31. Friedl, M.A.; Brodley, C.E. Decision tree classification of land cover from remotely sensed data. Remote Sens. Environ. 1997, 61, 399–409. [Google Scholar] [CrossRef]
  32. Rajeswari, K.; Preeti, K. Selection of significant features using decision tree classifiers. Preeti Kumari. Int.J. Eng. Res. Appl. 2014, 4, 48–51. [Google Scholar]
  33. Breiman, L. Random forests. Mach. Learn. 2001, 45, 5–32. [Google Scholar] [CrossRef] [Green Version]
  34. Torres, M.; Qiu, G. Automatic habitat classification using image analysis and random forest. Ecol. Inform. 2014, 23, 126–136. [Google Scholar] [CrossRef]
  35. Fu, B.; Wang, Y.; Campbell, A.; Li, Y.; Zhang, B.; Yin, S.; Xing, Z.; Jin, X. Comparison of object-based and pixel-based Random Forest algorithm for wetland vegetation mapping using high spatial resolution GF-1 and SAR data. Ecol. Indic. 2017, 73, 105–117. [Google Scholar] [CrossRef]
  36. Loh, W.Y. Classification and regression trees. Data Min. Knowl. Discov. 2011, 1, 14–23. [Google Scholar] [CrossRef]
  37. Al Fugara, A.M.; Pradhan, B.; Mohamed, T.A. Improvement of land-use classification using object-oriented and fuzzy logic approach. Appl. Geomat. 2009, 1, 111–120. [Google Scholar] [CrossRef] [Green Version]
  38. Li, C.; Shao, G. Object-oriented classification of land use/cover using digital aerial orthophotography. Int. J. Remote Sens. 2011, 33, 922–938. [Google Scholar] [CrossRef]
  39. Platt, R.V.; Rapoza, L. An evaluation of an object-oriented paradigm for land use/land cover classification. Prof. Geogr. 2008, 60, 87–100. [Google Scholar] [CrossRef]
  40. Cohen, J. A Coefficient of Agreement for Nominal Scales. Educ. Psychol. Meas. 1960, 20, 37–46. [Google Scholar] [CrossRef]
  41. Boschetti, L.; Brivio, P.A.; Flasse, S. Pareto Boundary: A useful tool in the accuracy assessment of low spatial resolution thematic products. In Proceedings of the IGARSS 2004. 2004 IEEE International Geoscience and Remote Sensing Symposiuml, IEEE, Anchorage, AK, USA, 20–24 September 2004; Volume 6, pp. 3759–3762. [Google Scholar]
  42. Foody, G.M. Thematic map comparison. Photogramm. Eng. Remote Sens. 2004, 70, 627–633. [Google Scholar] [CrossRef]
  43. Yang, C.; Wu, G.; Ding, K.; Shi, T.; Li, Q.; Wang, J. Improving Land Use/Land Cover Classification by Integrating Pixel Unmixing and Decision Tree Methods. Remote Sens. 2017, 9, 1222. [Google Scholar] [CrossRef] [Green Version]
  44. Huang, X.L. Analysis of Landscape Pattern and Information Extraction of Reclamation Area in Jinzhou Bay Based on Object-oriented Technology. Master’s Thesis, LiaoNing Normal University, Dalian, China, 2017. [Google Scholar]
Figure 1. (a) Location of Guangdong Province; (b) false-color composite image (R, G, B = 3, 2, 1) covering coastal Guangdong collected in 2019; (c) false-color composite image (R, G, B = 3, 2, 1) covering the study area in 2019, with the overlay of municipal administrative boundaries.
Remotesensing 14 00385 g001
Figure 2. Flowchart of the methodology.
Remotesensing 14 00385 g002
Figure 3. Sentinel 2A MSI false-color composites over (a) Pearl River Delta, (b) east Guangdong, and (c) west Guangdong.
Remotesensing 14 00385 g003
Figure 4. Classification of the reclamation uses from the four classifiers in west Guangdong.
Remotesensing 14 00385 g004
Figure 5. Classification of the reclamation uses from the four classifiers in the Pearl River Delta.
Remotesensing 14 00385 g005
Figure 6. Classification of the reclamation uses from the four classifiers in east Guangdong.
Remotesensing 14 00385 g006
Figure 7. Spatial distribution of reclamation extracted from Sentinel 2A MSI images in 2018 over coastal Guangdong.
Remotesensing 14 00385 g007
Table 1. Dataset information about the collected Landsat 8 OLI and Sentinel-2A MSI data.
YearsSensor TypePath/RowAcquisition Date/TimeSpatial Resolution
2019Landsat 8 OLI124−4511 October 201930
122−4429 October 2019
120−4415 October 2019
2019Sentinel-2A MSI\1 December 201910
4 November 2019
11 December 2019
8 December 2019
22 September 2019
18 November 2019
15 November 2019
Table 2. Detailed information of interpretation keys for the reclamation classification.
Reclamation TypeSpectral FeatureInterpretation SignImage Case
Salt pansBright crystal precipitation, tones of black gray or light grayRegular arrangement and rectangular pattern, close to the water body Remotesensing 14 00385 i001
Brackish water aquaculture pondsLow reflection, grey cofferdam around, dark water bodyComposed of irregular ponds with a certain size Remotesensing 14 00385 i002
PortsHigh reflection, different colors are presented, and the undeveloped areas preset gray tones; construction area shows pink and white colorsDifferent types of industry and towns around; regular shape of the construction area Remotesensing 14 00385 i003
Table 3. Description of confusion matrix used to validate the accuracy of reclamation classification.
Confusion MatrixActual TypeTotalUA
Aquaculture PondsPortsSalt PansOther Type
Classified TypeAquaculture ponds a 11 a 12 a 13 a 14 a 1 + a 11 / a 1 +
Ports a 21 a 22 a 23 a 24 a 2 + a 22 / a 2 +
Salt pans a 31 a 32 a 33 a 34 a 3 + a 33 / a 3 +
Other type a 41 a 42 a 43 a 44 a 4 + a 44 / a 4 +
Total a + 1 a + 1 a + 2 a + 3 a + 4 a
PA a 11 / a + 1 a 11 / a + 1 a 22 / a + 2 a 33 / a + 3 a 44 / a + 4
OA k = 1 4 a k k / a
Where a 1 j represents the number of the jth type in reference data, which is classified as aquaculture ponds; a i 1 represents the number of aquaculture ponds in reference data, which is misclassified as the ith type; a is the total number of validation points.
Table 4. Statistical significance parameters for two classifications using McNemar’s test.
Image Landsat 8 OLI
AllocationCorrectIncorrect
Sentinel 2A MSICorrectf11f12
Incorrectf21f22
Table 5. Value ranges of spectral reflectance, texture, and area for different reclamation types for training data.
TextureSpectral (Reflectance)Area (m2)
RedGreenBlue
ports0.05–0.20.44–0.820.53–0.860.69–0.87<100,000
aquaculture ponds0.1–0.30.28–0.370.45–0.520.6–0.62<80,000
salt pans0.15–0.20.42–0.480.64–0.660.64–0.65<10,500
Table 6. Verification points for the three main types of reclamation in different sub-regions.
Sub-RegionAquaculture PondsPortsSalt PansOther TypeTotal
West Guangdong103193513170
Pearl River Delta554567113
East Guangdong14140432
Table 7. Accuracy validation in west Guangdong.
MethodData PortsAquaculture PondsSalt Pans
kOA (%)PA (%)UA (%)PA (%)UA (%)PA (%)UA (%)
SVMLandsat 8 OLI0.72081.36%81.82%83.80%81.01%83.52%81.28%77.15%
Sentinel 2A MSI0.74283.05%85.89%88.58%84.14%87.01%76.95%70.00%
Object-orientedLandsat 8 OLI0.78386.39%88.69%83.58%83.93%92.72%87.32%79.02%
Sentinel 2A MSI0.82288.57%86.99%84.31%88.50%93.76%91.07%84.95%
RFLandsat 8 OLI0.74984.50%85.27%92.35%74.53%70.33%87.96%82.61%
Sentinel 2A MSI0.80186.81%84.41%91.20%86.95%86.50%88.81%83.72%
Decision TreeLandsat 8 OLI0.73782.62%78.79%85.23%80.43%82.67%87.55%80.81%
Sentinel 2A MSI0.76484.27%68.55%90.43%93.75%81.56%90.72%82.77%
Table 8. Accuracy validation in the Pearl River Delta.
MethodData PortsAquaculture PondsSalt Pans
kOA (%)PA (%)UA (%)PA (%)UA (%)PA (%)UA (%)
SVMLandsat 8 OLI0.75584.63%83.49%92.35%85.85%78.71%85.24%80.02%
Sentinel 2A MSI0.79686.47%83.73%95.53%88.70%80.48%87.63%83.36%
Object-orientedLandsat 8 OLI0.78285.47%86.00%88.39%87.94%79.63%82.78%88.40%
Sentinel 2A MSI0.82788.50%82.25%90.77%91.86%86.82%90.94%88.43%
RFLandsat 8 OLI0.75884.05%82.74%85.14%84.20%84.84%85.55%81.69%
Sentinel 2A MSI0.80086.79%84.13%88.98%88.39%88.48%87.95%81.94%
Decision TreeLandsat 8 OLI0.75483.76%86.83%81.93%81.35%86.95%82.48%82.97%
Sentinel 2A MSI0.79986.90%85.65%86.50%87.05%87.87%88.15%85.99%
Table 9. Accuracy validation in east Guangdong.
MethodData PortsAquaculture Ponds
kOA (%)PA (%)UA (%)PA (%)UA (%)
SVMLandsat 8 OLI0.52377.43%79.95%61.87%76.21%88.72%
Sentinel 2A MSI0.60379.77%81.76%68.40%78.64%88.41%
Object-orientedLandsat 8 OLI0.65383.13%86.12%73.91%81.29%90.50%
Sentinel 2A MSI0.67284.40%76.53%83.22%89.67%85.09%
RFLandsat 8 OLI0.56279.48%82.81%63.29%77.94%90.81%
Sentinel 2A MSI0.64382.60%83.96%74.80%81.73%88.75%
Decision TreeLandsat 8 OLI0.51976.82%79.89%63.09%75.20%87.57%
Sentinel 2A MSI0.53377.32%81.67%63.94%74.95%88.26%
Table 10. Three types of reclamation in Guangdong Province (Unit: ha).
Coastal CityAquaculture PondsPortsSalt Pans
Zhanjiang18,650879359
Maoming422833722
Yangjiang6830516137
Jiangmen11,59272869
Zhuhai444516181565
Zhongshan1786291425
Guangzhou103112220
Shenzhen70915231
Dongguan1242610
Huizhou616336144
Shanwei502754150
Jieyang30511041
Shantou9519696399
Chaozhou10,3552370
Total77,96381464072
Publisher’s Note: MDPI stays neutral with regard to jurisdictional claims in published maps and institutional affiliations.

