Article

Preliminary Application of Long-Range Lightning Location Network with Equivalent Propagation Velocity in China

1
Key Laboratory of Meteorological Disaster, Ministry of Education (KLME)/Joint International Research Laboratory of Climate and Environment Change (ILCEC)/Collaborative Innovation Center on Forecast and Evaluation of Meteorological Disasters (CIC-FEMD)/Key Laboratory for Aerosol Cloud-Precipitation of China Meteorological Administration, Nanjing University of Information Science & Technology, Nanjing 210044, China
2
Shanghai Typhoon Institute, China Meteorological Administration, Shanghai 200030, China
3
Jiangsu Meteorological Disaster Prevention Technology Center, Jiangsu Meteorological Bureau, Nanjing 210041, China
*
Author to whom correspondence should be addressed.
Submission received: 2 December 2021 / Revised: 12 January 2022 / Accepted: 19 January 2022 / Published: 25 January 2022

Abstract

:
The equivalent propagation method adopts a variable propagation velocity in lightning location, minimizing the location error caused by various factors in the long-range lightning location network. To verify the feasibility of this method, we establish a long-range lightning location network in China. A new method is used to extract the ground wave peak points of the lightning sferics and is combined with the equivalent propagation velocity method for lightning location. By comparing with the lightning data detected by the lightning locating system called advanced direction and time-of-arrival detecting (ADTD) that has been widely used for tens of years in China, the feasibility of this method is initially verified. Additionally, it is found that the relative detection efficiency of our long-range lightning location network can reach 53%, the average location error is 9.17 km, and the detection range can reach more than 3000 km. The equivalent propagation method can improve the average location accuracy by ~1.16 km, compared with the assumed light speed of lightning-radiated sferic from the lightning stroke point to the observation station. The 50th percentile of the equal propagation velocity is 0.998c, which may be used in the long-range lightning location networks.

1. Introduction

The lightning discharge process generates electromagnetic radiation in the frequency range of ~4 Hz to ~300 MHz or even higher [1], which provides an important way for lightning location. The electromagnetic radiation generated during the cloud-to-ground lightning (CG) return stroke is mainly concentrated in the very low frequency (VLF) and low frequency (LF) range [2]. VLF (3~30 kHz) electromagnetic waves can propagate in the form of ground waves along the Earth’s surface or in the form of sky waves in the Earth–ionospheric waveguide (EIWG) [2]. The propagation distance can be thousands of kilometers, so long-range network observation can be carried out. At present, the long-range lightning location systems working in the VLF mainly include the World Wide Lightning Location Network (WWLLN), Zeus, the new Met Office ATDNET lightning detection system (ATDNET), and the Asia–Pacific Lightning Location Network (APLLN) [3,4,5,6].
Modern lightning location networks are mainly equipped with a multistation time-synchronized GPS receiver to measure the time when lightning sferics reach each station and use the time of arrival (TOA) method or the time difference of arrival (TDOA) method to locate the lightning [4,5,6,7,8,9,10,11,12,13]. For the long-range lightning location system, the lightning sferic is much affected by many factors after propagating a long distance of thousands of km in the EIWG. Therefore, it is an important issue for accurately identifying the time when the lightning sferic reaches the station. For example, in the WWLLN, the time of group arrival (TOGA) method when the lightning sferic arrives at the station is found by calculating the slope of the phase of the lightning VLF signal with frequency change [3,14], which is used for the lightning location. In the Zeus lightning network, the cross-correlation technology is used to calculate the time difference that the lightning sky wave reaches different stations [5]. In the ATDNET, the time of lightning arrival at the measurement station is the time of arrival of the peak lightning sferic signal at the station [15]. In the APLLN, the Hilbert transform is used to calculate the lightning signal envelope, and the peak value of the envelope is used as the arrival time of the lightning sferic [6].
Some current research results show that the location accuracy of the lightning location network based on the TOA method is affected by limited soil conductivity, propagation topography, and ionospheric height [16,17,18,19,20,21,22,23,24,25,26,27,28,29,30,31]. To improve the accuracy of the lightning location network, Li et al. analyzed the location error of the lightning location system in the mountains around the Säntis Tower in the Swiss Alps [32]. They found that the evaluated location errors associated with amplitude thresholds of 10% and 20% and the time of the linear extrapolation of the tangent at maximum field derivative were found to be smallest. However, in the long-range lightning location system, these several time points are often difficult to identify due to attenuation and noise interference. In Li et al.’s paper, the accuracy of two simplified methods (terrain envelope method and tight-terrain-fit method) was also evaluated. Still, these methods are all post-modifications to the existing location results. Liu et al. used variable phase propagation velocity to minimize the influence of ground and sky waves equivalently and found that the location accuracy can be improved by ~0.89–~1.06 km [33]. However, the baseline length of the location network used by Liu et al. is relatively shorter, and the analyzed thunderstorm activities are also located inside the location network. The effect outside the location network is not yet known.
In addition, some other factors also affect the lightning location accuracy. The lightning sferic propagates along the ellipsoidal surface of the Earth, and the use of plane or spherical assumptions also bring certain errors [34,35]. Part of the severely distorted data added to the location also cause deviation of the location result. Finally, the sferics from different lightning may arrive at the station simultaneously, and the high similarity between the sferic signals makes it difficult to distinguish.
In this paper, we establish a long-range lightning location network in China and propose a new lightning ground wave peak point extraction method based on finite difference time domain (FDTD) simulation and waveform matching. In the location algorithm, the equivalent propagation velocity method is used to reduce the location error caused by the propagation effect. In addition, the Bezier inverse solution algorithm is added to the TDOA method to reduce the location error caused by the lightning propagation effect along the natural Earth surface. Then, by using the lightning locating system called advanced direction and time-of-arrival detecting (ADTD), which has been widely used for tens of years in China, we estimate our long-range lightning location’s relative detection efficiency and location accuracy.

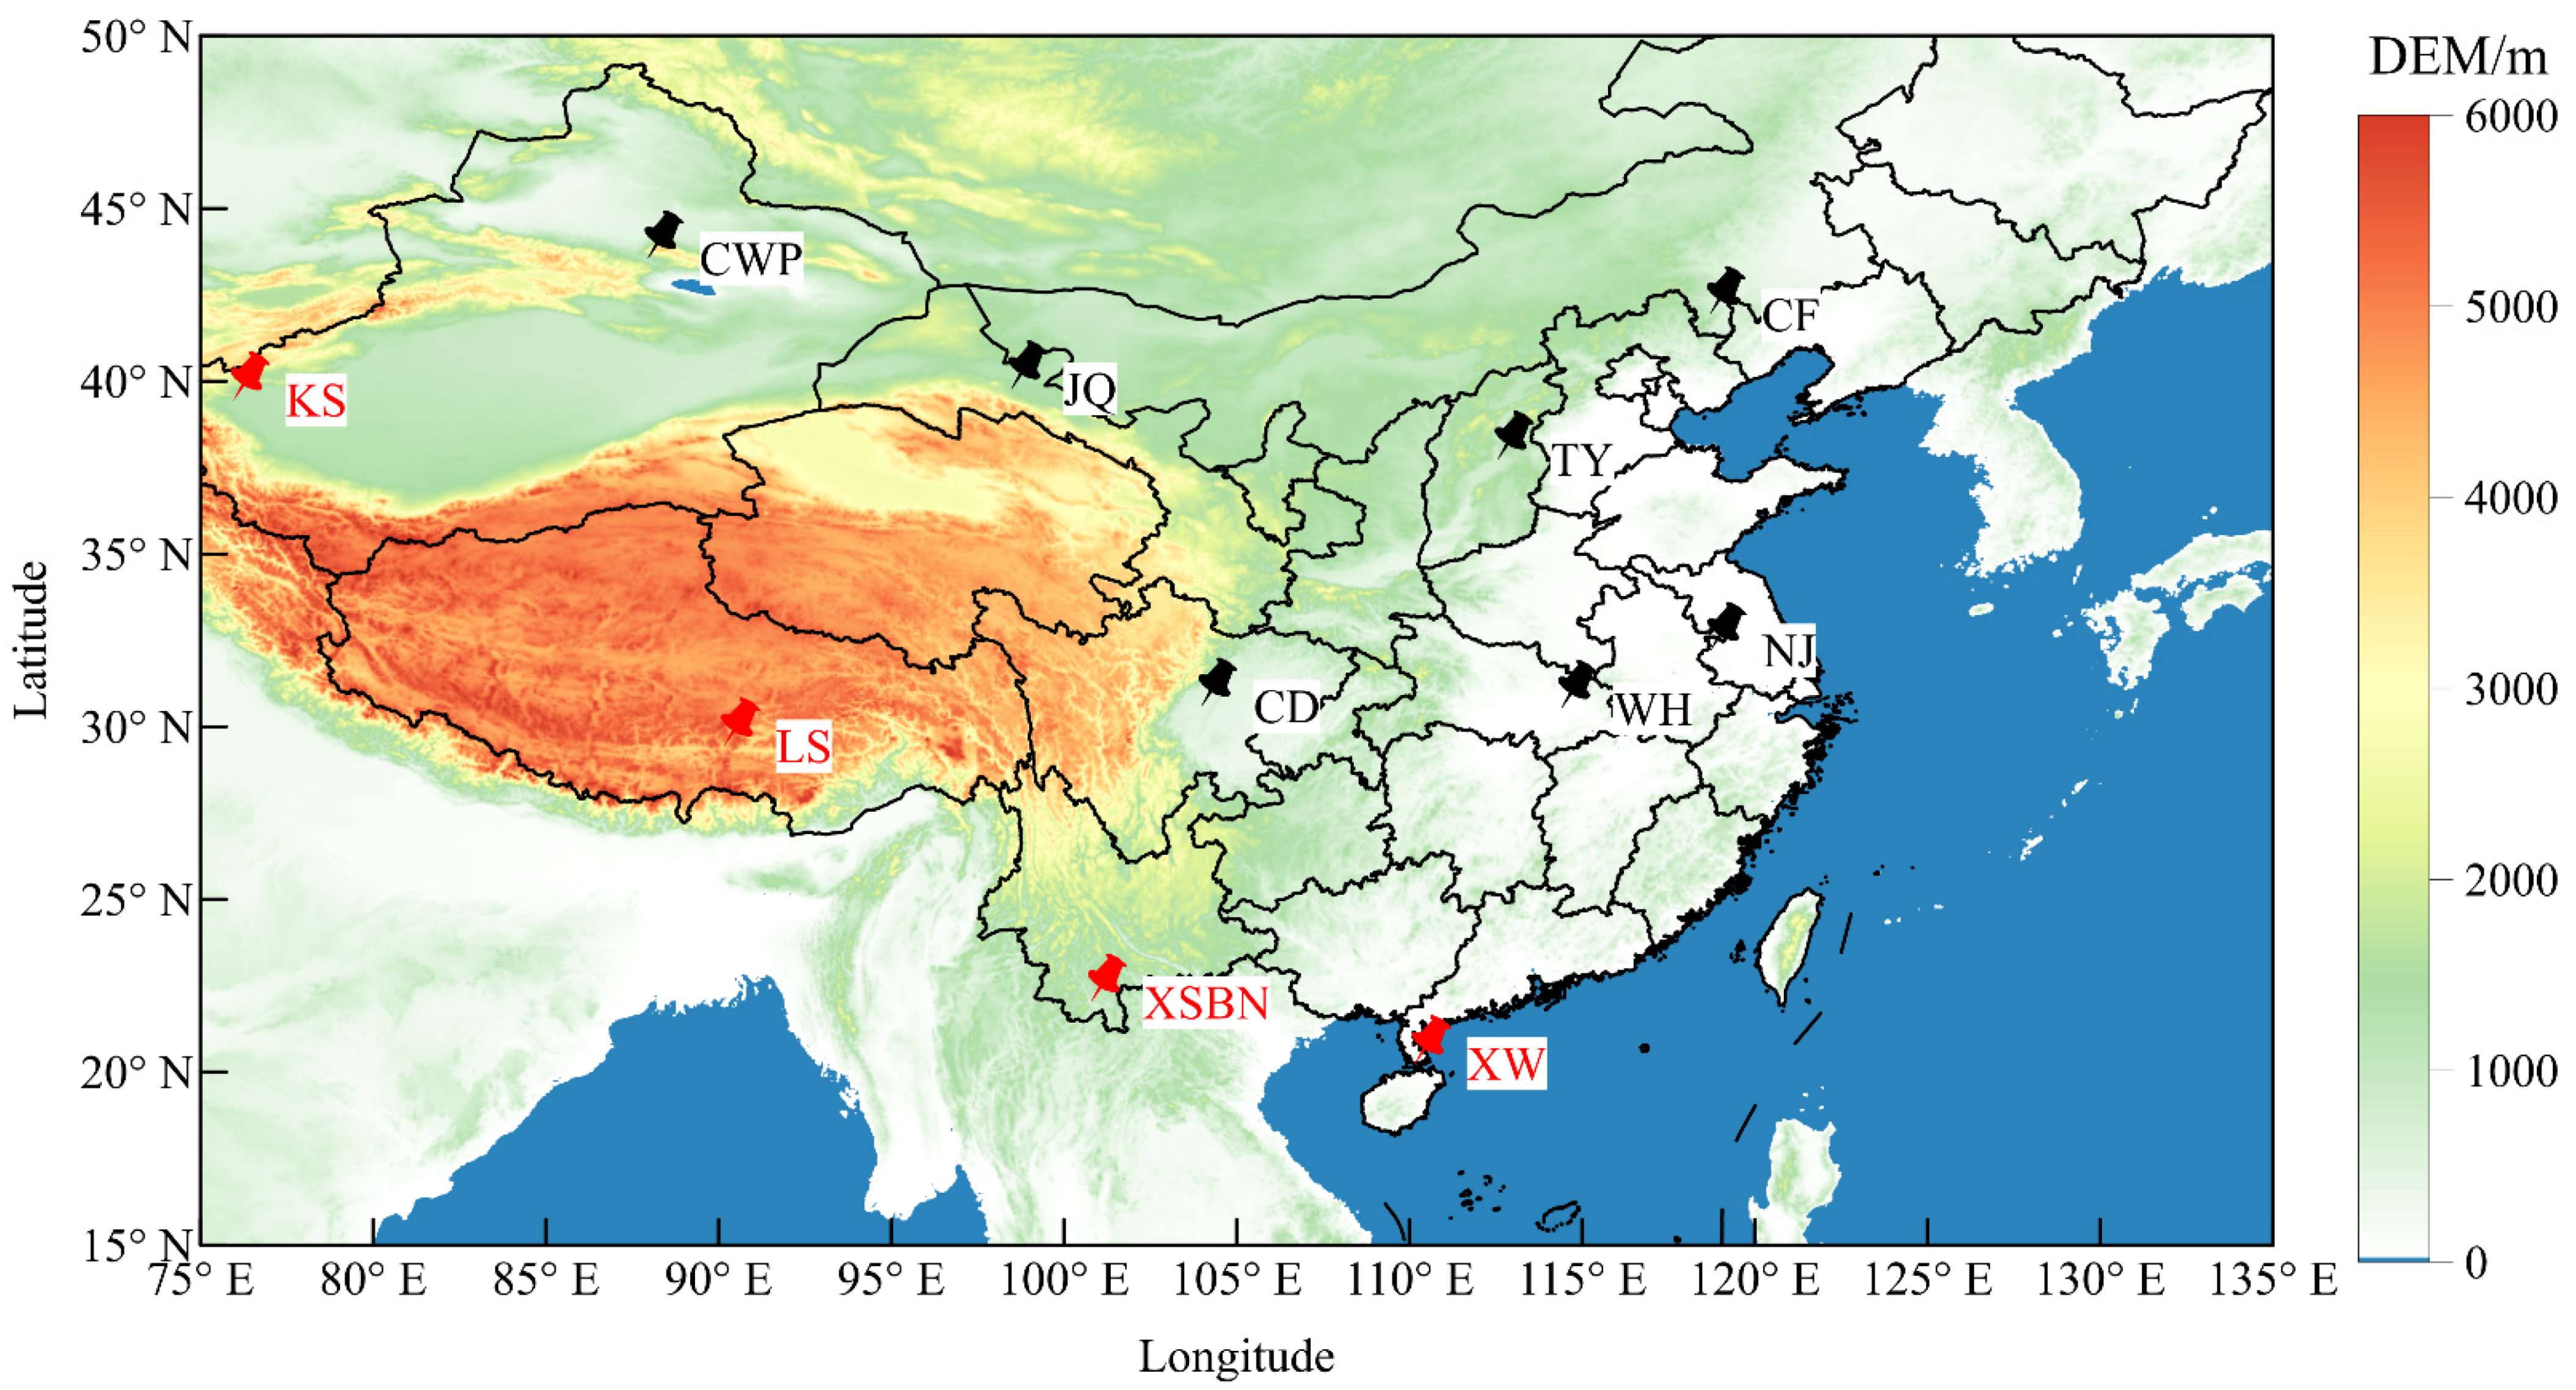
2. The Long-Range Lightning Location Network

We established a ground-based long-range lightning location network in China. In Figure 1, the black marks are the stations built in September 2021, and the red marks are ready to be established in the future. Each station continuously collects the lightning vertical electric field from several 5 Hz to several 30 kHz at a sampling rate of 1 MHz and sends the original waveform data greater than the lowest threshold to Nanjing station. The recording length of the data is 1000 μs, the pre-trigger time is 300 μs, and the length of each piece of data is just an independent VLF pulse. According to actual observation data, the location network has a detection radius of up to 3000 km, which can be used to study lightning activity in East Asia and Southeast Asia, and other related fields. Figure 2 shows the lightning sferic waveforms of a seven-station synchronization collected by the network.

3. Location Algorithm

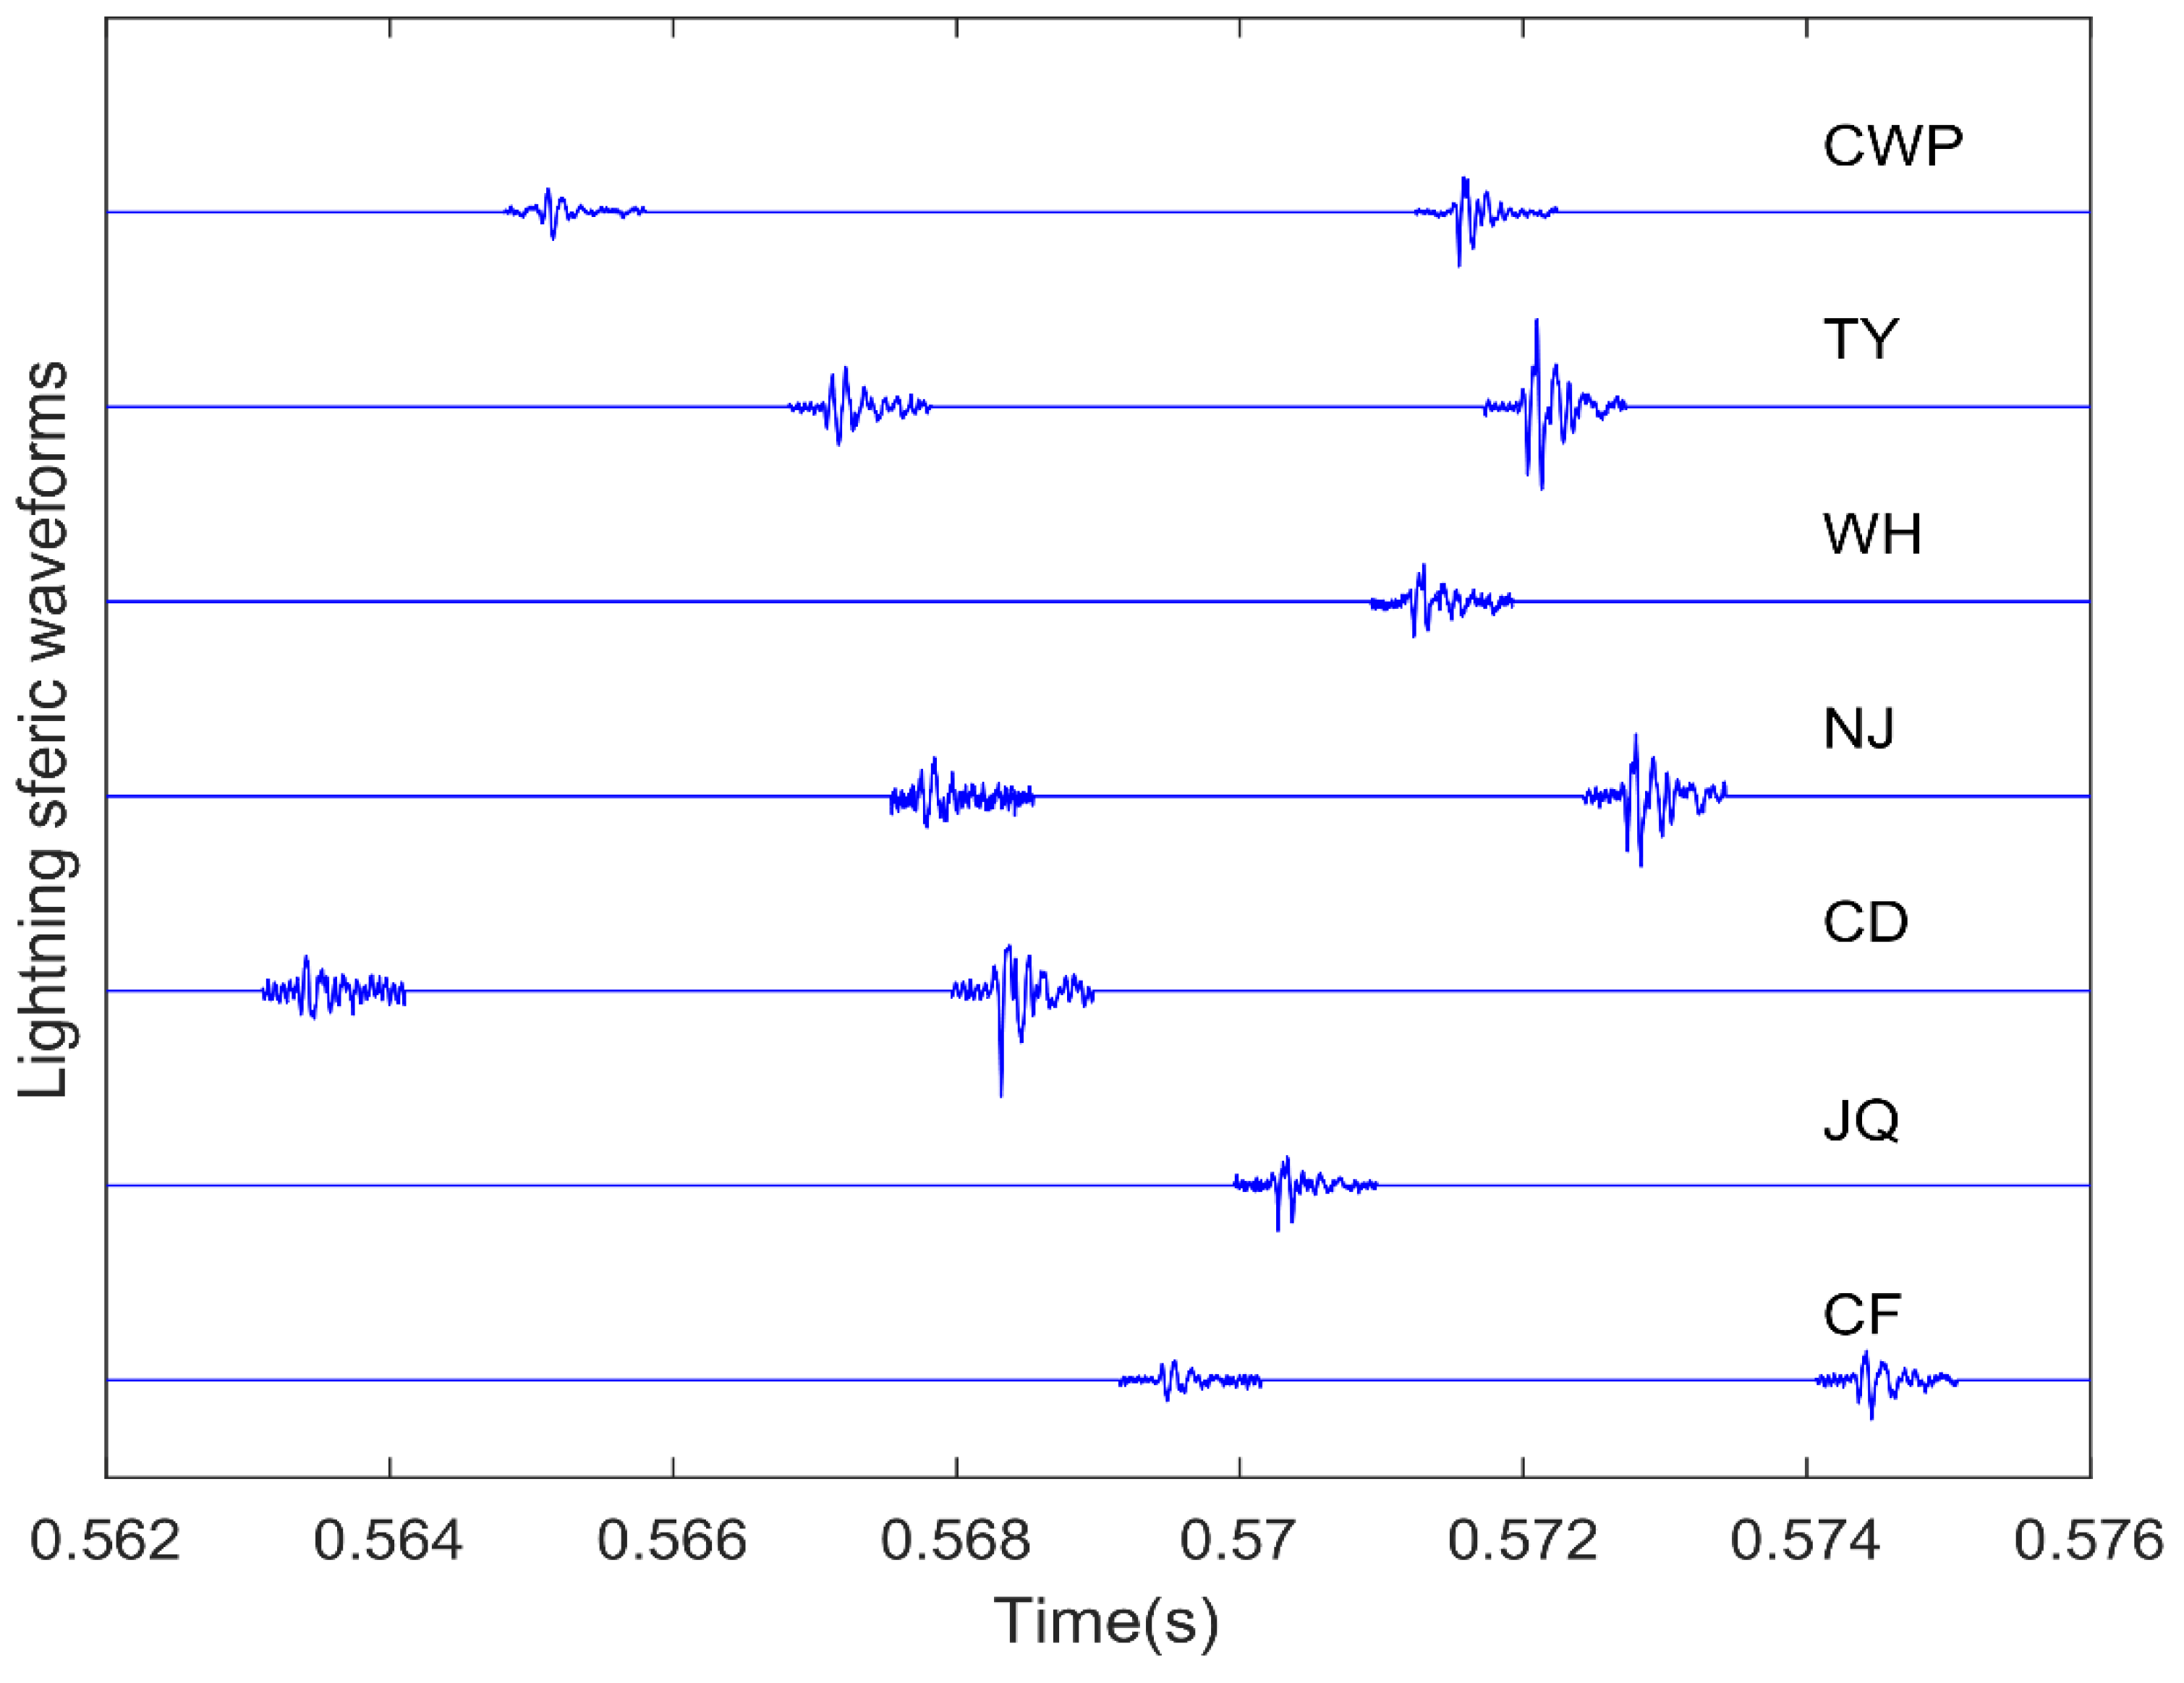
3.1. Sferic Waveform Bank

In this paper, we use the two-dimensional FDTD model to simulate the propagation of VLF lightning electromagnetic sferic in the EIWG and establish a waveform bank of the vertical electric field components of lightning sferic at different distances (100–3000 km) under the typical daytime ionospheric conditions and the typical nighttime ionospheric conditions. The FDTD is a full-wave model; however, the frequency response of our observed instrument is from 5 Hz to 30 kHz. Therefore, for comparison, we make a digital filter of 5 Hz–30 kHz for the FDTD simulating results. The size of the FDTD simulation domain is 3200 km × 100 km, the space step is set to ∆r = ∆z = 500 m, and the time step ∆t = 1 μs to ensure the same time resolution as the observed data. The lightning channel is a vertical dipole model with a height of 10 km. Because the VLF electromagnetic wave has a long wavelength and is much larger than the height of the lightning channel, the lightning channel can be regarded as a dipole, and the currents are equal everywhere in the channel. The return stroke current moment uses the model given by Cummer [36]:
I ( t ) = I 0 v 0 γ [ e a t e b t ] [ 1 e γ t ] / L
In the formula, I 0 = 20   kA , v 0 = 8 × 10 7   m / s , γ = 3 × 10 4   S 1 , a = 2 × 10 4   S 1 , b = 2 × 10 5   S 1 , and L is the length of the channel. A two-parameter exponential function expresses the electron density distribution of the ionosphere’s D layer (~60–90 km). The electron density distribution in the E-layer and F-layer are calculated using the International Reference Ionosphere—IRI 2016 model. Figure 3 shows the ionospheric electron density profiles used in the FDTD model during the daytime and nighttime.
Other model settings are consistent with that of Hou et al.’s paper [37,38]. However, it is enough to accurately identify the ground wave peak point of the measured data by using a waveform bank without considering the geomagnetic field, and we are only interested in the character of the waveform bank, but not the value peak. It is worth noting that we have not established a simulated waveform bank of intracloud lightning (IC), because it is difficult to observe the multistation synchronization data of the IC owing to the propagation effect for a ground-based long-range lightning location network.
The length of the model waveform in the waveform bank is 1000 μs, consistent with the measured data length. Figure 4 shows the normalized waveforms bank at different distances simulated by FDTD. Digital filtering introduces an LF component (Figure 4a), but does not affect the results of waveform matching and ground wave identification. Because the simulated height of the ionosphere during the daytime (70 km) is less than the simulated height of the nighttime ionosphere (80 km), the lightning sky waves arrive at the station earlier during the daytime and blend with the ground wave. Due to the polarity reversal of lightning sky waves at long distances, the peak value of ground waves during the daytime at the same distance are smaller than that at nighttime, and the rising edge of the ground waves during the daytime are narrower.

3.2. Grouping

To solve the mismatch and low-quality data causing location deviation in the long-range lightning location network, we group the data that meet the time condition and the minimum cross-correlation threshold. The time condition means that the value of the time difference between the lightning sferic arriving at the two stations multiplied by the propagation speed should be less than the baseline length between the two stations, and the minimum cross-correlation coefficient threshold is used to distinguish lightning signals from noise. Data synchronized over four stations are used for lightning location. If the same pulse exists between different combinations, the location results of each group are compared to select the best one. To reduce the amount of calculation, the propagation speed of lightning sferics is set to the speed of light. Then the equivalent propagation method is used to relocate the selected data group. The judgment conditions are progressive, as follows:
(1)
Deviation that is accurate to the order of a hundred kilometers between actual distance and matching distance;
(2)
Residual term of the least square method;
(3)
Correlation coefficient between measurement waveform and model waveform.

3.3. Bezier Inverse Solution Algorithm

The time difference of lightning sferics reaching various stations can be obtained through the ground wave identification method. In this paper, the TDOA method is used to solve the initial solution of lightning position. The Bezier inverse solution algorithm is used to calculate the actual distance from lightning to various stations. Then the Levenberg–Marquardt nonlinear least-squares fitting algorithm is used to fit the optimal solution. Since the Earth is a spheroid, the influence of the Earth’s oblateness must be considered when calculating the distance of lightning to the station. In calculating the exact solution by the least-squares method, the Bessel inverse solution algorithm is added to calculate the length of the Earth line between the lightning and the station. The basic principle of the Bessel inverse solution algorithm is to establish an auxiliary sphere and project the ellipsoid elements onto the auxiliary sphere according to certain conditions; then settle the Earth problem on the sphere. Finally, the spherical elements obtained are converted into corresponding ellipsoidal aspects according to the projection relationship. The Earth reference system used is the WGS84 coordinate system.

3.4. Equivalent Propagation Velocity Method

A method similar to Liu et al. is used to change the propagation speed to optimize the preliminary location results [33]. The equivalent propagation velocity method is an equivalent comprehensive replacement of various errors. To reduce the amount of calculation, we take a uniform value for the speed of all stations rather than the individual propagation speed of each station. This is a choice considering the location accuracy and computational efficiency. According to Liu et al.’s statistics in Western Europe, about 68% of the lightning propagation speed is within ±1.5% of the speed of light, and more than 80% of the lightning propagation speed is less than the speed of light [33]. Considering our network may have a longer detection range, we set the lightning propagation speed from 0.950 c to 1.01 c, increasing in steps of 0.01% of the speed of light. The optimal location result is determined by calculating the minimum root mean square (RMS) of the measured time difference and the time difference between the location result and each station. The minimum RMS calculation formula is:
X R M S = 1 N n = 1 N ( Δ t n Δ d n v ) 2
In the formula, N is the number of measuring stations, Δ t n is the time difference between lightning reaching each station and lightning reaching the first station, Δ d n is the difference between the distance between the lightning reaching each station and the distance between the lightning reaching the first station, and v is the equivalent propagation velocity.

4. Results

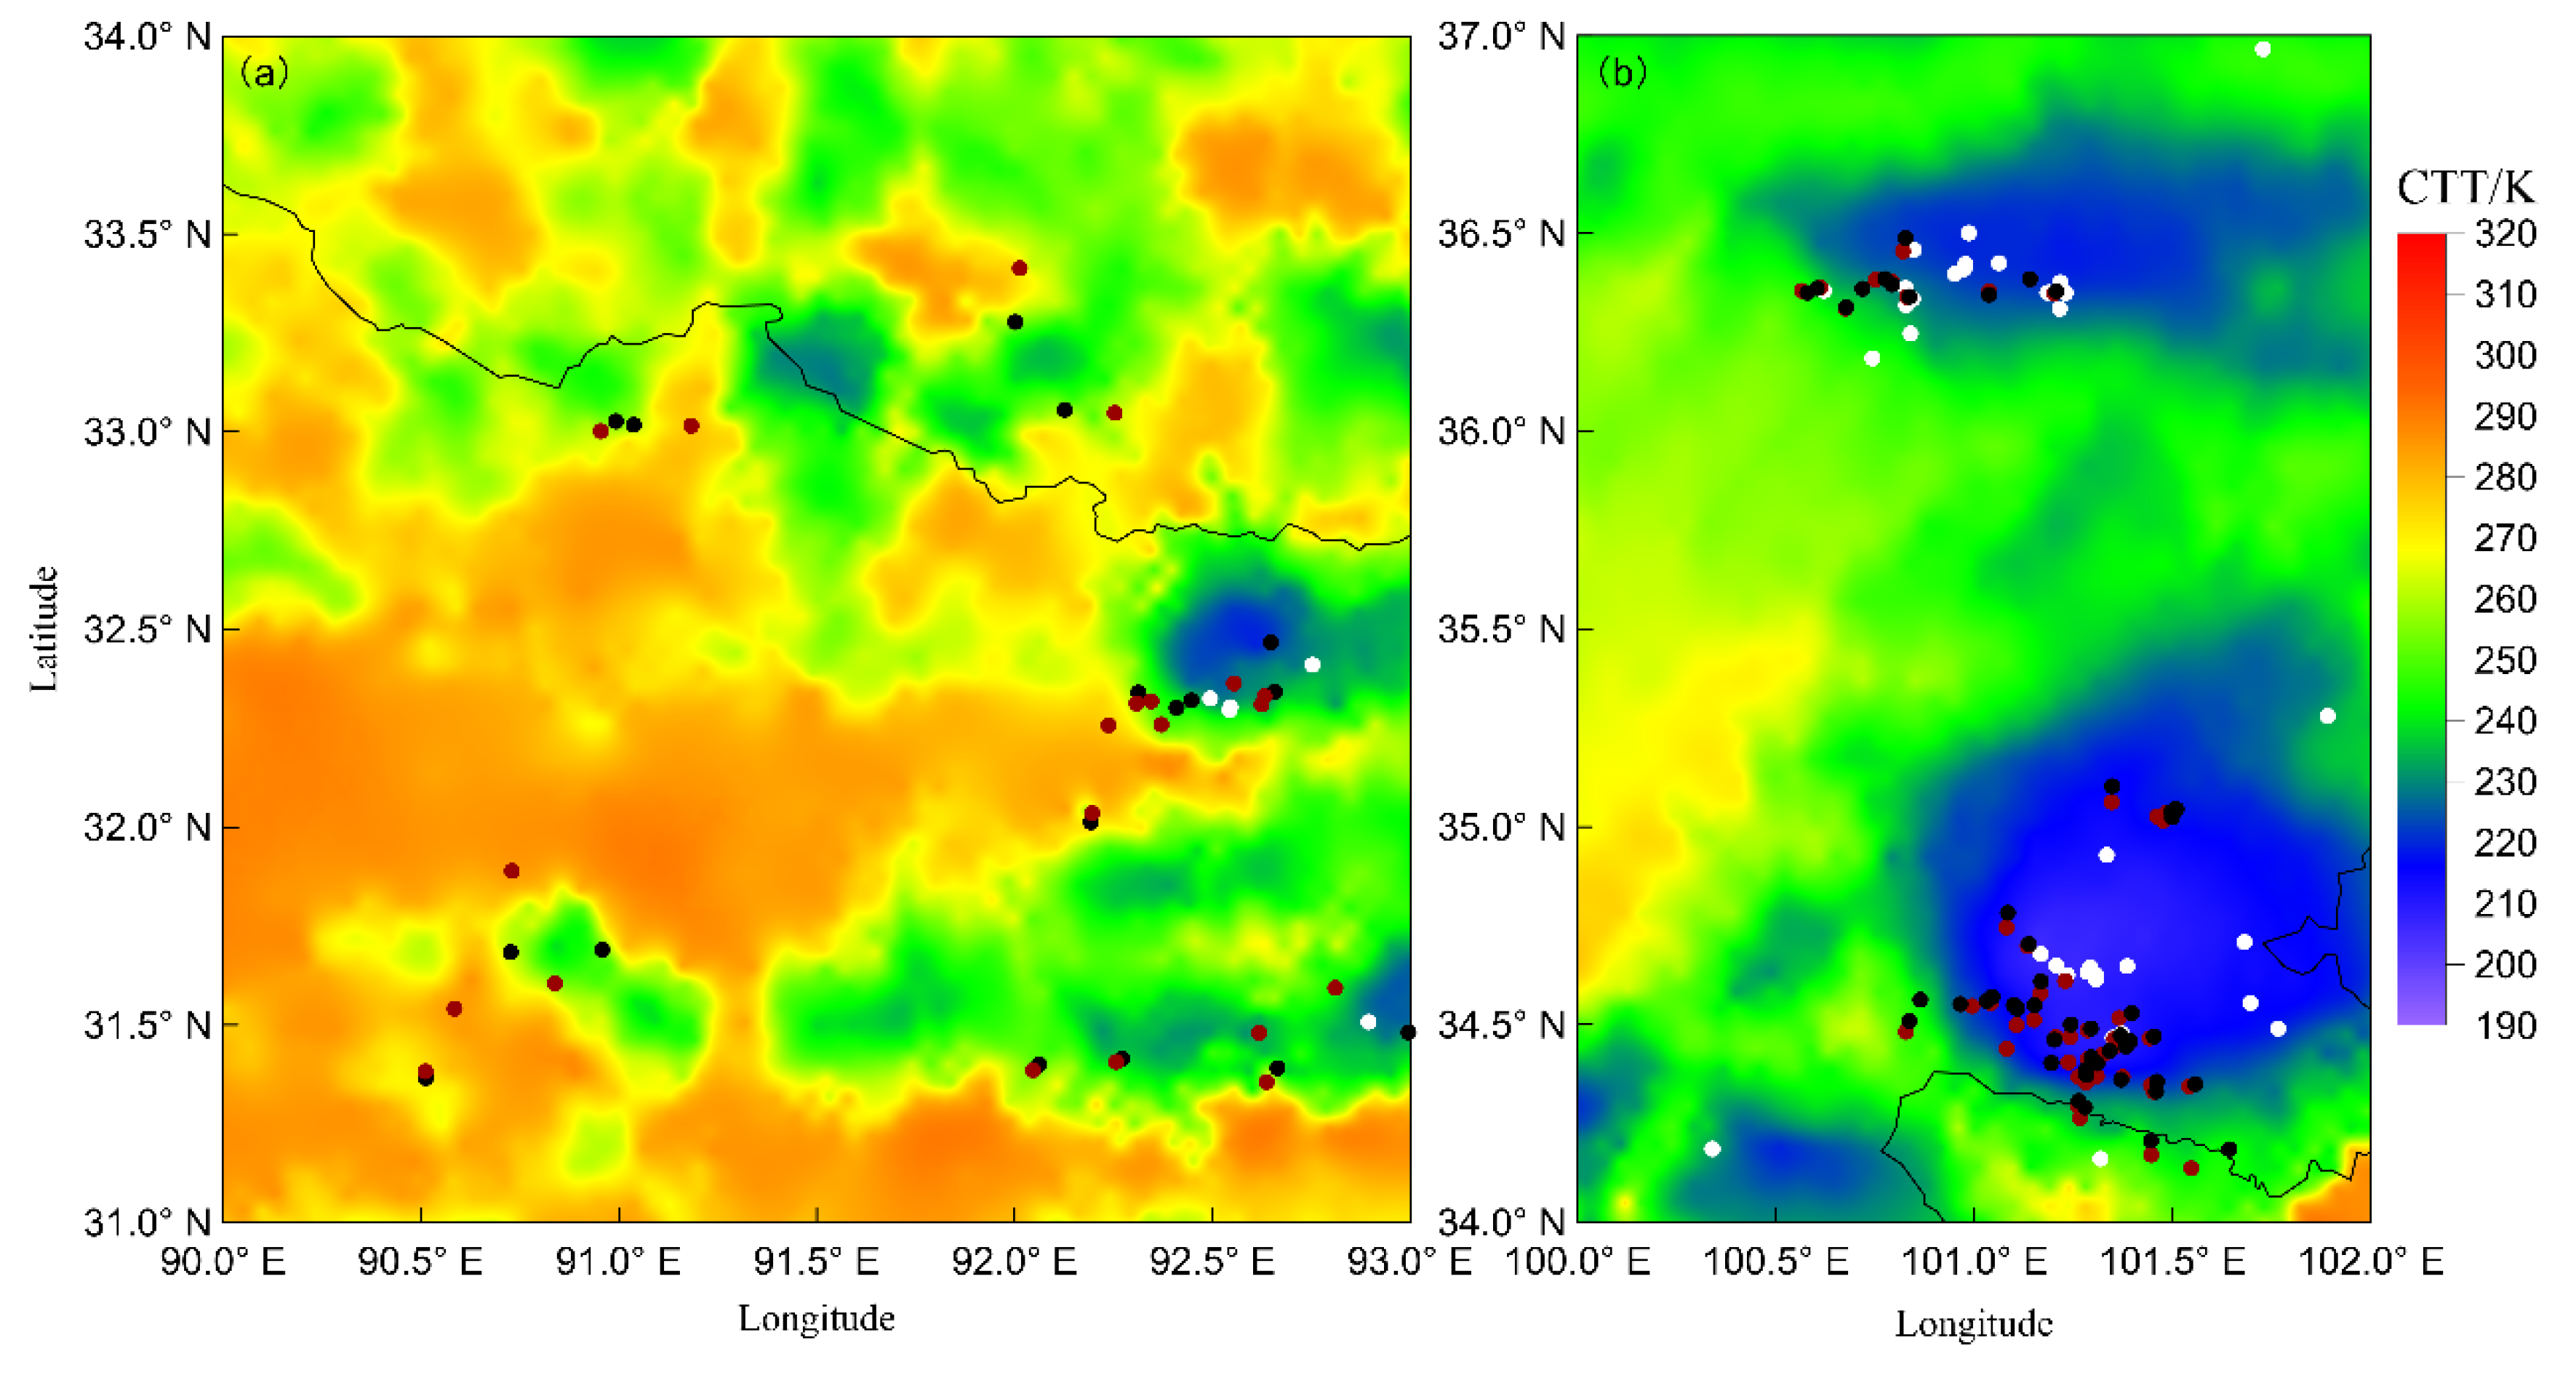
4.1. Results of Ground Wave Identification

In signal processing, cross-correlation is a measure used to express the similarity between two signals. When the observed data after digital filtering and the simulated waveform of a certain distance in the waveform bank has the largest correlation coefficient, the two waveforms are almost coincident. Therefore, a time window can be determined according to the ground wave peak point of this simulated waveform, and the peak point of the observed data in this window is the actual ground wave peak point. Before performing ground wave identification, we take the positive and negative of the observed waveform to do cross-correlation and take the polarity of the largest cross-correlation coefficient as the polarity of the observed waveform. The polarity of most stations is considered to be the polarity of the lightning to unify the polarity of the peak point. If the ground wave peak point of the observed data cannot be found in the time window due to noise interference, we use the matched simulated waveform ground wave peak point as the ground wave peak point of the observed data.
Figure 5 shows the ground wave identification results of a five-station synchronization dataset at 12:07 on 3 October 2021, Beijing time. Because the propagation path of lightning to the various station and the background noise around the station are different, the waveforms received by the five stations are very different. Multistation cross-correlation technology has a relatively large error in obtaining the time difference. However, the ground wave identification method can accurately identify each observed ground wave peak point. Due to noise interference, the 10% peak point of the ground wave in the data received by some stations cannot be identified, so we choose to use the peak point arrival time of the ground wave as the lightning arrival time for the location. In the data received by WH station, the actual distance differs from the matching distance by 400 km, but the correlation coefficient reaches 0.87. If the speed of light is still used as the propagation speed of lightning when using the time when the lightning arrives at the station extracted by the WH station for location, it will lead to a larger error. Because of the influence of noise, its ground wave peak point is ahead. In addition, the correlation coefficient between the observed lightning sferic waveforms and the simulated waveforms is also above 0.7. Because the influence of the geomagnetic field is not considered, there is a certain error between the skywave part of the observed data and the waveform bank. However, the ground waves of the two are basically consistent. Therefore, the waveform matching method is feasible to identify the ground wave of the lightning sferics.
Figure 6 shows the ground wave identification results of a seven-station synchronization dataset at 00:04 on 12 October 2021, Beijing time. The difference from Figure 5 is that this lightning is outside the network. The average distance from each station is 2557 km, and the farthest distance is 3400 km. As the distance increases, the lightning sferic waveform tends to become an oscillating waveform, and the similarity between the waveforms is greatly improved. At this distance, the ground wave is already feeble due to its attenuation, and the entire waveform is seriously interfered with by noise. The matching results show a deviation of the order of hundreds of kilometers between the actual distance and the matching distance in various stations. However, the ground wave peak point of the observed data can still be identified. Affected by noise, the ground wave of the observed data has been distorted, and the peak point of the ground wave has shifted to varying degrees. However, combined with the equivalent propagation speed method, from the location results, there is still a relatively good effect for the location of thunderstorms beyond 2000 km outside the network. Owing to the large background noise of the station at JQ Station (Figure 6f), close to the radar station), the correlation coefficient between the observed waveform and the simulated waveform is only 0.6545, and the ground wave peak point of the observed data has been challenging to identify. Therefore, 0.65 is set as the minimum cross-correlation coefficient threshold between the observed waveforms and the simulated waveforms. The skywave part of the observed data is more consistent with the waveform bank at a long distance. This is because the lightning is located in the south outside of the network, and the lightning sferics propagates from south to north to the station, and the influence of the geomagnetic field is relatively small. This indicates that if the influence of the geomagnetic field is fully considered, this method can also extract the skywave peak point of the lightning sferics.

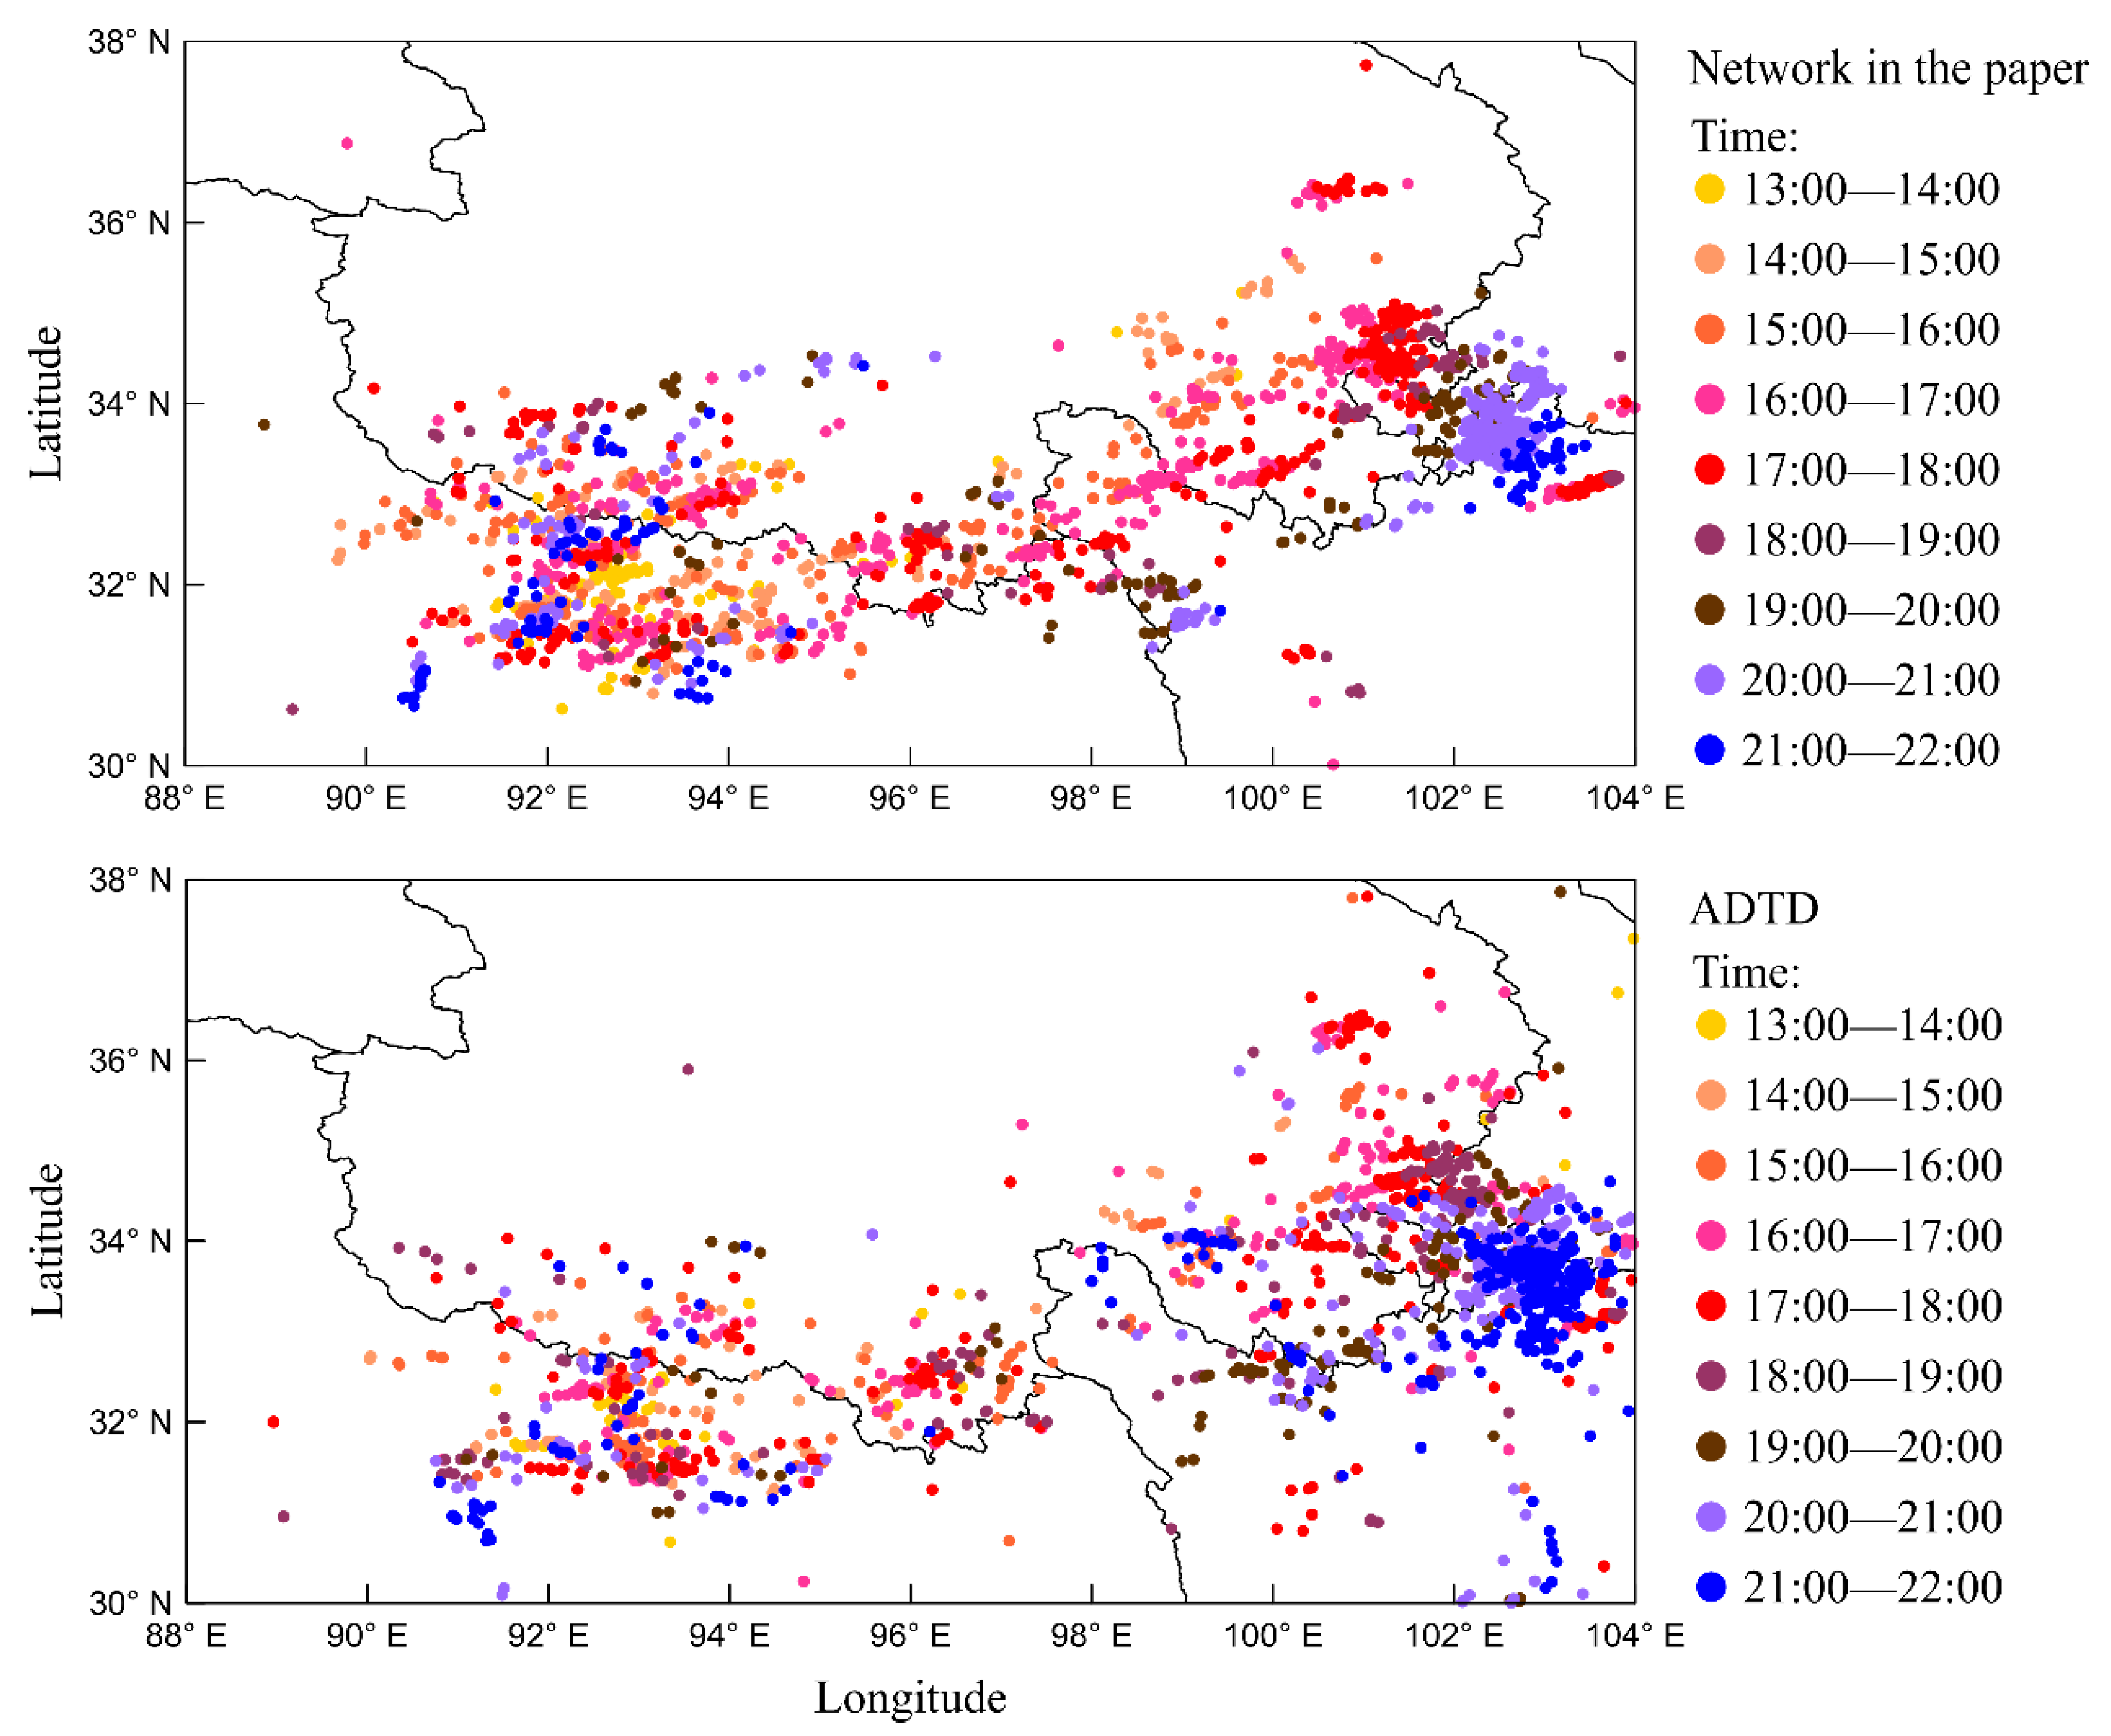
4.2. Location Results

Figure 7 shows the location results of the synchronization data of more than four stations outside the network from 00:00 to 00:15 on 12 October 2021, Beijing time. The background shows the cloud top temperature (CTT) data detected by the advanced geosynchronous radiation imager (AGRI) carried by FY4A. CTT is often used to research the development of convective clouds; the lower the value of CTT, the more vigorous the convective activity. The area where thunderstorms occurred is outside the network, and the average distance from the center of the network is more than 2000 km. The thunderstorm’s time is zero Beijing time, and the ionospheric height is relatively close to the simulated height used in the waveform bank. Except for lightning near 94°E and 25°N, the rest of the identified lightning locations are all in the area of strong convection. The lateral development of lightning may cause this particular point, or the detection accuracy of FY4A did not recognize small convective cells. Combined with Figure 1, the lightning sferic in the 90°E–95°E and 18°N–24°N regions propagates along the Hengduan Mountains or the Qinghai–Tibet Plateau with the highest elevation more than 3000 m. However, our long-range lightning location network still has good detection of thunderstorm activity in the region. In the lower right corner of Figure 6, the lightning activity inside Typhoon Kompasu is less. It may be that there is not much lightning activity inside Typhoon Kompasu because it can be seen from Figure 8 that our location network still has a good effect in the South China Sea region. In summary, our long-range lightning location network still has an accurate positioning result for lightning 2000 km away from the network boundary.
Figure 8 shows the simultaneous location results of more than four stations from 17:00 to 17:15 Beijing time on 3 October 2021. Areas where thunderstorms occur are relatively scattered. The thunderstorm is during the evening of Beijing time, and the height of the ionosphere is quite different from the simulated height used by the waveform bank. The local multiple small thunderstorms in the 95°E–105°E and 18°N–24°N areas and the squall line process in the 90°E–105°E and 30°N–32°N regions have a great location result. The overall outline of the lightning position located by using the method described in this paper is entirely consistent with the developing tendency of the multicell thunderstorm. The results show that the waveform database established by using the typical daytime ionospheric conditions and typical nighttime ionospheric conditions is sufficient to meet all-weather location requirements, and there is no need to build a waveform bank at every moment.

5. Discussion

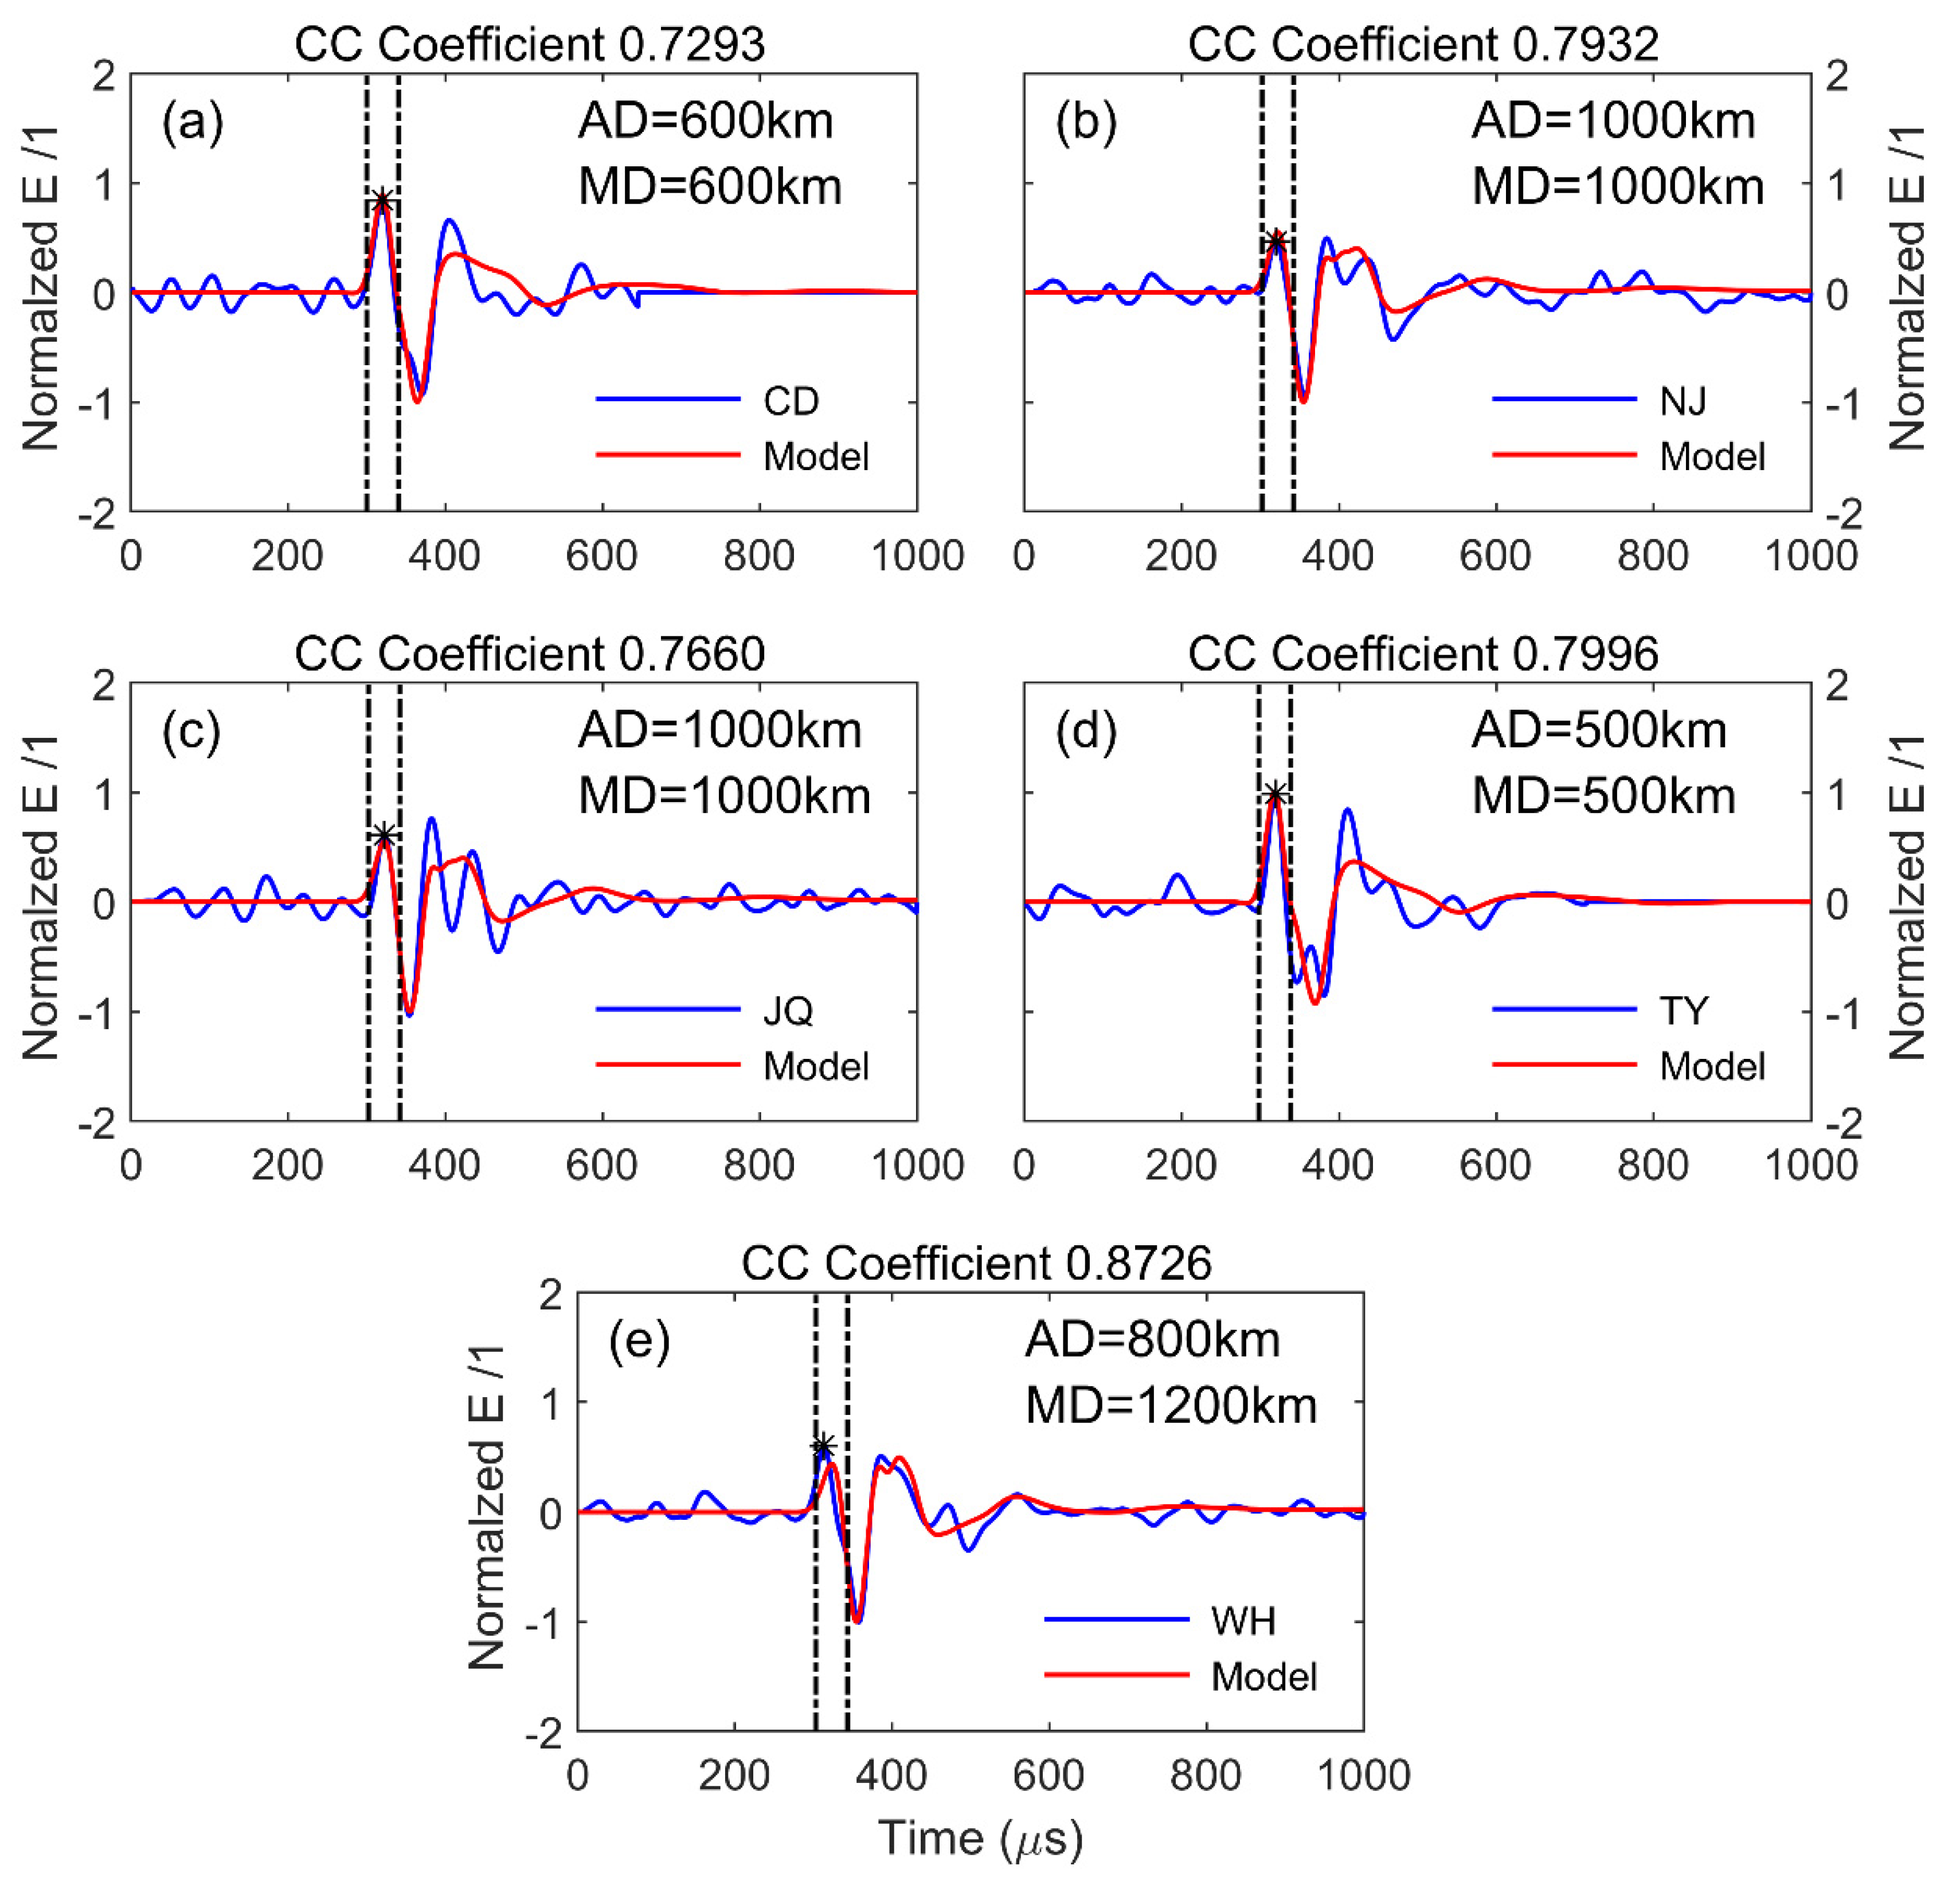
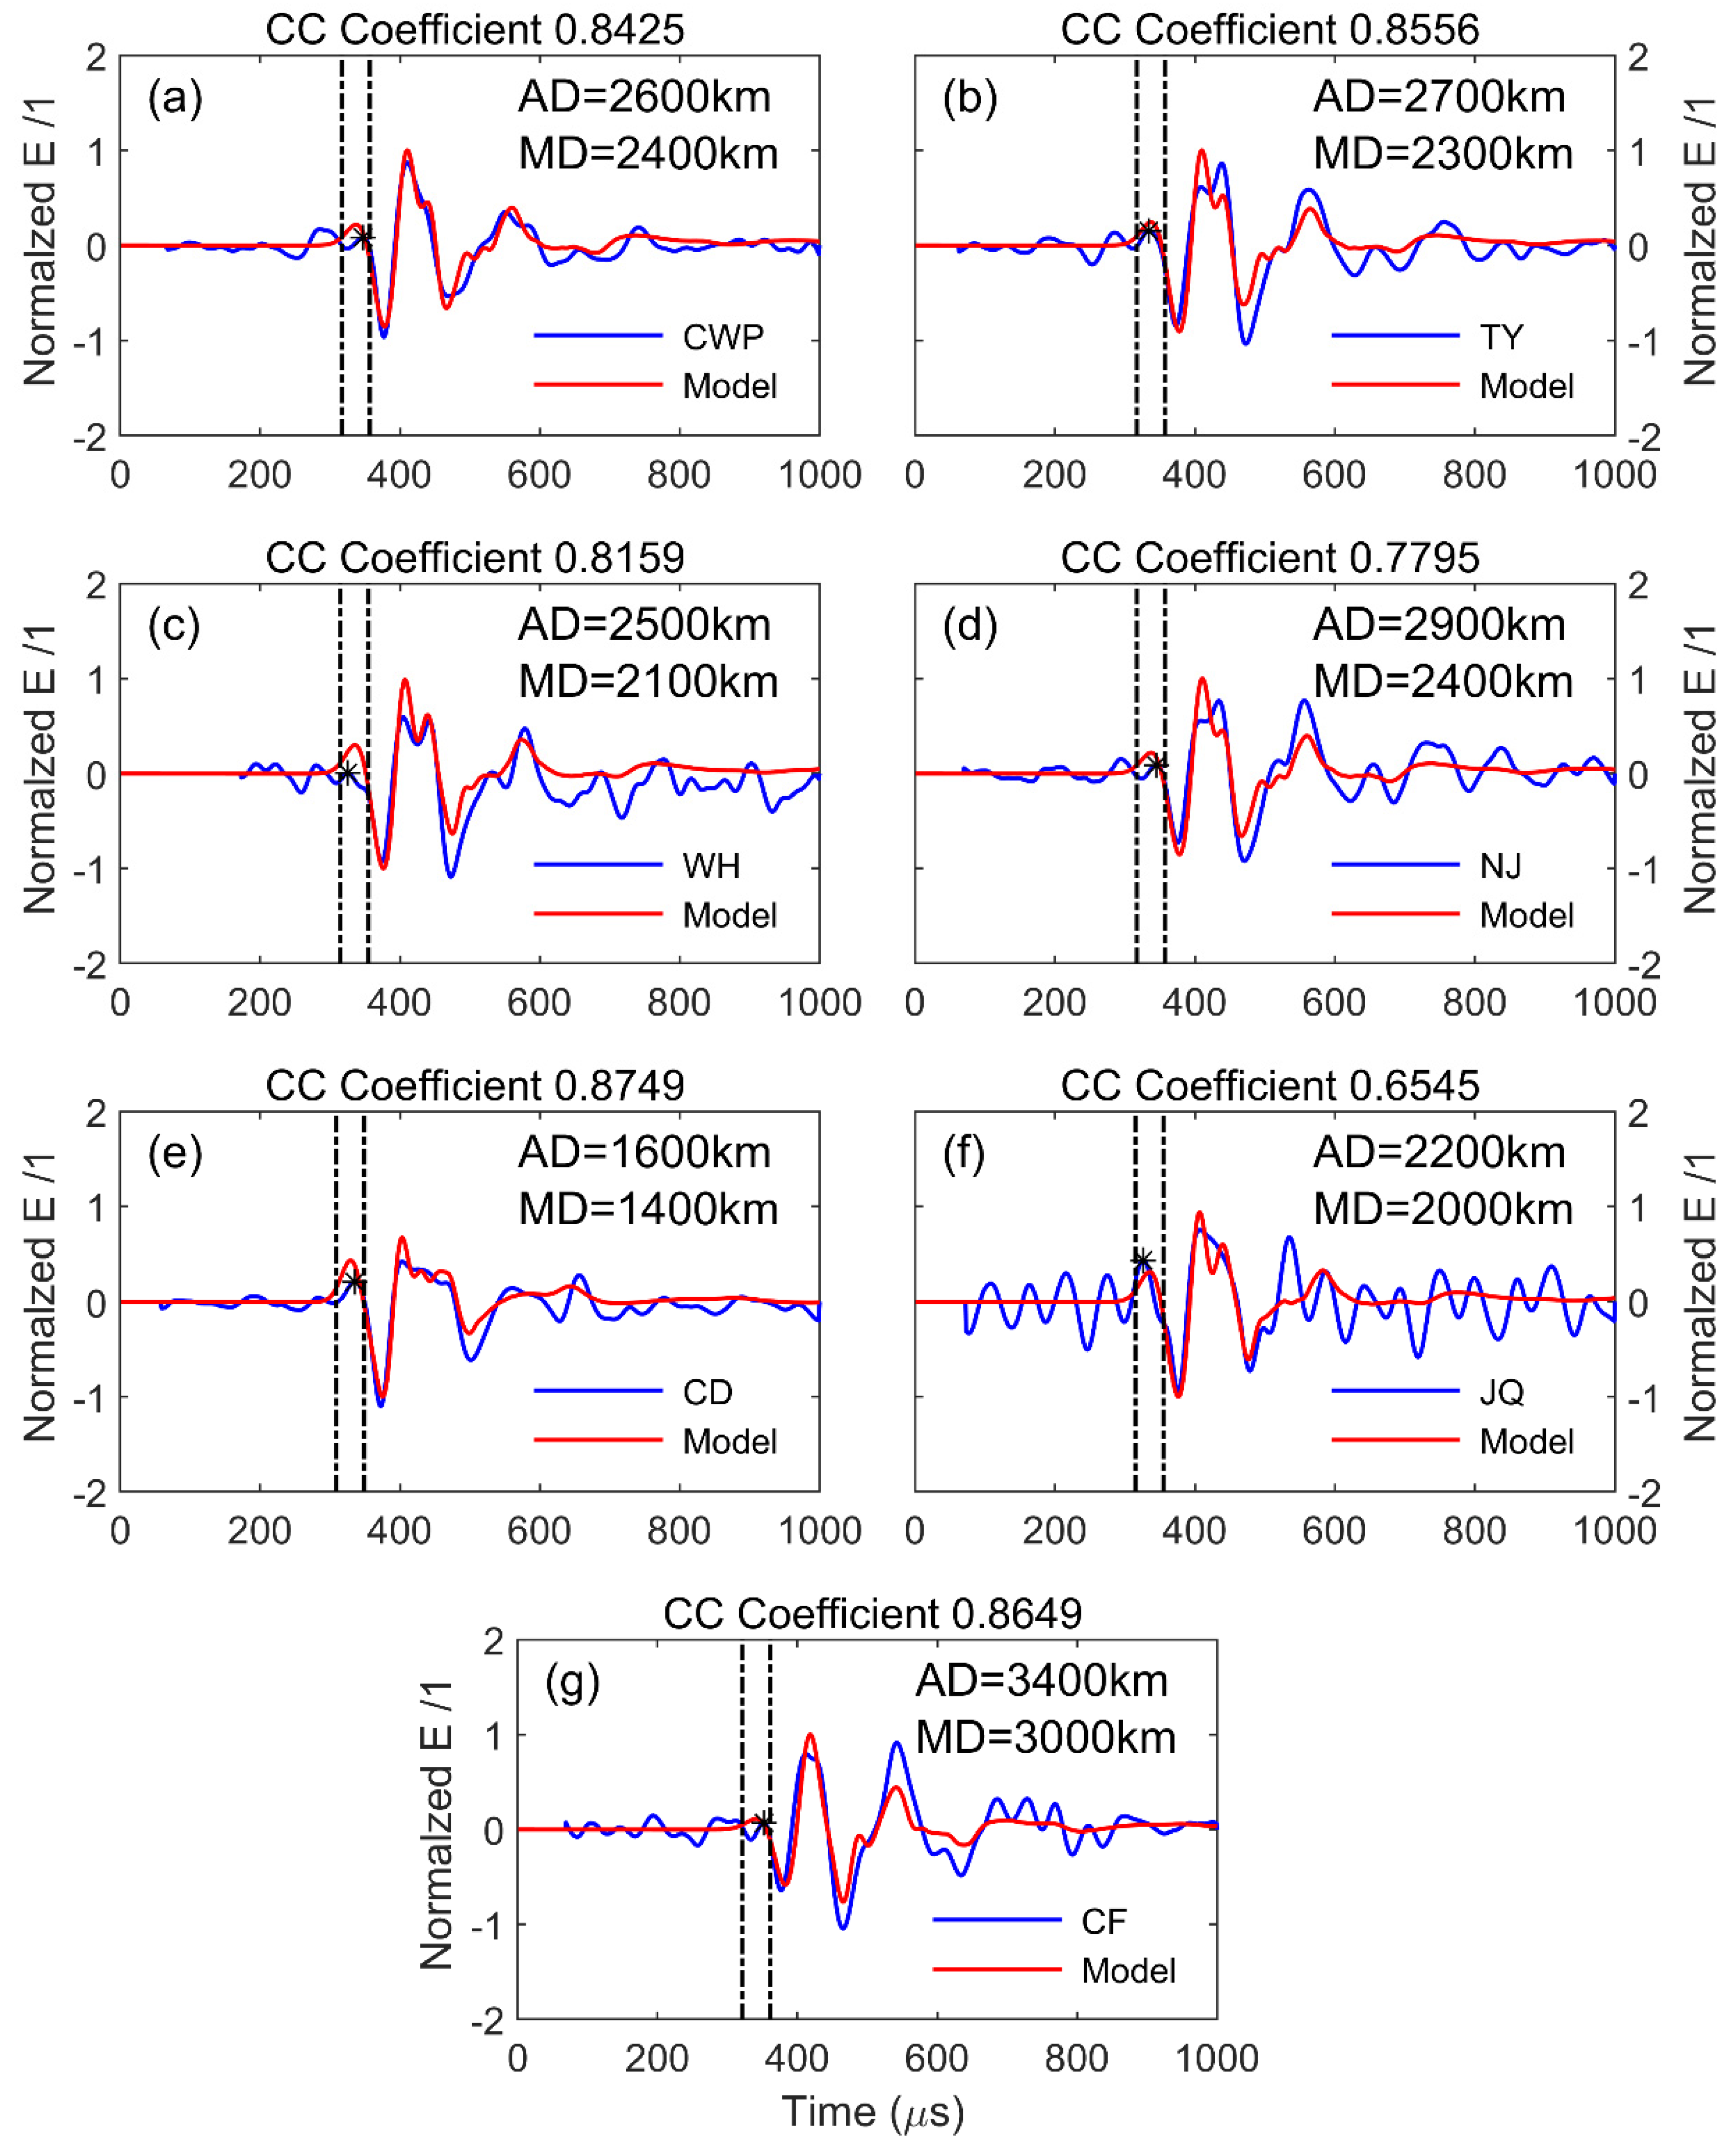
5.1. Method Effectiveness Verification

To evaluate the actual effect of equivalent propagation velocity, we compare the lightning location data with that by using the speed of light and advanced direction and time-of-arrival detecting (ADTD) in the multicell thunderstorm at the junction of Qinghai and Tibet, shown in Figure 8. The ADTD lightning location network consists of 371 sites, and the detection range covers most of China and some countries in Southeast Asia. The relevant parameters of ADTD come from Wang et al.’s paper [7]. According to ADTD’s product description, it can detect the time and type of lightning occurrence in real-time, calculate the location, height, peak current intensity, lightning cumulative density distribution, and movement trend of lightning. The horizontal location error of ADTD is better than 500 m, and the height error is better than 1000 m.
Figure 9 shows the lightning location results of the three methods for 3 October 2021, 17:00–17:15, Beijing time. To further illustrate this effect, we zoom in on each area. The black dots are the location results of this paper’s equivalent propagation velocity method. The ruby-red dots are the data located by using the speed of light. The white dots are the location results of ADTD. It can be seen that the location result using the equivalent propagation velocity method is closer to the location result of ADTD or a lower CTT area than the location result utilizing the speed of light. This proves that our method is effective for improving the overall lightning location accuracy. In the next section, we further illustrate the effectiveness of this method through the shared events between our network and ADTD.

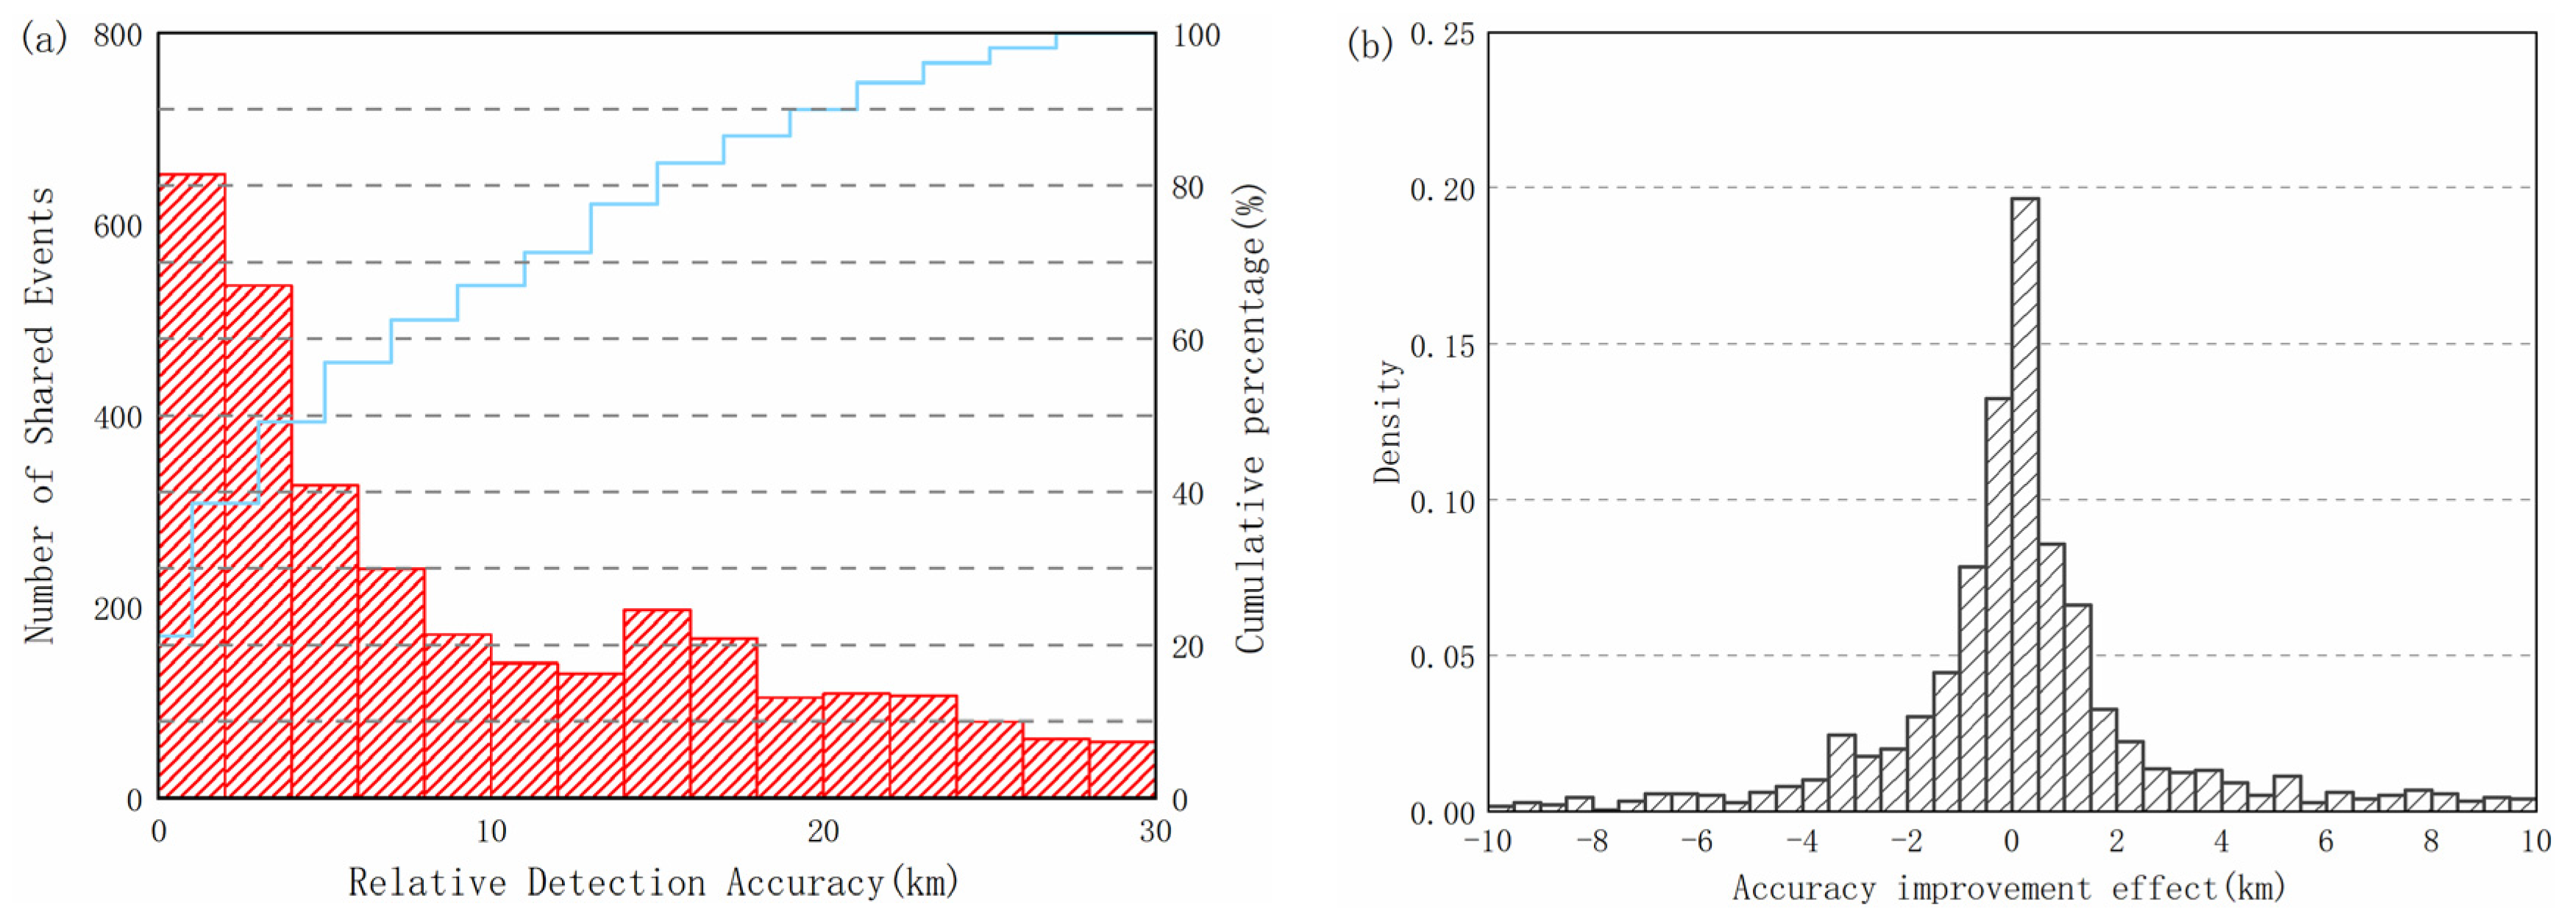
5.2. Evaluation of Location Effect

This paper selected multicell thunderstorm weather that occurred on 3 October 2021, Beijing time, in west China (88°E–104°E, 30°N–38°N) to evaluate further the lightning location effect of our network, and to compare and evaluate the location data of our network and ADTD. The thunderstorm process lasted from 13:00 to 22:00 Beijing time. Our network and ADTD detected 1857 and 1835 lightning strokes in this area during this weather process, respectively. The hourly lightning location results are shown in Figure 10. The overall structure of thunderstorms is belt-shaped, and there is no significant change trend over time.
We find that the lightning location data from both ADTD and our network are consistent with the area of that thunderstorm, but our location results are more crowded together. We identify the shared events between the two networks and use the two-way version of the three-way Bayesian approach presented by Bitzer and Burchfield to calculate the relative detection efficiency [39]. We used a time difference of 0.5 ms and a location deviation of 30 km as criteria to define shared events [8]. Specifically, referring to our network as “N” and ADTD as “A” in the following, the probability of detection by our network can be expressed as:
P ( N ) P ( N ) P ( N A ) = [ 1 P ( A | N ) + P ( A | N ) P ( N | A ) ] 1
During this thunderstorm process, a total of 202 shared events were detected, and it can be calculated that our network’s relative detection accuracy is less than or equal to 53%. Considering that ADTD detects full flashes, our network may have a higher relative detection efficiency for CG flash.
All shared events between our network and ADTD were evaluated for location accuracy. We identified all 3083 shared events on 3 October and further expanded the shared event dataset. The ADTD location results were used as a reference, and the location deviation of our network location results relative to ADTD was calculated. Figure 11a shows the distribution and cumulative percentage curve of shared events in different location deviations. It can be found that more than 60% of the deviations are distributed within 10 km, of which most are within 4 km. The average location error is 9.17 km, and the standard deviation is 8.04 km. The distance between the ADTD station and the lightning is usually tens of kilometers. The distance between our network station and the lightning is in the order of thousands of kilometers. Therefore, the overall location accuracy of shared events is sufficient to meet the needs of meteorological observations.
Figure 11b shows the distribution of accuracy improvement effect using the equivalent propagation velocity method, which is the deviation that lightning locations inferred from the equivalent propagation velocity and speed of light are compared with lightning locations reported by the ADTD. It can be seen that the deviation brought by the equivalent propagation velocity method is more of a positive optimization. The result indicates an improved average location accuracy by ~1.16 km when using the equivalent propagation velocity method. In addition, this also shows that using the equivalent propagation velocity method brings a difference of hundreds of meters to several kilometers, compared to the results inferred from the speed of light. In particular, the actual effect of the equivalent propagation velocity method may be better because the positioning results of the ADTD used for comparison are determined by the speed of light, and the results are not particularly ideal (Figure 10), which may underestimate the effectiveness of the method.

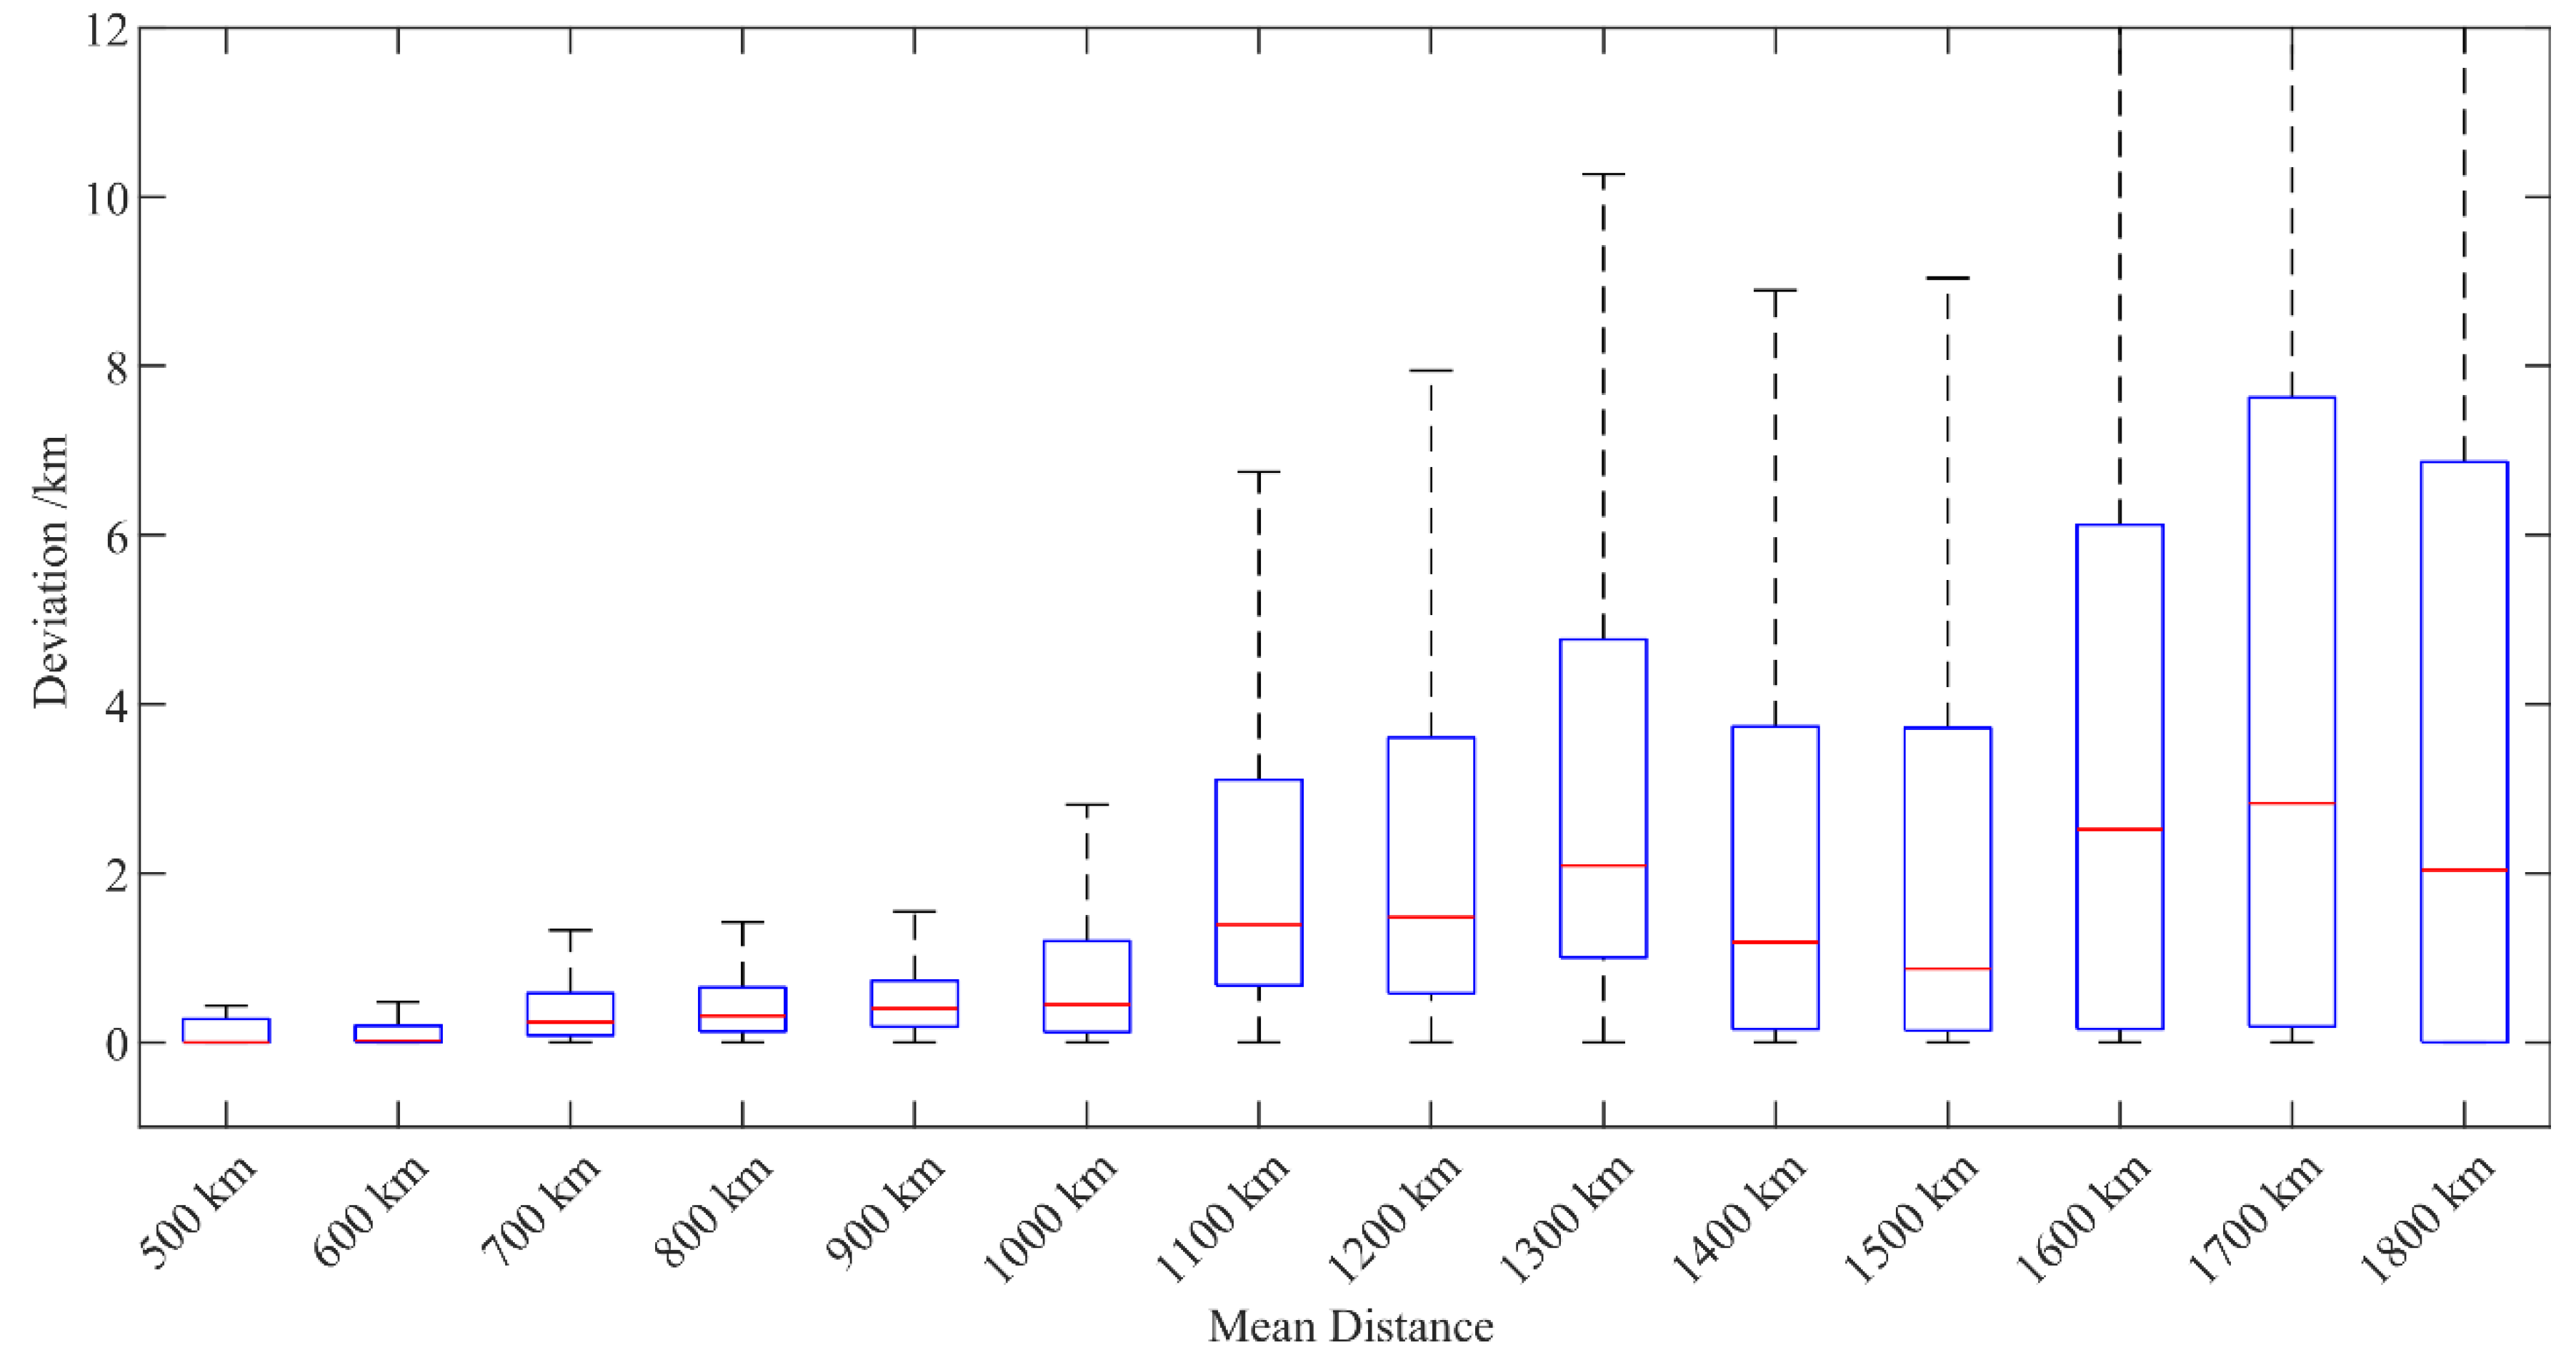
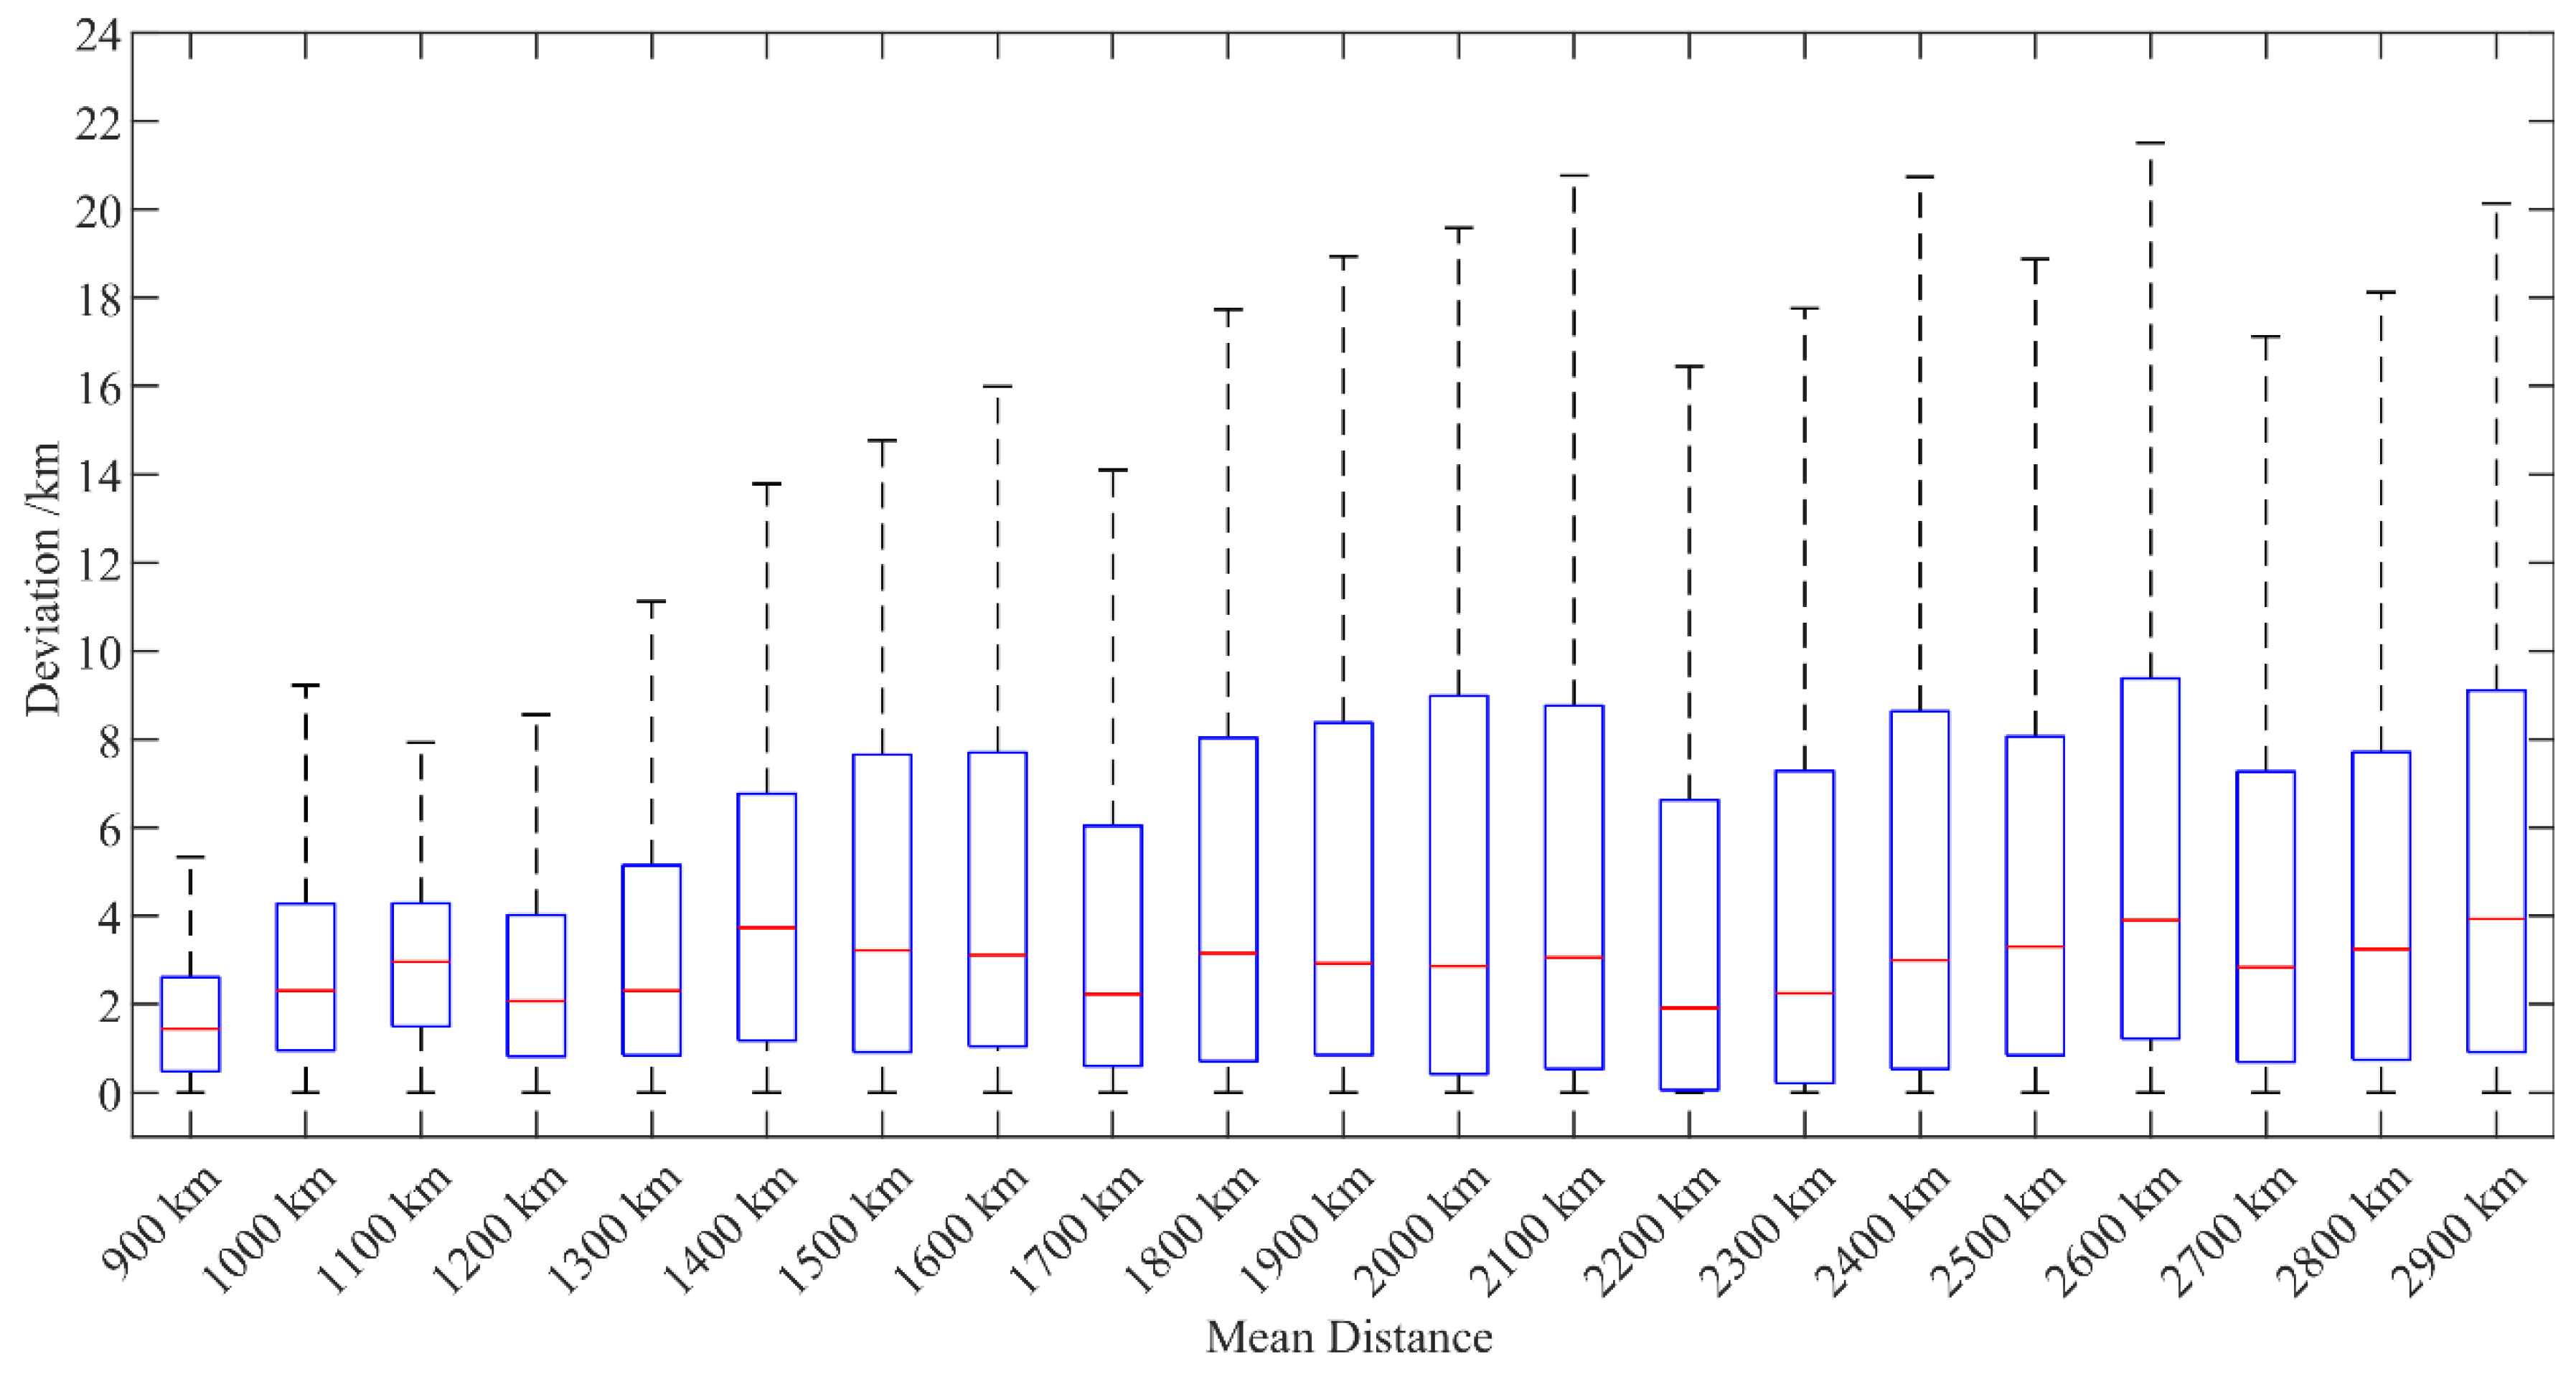
5.3. Position Deviation

This section discusses the deviation between the location results using the equivalent propagation velocity method and the location results using the speed of light. Under ideal conditions, this deviation can be regarded as the maximum position improvement brought about by the equivalent propagation velocity method. We divide the area of 95°E–120°E and 30°N–45°N as inside the network, and the remaining areas as outside and discuss the position deviations inside and outside the network. The data used is from 3 October 2021, Beijing time, when thunderstorm activity was widely distributed on that day. Figure 12 shows the changing trend of the deviation within the network with the average distance from lightning to the station. Owing to the long baseline of our network, the minimum average distance of lightning from the station is 500 km. It can be seen that within the network, within an average distance of 1000 km from a station, as the distance increases, both the median and upper limit of the overall distribution of deviations increase. The overall deviation is within 1 km, similar to Liu et al.’s result [35]. The deviation has a large change at the distance of the 1100 km group, but it decreases in the 1400 and 1500 km groups. The degree of dispersion of the internal data of each group also increased to a certain extent. By checking the location results, it is found that the lightning in the 1100–1300 km group is located inside the detection network, but the distance from the CF station or CWP station is much greater than the distance to other stations. The 25% value of deviation in the 1100–1300 km group is also larger, rather than close to zero as indicated for other groups. The lightning strokes of the 1400 and 1500 km groups are located at the edge of the network, and the measuring stations are located on the side of the lightning, and the average elevation of the lightning stroke area (95°E–105°E, 30°N–35°N) of the 1500 km group is lower than the lightning stroke area (115°E–120°E, 36°N–40°N) of the 1400 km group. In conclusion, the equivalent propagation velocity method may have a better effect in the following two cases.
(1)
Lightning locations are farther from one station or several stations than others.
(2)
The terrain on the originating location or the propagation path of the lightning sferic is more complicated.
Figure 13 shows the changing trend of the deviation outside the network with the average distance from lightning to the station. Distance is not a particularly sensitive factor that affects deviation outside the network. Within each distance group, the dispersion of deviation is also higher. This is because the terrain along the propagation path of the lightning sferic in the same distance group is quite different outside the network due to the wide distribution of lightning. The equivalent propagation method can theoretically minimize the error, so it seems from the results that the terrain may result in the largest location error. The average deviation outside the network is ~4 km, and the median is less than 4 km. Interestingly, from the 1500 km group to the 2000 km group, the minimum value, 25%, median, and 75% value of the deviation are relatively consistent, but the maximum value is constantly increasing. When the deviation increases to 20 km, however, the maximum value tends to be stable, which seems to be the limit of the positioning effect correction of this method. We believe that the ground wave peak point is moved forward due to the superposition of long-range sky waves, which to some extent offsets the waveform lag caused by the limited ground conductivity and propagation path. As a result, the deviation tends to have a stable value, rather than always increasing with distance. The larger deviation of some lightning may be due to the larger location error caused by the lightning hitting the mountain. Because the region where lightning occurs in the 2200 and 2700 km groups is relatively flat, the maximum value of the deviation for these groups is also smaller. However, the equivalent propagation velocity method needs further study on whether the location error caused by lightning hitting the mountain can be corrected.

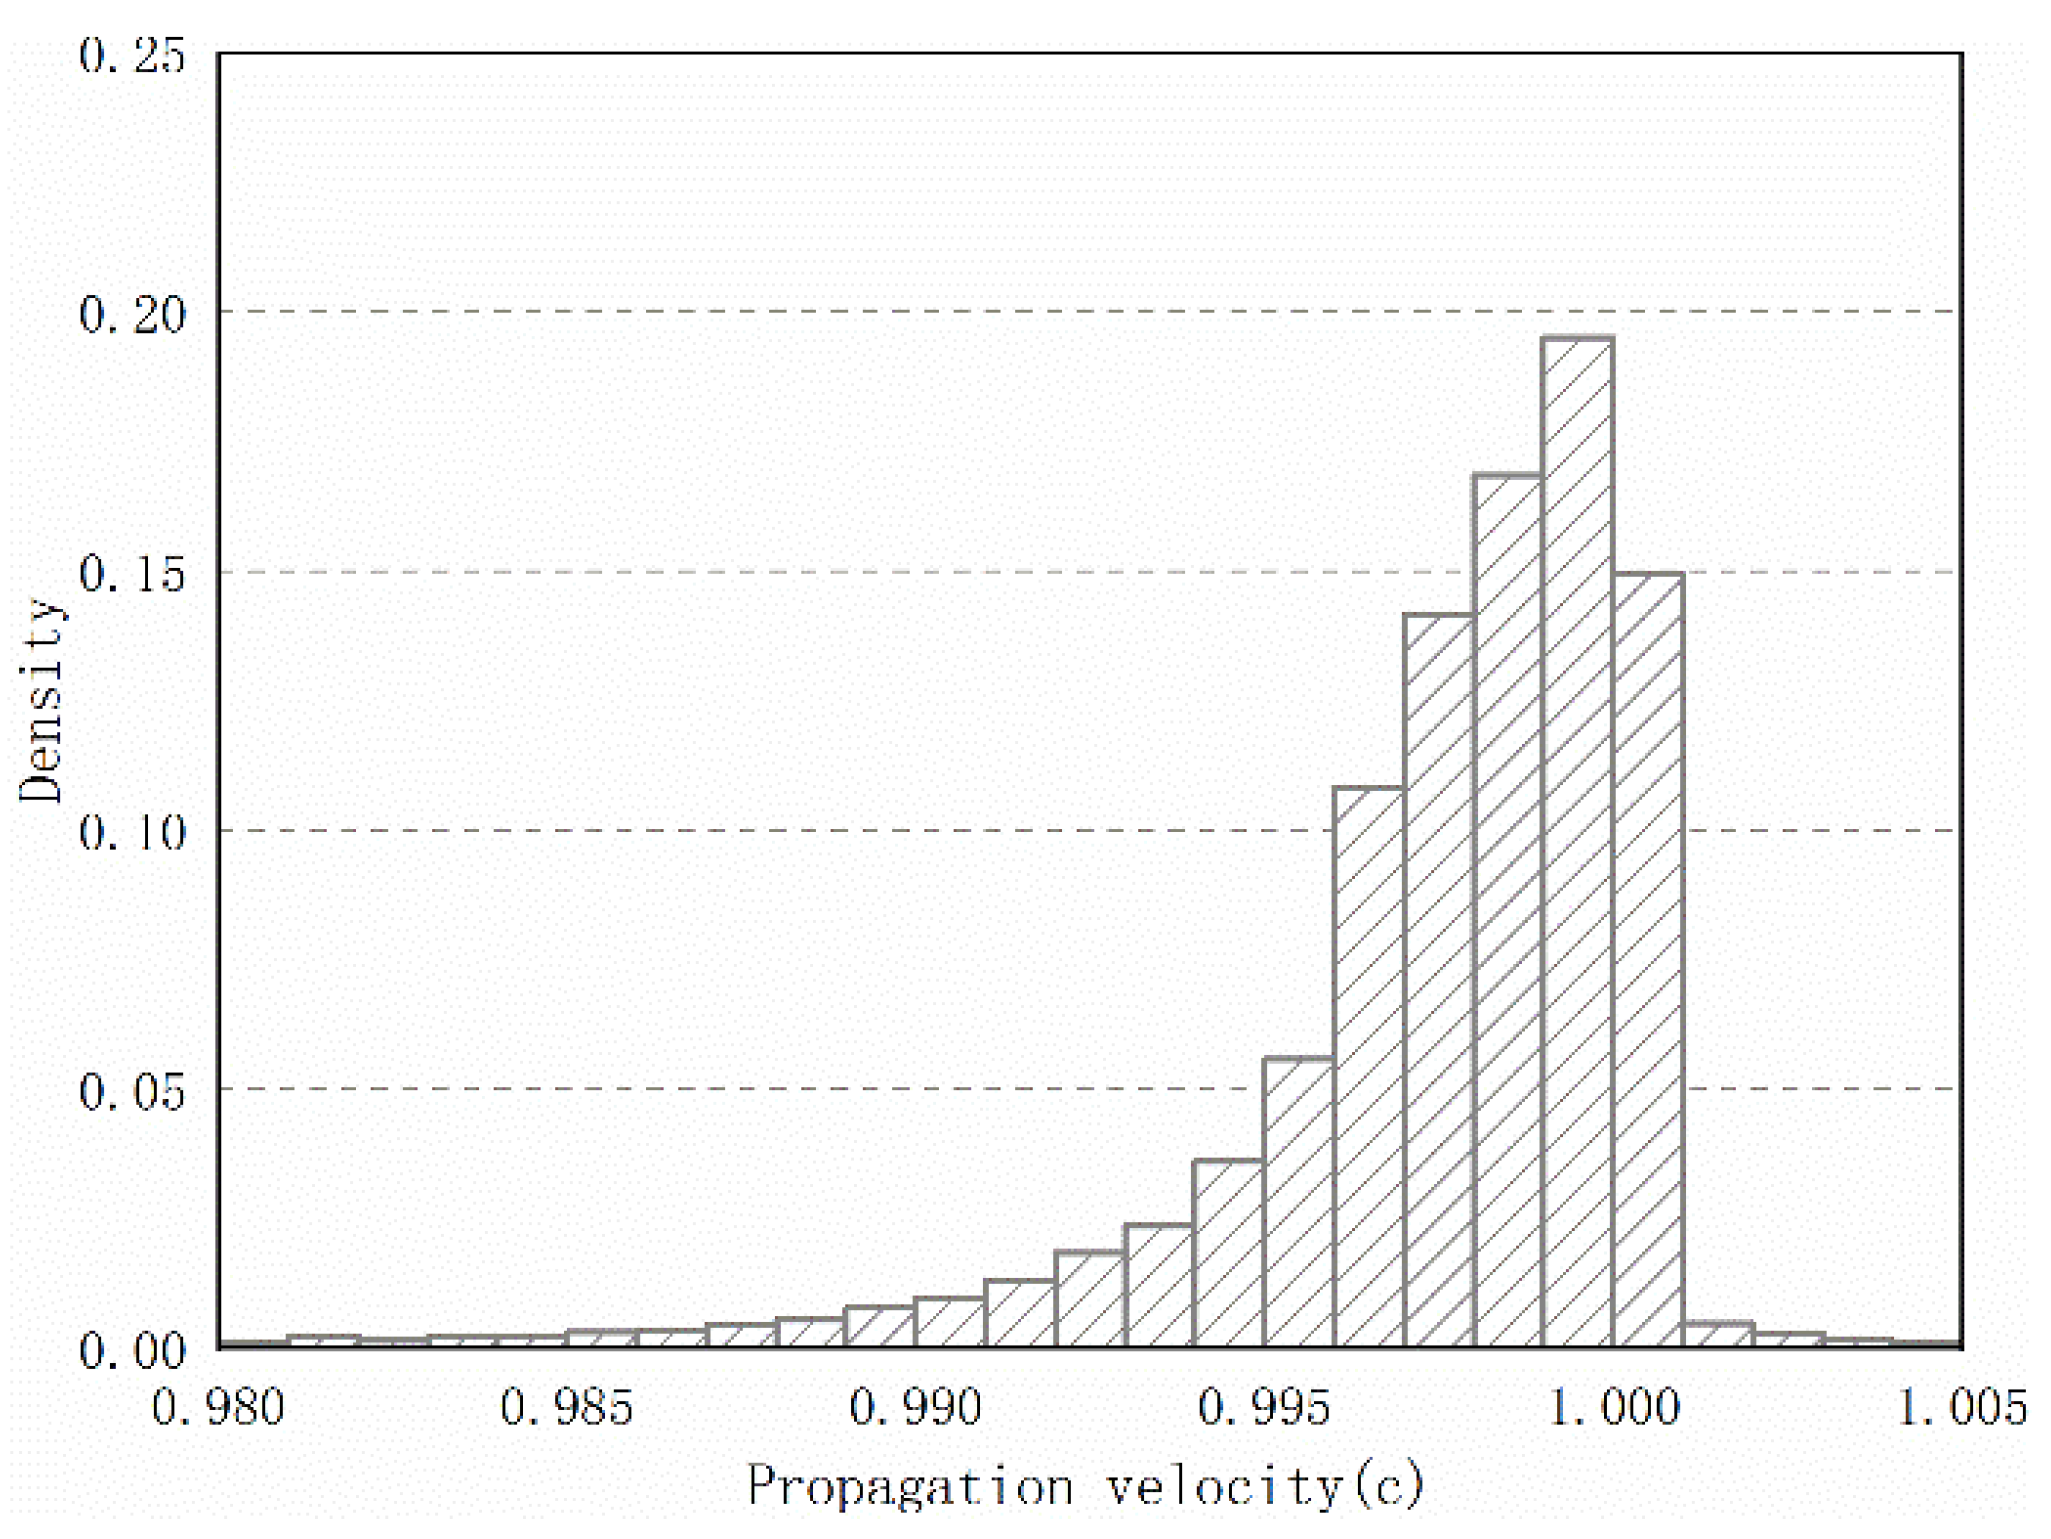
5.4. Frequency Distribution of Propagation Velocity

Figure 14 shows the frequency distribution of the propagation velocity of the lightning that occurred on 3 October 2021. About 97% of the lightning sferic propagation velocity is within ±1.5% of the speed of light, and more than 96% of the lightning sferic propagation velocity is less than the speed of light. Compared to Liu et al.’s results, the distribution is more concentrated [33]. The 50th percentile of lightning velocity is 0.998 times the speed of light. We believe that this is because the superposition of long-distance sky waves causes the peak value of ground waves to move forward, increasing propagation velocity. This point can also be seen from the waveform bank in Figure 3.

6. Conclusions

In this paper, we established a long-range lightning location network in China and introduced the location algorithm used by the network. The FDTD simulation and waveform matching method are used to extract the ground wave peak point of the lightning electrical signal when the lightning arrives at the station. The equivalent propagation velocity method is used to minimize the influence of limited soil conductivity, propagation path, sky waves, and other factors on the location accuracy. Finally, the relative detection efficiency, relative positioning accuracy, and the effect and velocity distribution of our station network’s equivalent propagation velocity method are evaluated using ADTD data. The main conclusions of this paper follow:.
(1)
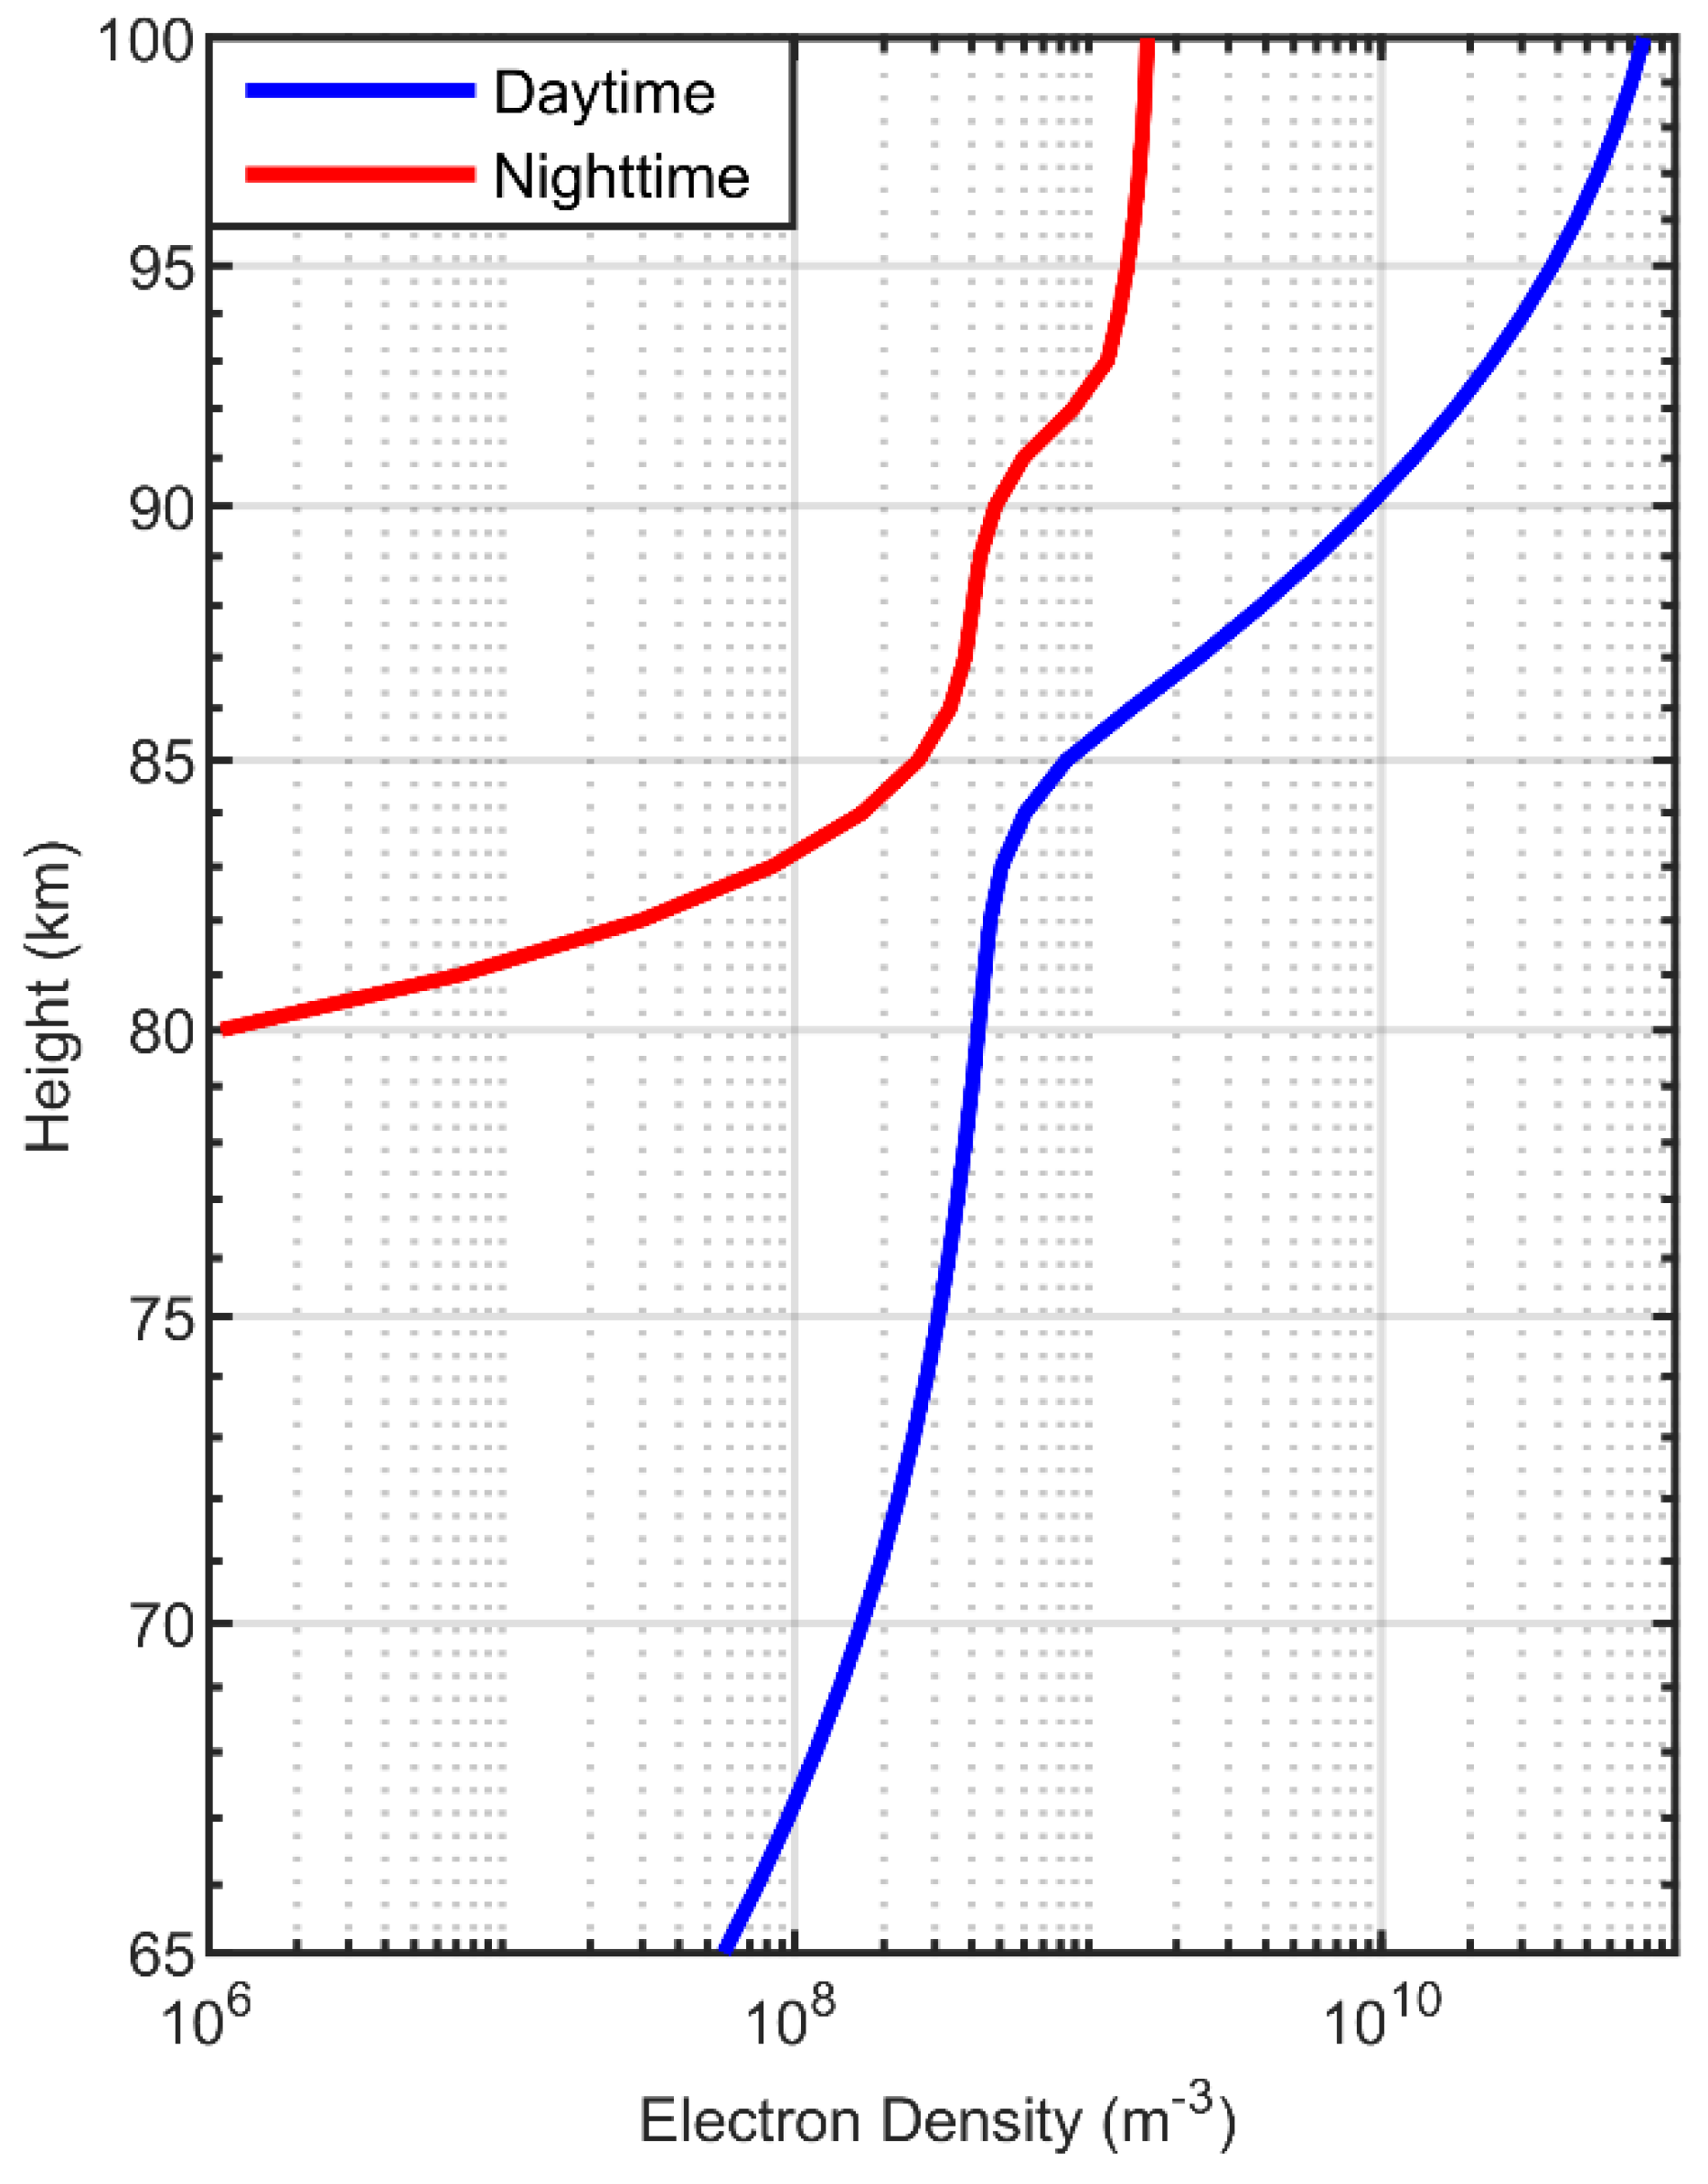
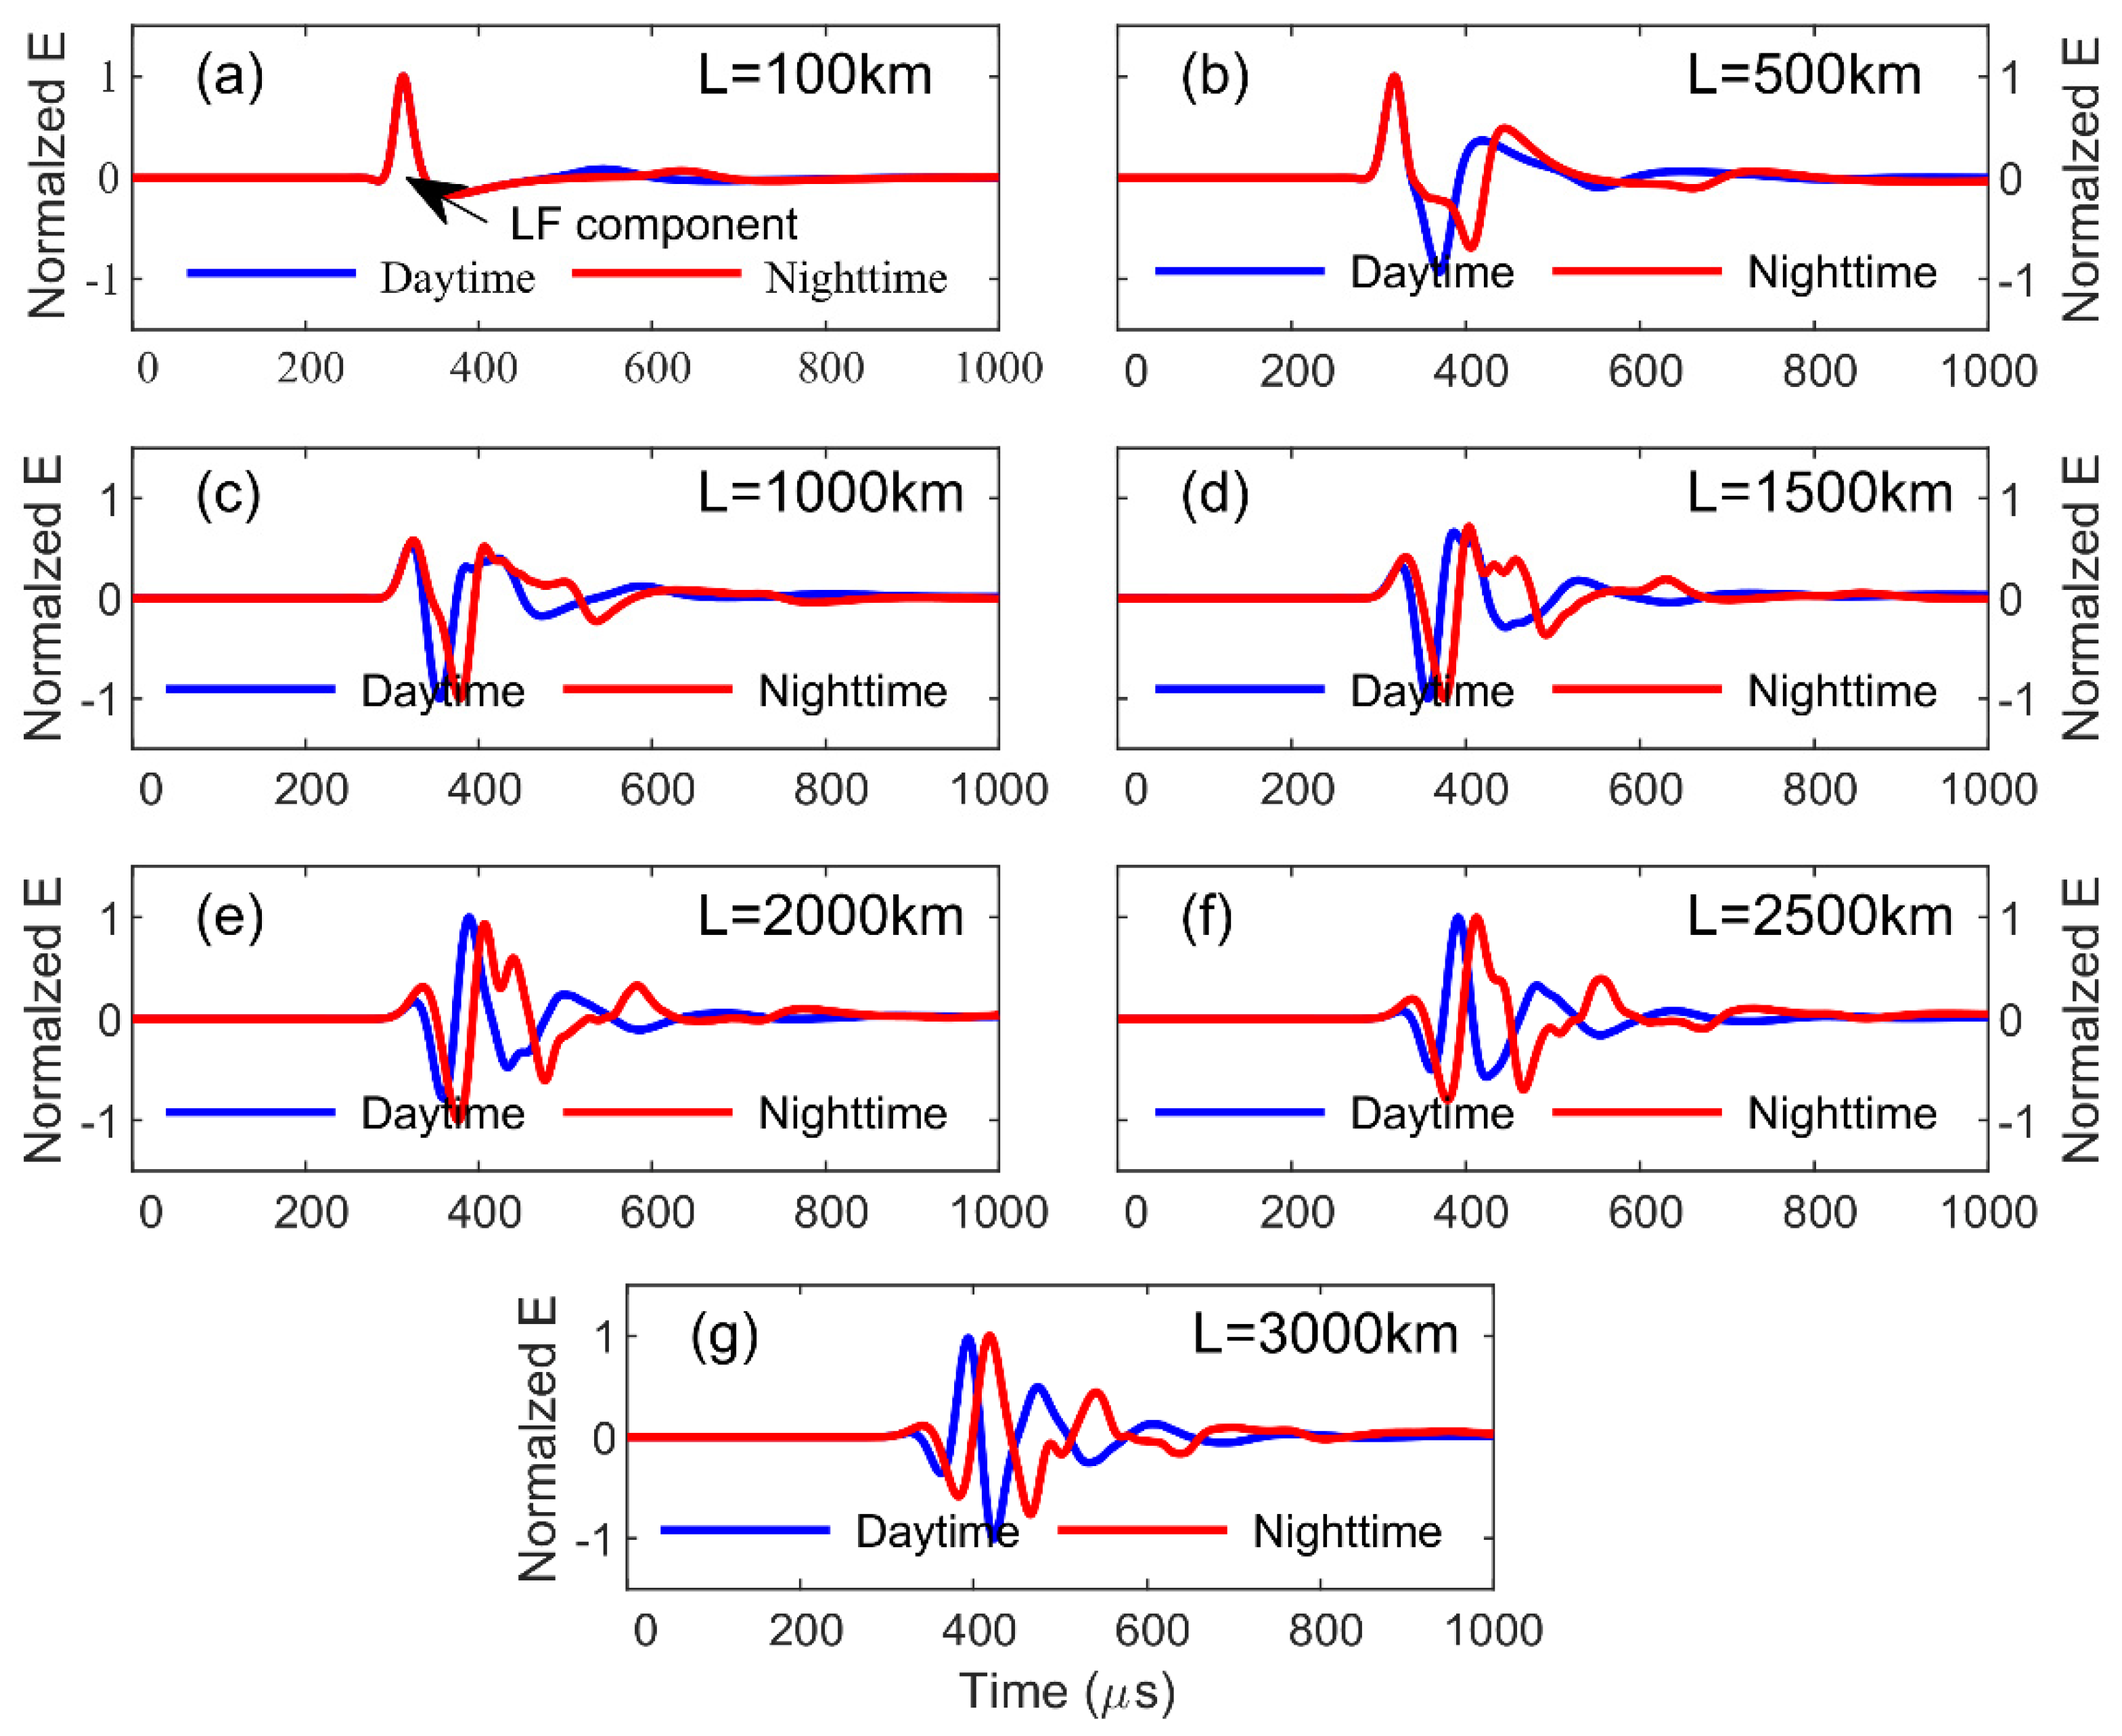
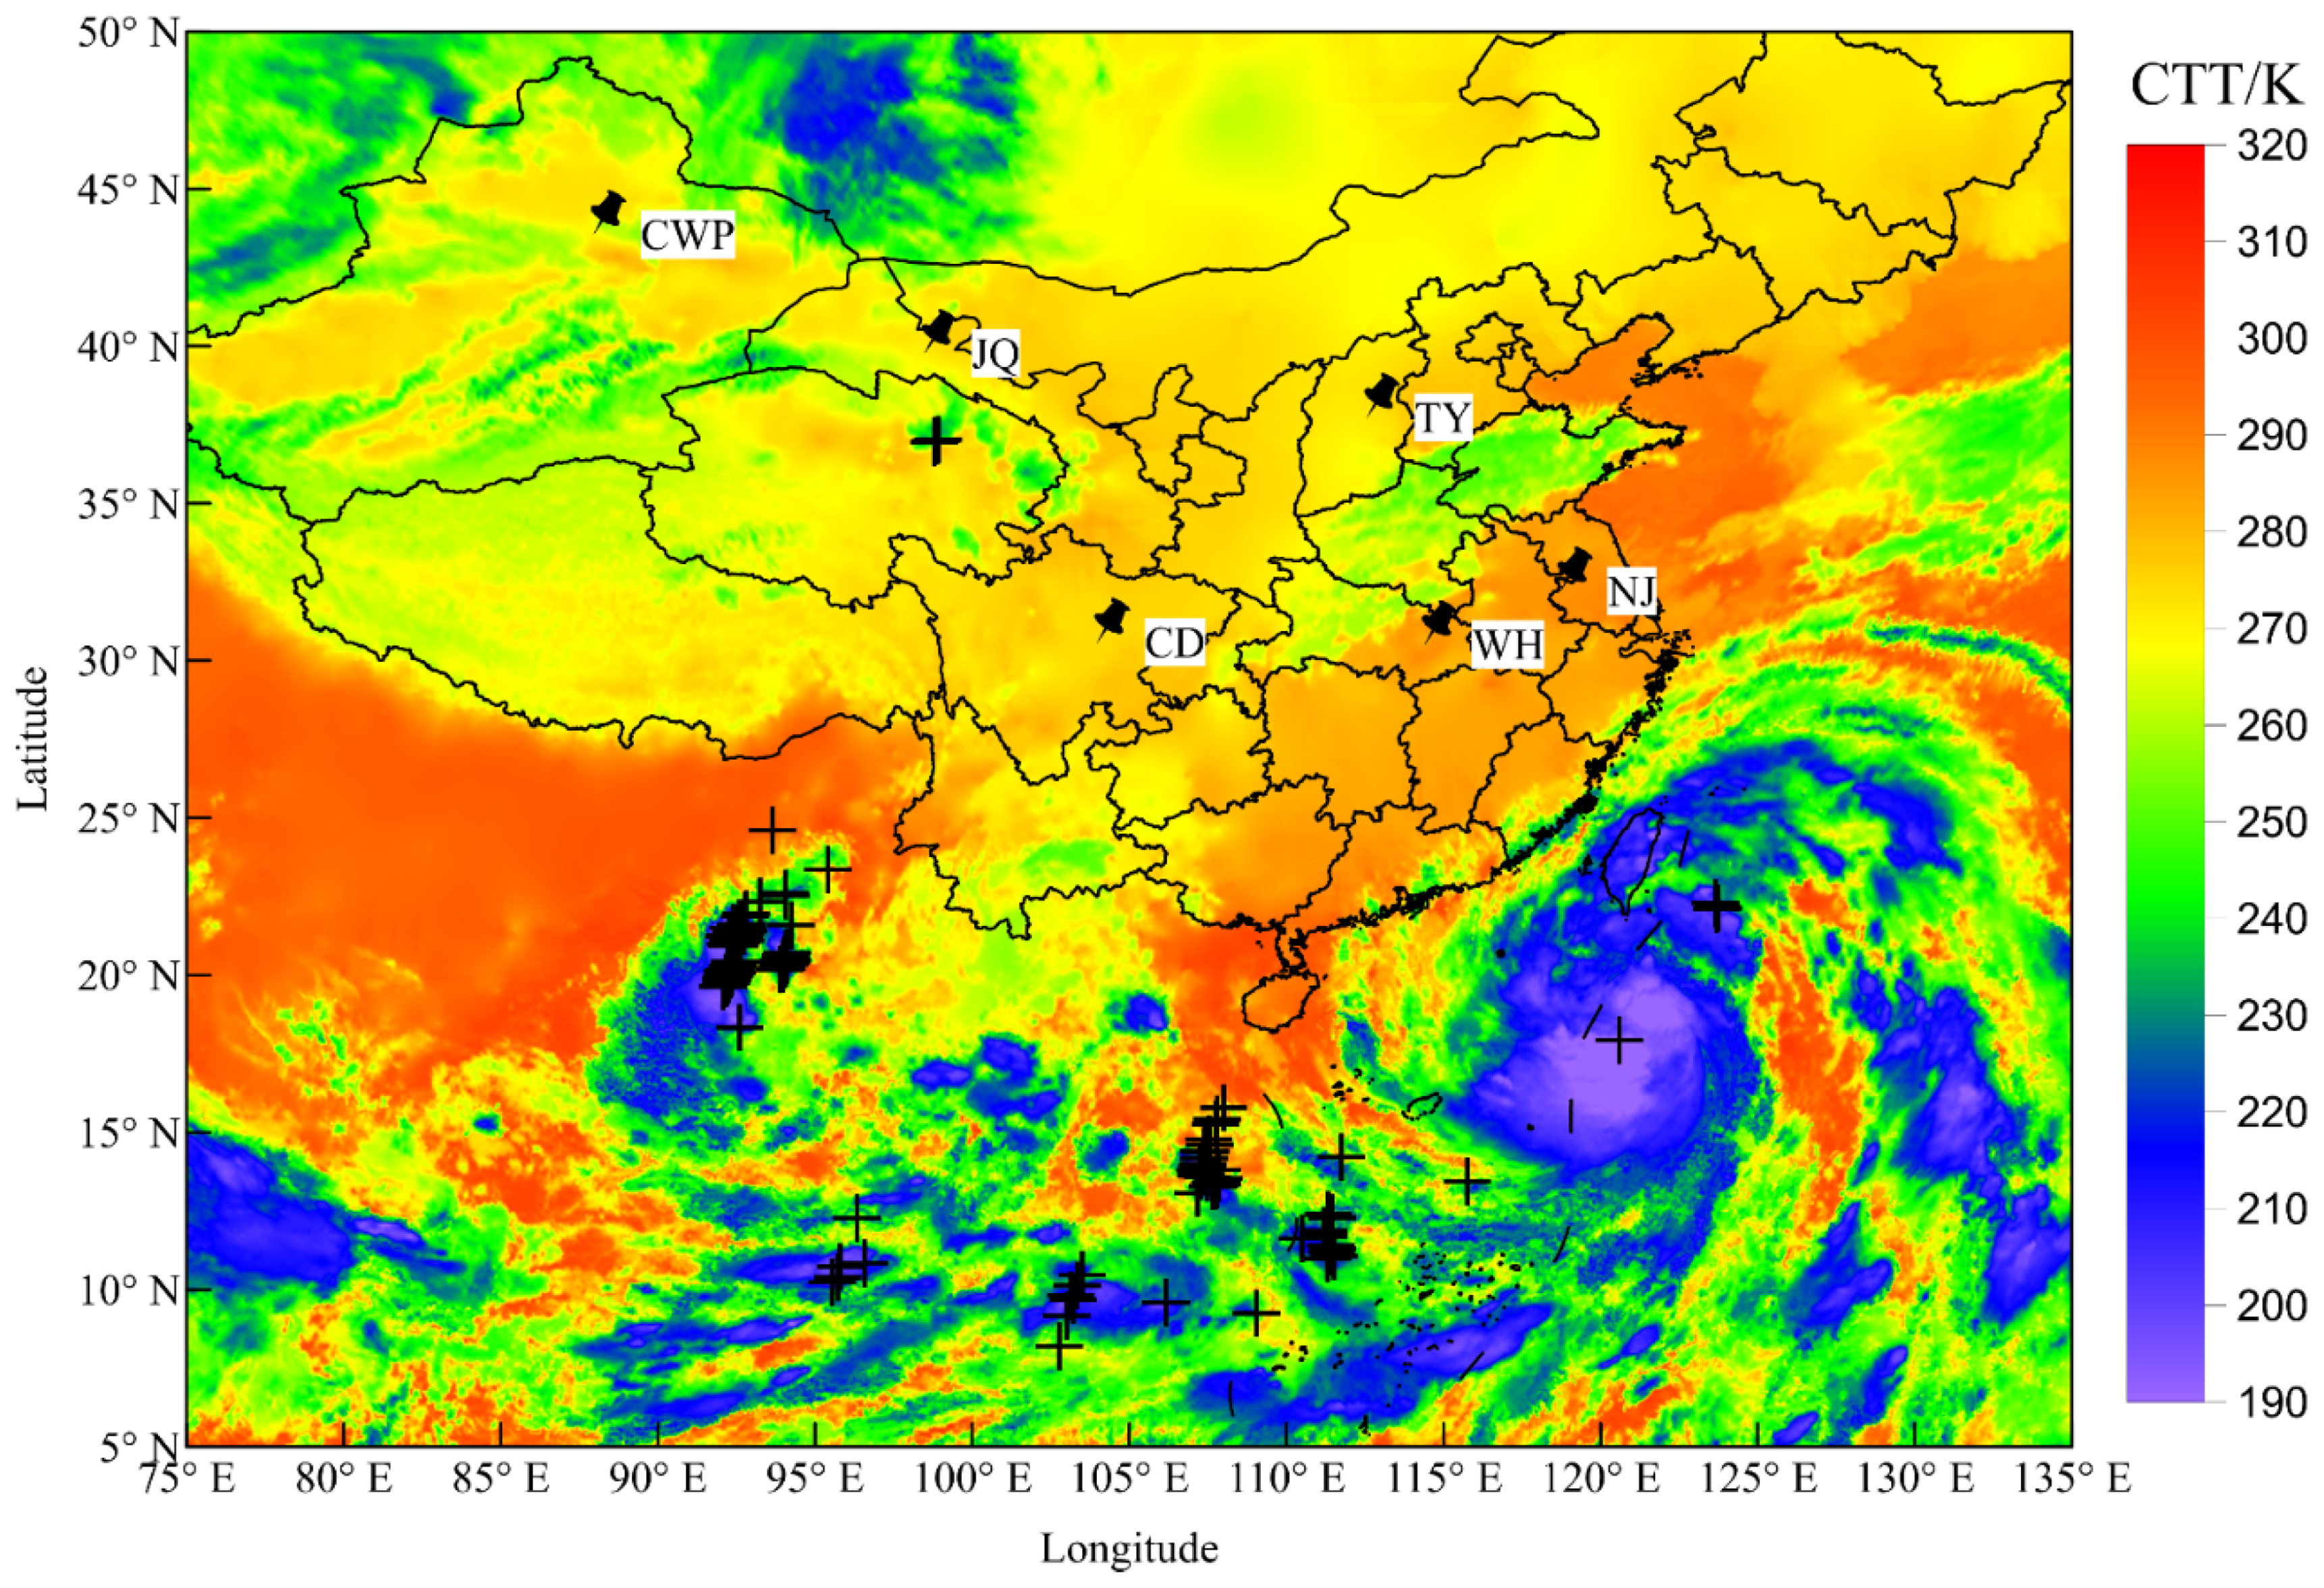
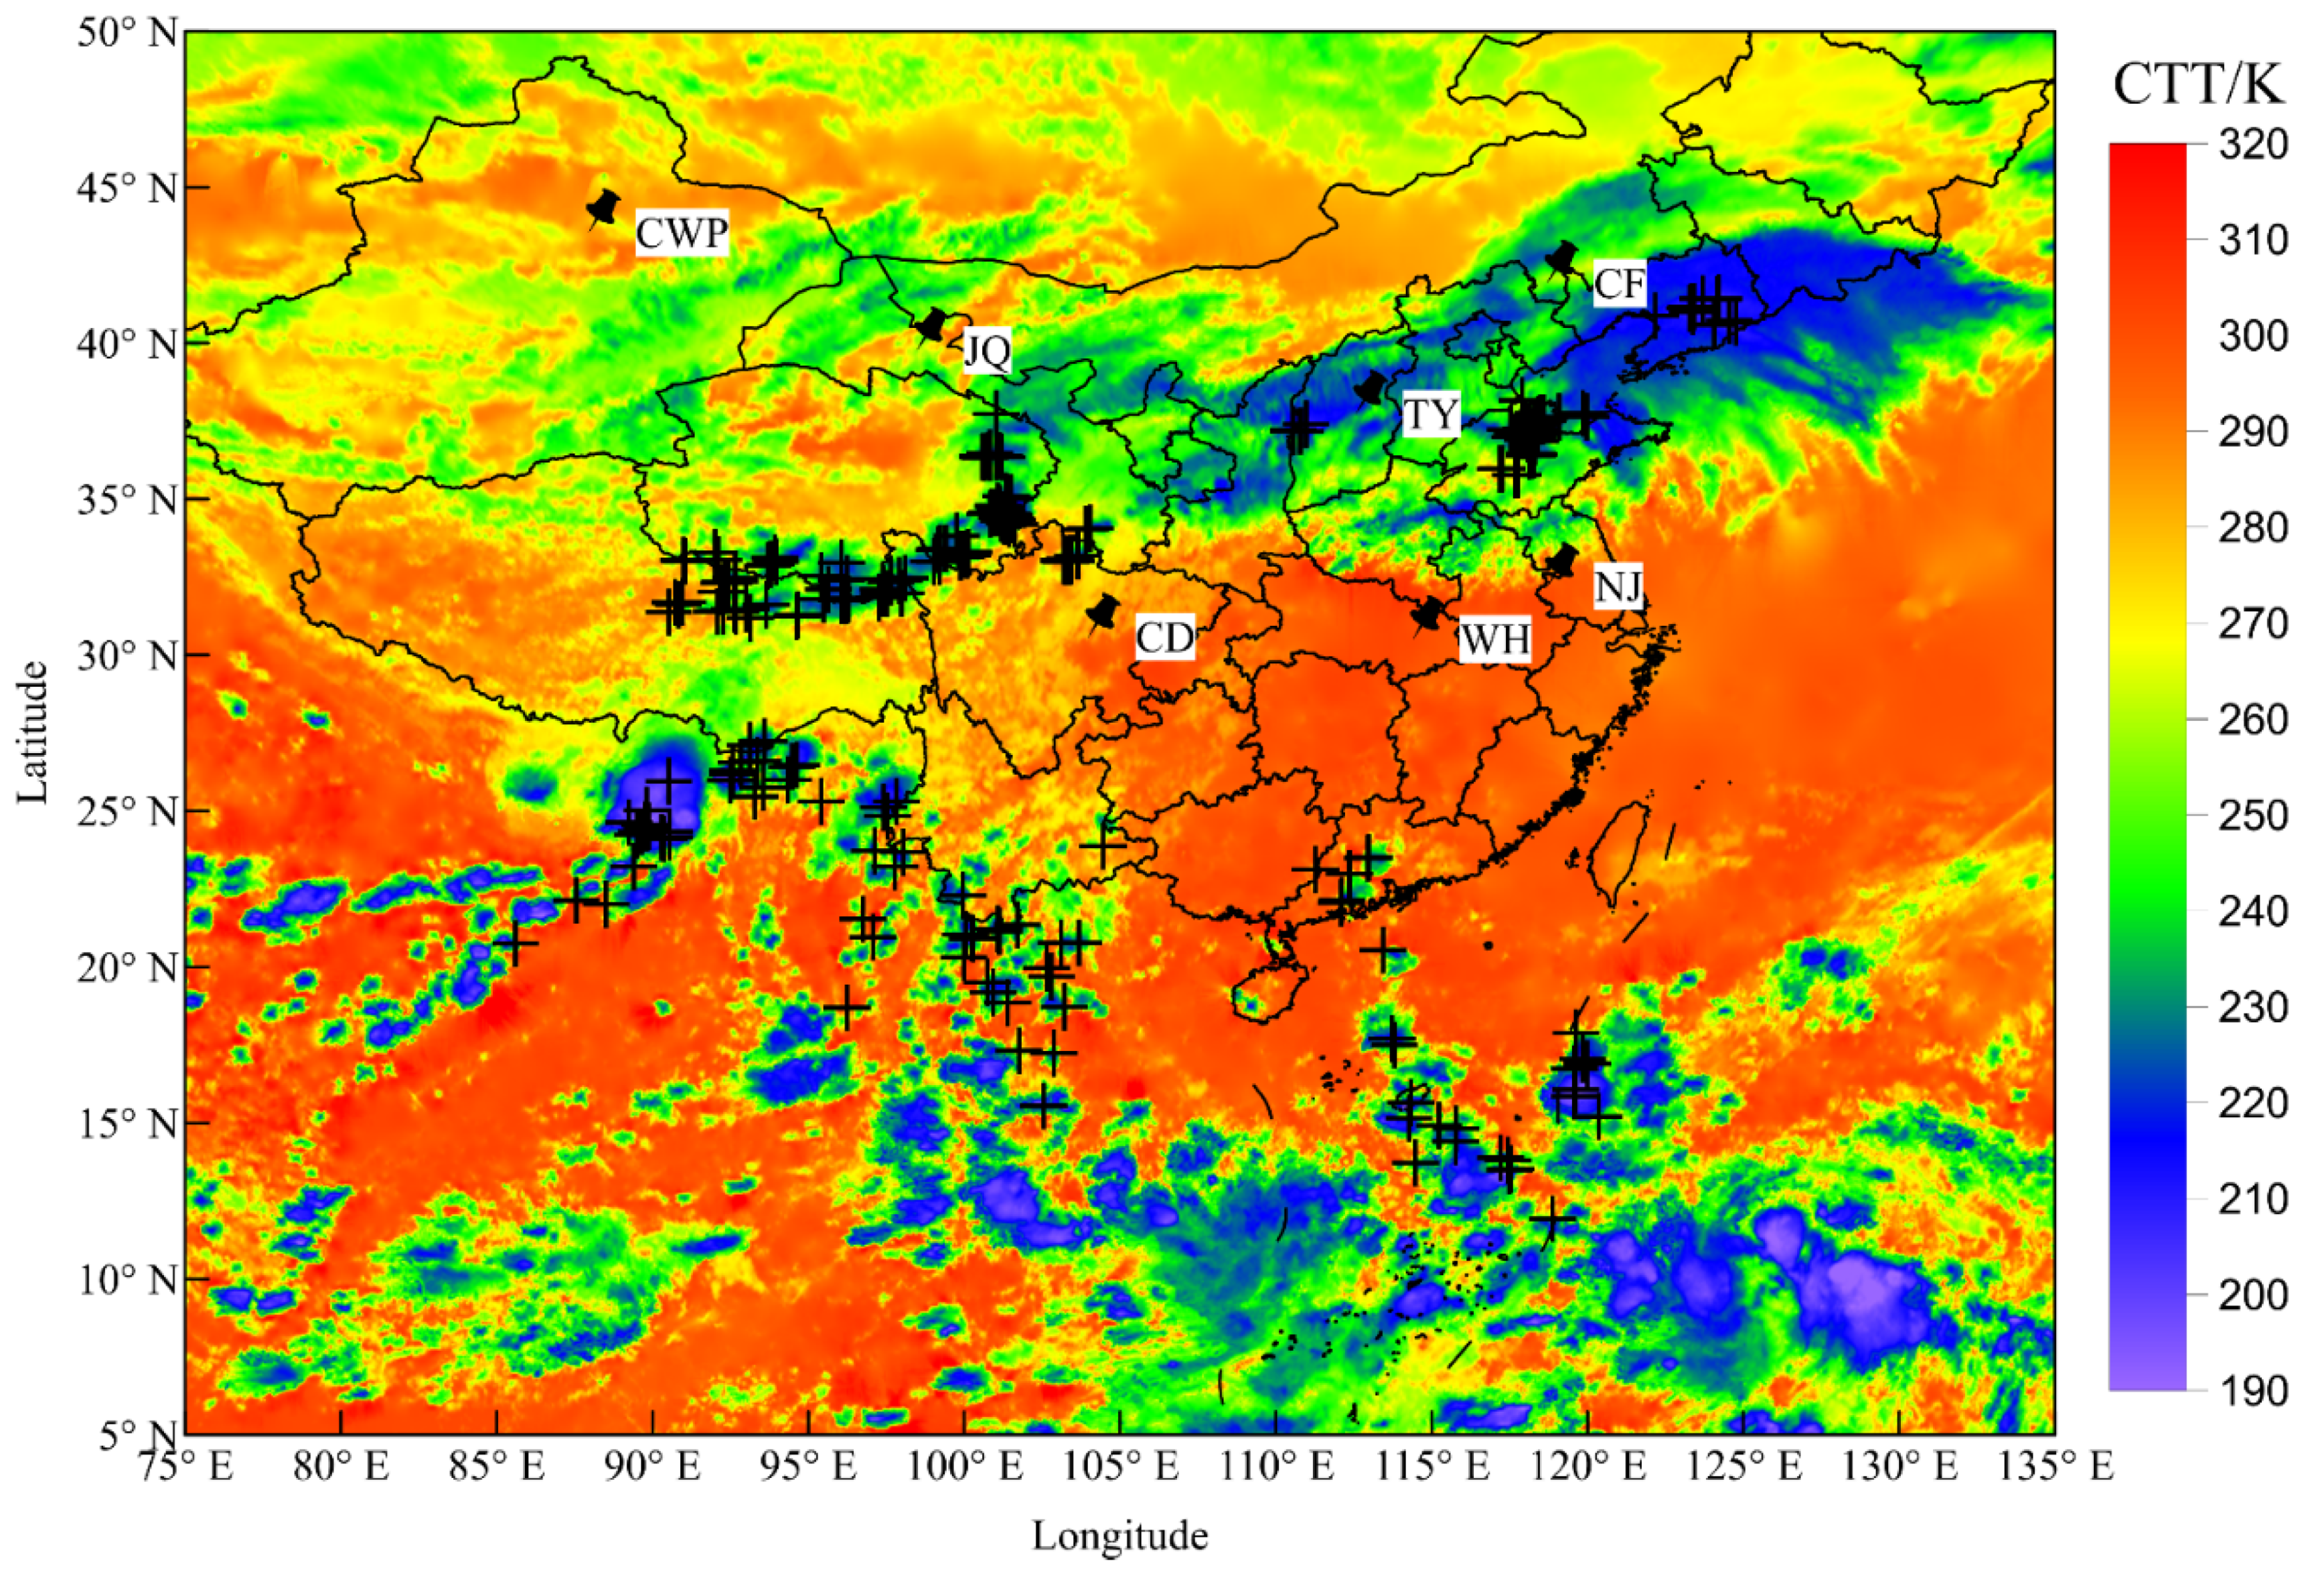
The detection range of the long-range lightning location network in China established in this paper can reach 3000 km. It has a good location result for individual thunderstorms, multicell thunderstorms, squall lines, and other thunderstorm process activities at different times inside and outside the station network. The ground wave identification method can accurately identify the ground wave peak point of the lightning signal. Waveform bank established by using typical daytime ionospheric conditions and typical nighttime ionospheric conditions can meet all-weather location requirements.
(2)
Our network’s relative detection accuracy is less than or equal to 53% calculated by the Bayesian approach. The average location error is 9.17 km, and the standard deviation is 8.04 km.
(3)
The equivalent propagation velocity method improved average location accuracy by ~1.16 km. Compared to using the speed of light, the equivalent propagation velocity method causes deviations of ~1 km and ~4 km inside and outside the network, respectively.
(4)
About 97% of the lightning sferic propagation velocity is within ±1.5% of the speed of light, and more than 96% of the lightning sferic propagation velocity is less than the speed of light. Compared to Liu et al.’s results, the distribution is more concentrated [33]. The 50th percentile of lightning velocity is 0.998 times the speed of light.
This paper does not use a separate equivalent propagation velocity for each station to reduce the amount of calculation. The terrain around the station on the equivalent propagation velocity needs to be further studied. Related research on the propagation speed of lightning sferics makes it hopeful to extract a propagation velocity widely used in long-range lightning location networks and analyze the relationship between lightning sferic propagation velocity and the ionosphere [20]. In the future, we will use the empirical wavelet transform (EWT) to process the data further and encrypt the site network to improve the positioning accuracy and the discharge parameter inversion work. The data on this network can also be used to analyze lightning activity in East Asia and Southeast Asia or to retrieve ionospheric parameters.

Author Contributions

Conceptualization, J.L. (Jie Li) and Q.Z.; data curation, B.D., J.Z. (Jiahao Zhou), Y.W., B.Z. and J.L. (Jing Li); formal analysis, J.L. (Jie Li), J.Z. (Junchao Zhang) and J.G.; funding acquisition, Q.Z. and J.Y.; investigation, J.L. (Jie Li), J.Z. (Junchao Zhang) and Q.Z.; methodology, J.L. (Jie Li), J.Z. (Junchao Zhang) and J.Y.; project administration, Q.Z.; resources, Q.Z.; software, J.L. (Jie Li), J.Z. (Junchao Zhang) and W.H.; supervision, Q.Z.; visualization, J.L. (Jie Li); writing—original draft, J.L. (Jie Li); writing—review and editing, Q.Z. and J.Y. All authors have read and agreed to the published version of the manuscript.

Funding

This research was funded by China’s National Key R&D Program under Grant 2017YFC1501505, in part by the National Natural Science Foundation of China under Grants 41775006, and Shanghai Typhoon Research Foundation TFJJ202001.

Acknowledgments

Thanks to the National Satellite Meteorological Center (NSMC) of the China Meteorological Administration for providing the FY4A-AGRI dataset and the meteorological department for the ADTD dataset. The authors thank all the personnel and meteorological departments involved in constructing the network. The authors would also like to thank the reviewers for their helpful feedback, which significantly improved the manuscript.

Conflicts of Interest

The authors declare no conflict of interest.

Abbreviations

ADActual Distance
AGRIAdvanced Geosynchronous Radiation Imager
APLLNAsia–Pacific Lightning Location Network
ADTDArrival Time Difference Thunderstorm Detection system
CDChendu
CFChifeng
CGCloud-to-Ground lightning
CTTCloud-Top Temperature
CWPCaiwopu
EIWGEarth–Ionospheric Waveguide
EWTEmpirical Wavelet Transform
FDTDFinite Difference Time Domain
FY4AFengYun 4A meteorological satellite
GPSGlobal Position System
ICIntracloud Lightning
KSKashi
LFLow Frequency
LSLasa
MDMatching Distance
NJNanjing
NSMCNational Satellite Meteorological Center
RMSRoot Mean Square
TDOATime Difference of Arrival
TOATime of Arrival
TOGATime of Group Arrival
TYTaiyuan
VLFVery Low Frequency
WGS84World Geodetic System 1984
WHWuhan
WWLLNWorld Wide Lightning Location Network
XSBNXishuangbanna
XWXuwen

References

  1. Rakov, V.A.; Uman, M.A. Lightning: Physics and Effects; Cambridge University Press: Cambidge, UK, 2003. [Google Scholar]
  2. Pessi, A.T.; Businger, S.; Cummins, K.L.; Demetriades, N.W.S.; Murphy, M.; Pifer, B. Development of a long-range lightning detection network for the Pacific: Construction, calibration, and performance. J. Atmos. Ocean. Technol. 2009, 26, 145–166. [Google Scholar] [CrossRef] [Green Version]
  3. Dowden, R.; Holzworth, R.; Rodger, C.; Lichtenberger, J.; Thomson, N.; Jacobson, A.; Lay, E.; Brundell, J.; Lyons, T.; O’Keefe, S.; et al. World-wide lightning location using VLF propagation in the Earth-ionosphere waveguide. IEEE Antennas Propag. Mag. 2008, 50, 40–60. [Google Scholar] [CrossRef] [Green Version]
  4. Chronis, T.; Anagnostou, E. Evaluation of a long-range lightning detection network with receivers in Europe and Africa. IEEE Trans. Geosci. Remote Sens. 2006, 44, 1504–1510. [Google Scholar] [CrossRef]
  5. Nash, J.; Atkinson, N.C.; Hibbett, E.; Callaghan, G.; Taylor, P.L.; Odhams, P.; Jenkins, D.; Keogh, S.; Gaffard, C.; Walker, E. The new Met Office ATDNET lightning detection system. In Proceedings of the WMO Technical Conference on Instruments and Observing Methods, Geneva, Switzerland, 4–6 December 2006; Volume 94. [Google Scholar]
  6. Wang, J.; Ma, Q.; Zhou, X.; Xiao, F.; Yuan, S.; Chang, S.; He, J.; Wang, H.; Huang, Q. Asia-Pacific Lightning Location Network (APLLN) and Preliminary Performance Assessment. Remote Sens. 2020, 12, 1537. [Google Scholar] [CrossRef]
  7. Wang, Y.; Min, Y.; Liu, Y.; Zhao, G. A New Approach of 3D Lightning Location Based on Pearson Correlation Combined with Empirical Mode Decomposition. Remote Sens. 2021, 13, 3883. [Google Scholar] [CrossRef]
  8. Srivastava, A.; Tian, Y.; Qie, X.; Wang, D.; Sun, Z.; Yuan, S.; Wang, Y.; Chen, Z.; Xu, W.; Zhang, H.; et al. Performance assessment of Beijing Lightning Network (BLNET) and comparison with other lightning location networks across Beijing. Atmos. Res. 2017, 197, 76–83. [Google Scholar] [CrossRef]
  9. Mazur, V.; Williams, E.; Boldi, R.; Maier, L.; Proctor, D.E. Initial comparison of lightning mapping with operational time-of-arrival and interferometric systems. J. Geophys. Res. Space Phys. 1997, 102, 11071–11085. [Google Scholar] [CrossRef]
  10. Zhang, G.; Wang, Y.; Qie, X.; Zhang, T.; Zhao, Y.; Li, Y.; Cao, D. Using lightning locating system based on time-of-arrival technique to study three-dimensional lightning discharge processes. Sci. China Earth Sci. 2010, 53, 591–602. [Google Scholar] [CrossRef]
  11. Shi, D.; Zheng, D.; Zhang, Y.; Zhang, Y.; Huang, Z.; Lu, W.; Chen, S.; Yan, X. Low-frequency E-field Detection Array (LFEDA)—Construction and preliminary results. Sci. China Earth Sci. 2017, 60, 1896–1908. [Google Scholar] [CrossRef]
  12. Sun, Z.; Qie, X.; Liu, M.; Cao, D.; Wang, D. Lightning VHF radiation location system based on short-baseline TDOA technique—Validation in rocket-triggered lightning. Atmos. Res. 2012, 129-130, 58–66. [Google Scholar] [CrossRef]
  13. Cummins, K.; Murphy, M.J.; Bardo, E.A.; Hiscox, W.L.; Pyle, R.B.; Pifer, A.E. A Combined TOA/MDF Technology Upgrade of the U.S. National Lightning Detection Network. J. Geophys. Res. Space Phys. 1998, 103, 9035–9044. [Google Scholar] [CrossRef]
  14. Dowden, R.L.; Brundell, J.; Rodger, C. VLF lightning location by time of group arrival (TOGA) at multiple sites. J. Atmos. Solar-Terr. Phys. 2002, 64, 817–830. [Google Scholar] [CrossRef]
  15. Poelman, D.R.; Honoré, F.; Anderson, G.; Pedeboy, S. Comparing a Regional, Subcontinental, and Long-Range Lightning Location System over the Benelux and France. J. Atmos. Ocean. Technol. 2013, 30, 2394–2405. [Google Scholar] [CrossRef] [Green Version]
  16. Cooray, V. Effects of propagation on the return stroke radiation fields. Radio Sci. 1987, 22, 757–768. [Google Scholar] [CrossRef]
  17. Honma, N.; Suzuki, F.; Miyake, Y.; Ishii, M.; Hidayat, S. Propagation effect on field waveforms in relation to time-of-arrival technique in lightning location. J. Geophys. Res. Space Phys. 1998, 103, 14141–14145. [Google Scholar] [CrossRef]
  18. Cooray, V.; Ming, Y. Propagation effects on the lightning-generated electromagnetic fields for homogeneous and mixed sea-land paths. J. Geophys. Res. Space Phys. 1994, 99, 10641–10652. [Google Scholar] [CrossRef]
  19. Cooray, V.; Fernando, M.; Sörensen, T.; Götschl, T.; Pedersen, A. Propagation of lightning generated transient electromagnetic fields over finitely conducting ground. J. Atmos. Solar-Terr. Phys. 2000, 62, 583–600. [Google Scholar] [CrossRef]
  20. Barr, R.; Jones, D.L.; Rodger, C.J. ELF and VLF radio waves. J. Atmos. Sol.-Terr. Phys. 2000, 62, 1689–1718. [Google Scholar] [CrossRef]
  21. Cummins, K.L. On the effect of land: Sea and other earth surface discontinuities in LLS-Inferred lightning parameters. In Proceedings of the VIII International Symposium on Lightning Protection, Sao Paulo, Brazil, 21–25 November 2005. [Google Scholar]
  22. Cooray, V. Propagation effects due to finitely conducting ground on lightning-generated magnetic fields evaluated using Sommerfeld’s integrals. IEEE Trans. Electromagn. Compat. 2009, 51, 526–531. [Google Scholar] [CrossRef]
  23. Li, D.; Azadifar, M.; Rachidi, F.; Rubinstein, M.; Diendorfer, G.; Sheshyekani, K.; Zhang, Q.; Wang, Z. Analysis of lightning electromagnetic field propagation in mountainous terrain and its effects on ToA-based lightning location systems. J. Geophys. Res. Atmos. 2016, 121, 895–911. [Google Scholar] [CrossRef]
  24. Li, D.; Rubinstein, M.; Rachidi, F.; Diendorfer, G.; Schulz, W.; Lu, G. Location Accuracy Evaluation of ToA-Based Lightning Location Systems Over Mountainous Terrain. J. Geophys. Res. Atmos. 2017, 122, 11760–11775. [Google Scholar] [CrossRef] [Green Version]
  25. Zhang, Q.; Yang, J.; Jing, X.; Li, D.; Wang, Z. Propagation effect of a fractal rough ground boundary on the lightning-radiated vertical electric field. Atmos. Res. 2012, 104, 202–208. [Google Scholar] [CrossRef]
  26. Zhang, Q.; Yang, J.; Li, D.; Wang, Z. Propagation effects of a fractal rough ocean surface on the vertical electric field generated by lightning return strokes. J. Electrost. 2012, 70, 54–59. [Google Scholar] [CrossRef]
  27. Gu, J.; Zhang, Q.; Zhang, J.; Hou, W.; Yin, Q.; Huang, S. Effect of Real Terrain on the Lightning Magnetic Fields and Location Accuracy in Yunnan, China. IEEE Trans. Electromagn. Compat. 2021, 63, 1491–1500. [Google Scholar] [CrossRef]
  28. Bennett, A.J.; Gaffard, C.; Nash, J.; Callaghan, G.; Atkinson, N.C. The Effect of Modal Interference on VLF Long-Range Lightning Location Networks Using the Waveform Correlation Technique. J. Atmos. Ocean. Technol. 2011, 28, 993–1006. [Google Scholar] [CrossRef]
  29. Cummins, K.L.; Murphy, M.J.; Cramer, J.A.; Scheftic, W.; Demetriades, N.; Nag, A. Location accuracy improvements using propagation corrections: A case study of the US National Lightning Detection Network. In Proceedings of the 21st International Lightning Detection Conference, Orlando, FL, USA, 19–22 April 2010; Vaisala, Inc.: Tucson, AZ, USA, 2010; pp. 19–20. [Google Scholar]
  30. Jean, A.G.; Taylor, W.L.; Wait, J.R. VLF phase characteristics deduced from atmospheric wave forms. J. Geophys. Res. Space Phys. 1960, 65, 907–912. [Google Scholar] [CrossRef]
  31. King, R.J.; Maley, S.W.; Wait, J.R. Groundwave propagation along three-section mixed paths. In Proceedings of the Institution of Electrical Engineers; IET Digital Library: London, UK, 1966; Volume 113, pp. 747–751. [Google Scholar]
  32. Li, D.; Azadifar, M.; Rachidi, F.; Rubinstein, M.; Paolone, M.; Pavanello, D.; Metz, S.; Zhang, Q.; Wang, Z. On Lightning Electromagnetic Field Propagation Along an Irregular Terrain. IEEE Trans. Electromagn. Compat. 2015, 58, 161–171. [Google Scholar] [CrossRef]
  33. Liu, Z.; Koh, K.L.; Mezentsev, A.; Enno, S.-E.; Sugier, J.; Füllekrug, M. Variable phase propagation velocity for long-range lightning location system. Radio Sci. 2016, 51, 1806–1815. [Google Scholar] [CrossRef] [Green Version]
  34. Koshak, W.J.; Solakiewicz, R.J. TOA lightning location retrieval on spherical and oblate spheroidal earth geometries. J. Atmos. Ocean. Technol. 2001, 18, 187–199. [Google Scholar] [CrossRef]
  35. Hu, Z.X.; Zhao, W.G.; Zhu, H.P. A source location algorithm of lightning detection networks in China. Ann. Geophys. 2010, 28, 1981–1991. [Google Scholar] [CrossRef] [Green Version]
  36. Cummer, S. An analysis of new and existing FDTD methods for isotropic cold plasma and a method for improving their accuracy. IEEE Trans. Antennas Propag. 1997, 45, 392–400. [Google Scholar] [CrossRef] [Green Version]
  37. Hou, W.; Azadifar, M.; Rubinstein, M.; Rachidi, F.; Zhang, Q. The Polarity Reversal of Lightning-Generated Sky Wave. J. Geophys. Res. Atmos. 2020, 125, e2020JD032448. [Google Scholar] [CrossRef]
  38. Hou, W.; Zhang, Q.; Zhang, J.; Wang, L.; Shen, Y. A New Approximate Method for Lightning-Radiated ELF/VLF Ground Wave Propagation over Intermediate Ranges. Int. J. Antennas Propag. 2018, 2018, 9353294. [Google Scholar] [CrossRef] [Green Version]
  39. Bitzer, P.M.; Burchfield, J.C. Bayesian techniques to analyze and merge lightning locating system data. Geophys. Res. Lett. 2016, 43, 12605–12613. [Google Scholar] [CrossRef]
Figure 1. The distribution of stations in the long-range lightning location network.
Remotesensing 14 00560 g001
Figure 2. The lightning sferic waveforms of a seven-station synchronization collected by the network.
Remotesensing 14 00560 g002
Figure 3. The daytime and nighttime ionospheric electron density profile used by the FDTD model.
Remotesensing 14 00560 g003
Figure 4. The normalized waveforms bank at different distances simulated by FDTD under typical daytime and nighttime ionospheric conditions. Each subplot represents the simulated waveform at a different distance. (a) 100 km; (b) 500 km; (c) 1000 km; (d) 1500 km; (e) 2000 km; (f) 2500 km; (g) 3000 km.
Remotesensing 14 00560 g004
Figure 5. The ground wave identification results of synchronized data for five stations at 12:07 on 3 October 2021, Beijing time. The middle of the dotted line is the peak-seeking interval and * represents the peak point of the measured data. AD actual distance, MD matching distance. Each subplot represents data observed at various stations. (a) CD station; (b) NJ station; (c) JQ station; (d) TY station; (e) WH station.
Remotesensing 14 00560 g005
Figure 6. The ground wave identification results of synchronized data for seven stations at 00:04 on 12 October 2021, Beijing time. The middle of the dotted line is the peak-seeking and * represents the peak point of the measured data. AD actual distance, MD matching distance. Each subplot represents data observed at various stations. (a) CWP station; (b) TY station; (c) WH station; (d) NJ station; (e) CD station; (f) JQ station; (g) CF station.
Remotesensing 14 00560 g006
Figure 7. Lightning location results from 00:00 to 00:15 on 12 October 2021, Beijing time.
Remotesensing 14 00560 g007
Figure 8. Lightning location results from 17:00 to 17:15 on 3 October 2021, Beijing time.
Remotesensing 14 00560 g008
Figure 9. The lightning location results of the three methods at 17:00–17:15 on 3 October 2021, Beijing time (partial zoom).
Remotesensing 14 00560 g009
Figure 10. A multicell thunderstorm occurred in west China. The figure shows the lightning location results of our network and ADTD. Each scatter point represents a detected lightning stroke, with different colors indicating when the lightning occurred. The time in the figure is Beijing time.
Remotesensing 14 00560 g010
Figure 11. (a) Distribution of relative location accuracy. The pale blue line indicates the cumulative percentage of shared events. (b) Distribution of accuracy improvement effect using the equivalent propagation velocity method, with an average value of 1.16 km.
Remotesensing 14 00560 g011
Figure 12. Deviation between the lightning positions within the network, determined by the equivalent propagation velocity and the speed of light.
Remotesensing 14 00560 g012
Figure 13. Deviation between the lightning positions outside the network, determined by the equivalent propagation velocity and the speed of light.
Remotesensing 14 00560 g013
Figure 14. Distribution of propagation velocity.
Remotesensing 14 00560 g014
Publisher’s Note: MDPI stays neutral with regard to jurisdictional claims in published maps and institutional affiliations.

