
Feature Decomposition-Optimization-Reorganization Network for Building Change Detection in Remote Sensing Images

 , ,
, , 
Abstract
:
1. Introduction
- (1)
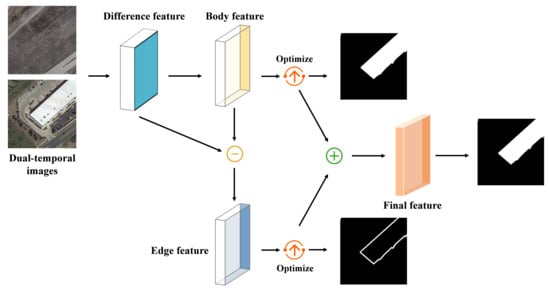
- We propose a novel framework, namely, feature decomposition-optimization-reorganization network (FDORNet) for building change detection. In our work, we model the main body and edge features of buildings separately based on the characteristics that the similarity between the main body pixels is strong but weak between the edge pixels.
- (2)
- We introduce the decoupling idea into building change detection and employ the feature optimization structure to refine the main body and edge features, which greatly improves the accuracy of the boundary detection of changed buildings.
2. Related Work
2.1. Traditional Change Detection Methods
2.1.1. Pixel-Based Methods
2.1.2. Object-Based Methods
2.2. Change Detection Methods Based on Deep Learning
3. Methods
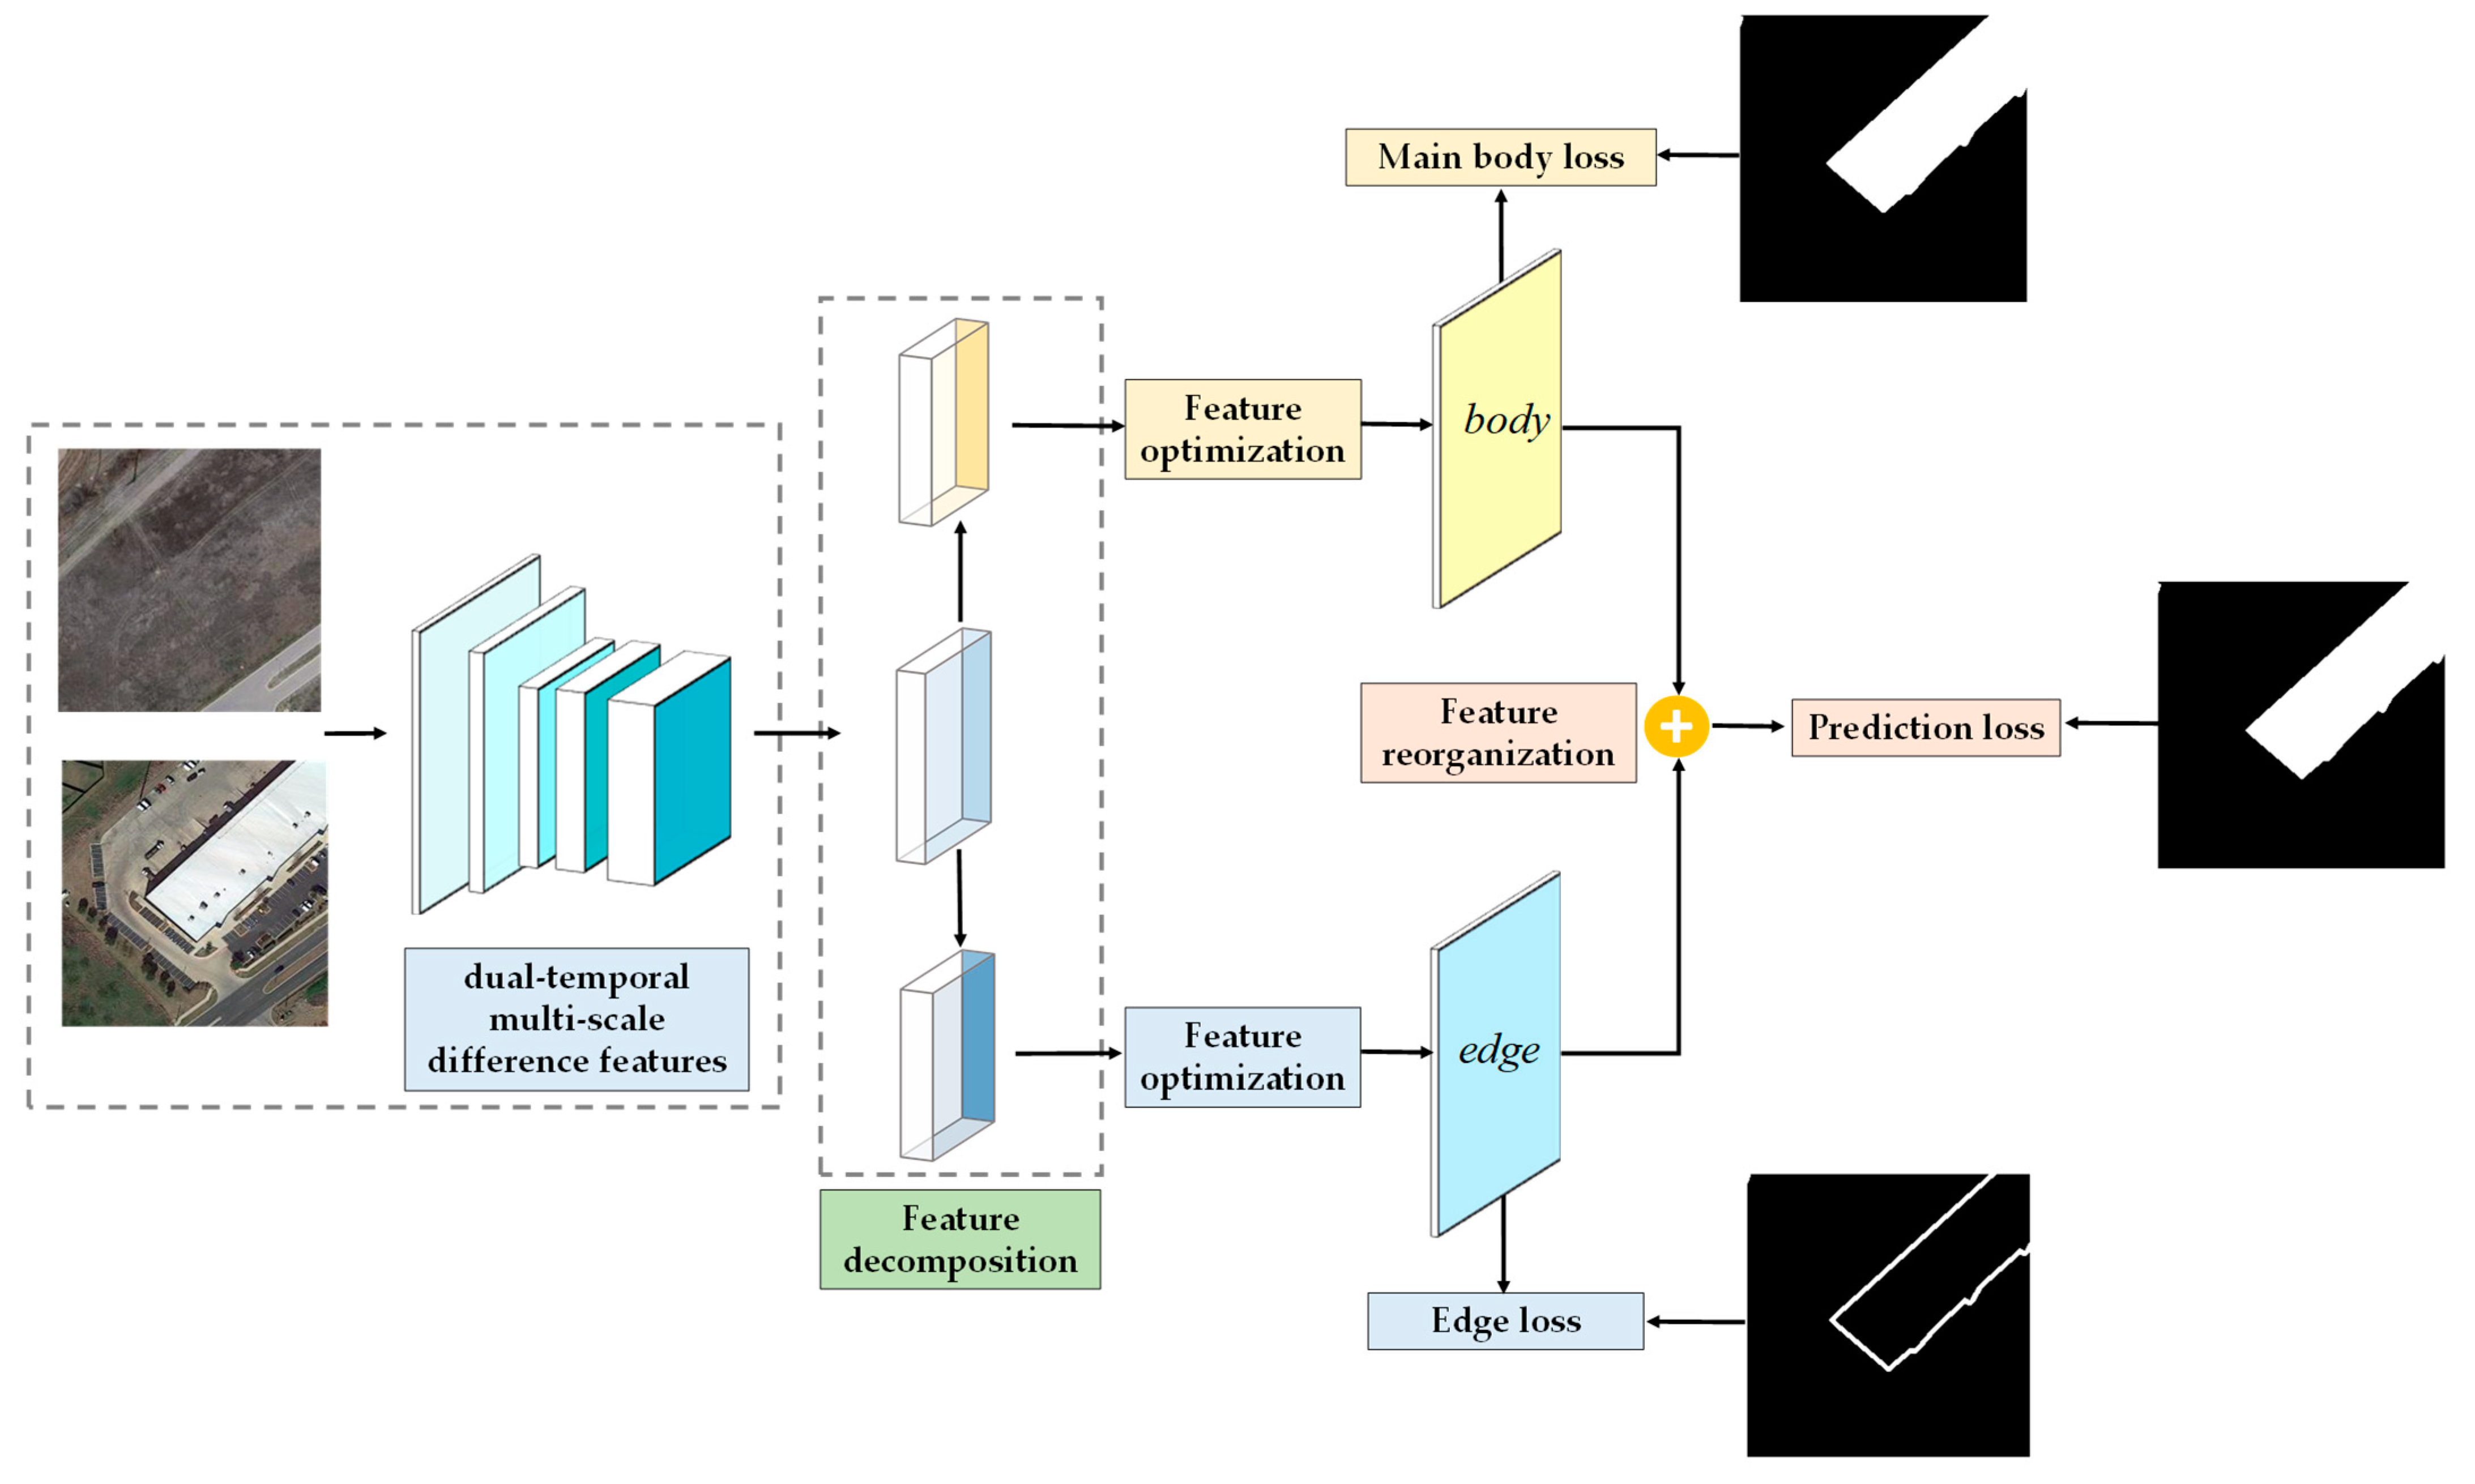
3.1. Overview
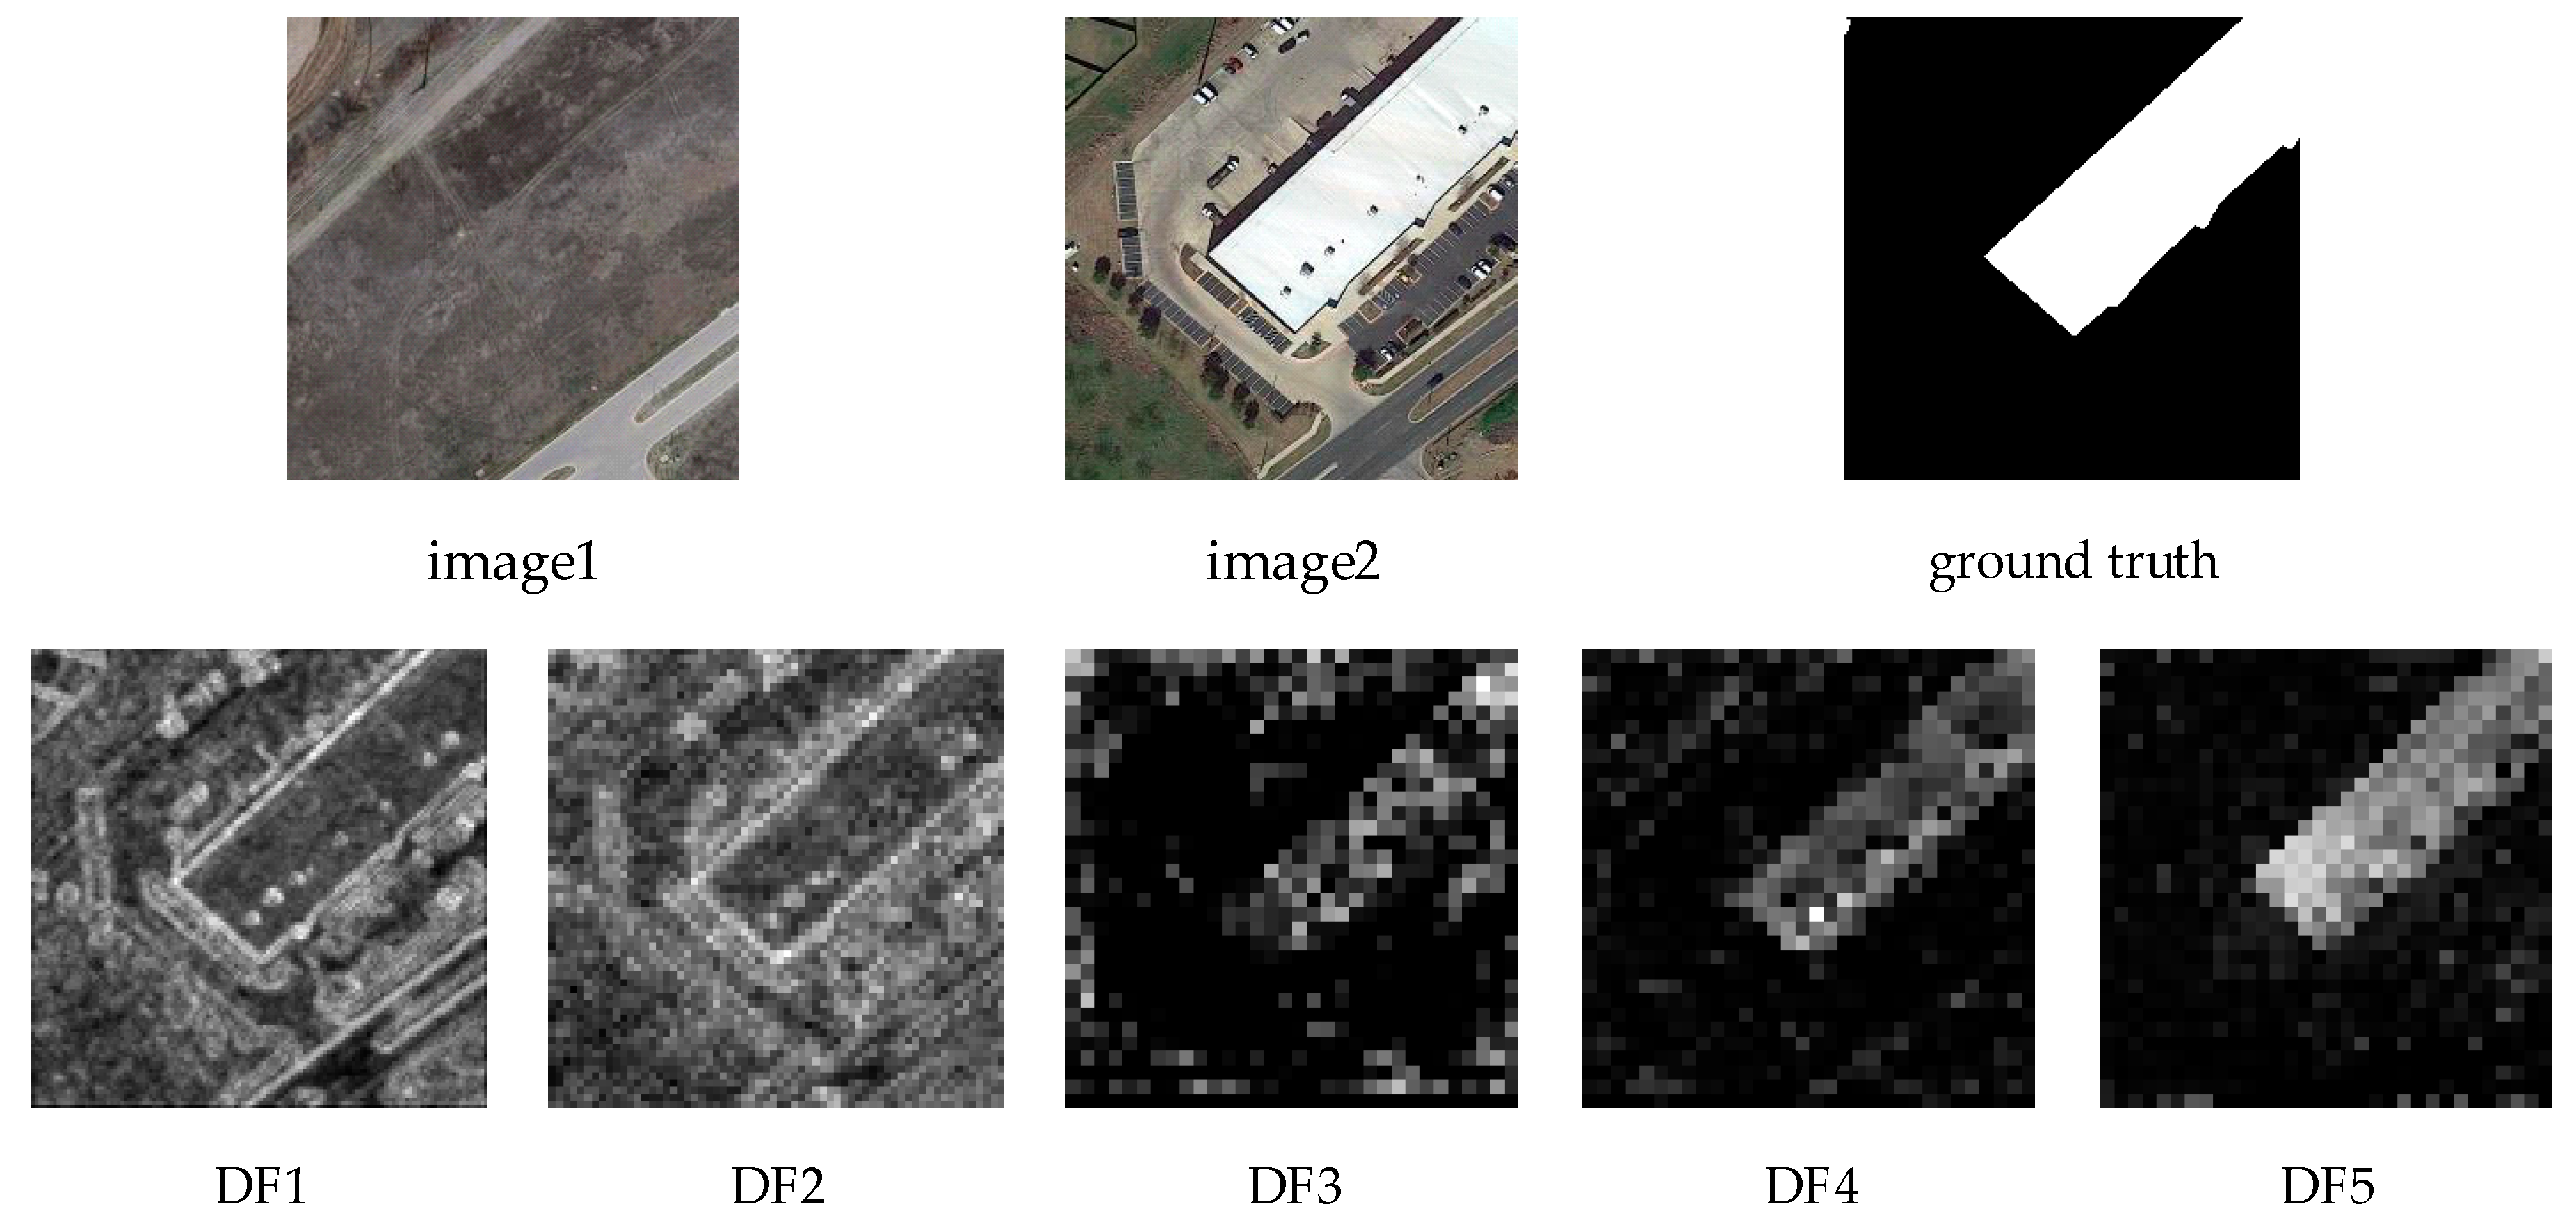
3.2. Feature Extraction
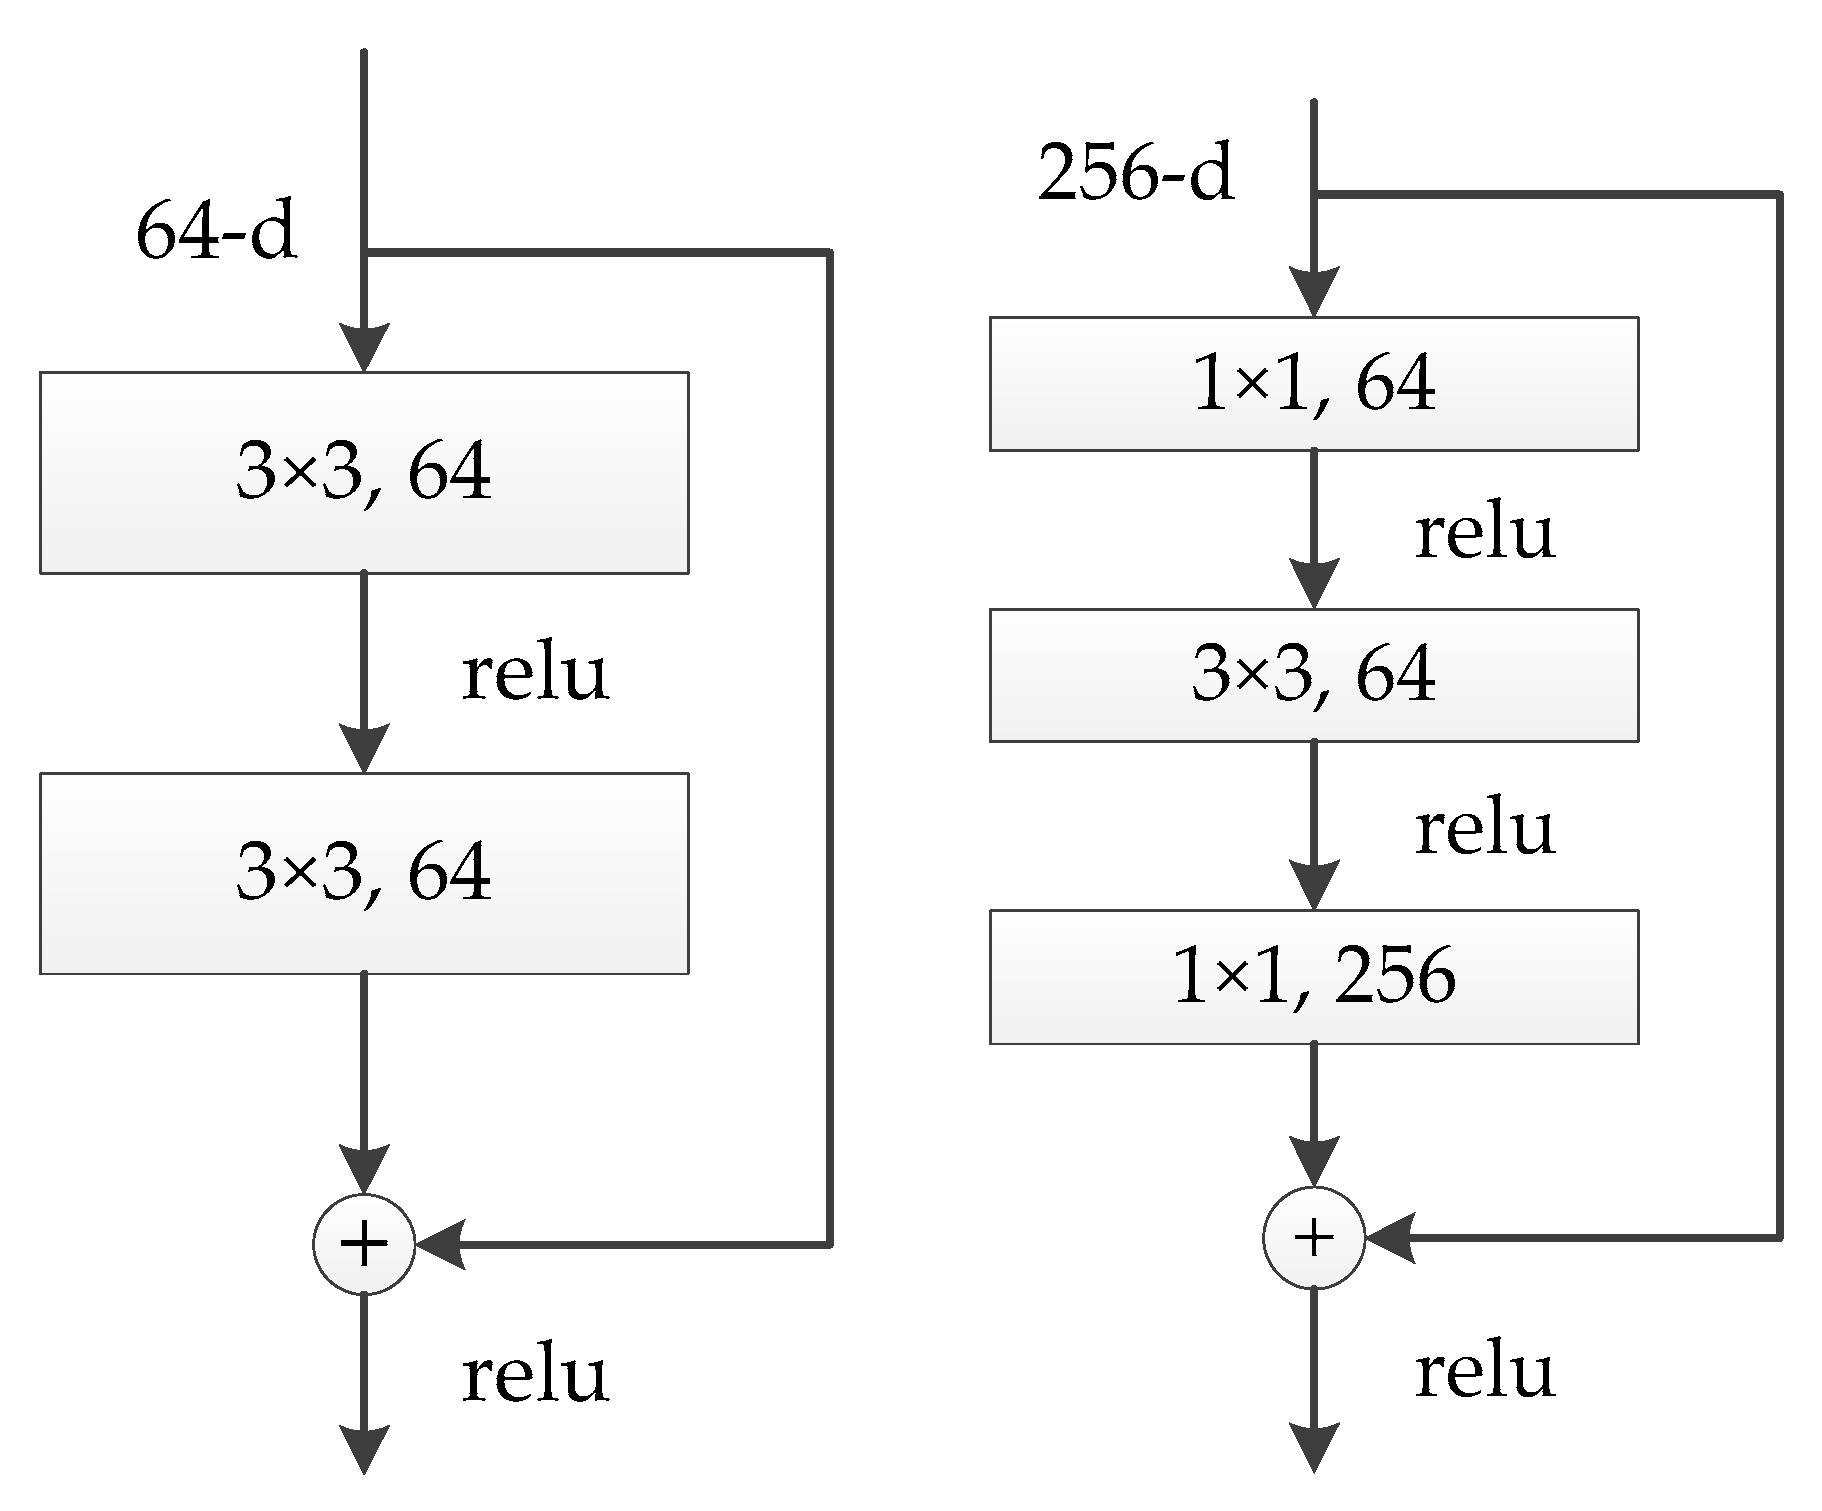
3.2.1. ResNet
3.2.2. Feature Extraction
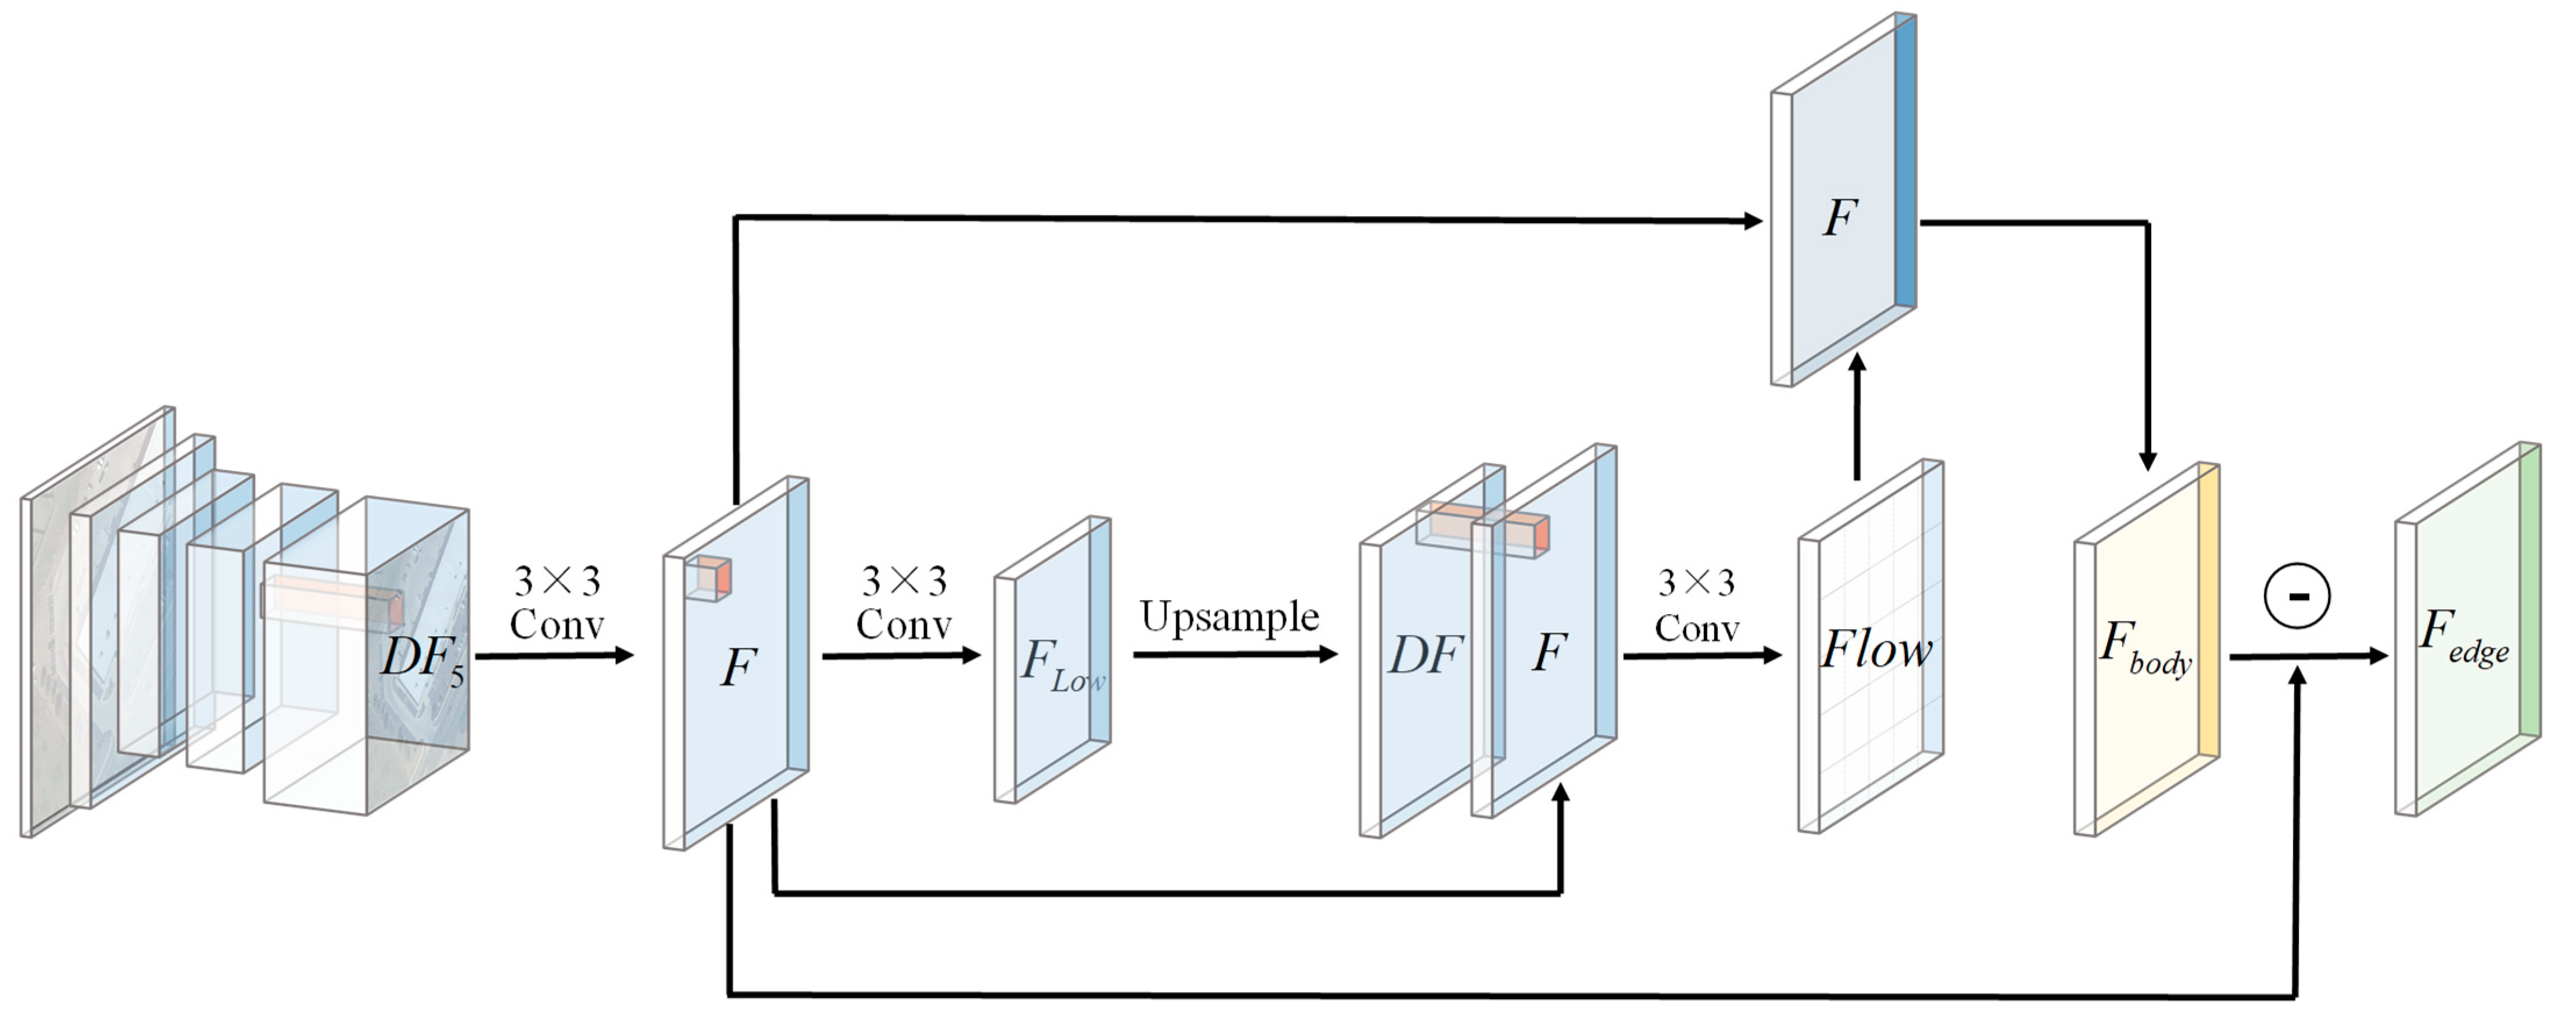
3.3. Feature Decomposition
3.3.1. Flow Field
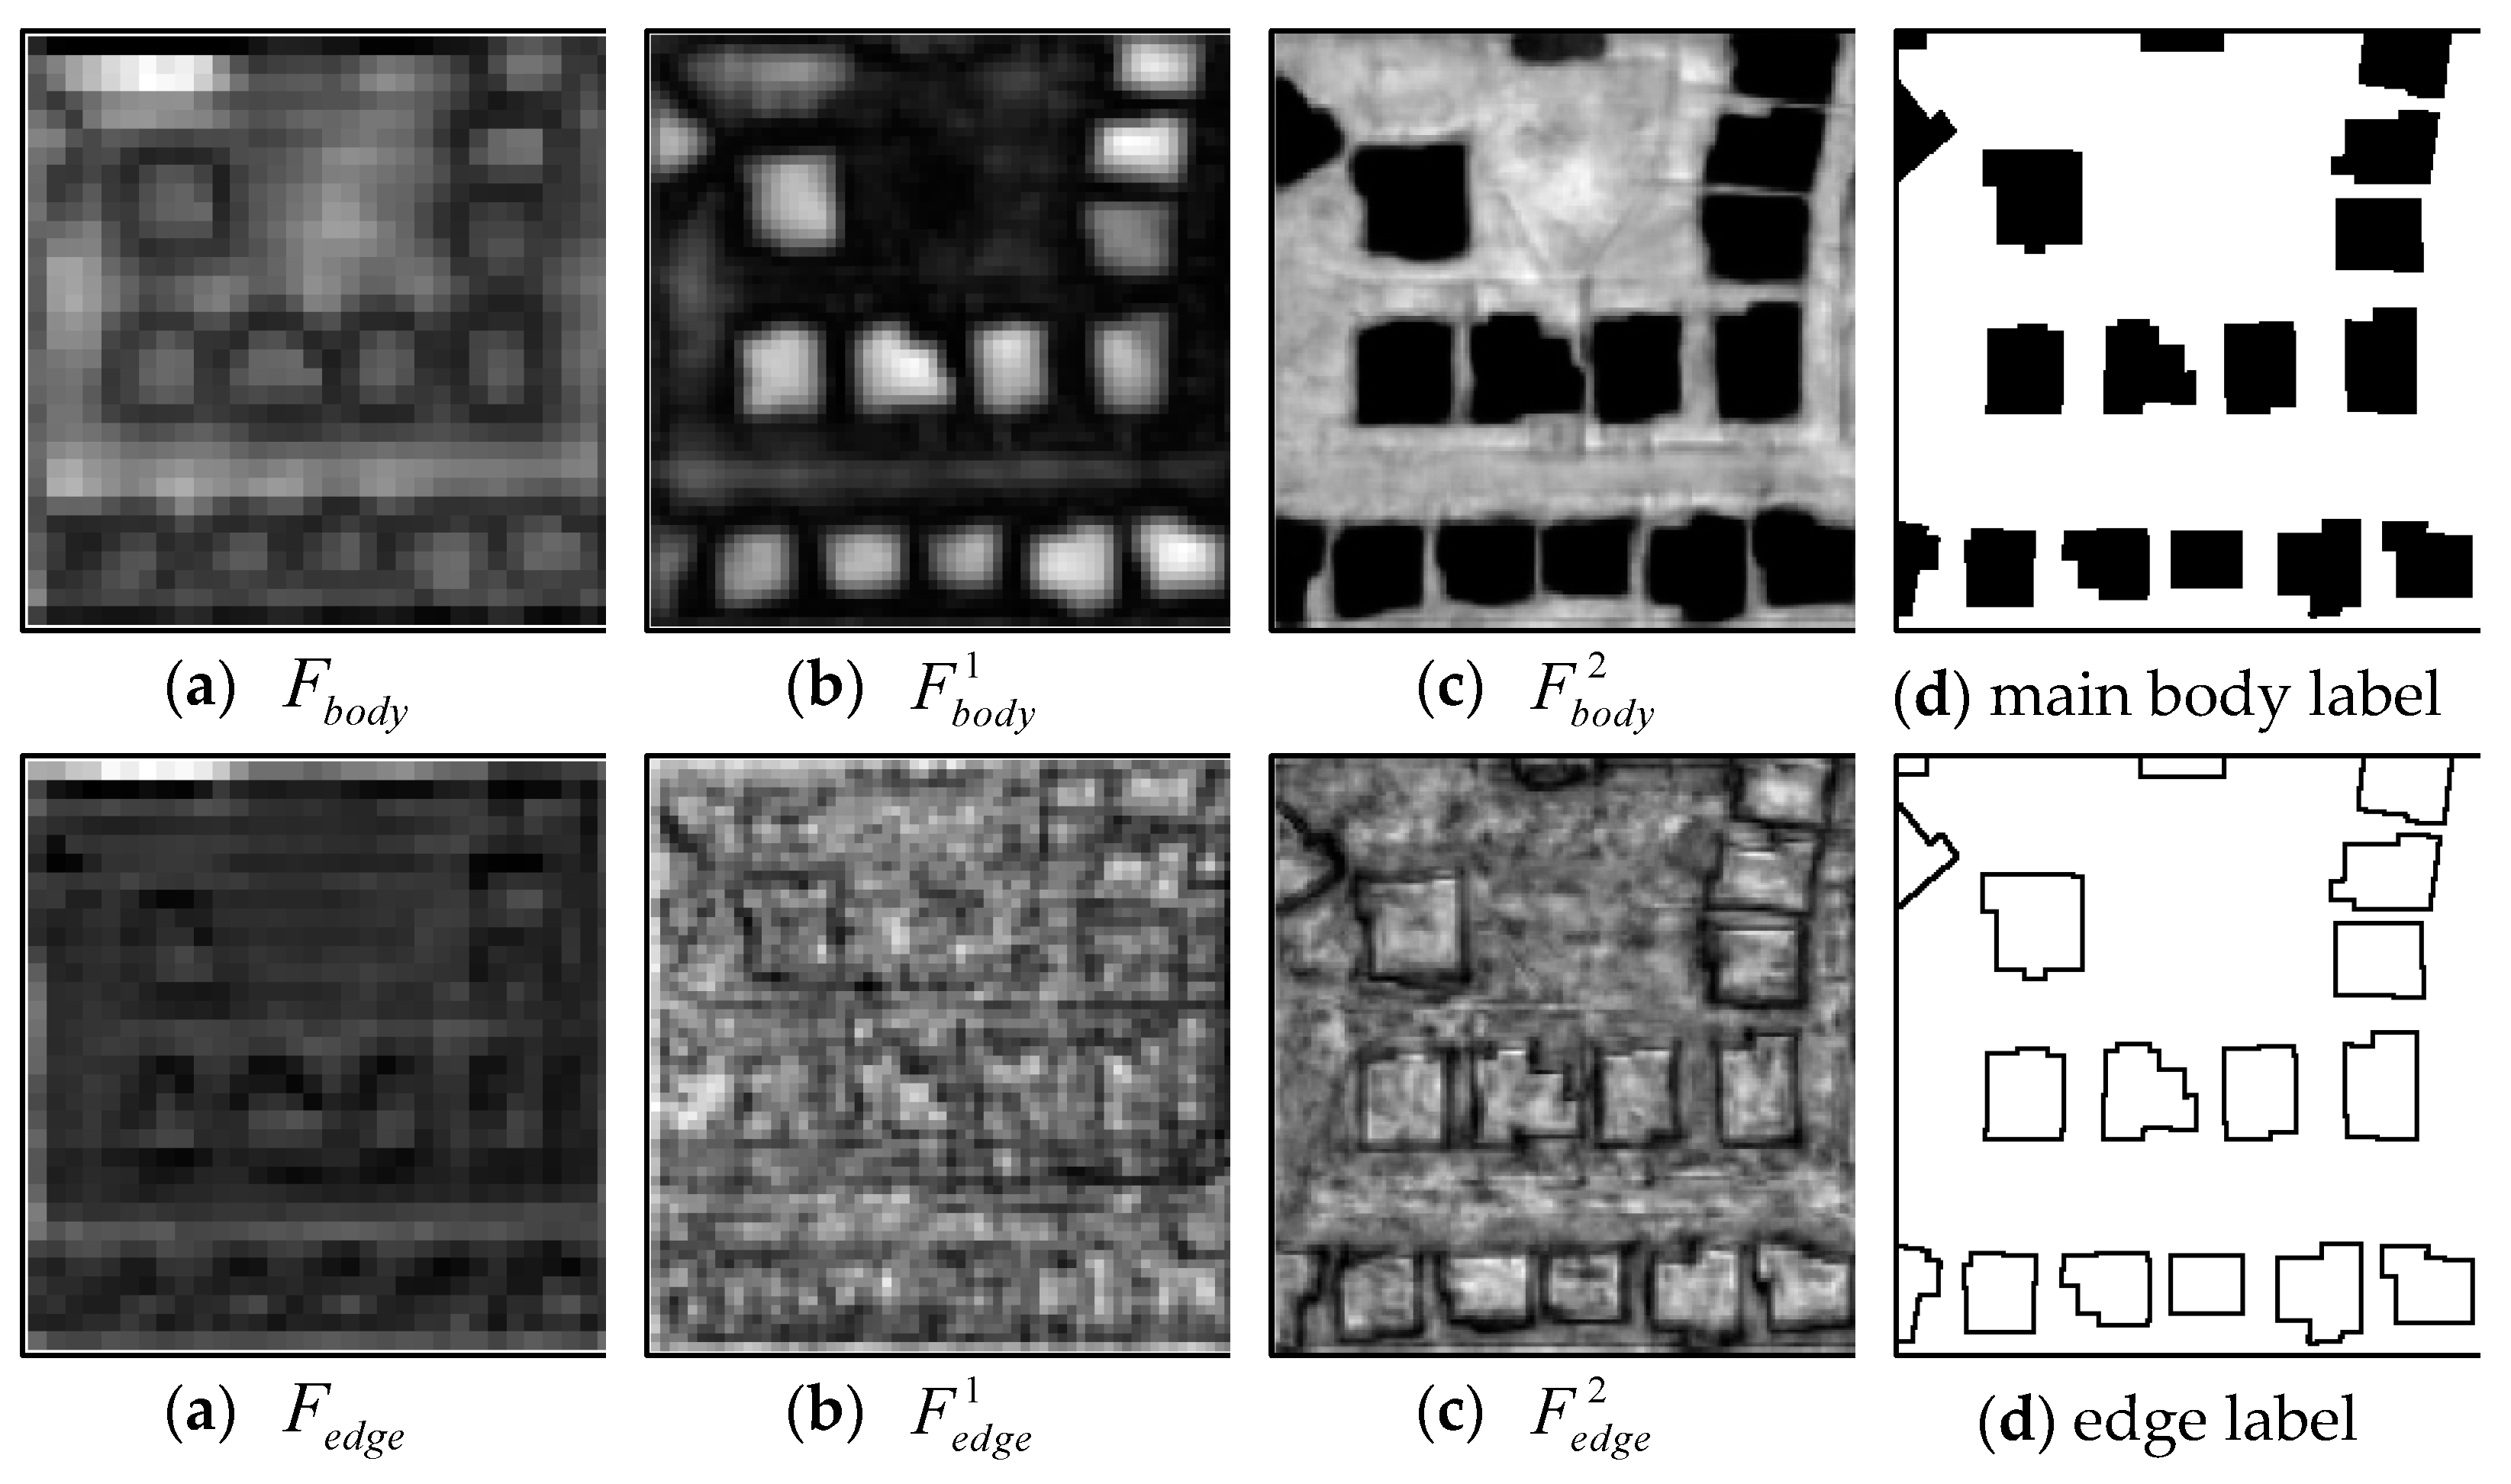
3.3.2. Main Body Features and Edge Features
3.4. Feature Optimization
3.5. Feature Reorganization
3.6. Loss Function
4. Experiments
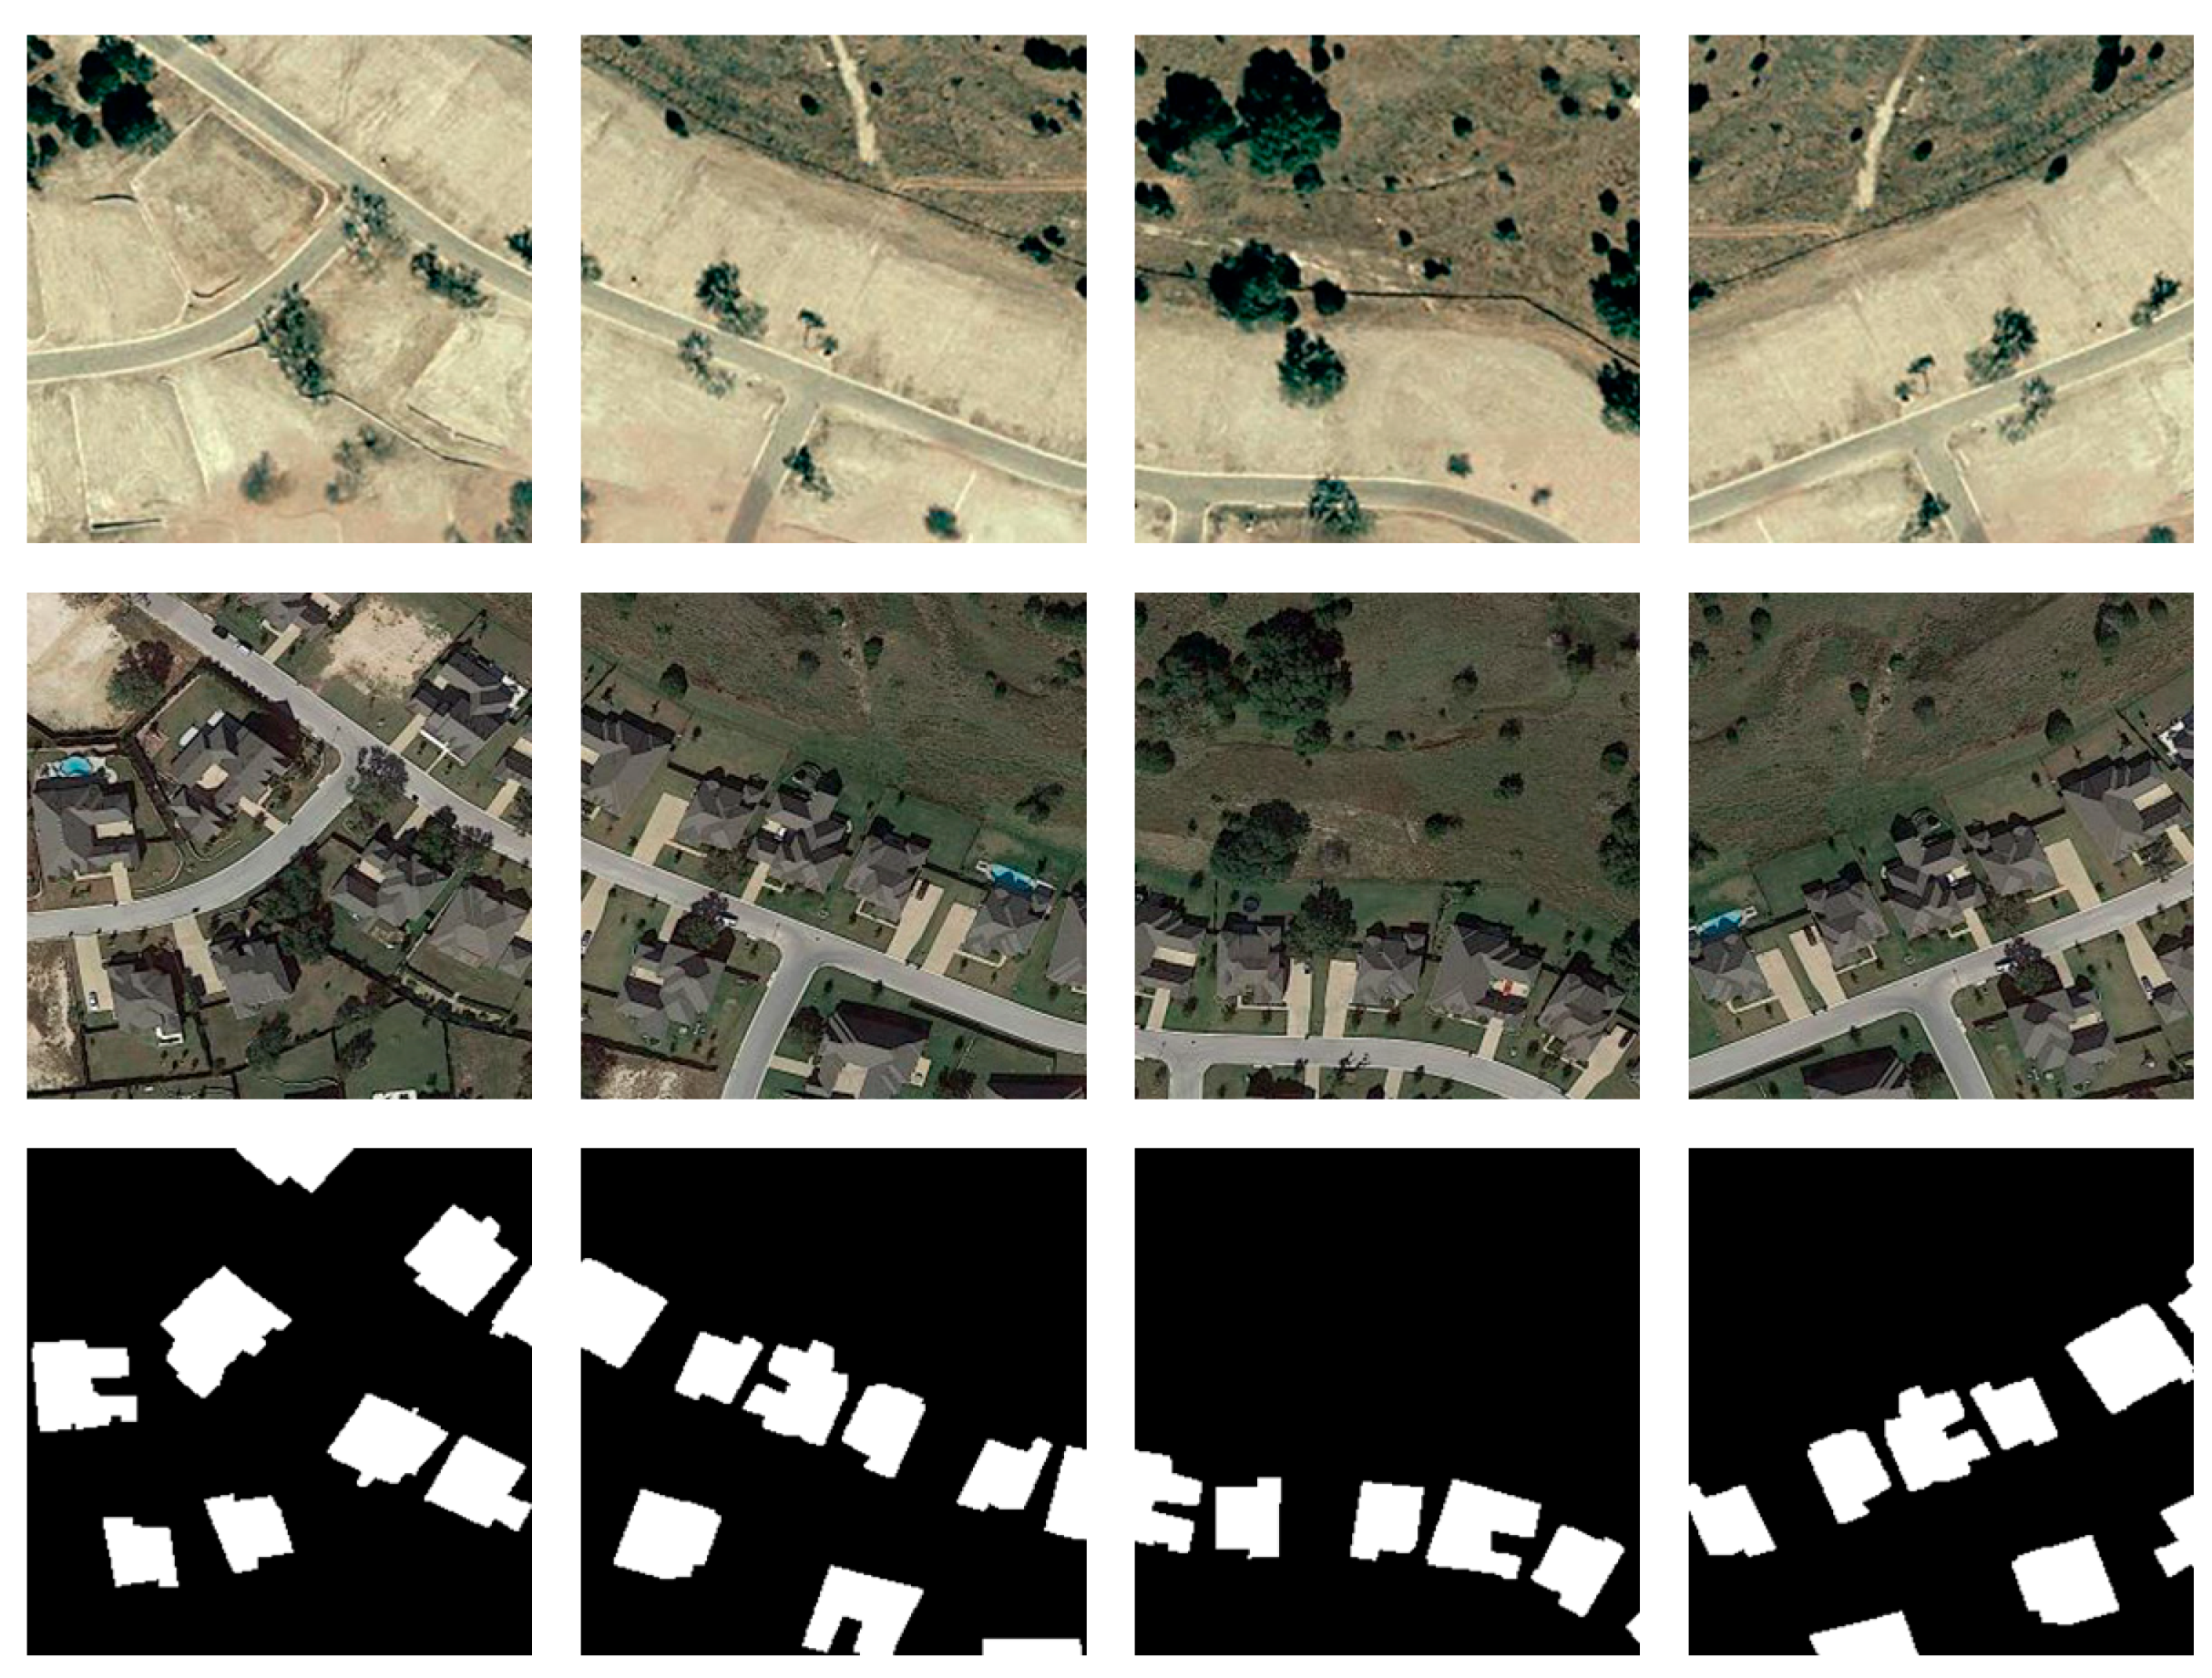
4.1. Dataset
4.2. Experimental Details
5. Results and Analysis
5.1. Quantitative Evaluation Cirteria
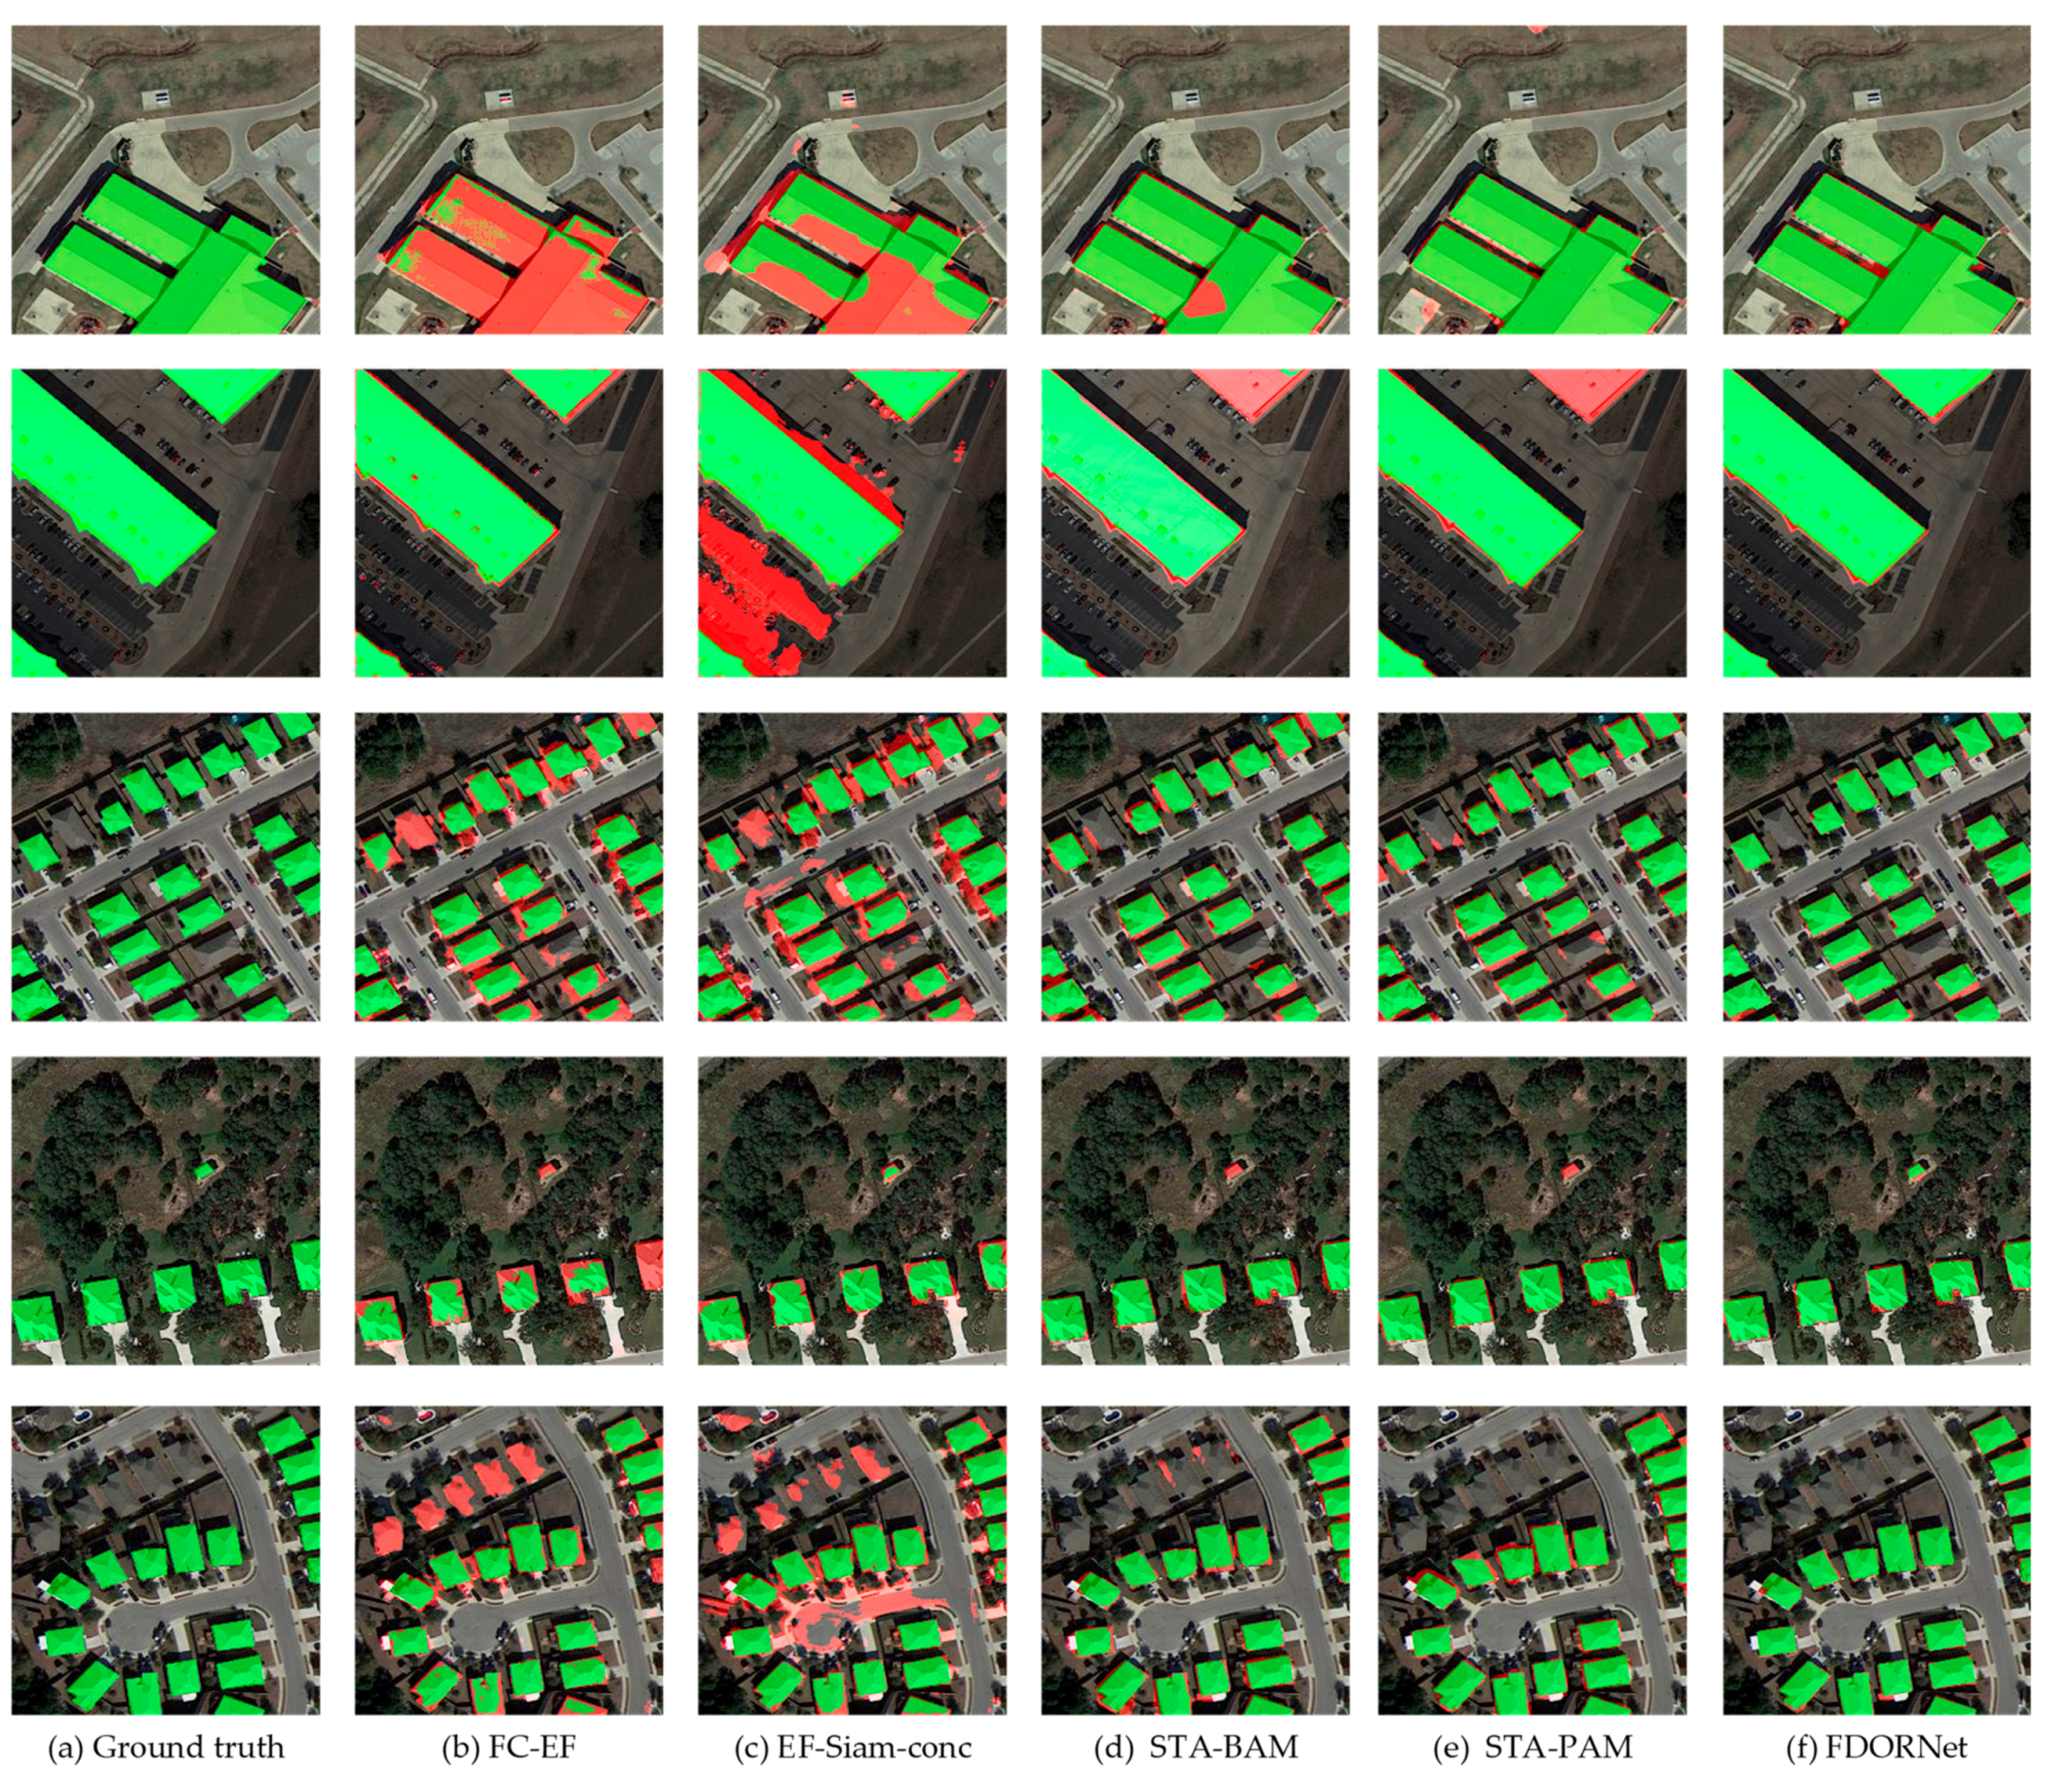
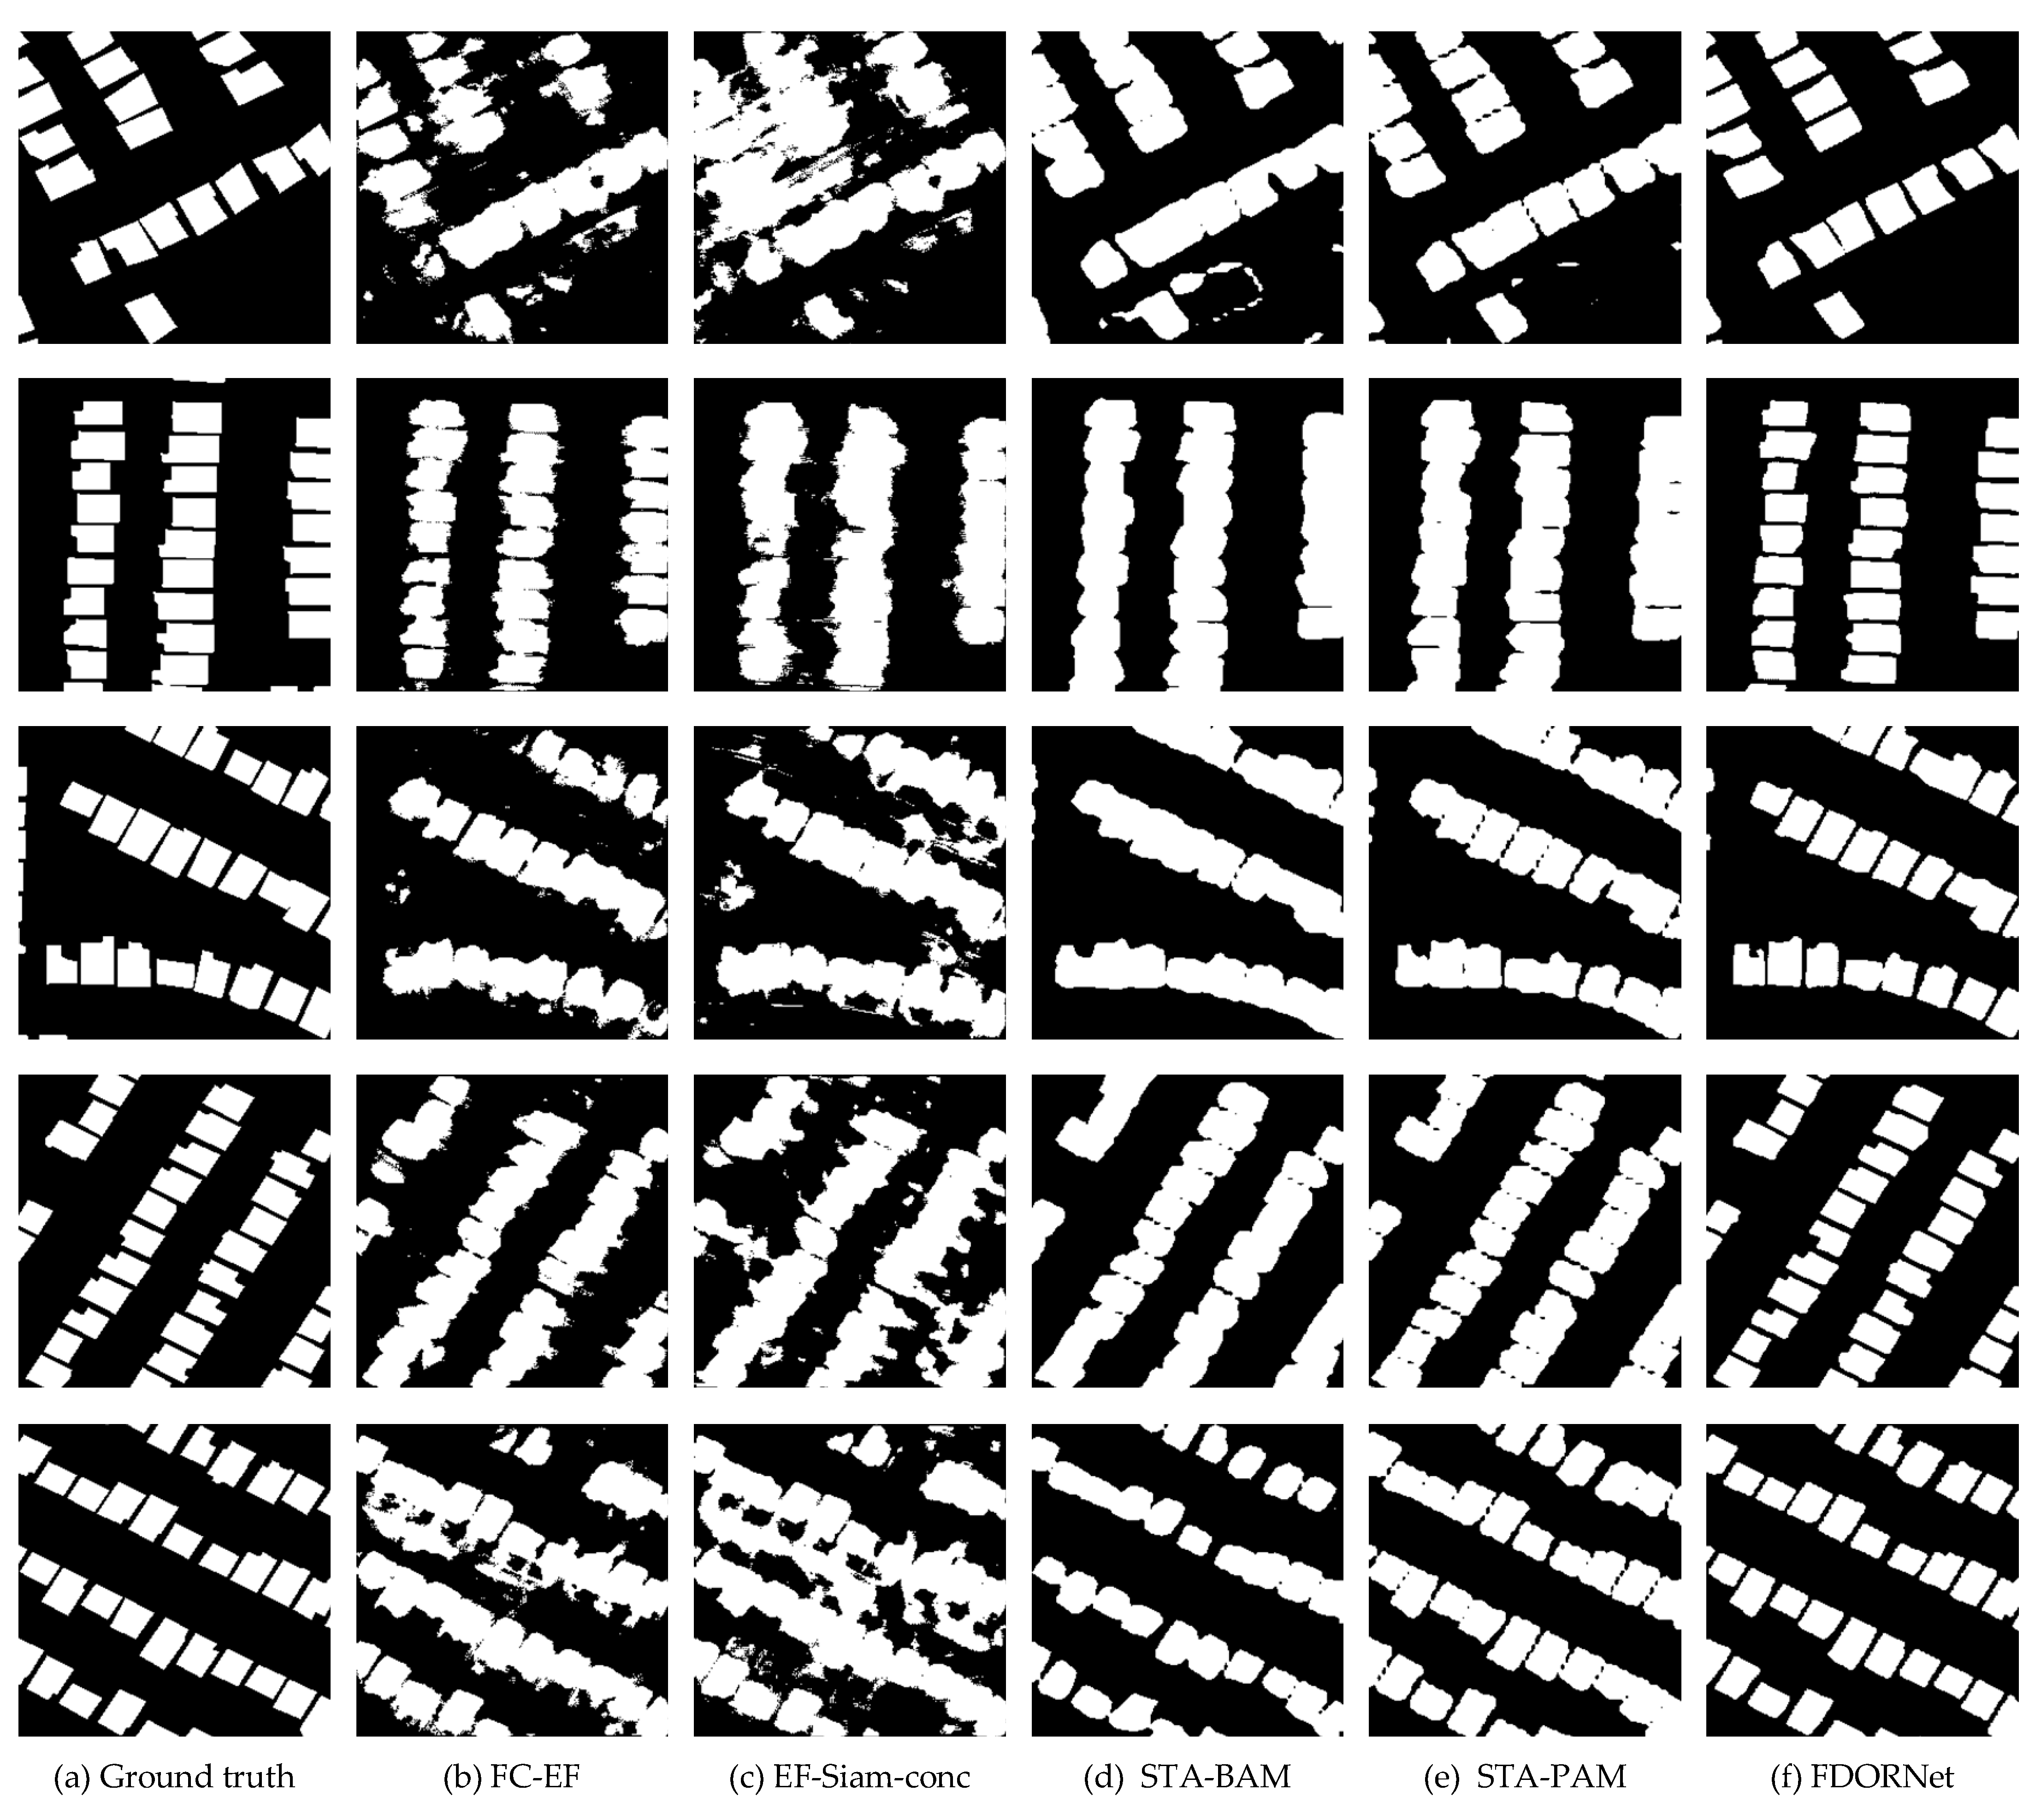
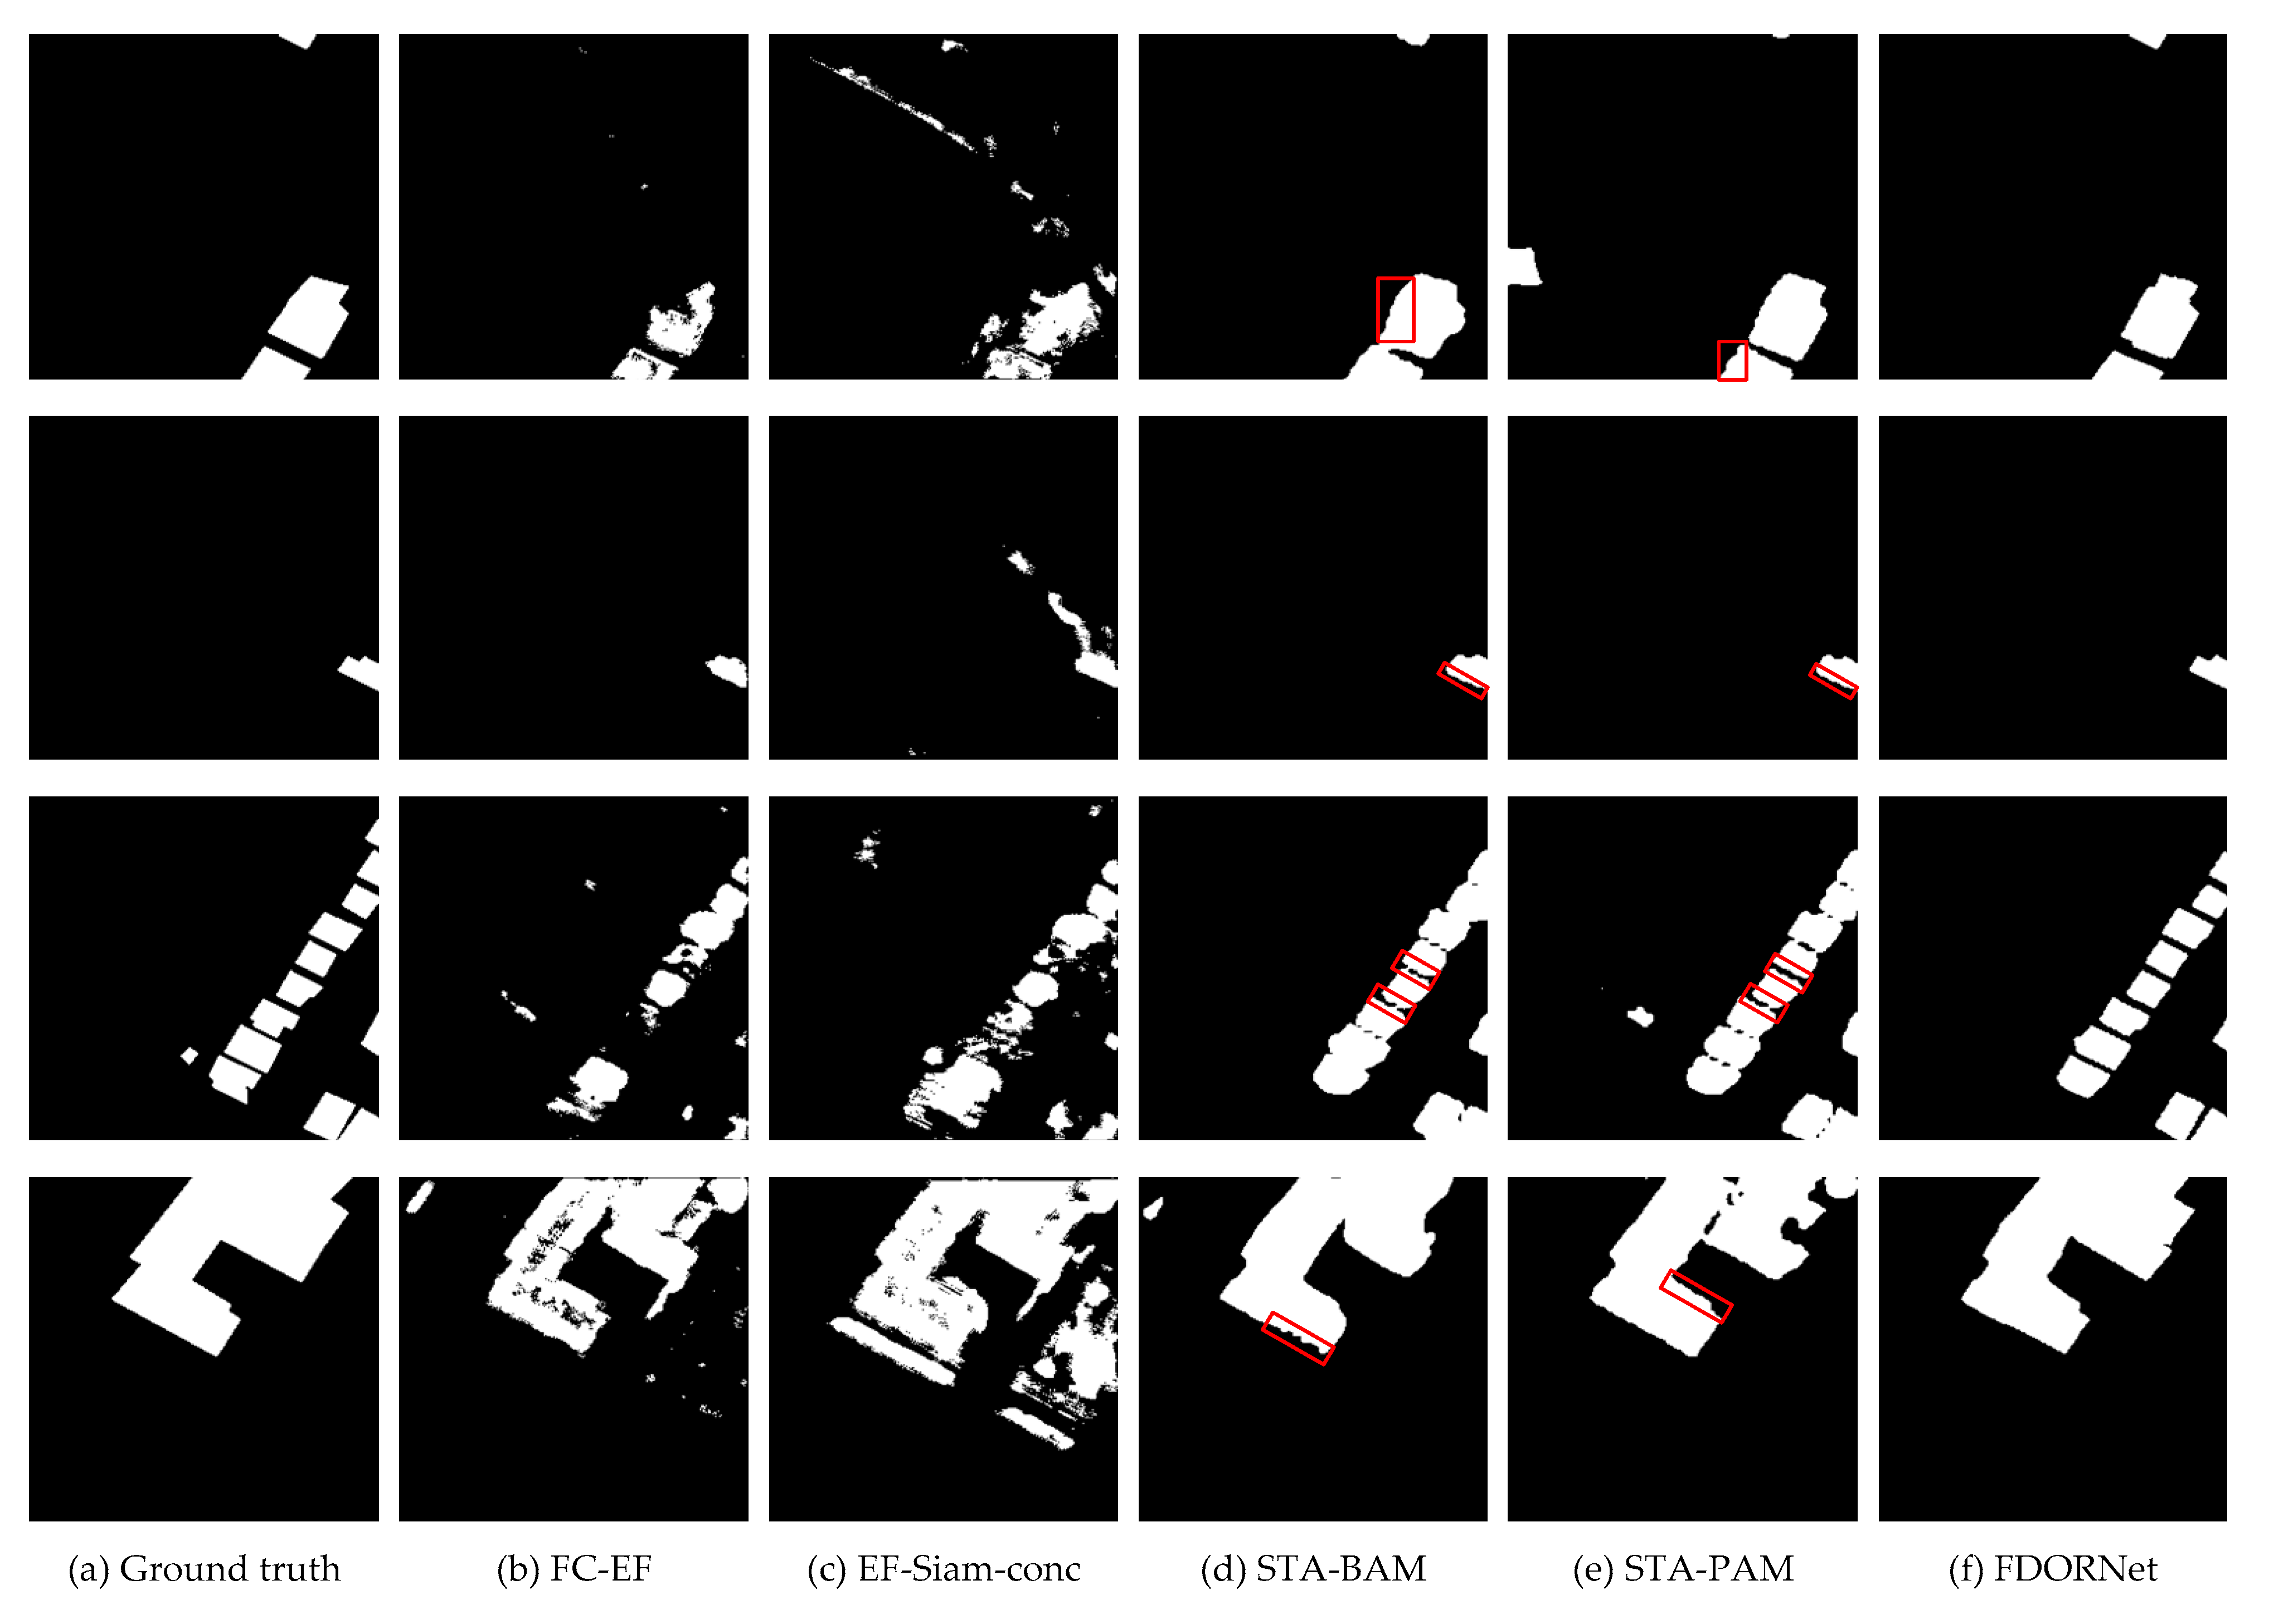
5.2. Comparison between Different Methods
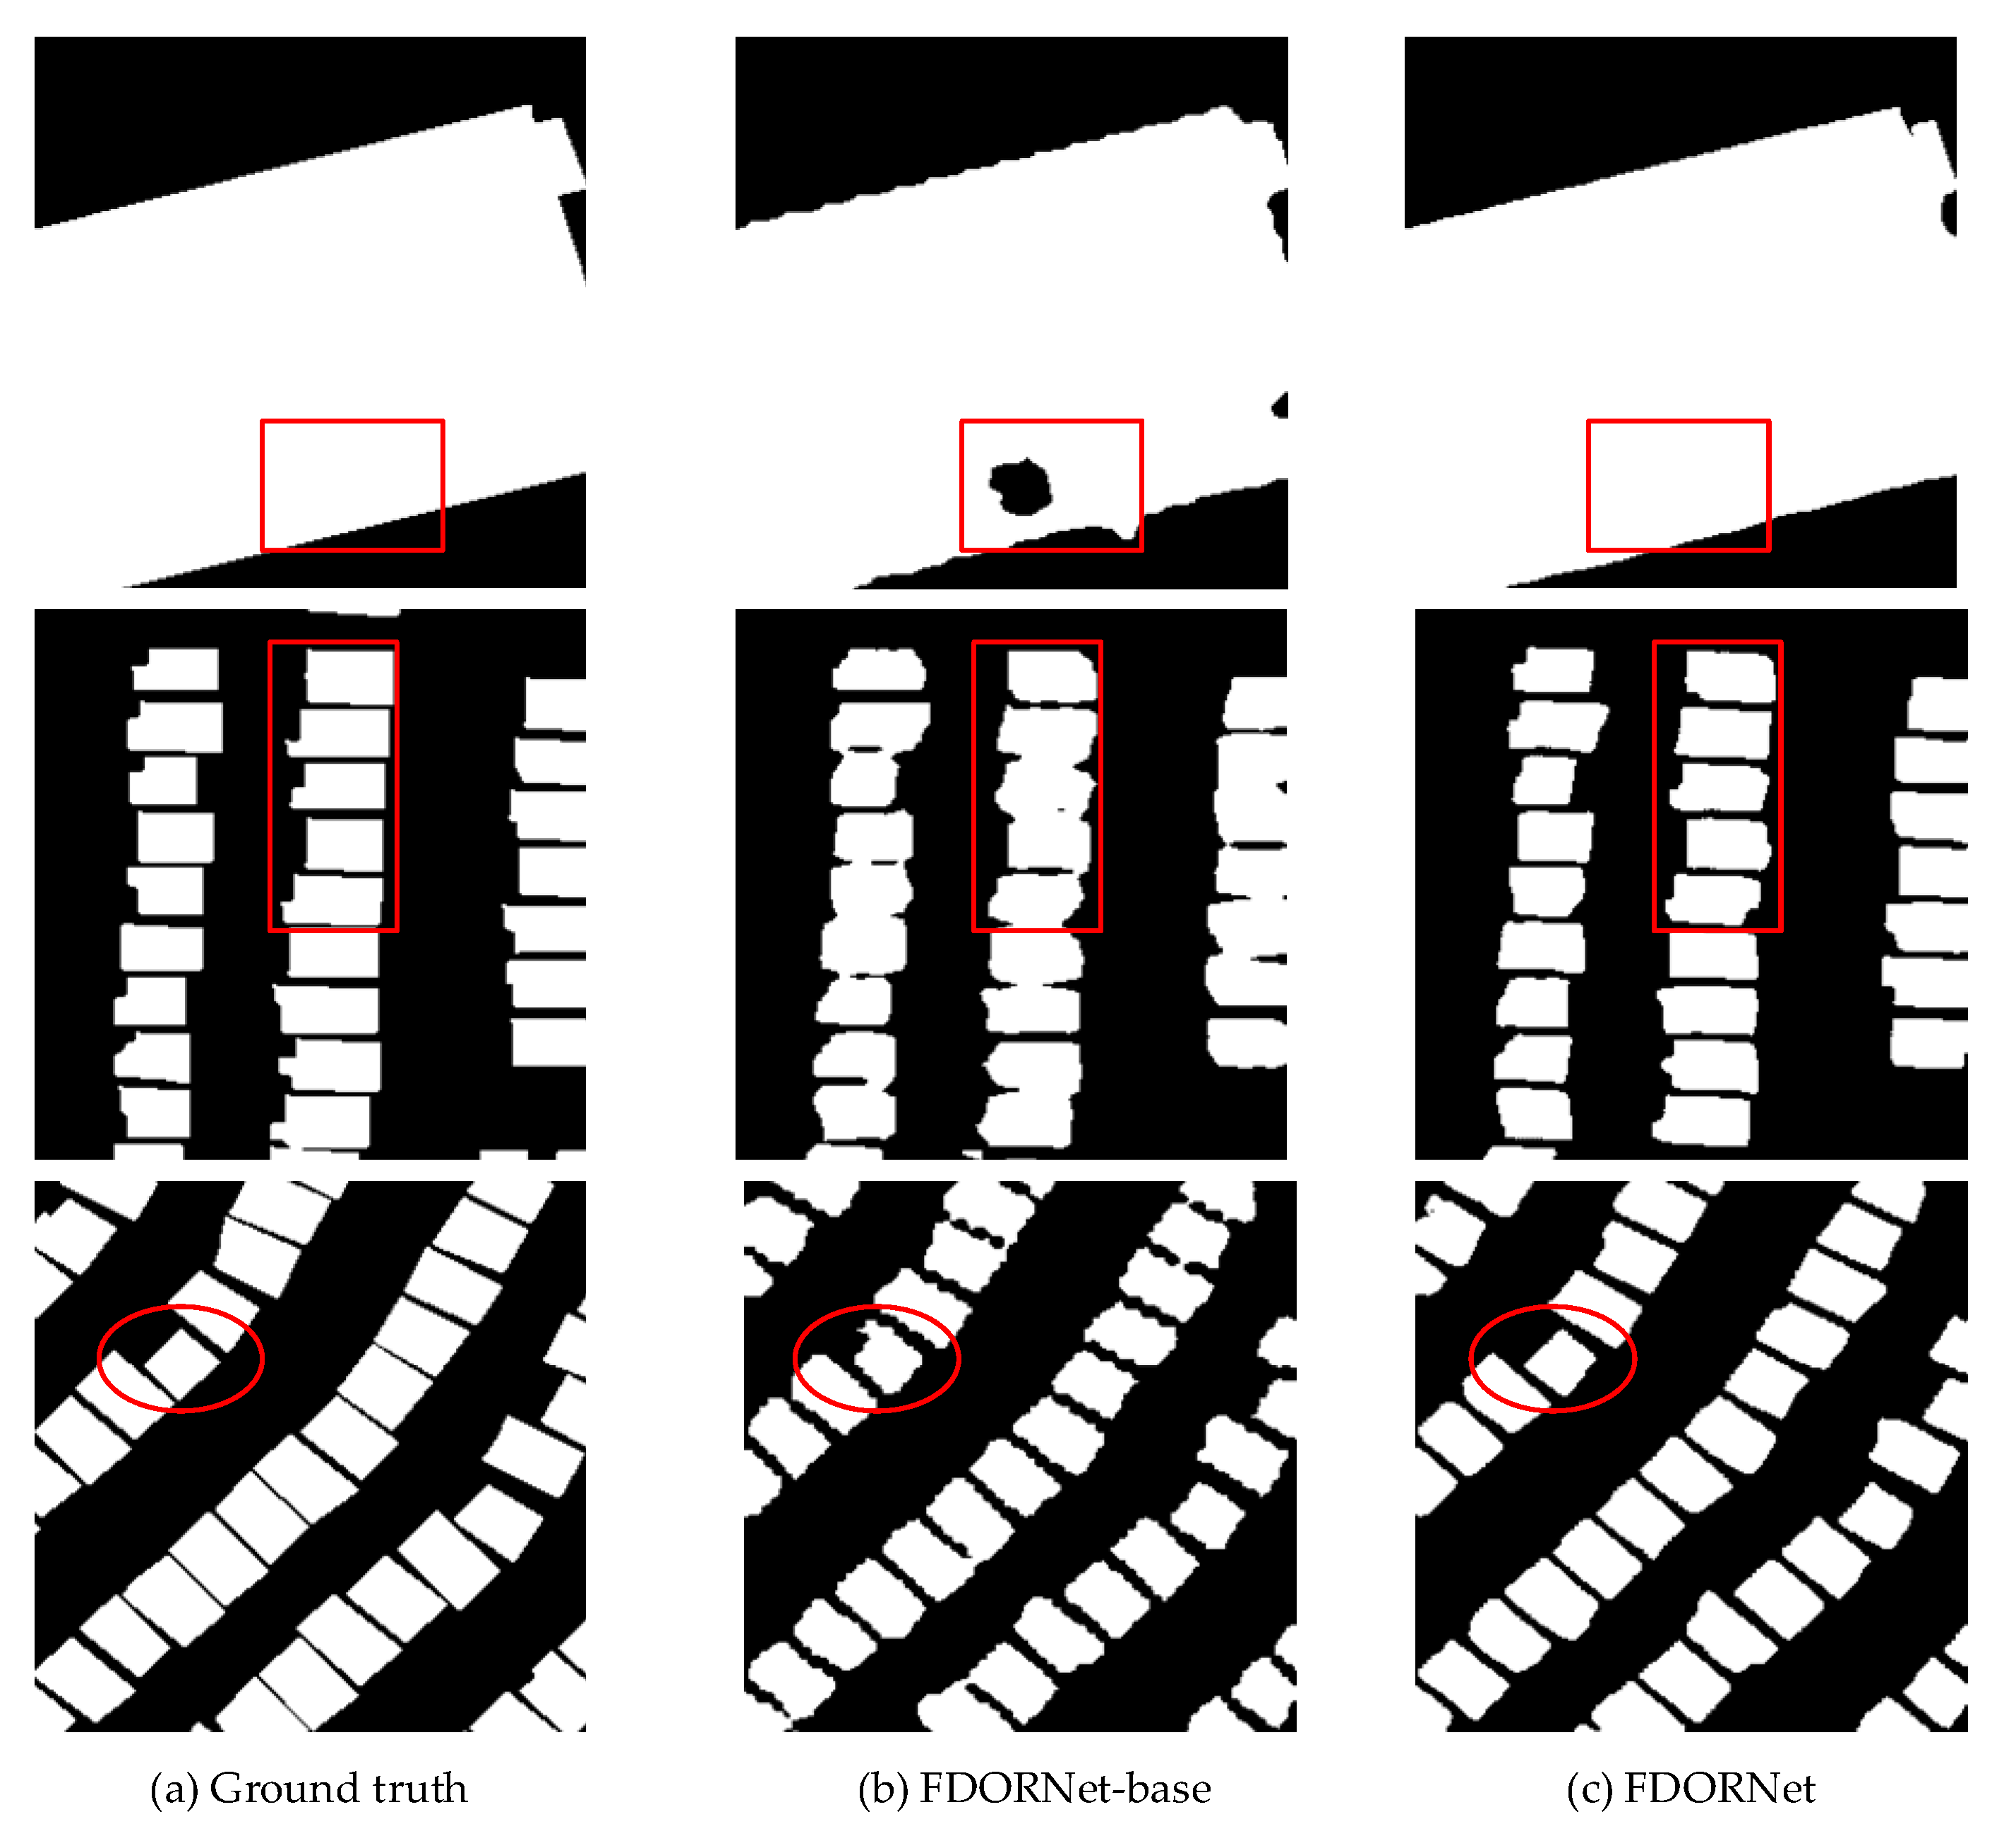
5.3. Ablation Experiments
6. Conclusions
Author Contributions
Funding
Institutional Review Board Statement
Informed Consent Statement
Data Availability Statement
Conflicts of Interest
References
- Singh, A. Review article digital change detection techniques using remotely-sensed data. Int. J. Remote Sens. 1989, 10, 989–1003. [Google Scholar] [CrossRef] [Green Version]
- Radke, R.J.; Andra, S.; Al-Kofahi, O.; Roysam, B. Image change detection algorithms: A systematic survey. IEEE Trans. Image Process. 2005, 14, 294–307. [Google Scholar] [CrossRef]
- Gong, M.; Zhao, J.; Liu, J.; Miao, Q.; Jiao, L. Change detection in synthetic aperture radar images based on deep neural networks. IEEE Trans. Neural Netw. Learn. Syst. 2015, 27, 125–138. [Google Scholar] [CrossRef]
- Mahdavi, S.; Salehi, B.; Huang, W.; Amani, M.; Brisco, B. A PolSAR Change Detection Index Based on Neighborhood Information for Flood Mapping. Remote Sens. 2019, 11, 1854. [Google Scholar] [CrossRef] [Green Version]
- Xian, G.; Homer, C. Updating the 2001 National Land Cover Database impervious surface products to 2006 using Landsat imagery change detection methods. Remote Sens. Environ. 2010, 114, 1676–1686. [Google Scholar] [CrossRef]
- Rokni, K.; Ahmad, A.; Selamat, A.; Hazini, S. Water Feature Extraction and Change Detection Using Multitemporal Landsat Imagery. Remote Sens. 2014, 6, 4173–4189. [Google Scholar] [CrossRef] [Green Version]
- Huang, X.; Zhang, L.; Zhu, T. Building change detection from multitemporal high-resolution remotely sensed images based on a morphological building index. IEEE J. Sel. Top. Appl. Earth Obs. Remote. Sens. 2013, 7, 105–115. [Google Scholar] [CrossRef]
- Ye, Y.; Bruzzone, L.; Shan, J.; Bovolo, F.; Zhu, Q. Fast and Robust Matching for Multimodal Remote Sensing Image Registration. IEEE Trans. Geosci. Remote Sens. 2019, 57, 9059–9070. [Google Scholar] [CrossRef] [Green Version]
- Javed, A.; Jung, S.; Lee, W.H.; Han, Y. Object-Based Building Change Detection by Fusing Pixel-Level Change Detection Results Generated from Morphological Building Index. Remote Sens. 2020, 12, 2952. [Google Scholar] [CrossRef]
- Wang, C.; Wang, X. Building change detection from multi-source remote sensing images based on multi-feature fusion and extreme learning machine. Int. J. Remote Sens. 2021, 42, 2246–2257. [Google Scholar] [CrossRef]
- Cao, S.; Du, M.; Zhao, W.; Hu, Y.; Mo, Y.; Chen, S.; Cai, Y.; Peng, Z.; Zhang, C. Multi-level monitoring of three-dimensional building changes for megacities: Trajectory, morphology, and landscape. ISPRS J. Photogramm. Remote Sens. 2020, 167, 54–70. [Google Scholar] [CrossRef]
- Liu, S.; Ding, W.; Liu, C.; Liu, Y.; Wang, Y.; Li, H. ERN: Edge Loss Reinforced Semantic Segmentation Network for Remote Sensing Images. Remote Sens. 2018, 10, 1339. [Google Scholar] [CrossRef] [Green Version]
- Dechesne, C.; Lassalle, P.; Lefèvre, S. Bayesian U-Net: Estimating Uncertainty in Semantic Segmentation of Earth Observation Images. Remote Sens. 2021, 13, 3836. [Google Scholar] [CrossRef]
- Cheng, G.; Zhou, P.; Han, J. Learning rotation-invariant convolutional neural networks for object detection in VHR optical remote sensing images. IEEE Trans. Geosci. Remote Sens. 2016, 54, 7405–7415. [Google Scholar] [CrossRef]
- Chen, C.; Zhong, J.; Tan, Y. Multiple-oriented and Small Object Detection with Convolutional Neural Networks for Aerial Image. Remote Sens. 2019, 11, 2176. [Google Scholar] [CrossRef] [Green Version]
- He, H.; Chen, M.; Chen, T.; Li, D. Matching of Remote Sensing Images with Complex Background Variations via Siamese Convolutional Neural Network. Remote Sens. 2018, 10, 355. [Google Scholar] [CrossRef] [Green Version]
- Zhou, L.; Ye, Y.; Tang, T.; Nan, K.; Qin, Y. Robust Matching for SAR and Optical Images Using Multiscale Convolutional Gradient Features. IEEE Geosci. Remote Sens. Lett. 2021, 19, 4017605. [Google Scholar] [CrossRef]
- Hou, B.; Wang, Y.; Liu, Q. Change detection based on deep features and low rank. IEEE Geosci. Remote. Sens. Lett. 2017, 14, 2418–2422. [Google Scholar] [CrossRef]
- Saha, S.; Bovolo, F.; Bruzzone, L. Unsupervised deep change vector analysis for multiple-change detection in VHR images. IEEE Trans. Geosci. Remote Sens. 2019, 57, 3677–3693. [Google Scholar] [CrossRef]
- Long, J.; Shelhamer, E.; Darrell, T. Fully convolutional networks for semantic segmentation. In Proceedings of the IEEE Conference on Computer Vision and Pattern Recognition, Boston, MA, USA, 7–12 June 2015; pp. 3431–3440. [Google Scholar]
- Ronneberger, O.; Fischer, P.; Brox, T. U-net: Convolutional networks for biomedical image segmentation. In Proceedings of the International Conference on Medical Image Computing and Computer-Assisted Intervention, Munich, Germany, 5–9 October 2015; Springer: Cham, Switzerland, 2015; pp. 234–241. [Google Scholar]
- Chen, H.; Shi, Z. A spatial-temporal attention-based method and a new dataset for remote sensing image change detection. Remote Sens. 2020, 12, 1662. [Google Scholar] [CrossRef]
- Chen, J.; Yuan, Z.; Peng, J.; Chen, L.; Huang, H.; Zhu, J.; Liu, Y.; Li, H. DASNet: Dual Attentive Fully Convolutional Siamese Networks for Change Detection in High-Resolution Satellite Images. IEEE J. Sel. Top. Appl. Earth Obs. Remote Sens. 2021, 14, 1194–1206. [Google Scholar] [CrossRef]
- Liu, Y.; Pang, C.; Zhan, Z.; Zhang, X.; Yang, X. Building Change Detection for Remote Sensing Images Using a Dual-Task Constrained Deep Siamese Convolutional Network Model. IEEE Geosci. Remote. Sens. Lett. 2021, 18, 811–815. [Google Scholar] [CrossRef]
- Li, X.; Li, X.; Zhang, L.; Cheng, G.; Shi, J.; Lin, Z.; Tan, S.; Tong, Y. Improving semantic segmentation via decoupled body and edge supervision. In Proceedings of the Computer Vision–ECCV 2020: 16th European Conference, Glasgow, UK, 23–28 August 2020; Springer International Publishing: Cham, Switzerland, 2020; pp. 435–452. [Google Scholar]
- Johnson, R.D.; Kasischke, E.S. Change vector analysis: A technique for the multispectral monitoring of land cover and condition. Int. J. Remote Sens. 1998, 19, 411–426. [Google Scholar] [CrossRef]
- Chen, J.; Gong, P.; He, C.; Pu, R.; Shi, P. Land-use/land-cover change detection using improved change-vector analysis. Photogramm. Eng. Remote Sens. 2003, 69, 369–379. [Google Scholar] [CrossRef] [Green Version]
- Bruzzone, L.; Prieto, D.F. Automatic analysis of the difference image for unsupervised change detection. IEEE Trans. Geosci. Remote Sens. 2000, 38, 1171–1182. [Google Scholar] [CrossRef] [Green Version]
- Li, Z.; Shi, W.; Hao, M.; Zhang, H. Unsupervised change detection using spectral features and a texture difference measure for VHR remote-sensing images. Int. J. Remote Sens. 2017, 38, 7302–7315. [Google Scholar] [CrossRef]
- Mishra, N.S.; Ghosh, S.; Ghosh, A. Fuzzy clustering algorithms incorporating local information for change detection in remotely sensed images. Appl. Soft Comput. 2012, 12, 2683–2692. [Google Scholar] [CrossRef]
- Im, J.; Jensen, J.R.; Tullis, J.A. Object-based change detection using correlation image analysis and image segmentation. Int. J. Remote Sens. 2008, 29, 399–423. [Google Scholar] [CrossRef]
- Wang, B.; Choi, S.; Byun, Y.; Lee, S.; Choi, J. Object-based change detection of very high resolution satellite imagery using the cross-sharpening of multitemporal data. IEEE Geosci. Remote Sens. Lett. 2015, 12, 1151–1155. [Google Scholar] [CrossRef]
- Liu, J.; Gong, M.; Qin, K.; Zhang, P. A deep convolutional coupling network for change detection based on heterogeneous optical and radar images. IEEE Trans. Neural Netw. Learn. Syst. 2016, 29, 545–559. [Google Scholar] [CrossRef]
- Zhan, Y.; Fu, K.; Yan, M.; Sun, X.; Wang, H.; Qiu, X. Change detection based on deep siamese convolutional network for optical aerial images. IEEE Geosci. Remote Sens. Lett. 2017, 14, 1845–1849. [Google Scholar] [CrossRef]
- Daudt, R.C.; Le Saux, B.; Boulch, A. Fully convolutional siamese networks for change detection. In Proceedings of the 2018 25th IEEE International Conference on Image Processing (ICIP), Athens, Greece, 7–10 October 2018; IEEE: Piscataway, NJ, USA, 2018; pp. 4063–4067. [Google Scholar]
- Liu, J.; Gong, M.; Qin, A.K.; Tan, K.C. Bipartite Differential Neural Network for Unsupervised Image Change Detection. IEEE Trans. Neural Netw. Learn. Syst. 2020, 31, 876–890. [Google Scholar] [CrossRef] [PubMed]
- Mou, L.; Bruzzone, L.; Zhu, X. Learning spectral-spatial-temporal features via a recurrent convolutional neural network for change detection in multispectral imagery. IEEE Trans. Geosci. Remote Sens. 2019, 57, 924–935. [Google Scholar] [CrossRef] [Green Version]
- Diakogiannis, F.I.; Waldner, F.; Caccetta, P. Looking for Change? Roll the Dice and Demand Attention. Remote Sens. 2021, 13, 3707. [Google Scholar] [CrossRef]
- Zhang, C.; Yue, P.; Tapete, D.; Jiang, L.; Shangguan, B.; Huang, L.; Liu, G. A deeply supervised image fusion network for change detection in high resolution bi-temporal remote sensing images. ISPRS J. Photogramm. Remote Sens. 2020, 166, 183–200. [Google Scholar] [CrossRef]
- Marcos, D.; Tuia, D.; Kellenberger, B.; Zhang, L.; Bai, M.; Liao, R.; Urtasun, R. Learning deep structured active contours end-to-end. In Proceedings of the IEEE Conference on Computer Vision and Pattern Recognition, Salt Lake City, UT, USA, 18–23 June 2018; pp. 8877–8885. [Google Scholar]
- Zorzi, S.; Fraundorfer, F. Regularization of Building Boundaries in Satellite Images Using Adversarial and Regularized Losses. In Proceedings of the IGARSS 2019–2019 IEEE International Geoscience and Remote Sensing Symposium, Yokohama, Japan, 28 July–2 August 2019; pp. 5140–5143. [Google Scholar]
- Zorzi, S.; Bittner, K.; Fraundorfer, F. Machine-Learned Regularization and Polygonization of Building Segmentation Masks. In Proceedings of the 2020 25th International Conference on Pattern Recognition (ICPR), Milan, Italy, 10–15 January 2021; pp. 3098–3105. [Google Scholar]
- He, K.; Zhang, X.; Ren, S.; Sun, J. Deep residual learning for image recognition. In Proceedings of the IEEE Conference on Computer Vision and Pattern Recognition, Las Vegas, CA, USA, 26 June–1 July 2016; pp. 770–778. [Google Scholar]
- Dosovitskiy, A.; Fischer, P.; Ilg, E.; Hausser, P.; Hazirbas, C.; Golkov, V.; van der Smagt, P.; Cremers, D.; Brox, T. Flownet: Learning optical flow with convolutional networks. In Proceedings of the IEEE International Conference on Computer Vision, Santiago, Chile, 7–13 December 2015; pp. 2758–2766. [Google Scholar]
- Jaderberg, M.; Simonyan, K.; Zisserman, A.; Kavukcuoglu, K. Spatial Transformer Networks. In Proceedings of the Neural Information Processing Systems 2015, Montreal, QC, Canada, 7–12 December 2015; pp. 2017–2025. [Google Scholar]


| Ground Truth | |||
|---|---|---|---|
| Predict | Change buildings | Background | |
| Change buildings | True Change (TC) | False Background (FC) | |
| Background | False Change (FB) | True Background (TB) | |
| Methods | Overall Accuracy (%) | Recall (%) | Precision (%) | F1-Score (%) | MIoU(%) |
|---|---|---|---|---|---|
| FC-EF | 96.5459 | 64.5995 | 68.7865 | 66.6273 | 73.1891 |
| EF-Siam-conc | 95.7203 | 73.4687 | 57.7948 | 64.6959 | 71.6804 |
| STA-BAM | 98.0691 | 87.2022 | 77.6449 | 82.1465 | 83.8408 |
| STA-PAM | 98.4768 | 89.8648 | 81.9707 | 85.7364 | 86.7188 |
| FDORNet | 99.0723 | 90.4158 | 91.2937 | 90.8524 | 91.1335 |
| Methods | Overall Accuracy (%) | Recall (%) | Precision (%) | F1-Score (%) | MIoU(%) |
|---|---|---|---|---|---|
| FDORNet -base | 98.8611 | 89.0168 | 88.6744 | 88.8452 | 89.3697 |
| FDORNet | 99.0723 | 90.4158 | 91.2937 | 90.8524 | 91.1335 |
Publisher’s Note: MDPI stays neutral with regard to jurisdictional claims in published maps and institutional affiliations. |
© 2022 by the authors. Licensee MDPI, Basel, Switzerland. This article is an open access article distributed under the terms and conditions of the Creative Commons Attribution (CC BY) license (https://creativecommons.org/licenses/by/4.0/).
Share and Cite
Ye, Y.; Zhou, L.; Zhu, B.; Yang, C.; Sun, M.; Fan, J.; Fu, Z. Feature Decomposition-Optimization-Reorganization Network for Building Change Detection in Remote Sensing Images. Remote Sens. 2022, 14, 722. https://0-doi-org.brum.beds.ac.uk/10.3390/rs14030722
Ye Y, Zhou L, Zhu B, Yang C, Sun M, Fan J, Fu Z. Feature Decomposition-Optimization-Reorganization Network for Building Change Detection in Remote Sensing Images. Remote Sensing. 2022; 14(3):722. https://0-doi-org.brum.beds.ac.uk/10.3390/rs14030722
Chicago/Turabian StyleYe, Yuanxin, Liang Zhou, Bai Zhu, Chao Yang, Miaomiao Sun, Jianwei Fan, and Zhitao Fu. 2022. "Feature Decomposition-Optimization-Reorganization Network for Building Change Detection in Remote Sensing Images" Remote Sensing 14, no. 3: 722. https://0-doi-org.brum.beds.ac.uk/10.3390/rs14030722