Article

Remotely Sensed Spatiotemporal Variation in Crude Protein of Shortgrass Steppe Forage

by
Jorge Gonzalo N. Irisarri
1,*,
Martin Durante
2,3,
Justin D. Derner
4,
Martin Oesterheld
5 and
David J. Augustine
6
1
Sustainable Agriculture Sciences, Rothamsted Research, North Wyke, Okehampton EX20 2SB, UK
2
Estación Experimental Agropecuaria Concepción del Uruguay, Instituto Nacional de Tecnología Agropecuaria (INTA), Concepcion del Uruguay 3260, Argentina
3
Programa Pasturas y Forrajes, Estación Experimental INIA Tacuarembó, Instituto Nacional de Investigación Agropecuaria (INIA), Tacuarembó 45000, Uruguay
4
USDA-Agricultural Research Service (ARS), Rangeland Resources and Systems Research Unit, Cheyenne, WY 82009, USA
5
Instituto de Investigaciones Fisiológicas y Ecológicas Vinculadas a la Agricultura, Buenos Aires 1417, Argentina
6
USDA-Agricultural Research Service (ARS), Rangeland Resources and Systems Research Unit, Fort Collins, CO 80526, USA
*
Author to whom correspondence should be addressed.
Submission received: 4 January 2022 / Revised: 28 January 2022 / Accepted: 9 February 2022 / Published: 11 February 2022

Abstract

:
In the Great Plains of central North America, sustainable livestock production is dependent on matching the timing of forage availability and quality with animal intake demands. Advances in remote sensing technology provide accurate information for forage quantity. However, similar efforts for forage quality are lacking. Crude protein (CP) content is one of the most relevant forage quality determinants of individual animal intake, especially below an 8% threshold for growing animals. In a set of shortgrass steppe paddocks with contrasting botanical composition, we (1) modeled the spatiotemporal variation in field estimates of CP content against seven spectral MODIS bands, and (2) used the model to assess the risk of reaching the 8% CP content threshold during the grazing season for paddocks with light, moderate, or heavy grazing intensities for the last 22 years (2000–2021). Our calibrated model explained up to 69% of the spatiotemporal variation in CP content. Different from previous investigations, our model was partially independent of NDVI, as it included the green and red portions of the spectrum as direct predictors of CP content. From 2000 to 2021, the model predicted that CP content was a limiting factor for growth of yearling cattle in 80% of the years for about 60% of the mid-May to October grazing season. The risk of forage quality being below the CP content threshold increases as the grazing season progresses, suggesting that ranchers across this rangeland region could benefit from remotely sensed CP content to proactively remove yearling cattle earlier than the traditional October date or to strategically provide supplemental protein sources to grazing cattle.

Graphical Abstract

1. Introduction

In arid and semi-arid rangeland ecosystems, sustainable livestock production is dependent on matching the timing of forage availability and associated quality with animal intake demands [1,2,3,4]. Ranchers often develop grazing plans that use established guides for initial stocking rates [5,6] and diverse management strategies to accomplish operational goals and desired outcomes [7]. Both intra- and inter-annual variations in forage availability, however, provide ranchers substantial challenges in matching with animal demand [8,9,10]. These challenges have major impacts on ranching operation economics, including operation structure regarding animal type, kind, and numbers, and ecosystem resiliency [11,12,13,14]. In addition to the uncertainties of the quantity of forage availability [15,16], variability in the quality of this forage presents logistical constraints to livestock production [17,18], which are expected to increase with climate change [19]. Advances in remote sensing technology have generated more accurate predictions of forage availability [20,21,22,23,24]. This has provided national research institutions around the globe with seasonal forecasts of forage availability for major rangeland areas (https://grasscast.unl.edu/ accessed on 10 January 2022; http://produccionforrajes.org.ar/ accessed on 10 January 2022; https://www.geo-rapp.org/ accessed on 10 January 2022). Similar efforts for forage quality are lacking; their development would provide ranchers with a key tool to advance adaptive management at ranch to landscape scales, in addition to enhancing development of more climate-friendly grazing strategies.
Crude protein (CP) content is one of the most relevant forage quality determinants of individual animal intake when CP content of forage is 8% or less [25,26,27,28]. Under such conditions, individual intake, expressed as a percentage of body weight, linearly relates to CP content; for each percentage unit of increase in CP content, individual intake increases 0.375 percentage units [28]. Regional variation in CP protein content is positively associated with mean annual precipitation and negatively with mean annual temperature [29]. In the last 20 years, CP content of forages has decreased, which has resulted in a greater need for supplemental protein sources with an economic cost of USD 1.9 billion annually [30]. Moreover, CP content is expected to further decrease in the Central Plains of North America due to climate change effects [19]. Capturing variation in CP content within the grazing season and at scales relevant to ranch-level decision making remains an urgent need for ranchers. The promise of remote sensing to provide this information, at a sufficient temporal frequency within the grazing season, is intriguing for application and use by ranchers.
With either field or airborne hyperspectral data, there is a tight correlation between specific portion of the spectrum and CP content of vegetation [31,32,33,34]. Furthermore, some recent analyses of hyperspectral data collected from aerial platforms have generated models that can predict forage quality, but these have relied on spectra not measured by satellites with a long history of data collection [35,36,37]. Extending this to satellite data, however, has received less attention due to an erratic association to CP content [34,38,39]. For example, in rangelands of Mongolia, spectral indices derived from MODIS and NOAA-AVHRR were poorly associated (<20%) with CP content across years [38]. However, when analyses were conducted seasonally within the year, the association between NOAA-AVHRR NDVI data and CP content inferred from fecal nitrogen content increased to 60% in savannas of Kruger National Park in South Africa [39]. Moreover, recent investigations have shown the association between the proportion of photosynthetic and non-photosynthetic vegetation and crude protein content [40]. It remains unclear if the use of reflectance bands may provide a model independent of NDVI itself. Since NDVI has mainly been used for vegetation growth rate estimations [20,21,41,42], use of NDVI itself for forage quality would be redundant. Multiple regression models using four spectral bands, simulating Sentinel 2 spectral bands through hyperspectral data, did explain two-thirds of the variation in CP content [34], and another recent analysis established a relationship between rangeland CP content and spectral indices measured by the Sentinel-2 satellite [41]. However, Sentinel 2 has been orbiting the Earth since only 2015, thereby limiting our ability to retrospectively assess seasonal spectral variations and CP content.
The lack of historical predictions of forage quality that can be linked with measures of livestock performance has limited our understanding of how spatial and temporal, both intra- and inter-annual, variations affect ranching operations. Moreover, erratic precipitation amounts when forage is in different phenological stages contributes to increasing enterprise risk for ranchers. Risk assessments in arid and semi-arid rangelands have centered on inter-annual variations in precipitation [12,14,42,43,44,45,46]. Variations in spring precipitation and temperature impact the performance of both cow–calf pairs and yearlings [9,10]. Recent field data demonstrates that knowledge of seasonal variations in weight gains can increase economic returns by 10–25% for ranchers by removing yearling grazing cattle from grazing rangelands earlier than is typical [13]. This earlier removal of yearlings would be most effective if implemented when forage CP content declines below the 8% threshold. It is unclear, however, how often the 8% CP content threshold is reached during the grazing season [25,26,27,28].
Our main objective was to quantify the level of risk experienced by farmers within the shortgrass steppe due to inadequate CP content of forage during the growing season. To reach this main objective, we proposed two specific objectives. First, we evaluated the associations between field estimates of CP content from paddocks with contrasting forage availability and botanical composition with seven different spectral bands acquired through MODIS satellite imagery for a semi-arid shortgrass steppe in North America. Second, using a calibrated model developed from these associations, we then assessed risk levels of reaching the 8% CP content threshold during the grazing season for paddocks with long-term differences in their grazing intensity (light, moderate, or heavy grazing intensities).

2. Materials and Methods

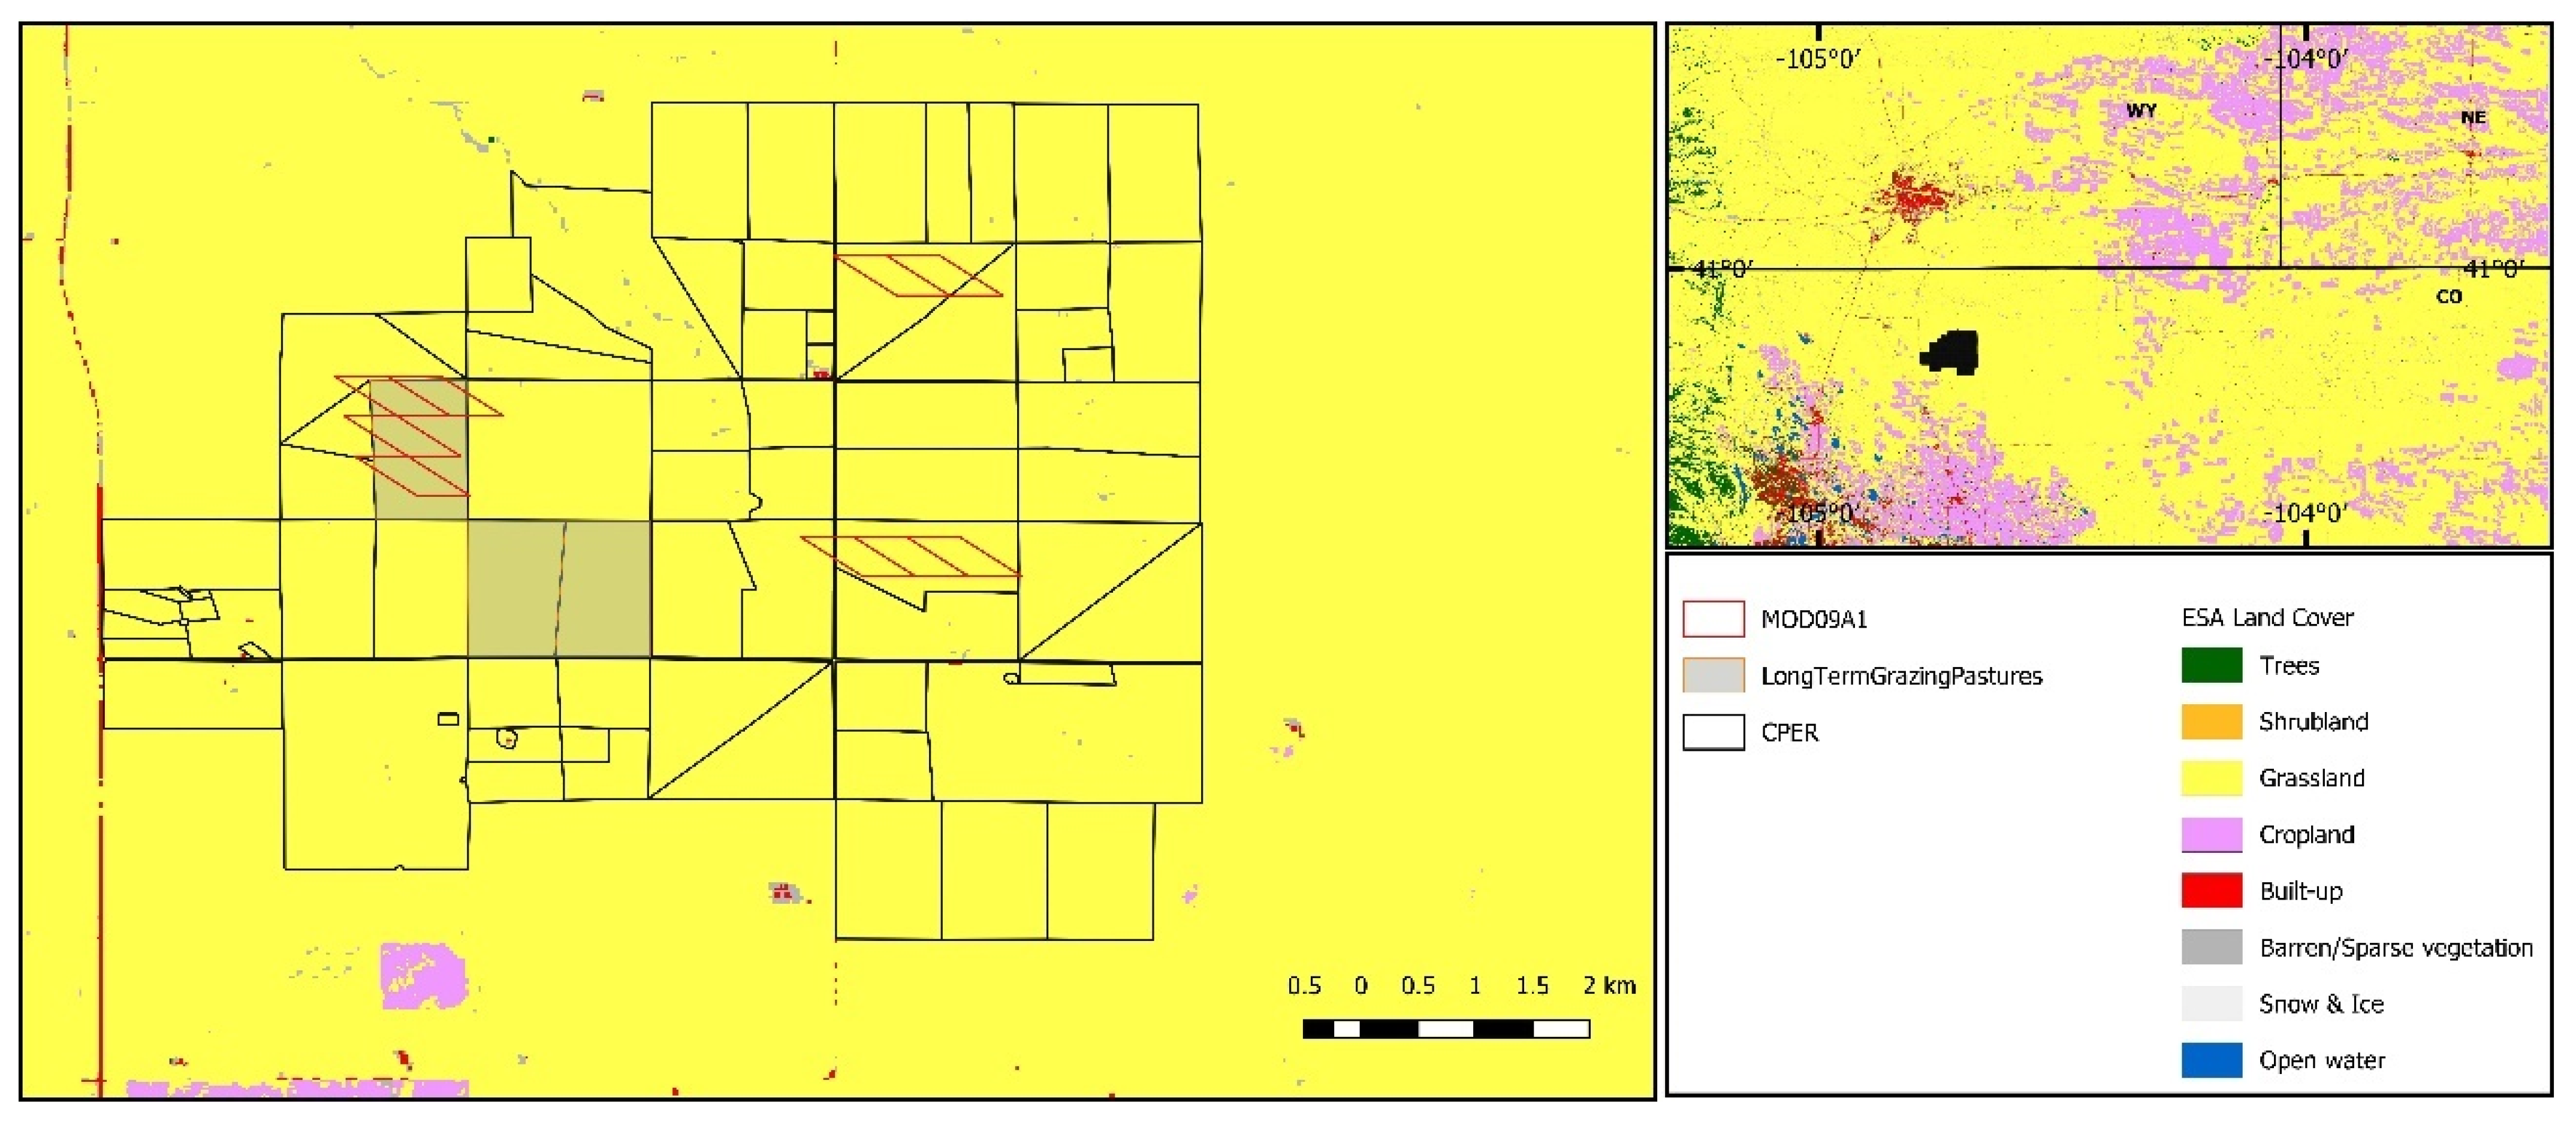
2.1. Site Description

Research was conducted on the USDA-Agricultural Research Service Central Plains Experimental Range in north-central Colorado, USA (40°49′N, 107°46′W), a Long-Term Agroecosystem Research (LTAR) network site. Mean annual precipitation is 340 mm, with 71% of this occurring during the growing season (April–August). Dominant ecological sites are Loamy Plains (R067BY002CO) and Sandy Plains (R06BW024CO) [47,48] with paddocks either being dominated by one or mixed. Ecological sites are distinct types of land with specific soils that produce distinct types and amount of vegetation. The C4, shortgrass blue grama (Bouteloua gracilis) is the dominant plant species for the Loams Plains ecological site. The C3, mid-height grasses needle and thread (Hesperostipa comata) and western wheatgass (Pascopyrum smithii) dominate the more productive plant community (>75% more forage [6,49]) for the Sandy Plains.

2.2. Model Calibration

CP content was estimated from fecal samples of steers in paddocks with different botanical composition. Fecal samples were collected weekly from five individual yearling steers that were kept in three different herds of 22–26 individuals each. Each herd was allocated to a paddock, of 130 ha, either dominated by Loamy or Sandy Plains, and the third was represented by a mix of both ecological sites (Figure 1). These differences in the ecological type provided a range of variation in the abundance of C3 (Sandy Plains) and C4 (Loamy Plains) grass species. During the 2015 and 2016 grazing seasons (mid-May through October) samples from the individual steers were composited by pasture, frozen, and shipped to the Grazingland Animal Nutrition laboratory (https://cnrit.tamu.edu/index.php/frequently-asked-questions/ accessed on 10 January 2022) for analyses of CP content using Near Infrared Reflectance Spectroscopy (NIRS). This resulted in 115 different CP content field estimations: three paddocks × two grazing seasons, and 19–20 weeks per grazing season.
MODIS reflectance data were obtained for the same paddocks where the fecal samples were collected. Reflectance from seven spectral bands was obtained from pixels that occupied 80% or more of the analyzed paddocks (Figure 1). Information from the MOD09A1 synthetic product was downloaded through the Google Earth Engine platform [50]. Specifically, 8-day reflectance data were obtained for seven spectral bands, along with associated metrics of the quality of the spectral measurements. The quality of satellite information was assessed according to the MODLAND QA bits (all the bands presented good quality). To match field estimates of CP content, the 8-day MOD09A1 data was converted to a daily step by linear interpolation between two successive dates.
A two-step approach was used to evaluate the association between field estimates of CP content with the seven spectral bands. First, we tested linear models between field estimates of CP content with all possible combinations of the seven spectral bands, through multiple regression analyses and simple regressions of the spectral bands combined as the normalized difference between them (band 1 − band 2/band 1 + band 2). Second, the predictive accuracy for the best model was assessed by a bootstrapping procedure (70% of the data used to calibrate and 30% to evaluate) using 50 iterations.
An important aspect of this calibration approach is the use of fecal samples as ground truth for CP content. Within remote sensing there are, at least, two main mechanisms for calibrations. The first approach considers sampling within the specific area of a pixel [51,52]. The second considers sampling within different areas of a paddock and, then, through data fusion, combines different satellites with contrasting spatial resolutions [20]. Here, we used the second approach: we combined fecal samples from each entire paddock and related them with remote sensing data that fully covered that paddock (Figure 1). Through this approach there is a great advantage associated with the ability of cattle to sense the entire pasture. At the same time, this sensing ability may be blurred due to stocking density differences. In addition, topography differences may interfere in the signal captured by satellite not associated with CP content variations. The first source of uncertainty is tackled using contrasting stocking rates. The second source, the topography effects on satellite signal, will be part of the noise in our model.

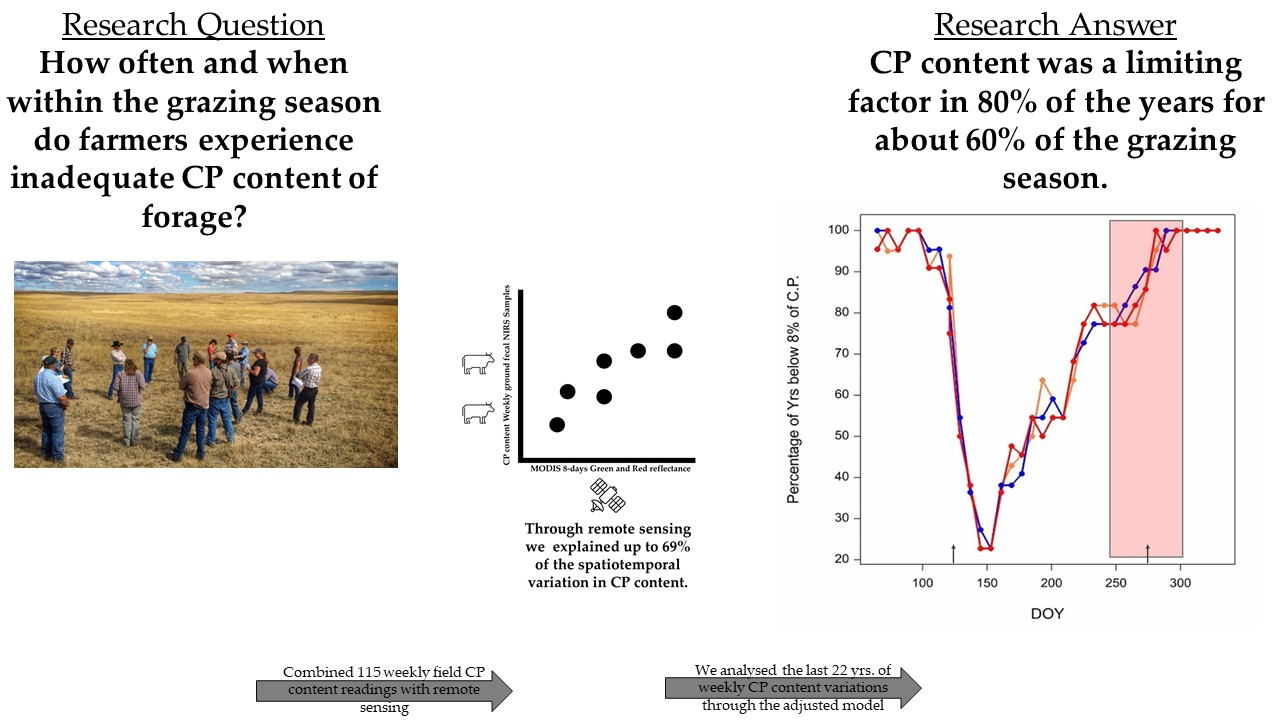
2.3. CP Content Risk Assessment

At CPER, three paddocks were assigned to the long-term (since 1939) grazing intensity treatments (Figure 1). All paddocks were dominated by the Loamy Plains ecological sites, and targeted 20%, 40%, and 60% utilization of peak growing-season biomass for light, moderate, and heavy, respectively [54]. Across the three paddocks, C4 grass biomass increases and C3 graminoid biomass decreases as grazing intensity increases [55]. Plant community composition is similar between the heavy and moderate grazing intensity treatments but differs under the light grazing intensity treatment [56]. For these three paddocks we used the calibrated model to assess the risk levels of CP content across the early growing (April) and grazing season (mid-May to October).
To understand the risks to which ranchers can be exposed during the grazing season, we first described seasonal dynamics of the CP content for each grazing treatment across the 22 years (2000–2021) of observations from MODIS data. Second, risk assessment by grazing intensity level and observed date by MODIS was estimated as the ratio between the years where the CP was ≤8% over the total 22 observed years. Third, we quantified the number of consecutive days within each of the 22 grazing seasons where CP content was >8%. Through this quantification we were able to extract three features from each grazing season: the initial and final date not limited by the 8% CP content threshold, and from the difference between these two dates we estimated the total number of days not limited by the CP content. Finally, we used trend analyses to determine if the initial and/or final date, and the total number of days not limited by CP content, changed in the last 22 years. To do so, we performed a linear regression analysis where the dependent variable was either the initial or final date, expressed as day of the year (DOY), and the independent variable was time expressed in years.

3. Results

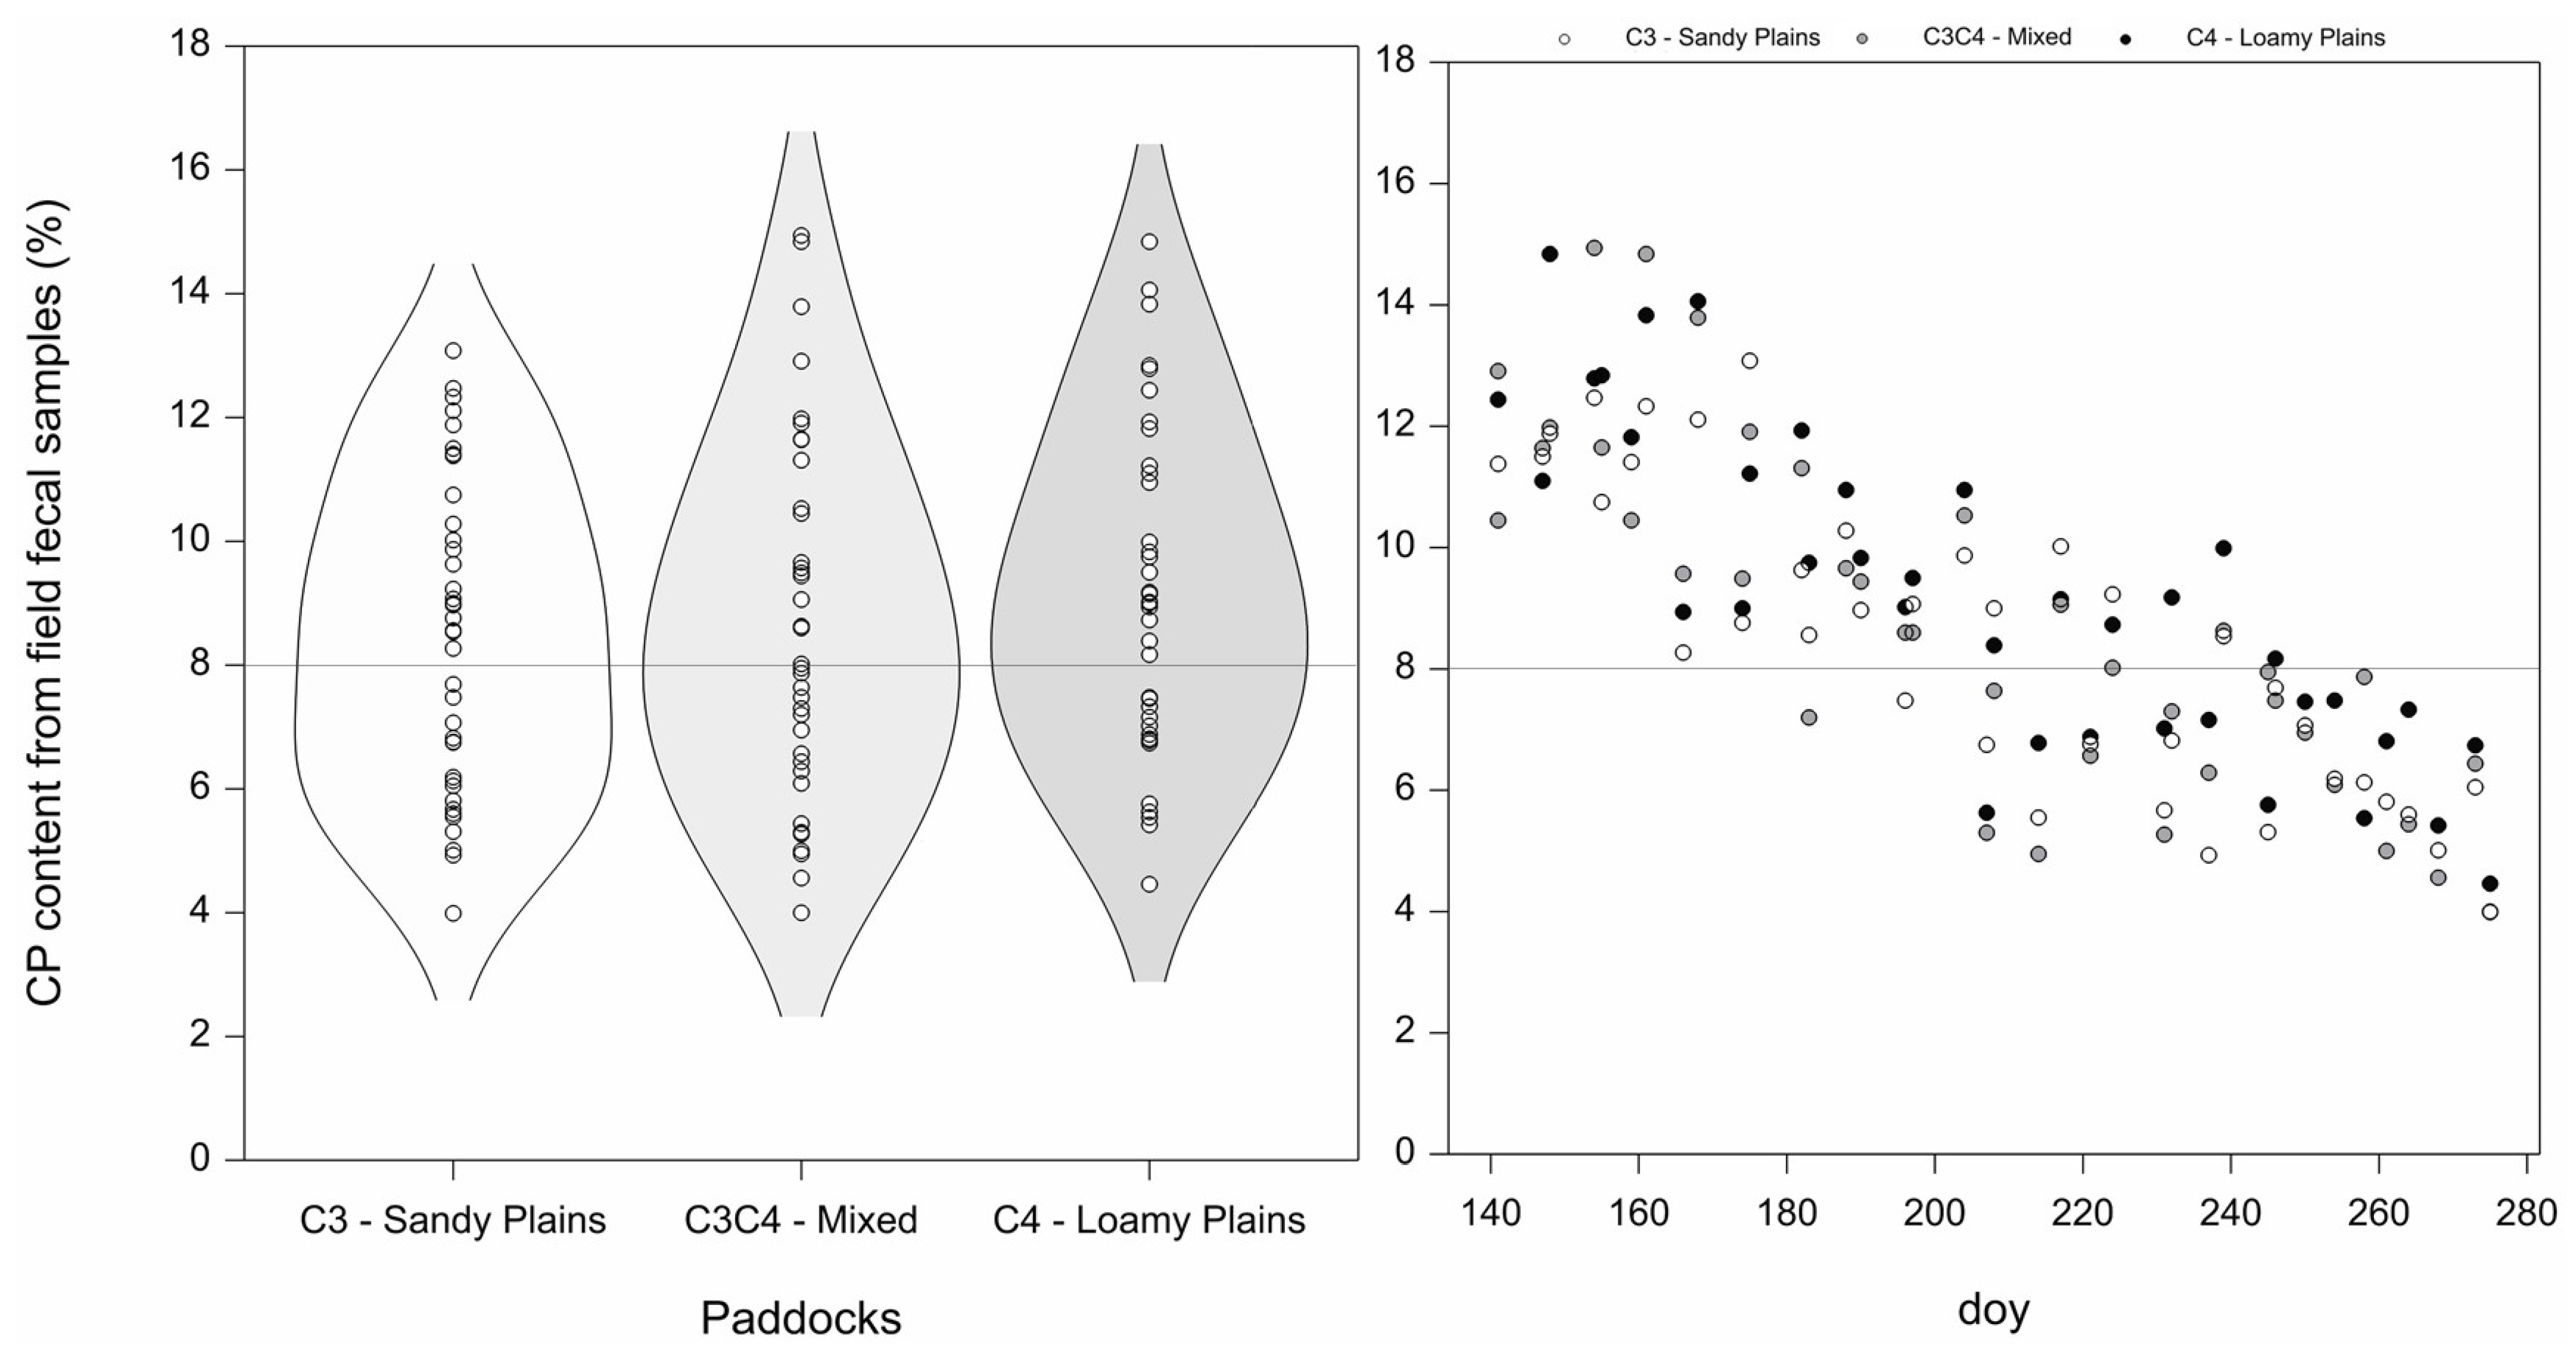
3.1. Variability in Field Estimates of CP Content

CP content from fecal samples of yearling steers varied from a minimum of 4% to a maximum of 16% across the two grazing seasons and paddocks dominated by different proportions of photosynthetic pathways of dominant grasses (Figure 2, left panel). Within the observation dates, years and paddocks CP content negatively declined as the grazing season progressed (Figure 2, right panel).

3.2. Crude Protein Content Calibration with Remotely Sensed Data

Over the two evaluated approaches, multiple regression or normalized difference indices, the first prevailed (Figure 3 and Table S1 Supplementary Material). The most parsimonious model included bands one and four of the MOD09A1 synthetic product, representing the red and green portions of the spectrum, respectively: CP% = 10.46 − 0.025b1 + 0.026b4. These two bands explained 69% of spatial and temporal variation within and across grazing seasons with RMSD of 1.54 ± 0.15 (n = 115) (Figure 3). No differences were observed in the most parsimonious model for paddocks dominated by different proportions of C3 and C4 plant functional types (Supplementary Material Table S1).

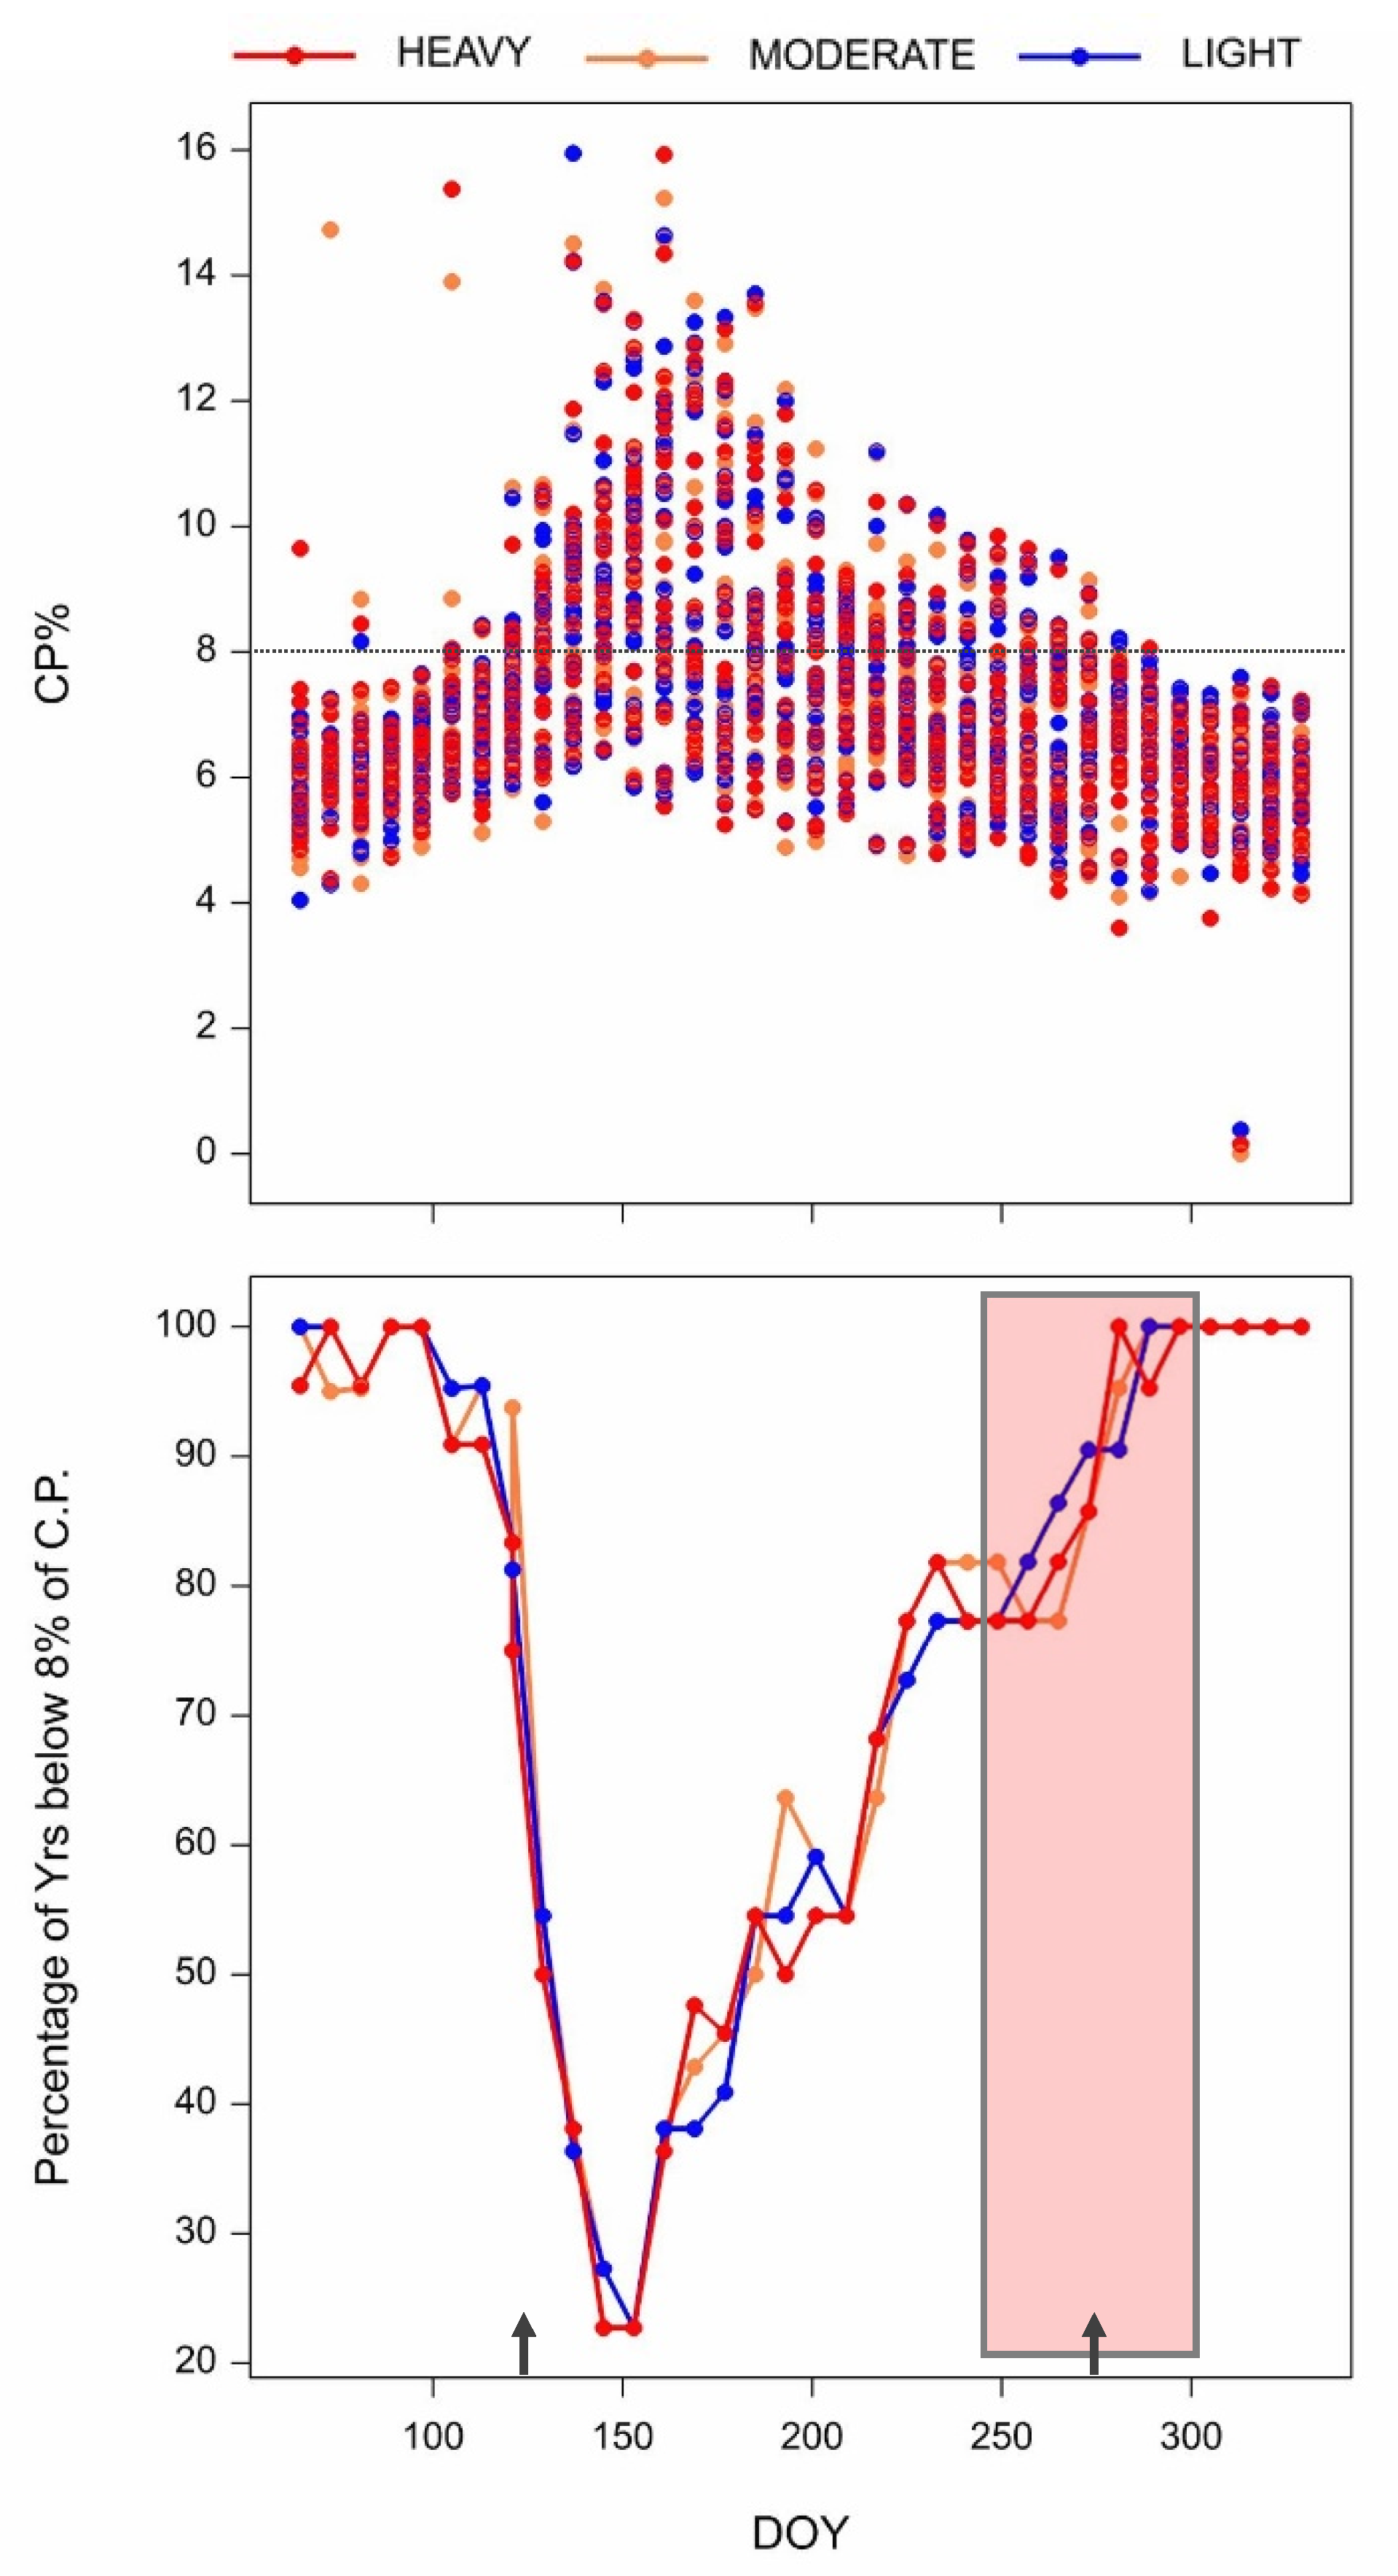
3.3. Risk Assessment of the Lack of Crude Protein Content

Clear patterns within the grazing season were observed across the 22 years for CP content, with maximum values occurring at the beginning of June and then declining as the grazing season progressed (Figure 4, top panel). The mean value for CP content across the grazing season was 9.6%, with a relative inter-annual variation of 21%. We did observe that the 8% CP threshold could occur at any time during the grazing season.
The risk of CP content being ≤8% was inverse to the seasonal pattern for CP content. The risk of being below the threshold was approximately one in five years (20%) at the beginning of June, but increased to three in four years (75%) by early September and 100% of the years for the three grazing intensity treatments by October (Figure 4, lower panel). Few differences were observed for risk among the grazing intensity treatments, suggesting that the observed patterns were primarily driven by plant phenology. Finally, during the two major droughts experienced in 2002 and 2012, the 8% threshold was not surpassed during the entire grazing season.
The 8% CP content threshold at the end of the season was reached increasingly earlier across the 2000–2021 period. If ranchers had to end the grazing season based on that date, it would have shortened by more than two days per year (Figure 5. END_grazing DOY = 4941 − 2.356 year; R2: 0.18; p-value < 0.001; n: 60). This relationship indicates that grazing animal intake limitations due to the 8% CP threshold have shifted from late August in 2000 to mid-July by 2021.

4. Discussion

Our study provides the first complete description of the association between field estimates of crude protein content (CP content) and its remotely sensed estimation using spectral bands partially independent of NDVI for one of the main semi-arid rangelands in North America, the shortgrass steppe. We determined that CP content was positively associated with the green portion of spectrum and negatively with the red portion from MOD09A1. A calibrated model based on this association allowed us to assess for the first time the long-term risk that CP content of forage will fall below the 8% threshold during the traditional grazing season, and thus expose ranchers to significant declines in weight gains of yearling steers. Surprisingly, we found that CP content is expected to be a limiting factor for yearling growth in four of five years (80%) during about 60% of the mid-May to October grazing season. We also observed a weak negative temporal trend for the last day in the grazing season when content remains above the 8% threshold, suggesting that the number of grazing season days not limited by CP content decreased over the past 22 years (2000–2021).
To date, we lacked a full picture of the association between CP content and portions of the spectrum independent of NDVI for long-term remote sensing data. Moreover, NDVI has shown limited sensitivity to moderate to high chlorophyll content or high quantities of leaf layers under erectophile canopies because, under such a canopy arrangement, more radiation is scattered to the bottom leaves, thus decreasing NIR reflectance [57]. Under low vegetation cover, soil reflectance also contributes to NIR reflectance. Specifically, soil moisture causes decreases in NIR reflectance, affecting NDVI signal in sites where green vegetation cover is far from reaching 95% interception. Finally, NIR reflectance is species dependent because it is closely associated with leaf and canopy structure [58]. Our calibrated model provides new insight as previous works focused on the association between NDVI and CP content [38,39,59]. However, the phenology derived from NDVI also explained a high variation in CP content [57]. Three key aspects from this work should advance additional efforts. First, we confirmed that CP content is closely negatively related to the red portion of spectrum, indicating a direct association with photosynthetic activity [59,60,61]. Second, we found a positive association between CP content and the green portion of the spectrum. This represents a seasonal and independent estimation of CP content from either growth rate of biomass [20,57] or the total amount of biomass [62]. These latter efforts use strong associations with the red and different wavebands within the infrared portion of spectrum for their remote sensing approaches. Finally, our model seems to be independent of the botanical composition and the growth rate, providing a robust model to extrapolate across different grazing intensity levels, as recently shown in savannas of northern Australia [40].
Our findings provide novel insights to understand intra- and inter-seasonal variations in forage quality in semi-arid environments, and linkages to assessing risks of grazing strategies. In the shortgrass steppe of the western part of the North American Great Plains, forage production is closely associated with current [63,64] and previous year [65] spring precipitation. Climate changes in this system predict increases in spring precipitation variability, increasing temperatures, and rising atmospheric CO2 [66,67]. Increasing precipitation variability during the spring suggests enterprise changes to ranching, with more yearlings added and reduced numbers of cow–calf pairs [12]. This anticipated increase in the number of yearlings grazing in this rangeland ecosystem, combined with expected increases in forage production but with reduced CP content arising from increasing atmospheric CO2 [19], showcases the need for robust, remotely sensed estimations of CP content for ranchers. Obtaining CP content estimates at temporal and spatial scales relevant for paddock and ranch-level decision making will be needed to determine when grazing animals may need supplementation of protein or when to remove them from extensive rangelands to confined finishing operations. Being proactive for both scenarios should be economically advantageous for ranchers and contribute to long-term resilience of this rangeland ecosystem.

5. Conclusions

Ranchers and land managers have access to remotely sensed biomass estimates that can be used for paddock and ranch-level grazing management (e.g., https://grasscast.unl.edu/ accessed on 10 January 2022). However, lacking are corresponding forage quality estimates that would assist in predicting near-real-time trade-offs between forage quantity and quality that impact the growth rates of grazing animals. For example, can remote sensing provide robust and accurate estimates of CP content independently of growth rate estimations associated directly with NDVI [20,60], and thereby enhance opportunities for ranchers to adaptively manage grazing lands to optimize the weight gain of yearling animals? The model predictions developed here can be used with emerging technological advances in the virtual herding of animals to match high-quality forage locations more effectively on the landscape with growing animals, without needing the botanical composition to estimate the growth rate [20]. Combining these technologies may reduce the intrinsic risks of yearling grazing forages that do not provide a diet with sufficient CP for growth, and increase optimization of weight gains across the grazing season to enhance the efficiency of the yearling grazing enterprise for ranchers in this highly variable semi-arid rangeland environment.

Supplementary Materials

The following supporting information can be downloaded at: https://0-www-mdpi-com.brum.beds.ac.uk/article/10.3390/rs14040854/s1, Table S1: R2 values of the linear relationship between field estimations of CP content with all possible normalized difference indices. Highlighted are those that represented the top association and similar fitted values.

Author Contributions

Conceptualization, J.G.N.I., M.D., J.D.D., M.O. and D.J.A. Methodology, M.D., J.G.N.I., J.D.D., D.J.A. and M.O. Writing—original draft preparation: J.G.N.I., M.D., J.D.D., M.O. and D.J.A. All authors have read and agreed to the published version of the manuscript.

Funding

This work was supported by the USDA Agricultural Research Service. (ARS), Rangeland Resources and Systems Research Unit.

Institutional Review Board Statement

Not applicable.

Informed Consent Statement

Not applicable.

Data Availability Statement

Not applicable.

Acknowledgments

We appreciate the provision of livestock for grazing by the Crow Valley Livestock Cooperative, Inc.

Conflicts of Interest

The authors declare no conflict of interest.

References

  1. Holechek, J.L.; Vavra, M.; Arthijn, D. Relationships between performance, intake, diet nutritive quality and fecal nutritive quality of cattle on mountain range. J. Range Manag. 1978, 741–744. [Google Scholar] [CrossRef] [Green Version]
  2. Holechek, J.L. An approach for setting the stocking rate. Area 1988, 10, 10–14. [Google Scholar]
  3. Hart, R.H.; Waggoner, J.W.; Dunn, T.G.; Kaltenbach, C.C.; Adams, L.D. Optimal stocking rate for cow-calf enterprises on native range and complementary improved pastures. J. Range Manag. 1988, 41, 435. [Google Scholar] [CrossRef]
  4. Derner, J.D.; Hart, R.H.; Smith, M.A.; Waggoner, J.W. Long-term cattle gain responses to stocking rate and grazing systems in northern mixed-grass prairie. Livest. Sci. 2008, 117, 60–69. [Google Scholar] [CrossRef]
  5. Bement, R.E. A stocking-rate guide for beef production on Blue-Grama range. J. Range Manag. 1969, 22, 83. [Google Scholar] [CrossRef] [Green Version]
  6. Raynor, E.J.; Derner, J.D.; Baldwin, T.; Ritten, J.P.; Augustine, D.J. Multidecadal directional shift in shortgrass stocking rates. Rangel. Ecol. Manag. 2021, 74, 72–80. [Google Scholar] [CrossRef]
  7. Wilmer, H.; Augustine, D.J.; Derner, J.D.; Fernández-Giménez, M.E.; Briske, D.D.; Roche, L.M.; Tate, K.W.; Miller, K.E. Diverse management strategies produce similar ecological outcomes on ranches in western Great Plains: Social-ecological assessment. Rangel. Ecol. Manag. 2018, 71, 626–636. [Google Scholar] [CrossRef]
  8. Raynor, E.J.; Derner, J.D.; Hoover, D.L.; Parton, W.J.; Augustine, D.J. Large-scale and local climatic controls on large herbivore productivity: Implications for adaptive rangeland management. Ecol. Appl. 2019, 30, e02053. [Google Scholar] [CrossRef]
  9. Reeves, J.L.; Derner, J.D.; Sanderson, M.A.; Hendrickson, J.R.; Kronberg, S.L.; Petersen, M.K.; Vermeire, L.T. Seasonal weather influences on yearling beef steer production in C3-dominated Northern Great Plains rangeland. Agric. Ecosyst. Environ. 2014, 183, 110–117. [Google Scholar] [CrossRef]
  10. Reeves, J.L.; Derner, J.D.; Sanderson, M.A.; Petersen, M.K.; Vermeire, L.T.; Hendrickson, J.R.; Kronberg, S.L. Temperature and precipitation affect steer weight gains differentially by stocking rate in northern Mixed-Grass Prairie. Rangel. Ecol. Manag. 2013, 66, 438–444. [Google Scholar] [CrossRef] [Green Version]
  11. Dunn, B.H.; Smart, A.J.; Gates, R.N.; Johnson, P.S.; Beutler, M.K.; Diersen, M.A.; Janssen, L.L. Long-term production and profitability from grazing cattle in the northern mixed grass prairie. Rangel. Ecol. Manag. 2010, 63, 233–242. [Google Scholar] [CrossRef] [Green Version]
  12. Hamilton, T.W.; Ritten, J.P.; Bastian, C.T.; Derner, J.D.; Tanaka, J.A. Economic impacts of increasing seasonal precipitation variation on southeast Wyoming cow-calf enterprises. Rangel. Ecol. Manag. 2016, 69, 465–473. [Google Scholar] [CrossRef]
  13. Irisarri, J.G.; Derner, J.D.; Ritten, J.P.; Peck, D.E. Beef production and net revenue variability from grazing systems on semiarid grasslands of North America. Livest. Sci. 2019, 220, 93–99. [Google Scholar] [CrossRef]
  14. Ritten, J.P.; Frasier, W.M.; Bastian, C.T.; Gray, S.T. Optimal rangeland stocking decisions under stochastic and climate-impacted weather. Am. J. Agric. Econ. 2010, 92, 1242–1255. [Google Scholar] [CrossRef]
  15. Augustine, D.J.; Derner, J.D.; Fernández-Giménez, M.E.; Porensky, L.M.; Wilmer, H.; Briske, D.D. Adaptive, multipaddock rotational grazing management: A ranch-scale assessment of effects on vegetation and livestock performance in semiarid rangeland. Rangel. Ecol. Manag. 2020, 73, 796–810. [Google Scholar] [CrossRef]
  16. Dieguez Cameroni, F.; Fort, H. Towards scientifically based management of extensive livestock farming in terms of ecological predator-prey modeling. Agric. Syst. 2017, 153, 127–137. [Google Scholar] [CrossRef]
  17. Russell, M.L.; Bailey, D.W.; Thomas, M.G.; Witmore, B.K. Grazing distribution and diet quality of Angus, Brangus, and Brahman cows in the Chihuahuan desert. Rangel. Ecol. Manag. 2012, 65, 371–381. [Google Scholar] [CrossRef]
  18. Tolleson, D.R.; Schafer, D.W. Application of fecal near-infrared spectroscopy and nutritional balance software to monitor diet quality and body condition in beef cows grazing Arizona rangeland. J. Anim. Sci. 2014, 92, 349–358. [Google Scholar] [CrossRef]
  19. Augustine, D.J.; Blumenthal, D.M.; Springer, T.L.; Lecain, D.R.; Gunter, S.A.; Derner, J.D. Elevated CO2 induces substantial and persistent declines in forage quality irrespective of warming in mixedgrass prairie. Ecol. Appl. 2018, 28, 721–735. [Google Scholar] [CrossRef]
  20. Gaffney, R.; Porensky, L.M.; Gao, F.; Irisarri, J.G.; Derner, J.D.; Augustine, D.J. Using APAR to predict aboveground plant productivity in semi-arid rangelands: Spatial and temporal relationships differ. Remote Sens. 2018, 10, 1474. [Google Scholar] [CrossRef] [Green Version]
  21. Grigera, G.; Oesterheld, M.; Pacín, F.; Pacin, F. Monitoring forage production for farmers’ decision making. Agric. Syst. 2007, 94, 637–648. [Google Scholar] [CrossRef]
  22. Reeves, M.C.; Moreno, A.L.; Bagne, K.E.; Running, S.W. Estimating climate change effects on net primary production of rangelands in the United States. Clim. Change 2014, 126, 429–442. [Google Scholar] [CrossRef] [Green Version]
  23. Reeves, M.C.; Zhao, M.; Running, S.W. Special Feature: Applications of geospatial techniques applying improved estimates of MODIS productivity to characterize grassland vegetation dynamics. Earth Sci. 2006, 59, 1–10. [Google Scholar]
  24. Reeves, M.C.; Winslow, J.C.; Running, S.W. Mapping weekly rangeland vegetation productivity using MODIS algorithms. J. Range Man 2001, 54, 90–105. [Google Scholar]
  25. Mathis, C. Protein and Energy Supplementation to Beef Cows Grazing New Mexico Rangelands. Cooperative Extension Service Circular 564; College of Agriculture and Home Economics. 2003. Available online: https://aces.nmsu.edu/pubs/_circulars/Circ564.pdf (accessed on 10 January 2022).
  26. Mathis, C.P.; Sawyer, J.E. Nutritional management of grazing beef cows. Vet. Clin. N. Am. Food Anim. Pract. 2007, 23, 1–19. [Google Scholar] [CrossRef] [PubMed]
  27. Heldt, J.S.; Cochran, R.C.; Mathis, C.P.; Woods, B.C.; Olson, K.C.; Titgemeyer, E.C.; Nagaraja, T.G.; Vanzant, E.S.; Johnson, D.E. Effects of level and source of carbohydrate and level of degradable intake protein on intake and digestion of low-quality tallgrass-prairie hay by beef steers. J. Anim. Sci. 1999, 77, 2846–2854. [Google Scholar] [CrossRef]
  28. Mathis, C.P.; Cochran, R.C.; Heldt, J.S.; Woods, B.C.; Abdelgadir, I.E.O.; Olson, K.C.; Titgemeyer, E.C.; Vanzant, E.S. Effects of supplemental degradable intake protein on utilization of medium- to low-quality forages. J. Anim. Sci. 2000, 78, 224–232. [Google Scholar] [CrossRef]
  29. Craine, J.M.; Elmore, A.J.; Olson, K.C.; Tolleson, D. Climate change and cattle nutritional stress. Glob. Change Biol. 2010, 16, 2901–2911. [Google Scholar] [CrossRef]
  30. Craine, J.M.; Elmore, A.; Angerer, J.P. Long-term declines in dietary nutritional quality for North American cattle. Environ. Res. Lett. 2017, 12, 044019. [Google Scholar] [CrossRef] [Green Version]
  31. Starks, P.J.; Zhao, D.; Phillips, W.A.; Coleman, S.W. Development of canopy reflectance algorithms for real-time prediction of bermudagrass pasture biomass and nutritive values. Crop Sci. 2006, 46, 927–934. [Google Scholar] [CrossRef] [Green Version]
  32. Zeng, L.; Chen, C. Using remote sensing to estimate forage biomass and nutrient contents at different growth stages. Biomass Bioenergy 2018, 115, 74–81. [Google Scholar] [CrossRef]
  33. Homolova, L.; Schaepman, M.E.; Lamarque, P.; Clevers, J.G.P.W.; De Bello, F.; Thuiller, W.; Lavorel, S. Comparison of remote sensing and plant trait-based modelling to predict ecosystem services in subalpine grasslands. Ecosphere 2014, 5, 1–29. [Google Scholar] [CrossRef]
  34. Lugassi, R.; Zaady, E.; Goldshleger, N.; Shoshany, M.; Chudnovsky, A. Spatial and temporal monitoring of pasture ecological quality: Sentinel-2-based estimation of crude protein and neutral detergent fiber contents. Remote Sens. 2019, 11, 799. [Google Scholar] [CrossRef] [Green Version]
  35. Ling, B.; Goodin, D.G.; Raynor, E.J.; Joern, A. Hyperspectral analysis of leaf pigments and nutritional elements in tallgrass prairie vegetation. Front. Plant Sci. 2019, 10, 142. [Google Scholar] [CrossRef] [Green Version]
  36. Ferner, J.; Linstädter, A.; Rogass, C.; Südekum, K.H.; Schmidtlein, S. Towards forage resource monitoring in subtropical savanna grasslands: Going multispectral or hyperspectral? Eur. J. Remote Sens. 2021, 54, 364–384. [Google Scholar] [CrossRef]
  37. Jennewein, J.S.; Eitel, J.U.H.; Joly, K.; Long, R.A.; Maguire, A.J.; Vierling, L.A.; Weygint, W. Estimating integrated measures of forage quality for herbivores by fusing optical and structural remote sensing data. Environ. Res. Lett. 2021, 16, 075006. [Google Scholar] [CrossRef]
  38. Watanabe, O.; Wang, S. Comparing MODIS vegetation indices with AVHRR NDVI for monitoring the forage quantity and quality in Inner Mongolia grassland, China. Grassl. Sci. 2005, 51, 33–40. [Google Scholar] [CrossRef]
  39. Ryan, S.J.; Cross, P.C.; Winnie, J.; Hay, C.; Bowers, J.; Getz, W.M. The utility of normalized difference vegetation index for predicting African buffalo forage quality. J. Wildl. Manag. 2012, 76, 1499–1508. [Google Scholar] [CrossRef]
  40. Pringle, M.J.; O’Reagain, P.J.; Stone, G.S.; Carter, J.O.; Orton, T.G.; Bushell, J.J. Using remote sensing to forecast forage quality for cattle in the dry savannas of northeast Australia. Ecol. Indic. 2021, 133, 108426. [Google Scholar] [CrossRef]
  41. Chabalala, Y.; Adam, E.; Oumar, Z.; Ramoelo, A. Exploiting the capabilities of Sentinel-2 and RapidEye for predicting grass nitrogen across different grass communities in a protected area. Appl. Geomat. 2020, 12, 379–395. [Google Scholar] [CrossRef]
  42. Diaz-Solis, H.; Kothmann, M.M.; Grant, W.E.; De Luna-Villarreal, R. Use of irrigated pastures in semi-arid grazinglands: A dynamic model for stocking rate decisions. Agric. Syst. 2006, 88, 316–331. [Google Scholar] [CrossRef]
  43. Díaz-Solis, H.; Kothmann, M.M.; Hamilton, W.T.; Grant, W.E. A simple ecological sustainability simulator (SESS) for stocking rate management on semi-arid grazinglands. Agric. Syst. 2003, 76, 655–680. [Google Scholar] [CrossRef]
  44. Díaz-Solís, H.; Grant, W.E.; Kothmann, M.M.; Teague, W.R.; Díaz-García, J.A. Adaptive management of stocking rates to reduce effects of drought on cow-calf production systems in semi-arid rangelands. Agric. Syst. 2009, 100, 43–50. [Google Scholar] [CrossRef]
  45. Ritten, J.P.; Bastian, C.T.; Frasier, W.M. Economically optimal stocking rates: A bioeconomic grazing model. Rangel. Ecol. Manag. 2010, 63, 407–414. [Google Scholar] [CrossRef]
  46. Torell, L.A.; Murugan, S.; Ramirez, O.A. Economics of flexible versus conservative stocking strategies to manage climate variability risk. Rangel. Ecol. Manag. 2010, 63, 415–425. [Google Scholar] [CrossRef]
  47. Natural Resources Service Conservation (Ed.) Ecological site description for Loamy plains (R067BY002CO). In Ecological Site Description Catalog; USDA: Washington, DC, USA, 2007. Available online: https://edit.jornada.nmsu.edu/catalogs/esd/067B/R067BY002CO (accessed on 10 January 2022).
  48. Natural Resources Service Conservation (Ed.) Ecological site description for Sandy plains (R067BY024CO). In Ecological Site Description Catalog; USDA: Washington, DC, USA, 2007. Available online: https://edit.jornada.nmsu.edu/catalogs/esd/067B/R067BY024CO (accessed on 10 January 2022).
  49. Reynolds, A.Q.; Derner, J.D.; Augustine, D.J.; Porensky, L.M.; Wilmer, H.; Jorns, T.; Briske, D.D.; Scasta, J.D.; Fernández-Giménez, M.E. Ecological sites: Can they be managed to promote livestock production? Rangelands 2019, 41, 239–243. [Google Scholar] [CrossRef]
  50. Gorelick, N.; Hancher, M.; Dixon, M.; Ilyushchenko, S.; Thau, D.; Moore, R. Google Earth Engine: Planetary-scale geospatial analysis for everyone. Remote Sens. Environ. 2017, 202, 18–27. [Google Scholar] [CrossRef]
  51. Irisarri, J.G.N.; Oesterheld, M.; Paruelo, J.M.; Texeira, M.A. Patterns and controls of above-ground net primary production in meadows of Patagonia. A remote sensing approach. J. Veg. Sci. 2012, 23, 114–126. [Google Scholar] [CrossRef]
  52. Pellegrini, P.; Cossani, C.M.; Bella, C.M.D.; Piñeiro, G.; Sadras, V.O.; Oesterheld, M. Simple regression models to estimate light interception in wheat crops with Sentinel-2 and a handheld sensor. Crop Sci. 2020, 60, 1607–1616. [Google Scholar] [CrossRef]
  53. Zanaga, D.; Van De Kerchove, R.; De Keersmaecker, W.; Souverijns, N.; Brockmann, C.; Quast, R.; Wevers, J.; Grosu, A.; Paccini, A.; Vergnaud, S.; et al. ESA WorldCover 10 m 2020 v100 2021. Available online: https://developers.google.com/earth-engine/datasets/catalog/ESA_WorldCover_v100 (accessed on 10 January 2022).
  54. Hart, R.H.; Ashby, M.M. Grazing intensities, vegetation, and heifer gains: 55 years on shortgrass. J. Range Manag. 1998, 51, 392–398. [Google Scholar] [CrossRef] [Green Version]
  55. Irisarri, J.G.N.; Derner, J.D.; Porensky, L.M.; Augustine, D.J.; Reeves, J.L.; Mueller, K.E. Grazing intensity differentially regulates ANPP response to precipitation in North American semiarid grasslands. Ecol. Appl. 2016, 26, 1370–1380. [Google Scholar] [CrossRef] [PubMed] [Green Version]
  56. Porensky, L.M.; Derner, J.D.; Augustine, D.J.; Milchunas, D.G. Plant community composition after 75 yr of sustained grazing intensity treatments in Shortgrass Steppe. Rangel. Ecol. Manag. 2017, 70, 456–464. [Google Scholar] [CrossRef]
  57. Kearney, S.P.; Porensky, L.M.; Augustine, D.J.; Derner, J.D.; Gao, F. Predicting spatial-temporal patterns of diet quality and large herbivore performance using satellite time series. Ecol. Appl. 2021, e2503. [Google Scholar] [CrossRef] [PubMed]
  58. Gitelson, A.A.; Kaufman, Y.J.; Stark, R.; Rundquist, D. Novel algorithms for remote estimation of vegetation fraction. Remote Sens. Environ. 2002, 80, 76–87. [Google Scholar] [CrossRef] [Green Version]
  59. Gitelson, A.; Arkebauer, T.; Viña, A.; Skakun, S.; Inoue, Y. Evaluating plant photosynthetic traits via absorption coefficient in the photosynthetically active radiation region. Remote Sens. Environ. 2021, 258, 11241. [Google Scholar] [CrossRef]
  60. Merzlyak, M.N.; Gitelson, A.A.; Chivkunova, O.B. Non-destructive optical detection of pigment changes during leaf senescence and fruit ripening. Physiol. Plant. 1999, 106, 135–141. [Google Scholar] [CrossRef] [Green Version]
  61. Gitelson, A.A.; Zur, Y.; Chivkunova, O.B.; Merzlyak, M.N. Assessing carotenoid content in plant leaves with reflectance spectroscopy. Ratio 2002, 75, 272–281. [Google Scholar]
  62. Xu, D.; Wang, C.; Chen, J.; Shen, M.; Shen, B.; Yan, R.; Li, Z.; Karnieli, A.; Chen, J.; Yan, Y.; et al. The superiority of the normalized difference phenology index (NDPI) for estimating grassland aboveground fresh biomass. Remote Sens. Environ. 2021, 264, 112578. [Google Scholar] [CrossRef]
  63. Derner, J.D.; Hart, R.H. Grazing-induced modifications to peak standing crop in Northern Mixed-grass Prairie. Rangel. Ecol. Manag. 2007, 60, 270–276. [Google Scholar] [CrossRef]
  64. Lauenroth, W.K.; Sala, O.E. Long-term forage production of North American shortgrass steppe. Ecol. Appl. 1992, 2, 397–403. [Google Scholar] [CrossRef] [Green Version]
  65. Oesterheld, M.; Loreti, J.; Semmartin, M.; Sala, O.E. Inter-annual variation in primary production of a semi-arid grassland related to previous-year production. J. Veg. Sci. 2001, 12, 137. [Google Scholar] [CrossRef]
  66. Polley, H.W.; Briske, D.D.; Morgan, J.A.; Wolter, K.; Bailey, D.W.; Brown, J.R. Climate Change and North American Rangelands: Trends, Projections, and Implications. Rangel. Ecol. Manag. 2013, 66, 493–511. [Google Scholar] [CrossRef]
  67. Joyce, L.A.; Briske, D.D.; Brown, J.R.; Polley, H.W.; McCarl, B.A.; Bailey, D.W. Climate change and North American rangelands: Assessment of mitigation and adaptation strategies. Rangel. Ecol. Manag. 2013, 66, 512–528. [Google Scholar] [CrossRef] [Green Version]
Figure 1. Central Plains Experimental Range (CPER) location in north-eastern Colorado, USA. Each long-term grazing intensity paddock represented 130 ha. The MOD9A1 selected pixels represent approximately 25 ha. Land cover was assessed through the world land cover mapping developed by the European Space Agency through Sentinel 1 and 2 data [53]).
Remotesensing 14 00854 g001
Figure 2. (Left panel): Density plot of CP content from fecal samples obtained from 5 yearling steers grazing Loamy Plains (C4-dominated vegetation), Sandy Plains (C3-dominated vegetation), and mixed (co-dominated C3–C4 vegetation) 130 ha paddocks in shortgrass steppe of north-eastern Colorado, USA. (Right panel): Relationship of crude protein content (CP%) to day of the year (DOY) across the 2015 and 2016 grazing seasons (CP content = 20.19 0.0550DOY; value p < 0.001; R2 = 0.69; n = 115). The dashed line at 8% CP content represents the threshold for individual intake.
Remotesensing 14 00854 g002
Figure 3. Relation between CP content (%) derived from remotely sensed and the observed CP content. Remotely sensed data were obtained from the MODIS-Terra satellite through the MOD09A1 synthetic product using the green (b4) and red (b1) portions of the spectrum. The continuous line represents the fitted model between the observed and predicted values. The dashed line at 8% CP content represents the threshold for individual intake.
Remotesensing 14 00854 g003
Figure 4. (Top panel): Seasonal variation in CP content remotely estimated through MODIS-TERRA, MOD09A1, during the 2000–2021 period, for 130 ha paddocks with three long-term grazing intensities (light, moderate, and heavy) at the Central Plains Experimental Range in north-eastern Colorado, USA. The dashed line at 8% CP content represents the threshold for individual intake. (Lower panel): Seasonal dynamics of the risk of forage CP content being ≤8%for each of the three grazing intensity treatments. Risk level was assessed as the percentage of years during 2000–2021 where CP content did not reach the threshold value of 8% for the day of year during the grazing season. Arrows on the bottom part represent the traditional start (DOY 135) and end (DOY 275) day that cattle graze on these pastures. The shaded region represents the critical period to end the grazing season.
Remotesensing 14 00854 g004
Figure 5. Temporal trend in the day of the year (DOY) when forage CP content estimated by the remote sensing model fell beneath the 8% threshold. The solid line represents the fitted linear regression, with dashed lines depicting the 95% confidence interval (R2: 0.18; p-value < 0.001; n: 60).
Remotesensing 14 00854 g005
Publisher’s Note: MDPI stays neutral with regard to jurisdictional claims in published maps and institutional affiliations.

