1. Introduction
Mangroves are essential wetland ecosystems with the characteristics of both terrestrial and marine ecosystems, widely distributed in the intertidal areas of tropical and subtropical regions of the world [
1,
2]. They have significant social, economic, and ecological values and provide a wide range of ecosystem services, such as water purification, shoreline stabilization, reducing coastal erosion, and maintaining biodiversity [
3,
4,
5]. However, due to unreasonable economic development and human overexploitation in coastal areas, the area of mangroves in China has been drastically decreased since the 1950s [
6]. The remaining mangroves are also under pressure from climate change and human activities, such as sea-level rise, biological invasion, seawall construction, and aquaculture [
7,
8,
9]. Irreplaceable in ecological and socio-economic services, mangroves have become important targets for wetland conservation and biodiversity protection in China.
Establishing nature reserves is an effective measure to protect and manage mangrove resources [
10]. At present, China has nearly 40 nature reserves with mangroves as the primary protection objects established by the state or local governments. Approximately 64% of mangroves are distributed within the nature reserves, and the coverage of the reserves is still expanding [
11]. However, mangrove reserves in China started late and lacked systematic planning and design and management experience. Reserves mainly adopted a “rescuing protection” compulsory conservation policy, and the evaluation of its effectiveness was not given sufficient attention [
12]. There are four different and complementary aspects in protected areas effectiveness evaluation, i.e., coverage [
13,
14], degree of detailed monitoring [
15,
16], management effectiveness [
17,
18], and conservation effectiveness [
19,
20]. Specifically, the coverage is an evaluation based on the scope of protection, the degree of detailed monitoring is an evaluation based on the monitoring method, the management effectiveness is an evaluation based on the management behavior, and the conservation effectiveness is an evaluation based on the protection objects of the protected areas. Previous studies on the effectiveness of reserves paid more attention to the evaluation of management effectiveness. According to preliminary statistics, there are about fifty evaluation methods for management effectiveness, which are mainly conducted through literature research, questionnaire surveys, interviews with managers, or expert scoring [
17,
21]. However, few studies were conducted to evaluate the conservation effectiveness of reserves, especially for mangrove reserves.
Remote sensing has been widely used in the multi-scale and long time-series monitoring of the ecological environment and natural resources, especially for inaccessible mangrove ecosystems [
22,
23,
24]. Due to the characteristics of timely observations and large-area coverage, remote sensing also provides new perspectives and methods for the evaluation of conservation effectiveness [
25,
26]. A common method is to analyze the changes in the area indicators related to protected objects based on the land cover data obtained from remote sensing monitoring. For example, Wang et al. [
27] tested the conservation effectiveness of 20 reserves in Hainan Island by comparing the changes in forest area in locations within the reserves, adjacent to the reserves, and far outside of the reserves. Jia et al. [
28] analyzed the dynamics of mangrove areas in seven national reserves before and after the establishment of the reserves. The results showed that China’s mangrove forest conservation effectiveness is better than other Asian countries, and the mangrove area increased immediately after the reserves were established. Porter Bolland et al. [
29] compared the annual deforestation rates of community-managed forests and protected forests and found that community-managed forests presented lower annual deforestation rates and higher conservation effectiveness than protected forests. Other studies also evaluated the conservation effectiveness from the perspective of vegetation productivity based on vegetation index or net primary productivity (NPP) data retrieved from remote sensing. For example, Tang et al. [
30] used the normalized difference vegetation index (NDVI) to measure variations in plant productivity in the core, boundary, and surroundings of 1015 reserves over a 25-year period. The results suggested that reserves achieved good conservation effectiveness in protecting vegetation productivity. Zhang et al. [
31] evaluated the effectiveness of 11 reserves in protecting the ecological environment by analyzing the differences of the NPP before and after the establishment of the reserves and inside and outside reserves.
Besides the area and vegetation productivity indicators, some researchers also evaluated the conservation effectiveness from a landscape perspective based on landscape metrics. Landscape metrics can objectively represent the spatial structure, configuration, and function of the landscape from different levels and perspectives in a quantitative manner, which has been proven to be a reliable indicator for evaluating the conservation effectiveness of reserves [
32,
33]. For example, Jia et al. [
34] analyzed the dynamics of six landscape indices in the Futian reserve and the Mai Po reserve. The results showed that although the integrity and connectivity of mangrove patches improved in both reserves, the integrity of mangrove patches in Mai Po reserve was always higher than that in the Futian reserve, which indicated higher conservation effectiveness of Mai Po reserve. Lu et al. [
35] used eighteen landscape metrics to construct an evaluation index system and evaluated the conservation effectiveness of five national wetland nature reserves in the Songnen Plain based on an information entropy model. They found that the natural wetland area of each reserve declined continuously during the study period, and the conservation effectiveness also showed a decreasing trend. In general, the effectiveness evaluation based on landscape metrics is easier to analyze, compare, and monitor than other qualitative methods. The diversity of landscape metrics (e.g., number, area, shape, distance, and connectivity) also makes the evaluation results more comprehensive and credible [
36]. Although the methods mentioned above have been widely used and recognized, previous studies on the conservation effectiveness of mangrove reserves in China mainly focused on reserves at local scales, which were insufficient to understand the protection status of mangrove resources in China [
37]. Therefore, it is of great practical significance and scientific value to evaluate the conservation effectiveness of mangrove reserves at a national scale, which can contribute to promoting the restoration of mangrove resources and strengthening the management of the reserves.
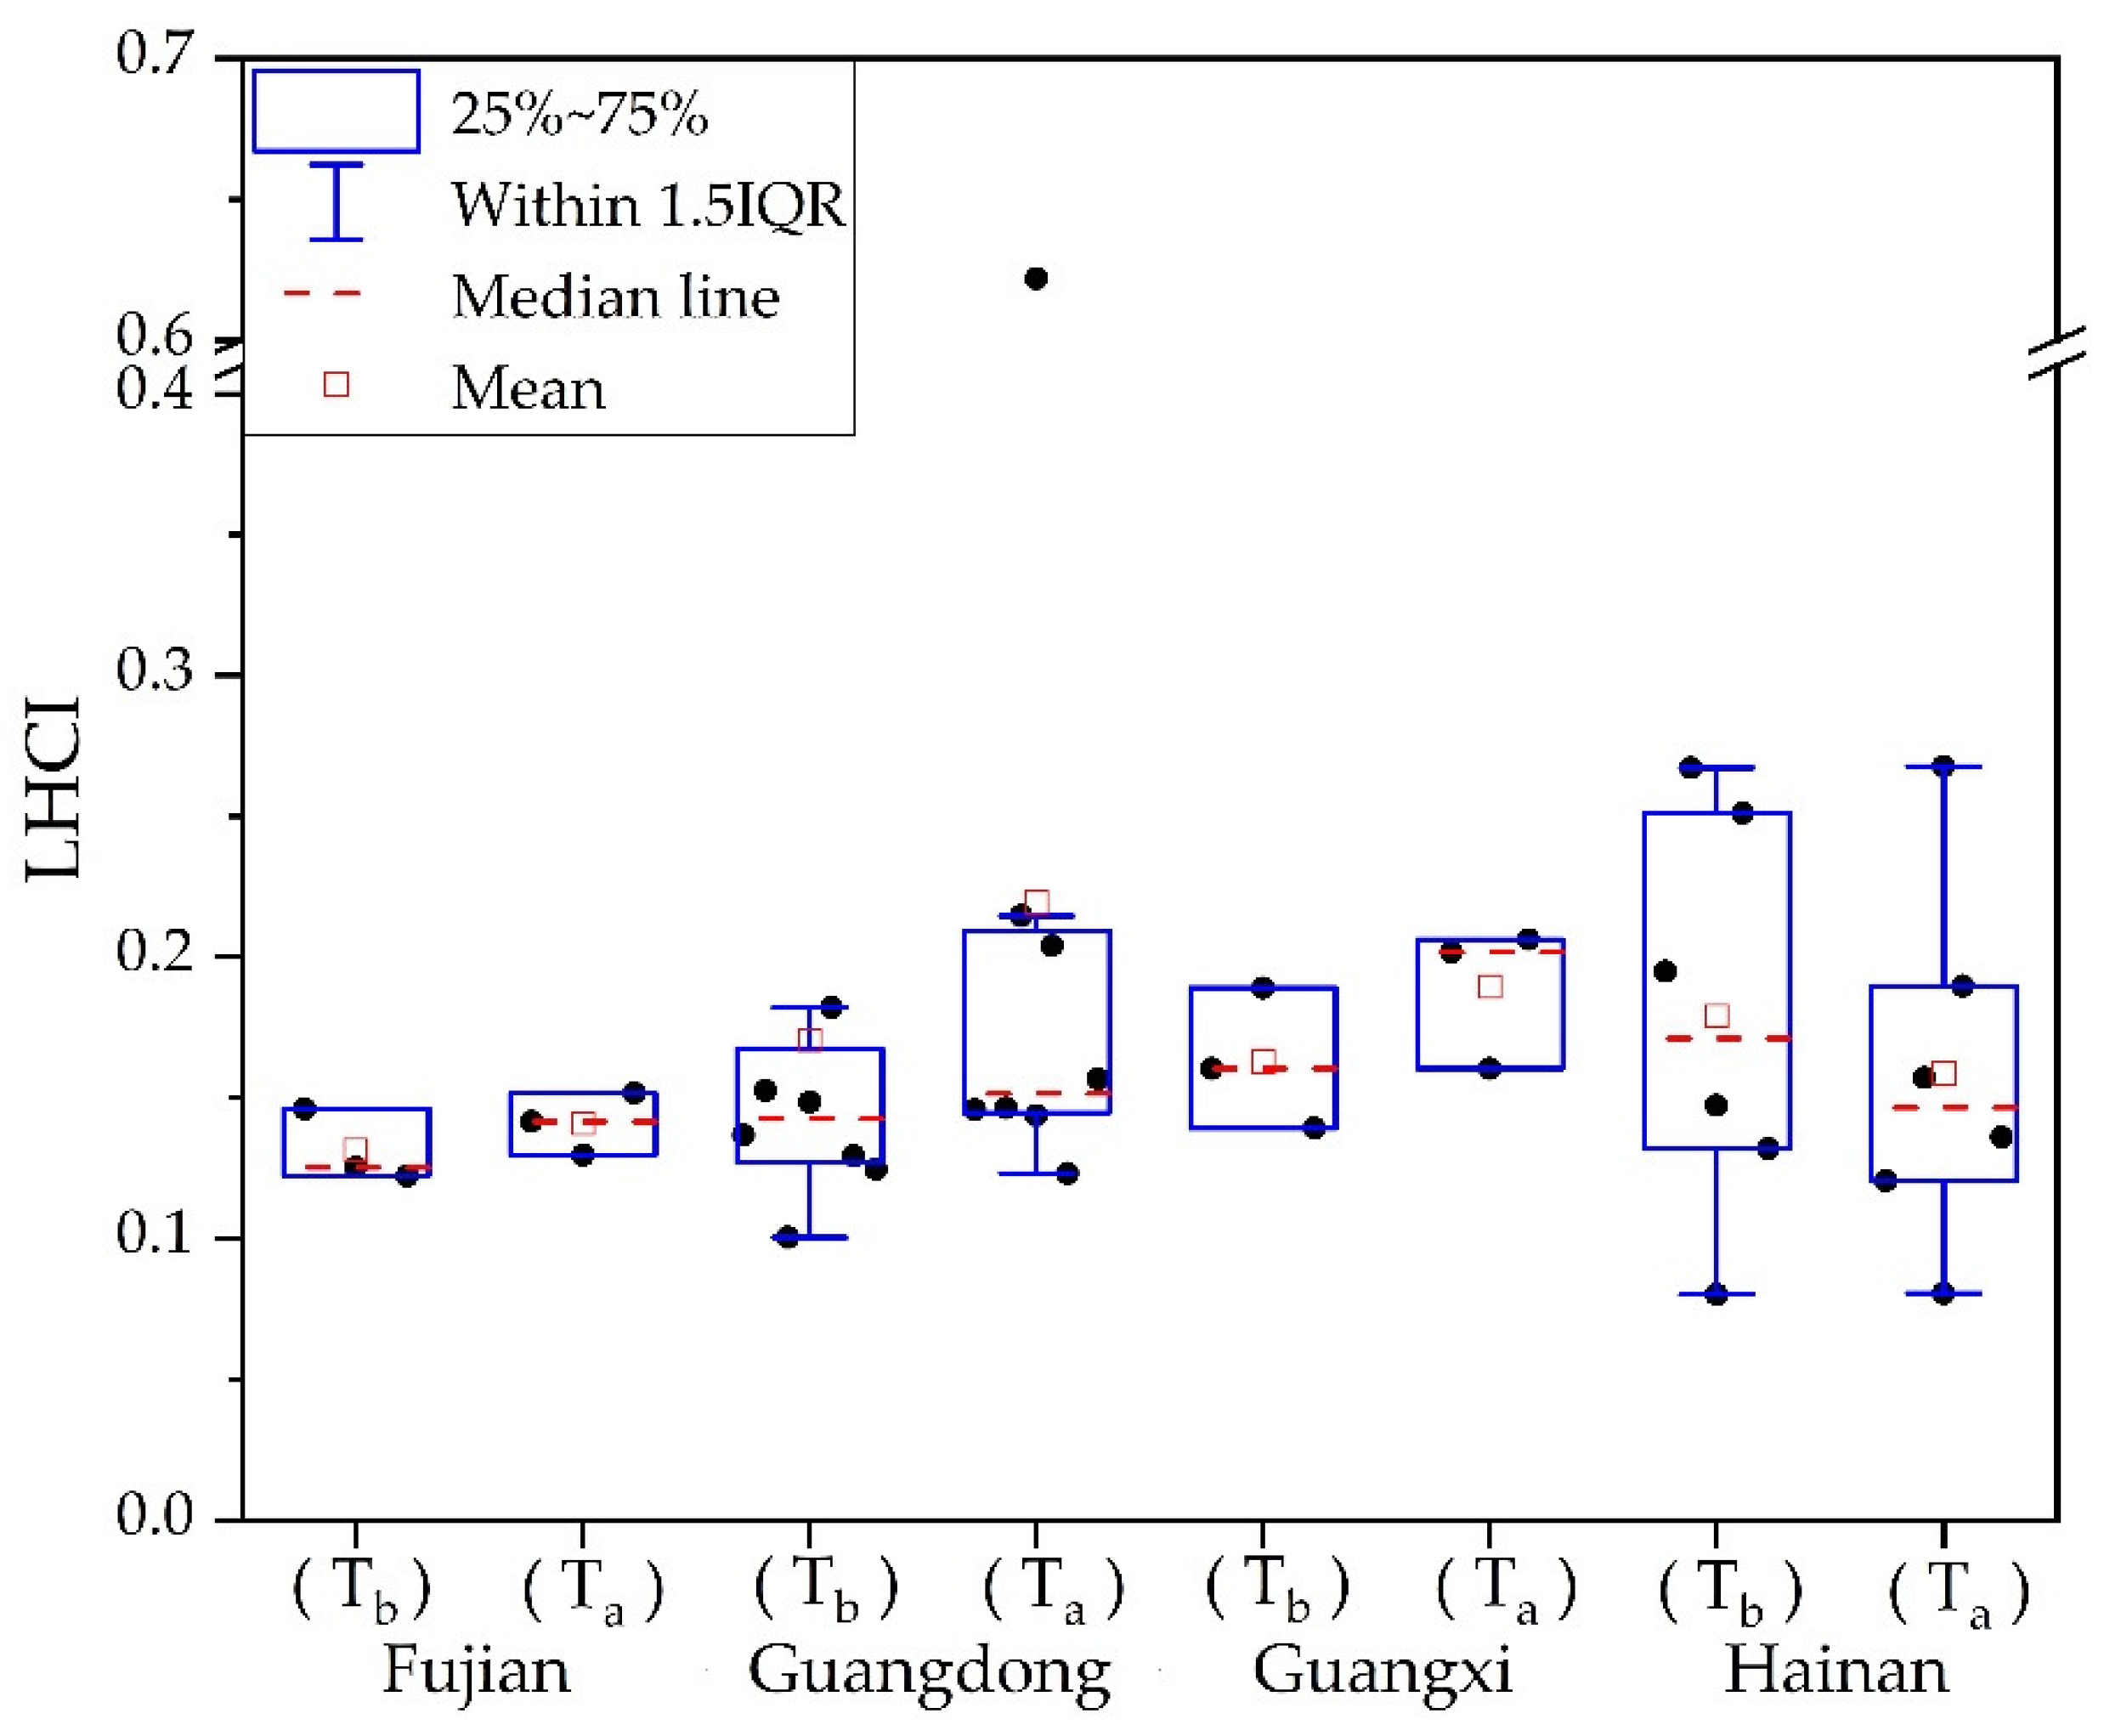
In this study, we constructed an evaluation index system for landscape health and proposed a landscape health composite index (LHCI) to characterize the landscape health status of mangroves. Based on China’s mangrove distribution dataset with high classification accuracy from 1978 to 2018, we analyzed the dynamics of mangrove landscape health status in 24 representative reserves and evaluated the conservation effectiveness from the perspective of landscape health. To the best of our knowledge, this is the first national-scale evaluation of the conservation effectiveness of mangrove reserves. The results can provide references for the scientific management and adequate protection of mangroves in China.
4. Discussion
As the ecological and socio-economic functions of mangroves are increasingly valued in China, the government has issued a series of laws and regulations to protect mangroves. The number of mangrove reserves is increasing, and about 64% of mangroves have been protected [
11]. However, the quantitative enhancement of mangrove reserves does not always guarantee qualitative improvement [
57]. The conservation effectiveness evaluation is necessary to enhance the conservation level of mangrove reserves and promote the restoration of mangrove resources.
Previous studies based on remote sensing mainly focused on the analysis and evaluation of the conservation effects of mangrove reserves from the perspective of spatial-temporal changes in mangroves, such as the research carried out in the Zhanjiang reserve [
58], Qinglan reserve [
59], Quanzhou Bay reserve [
56], and Zhangjiang Estuary [
60]. There is no doubt that the increase in the area of mangroves can indicate the conservation effects of reserves. The maintenance of mangrove cover is also an essential guarantee for preserving the integrity and biodiversity of mangrove ecosystems [
61]. However, the mangrove area is only one indicator to evaluate conservation effectiveness [
29]. If there is insufficient knowledge of the quality and spatial arrangement of mangrove habitat, the area indicator alone is not adequate to guide the implementation of conservation actions. Though measuring and understanding changes in mangroves is an essential step in developing conservation policies and identifying conservation priorities, other indicators of habitat health, such as connectivity and fragmentation, are also critical indicators for conservation effectiveness evaluation [
49,
62]. Therefore, it is more comprehensive and reliable to evaluate the conservation effectiveness from the perspective of landscape pattern change instead of simply considering the area change.
Different from previous studies, our analysis of changes in landscape metrics was not conducted independently [
63,
64,
65]. Independent analysis of landscape metrics is feasible for evaluating the conservation effectiveness of a few reserves [
34]. When the number of reserves to be evaluated is large, or the changes in landscape metrics are complex, it may be difficult to judge which reserve is more effective in protecting mangroves. For example, AREA_MN and PD may increase simultaneously (by different amplitudes) over a certain period. However, as pointed out in
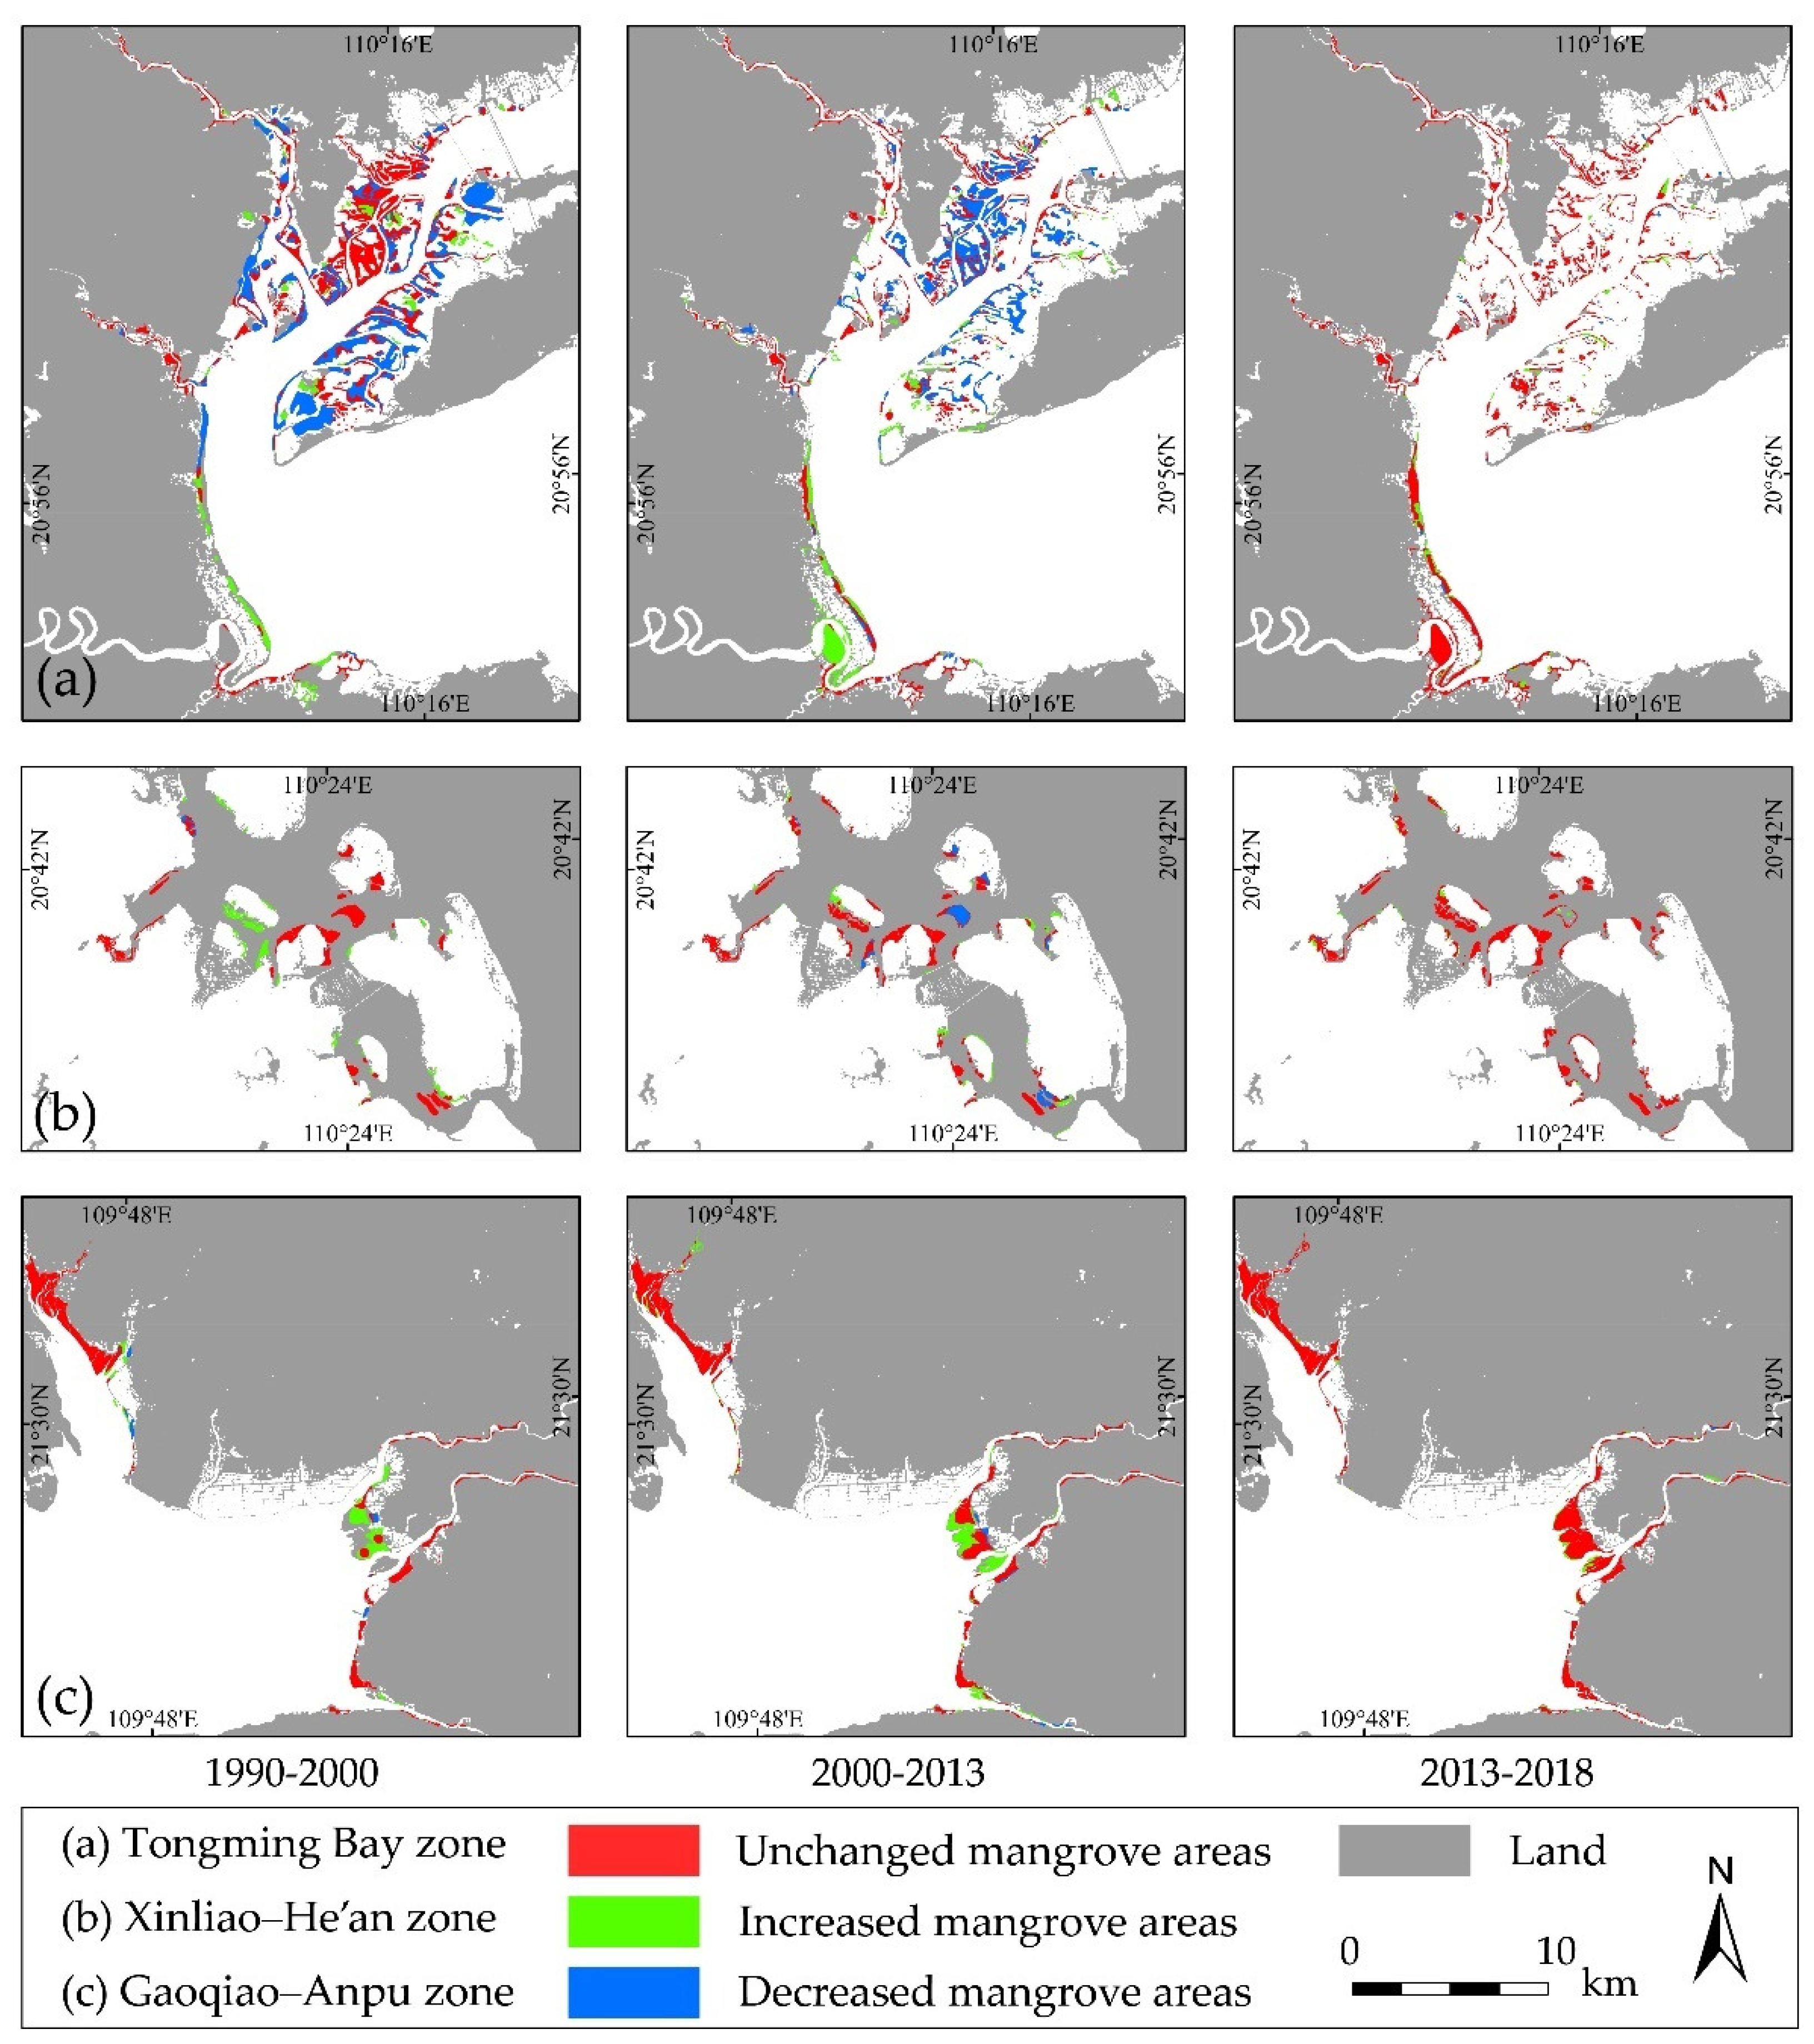
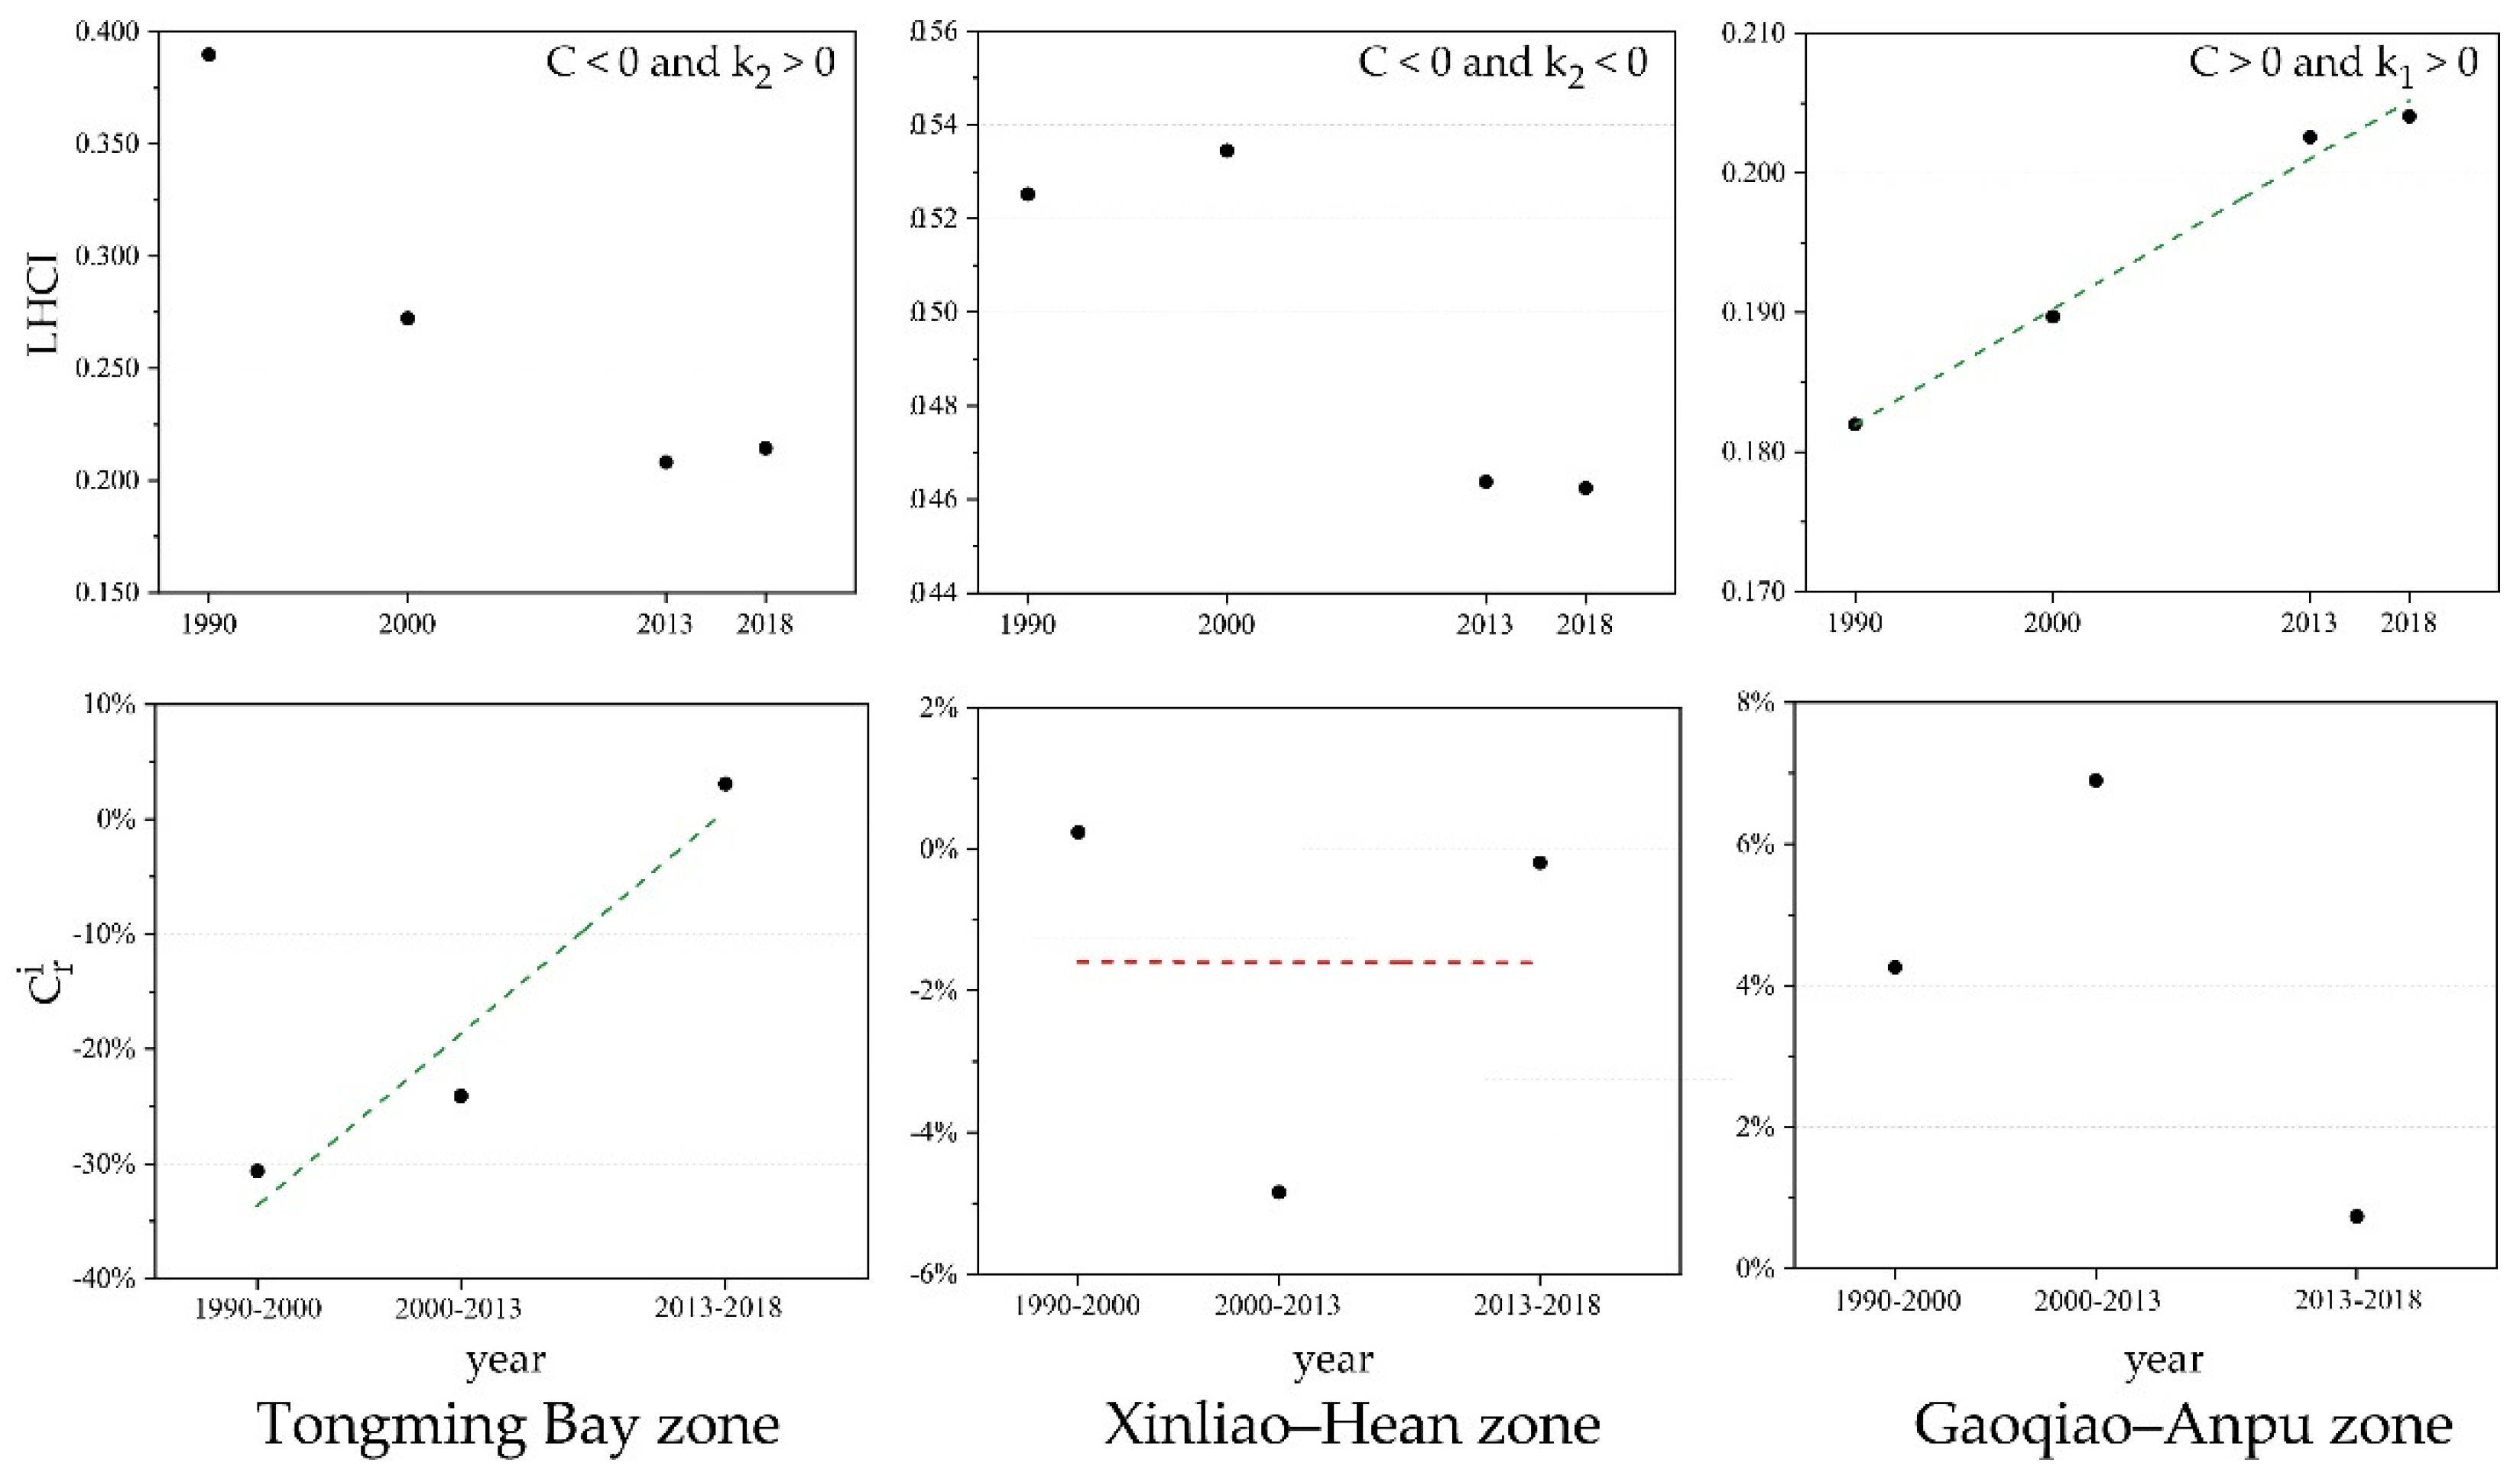
Section 2.3.1, one is a positive index, and the other is a negative index. Therefore, we comprehensively considered the ecological significance of different landscape metrics by establishing the LHCI. This measure is reasonable because one or a class of landscape metrics only characterizes one aspect of the landscape pattern. The detailed analysis of the temporal and spatial evolution of the mangrove landscape pattern in three zones of the Zhanjiang reserve also verified the reliability of the evaluation method based on the LHCI. On the other hand, as far as the research scale is concerned, there is still a lack of specialized research on the conservation effectiveness evaluation of mangrove reserves at the national scale in China. Zheng et al. [
66] and Jia et al. [
28] have conducted a national-scale evaluation of the conservation effectiveness of mangrove reserves, which only included reserves at the national level. Zheng et al. [
66] evaluated the conservation effectiveness of China’s national wetland reserves from three aspects: conservation value, wetland changes, and functional zoning adjustment. Although the evaluation index system in their study was comprehensive, the difficulty of collecting reserves database (e.g., environmental data, protection value data, species data) limited the promotion and application of the method. Jia et al. [
28] analyzed the conservation effectiveness of national mangrove reserves based on the changes in mangrove forests between 1973 and 2015. However, as only the area was considered, the information provided by the research results was not exhaustive.
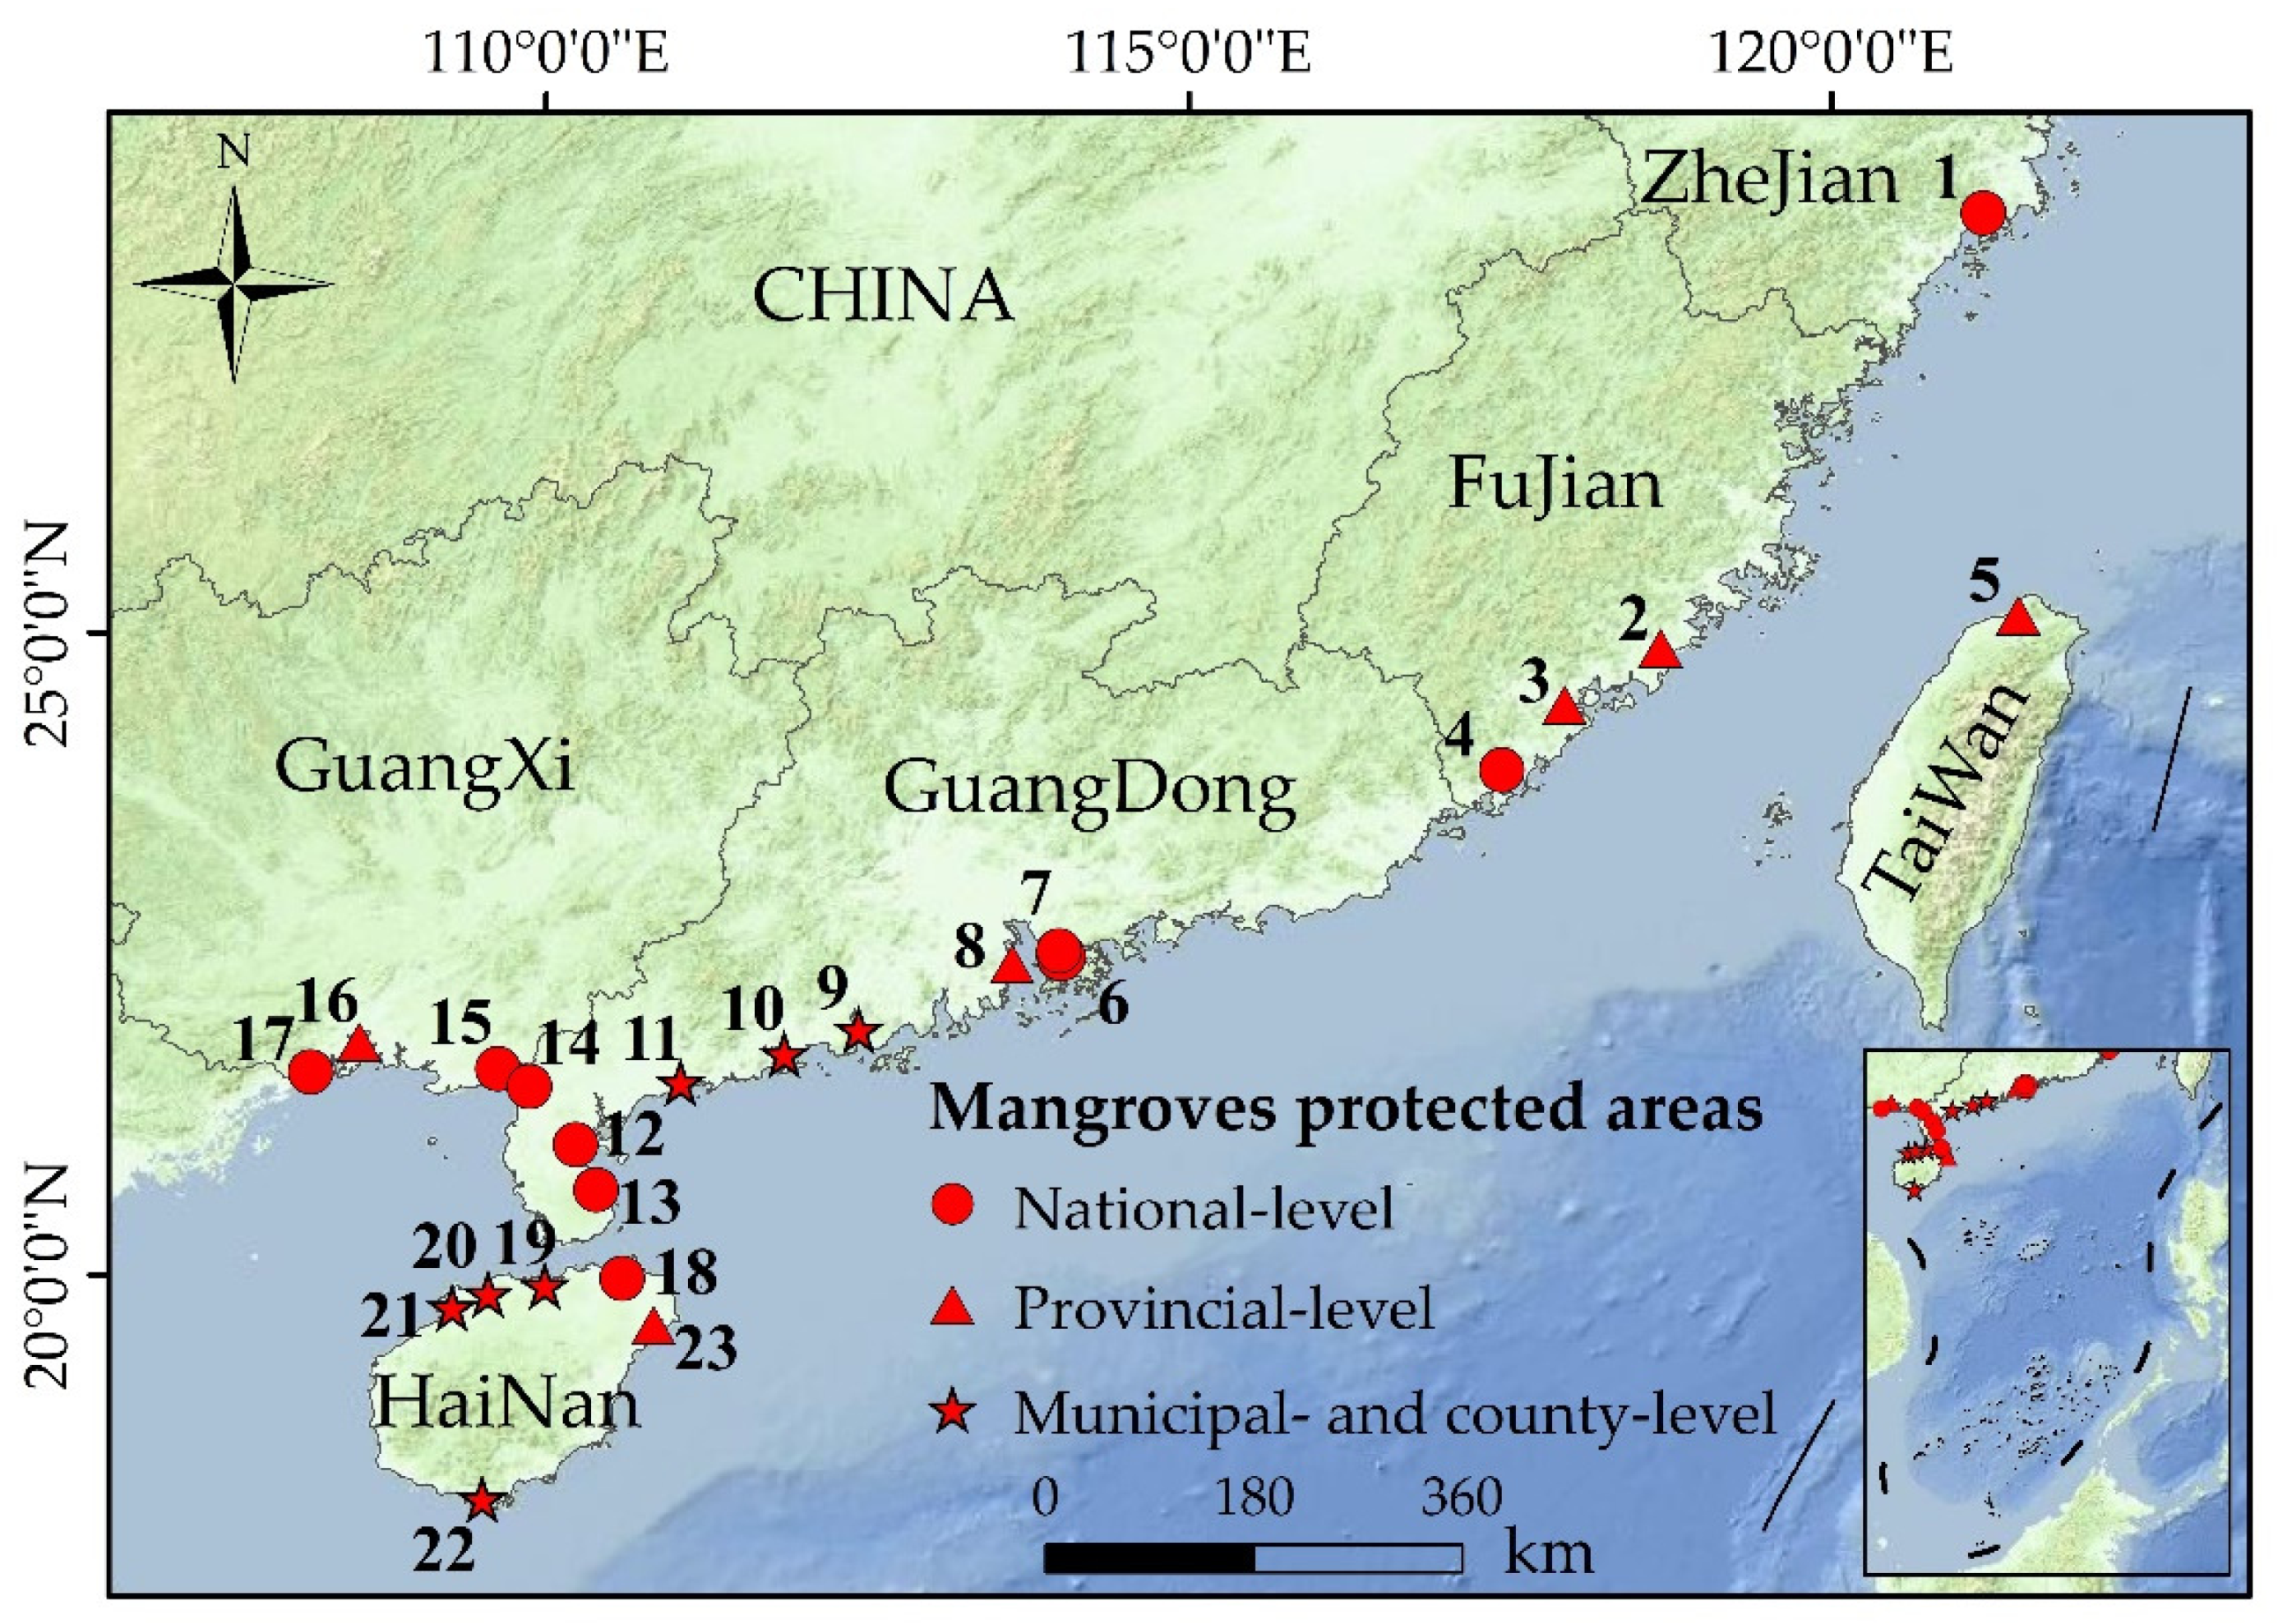
In this study, the research objects covered mangrove reserves at all levels (national, provincial, municipal, and county levels), and the study area covered the main distribution areas of mangroves in China (six coastal provinces and one special administrative region). The comprehensive evaluation results obtained from the perspective of landscape health can provide a practical reference for the construction and management of mangrove reserves and the formulation and adjustment of protection policies. For those good reserves, we suggest that long-term protection plans should be formulated, and more reasonable and targeted protection measures should be developed to consolidate and improve conservation effectiveness, such as conducting field surveys of critical mangrove habitats and increasing the frequency of remote sensing monitoring. For those ordinary reserves, we suggest that more investment should be increased to improve conservation effectiveness as soon as possible, carrying out mangrove species introduction projects and implementing replantation and afforestation programs.
However, there are still limitations in remote sensing-based conservation evaluation. First, a time-series mangrove distribution dataset is necessary for remote sensing-based evaluation methods, but it is difficult to produce unbiased maps due to differences in the raw images used in the mapping process (e.g., satellite sensors, image resolutions). Although the dataset can be converted to a consistent spatial resolution, the conversion process can also generate errors. In addition, the change of spatial resolution (pixel size) often affects landscape metrics. On the other hand, large-scale mangrove afforestation is a primary conservation measure in China [
67]. For example, in May 2017, the State Forestry Administration and the National Development and Reform Commission released the Planning of Constructing National Coastal Shelter Forests (2016–2025). In this plan, mangrove reforestation was listed as a critical project, aiming to plant 48,650 ha mangroves in 62 counties. Nevertheless, mangroves planted in most restoration projects usually consisted of only a single species (e.g.,
Sonneratia apetala), which may reduce regional biodiversity. Previous studies have demonstrated the great potential of mapping the spatial distribution of mangrove species based on satellite imagery [
68,
69,
70]. Future research should give some consideration to species diversity to further improve the evaluation of conservation effectiveness based on remote sensing.
5. Conclusions
This study constructed an evaluation index system for landscape health and proposed a landscape health composite index (LHCI) to characterize the landscape health status of mangroves. Using a long time-series China’s mangrove distribution dataset in the past 40 years, the conservation effectiveness of mangrove reserves in China was evaluated by analyzing the dynamics of mangrove area and mangrove landscape health status before and after the establishment of the reserves.
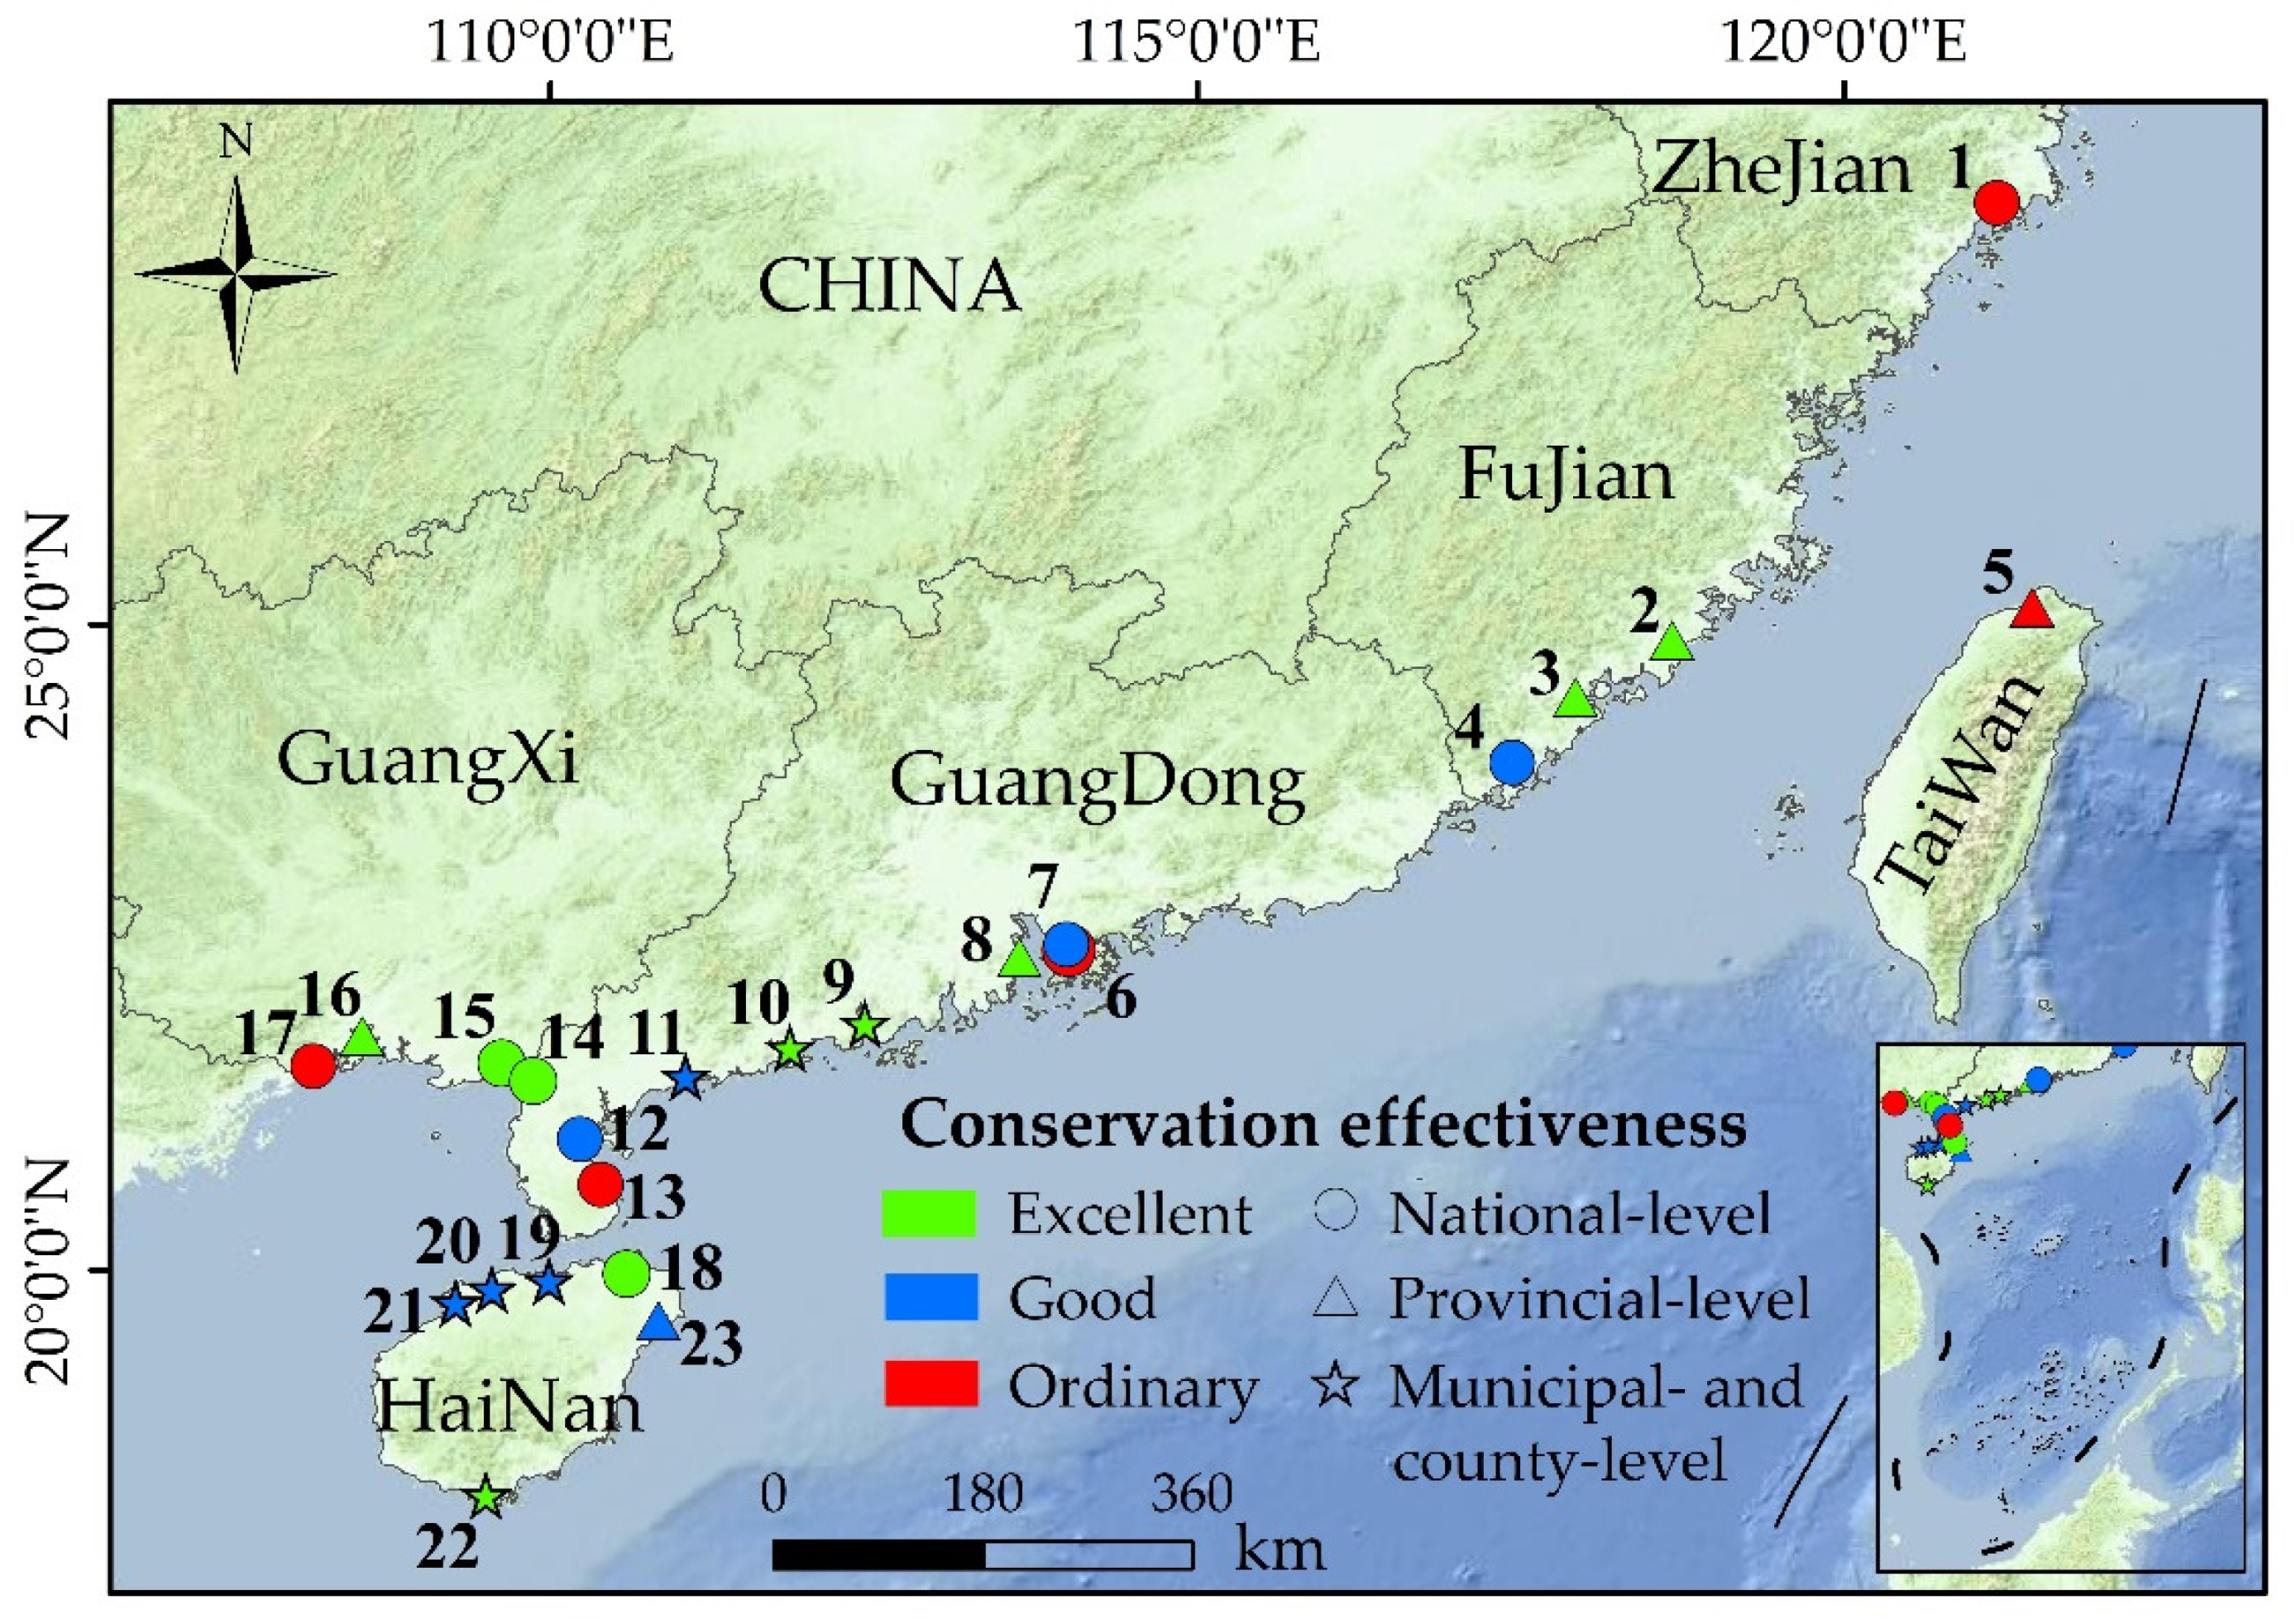
The dynamics of mangrove areas show that the mangrove area in 83% of the reserves increased after the establishment of reserves. In addition, the increase in mangrove area in provincial-level, municipal-level, and county-level reserves was higher than that in national-level reserves, and the most significant increase in mangrove area was in Guangxi, followed by Fujian and Hong Kong. The evaluation results show that reserves protected mangroves effectively in China, with 43% of the reserves significantly improving the landscape health status of mangroves and 35% of the reserves maintaining good mangrove landscape health status. The most effective reserves protecting mangroves were the Qi’ao Island reserve, Maowei Gulf reserve, and Enping reserve. Moreover, the conservation effectiveness of provincial-, municipal- and county-level reserves was more significant than the national-level reserves, with excellent reserves accounting for 66% and 57%, respectively. The reserves in Guangxi, Guangdong, and Fujian Provinces showed more significant protection effects, with the proportion of excellent reserves at 50% and above. Although there are limitations, this study nonetheless provides a sound evaluation to understand the conservation effectiveness of mangrove reserves, which can also be used as a guide for conservation policymaking and scientific management of reserves.


 ,
, 


