Article

Quantitative Evaluation of Gully Erosion Using Multitemporal UAV Data in the Southern Black Soil Region of Northeast China: A Case Study

1
Institute of Loess Plateau, Shanxi University, Taiyuan 030006, China
2
Northeast Institute of Geography and Agroecology, Chinese Academy of Sciences, Changchun 130102, China
*
Author to whom correspondence should be addressed.
Submission received: 16 February 2022 / Revised: 13 March 2022 / Accepted: 15 March 2022 / Published: 18 March 2022

Abstract

:
The black soil region of northeast China is experiencing severe gully erosion. The lack of periodic, high-resolution, short–medium-term, annual, and seasonal observations considerably limit the comprehensive understanding of the processes and mechanisms of gully erosion caused by multiple forces at the watershed scale. Therefore, in this study, we periodically monitored the geomorphic, morphological, and volume changes of a stabilized gully both annually and seasonally in a small agricultural watershed (6 ha) in the southern black soil region in northeast China based on the centimeter-level resolution of unmanned aerial vehicle (UAV)-derived orthoimages and digital terrain models (DTMs) from 2015 to 2020. Compared with submeter-resolution satellite images, the multitemporal UAV data exhibited strong adaptability and various advantages for the assessment of short–medium-term (≤5 years) gully erosion rates in this region. The results demonstrated that the gully has an actively retreating headcut that was always the main source of sediment yield. The linear, areal, and volumetric gully headcut retreat (GHR) rates were 0.74 m year−1, 7.29 m2 year−1, and 9.66 m3 year−1, respectively. GHR in the rainy season accounted for 94.62% of the annual linear erosion and 87.64% of the areal erosion. In particular, sidewall collapse and gully head expansion dominated in the early rainy season, which accounted for 66.67% of the annual linear erosion and 49% of the areal erosion. Our results provide high-resolution orthoimages and a DTM time series produced by a UAV to evaluate short–medium-term (5 years) GHR rate and quantify the contribution of freeze–thaw processes, snowmelt, and rainfall to gully erosion in the region. The findings contribute to understanding the gully erosion processes induced by multiple forces in the southern black soil region of northeast China.

1. Introduction

Gully erosion, as one of the most destructive types of water erosion, results in a large amount of soil loss and infrastructure destruction and has negative hydrological impacts on watershed functions, leading to increased runoff and sediment connectivity in the landscape. These effects increase the risk of mountain floods [1,2,3]. The presence of a gully typically indicates accelerated soil erosion, which is a serious form of land degradation. Therefore, gullies can be considered the most important indicator of land degradation [3]. Gully erosion is a dangerous geomorphological process that can seriously threaten life and property and is the most important geomorphic natural hazard in some regions worldwide [4]. The black soil region of northeast China is the major commercial grain production base in China. This region has suffered severe soil erosion due to mass reclamation over the last 100 years [5]. As the heart of the region, the typical black soil area has suffered intensive gully erosion, which has mostly occurred on sloping farmland [6]. The slope length of the sloping farmland is mostly between 300 and 500 m in this region [7]. The special climate, having four distinctive seasons, leads to seasonal fluctuations in gully erosion induced by multiple forces, including freeze–thaw cycles, snow melting, and rainfall. How to monitor and understand gully erosion and its changes under the multiple forces, at the sloping farmland scale or small watershed scale, is one of the key issues for soil conservation and land management in this region [7]. In particular, the repeated exact measurement of the spatial patterns of erosion and deposition within the gully system is necessary to quantify and understand gully erosion processes. Currently, there is a lack of continuous periodic observations with a high spatial and temporal resolution for gully erosion to obtain the erosion rates and the spatial distribution of erosion/deposition, particularly at the watershed scale [8].
Continuous monitoring of gully erosion is a crucial step in understanding the dynamics of gully erosion and its prevention and control [9]. The conventional ground-based measurement methods, such as tapes [10], microtopographic profilers [11], total stations [12], pins [13], and differential GPS [14], are time-consuming and labor-intensive in high-accuracy field surveys. Terrestrial laser scanning (TLS) technology, used for monitoring and quantifying gully morphology change over time with subcentimeter positional accuracies, has matured considerably [15]; however, it requires expensive equipment and more expertise and is higher in cost. Ground-based monitoring methods are typically applicable on small scales and for short-term monitoring [14,16]. However, on larger temporal and spatial scales, visual and object-oriented analyses of high-resolution satellite remote sensing images have been used to quantify temporal changes in various gully planar morphological parameters [17,18,19]. Furthermore, classical aerial optical photography has been effectively employed for estimating the three-dimensional (i.e., volumetric) changes in gullies with stereo image pairs [20,21]. However, meter- or decimeter-level satellite images and aerial photographs do not allow for a comprehensive analysis [22,23]. To maximize the resolution of remote sensing images, various low-altitude remote sensing platforms, such as hot-air balloons [24], kites, and blimps [25], have been built. However, these platforms have poor stability.
Compared with the above labor-intensive field measurements and satellite and aircraft remote sensing techniques, unmanned aerial vehicle (UAV) remote sensing provides advantages such as low cost, automation, flexible system, simple operation with convenient take-offs and landings, fast image acquisition speed, and high ground resolution [26]. Simultaneous advances in computer vision and photogrammetric techniques (named structure from motion (SfM)) have enabled the fast and automatic 3D reconstruction from 2D pictures using only consumer-grade cameras that require less expertise [27]. Various authors have applied a combination of advanced photogrammetry and UAVs to monitor gully erosion using UAV-derived orthoimages, digital surface/terrain models (DSMs/DTMs), point clouds, and 3D models [28,29,30,31]. Various studies also demonstrated that SfM photogrammetry can deliver data quality and resolution comparable with those of LiDAR but require cheaper and lighter equipment [12,32,33,34,35]. Moreover, through the consistency among the high-resolution UAV-derived DEMs in terms of relief, the UAV technique showed a high level of flexibility and robustness at the watershed scale where other methods are too destructive, expensive, or time consuming [8]. UAV remote sensing technology has the potential for reducing the existing gap between field- and satellite-scale resolution [22].
Previous studies on the gully erosion rates in the typical black soil area of northeast China focused on its northern and central zones, located in the rolling hills between Songnen Plain, Da Hinggan Mountains, and Xiao Hinggan Mountains [16,36,37,38]. However, little information is available on the gully erosion rates in the southern zone located in the hills between the Songnen Plain and Changbai Mountain. Moreover, previous research primarily focused on how individual erosional forces influence gully erosion [39,40,41,42,43]. The lack of short–medium-term, annual, seasonal, and periodic observations limits the comprehensive understanding of the multiple forces and mechanisms of gully erosion and the quantification of the contribution of these forces to gully erosion [7].
Thus, in this study, selecting a typical gully system located in a small agricultural watershed in the southern area black soil region of northeast China, and using multitemporal UAV data, we aimed to (1) establish a technique chain to obtain the orthoimages and DTMs time series with centimeter-level resolution; (2) quantitatively monitor annual and seasonal gully changes over a five-year interval; and (3) evaluate headcut retreat rates and quantify the contribution of freeze–thaw cycles, snowmelt, and rainfall to gully erosion.

2. Materials and Methods
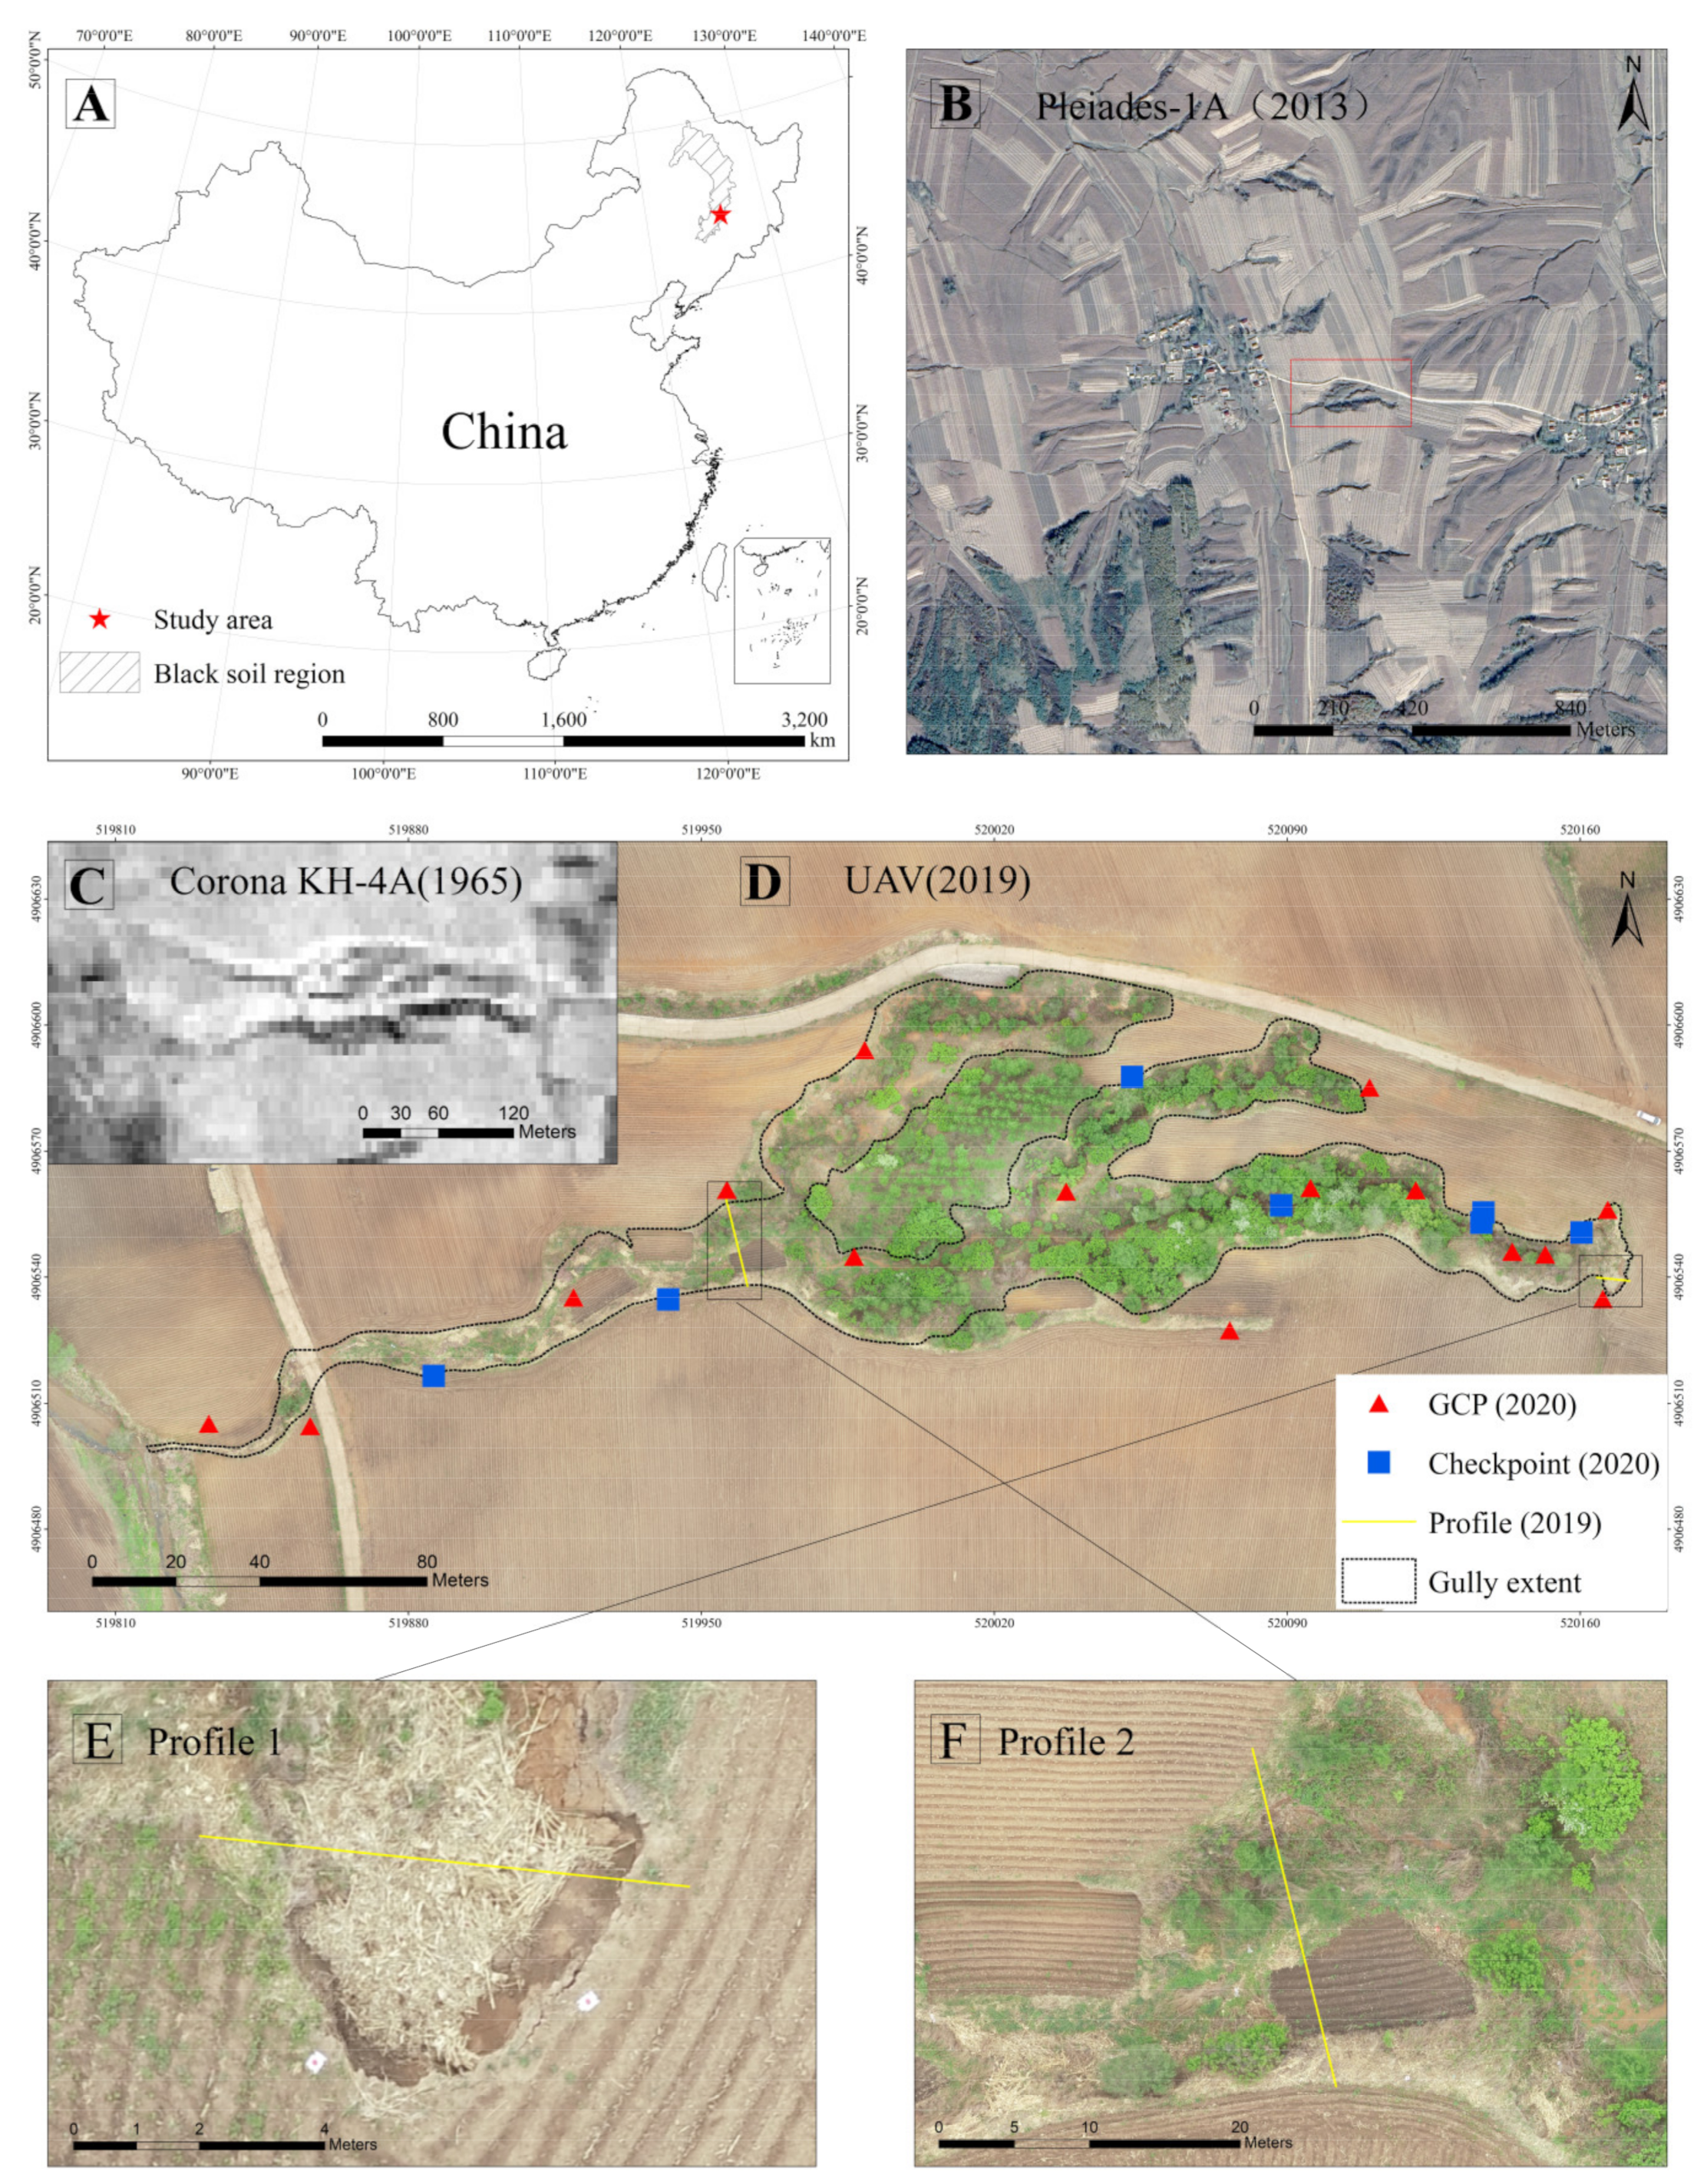
2.1. Study Area

The study site is located in a small agricultural watershed of the Sancha River basin in the Jiutai District of Jilin Province, which is situated at the southeastern edge of the black soil region in northeast China (Figure 1A). This area is located in the hills between Changbai Mountain and the Song-Liao Plain, where the terrain undulation is remarkable, and the area is covered by black, meadow, albic, and dark brown soils. Geological structure of study area belongs to transitional zone of subsidence zone in the second uplift belt of Neocathaysian system. Dominant lithology of bedrock are siltstone, silty mudstone, and feldspar quartz sandstone. The Sancha River basin has a mosaic of a land cover comprising 66.2% farmland, 26.4% forest, 2.0% grassland, 2.9% water area, and 2.5% road and housing construction area. Farmland is the primary land use. The study area has a continental climate with an annual temperature of 5.3 °C and annual precipitation of 568 mm. During the study period (2015–2020), the average annual rainfall was 719 mm and the average annual snowfall was 30 mm. The mean annual maximum frost depth reaches 130cm. Because of the soil properties, land cover characteristics, and precipitation behavior, gully erosion occurs widely throughout this area (Figure 1B). The gully density of the Sancha River basin is 1.37 km/km2, and 56% of the total area of the gullies is covered by vegetation [23].
In this area, the winters are cold, having an average monthly temperature of −16.3 °C; however, summers are hot, having an average monthly temperature of 23.3 °C. The 457 mm of precipitation that falls between June and October accounts for 80.33% of the year, and therefore, we defined this period as the rainy season and the other months as winter–spring, during which the monthly average temperature below 0 °C occurs from November to March, followed by freeze–thaw action and snowmelt. This site offers the opportunity to estimate the seasonal variations in gully erosion.
The small agricultural watershed covers 6 ha and the elevation ranged from 227.20 to 267.22 m (see Section 3.2.1). For observation, we selected a ramified gully system. The monitored gully is located in east-to-west sloping farmland and near a road. The historical satellite image shows that the gully has existed, and the surrounding area has been reclaimed, since 1965 (Figure 1C). The slopes of the gully were bare, without vegetation, and the edge of the gully was visible everywhere. It was an active gully. However, most of the gully is currently covered with vegetation (Figure 1D). In the downstream area of the gully, the vegetation is present on the gully bottom and lower sections of the wall; however, parts of the bed are cultivated in the middle of the gully (Figure 1F). This gully should generally be considered a stabilized gully as it is primarily characterized by smooth cross-sectional profiles, walls overgrown with vegetation, and the morphology has been preserved remarkably well over long periods [44,45]. However, it has an active headcut (Figure 1E).

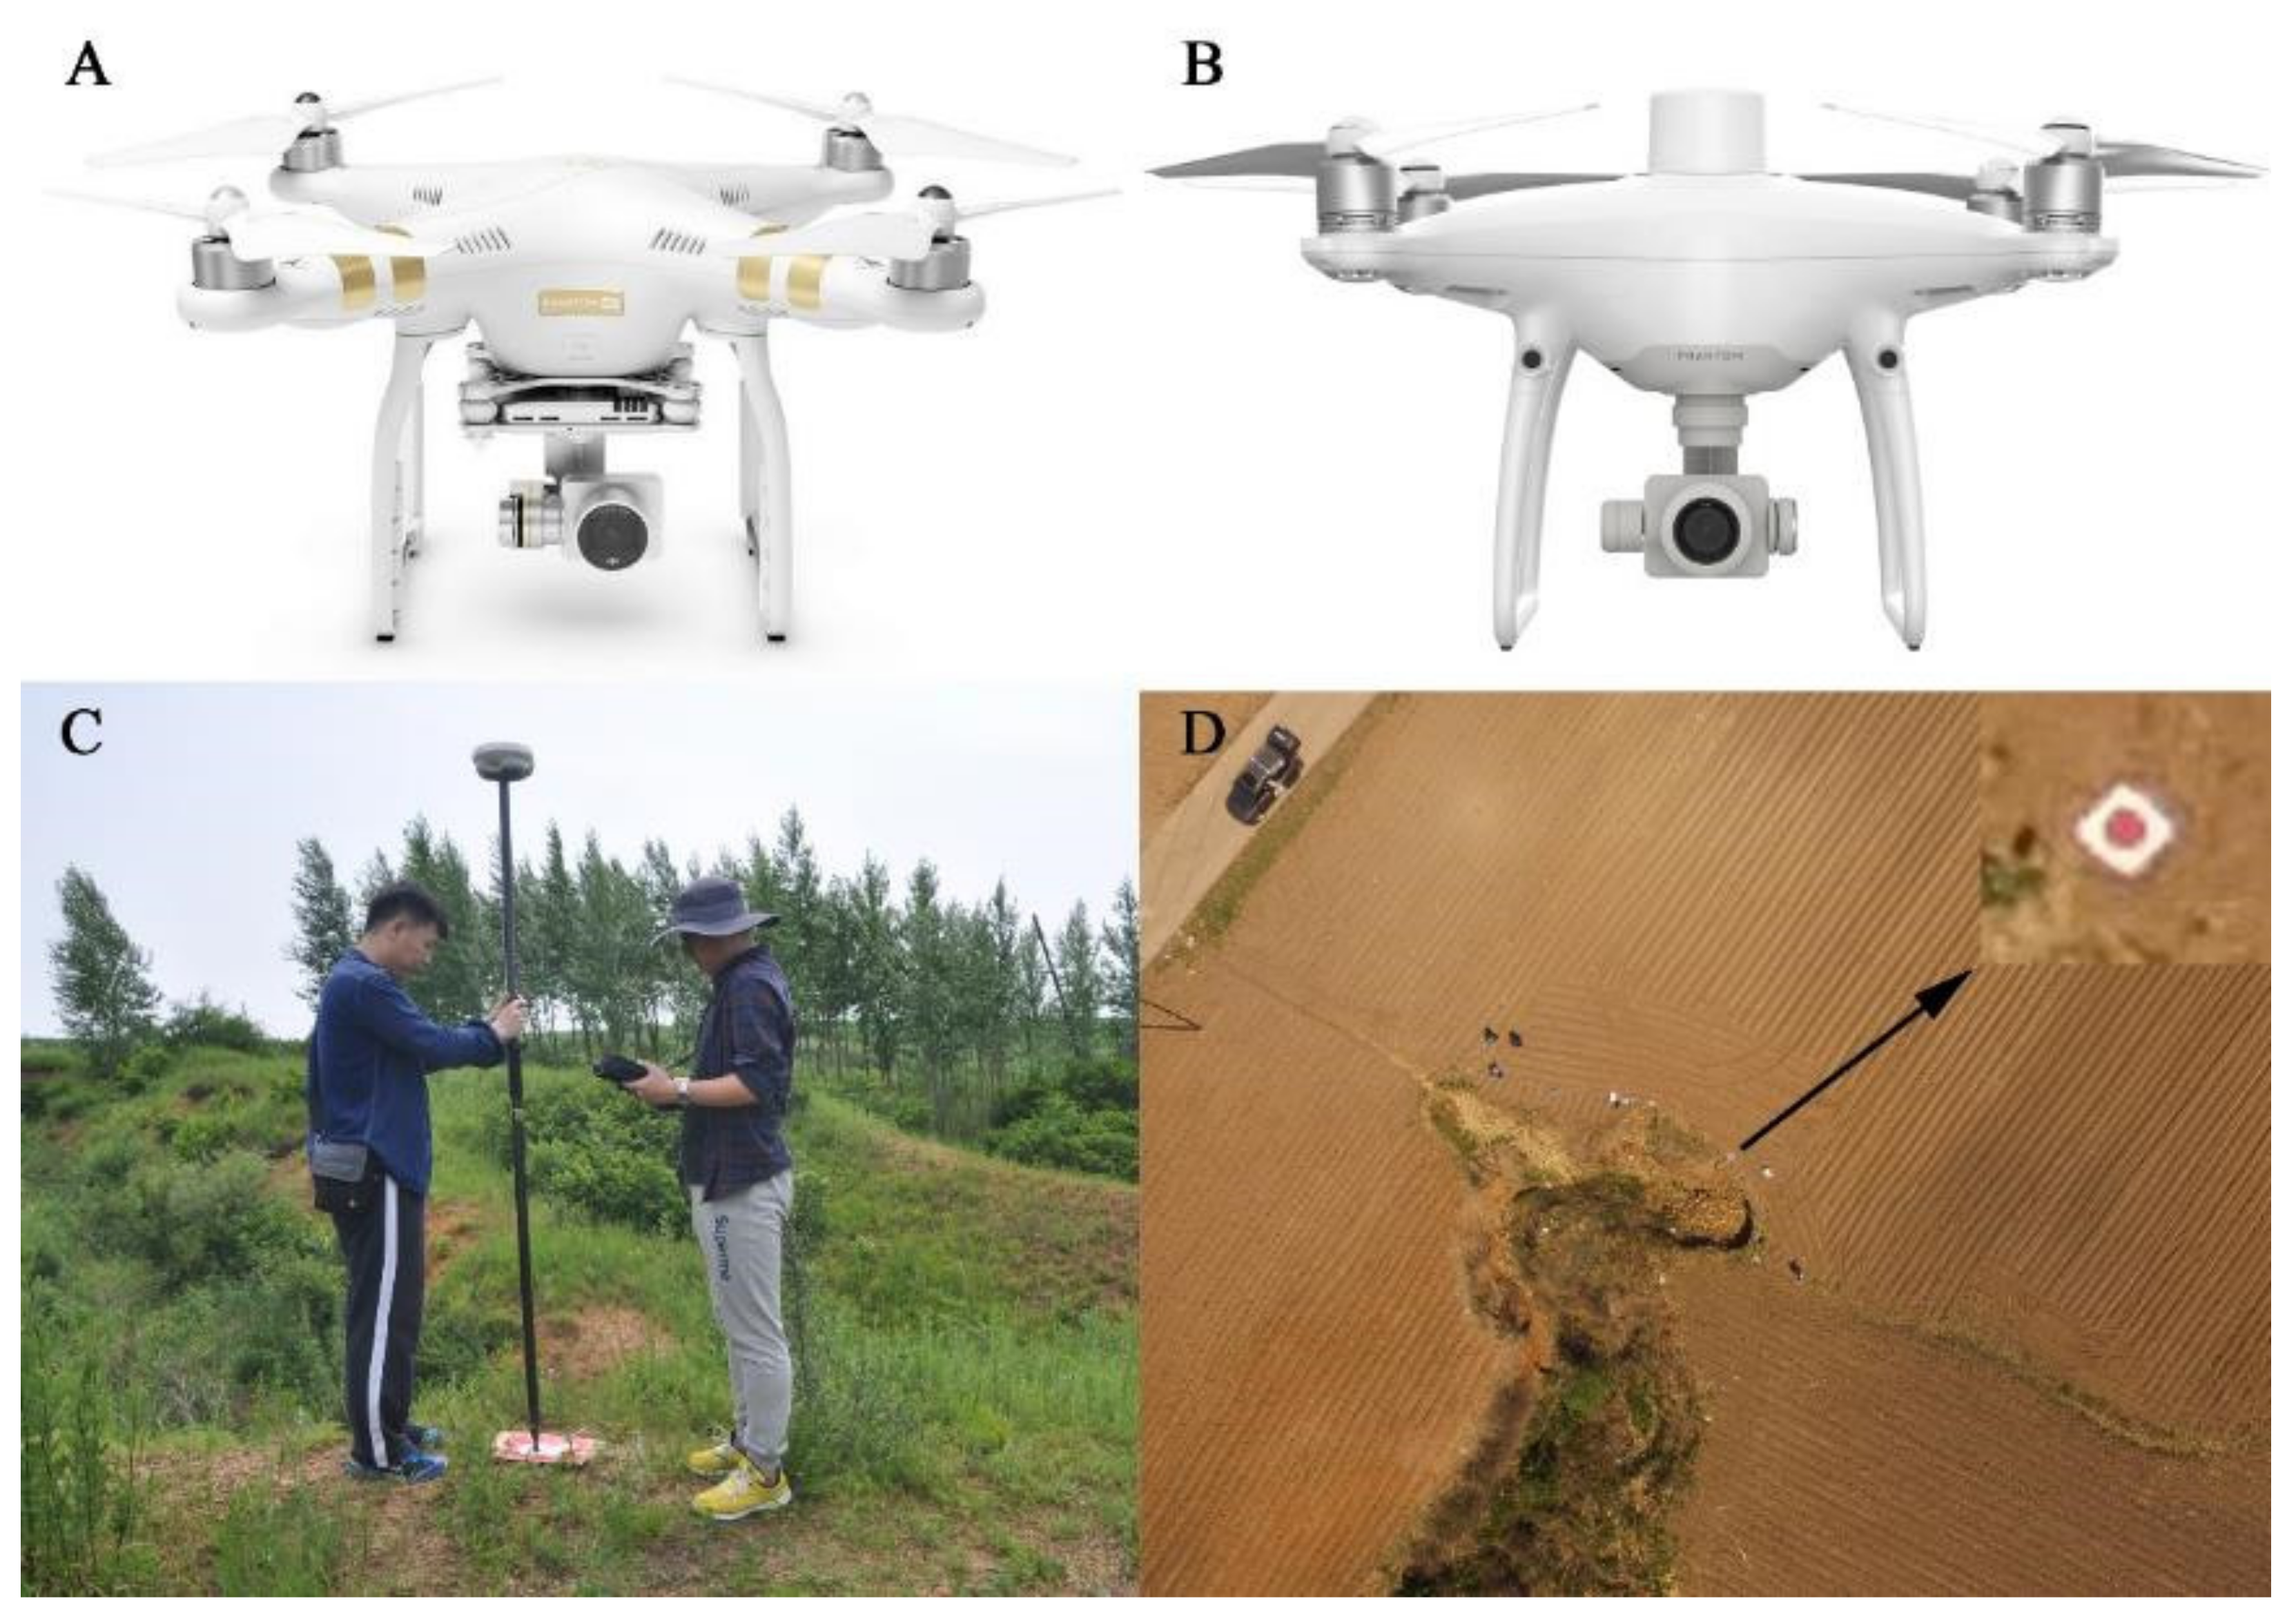
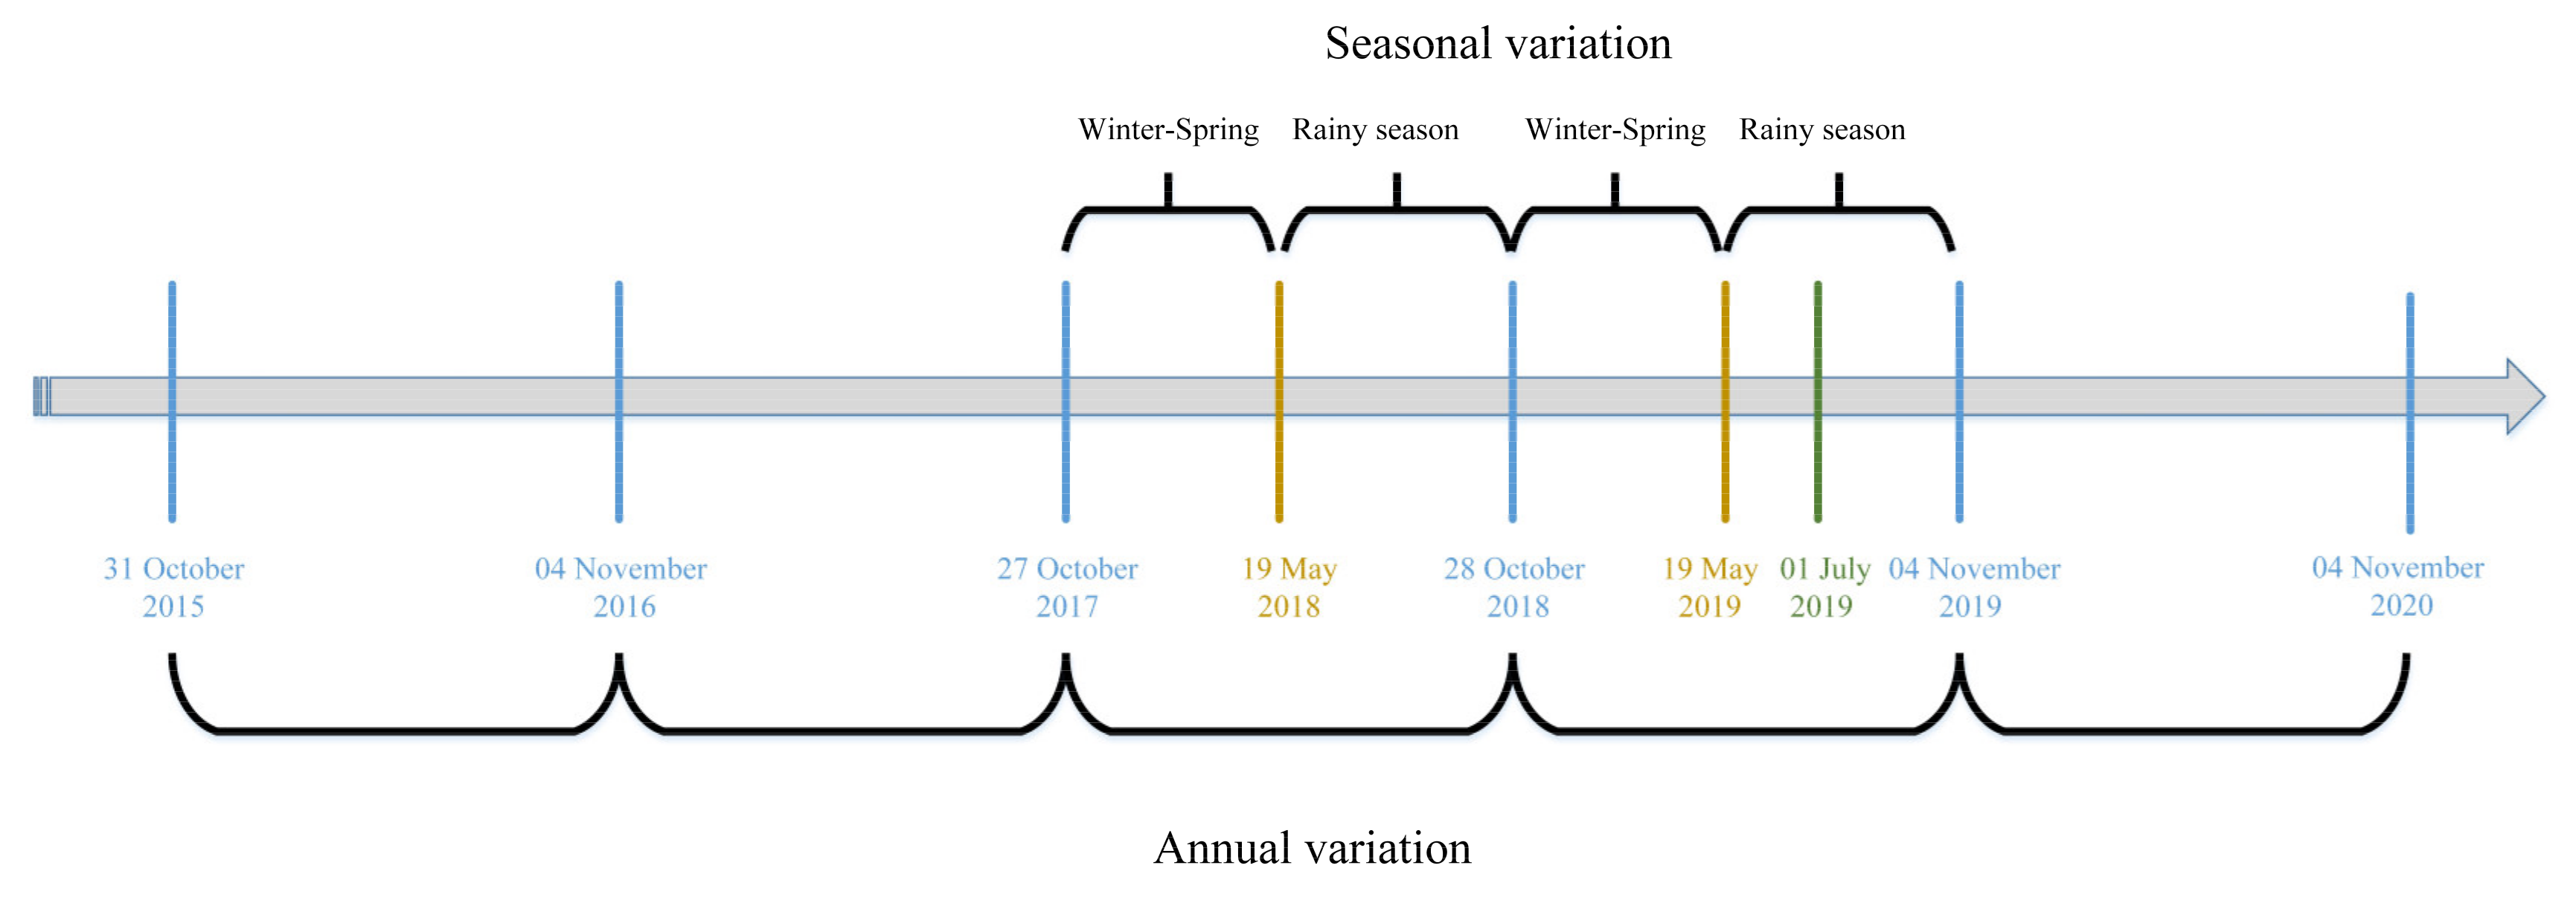
2.2. Data Acquisition

For image acquisition, we acquired the UAV images using a battery-powered quadcopter type Phantom 3 Professional (P3P, Figure 2A) or Phantom 4 RTK (P4R, Figure 2B), manufactured by DJI company (Shenzhen, China). Table 1 provides the specifications of the two drones. The drones had a uniform platform equipped with an active stabilizing camera installed to compensate for system vibrations and wind-induced flight disturbances, such that the camera was guaranteed to be always nadir-oriented and acquired sharp images. However, the crucial difference is that the P3P carried a single-frequency GNSS receiver and a consumer-grade IMU for navigation, whereas the P4R was equipped with a multi-frequency GNSS receiver with the RTK that enabled the precise collection of the aircraft’s position at the time of each photograph capture. The P4R provided a link with the RTK network Qianxun Continuously Operating Reference Station (CORS) using a 4G wireless network card or Wi-Fi hotspot. The built-in RTK-GNSS improved the stability and 3D positional accuracy of the UAV and recorded the raw GNSS trajectory observations for post-processing.
We installed the GCPs over the selected gully before every airborne campaign, and they were generally defined by a red circle on the top of a whiteboard or the opposite color (Figure 2C). The circle was always marked with a CD with a diameter of 12 cm, which was sufficiently visible in the UAV imagery obtained in all surveys (Figure 2D). We placed these targets before the drone campaign on the days of every survey flight. We precisely measured the GCPs with a Trimble RTK device by contacting the Jilin CORS (Figure 2C). The horizontal and vertical positioning accuracies of the device were better than 3 cm and 5 cm, respectively. We set the geographic coordinate system and projection to the China Geodetic Coordinate System 2000 and Gauss Kruger, respectively. Furthermore, we used the line staking-out function of the RTK to measure Profiles 1 and 2 (Figure 1E,F) in the last survey (4 November 2020) to evaluate the accuracy of the terrain data obtained by the UAV.
We conducted the UAV surveys (2015–2020) between 31 October 2015, and 4 December 2020, to monitor the gully erosion (Figure 3). We used the P3P in 2015–2018 and the P4R in 2019–2020. The UAV was autonomously controlled following the predefined flight plans set by the autopilot software to acquire images, except for the 2015 survey, for which we manually controlled the UAV to acquire images. The two drones use different autopilot software, named Pix4dcapture (Pix4d, Lausanne, Switzerland) and the DJIGS RTK (DJI, Shenzhen, China) for P3P and P4R, respectively. We designed the flight missions by setting the flight height, flight line, flight speed, picture overlap, and camera angle to ensure that the drone could stably and accurately acquire the geomorphologic data of the gully. To ensure sufficient area coverage, we designed the flight plans with an 80% overlap inflight direction and a 70% overlap of flight strips. The lens of the camera was always set in the 90° position to ensure a constant downward viewing direction. The details of the fight missions are summarized in Table 2. All flight missions were performed between 10 a.m. and 2 p.m. to guarantee relatively consistent lighting conditions.
The precipitation data of the Jiutai Meteorological Station (Figure 4) were provided by the Jilin Provincial Meteorological Service.

2.3. Data Processing

We processed a series of noncalibrated images obtained from the UAV surveys with Pix4Dmapper software (Pix4D, Lausanne, Switzerland) to generate 3D data from 2D images. The software integrates SfM and multiview stereo (MVS) techniques to reconstruct 3D photos. For reconstruction, we followed these processing steps: (1) identification of homologous image points and consequent image matching; (2) reconstruction of the camera orientation, position, and internal camera parameters and computation of the corresponding 3D coordinates with an iterative bundle block adjustment (BBA); and (3) dense matching of the sparse point cloud by forward intersections in space [30,46,47]. We included high-precision GCPs in the processing by manually adding additional tie points for georeferencing during the photogrammetric analysis. Finally, we obtained a dense point cloud, a 3D mesh model, and an ortho-mosaic and DSM with centimeter-level resolution and accuracy. Furthermore, we generated the DTM using machine-learning point-cloud classification to filter vegetation in Pix4Dmapper [48]. This software is highly reliable and increasingly widely used in the geomorphological community [28,31,49]. Afterward, we used the produced DTMs to compute the topographic information of the gully, including slope, aspect, watershed, and runoff pathways. We obtained this information using the Spatial Analyst tool in ArcGIS® software.

2.4. Monitoring Geomorphological Changes

In this study, we monitored the geomorphological changes in the gully between 2015 and 2019. According to the image features combined with DTM, we manually digitized the gully edge, particularly the headcut, to detect the morphological changes of the gully. We also used the representative profiles of the head and downstream of the gully (Figure 1E,F) to evaluate the geomorphological changes in the stabilized gully. We created these cross-sections from DTMs in ArcGIS 10.
We detected the high-resolution, multitemporal, volumetric changes in the gully using the DTM of differencing (DoD) technique [50], which is used in most geomorphological change detection studies [51,52]. The DoD subtracts the old DTM from the new DTM, which results in a DTM showing the differences between the two surfaces, where positive values indicate sedimentation and negative values represent erosion. Furthermore, the resulting DTM can be summed to quantify the total volumetric changes. These surface changes are controlled by the errors and topographic uncertainties of each DTM. To identify the actual surface changes from artifacts arising from errors and uncertainties in the DTMs and to more realistically evaluate volumetric change, we applied a threshold minimum level of detection (minLoD) to determine the uncertainty threshold for each DoD, which we considered a conservative method. Only the elevation changes above the threshold were assumed to be soil erosion or deposition, whereas elevation changes beneath the threshold were discarded. The minLoD is widely used [50,53,54,55,56] and is calculated as follows:
minLoD = t δ DTM 1 2 + δ DTM 2 2
where minLoD is the threshold minLoD detection of significant elevation changes; t is the confidence interval, which we set to 1.96 for a 95% confidence interval; and δDTM1 and δDTM1 are the standard deviation of the error in the new and old DTMs, respectively. In this study, we assumed that the error for a DTM was the error obtained during the georeferencing procedure (i.e., the root mean square error (RMSE) of GCPs in Z coordinates, Table 2). We used geomorphic change detection software (http://gcd.riverscapes.xyz/, accessed on 17 September 2021) to perform the calculations.
Additionally, we added some rules to improve the final calculation of change volume. To avoid errors, we excluded vegetated areas within the gully. We only accepted erosion in the outer part of the perimeter of the gully; this rule was comprehensively described by Gomez-Gutierrez et al. [52].

3. Results

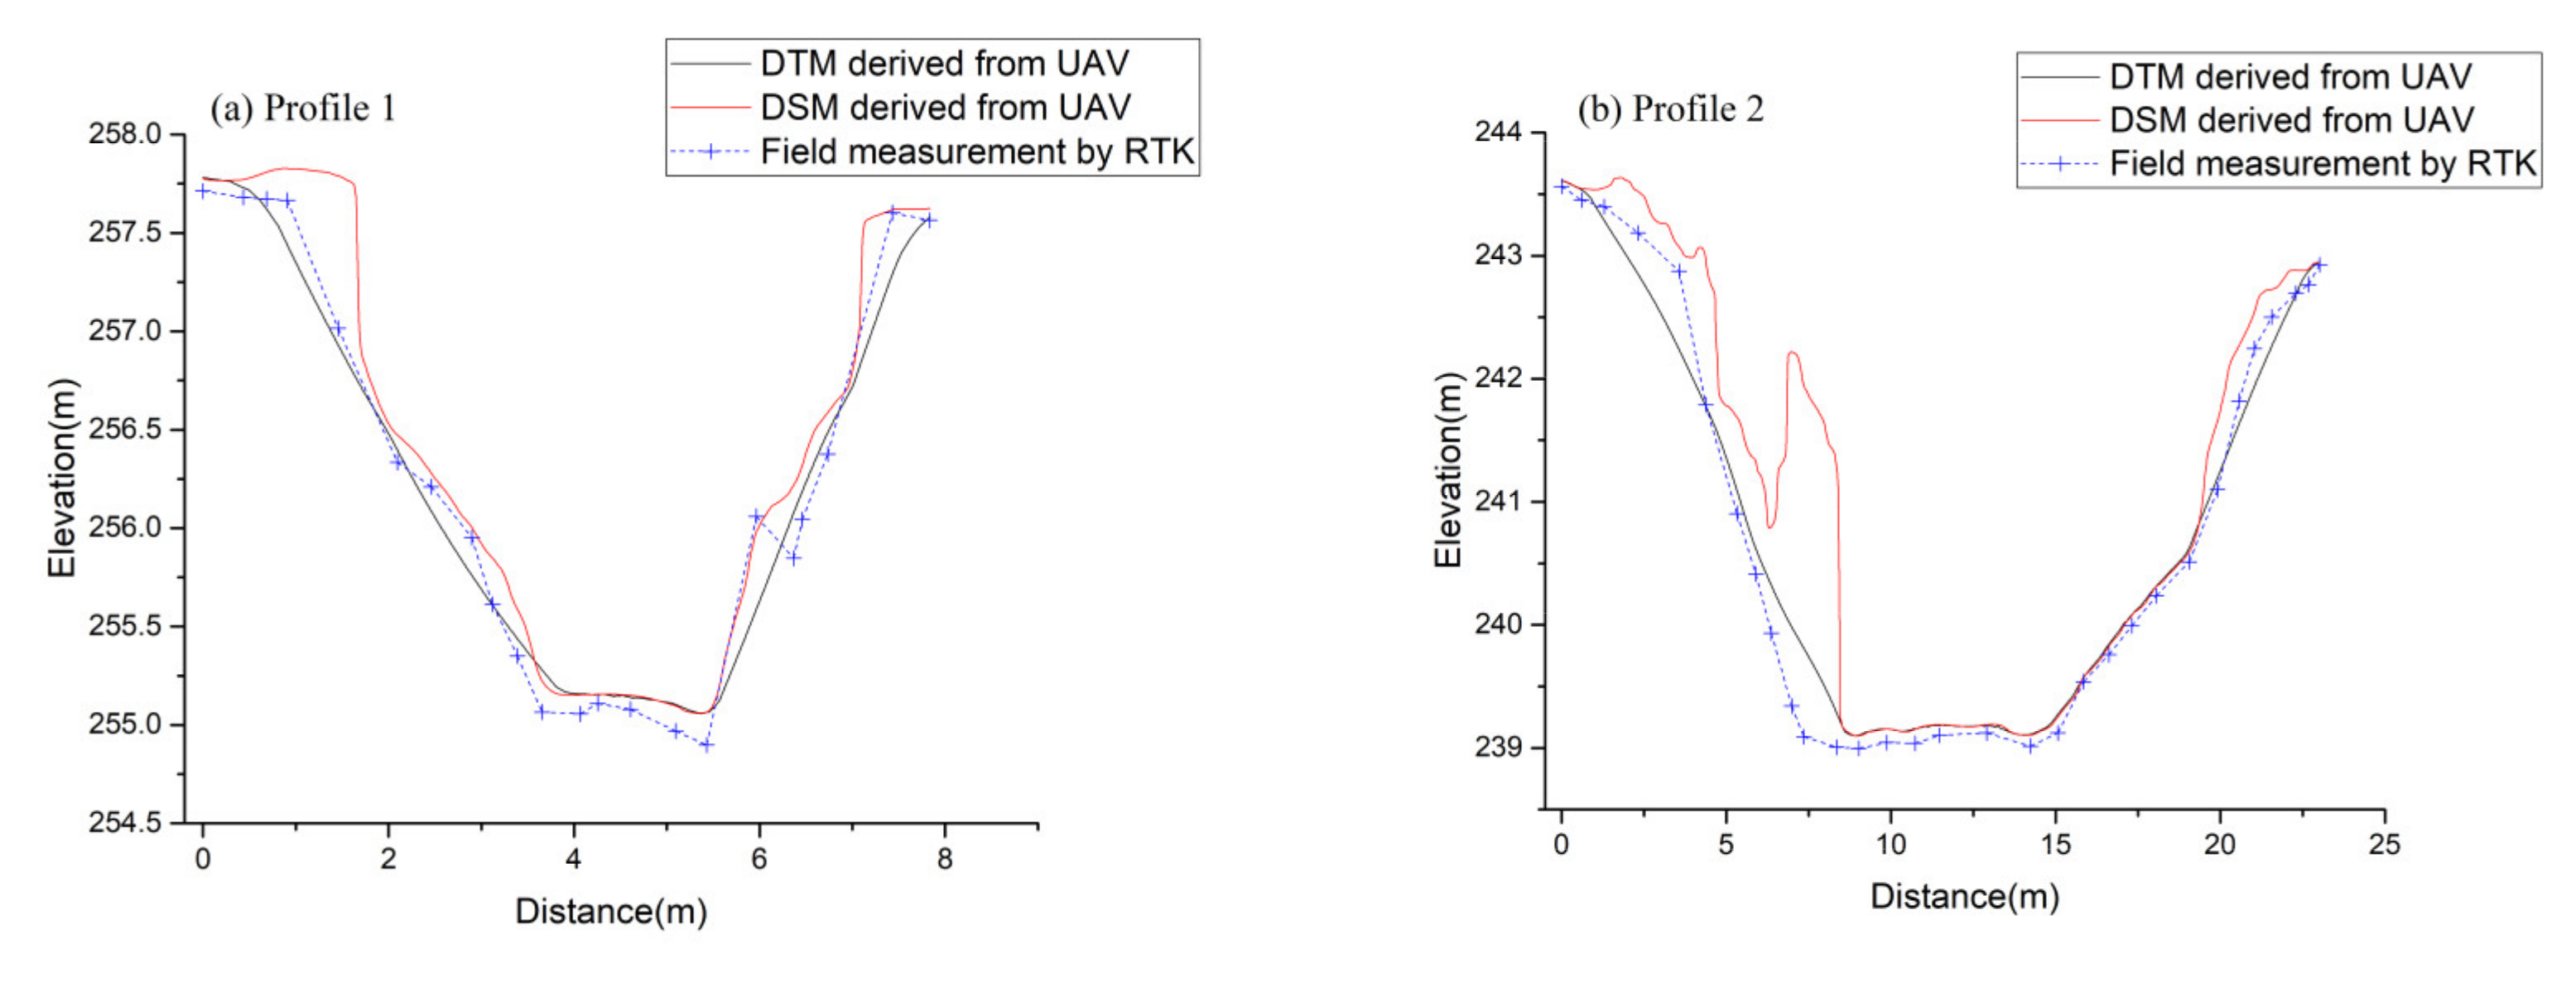
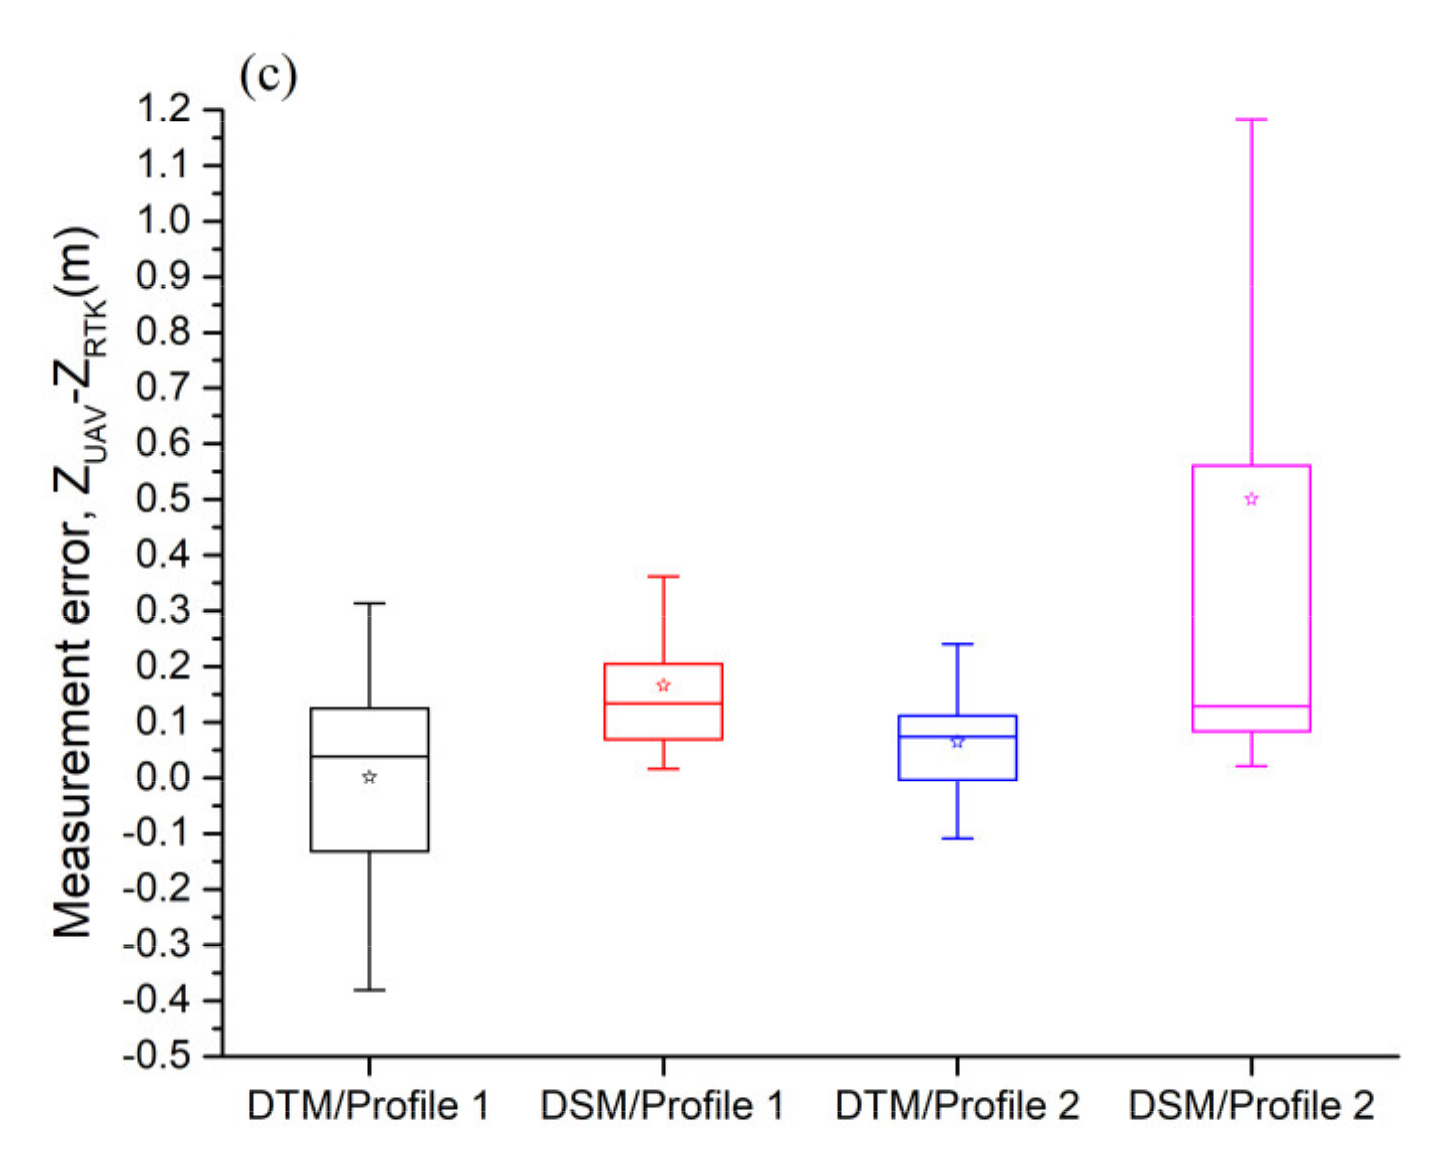
3.1. Accuracy Assessment

During the field campaigns from October 2015 to November 2020, the gully was recorded by 142–754 UAV images with a flying altitude between 25 and 80 m (Table 2). We obtained the largest number of images on 28 October 2018, because of the lower flight height (25 m). The orthoimages and grid DSMs produced by the photogrammetric processing provided a ground sampling distance between 1.21 and 2.61 cm. After photogrammetric processing, we assessed the accuracy of the UAV-derived products, for which we heavily relied on the accuracy of the photogrammetric restitution based on bundle-block triangulation and DTM extraction [22]. In this study, we used the bundle-block adjustment errors, camera optimization errors, and GCP residuals to assess precision. In the bundle-block adjustment details, we calculated the reprojection errors, which corresponded to the image distance between the original measured point and the reprojected point in the camera. We used the relative difference between the initial and optimized internal camera parameters to assess the camera optimization errors. We also evaluated the accuracy of the absolute orientation by the GCP residuals, which indicated the remaining deviation between the GCP coordinates measured by RTK-CORS and those retrieved from the photogrammetric processing. We considered all directional vectors (X, Y, and Z) to calculate RMSE.
The accuracy assessment results of the UAV-derived product are presented in Table 2. The mean reprojection errors were all less than one pixel. The initial camera models were all within 5% of the optimized value except for those of the 2015 survey, for which the value was 7.33%. The poorest accuracy occurred for the 2015 flight, which had the largest GCP RMSE (6.03 cm). This was most likely owing to the UAV being flown manually, which resulted in an inability to ensure uniform and sufficient overlap and because of a small number of GCPs. During the field campaigns from 2016 to 2020, the total RMSE of the GCPs ranged between 1.10 and 3.83 cm. The maximum and minimum RMSE values were 4.39 cm and 0.92 cm, 3.65 cm and 0.79 cm, and 4.57 cm and 1.37 cm in the X, Y, and Z directions, respectively.
We used the field measurements of profiles obtained from the gully using the line staking-out function of the RTK to obtain geodetic measured points as reference data for analyzing the errors associated with the terrain data obtained from the UAV. We used 22 and 31 points in the vertical error calculation for Profiles 1 and 2, respectively. The vertical difference in the RMSE between all 53 measured geodetic points and the UAV-DSM calculated points in 2019 was 0.72 m, whereas the average vertical RMSE of UAV-DTM on bare ground remarkably decreased to 0.23 m after point cloud classification (Table 3). Moreover, the vertical RMSE of Profile 1 was smaller than that of Profile 2 because Profile 1 had less vegetation cover. Comparing the error plot (Figure 5) with the corresponding profiles in Figure 1E,F, most errors were associated with vegetation cover. The reason for the large magnitude of some of the outliers was also clear: steep and high walls are present in the gully, and at these steep walls, only small lateral offsets of the RTK could result in large cross-section elevation errors, whereas the line staking-out function of the RTK allowed for small lateral offsets. Furthermore, the shadow of the sun-diverted gully walls affected the quality of the UAV photogrammetric analysis.

3.2. Geomorphological Changes

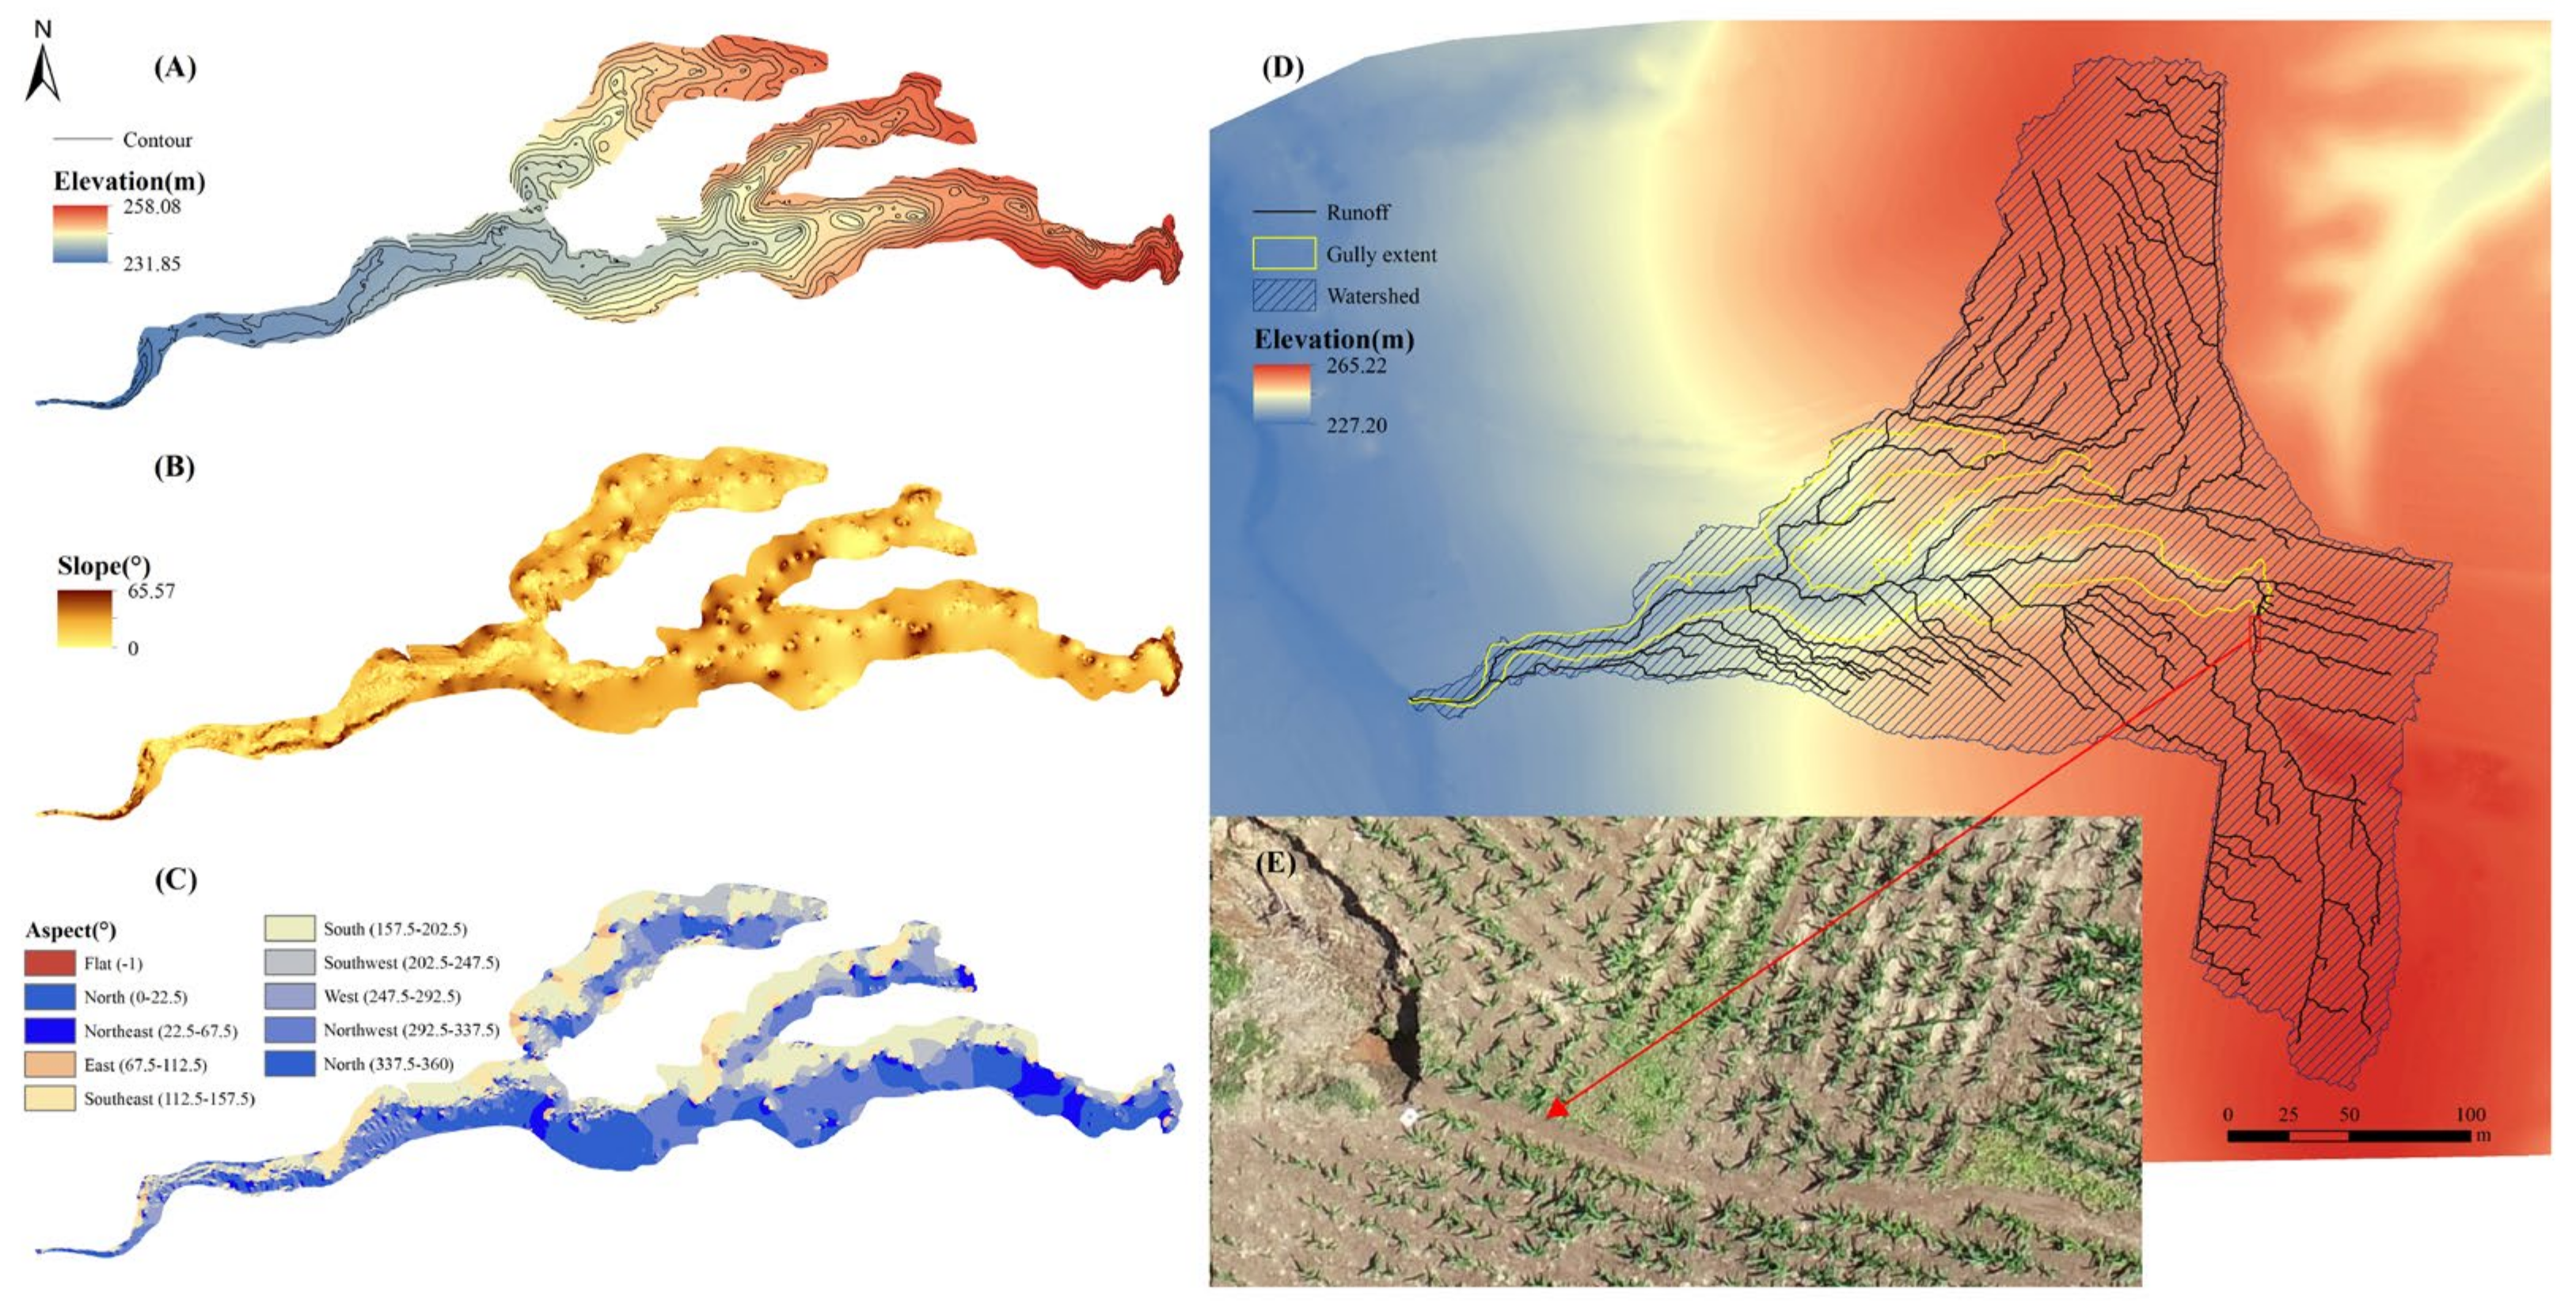
3.2.1. Extraction of Topographic Information

Based on the DTM derived from the UAV data of 4 December 2020, we generated the topographic information of the gully (Figure 6). Topographical factors have the strongest influence on the erosion of gullies and thus are related to the pattern and rate of gully erosion. The gully area was 9289.10 m2, and the length of the major gully was 423 m in 2020. The elevation of the gully ranged from 231.85 to 258.08 m, and the relative elevation difference was 26.32 m (Figure 6A). The average gradient of the gully exhibited a normal distribution from 0° to 65.57°, and the area with a steep slope (a gradient greater than 25°) accounted for 19.03% of the total area. Near the edge of the gully head, the slope was greater than 35° in some areas (Figure 6B). The main slope aspects of the gully were north, northwest, and south because the gully is located on the western slope of farmland (Figure 6C). The watershed area of the gully was 5.99 ha. We generated runoff pathways based on the produced DTM (Figure 6D); however, only certain parts of the drainage area actually contributed runoff owing to rainfall characteristics and the spatial configuration of land use and soil types [57,58,59]. Nonetheless, the DTM captured the major landscape behavior. For example, in the upstream area that drained to the gully headcut, we computed a concentrated runoff pathway, which corresponds with the field observation (Figure 6E).

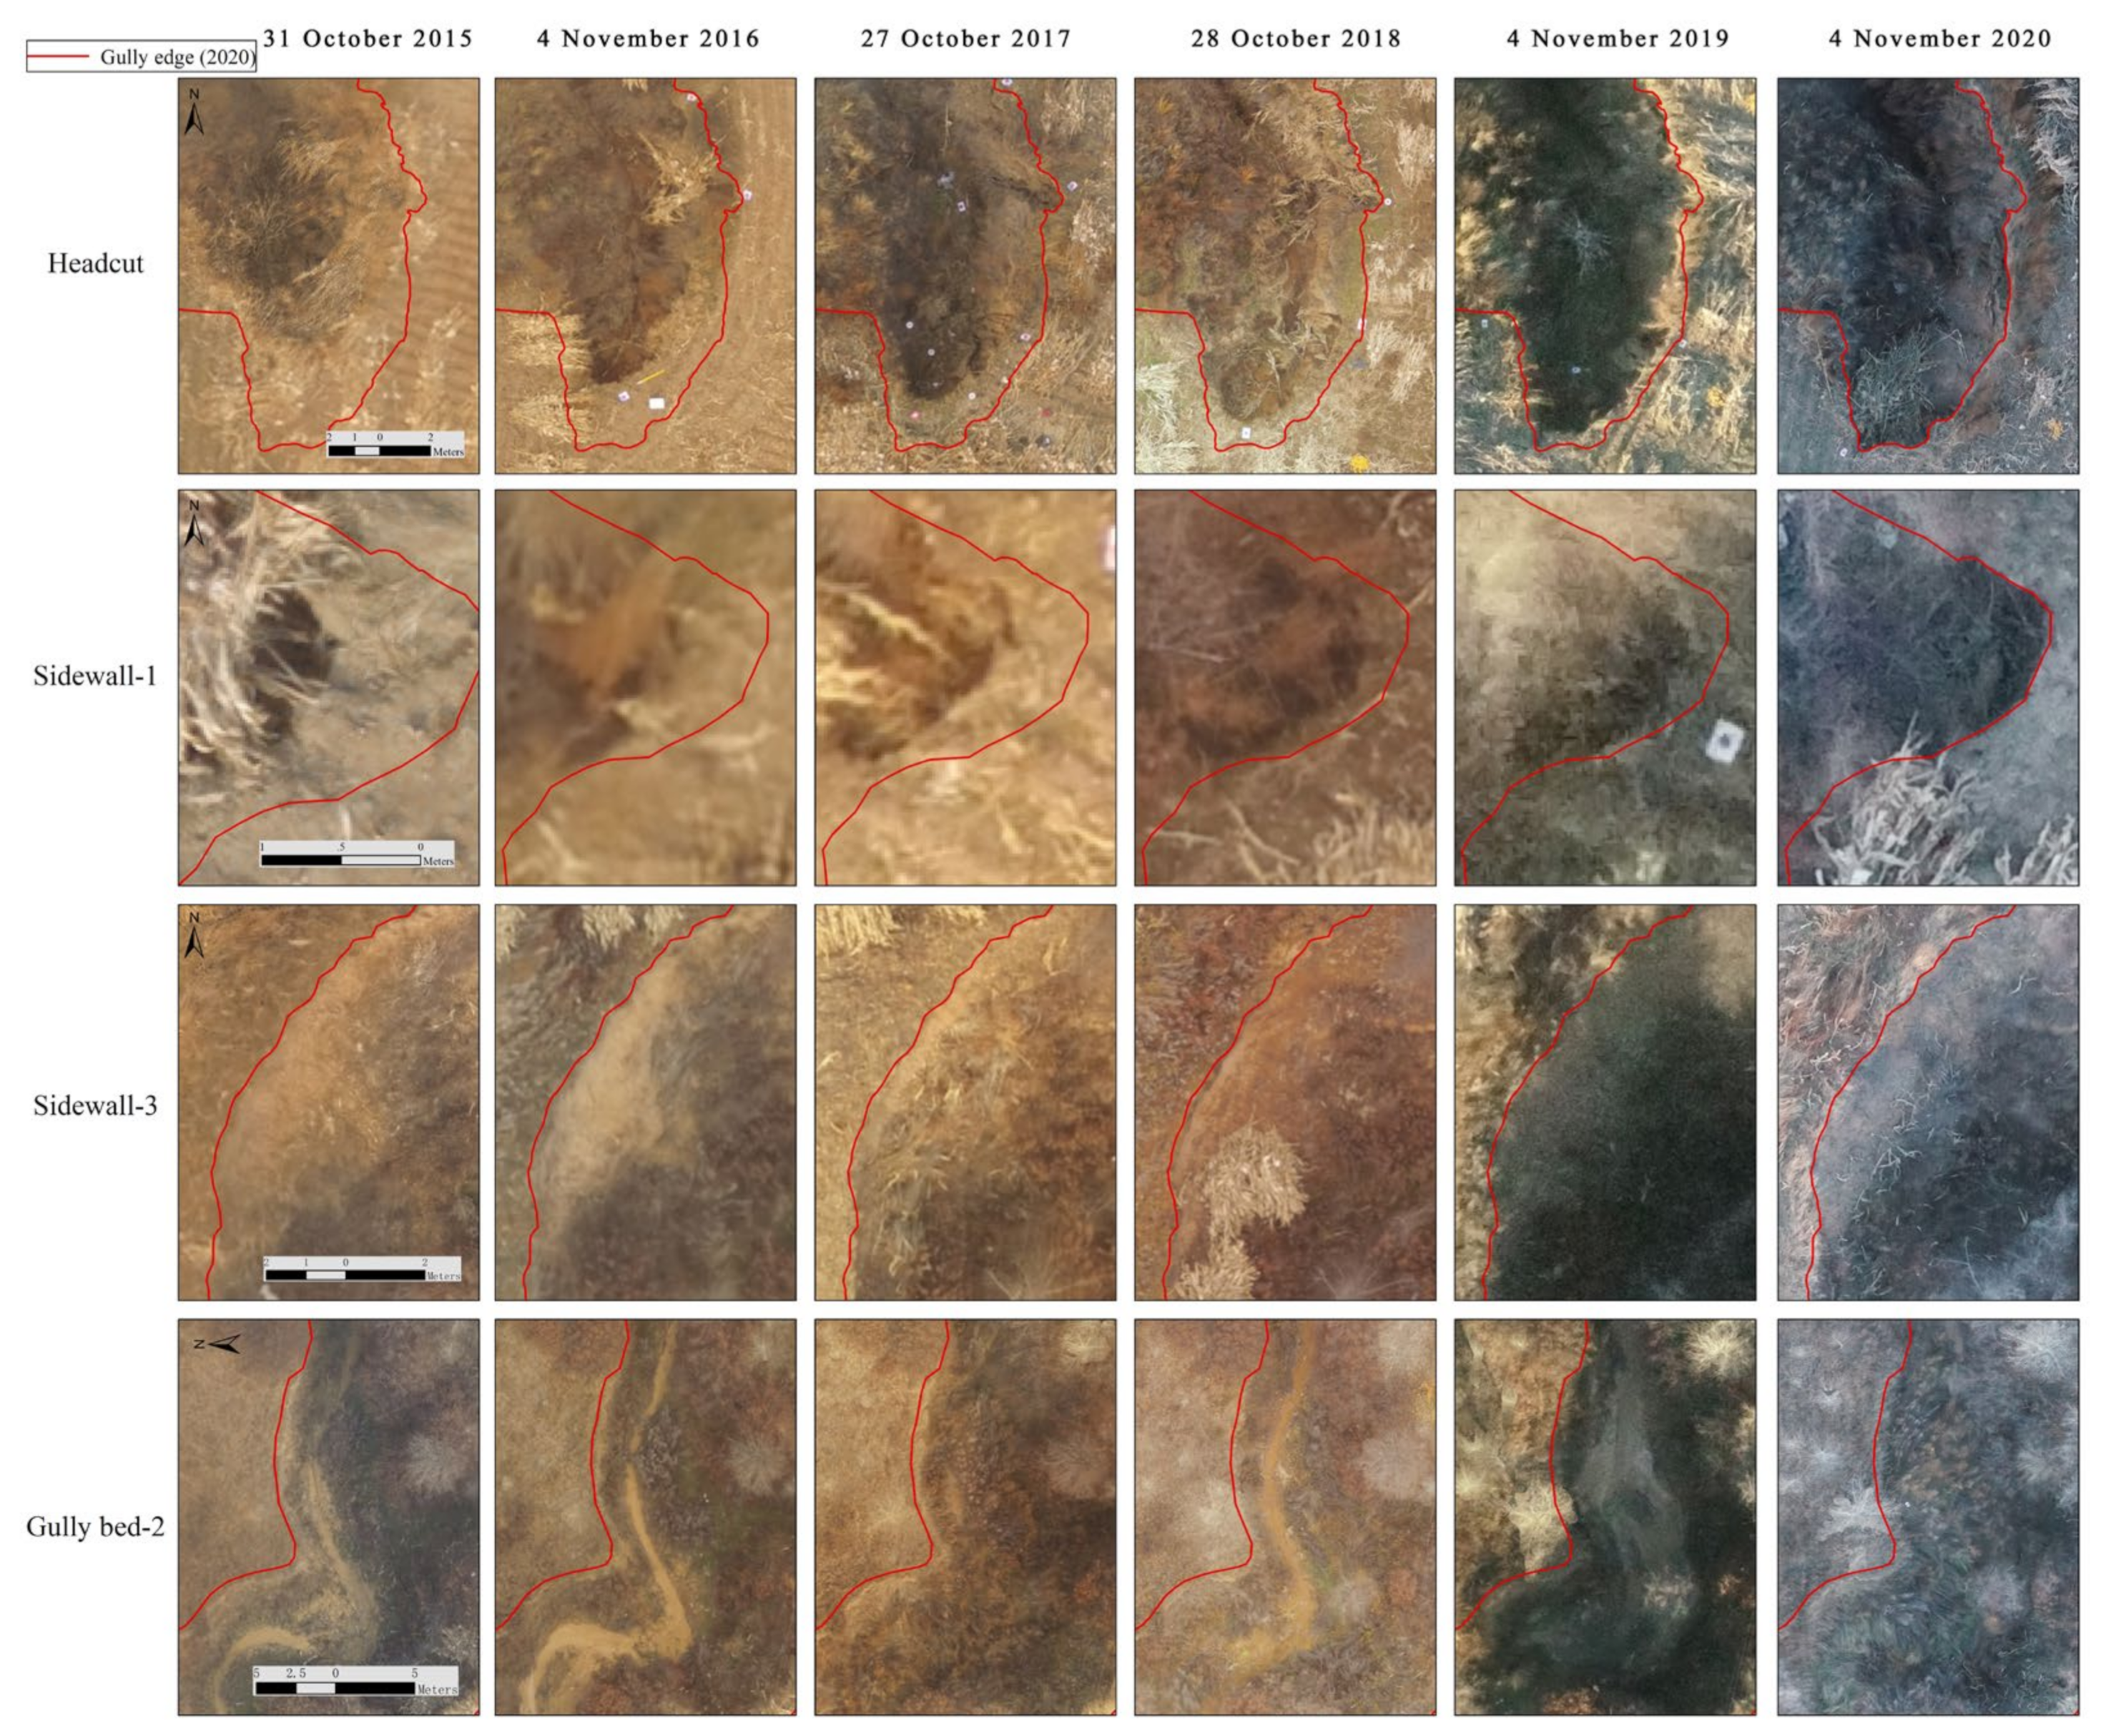
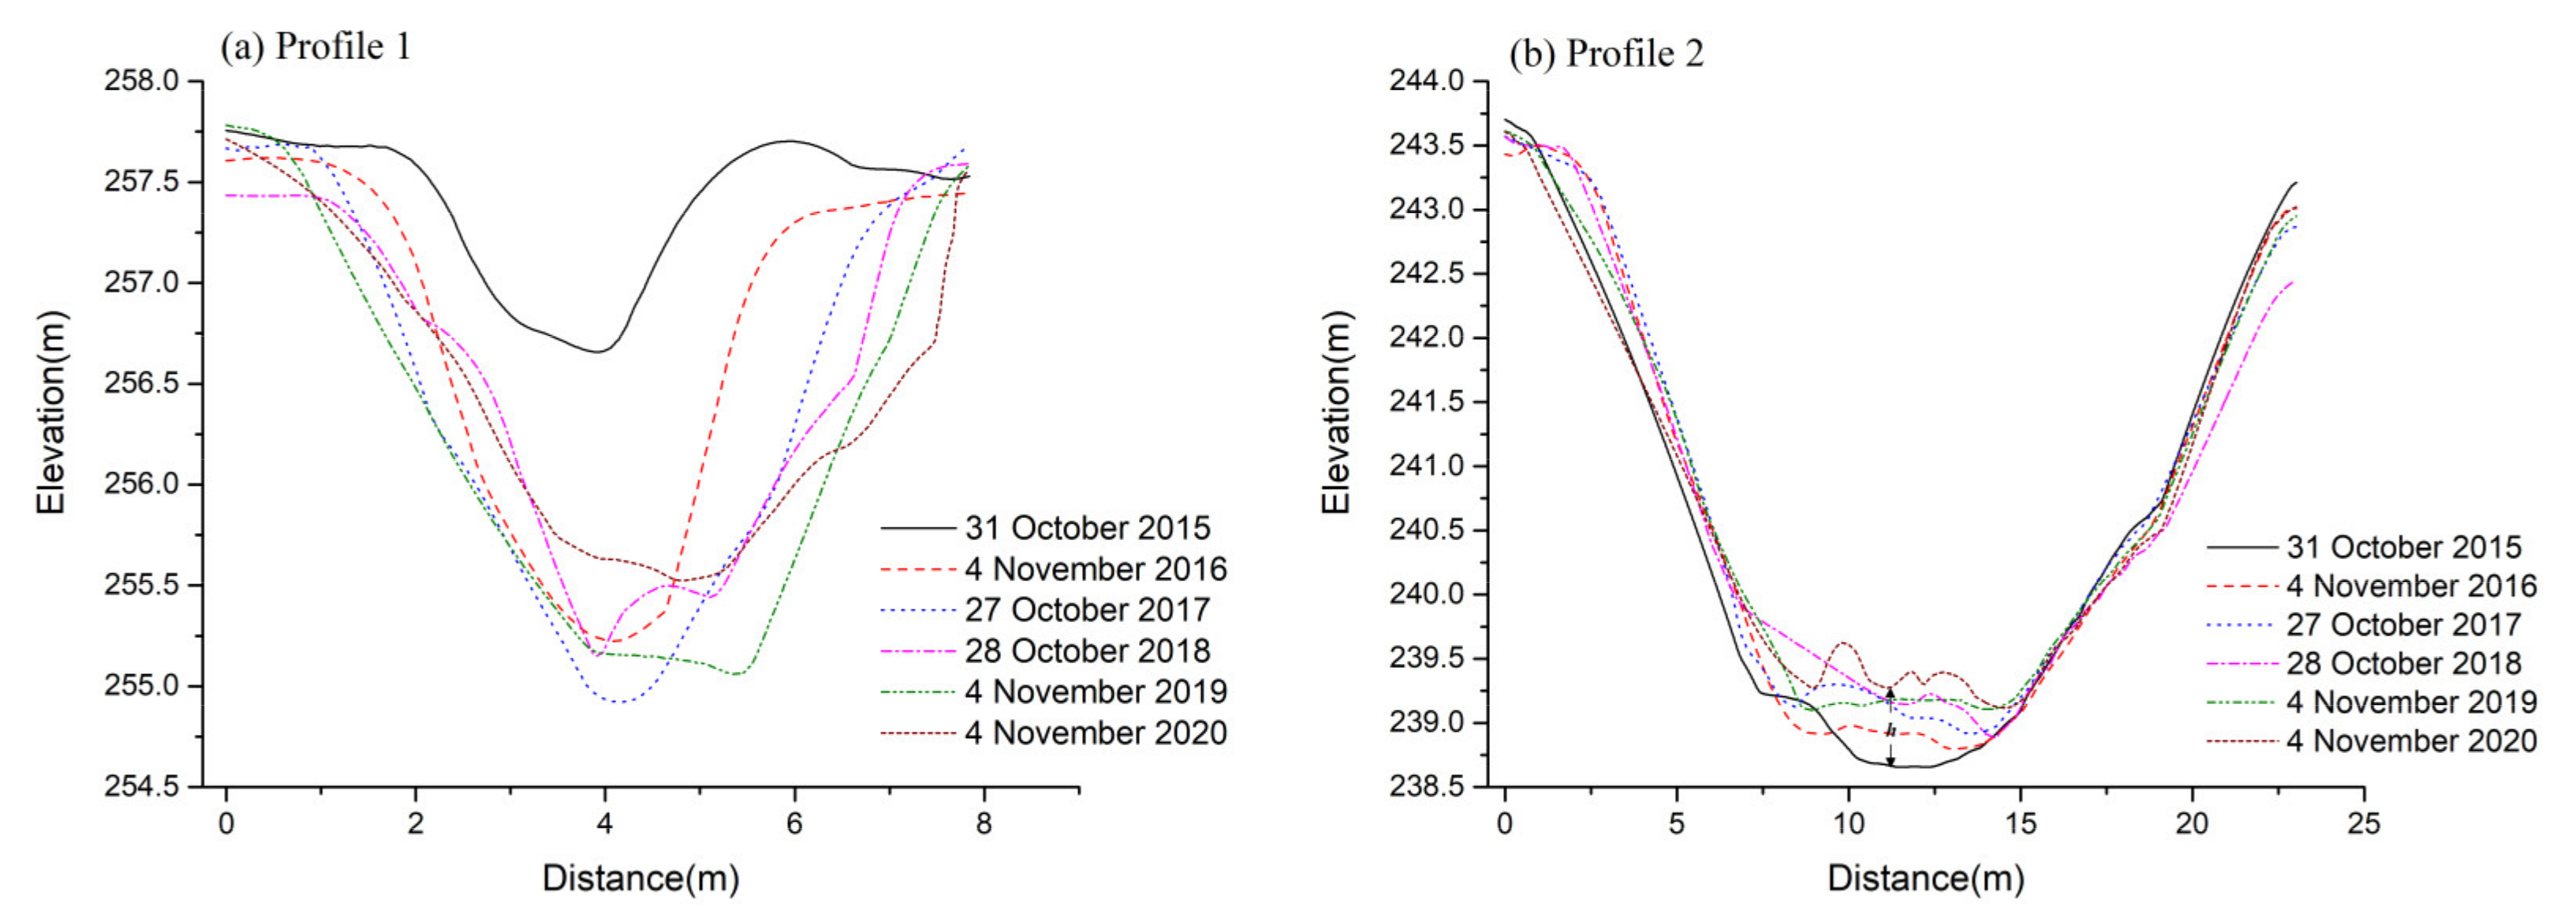
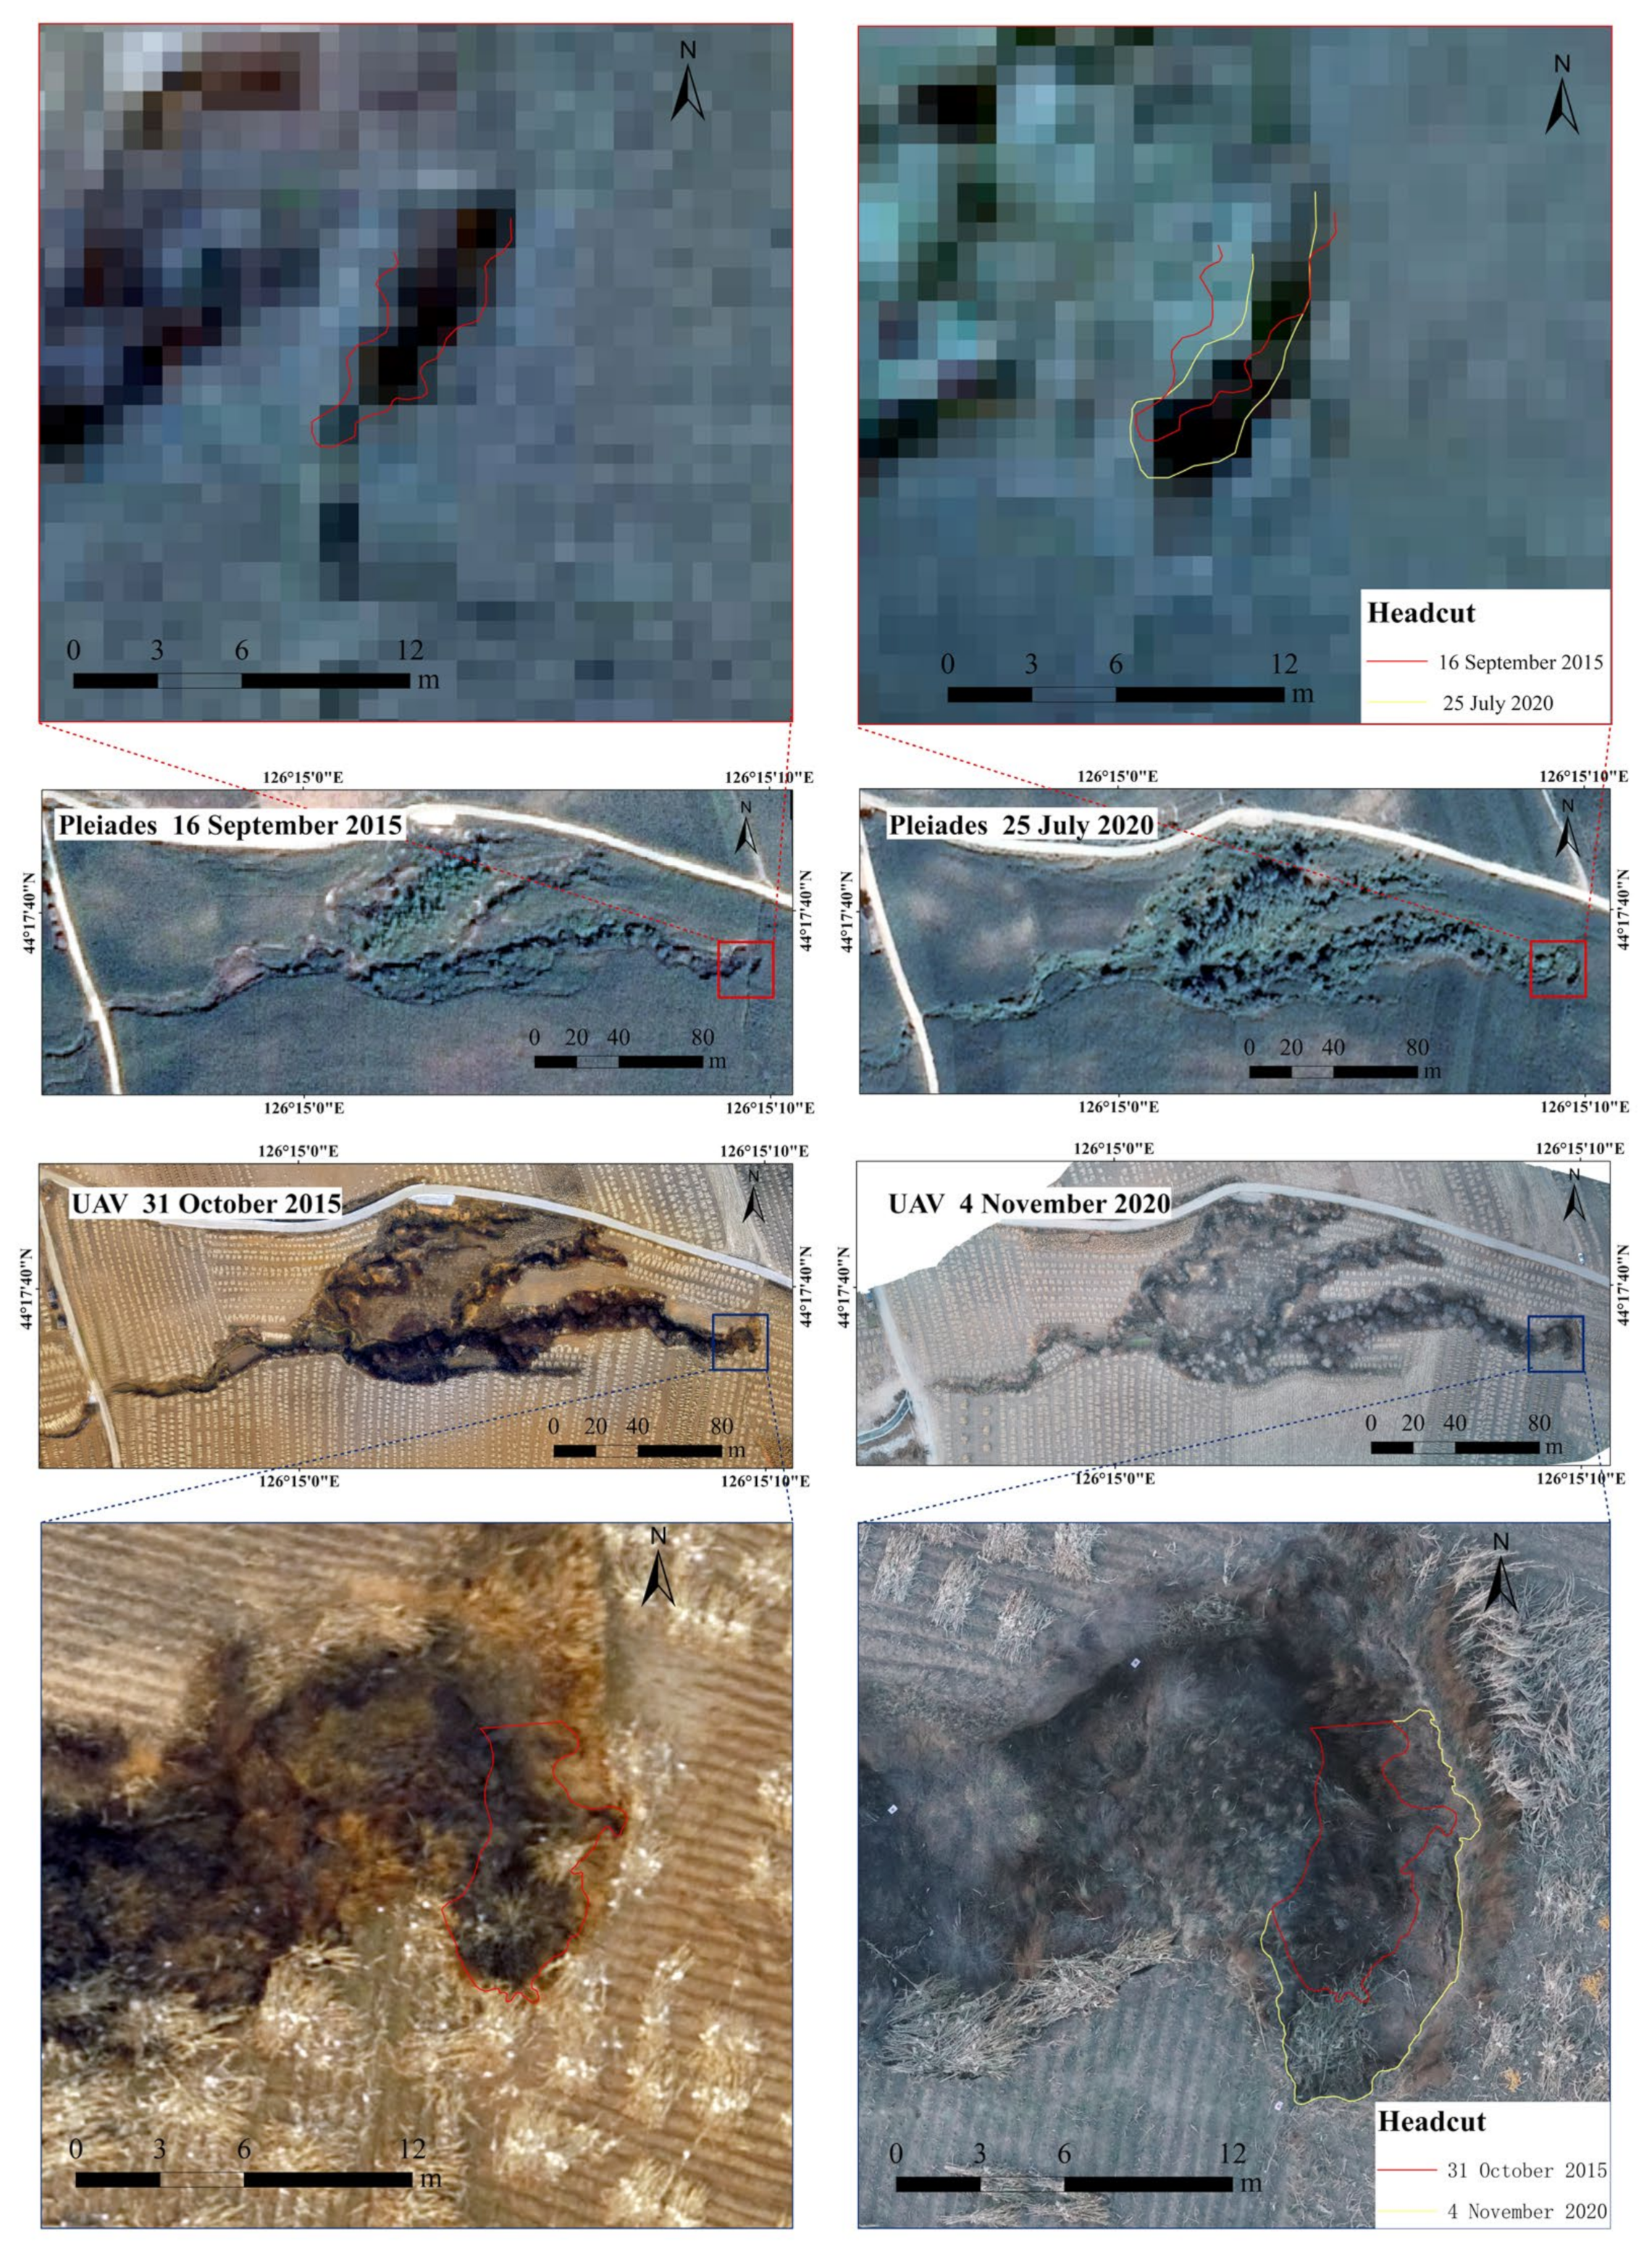
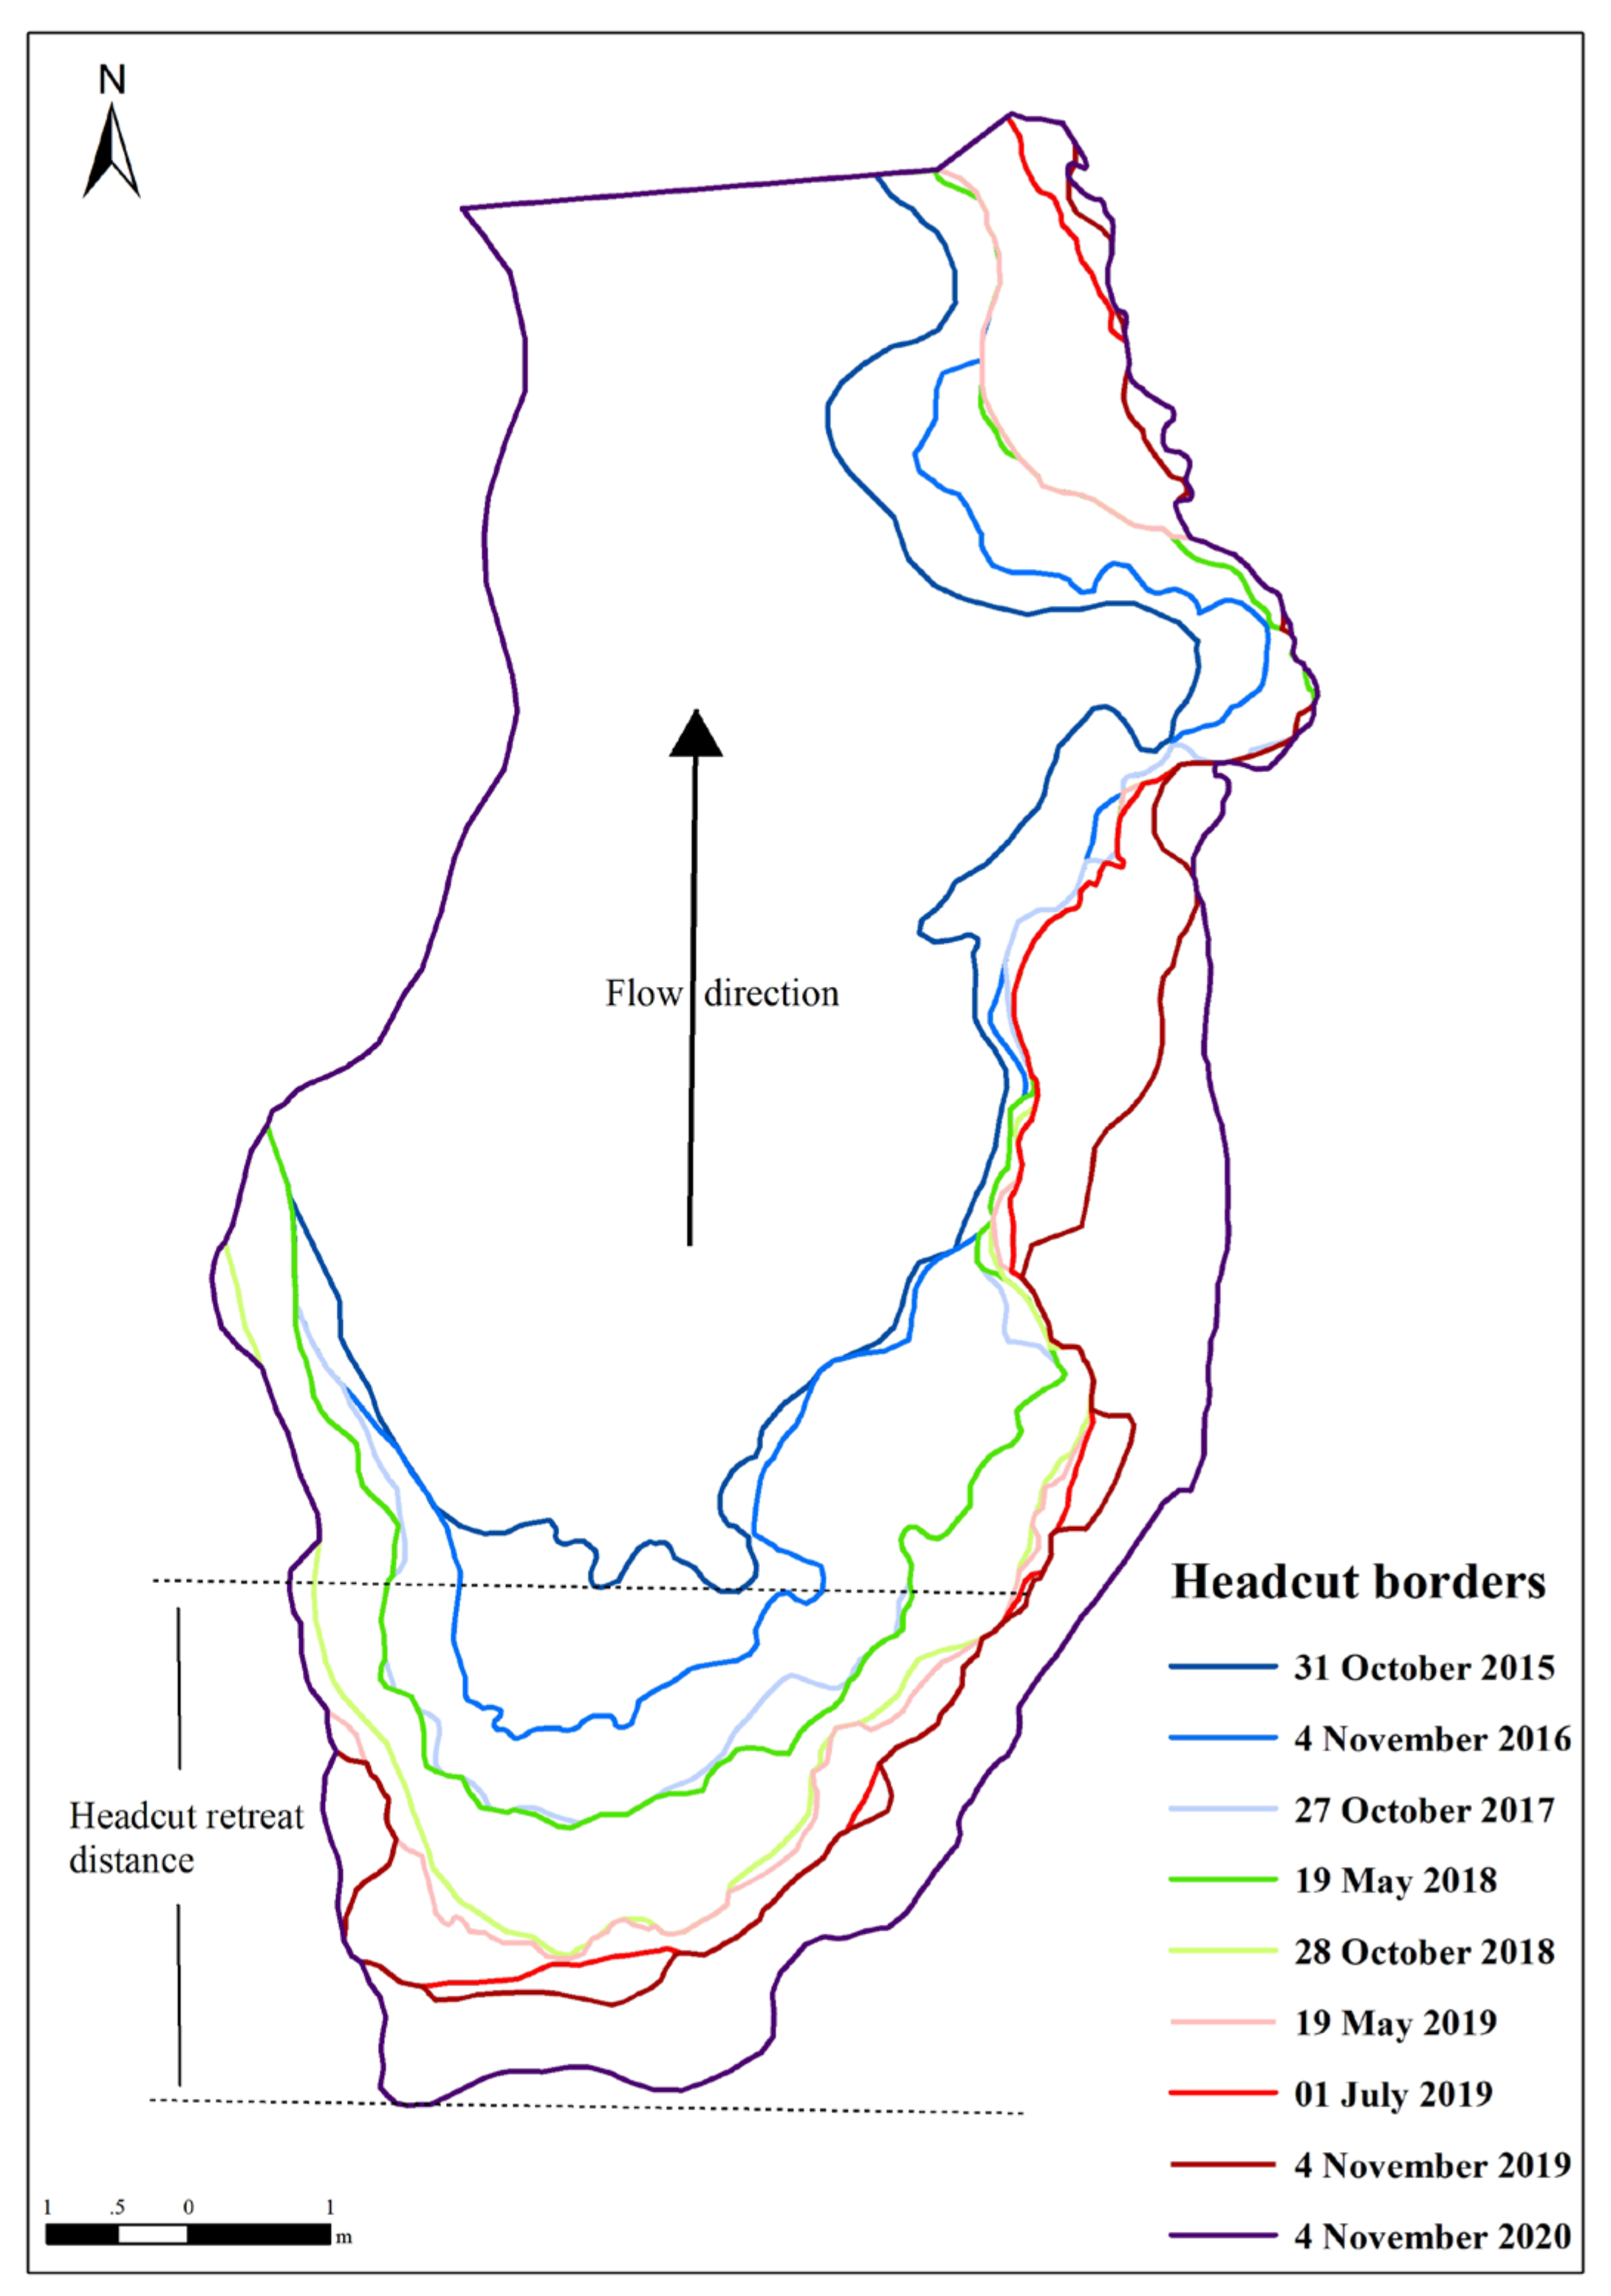
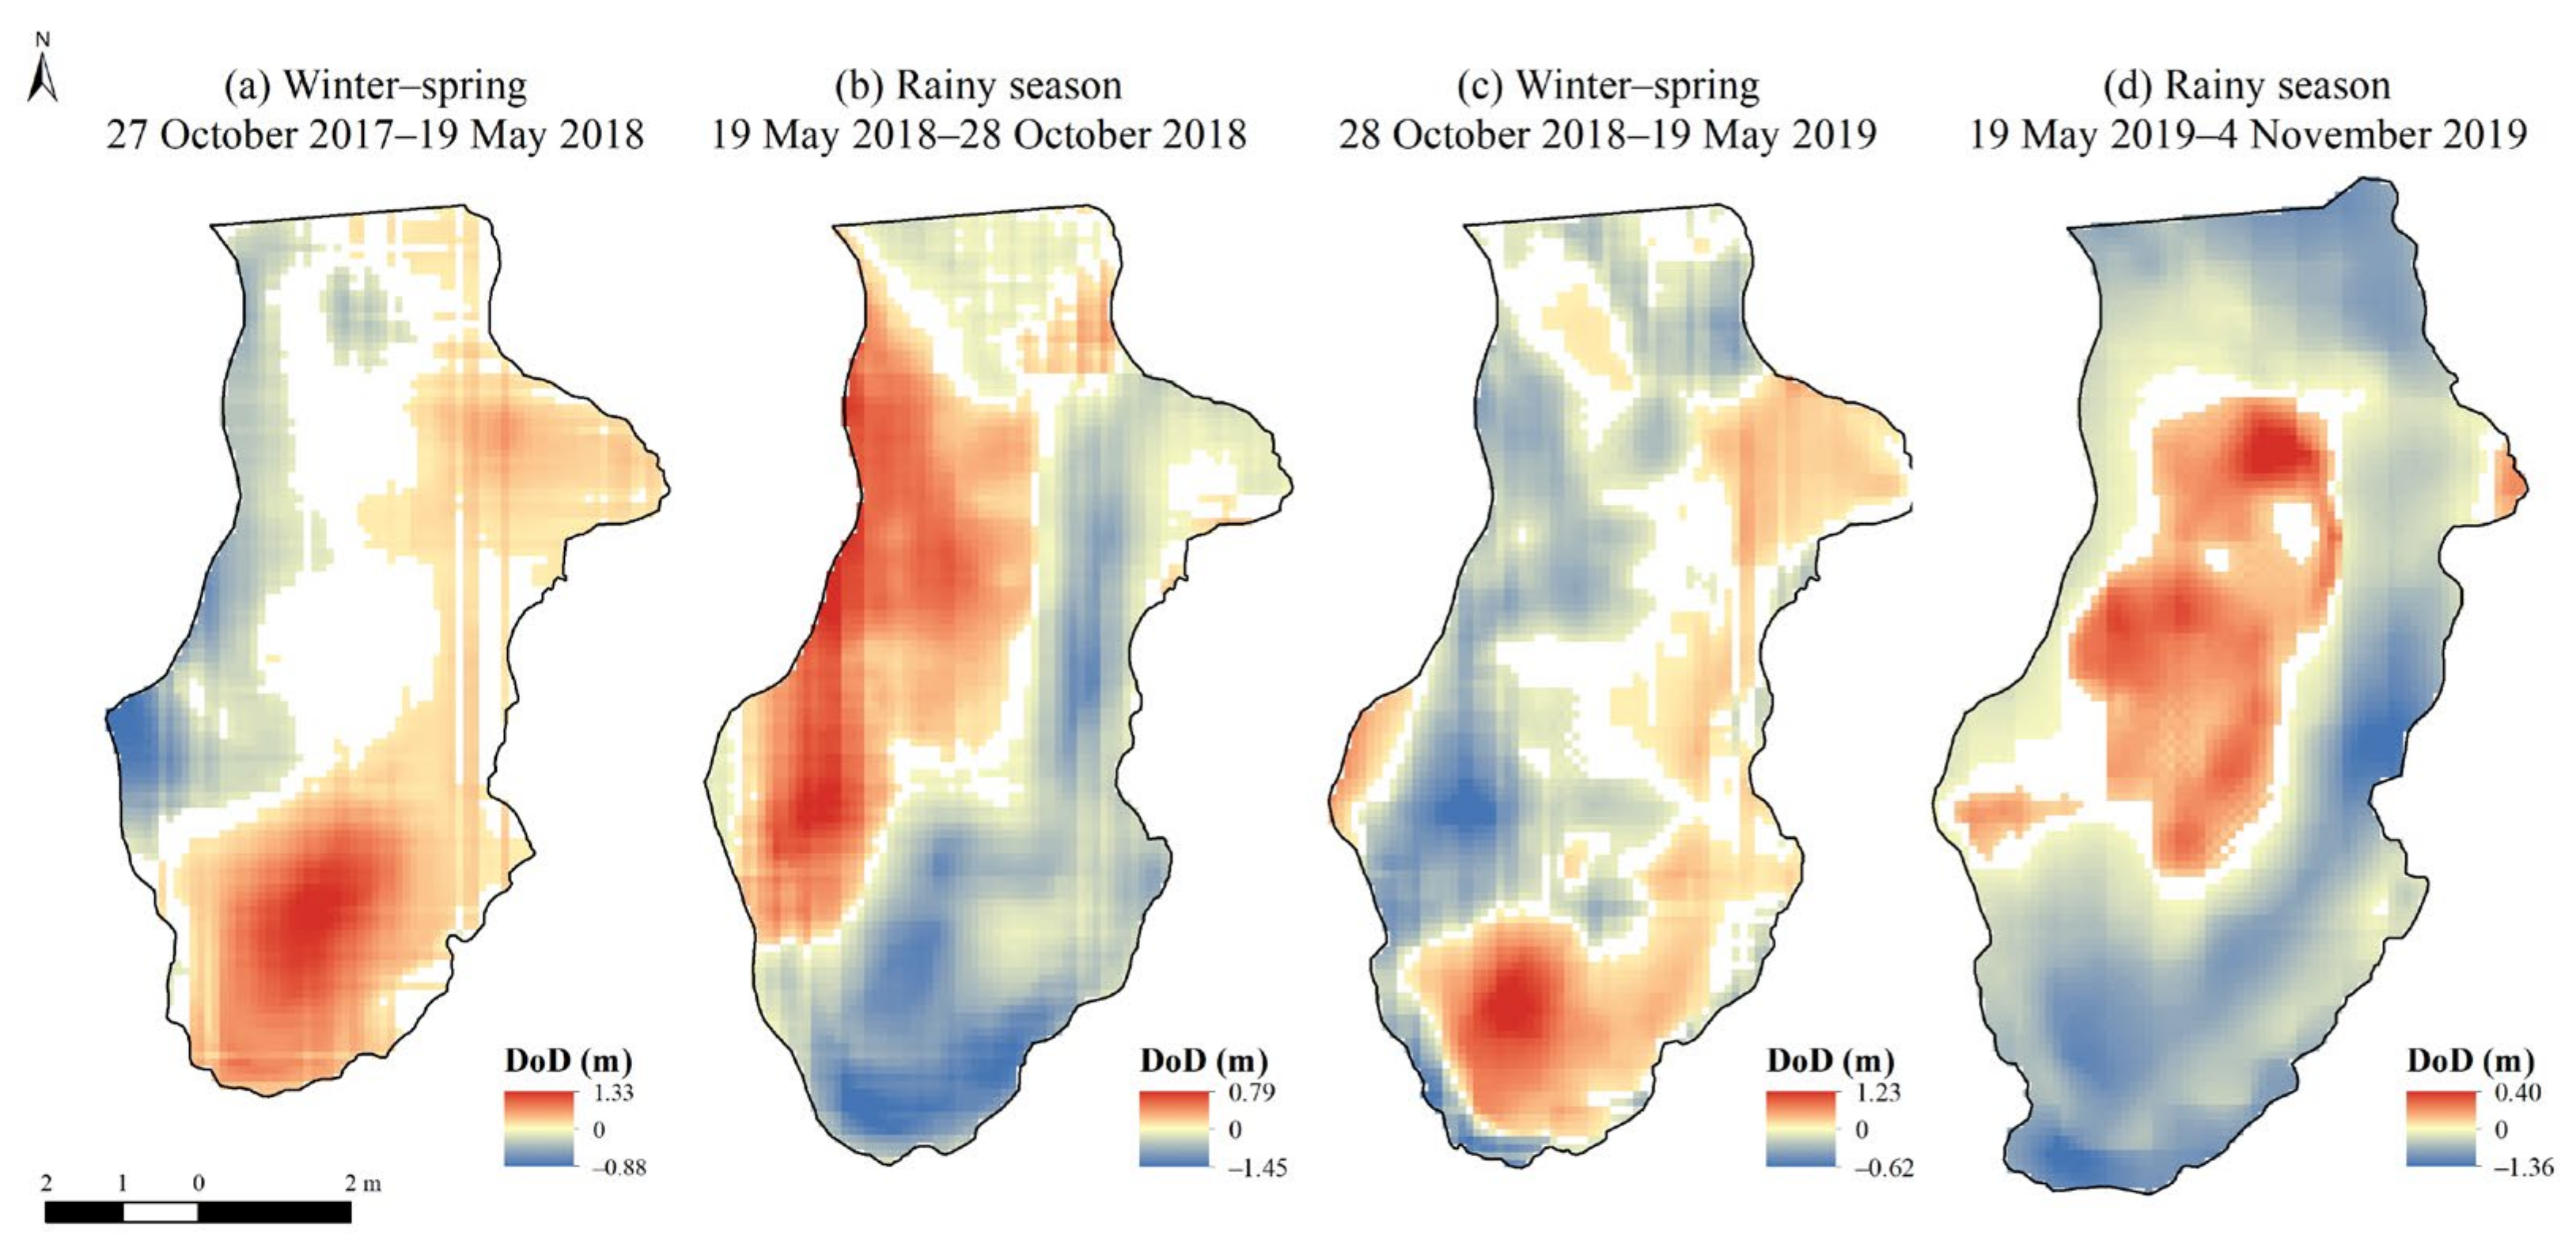
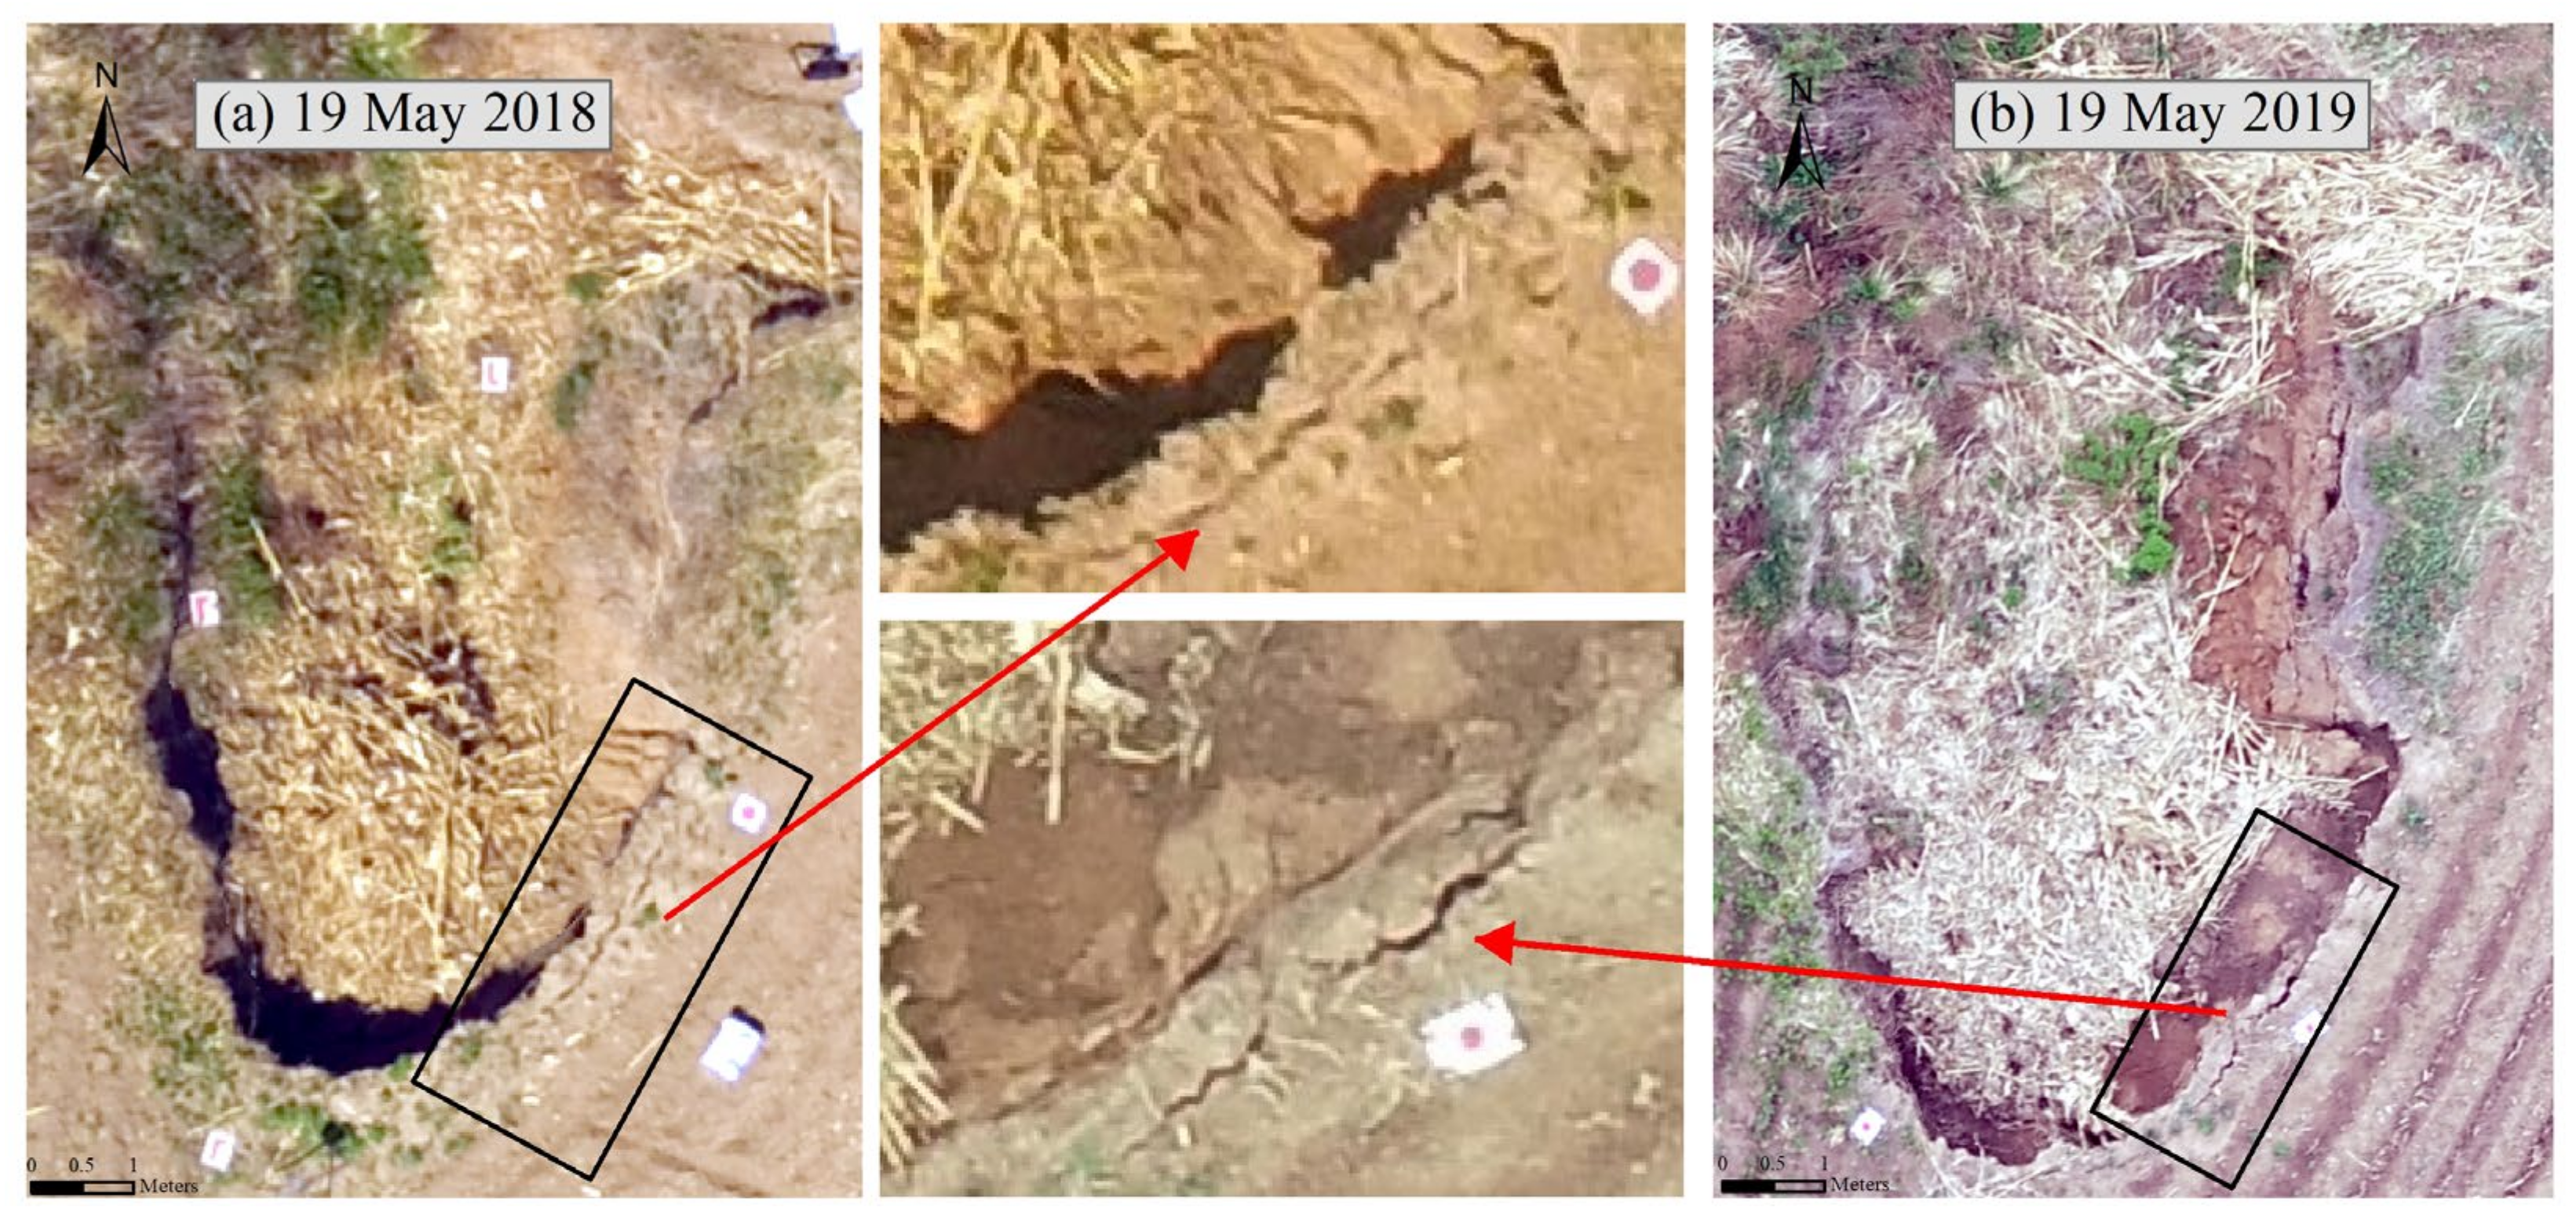
3.2.2. Morphological Changes of the Gully

The large amounts of vegetation coverage in the stable gully posed difficulties in the geomorphologic change monitoring of the gully. We could identify the areas covered with bare soil or a small amount of vegetation owing to the centimeter-level resolution of the UAV orthophoto images. These areas are typically prone to be affected by geomorphological changes (erosion or deposition). We classified the ground objects in the gully according to their location and image features, and we monitored the headcut, sidewall, and gully bed for geomorphological changes (Figure 7).
According to the image features, combined with DTM and the gully edge line in 2020, we observed the geomorphological changes of the gully between 2015 and 2020 (Figure 8). The gully head continuously eroded the farmland, and the expansion of Sidewall-1 was relatively slow. Although the slopes of these sidewalls were steep, the edges of Sidewalls-2–4 were relatively stable, exhibiting minimal change. By comparing vegetation cover and runoff conditions (Figure 6E), we found that the gully headcut and Sidewall-1 were adjacent to cultivated land (i.e., bare soil) and had catchment areas, whereas stable sidewalls were adjacent to broad grass belts and not located on the runoff pathways. Notably, erosion and deposition could still have occurred under the stable gully sidewall edge. We found noticeable runoff at the bottom of the gully, and the gully width was gradually increasing. The width at the bottom of the gully was primarily influenced by runoff discharge [60].
In the two selected representative profiles of the gully, we observed differences between 2015 and 2020 (Figure 9), with widely different geomorphic processes. The surface changes of Profile 1 showed active headcut retreat over the 5 years. The area of Profile 1 in 2015 is where the headcut continued to show undercut erosion and sidewall expansion, until 2017, when the gully bed reached its lowest elevation. Meanwhile, a V-morphology had formed, characterized by a homogeneous and almost constant inclination of the walls as well as a narrow gully bed. Subsequently, with further headcut retreat, Profile 1 became smooth, and the gully bed began to widen and fill with deposits; however, the sidewalls were still expanding. In contrast, Profile 2 maintained a U-morphology over 5 years. Material accumulated continuously at the gully bed, and the elevation of the bottom of the gully bed increased by 0.52 m from 2015 to 2020 (Figure 9b). Further visual analysis of the orthophotos (Figure 1F) demonstrated the possibility of anthropogenic impacts on the gully bed owing to cultivation. The morphology of Profile 2 was well-preserved over long periods, indicating a stabilized gully.

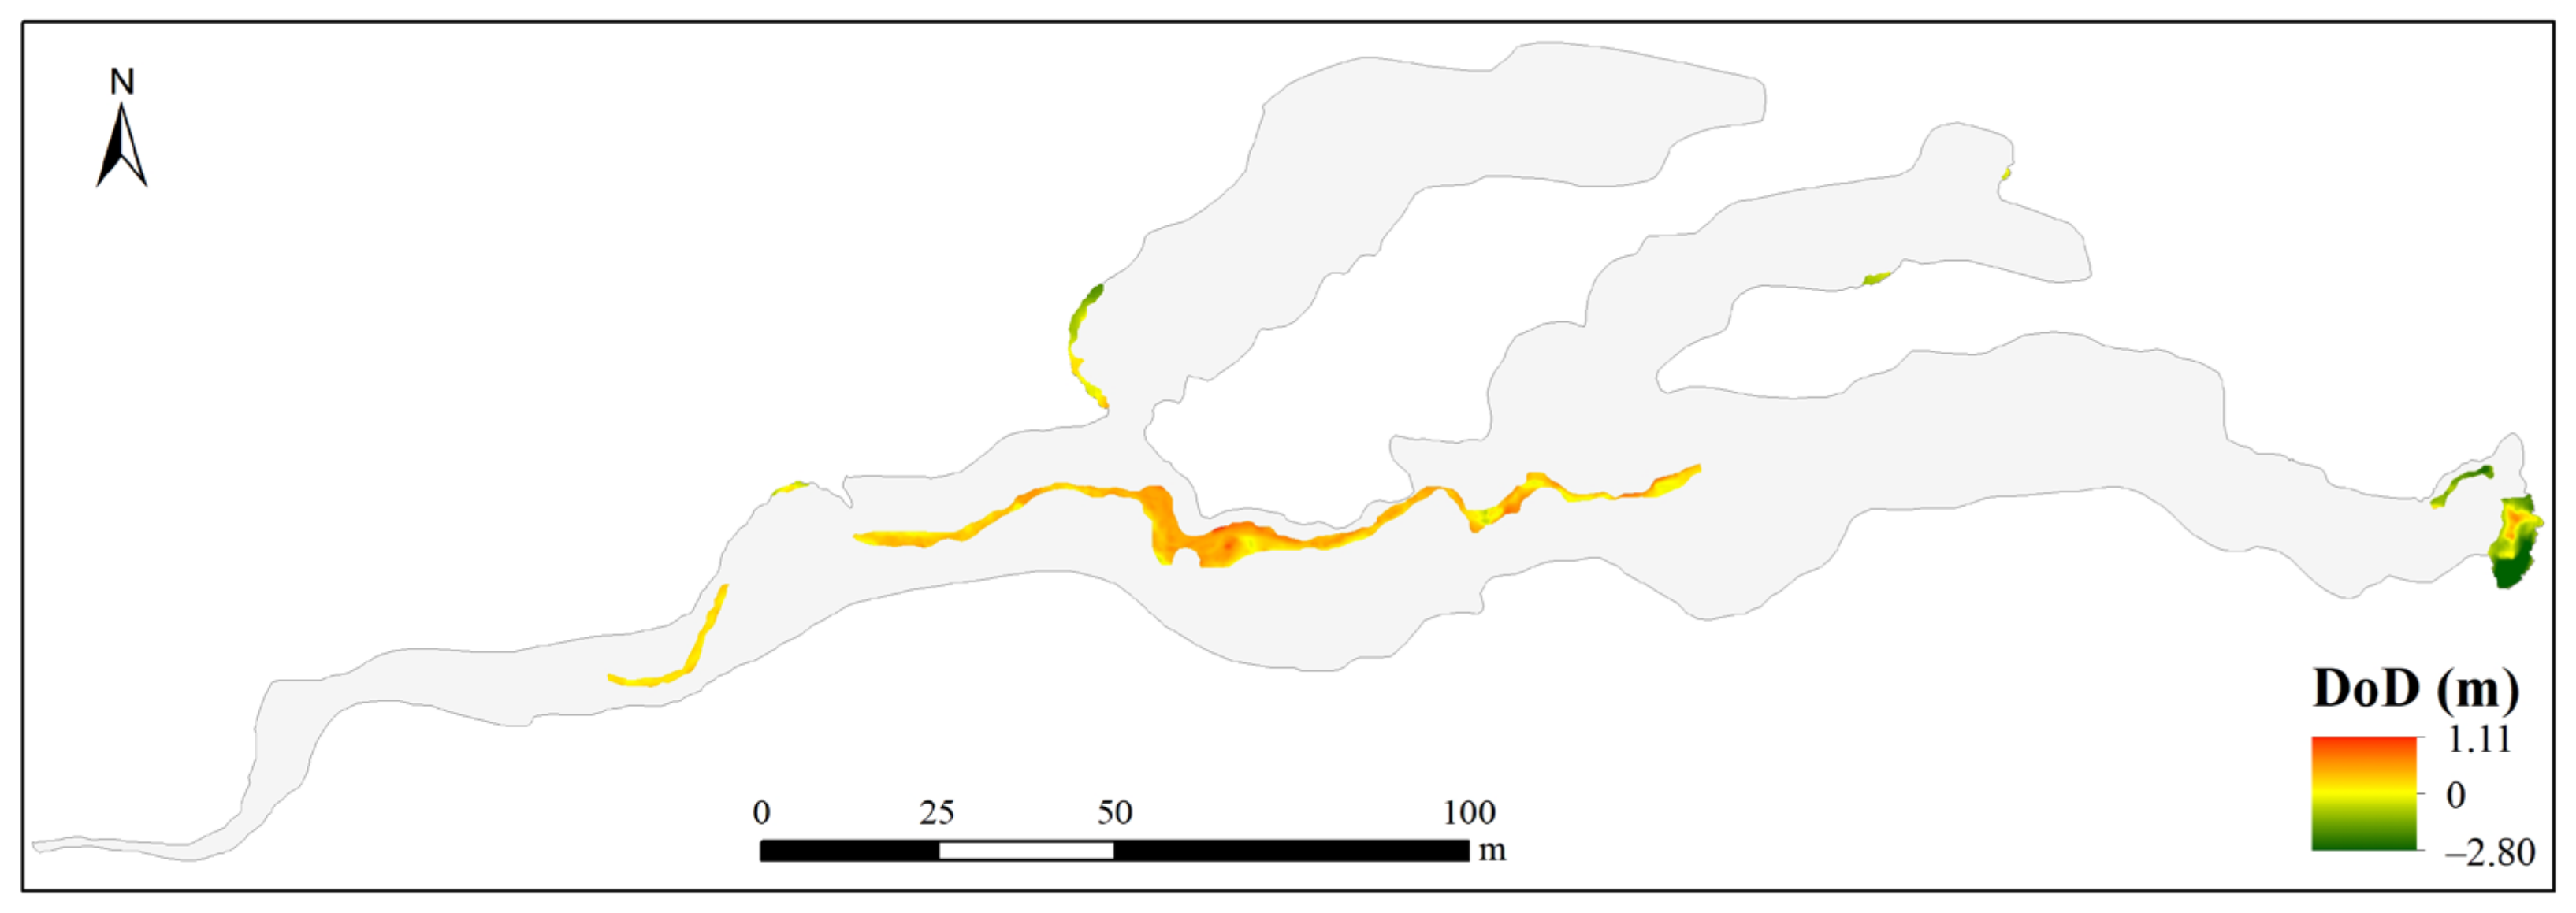
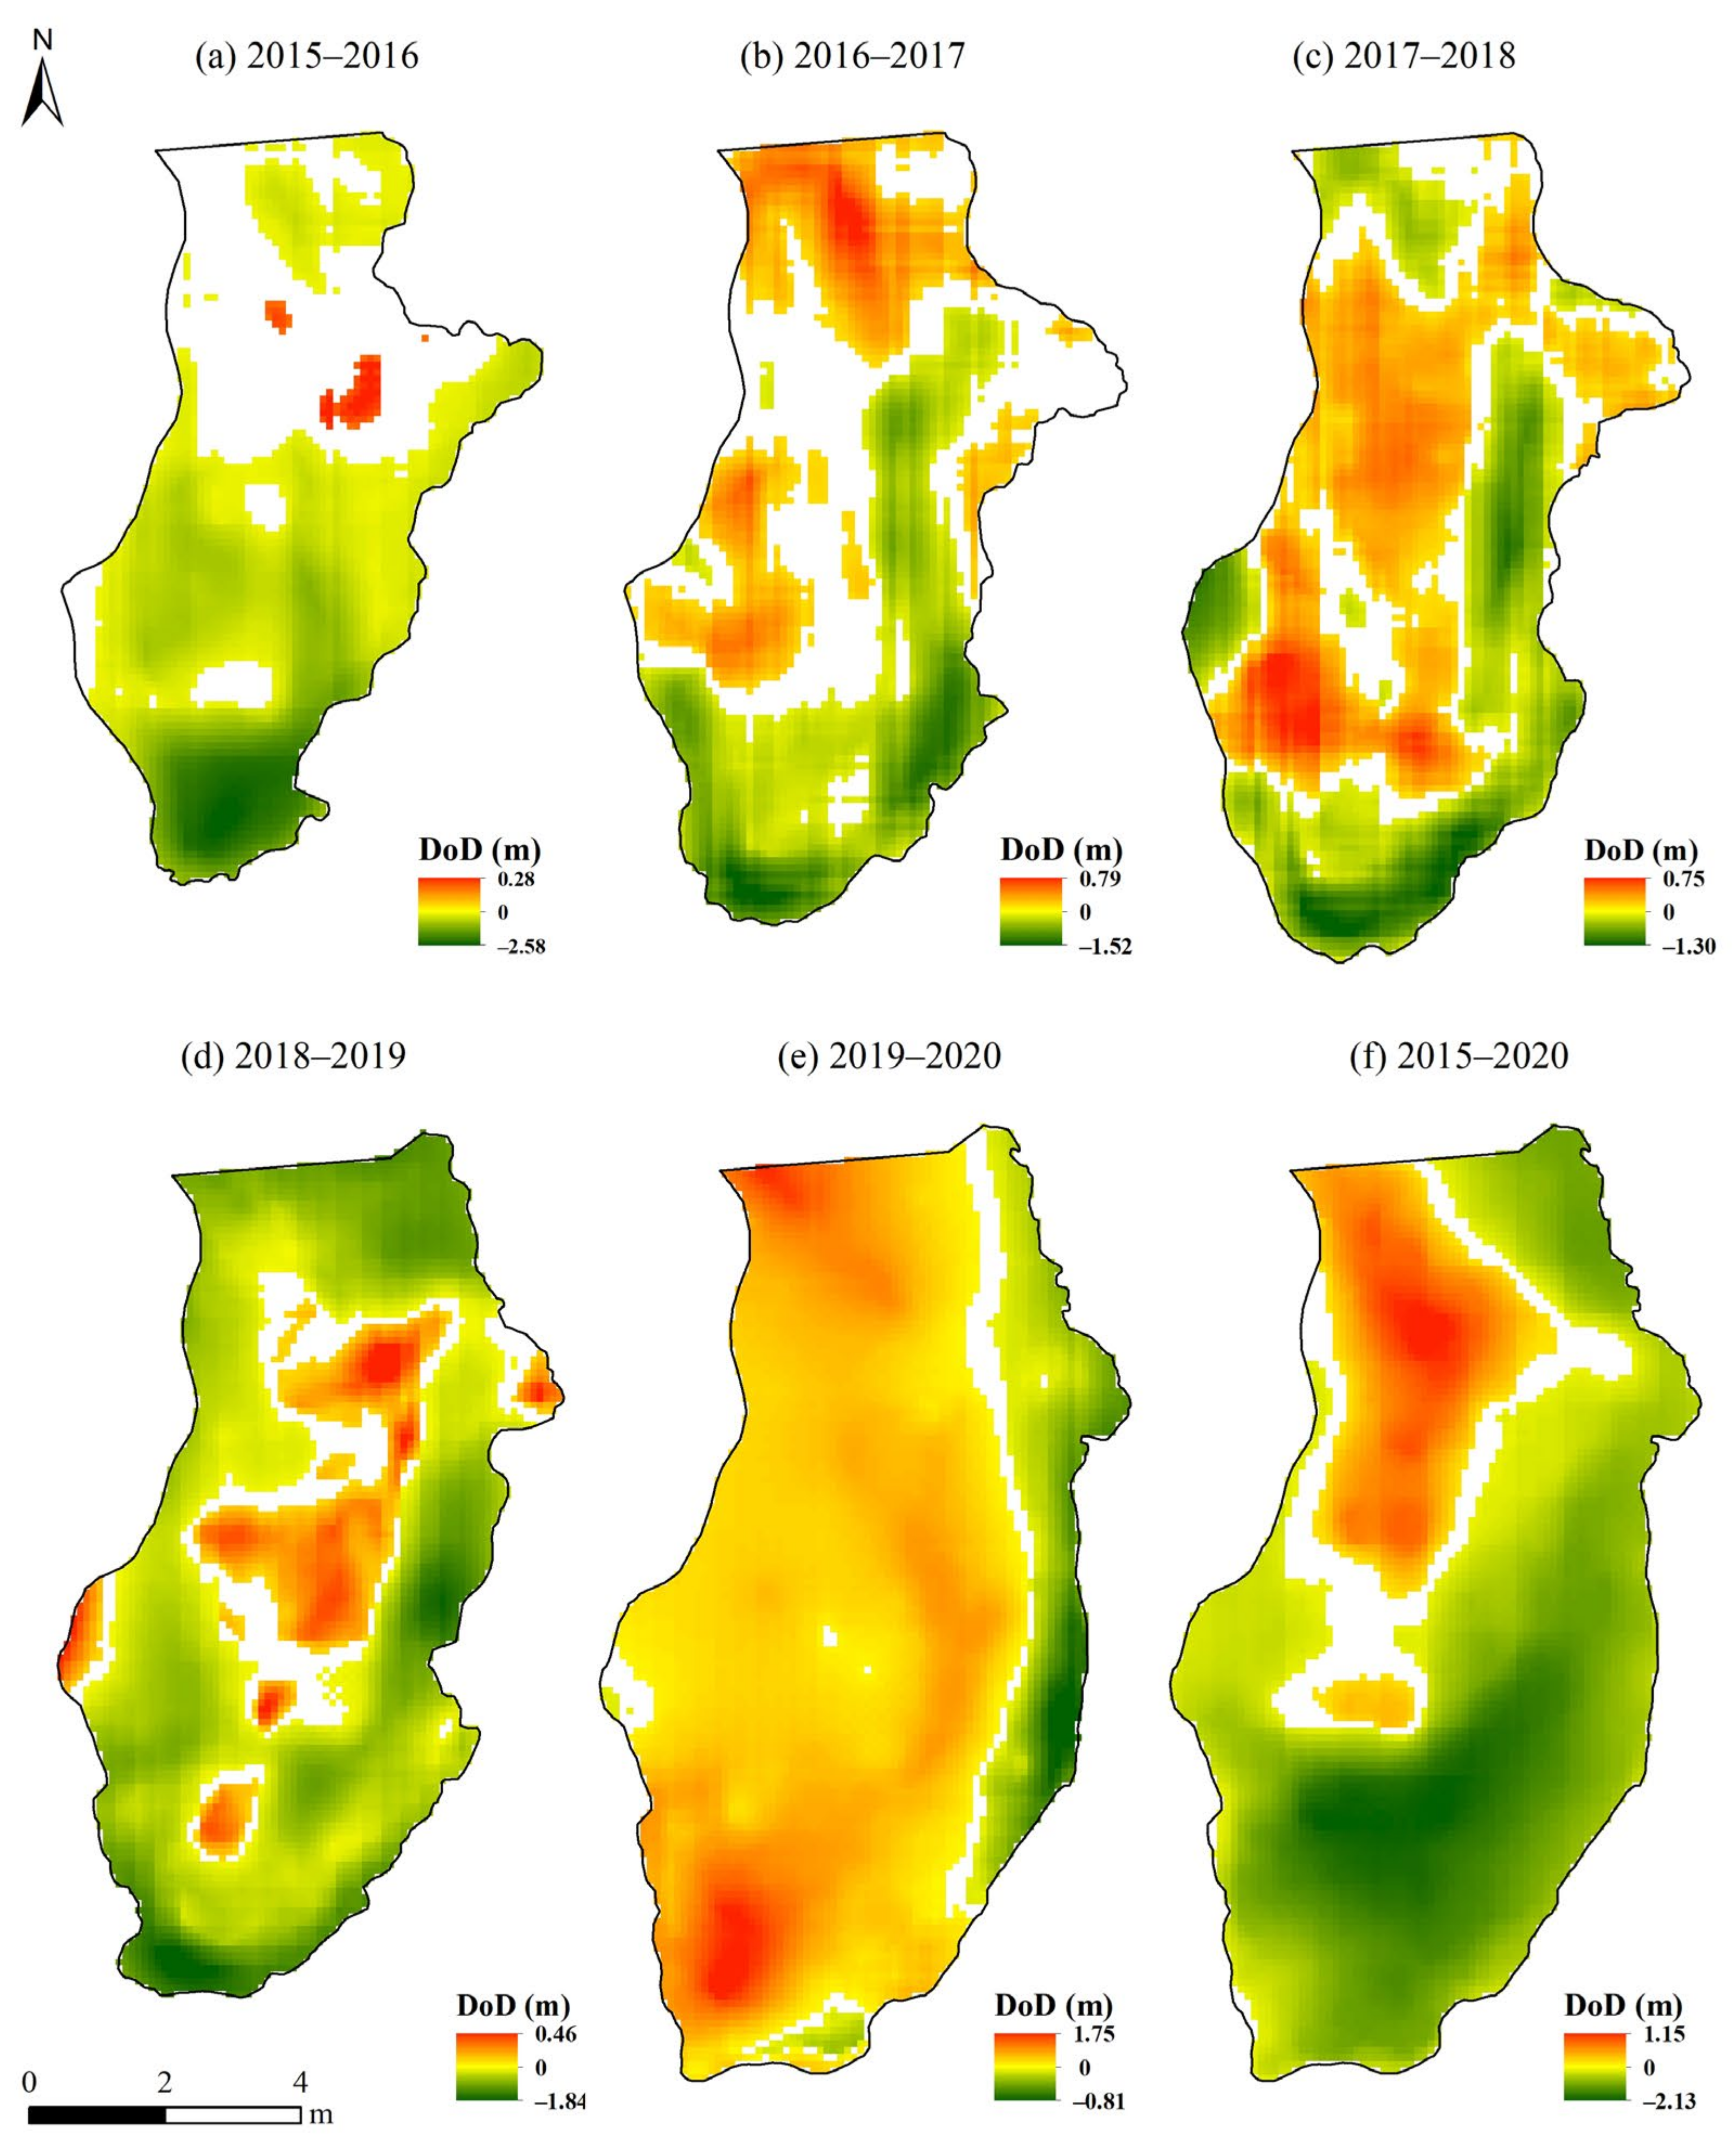
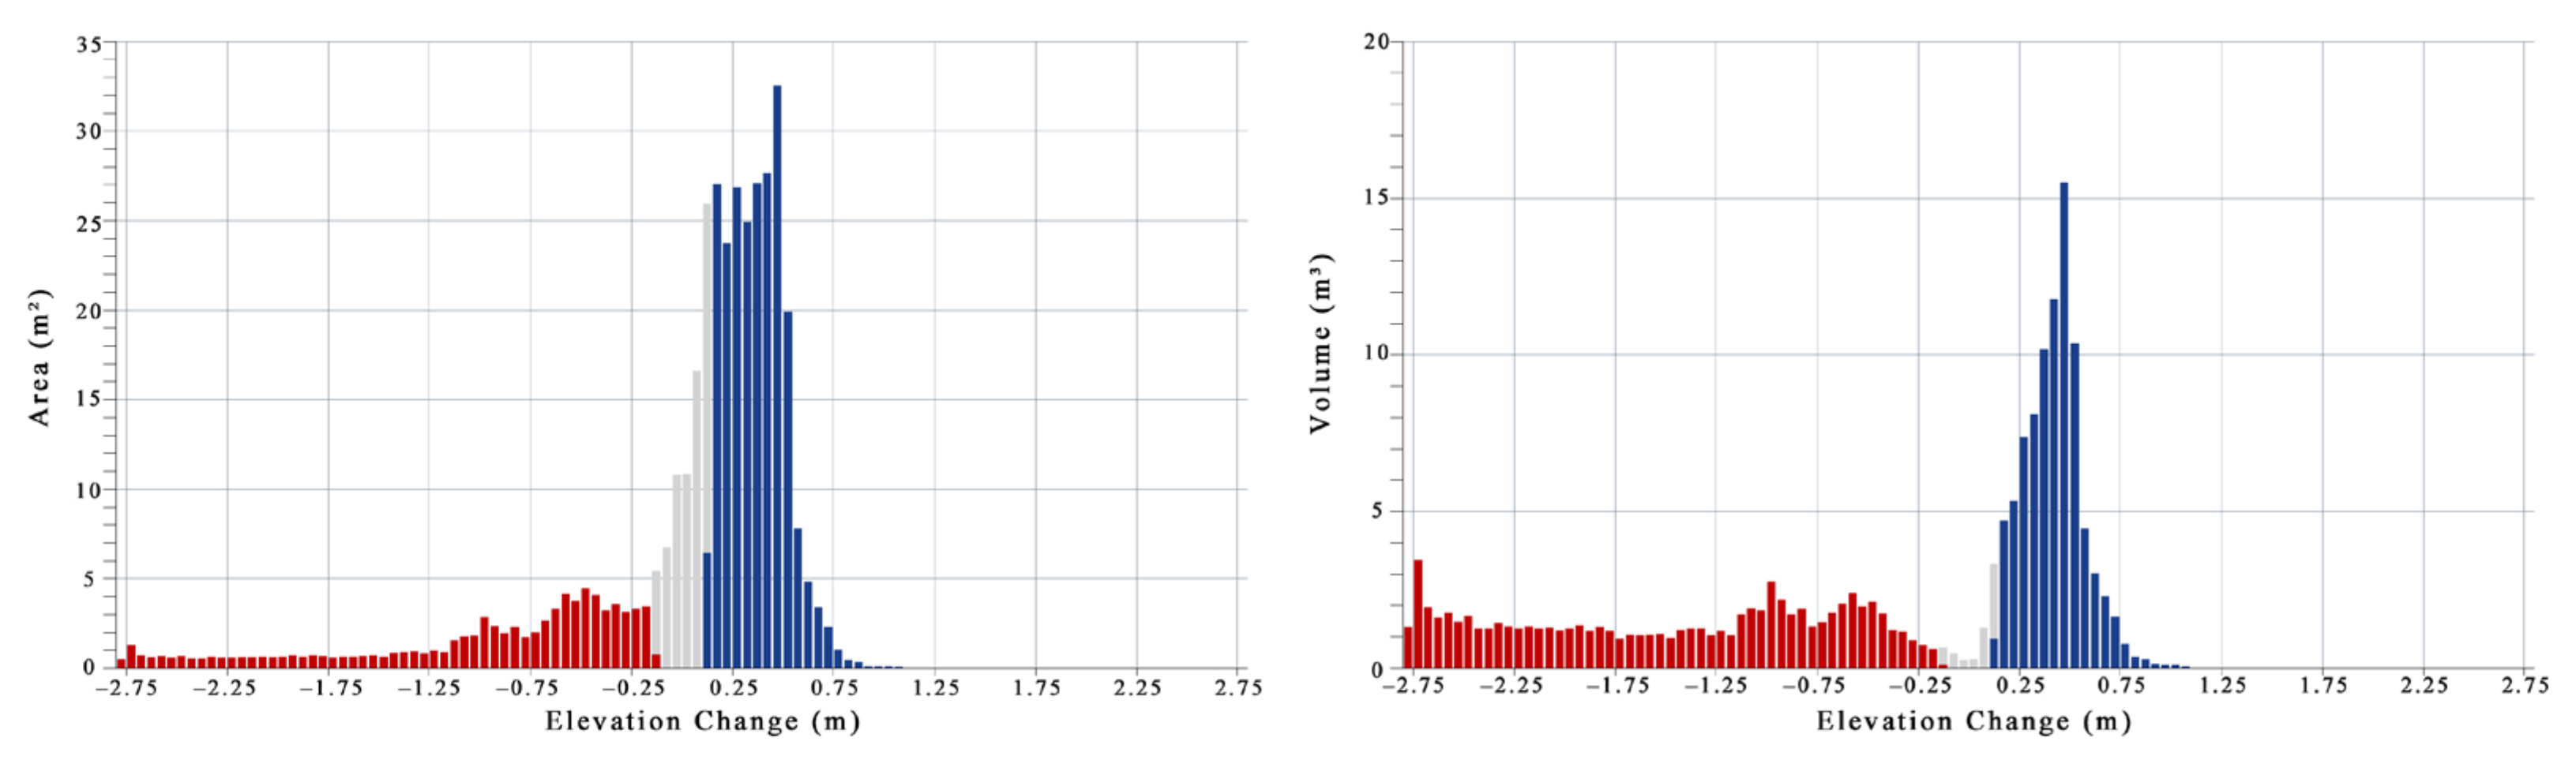
3.2.3. Volume Change

The above-illustrated profiles show a representative example of many possible cross-profiles of gully surfaces. Therefore, further evaluations were necessary to comprehensively assess these multitemporal changes. Based on the DTMs, we detected high-resolution, multitemporal volume changes. We observed that the gully headcut was always the main source of sediment yield over the five-year time interval. In 2016–2017, 2017–2018, and 2019–2020, we ignored the volume changes of the gully and the bed because the bottom of the gully was almost completely covered by an overabundance of vegetation in 2017 and 2020 (Figure 8).
The 2015 and 2019 UAV-derived DoD demonstrated a spatial pattern of large amounts of erosion and deposition in the gully area over the four years (Figure 10). The gully upstream was characterized by widespread erosion, with evidence of gully head cutting as well as the expansion and slumping of the gully sidewalls (Figure 11). The gullies midstream and downstream were characterized by deposition, with evidence of channel width increase and material accumulation at the bottom of the gully. Overall, erosion and deposition areas covered 20.93% and 61.24% of the total area of interest, respectively; however, the area of interest with undetectable change accounted for 17.83% of the total. The average depth that the gully bed lowered and raised was 0.96 m and 0.37 m, respectively. The net volume difference for the analyzed surface was 9.78 m3, with 77.75 m3 of erosion detected and 87.53 m3 of deposition (Figure 12). This finding implies that there was a small net amount of sediment accumulation during the four years in the whole analyzed gully area, which was likely due to the influence of human activities. For example, straw from the surroundings was dumped into the gully, which we interpreted from the UAV orthoimage (Figure 7). The area and volumetric change exhibited a normal distribution correspondence with increasing surface values as well as a relatively uniform distribution correspondence with lowering surface values (Figure 12). Notably, the elevation change value was approximately zero when we used gray color owing to the application of the DoD threshold to evaluate uncertainty.

4. Discussion

4.1. Quality Evaluation of Multitemporal UAV-Based Monitoring

The use of UAVs to observe and quantify gully erosion by generating high-resolution DTMs is now widely established. The accuracy of UAV-derived DTMs relies on some fundamental aspects. Image quality is crucial for photogrammetric measurements and is directly affected by the flight, shooting, and field conditions. The presented five years of UAV surveys involved two types of UAV drones, different flight altitudes, and different numbers and distributions of GCPs. The accuracy of the P4R-derived data was significantly higher than that of P3P because of the built-in RTK-GNSS and additionally captured oblique images. Capturing and including additional oblique views in the images acquired by P4R could significantly reduce DTM errors [61]. Flight altitude may be one of the parameters influencing precision. However, Anders et al. demonstrated that the vertical accuracy of DSMs does not clearly differ with increasing flight altitude [62]. The distribution and number of GCPs are important for accurate photogrammetric restitution [25]. In reality, no clear conclusion yet exists about the relationship between the disposition and abundance of GCPs and accuracy [63]. The number and distribution of GCPs in this study appeared appropriate, considering the decreasing GCP RMSE. The accuracy was similar between flights, particularly in 2019, showing the reproducibility of the products obtained by the UAV-based photogrammetric technique. However, in this study, the usability of UAV data for steep and overhanging gully walls was restricted owing to the limitations of the birds-eye view. The combined use of UAV and terrestrial pictures allows the construction of comprehensive and high-spatial-resolution gully models [30]. Moreover, in vegetated areas, the proposed technique is not fully suitable, thereby posing a challenge for future research. Therefore, we could only consider areas in the gully that were not affected by vegetation in the geomorphological change detection. The combination of UAVs and LiDAR would be promising for geomorphological change detection in vegetated areas [35]. Although DoD analysis may underestimate erosion and deposition owing to the critical threshold used in geomorphic change detection, the estimated sediment yield exhibited no significant deviations [28].
In this study, we used UAV data to accurately identify and monitor five years (2015–2020) of morphological changes in the active headcut of a stabilized gully. In contrast, very-high-resolution satellite images, such as Pleiades having a 0.7 m resolution, do not allow this degree of detail. The 2015 and 2020 Pleiades satellite images considerably improved the identification of gully erosion and even showed the change in the headcut (Figure 13). However, this level of morphological change could not be accurately quantified owing to various uncertainties and could not be accepted as a real change, as the positioning accuracy error of satellite images was typically two to three pixels, and deviation was caused by manually digitizing the gully edge. Compared with high-resolution satellite images, the multitemporal UAV data exhibited strong adaptability and many advantages for the assessment of short–medium-term (≤5 years) gully erosion rates in this region.

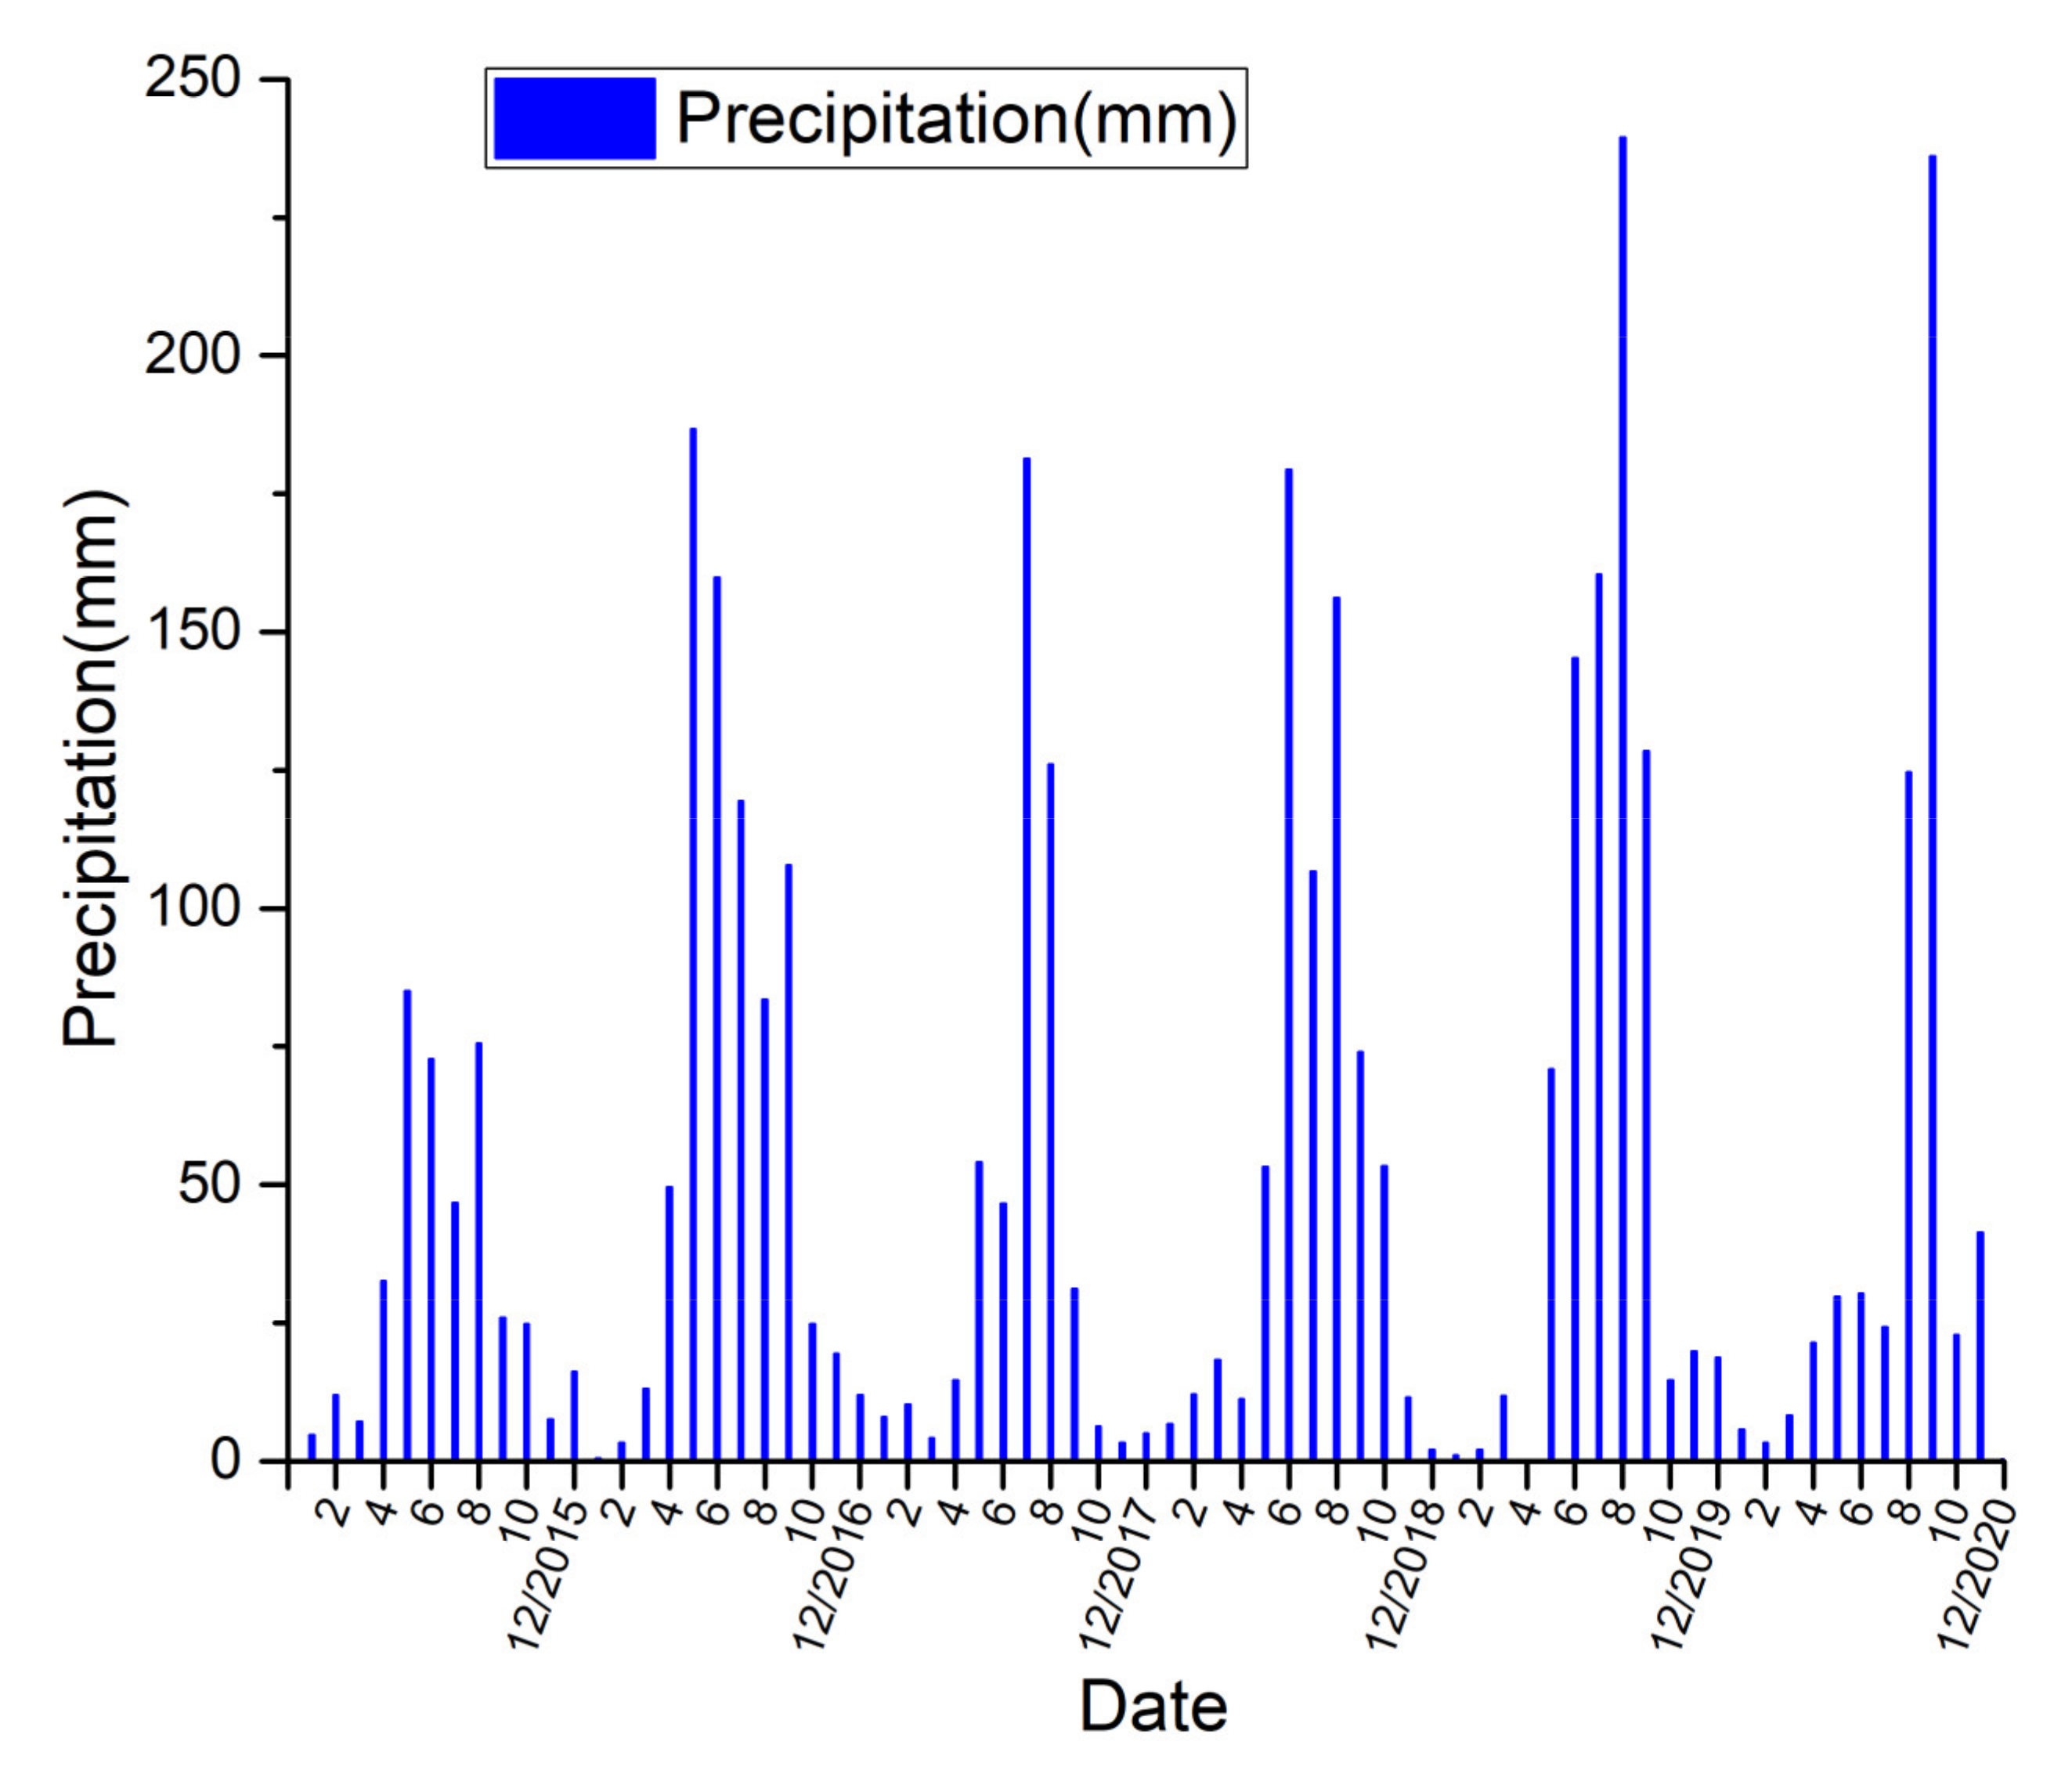
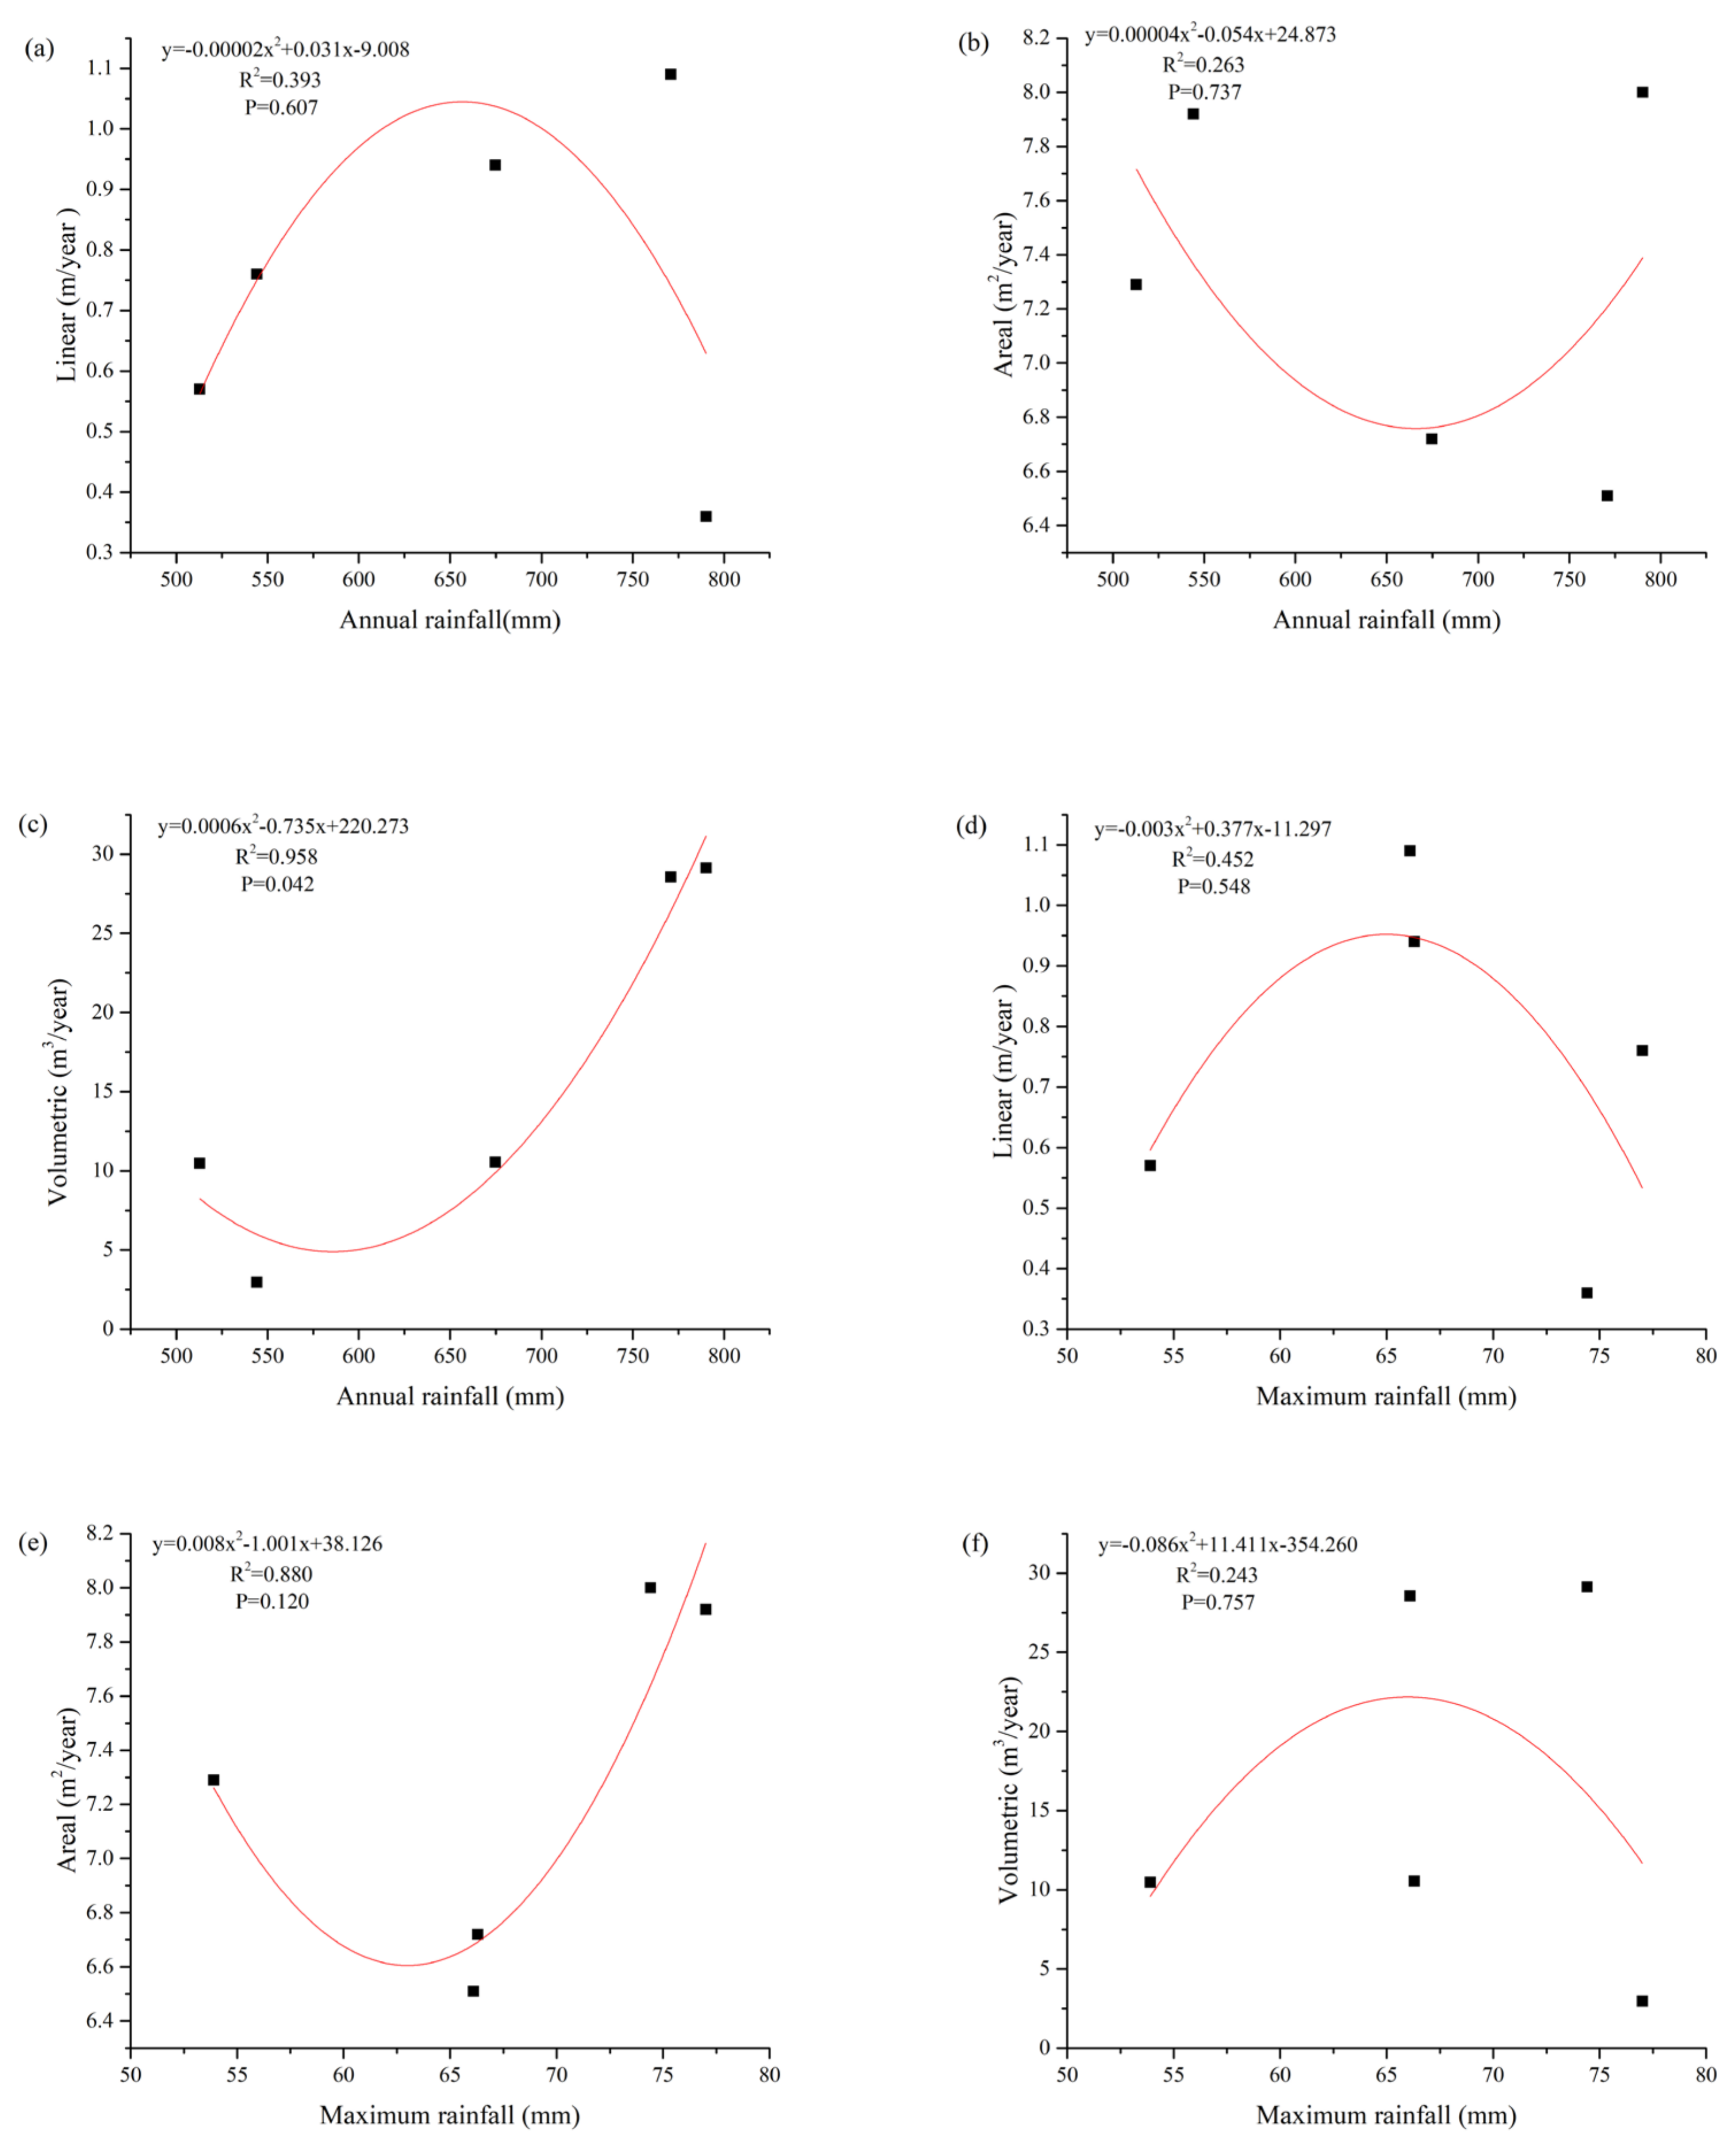
4.2. Headcut Retreat Rates and Environmental Factors

This “stabilized” gully has an actively retreating headcut, implying that the lower section of the gully is stabilizing while the gully headcut is extremely active. Headcut retreat is the major process through which the gully expanded and largely contributed to the soil loss in the whole analyzed gully area. Based on the high-resolution, multitemporal, UAV-derived data, we detected annual (2015–2020) variations in gully headcut retreat (GHR), including the linear, areal, and volumetric retreat rates (Figure 11 and Figure 14, Table 4). The linear GHR rate in the study area, of 0.74 m year−1, was lower than the global median GHR rate of 0.89 m year−1; however, the areal and volumetric GHR rates in the study area, of 7.29 m2 year−1 and 9.66 m3 year−1, respectively, were significantly higher than the global median GHR rates of 3.1 m2 year−1 and 2.2 m3 year−1, respectively [60]. Compared with the median GHR rates worldwide, the headcut retreat we identified likely contributes more to the soil loss with a similar linear GHR rate, primarily owing to the weak soil erodibility resistance, concentrated rainfall, strong freeze–thaw action, undulating terrain of the black soil region, and the long-term human activities of cultivation and overgrazing [64].
However, compared with the existing research on the northern black soil region of northeast China [16,36,37,38], the southern region exhibited a lower GHR rate. Compared with the northern region, the southern black soil region has higher rainfall erosivity but a shorter slope length; the freeze–thaw duration is shorter, and the temperature difference during the thawing period is smaller [65]. With the increase in slope length, the development space of the gully increases, and the runoff acceleration increases. Moreover, the longer the freeze–thaw duration and the larger the temperature difference during the thawing period, the more the aggravation of damage to the soil structure and the more the reduction in soil corrosion resistance. The differences in terrain, freezing–thaw duration, and temperature resulted in the rainfall erosivity having stronger and weaker effects on gully development in the northern and southern regions, respectively [65].
Through multitemporal UAV images and field investigation, we found that the land use, soil characteristic, tillage practices, and crop types in the selected area did not change considerably. The topographic factors, particularly the upstream area of the gully headcut, changed slightly in this short-term study. The variations in the GHR rates were primarily related to rainfall intensity changes (Table 4). The volumetric retreat rates were strongly correlated with annual rainfall (R2 = 0.958, P = 0.042), and the parabolic function was similar to that in the northern black soil region [36]. However, except for the previous case, we found no significant relationships between the GHR rates and annual or maximum rainfall (Figure 15). One of the major reasons for this finding may be related to the short measuring period (5 years). A meta-analysis of measured GHR rates worldwide revealed that average GHR rates measured over short (<5 years) periods may have large (>100%) uncertainties [59]. Another important reason for this finding is related to human activities. The straw dumped into the gully headcut would have remarkably affected the measured GHR rates, particularly the volumetric retreat rates.

4.3. Seasonal Variations in Gully Erosion Induced by Various Forces

Gully development processes exhibit large seasonal variations, which are induced by multiple forces including freeze–thaw cycles, snow melting, and rainfall in the black soil region of China [7,66]. In this study, we compared the results of six UAV campaigns conducted between 27 October 2017, and 4 November 2019, to estimate seasonal gully changes (Figure 16). The results showed that gully head expansion and net erosion dominated in the rainy season, whereas tensional cracks developed on the sidewall in winter–spring, without marked net erosion (Table 5); these findings are similar to those of previous studies [13,36,66]. During winter–spring, a series of tensional cracks parallel to the sidewalls formed on the top of the sidewalls of the gully head owing to freeze–thaw processes. The cracks further expanded due to the surface runoff caused by the spring snowmelt when the temperature rose (Figure 17). At this time, the upper part of the gully head was almost suspended, and it was only maintained above the sidewall by the adhesive force of the soil layer. Only a small part of the gully head collapsed under the action of gravity and runoff caused by the spring snowmelt and little rainfall, whereas the sidewall collapsed primarily in the rainy season (Table 5, Figure 16a,c and Figure 17), which was different from the processes in the northern black soil region in northeast China [36,38]. The main reason for these differences may be that the freeze–thaw duration is shorter and the temperature difference during the thawing period in the southern black soil region is smaller, leading to relatively minor damage to the soil structure [65]. The action of gravity and runoff caused by the spring snowmelt was insufficient to cause a large number of cracked sidewalls to collapse in the winter–spring. GHR in the rainy season accounted for 94.62% of the annual linear erosion and 87.64% of the areal erosion in 2017–2019 (Table 5). In particular, the sidewall collapse and gully head expansion dominated in the early rainy season (19 May–1 July 2019), which accounted for 66.67% of the annual linear erosion and 49% of the areal erosion (Table 5). Under the influence of gravity and runoff caused by rainfall, the suspended part of the sidewall slid to the bottom and became vertical to the ground. As the rainfall in the rainy season was more abundant, the runoff not only transported the accumulated material at the bottom to the downstream area but also repeatedly scoured the lower part of the gully head sidewall, which resulted in the upper part of the gully head being almost suspended at the end of the rainy season (Figure 18). We consider that the cyclic process maybe an important mechanism for gully head development, which is induced by multiple forces in the southern black soil region in northeast China. Nevertheless, the data obtained are limited. We will continue to investigate more gully erosion for explaining the patterns of development of gully erosion in this region.

5. Conclusions

The present work is a contribution to periodic, high-resolution, short–medium-term, annual, and seasonal surface reconstruction for gully erosion to obtain the erosion rates and the spatial distribution of erosion/deposition at a watershed scale. We used a combination of multitemporal UAV images and SfM technologies to quantitatively evaluate the geomorphological and volume changes of a “stabilized” gully in a small agricultural watershed in the northern black soil region of northeast China over a five-year interval. The resolution of the UAV-derived orthoimages and DSMs ranged from 1.21 to 2.61 cm. The major landscape behavior can be captured by the high spatiotemporal resolution products. For example, in the upstream area that drained to the gully headcut, we computed a concentrated runoff pathway, which corresponds with the field observation. Despite the poorest accuracy occurring for the 2015 flight, the total RMSE of the GCPs ranged from 1.10 to 3.83 cm between 2016 and 2020. The accuracy was similar between flights, particularly in 2019, showing the reproducibility of the products obtained by the UAV-based photogrammetric technique. Compared with the submeter-resolution satellite images, the multitemporal UAV data exhibited adaptability and advantages for the assessment of short–medium-term (≤5 years) gully erosion rates in this region.
We periodically monitored, both annually and seasonally, the areas covered with bare soil or a small amount of vegetation. The results demonstrated that GHR was the major process through which the gully was expanding and strongly contributed to the soil loss in the whole analyzed area of the gully. Short–medium-term (5 years) linear, areal, and volumetric GHR rates were 0.74 m year−1, 7.29 m2 year−1, and 9.66 m3 year−1, respectively. The volumetric retreat rates were strongly correlated with annual rainfall (R2 = 0.958, P = 0.042). Gully head expansion and net erosion dominated in the rainy season, whereas the sidewalls tension crack development occurred in winter–spring, without marked net erosion. GHR in the rainy season accounted for 94.62% of the annual linear erosion and 87.64% of the areal erosion. In particular, sidewall collapse and gully head expansion dominated in the early rainy season, which accounted for 66.67% of the annual linear erosion and 49% of the areal erosion. However, only a small part of the gully head collapsed under the action of gravity and runoff, caused by the spring snowmelt and little rainfall, whereas the sidewalls collapsed primarily in the rainy season, which was different from the process in the northern black soil region in northeast China.
These periodic high-resolution, short–medium-term, annual, and seasonal observations considerably improve our understanding of the processes and mechanisms of gully erosion caused by multiple forces. However, the suitability of the proposed technique in vegetated areas is limited; therefore, combining UAV and LiDAR is a promising method for geomorphological change detection in vegetated areas. In the future, techniques and algorithms need to be continuously developed to better tailor the workflow to different vegetation, shadow, and lighting conditions in multitemporal UAV-based monitoring.

Author Contributions

Conceptualization, R.W. and J.Y.; data curation, R.W., J.Y. and S.Z.; investigation, R.W., H.S. and H.F.; methodology, R.W.; writing—original draft, R.W., N.W. and Q.L.; writing—review and editing, all. All authors have read and agreed to the published version of the manuscript.

Funding

This research was supported by the National Natural Science Foundation of China (no. 41801350), the Natural Science Foundation of Jilin Province (no. 20200201040JC), the Natural Science Foundation for Youth of Shanxi Province (no. 201901D211119), and the Scientific and Technological Innovation Programs of Higher Education Institutions in Shanxi (no. 2020L0042).

Institutional Review Board Statement

Not applicable.

Informed Consent Statement

Not applicable.

Data Availability Statement

Not applicable.

Acknowledgments

We thank our partners who provided all the help during the research process and the team for their great support.

Conflicts of Interest

The authors declare no conflict of interest.

References

  1. Hayas, A.; Poesen, J.; Vanwalleghem, T. Rainfall and vegetation effects on temporal variation of topographic thresholds for gully initiation in mediterranean cropland and olive groves. Land Degrad. Dev. 2017, 28, 2540–2552. [Google Scholar] [CrossRef]
  2. Verstraeten, G.; Poesen, J. The nature of small-scale flooding, muddy floods and retention pond sedimentation in central Belgium. Geomorphology 1999, 29, 275–292. [Google Scholar] [CrossRef]
  3. Poesen, J.; Nachtergaele, J.; Verstraeten, G.; Valentin, C. Gully erosion and environmental change: Importance and research needs. Catena 2003, 50, 91–133. [Google Scholar] [CrossRef]
  4. Ionita, I.; Fullen, M.A.; Zgłobicki, W.; Poesen, J. Gully erosion as a natural and human-induced hazard. Nat. Hazards 2015, 79, 1–5. [Google Scholar] [CrossRef] [Green Version]
  5. Liu, B.; Yan, B.; Bo, S.; Wang, Z.; Xin, W. Current status and comprehensive control strategies of soil erosion for cultivated land in the Northeastern black soil area of China. Sci. Soil Water Conserv. 2008, 6, 1–8. [Google Scholar] [CrossRef]
  6. Yang, J.C.; Zhang, S.W.; Chang, L.P.; Li, F.; Li, T.Q.; Gao, Y. Gully erosion regionalization of black soil area in northeastern China. Chinese Geogr. Sci. 2017, 27, 78–87. [Google Scholar] [CrossRef] [Green Version]
  7. Zheng, F.L.; Zhang, J.Q.; Liu, G.; Fan, H.M.; Wang, B.; Shen, H.O. Characteristics of soil erosion on sloping farmlands and key fields for studying compound soil erosion caused by multi-forces in Mollisol Region of Northeast China. Bull. Soil Water Conserv. 2019, 39, 314–319. [Google Scholar] [CrossRef]
  8. Pineux, N.; Lisein, J.; Swerts, G.; Bielders, C.L.; Lejeune, P.; Colinet, G.; Degré, A. Can DEM time series produced by UAV be used to quantify diffuse erosion in an agricultural watershed? Geomorphology 2017, 280, 122–136. [Google Scholar] [CrossRef]
  9. Castillo, C.; Gómez, J.A. A century of gully erosion research: Urgency, complexity and study approaches. Earth-Sci. Rev. 2016, 160, 300–319. [Google Scholar] [CrossRef]
  10. Vandekerckhove, L.; Poesen, J.; Wijdenes, D.O.; Gyssels, G. Short-term bank gully retreat rates in Mediterranean environments. Catena 2001, 44, 133–161. [Google Scholar] [CrossRef]
  11. Casali, J.; Loizu, J.; Campo, M.A.; de Santisteban, L.M.; Alvarez-Mozos, J. Accuracy of methods for field assessment of rill and ephemeral gully erosion. Catena 2006, 67, 128–138. [Google Scholar] [CrossRef]
  12. Castillo, C.; Perez, R.; James, M.R.; Quinton, J.N.; Taguas, E.V.; Gomez, J.A. Comparing the accuracy of several field methods for measuring gully erosion. Soil Sci Soc. Am. J. 2012, 76, 1319–1332. [Google Scholar] [CrossRef] [Green Version]
  13. Ionita, I. Gully development in the Moldavian Plateau of Romania. Catena 2006, 68, 133–140. [Google Scholar] [CrossRef]
  14. Wu, Y.Q.; Cheng, H. Monitoring of gully erosion on the Loess Plateau of China using a global positioning system. Catena 2005, 63, 154–166. [Google Scholar] [CrossRef]
  15. Goodwin, N.R.; Armston, J.; Stiller, I.; Muir, J. Assessing the repeatability of terrestrial laser scanning for monitoring gully topography: A case study from Aratula, Queensland, Australia. Geomorphology 2016, 262, 24–36. [Google Scholar] [CrossRef]
  16. Wu, Y.; Zheng, Q.; Zhang, Y.; Liu, B.; Cheng, H.; Wang, Y. Development of gullies and sediment production in the black soil region of northeastern China. Geomorphology 2008, 101, 683–691. [Google Scholar] [CrossRef]
  17. Yan, Y.C.; Zhang, S.W.; Yue, S.P. Application of corona and spot imagery on erosion gully research in typical black soil regions of Northeast China. Resour. Sci. 2006, 27, 650–656. [Google Scholar]
  18. Xu, Q.; Kou, P.; Wang, C.; Yunus, A.P.; Xu, J.; Peng, S.; He, C. Evaluation of gully head retreat and fill rates based on high-resolution satellite images in the loess region of China. Environ. Earth Sci. 2019, 78, 465. [Google Scholar] [CrossRef]
  19. Shruthi, R.B.V.; Kerle, N.; Jetten, V.; Abdellah, L.; Machmach, I. Quantifying temporal changes in gully erosion areas with object oriented analysis. Catena 2015, 128, 262–277. [Google Scholar] [CrossRef]
  20. Daba, S.; Rieger, W.; Strauss, P. Assessment of gully erosion in eastern Ethiopia using photogrammetric techniques. Catena 2003, 50, 273–291. [Google Scholar] [CrossRef]
  21. Martinez-Casasnovas, J.A. A spatial information technology approach for the mapping and quantification of gully erosion. Catena 2003, 50, 293–308. [Google Scholar] [CrossRef]
  22. D’Oleire-Oltmanns, S.; Marzolff, I.; Peter, K.D.; Ries, J.B. Unmanned aerial vehicle (UAV) for monitoring soil erosion in Morocco. Remote Sens. 2012, 4, 3390–3416. [Google Scholar] [CrossRef] [Green Version]
  23. Wang, R.; Zhang, S.; Pu, L.; Yang, J.; Yang, C.; Chen, J.; Guan, C.; Wang, Q.; Chen, D.; Fu, B. Gully erosion mapping and monitoring at multiple scales based on multi-source remote sensing data of the Sancha River Catchment, Northeast China. ISPRS Int. J. Geo-Inf. 2016, 5, 200. [Google Scholar] [CrossRef] [Green Version]
  24. Ries, J.B.; Marzolff, I. Monitoring of gully erosion in the Central Ebro Basin by large-scale aerial photography taken from a remotely controlled blimp. Catena 2003, 50, 309–328. [Google Scholar] [CrossRef]
  25. Marzolff, I.; Poesen, J. The potential of 3D gully monitoring with GIS using high-resolution aerial photography and a digital photogrammetry system. Geomorphology 2009, 111, 48–60. [Google Scholar] [CrossRef]
  26. Colomina, I.; Molina, P. Unmanned aerial systems for photogrammetry and remote sensing: A review. ISPRS J. Photogramm 2014, 92, 79–97. [Google Scholar] [CrossRef] [Green Version]
  27. Westoby, M.J.; Brasington, J.; Glasser, N.F.; Hambrey, M.J.; Reynolds, J.M. ‘Structure-from-Motion’ photogrammetry: A low-cost, effective tool for geoscience applications. Geomorphology 2012, 179, 300–314. [Google Scholar] [CrossRef] [Green Version]
  28. Gong, C.; Lei, S.; Bian, Z.; Liu, Y.; Zhang, Z.; Cheng, W. Analysis of the development of an erosion gully in an open-pit coal mine dump during a winter freeze-thaw cycle by using low-cost UAVs. Remote Sens. 2019, 11, 1356. [Google Scholar] [CrossRef] [Green Version]
  29. Kou, P.; Xu, Q.; Yunus, A.P.; Ju, Y.; Guo, C.; Wang, C.; Zhao, K. Multi-temporal UAV data for assessing rapid rill erosion in typical gully heads on the largest tableland of the Loess Plateau, China. Bull. Eng. Geol. Environ. 2019, 79, 1861–1877. [Google Scholar] [CrossRef]
  30. Stocker, C.; Eltner, A.; Karrasch, P. Measuring gullies by synergetic application of UAV and close range photogrammetry—A case study from Andalusia, Spain. Catena 2015, 132, 1–11. [Google Scholar] [CrossRef]
  31. Eltner, A.; Baumgart, P.; Maas, H.G.; Faust, D. Multi-temporal UAV data for automatic measurement of rill and interrill erosion on loess soil. Earth Surf. Proc. Land 2015, 40, 741–755. [Google Scholar] [CrossRef]
  32. Kaiser, A.; Neugirg, F.; Rock, G.; Muller, C.; Haas, F.; Ries, J.; Schmidt, J. Small-scale surface reconstruction and volume calculation of soil erosion in complex Moroccan gully morphology using structure from motion. Remote Sens. 2014, 6, 7050–7080. [Google Scholar] [CrossRef] [Green Version]
  33. White, J.C.; Wulder, M.A.; Vastaranta, M.; Coops, N.C.; Pitt, D.; Woods, M. The utility of image-based point clouds for forest inventory: A comparison with airborne laser scanning. Forests 2013, 4, 518–536. [Google Scholar] [CrossRef] [Green Version]
  34. Ouédraogo, M.M.; Degré, A.; Debouche, C.; Lisein, J. The evaluation of unmanned aerial system-based photogrammetry and terrestrial laser scanning to generate DEMs of agricultural watersheds. Geomorphology 2014, 214, 339–355. [Google Scholar] [CrossRef]
  35. Cook, K.L. An evaluation of the effectiveness of low-cost UAVs and structure from motion for geomorphic change detection. Geomorphology 2017, 278, 195–208. [Google Scholar] [CrossRef]
  36. Dong, Y.; Wu, Y.; Qin, W.; Guo, Q.; Yin, Z.; Duan, X. The gully erosion rates in the black soil region of northeastern China: Induced by different processes and indicated by different indexes. Catena 2019, 182, 104146. [Google Scholar] [CrossRef]
  37. Wen, Y.; Kasielke, T.; Li, H.; Zepp, H.; Zhang, B. A case-study on history and rates of gully erosion in Northeast China. Land Degrad. Dev. 2021, 32, 4254–4266. [Google Scholar] [CrossRef]
  38. Hu, G.; Wu, Y.; Liu, B.; Yu, Z.; You, Z.; Zhang, Y. Short-term gully retreat rates over rolling hill areas in black soil of Northeast China. Catena 2007, 71, 321–329. [Google Scholar] [CrossRef]
  39. Zhang, S.; Wang, X.; Xiao, Z.; Qu, F.; Wang, X.; Li, Y.; Aurangzeib, M.; Zhang, X.; Liu, X. Quantitative studies of gully slope erosion and soil physiochemical properties during freeze-thaw cycling in a Mollisol region. Sci. Total Environ. 2020, 707, 136191. [Google Scholar] [CrossRef]
  40. Huang, D.; Su, L.; Zhou, L.; Fan, H. Gully is the dominant sediment source of snowmelt erosion in the black soil region—A case study. Soil Tillage Res. 2022, 215, 105232. [Google Scholar] [CrossRef]
  41. Xu, J.; Li, H.; Liu, X.; Hu, W.; Yang, Q.; Hao, Y.; Zhen, H.; Zhang, X. Gully erosion induced by snowmelt in Northeast China: A case Study. Sustainability 2019, 11, 2088. [Google Scholar] [CrossRef] [Green Version]
  42. Hu, L.-J.; Wang, L.; Zhang, F. New explanations for gully formation on farmlands in China’s Mollisols region: Fissure evidence by spring freeze-thaw actions. J. Soil Water Conserv. 2021, 76, 89A. [Google Scholar] [CrossRef]
  43. Xu, X.; Zheng, F.; Wilson, G.V.; He, C.; Lu, J.; Bian, F. Comparison of runoff and soil loss in different tillage systems in the Mollisol region of Northeast China. Soil Tillage Res. 2018, 177, 1–11. [Google Scholar] [CrossRef]
  44. Frankl, A.; Nyssen, J.; de Dapper, M.; Haile, M.; Billi, P.; Munro, R.N.; Deckers, J.; Poesen, J. Linking long-term gully and river channel dynamics to environmental change using repeat photography (Northern Ethiopia). Geomorphology 2011, 129, 238–251. [Google Scholar] [CrossRef]
  45. Frankl, A.; Poesen, J.; Haile, M.; Deckers, J.; Nyssen, J. Quantifying long-term changes in gully networks and volumes in dryland environments: The case of Northern Ethiopia. Geomorphology 2013, 201, 254–263. [Google Scholar] [CrossRef] [Green Version]
  46. Eltner, A.; Kaiser, A.; Castillo, C.; Rock, G.; Neugirg, F.; Abellan, A. Image-based surface reconstruction in geomorphometry—Merits, limits and developments of a promising tool for geoscientists. Image 2015, 3, 1445–1508. [Google Scholar]
  47. Furukawa, Y.; Ponce, J. Accurate, dense, and robust multiview stereopsis. IEEE Trans. Pattern Anal. Mach. Intell. 2007, 32, 1362–1376. [Google Scholar] [CrossRef] [PubMed]
  48. Becker, C.; Häni, N.; Rosinskaya, E.; d’Angelo, E.; Strecha, C. Classification of aerial photogrammetric 3D point clouds. arXiv 2017, arXiv:1705.08374. [Google Scholar]
  49. Yang, S.; Guan, Y.; Zhao, C.; Zhang, C.; Bai, J.; Chen, K. Determining the influence of catchment area on intensity of gully erosion using high-resolution aerial imagery: A 40-year case study from the Loess Plateau, northern China. Geoderma 2019, 347, 90–102. [Google Scholar] [CrossRef]
  50. Wheaton, J.M.; Brasington, J.; Darby, S.E.; Sear, D.A. Accounting for uncertainty in DEMs from repeat topographic surveys: Improved sediment budgets. Earth Surf. Processes Landf. J. Br. Geomorphol. Res. Group 2010, 35, 136–156. [Google Scholar] [CrossRef]
  51. Bezak, N.; Grigillo, D.; Urbančič, T.; Mikoš, M.; Petrovič, D.; Rusjan, S. Geomorphic response detection and quantification in a steep forested torrent. Geomorphology 2017, 291, 33–44. [Google Scholar] [CrossRef]
  52. Gómez-Gutiérrez, Á.; Schnabel, S.; Berenguer-Sempere, F.; Lavado-Contador, F.; Rubio-Delgado, J. Using 3D photo-reconstruction methods to estimate gully headcut erosion. Catena 2014, 120, 91–101. [Google Scholar] [CrossRef]
  53. Brasington, J.; Rumsby, B.T.; McVey, R.A. Monitoring and modelling morphological change in a braided gravel-bed river using high resolution GPS-based survey. Earth Surf. Proc. Land 2000, 25, 973–990. [Google Scholar] [CrossRef]
  54. Brasington, J.; Langham, J.; Rumsby, B. Methodological sensitivity of morphometric estimates of coarse fluvial sediment transport. Geomorphology 2003, 53, 299–316. [Google Scholar] [CrossRef]
  55. Vericat, D.; Smith, M.; Brasington, J. Patterns of topographic change in sub-humid badlands determined by high resolution multi-temporal topographic surveys. Catena 2014, 120, 164–176. [Google Scholar] [CrossRef]
  56. James, M.R.; Robson, S.; Smith, M.W. 3-D uncertainty-based topographic change detection with structure-from-motion photogrammetry: Precision maps for ground control and directly georeferenced surveys. Earth Surf. Proc. Land 2017, 42, 1769–1788. [Google Scholar] [CrossRef]
  57. Moeyersons, J.; Makanzu Imwangana, F.; Dewitte, O. Site- and rainfall-specific runoff coefficients and critical rainfall for mega-gully development in Kinshasa (DR Congo). Nat. Hazards 2015, 79, 203–233. [Google Scholar] [CrossRef]
  58. Rossi, M.; Torri, D.; Santi, E. Bias in topographic thresholds for gully heads. Nat. Hazards 2015, 79, 51–69. [Google Scholar] [CrossRef]
  59. Vanmaercke, M.; Poesen, J.; van Mele, B.; Demuzere, M.; Bruynseels, A.; Golosov, V.; Bezerra, J.F.R.; Bolysov, S.; Dvinskih, A.; Frankl, A.; et al. How fast do gully headcuts retreat? Earth-Sci. Rev. 2016, 154, 336–355. [Google Scholar] [CrossRef]
  60. Nachtergaele, J.; Poesen, J.; Sidorchuk, A.; Torri, D. Prediction of concentrated flow width in ephemeral gully channels. Hydrol. Process. 2002, 16, 1935–1953. [Google Scholar] [CrossRef]
  61. James, M.R.; Robson, S. Mitigating systematic error in topographic models derived from UAV and ground-based image networks. Earth Surf. Proc. Land 2014, 39, 1413–1420. [Google Scholar] [CrossRef] [Green Version]
  62. Anders, N.; Smith, M.; Suomalainen, J.; Cammeraat, E.; Valente, J.; Keesstra, S. Impact of flight altitude and cover orientation on Digital Surface Model (DSM) accuracy for flood damage assessment in Murcia (Spain) using a fixed-wing UAV. Earth Sci. Inform. 2020, 13, 391–404. [Google Scholar] [CrossRef] [Green Version]
  63. Rock, G.; Ries, J.; Udelhoven, T. Sensitivity Analysis of UAV-Photogrammetry for Creating Digital Elevation Models (DEM). In Proceedings of the Conference on Unmanned Aerial Vehicle in Geomatics, Zurich, Switzerland, 14–16 September 2011; pp. 69–73. [Google Scholar]
  64. Fan, H.; Gu, G.; Wang, Y.; Zhong, Y. Characteristics of eroded gully development and environment of black soil region in Northeast China. Soil Water Conserv. China 2013, 379, 75–79. [Google Scholar] [CrossRef]
  65. Gu, G.; Wang, Y.; Zhong, Y.; Liu, J.; Fan, H.; Liu, L. Development characteristics of gullies in rolling hilly regions in Northeast of China. Res. Soil Water Conserv. 2015, 22, 47. [Google Scholar]
  66. Hu, G.; Wu, Y.Q.; Liu, B.Y.; Zhang, Y.G.; You, Z.M.; Yu, Z.T. The characteristics of gully erosion over rolling hilly black soil areas of Northeast China. J. Geogr. Sci. 2009, 19, 309–320. [Google Scholar] [CrossRef]
Figure 1. Location of the study area. (A) Typical black soil area in China; (B) Pleiades-1A imagery (2013) of the study area; (C) Corona KH-4A imagery (1965) of the gully; and (D) Phantom 4 RTK UAV imagery of the gully and distribution of the ground control points (GCPs). The geographic coordinate system and projection were set to CGCS2000_3_Degree_GK_CM_126E. Detailed map of Profile 1 (E) and Profile 2 (F).
Remotesensing 14 01479 g001
Figure 2. Photographs of the drones and ground control points (GCPs). (A) Phantom 3 Professional UAV; (B) Phantom 4 RTK UAV; (C) GCPs were measured with a Trimble RTK; and (D) inset shows a close-up of a GCP in the P3P UAV photograph from the May 2018 survey.
Remotesensing 14 01479 g002
Figure 3. Timing of the UAV surveys for monitoring gully erosion.
Remotesensing 14 01479 g003
Figure 4. Monthly rainfall at Jiutai Station (~38 km from the study site).
Remotesensing 14 01479 g004
Figure 5. (a,b) Vertical difference between UAV-DTM/DSM-derived surface (solid line) and geodetic measured surface (dash line) for Profiles 1 and 2; (c) box plot of the height error (elevation difference between UAV and field measurements) for Profiles 1 and 2.
Remotesensing 14 01479 g005aRemotesensing 14 01479 g005b
Figure 6. Topographic information of the gully: (A) elevation; (B) slope; (C) aspect; (D) watershed and runoff pathways; (E) P4R UAV photo of a concentrated runoff pathway in the upstream area draining to the gully headcut, obtained on 1 July 2019.
Remotesensing 14 01479 g006
Figure 7. Classification of ground objects in the gully (P4R UAV orthophoto image obtained on 19 May 2019).
Remotesensing 14 01479 g007
Figure 8. Morphological changes of the gully between 2015 and 2020 based on UAV orthophotos.
Remotesensing 14 01479 g008
Figure 9. Profiles 1 (a) and 2 (b) illustrate surface changes from 2015 until 2020 in the gully. h, the elevation difference at the bottom of the gully bed between 2015 and 2020.
Remotesensing 14 01479 g009
Figure 10. DoD map of the gully (elevation in 2019–elevation in 2015).
Remotesensing 14 01479 g010
Figure 11. DoD map of the headcut in 2015–2020.
Remotesensing 14 01479 g011
Figure 12. Histograms of areal and volumetric change distribution. Positive values indicate deposition, and negative values indicate erosion.
Remotesensing 14 01479 g012
Figure 13. Comparison of high-resolution satellite (Pleiades) and UAV images for monitoring the gully headcut retreat between 2015 and 2020.
Remotesensing 14 01479 g013
Figure 14. Headcut retreat between 2015 and 2020.
Remotesensing 14 01479 g014
Figure 15. Parabolic relationships between annual and maximum rainfall and annual gully headcut: (a,d) linear, (b,e) areal, and (c,f) volumetric retreat rates.
Remotesensing 14 01479 g015
Figure 16. DoD map of the seasonal variations in the gully head (2017–2019).
Remotesensing 14 01479 g016
Figure 17. Tension crack development in the retreating headcut.
Remotesensing 14 01479 g017
Figure 18. Picture of the gully head acquired in October 2017.
Remotesensing 14 01479 g018
Table 1. UAV specifications (from https://www.dji.com/cn, accessed on 5 February 2022).
AircraftPhantom 3 ProfessionalPhantom 4 RTK
Weight1280 g1391 g
Maximum flight speed16 m/s (ATTI mode)50 km/h (P-mode)
58 km/h (A-mode)
Flight time~23 min/sortie~30 min/sortie
Camera sensor1/2.3 inch CMOS with effective Pixel of 12.4 MP1 inch CMOS with effective pixels of 20 MP
Camera lensFOV 94° 20 mm (35 mm format equivalent) f/2.8 auto focus at ∞FOV 84° 8.8 mm/24 mm (35 mm format equivalent) f/2.8–f/11 auto focus at 1 m–∞
GNSSSingle-frequency GNSS module: GPS/GLONASS(1) Single-frequency GNSS module: GPS + BeiDou + Galileo
(2) Multi-frequency, multi-system, high-precision RTK-GNSS
Table 2. Accuracy parameters of the photogrammetric processing (GSD, ground sample distance; MRE, mean reprojection error; camera optimization, relative difference between the initial and optimized internal camera parameters; GCP, ground control point; and RMSE, root mean square error).
UAV31 October 20154 November 201627 October 201719 May 201828 October 201819 May 20191 July 20194 November 20194 November 2020
Drone P3PP3PP3PP3PP3PP4RP4RP4RP4R
Flight height (m)405050502550807040
No. images calibrated223509193333754280142203462
GSD (cm)1.742.212.522.71.511.722.612.051.21
MRE (pixels)0.2790.1478410.2090.2740.2170.1380.1490.1880.195
Camera optimization7.33%4.48%0.43%4.98%3.90%0.45%0.61%0%0.58%
No. of GCPs5825121420171015
RMSE/X (cm)3.944.393.562.893.800.920.962.261.21
RMSE/Y (cm)7.503.282.663.653.051.300.902.030.79
RMSE/Z (cm)6.653.814.572.421.962.272.072.021.37
Total RMSE (cm)6.033.833.602.992.941.501.312.101.10
Table 3. Vertical differences in the RMSE between the geodetic measured points and the DTM/DSM points obtained from a UAV in 2019.
AccuracyDTMDSM
AllProfile 1Profile 2AllProfile 1Profile 2
RMSE (m)0.230.170.270.720.230.92
Table 4. Variations in the gully headcut retreat rate and environmental factors.
Monitoring PeriodRainfallUpstream Area of the Headcut Annual Gully Headcut Retreat Rate
Annual Rainfall (mm)Maximum Rainfall (mm)Initial (m2)Final (m2)Linear (m/year)Areal (m2/year)Volumetric (m3/year)
31 October 2015–4 November 2020719.3779735.279698.830.747.299.66
31 October 2015–4 November 2016770.966.19735.279728.761.096.5128.55
4 November 2016–27 October 2017512.953.99728.769721.470.577.2910.48
27 October 2017–28 October 2018674.766.39721.479714.750.946.7210.55
28 October 2018–4 November 2019790.274.49714.759706.750.368.0029.13
4 November 2019–4 November 2020544.1779706.759698.830.767.922.97
Table 5. Annual and seasonal variations in gully headcut retreat.
Monitoring PeriodPrecipitation (mm) During the Monitoring PeriodGully Headcut Retreat
Linear (m)Areal (m2)Volumetric (m3)
Winter–spring27 October 2017–19 May 201858.30.050.93+7.18
Rainy season19 May 2018–28 October 2018616.40.905.7910.49
Winter–spring28 October 2018–19 May 201944.20.030.890.86
Rainy season19 May 2019–4 November 2019746.00.337.1120.40
19 May–1 July210.00.243.922.39
1 July–4 November536.00.093.2018.03
Publisher’s Note: MDPI stays neutral with regard to jurisdictional claims in published maps and institutional affiliations.

