
Characterizing Pulse Attenuation of Intra-Cloud and Cloud-to-Ground Lightning with E-Field Signal Measured at Multiple Stations

School of Earth and Space Sciences, University of Science and Technology of China, Hefei 230026, China
*
Author to whom correspondence should be addressed.
Remote Sens. 2022, 14(7), 1672; https://0-doi-org.brum.beds.ac.uk/10.3390/rs14071672
Submission received: 20 February 2022
/
Revised: 27 March 2022
/
Accepted: 28 March 2022
/
Published: 30 March 2022
(This article belongs to the Special Issue Remote Sensing of Lightning and Its Applications in Atmospheric Electricity Studies)
Abstract
:In this paper, we analyze the waveform data of nearly 200,000 intra-cloud (IC) and cloud-to-ground (CG) lightning discharges detected by the Jianghuai Area Sferic Array on 26–29 August 2019 to investigate the propagation features of lightning electromagnetic fields. Through the analysis of variation in the electric field (E-field) signal of lightning during the actual propagation, it was found that (1) the attenuation of lightning E-field signal with distance can be fairly well described by the power-law relationship E = ar−b, and the attenuation index is b = 1.02 (for IC) and b = 1.13 (for CG); (2) under the situation of the same propagation path, the IC pulses experience less attenuation than CG pulses; and (3) through the comparison with simulations, it can be seen that the attenuation of lightning E-field pulse is affected by the conductivity of the ground surface, and according to the attenuation factor of lightning E-field strength, it can be inferred that the conductivity in the Jianghuai area ranges between 0.005 S/m and 0.01 S/m, which is in good agreement with the measured conductivity in this area. Our results suggest that lightning radiation could provide a feasible means for remotely sensing the ground conductivity.
1. Introduction
The electromagnetic (EM) wave excited by lightning is subject to the influence of underlying terrain features and surface conductivity during its propagation, and the high-frequency components rapidly attenuate as the propagation distance increases, causing the weakening of lightning electromagnetic fields and an increase in waveform rising time [1,2,3,4,5,6,7,8]. The understanding of the characteristics of propagation attenuation for the EM pulses generated by lightning discharges on the ground surface with finite electrical conductivity is not only important for remote sensing of the parameters of lightning-discharging current, but also has great application value for evaluating the coupling mechanism and destructive effects between lightning electromagnetic pulses (LEMPs) and the electronic and electrical equipment of various industrial facilities.
At present, the propagation attenuation effect of low-frequency/very-low-frequency (LF/VLF) LEMPs is mainly examined via two methods: The first method is to investigate the propagation features of LF/VLF EM waves generated by lightning along the ground surface with finite conductivity through theoretical simulation or numerical modeling [5,9,10,11]. In these simulation studies, the ground surface is usually presumed as a plane with uniform electrical conductivity, or as being composed of segments with varying conductivity. In recent years, by adopting the finite-differential time-domain (FDTD) method, it has become possible to investigate the influence of more complicated ground surface features—such as irregular undulating terrain (e.g., mountains) and ground stratification—on the propagation features of lightning EM waves. These model assumptions unavoidably have some deviations from the actual propagation of EM waves. To avoid the aforementioned issues, some researchers examined the characteristics of propagation attenuation by measuring the variation in the peak value of EM waves from the same lightning discharge at different propagation distances.
Uman et al. 1976 analyzed the observation data of artificially triggered lightning in Florida; it was found that the peak value of discharging pulses for CG strokes usually attenuates by 10% while propagating more than 50 km over the soil in Florida State, and attenuates by 20% while propagating over 200 km [12]. Orville 1991 and Idone et al. 1993 analyzed the measurement results of calibrated sensors at different stations for the stroke peak value of rocket-triggered lightning, and fitted the relationship for the variation in the EM field peak value of CG strokes with the propagation distance [13,14]. Orville 1991 examined the measurement results from four lightning observation stations, which were between 117.9 and 259.1 km, for seven artificial rocket-triggered lightning flashes at the Kennedy Space Center (KSC) of the United States National Aeronautics and Space Administration (NASA); the fitting between the peak value of lightning EMP pulses y and propagation distance exhibited the power-law relationship E = ar−b, where b varies between −0.96 and −1.20, with an average of −1.13 [13]. Similarly, Idone et al. 1993 examined the observation results of 12 rocket-triggered lightning flashes at six stations of NASA-KSC, which were between 117.9 and 427 km, and determined that the fitting coefficient b ranges between −0.95 and −1.34, and the average is −1.09 [14].
De Mesquita et al. (2012) analyzed seven lightning flashes measured at the observation tower at Morro do Cachimbo station in Brazil [15]. To evaluate the attenuation of lightning EM signal peak values, they used two quantities of EM field peak value and the distance from the tower to the sensors to determine a power regression curve (in the form of E = ar−b), thereby fitting the data. The average fitting coefficient of seven lightning events was −1.52, in contrast with the measurement result of −1.13 by Orville 1991 in Florida [13]; that is, the attenuation of lightning E-field over distance was faster in Brazil. Kolmašová et al. 2016 used the MÉTÉORAGE lightning location network of France [16]. By analyzing 15 lightning events observed on 11 October 2012, they obtained the power regression curve E =, where α is in the range of 1.74–2.3, where the coefficient A (in V/m) represents the electric field amplitude at a distance of 100 km, and D = d/100 km, where d is the lightning distance. This value is likely caused by the farther distance, where the lightning observation distance of three stations is between 300 and 600 km. There is relatively large fluctuation in index b fitted from different lightning observation data; for example, the maximum and minimum b fitted by Idone et al. (1993) are different by 0.39 [14]. On the one hand, this could arise from the fitting error under the condition of a relatively small fitting sample, and on the other hand, it also likely indicates that the actual gain of sensors at the measurement stations could have random fluctuations relative to the calibrated gain, causing a relatively large deviation in the measured CG peak values. Apparently, we need to conduct the fitting study on the characteristics of lightning E-field attenuation with propagation distance based on a relatively large sample of observation data, in order to minimize the fluctuation of fitting results caused by the relatively small sample size.
It has been a long time since the study of the propagation effects of electromagnetic pulses driven by lightning has mainly focused on the return stroke process of CG approaching the ground surface. In fact, IC discharge can also produce a bipolar pulse with strength comparable to the CG strokes [17,18,19,20]. In the early CG location systems, these IC discharge pulses were removed by the traditional identification algorithm, while they can be registered as IC discharging events and also located in the model total lightning location system. For these lightning pulses occurring inside the clouds and CG stroke pulses that mainly occur near the ground surface, their characteristics of propagation attenuation can be obviously different due to the differences in the height of the lightning source and the propagation path. Cooray et al. 2000 [21] applied the propagation attenuation function of air dipoles to study the attenuation effect of propagation for IC pulses, and their results indicate that in comparison with CG stroke pulses that mainly propagate along the ground surface, the IC pulses undergo less propagation attenuation. This conclusion still merits validation with experimental data.
In this paper, we use a set of observation systems that record the impulsive waveforms of lightning EM fields synchronously at multiple stations. For the huge amounts of data for the E-field waveforms recorded for CG strokes and IC bipolar pulses, we propose a method that actually fits the attenuation features of lightning pulse peak with propagation distance. This method does not need to calibrate the antenna gain in the field for each station. Meanwhile, it can fit the relatively large data sample within a greater range. In particular, it can not only fit the pulse of CG strokes, but also measure the propagation attenuation of bipolar IC pulses. In addition, a simulation was carried out on the influence of the ground conductivity on the transmission of IC/CG electromagnetic wave, and a comparison was made with the measurement.
2. Methodology
With respect to the actual observations and theoretical derivation, the sketch of the observation site and lightning event is shown in Figure 1.
As shown in Figure 1, for a lightning channel reaching the ground as a perfect conductor (i.e., with infinite conductivity),when the current pulse propagates along the channel, the E-field at point P is as follows [12]:
where , and c is the speed of light in the air. The three terms on the right-hand side are the electrostatic, induction, and radiation fields, respectively. When the observation distance is relatively far, the E-field is mainly the radiation component—the last term in Equation (1). That is, if r >> H, and R ≅ r (R > 100 km), we have
Denote , and for a specific discharge, it is only related to the propagation of the lightning current along the channel, and does not depend on the propagation distance. Thus,
Equation (3) indicates that when the lightning current propagates in the vertical channel, without taking into account the influence of propagation attenuation, the E-field at different distances is inversely proportional to the propagation distance. When the electromagnetic wave of lightning propagates on the ground surface with finite conductivity, the variation in the peak E-field along the distance can be described with the following equation:
where f(r) is the influence of propagation attenuation on the amplitude of the E-field waveform, and is the attenuated E-field peak, which is a function of the propagation distance, . When we use the antenna to measure the E-field strength, we also need to consider the influence of antenna gain in the field:
where G is the site gain coefficient of the antenna, and Epag is the attenuated E-field peak considering the field strength gain. We use the sensor calibrated with the field gain to measure the impulsive signal value of the same lightning discharge at different distance r, and can obtain the variation in with distance through the -r curve [13,14]. In this paper, we introduce a method that can fit without needing to calibrate the antenna gain in the field. According to Equation (5), we use the sensors placed at location i and location j to measure the identical discharging event, and the peak value of measured signal is denoted as follows:
We can further derive
where k is the ratio between the site gain of two sensors, and is a constant independent of distance. If we select the lightning events at the same distance from station j in the actual measurement—namely, —then
Equation (9) indicates that, by fixing the distance of one station relative to the lightning stroke, we can use the ratio between the lightning pulse amplitudes measured synchronously at two stations to determine the variation in propagation attenuation function with distance (k is the ratio between the site gain of two sensors, and is a constant independent of distance, without considering the constant coefficient).
Figure 2 shows the geometric layout necessary to achieve this measurement. When the lightning event is located on the circular ring at the same distance from the JS station, its distance from the HF station is different. We can obtain the variation relationship for the ratio between the pulse peak at the JS station and the pulse peak at the HF station with the distance of the HF station, and further derive the variation of with distance (by ignoring the constant coefficient). In the actual measurement, in order to ensure sufficient samples, we usually select the lightning discharge events on a circular ring with very nar-row thickness, and the thickness of the circular ring is small enough in comparison with the radius of the circular ring. In this way, all of the discharges within the circular ring can be considered as being of an equal distance relative to the HF station. Meanwhile, the radius of the circular ring cannot be too small, in order to ensure that the lightning events within the circular ring have a sufficiently large span with respect to the distance from the JS station.
3. Observations and Data
In this paper, the waveform data of lightning pulses recorded by a regional detection network, the Jianghuai Area Sferic Array (JASA) are used to characterize the attenuation of lightning electromagnetic signal with distance [17,18,19,20]. The JASA is a regional network that can achieve the multi-station recording of electromagnetic pulses generated by local lightning activity, and different stations are synchronized by adopting the technique of high-precision temporal synchronization. The system was constructed in the Jianghuai area of China since 2011, and its first phase includes six detection stations. At present, the number of stations in this system is continuously expanding, as shown in Figure 3. Each station is equipped with a reception antenna for VLF/LF band (bandwidth 0.8–400 kHz) lightning signals, along with a seamless acquisition system for lightning waveforms with high-precision temporal synchronization (40 ns). With the waveform of lightning pulses recorded synchronously at multiple stations, we can manually determine the type of discharge, and calculate the occurrence location with a time-of-arrival location algorithm [22]. The detection efficiency of the JASA is better than 95%, based on composite pattern recognition and machine recognition. The positioning accuracy of the JASA is better than 2 km in the Jianghuai region when using methods such as Monte Carlo. For more detailed information, refer to Liu et al. 2021 [20].
Figure 4 shows the waveform of a CG stroke recorded at multiple stations. The location of this CG stroke was determined from the time-of-arrival of pulses recorded at four stations—HF, FN, HB, and JS—via the time-of-arrival (TOA) method. Its distance from each station is indicated in the figure. This stroke was approximately 148.5 km from the JS station, and the measured peak value of the CG pulse was 951 digital units (DU); meanwhile the distance from the HF station was 283.4 km, and its pulse amplitude was 581 DU. According to Equation (9), the ratio of their pulse amplitude was 1.64.
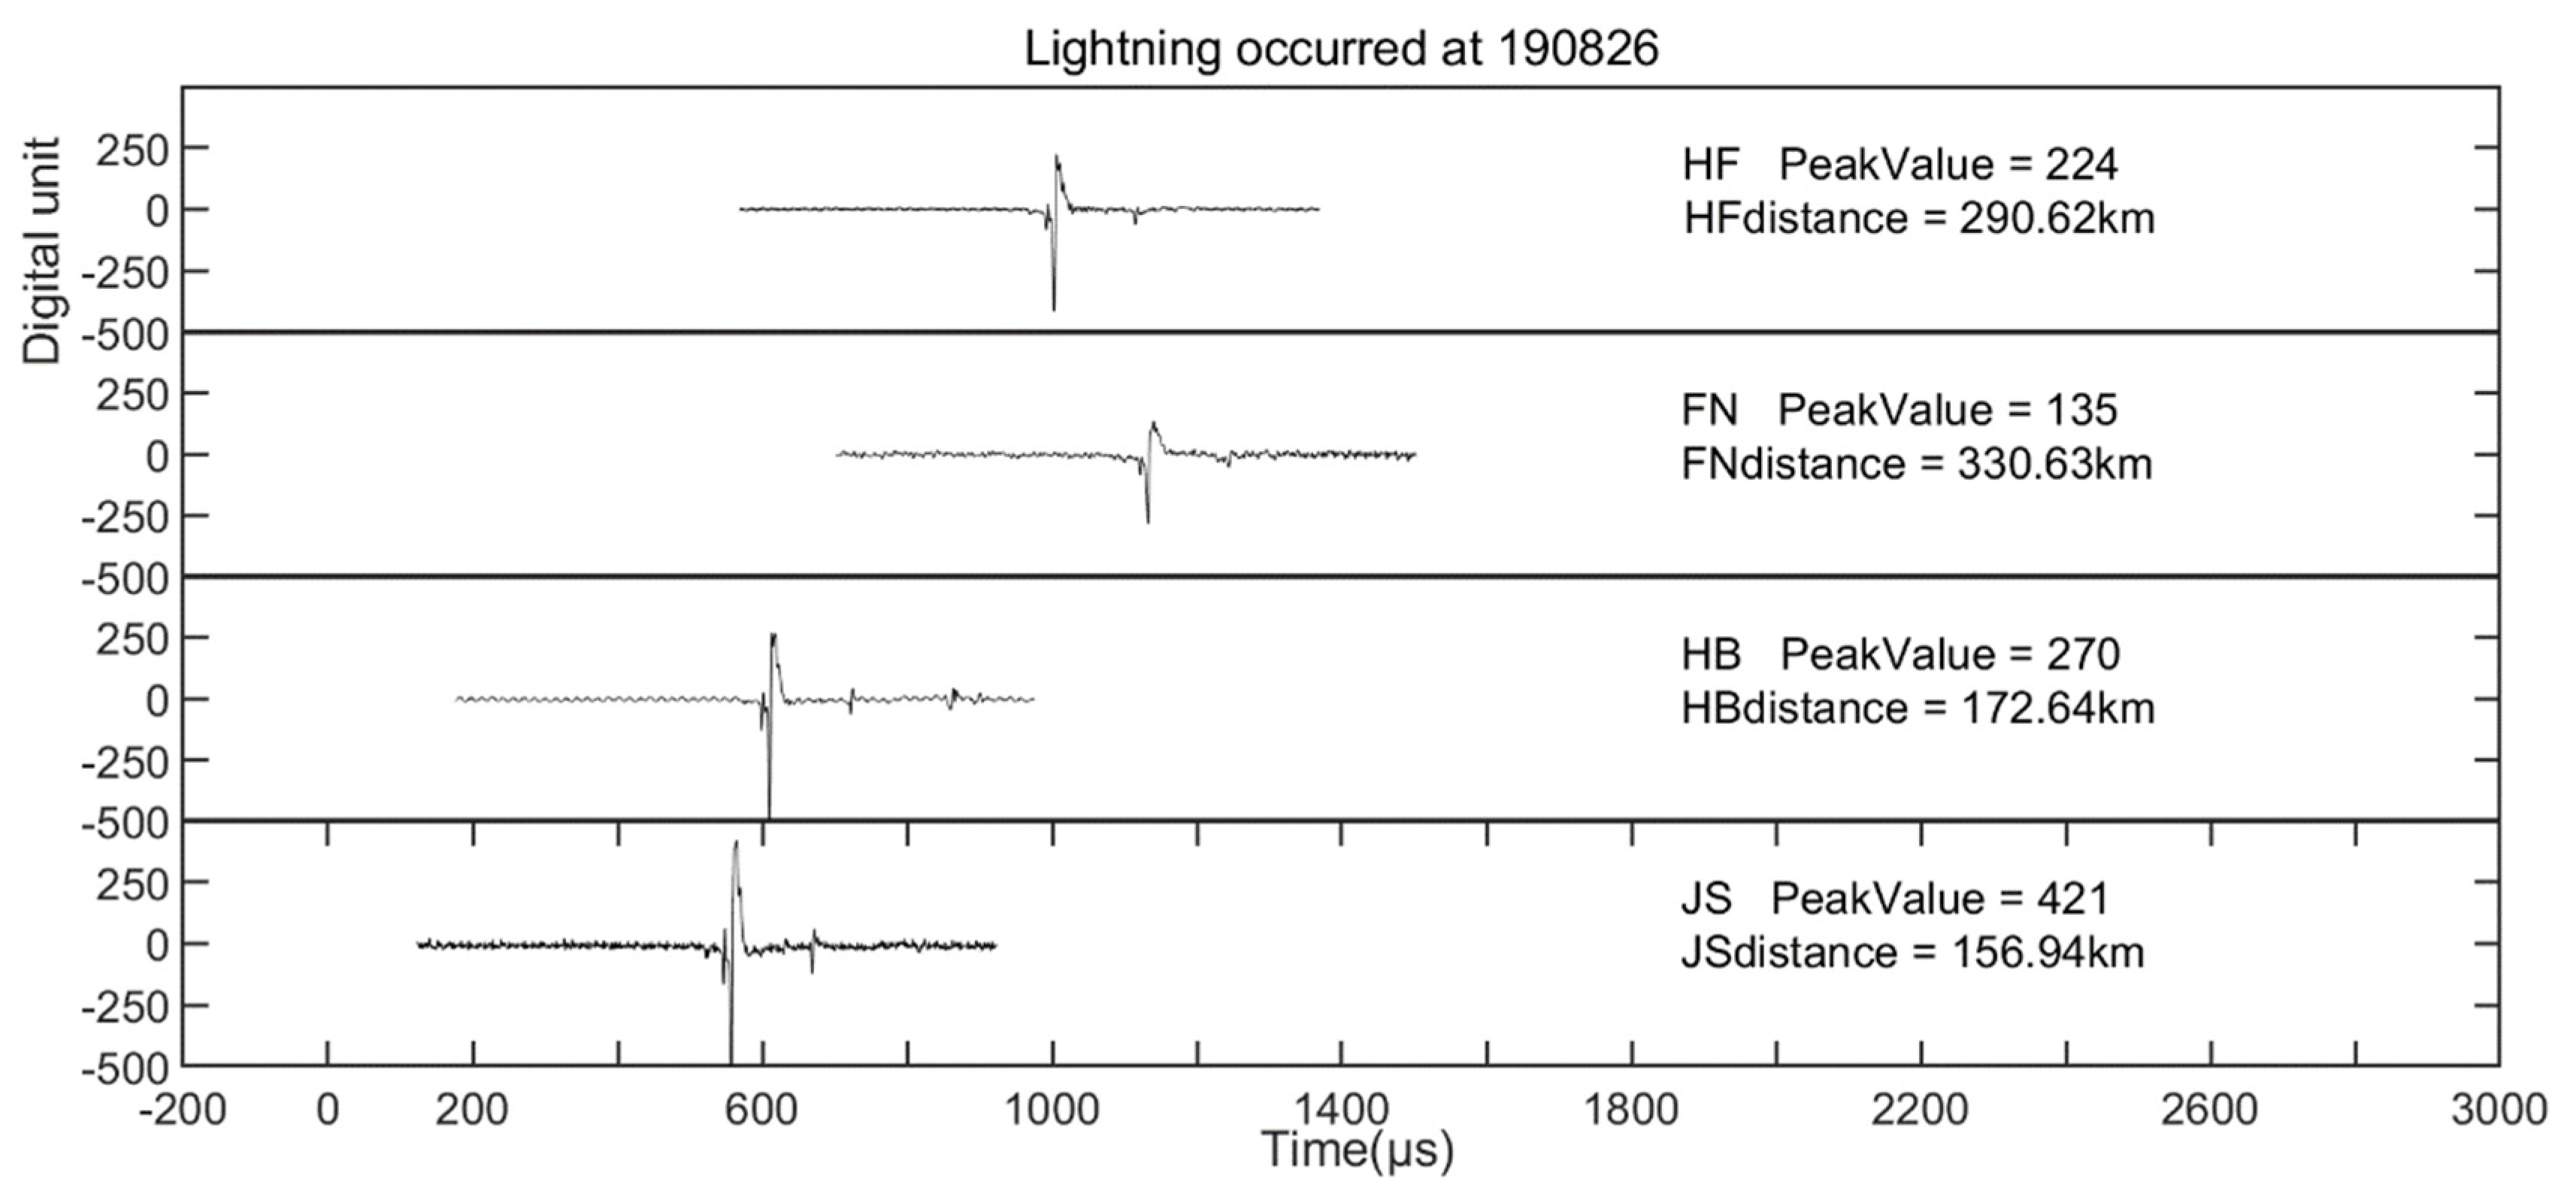
Figure 5 shows the bipolar waveform recorded by the system for an impulsive event generated by an IC discharge. Its distance from the HF station was 290.6 km, and the pulse peak was 224 DU; its distance from the JS station was 157.0 km, and the pulse peak was 224 DU; its distance from the JS station was 157.0 km, and the pulse value was 421 DU. Therefore, the pulse peak at the two stations was 1.88. These two lightning events were about 290 km from the HF station, and about 150 km from the JS station. The propagation path was almost the same as the propagation distance, while the ratio of IC pulse amplitude was about 1.15 times the ratio of CG pulse amplitude, which indicates that the IC pulses might undergo less peak value attenuation under the same propagation path conditions.
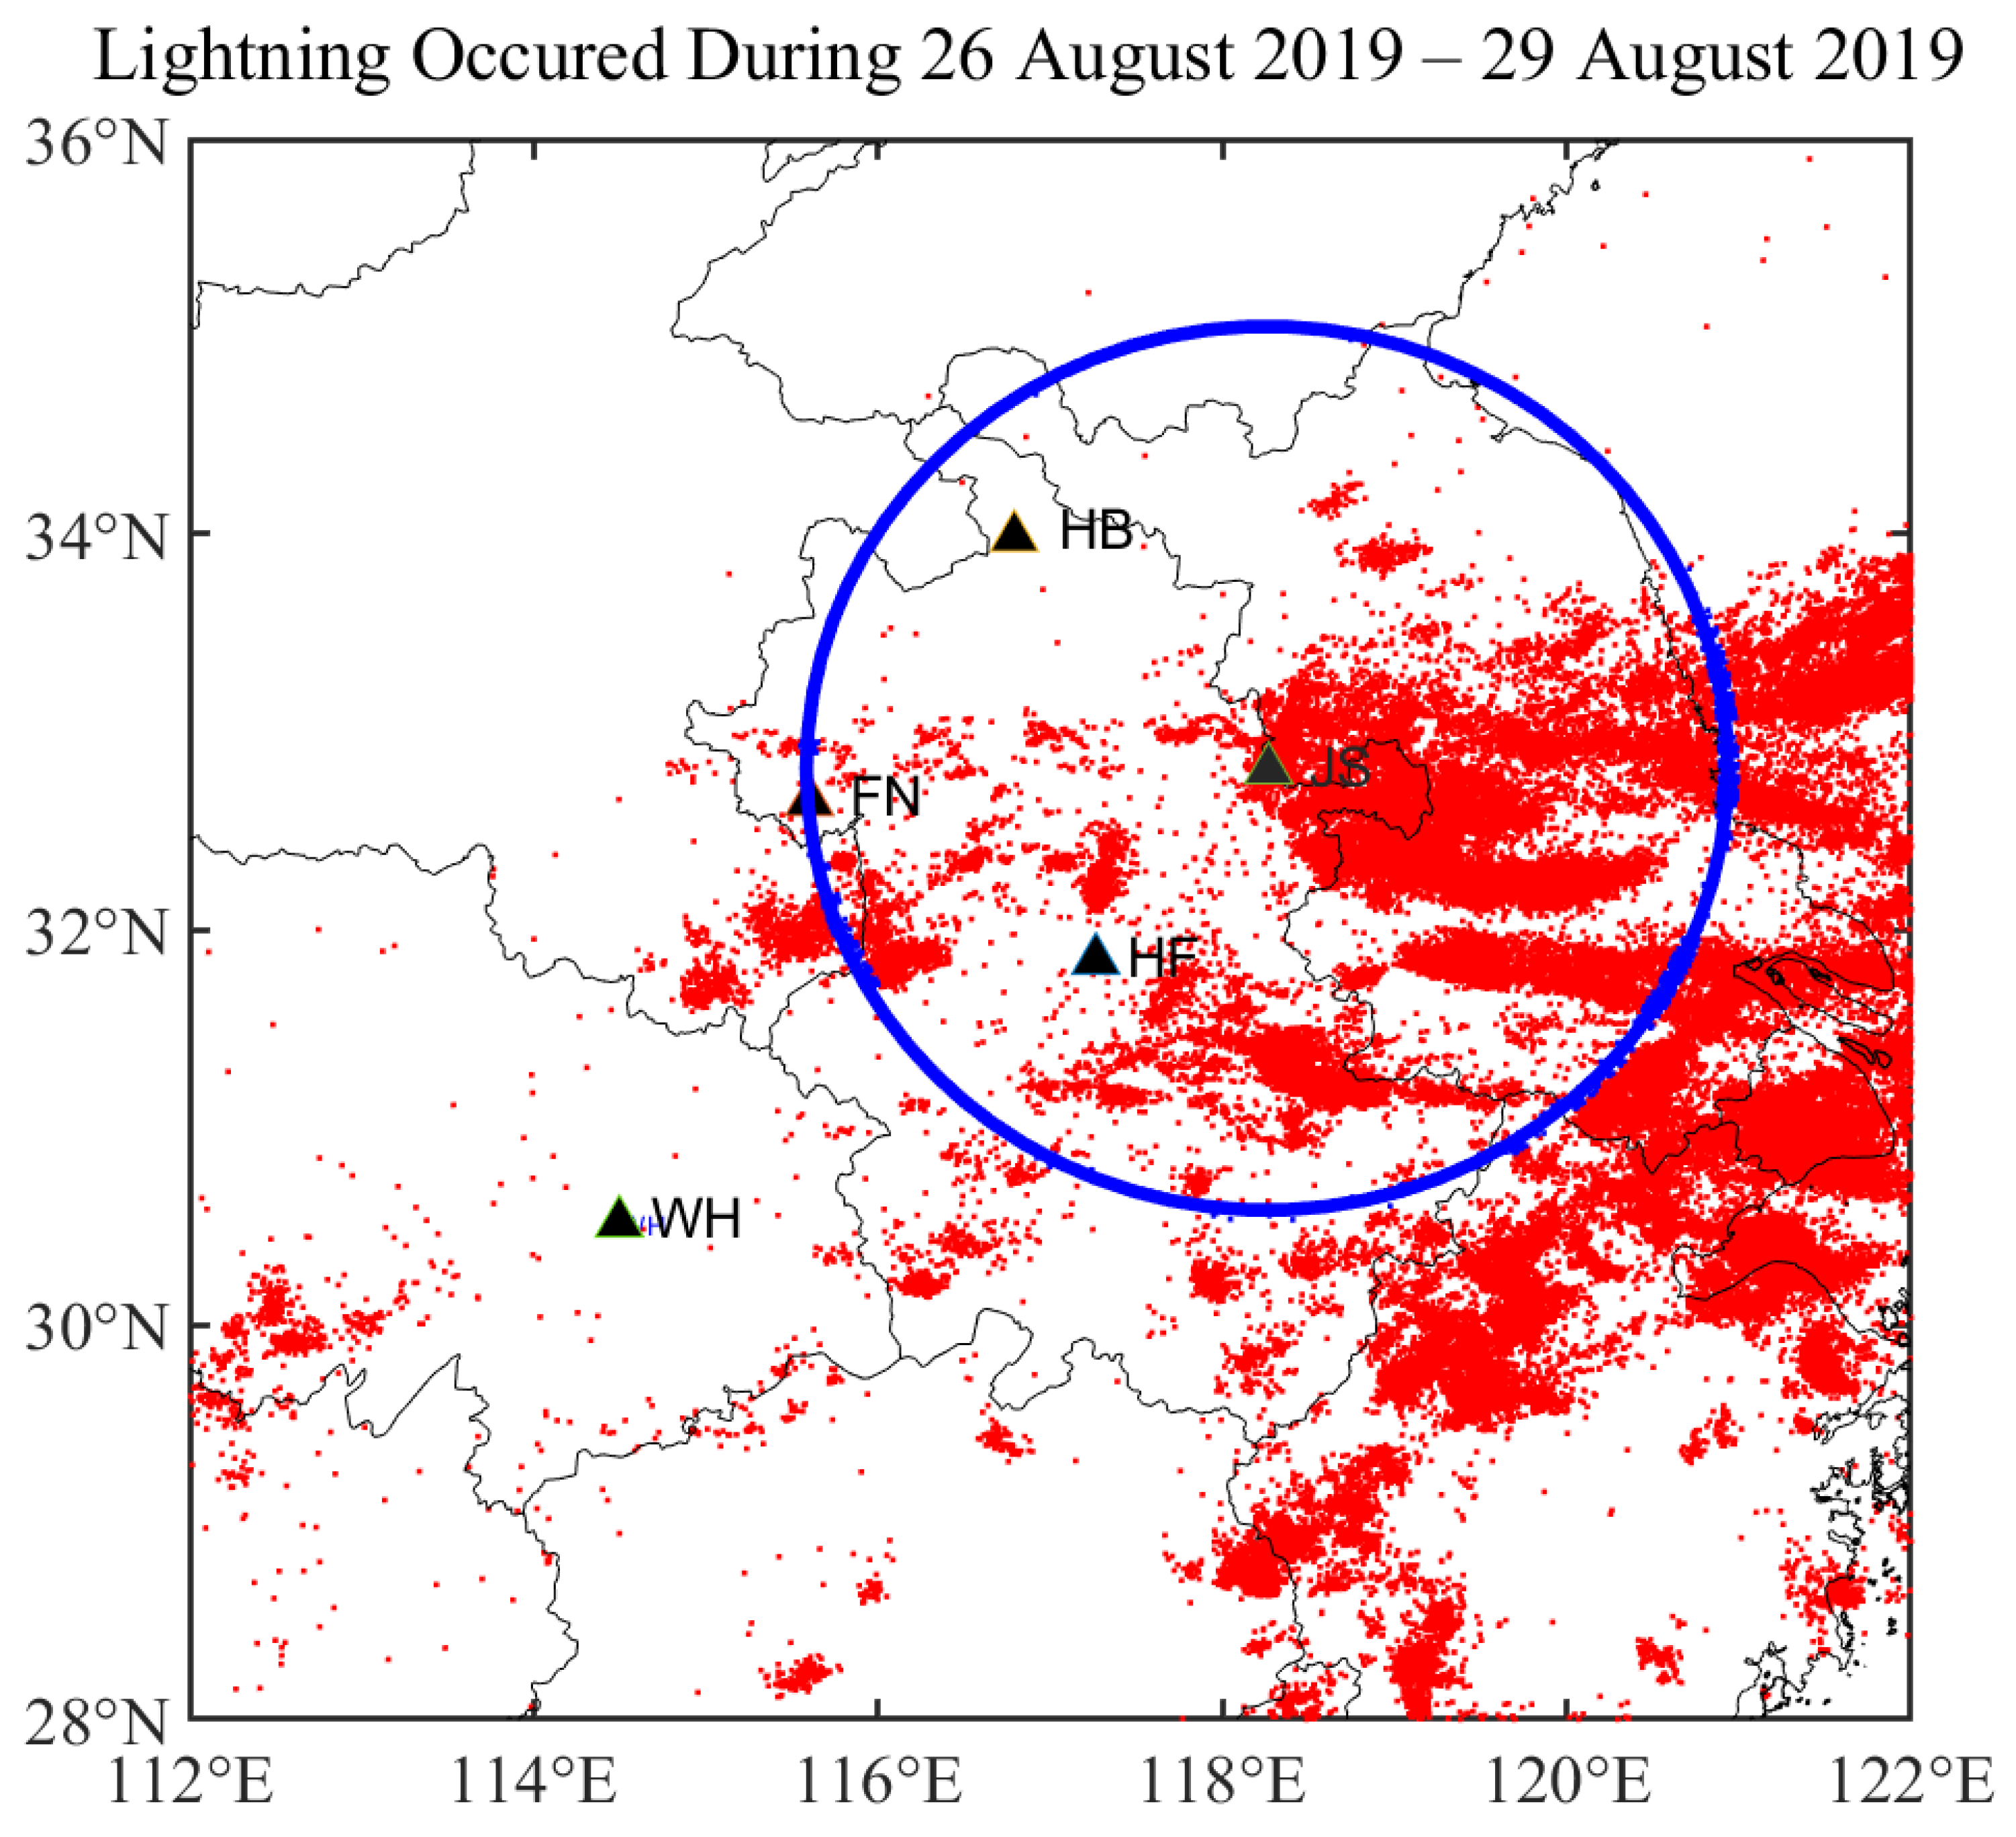
Figure 6 shows the location results of the time-of-arrival technique for lightning events recorded by the system on 26–29 August 2019. We can see that the distance of these lightning events from the HF and JS stations varied in a relatively large range, and in this paper we discuss the characteristics of propagation attenuation. As addressed in the following discussion, for the lightning-discharging events occurring at particular locations, we can identify the IC pulses and CG stroke pulses according to the signal waveform. The ratio of pulse peak observed at the HF and JS stations was calculated respectively, and the distance from the station was taken as the function.
4. Results and Discussions
4.1. Ratio of Field Gain
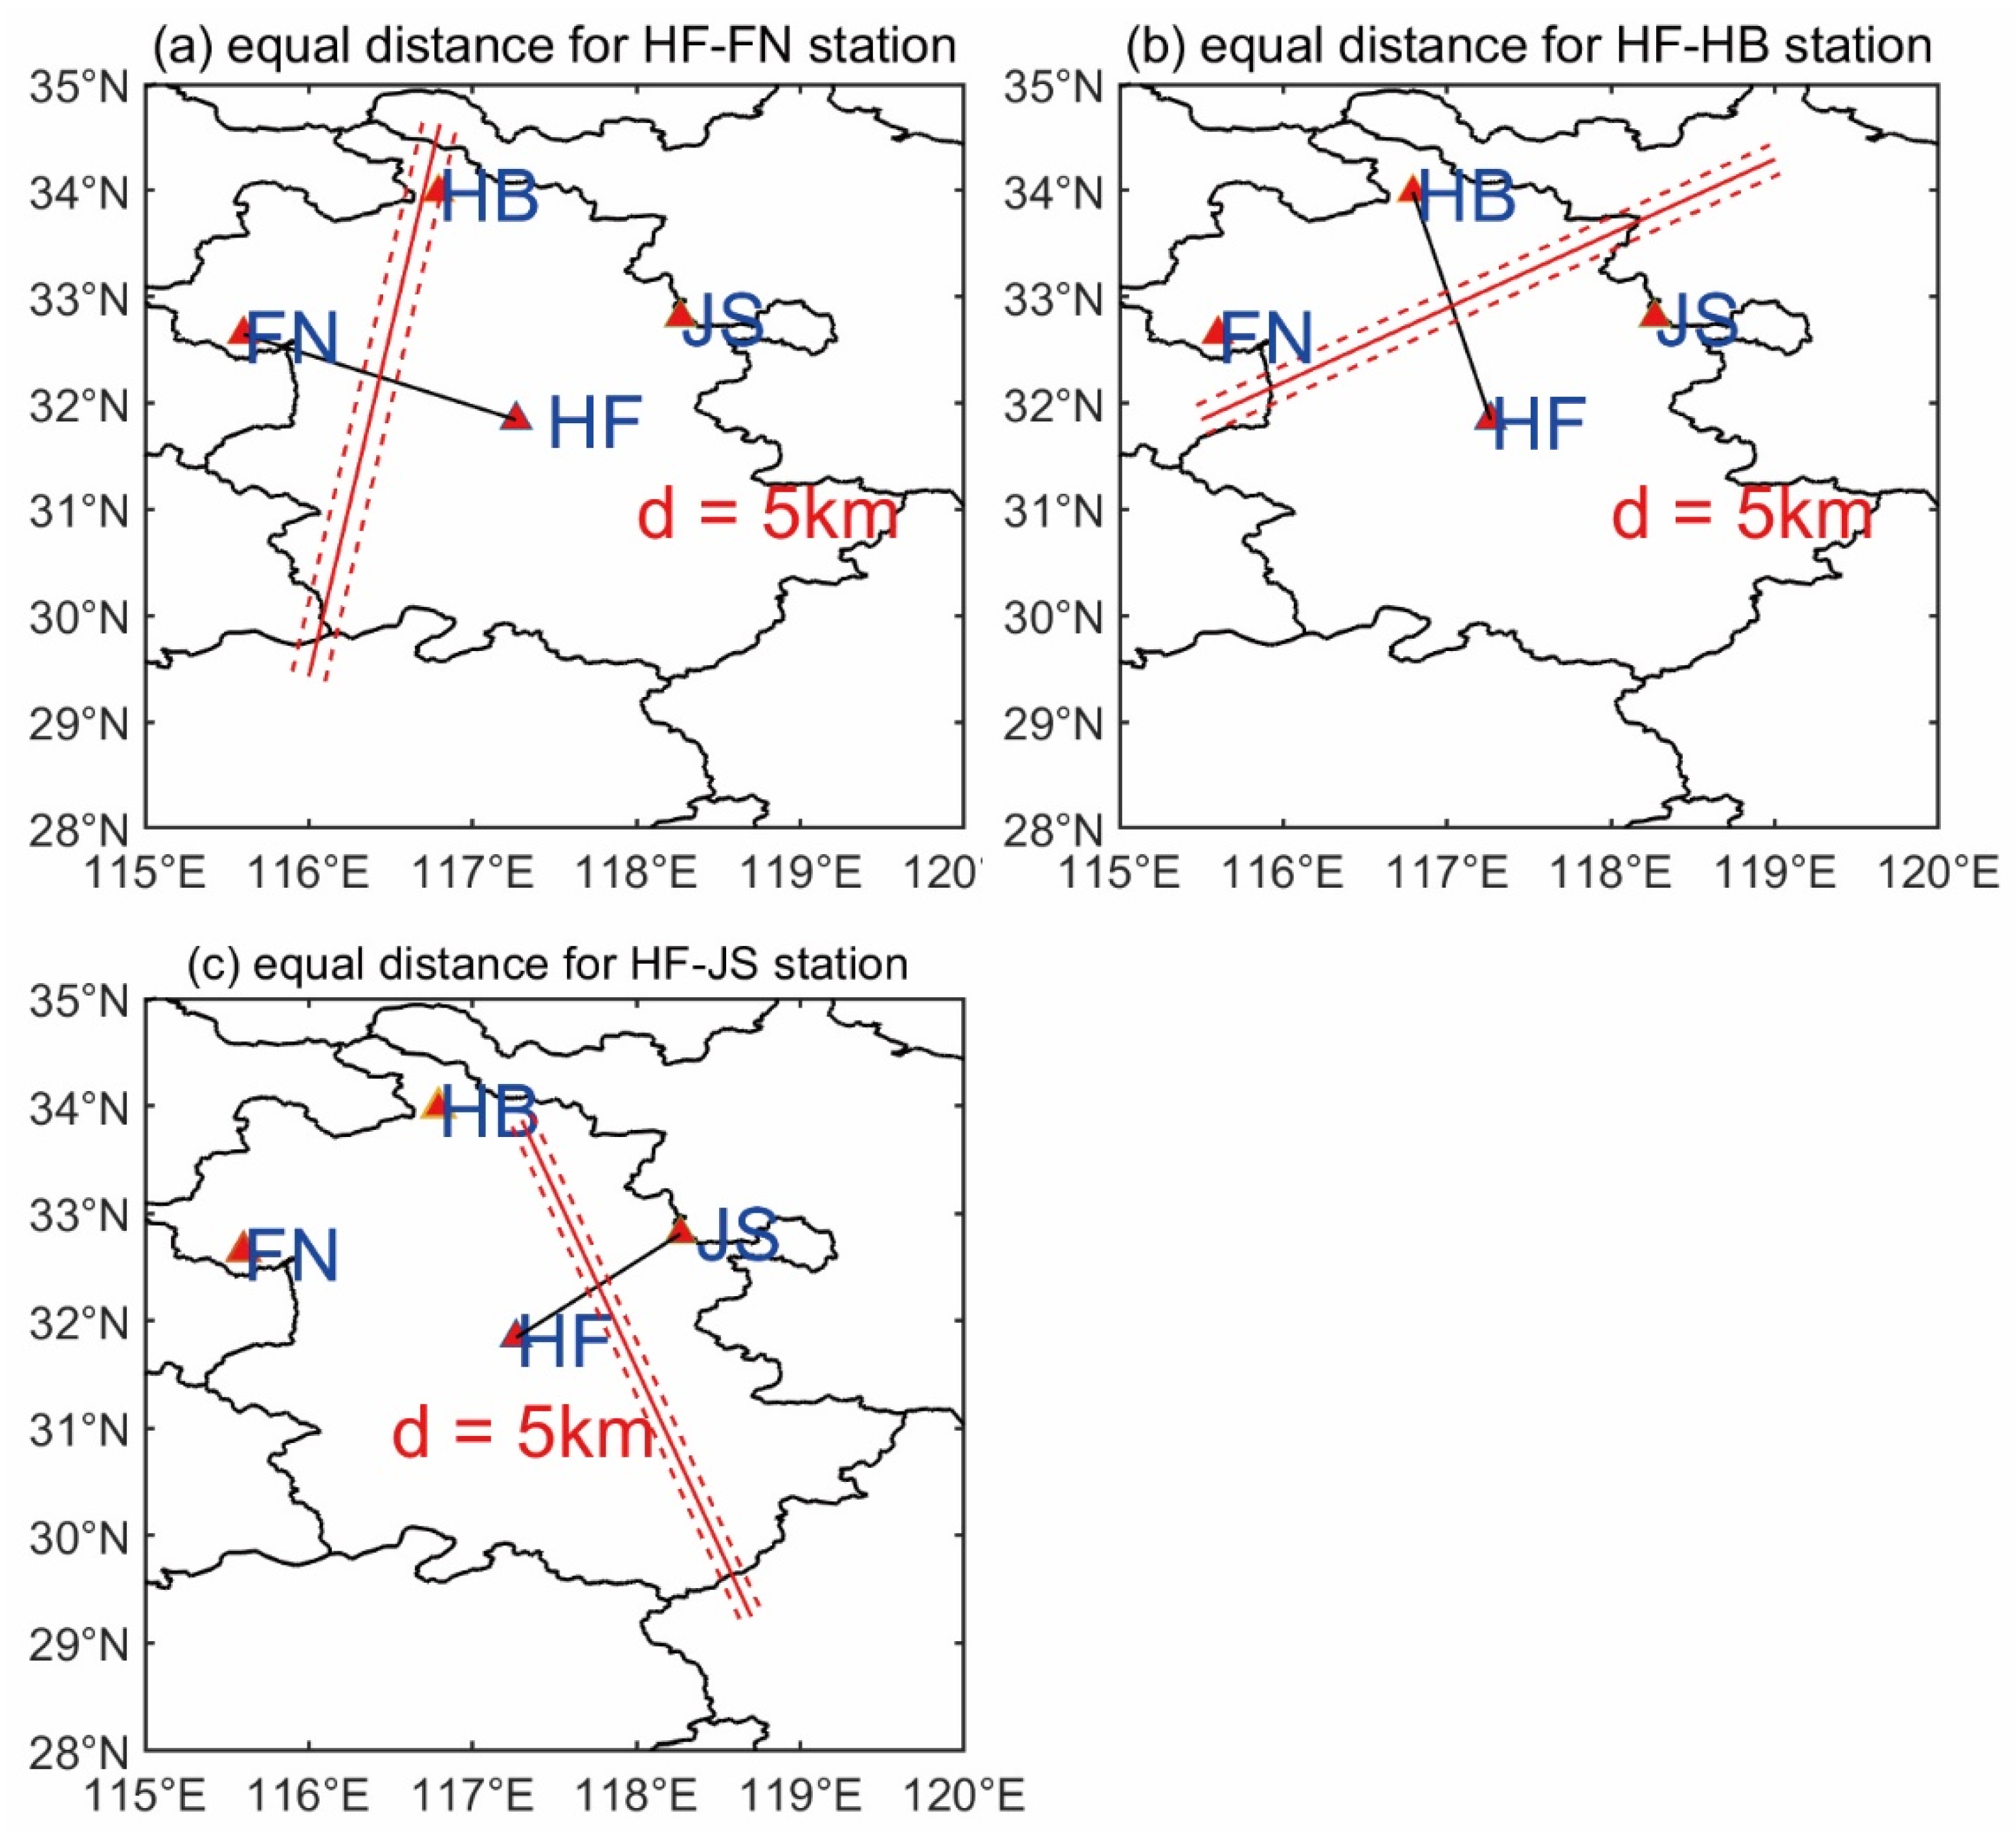
According to Equation (8), the ratio between the field antenna gain at two stations is a constant independent of distance. In order to validate this hypothesis, as shown in Figure 7, we respectively selected the lightning events at the same distance from the HF and FN stations, and calculated the variation in the ratio between pulse peak with distance. The set of events was located on the normal line to the HF–FN station link in Figure 7. To increase the amount of data, we used the distance method above, and lightning events within 5 km of both sides of the normal line were taken into account.
Because the selected discharging event was at comparable distance from two stations, we could ignore the influence of propagation attenuation, which was therefore independent of propagation distance. In the practical calculation, in order to enlarge the sample size as much as possible, we chose the lightning events within 5 km range from the HF station and the FN, HB, and JS stations.
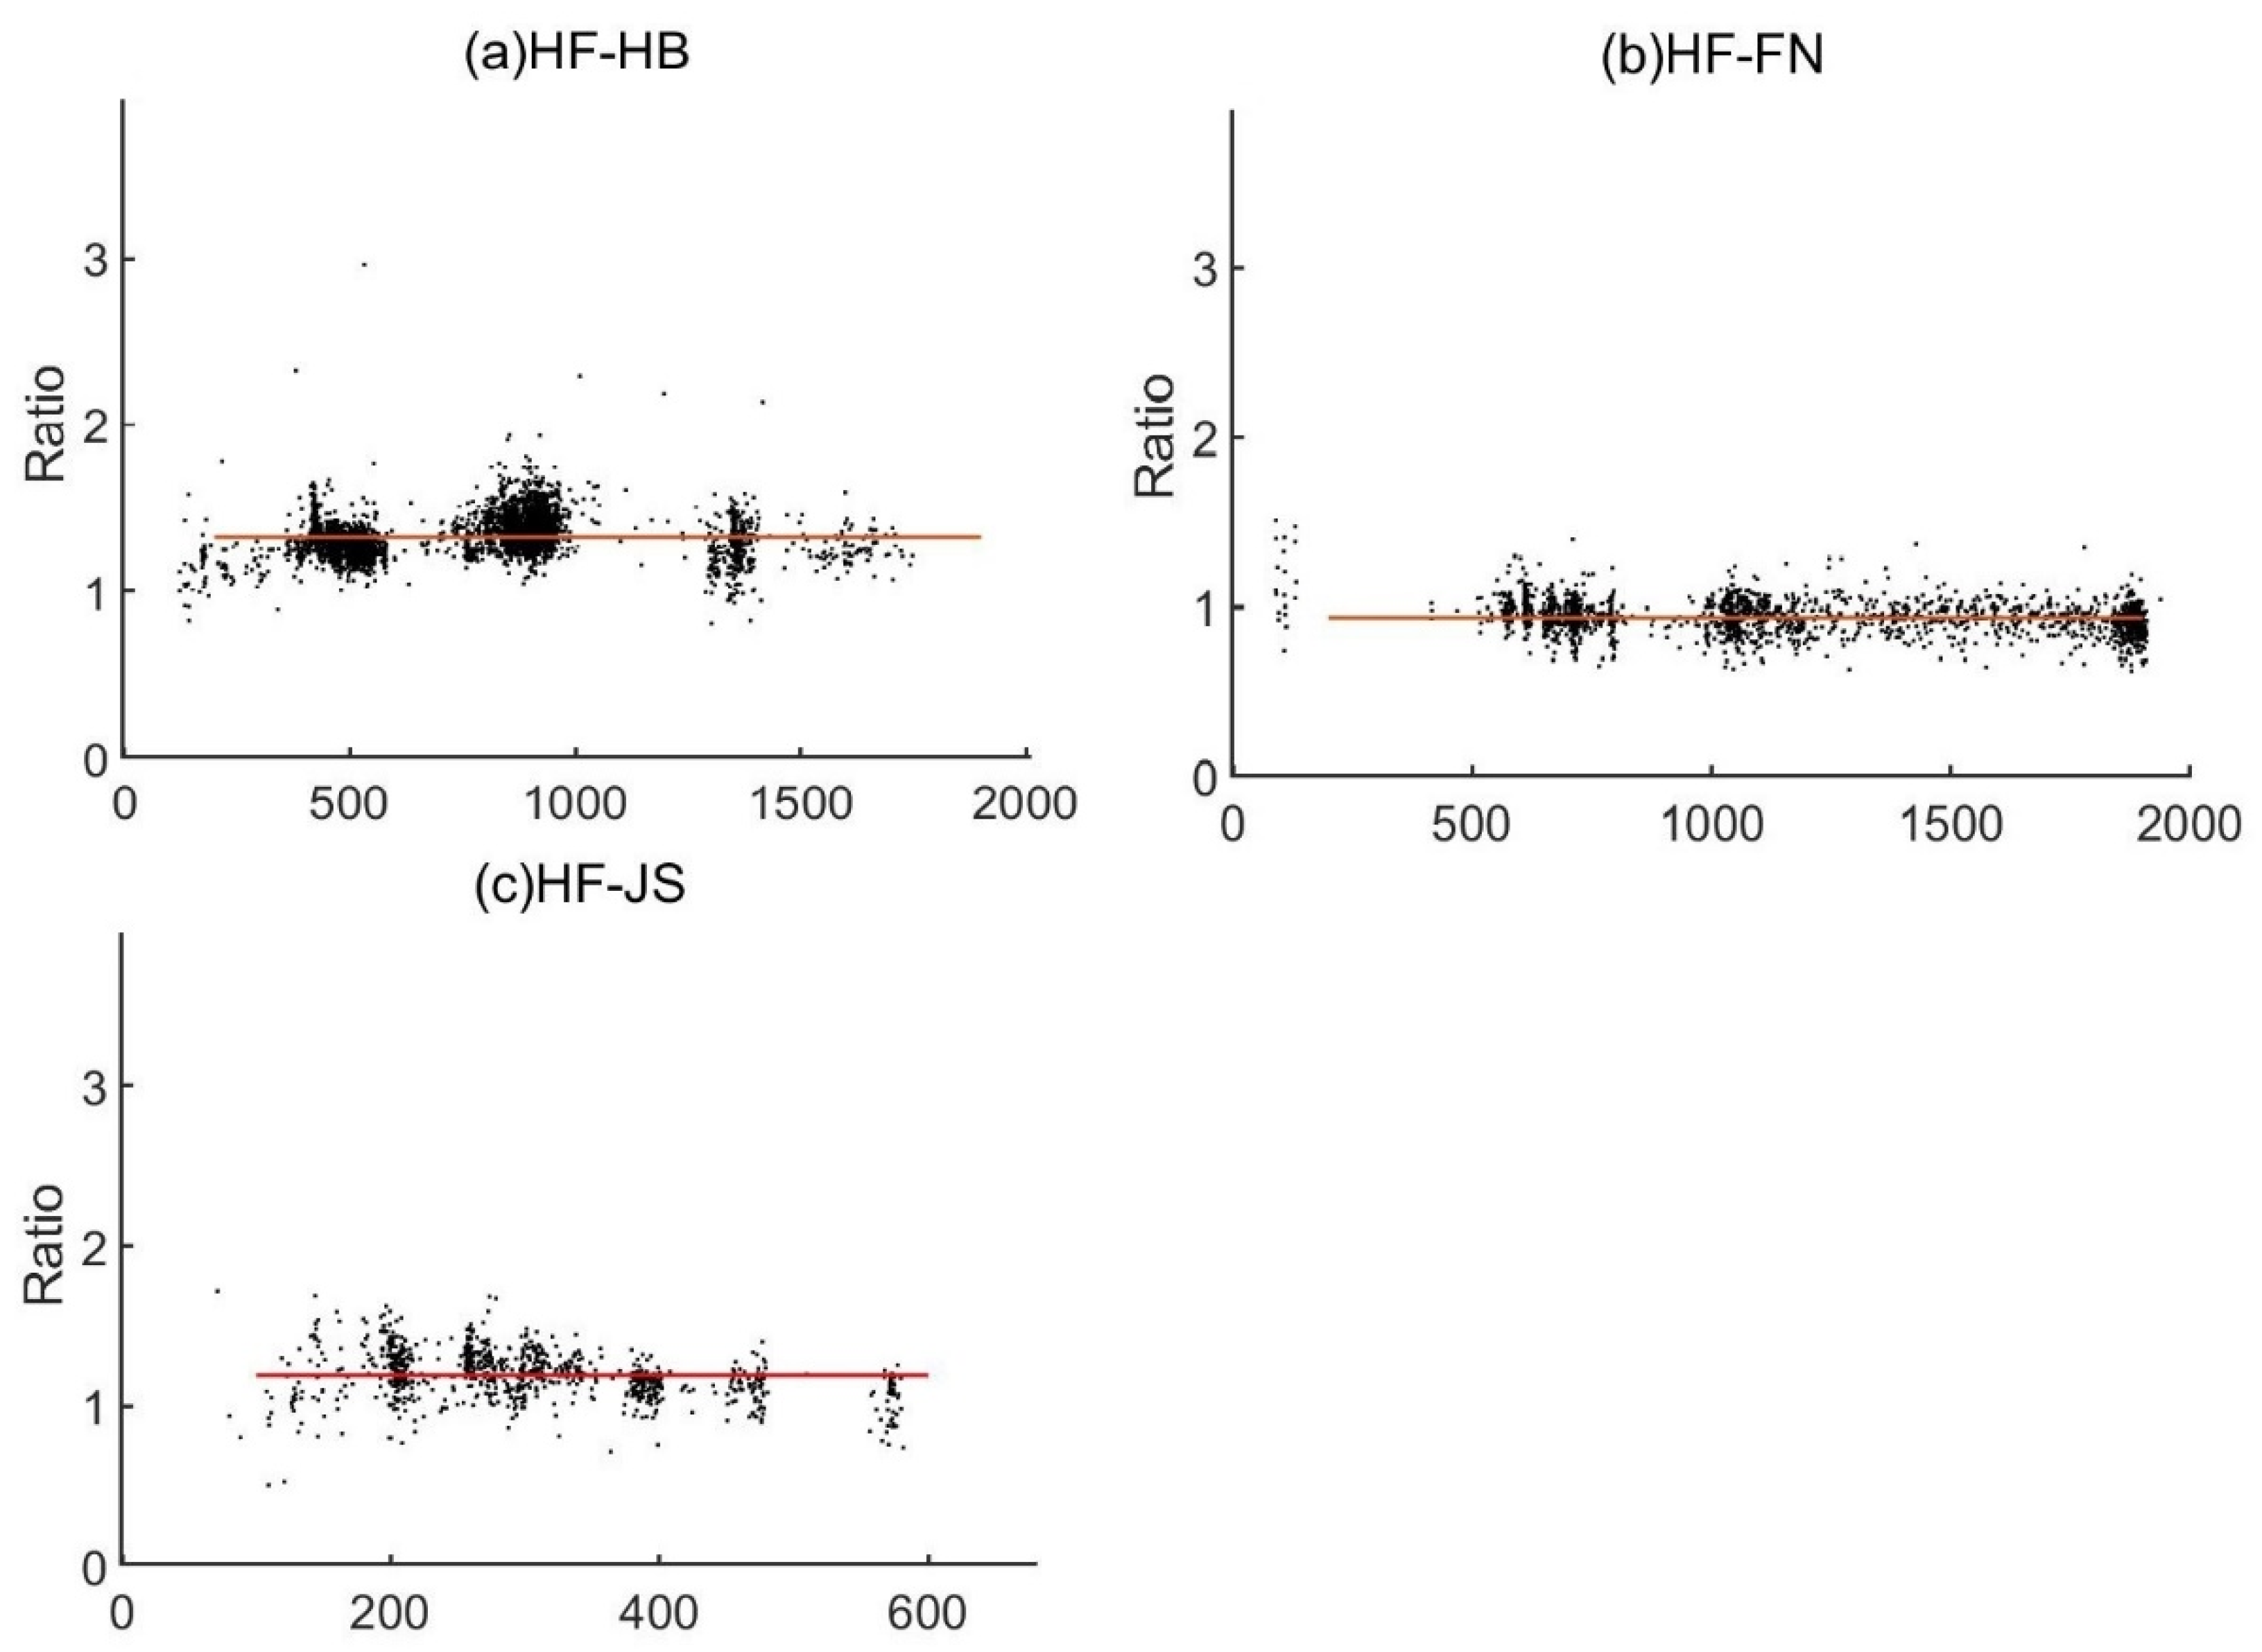
We can see from Figure 8a that the relative ratio of field strength at the stations HF and HB fluctuates in the range of 1.006–1.91, with an average of 1.32; it can be seen that the ratio of the amplitudes between the two stations is not affected by the distance. This ratio of field strength exhibits independence of propagation distance, which indicates that our assumption in the formula is appropriate. The average ratio of relative field strength at the HF and FN stations is 0.98, and the average ratio of relative field strength at the HF and JS stations is 1.18. However, we can also see from Figure 8a that this ratio of amplitude exhibits a relatively large fluctuation. We speculate that this could be related to the random fluctuation of site gain; specifically, when the electromagnetic wave comes from different directions, there is a considerable difference in the site gain.
4.2. Variation of Lightning Pulse Peak Value with Distance
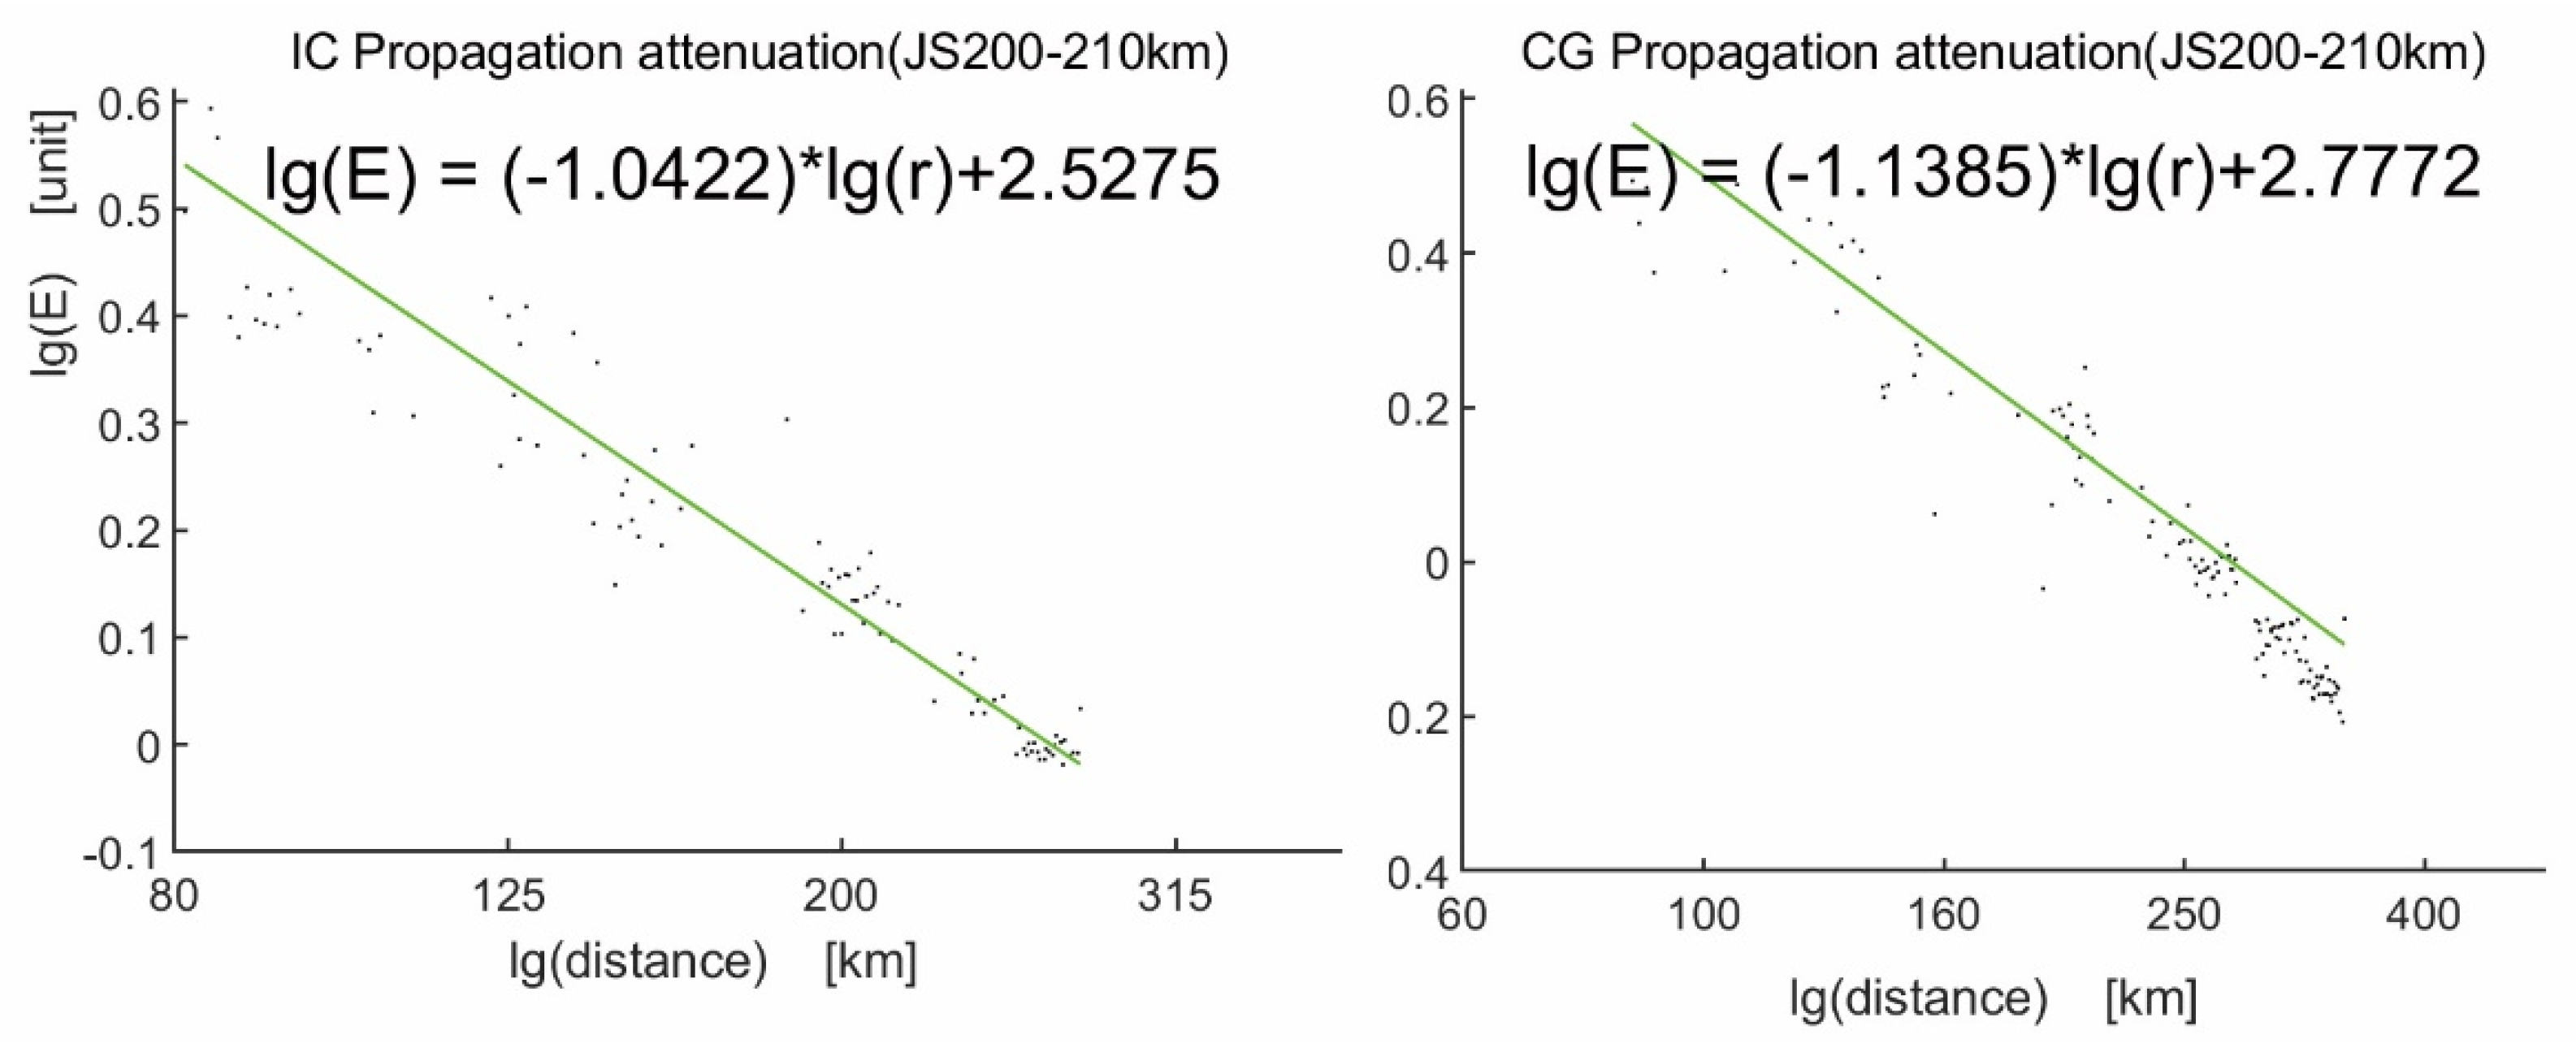
According to Equation (9), in order to explore the variation in lightning pulse peak value with distance, here we manually sort the lightning-discharging events at a range of 205 km (200–210 km) from the JS station, including a total of 1053 IC discharges and 726 CG strokes. The distance from these discharging events to the HF station varies from 0 km up to 400 km; therefore, we can examine the variation in pulse peak value at the JS station (relative to the amplitude at the HF station) with propagation distance. We can see from the figure that for both the IC and CG pulses, the pulse amplitude attenuates rapidly with the propagation distance. Idone et al. 1993 pointed out that the peak value of CG strokes attenuates exponentially with distance (r); therefore, we can adopt the data fitting in the logarithmic coordinates [14]:
Take the
We fit the logarithmic value of the data by applying the logarithm on both sides of Equation (10). We then we get the following equation:
For the IC events and CG events at a range of 205 km (200–210 km) from the JS station, b = 1.0422 and b = 1.1385, respectively, as shown in Figure 9.
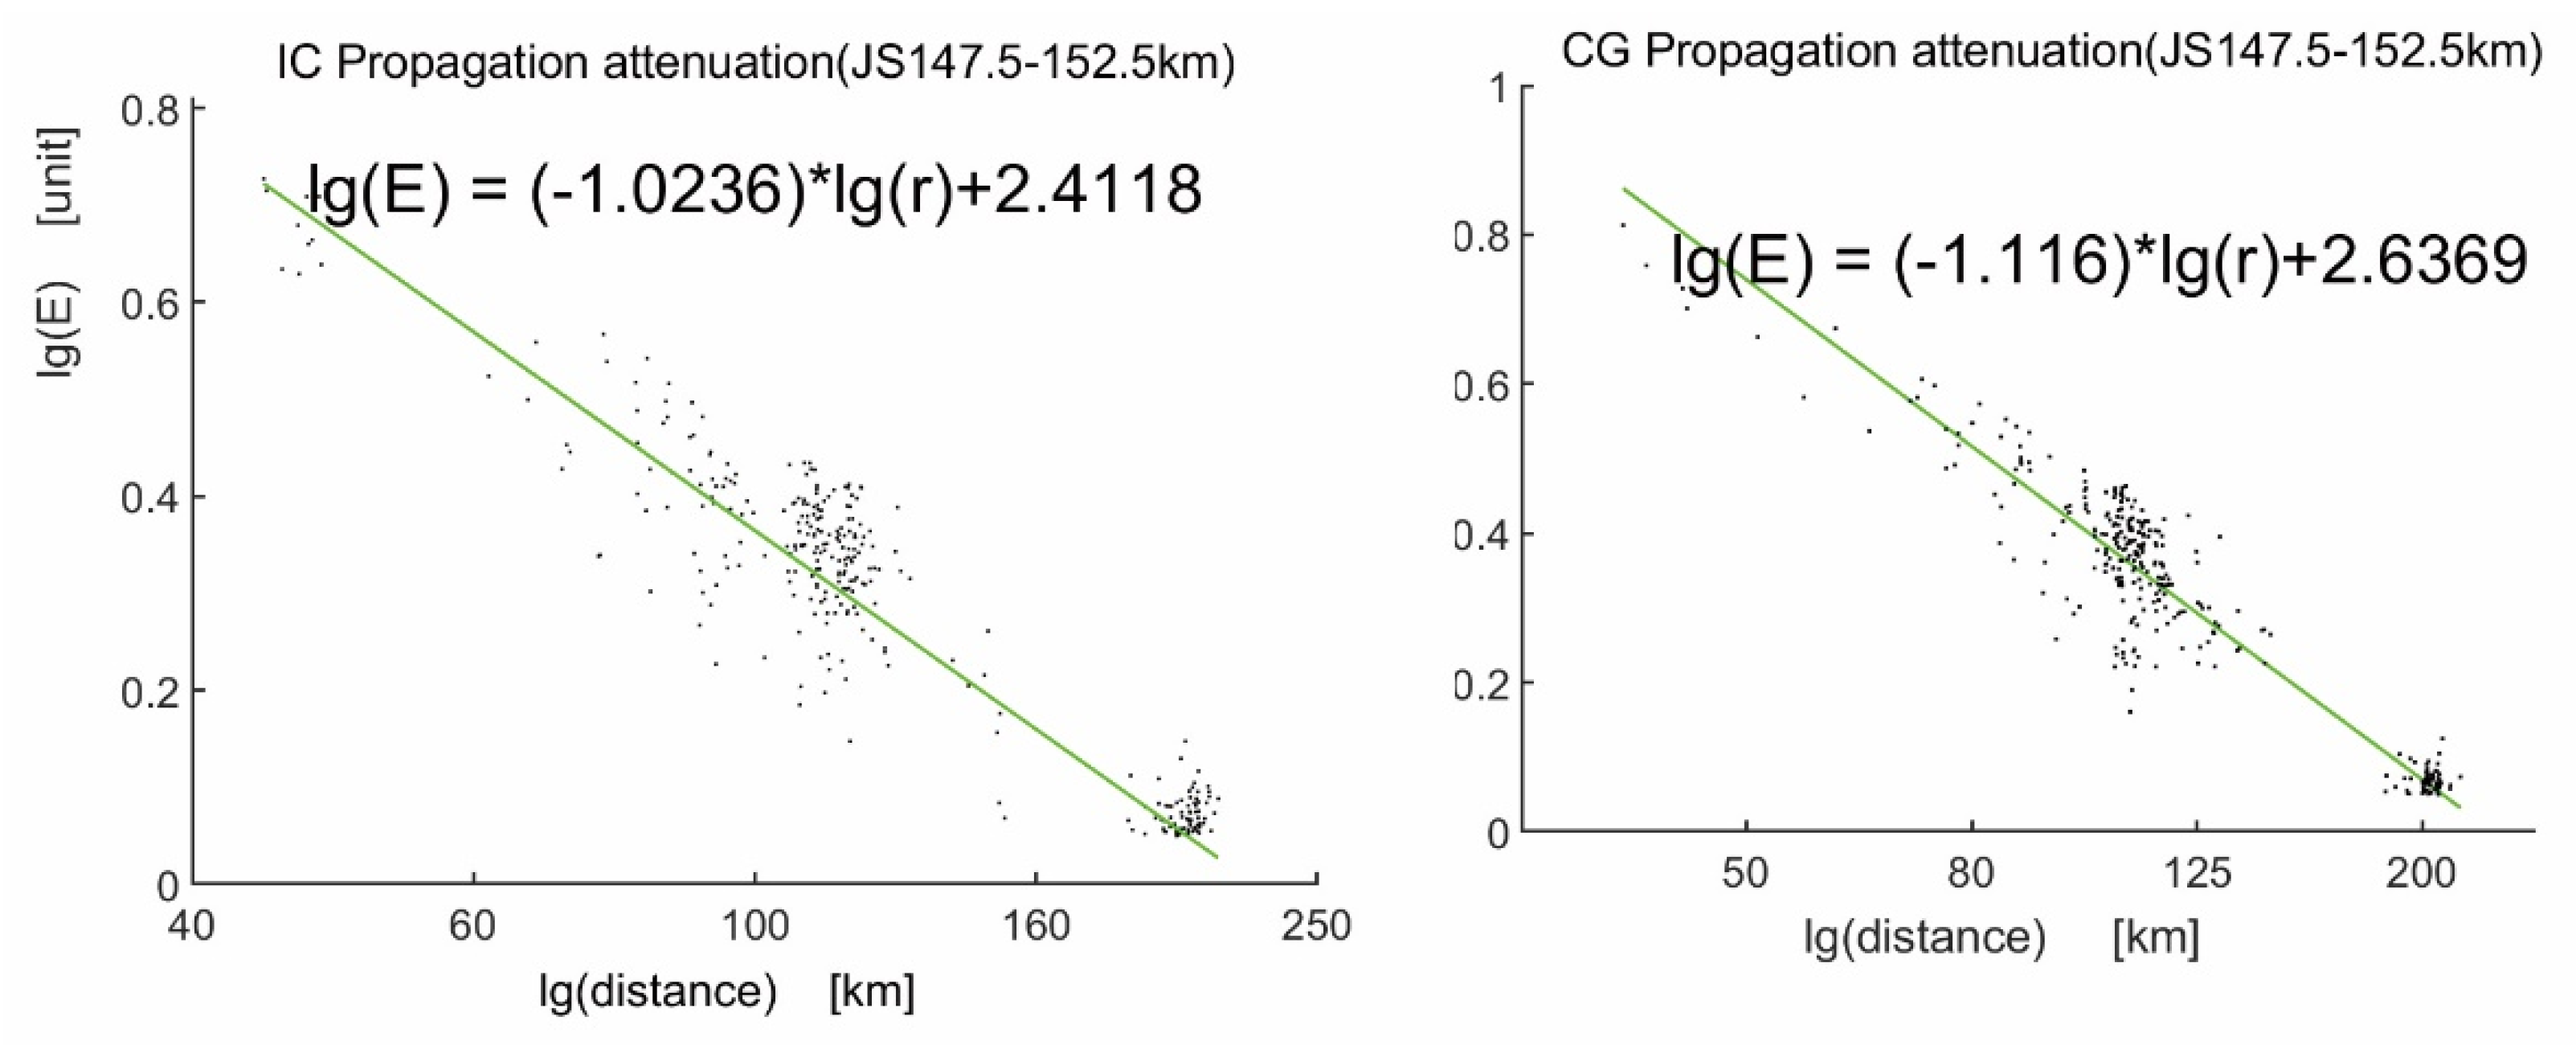
Figure 10 shows the variation in pulse amplitude with the distance from the JS station for 453 IC pulses and 334 CG pulses. Similarly, for the CG and IC events occurring at a distance of 150 km (147.5–152.5 km) from the JS station, we obtained the variation in E-field pulse peak value (relative to the HF station) with distance, and the results of index fitting were b = 1.0236 (for IC) and b = 1.116 (for CG), respectively. The results are shown in Figure 10.
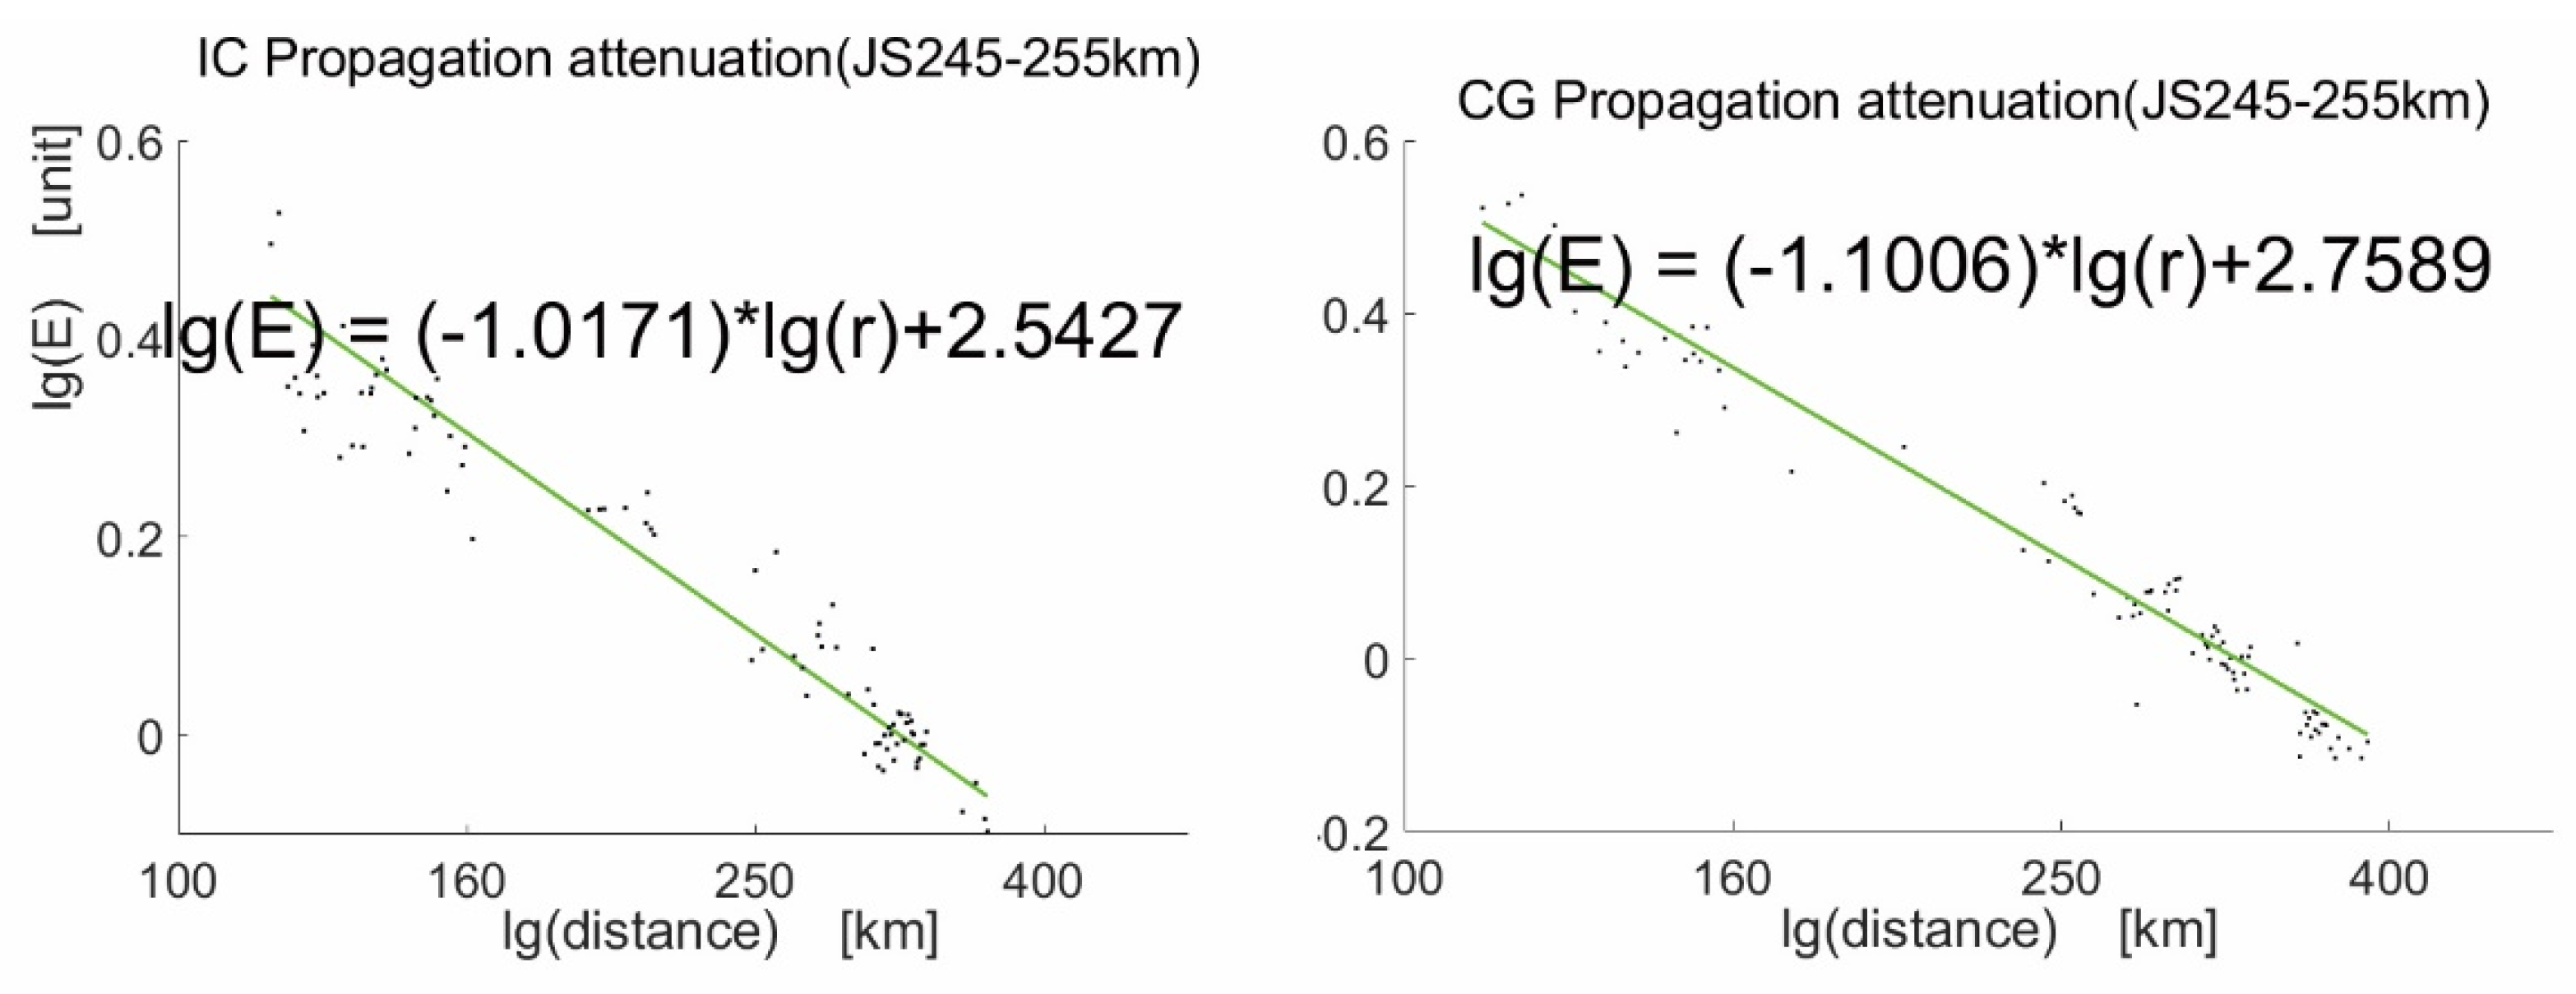
Figure 11 shows the variation in the ratio between the E-field peak values of CG and IC events occurring at a distance of 250 km (245–255 km) from the JS station with distance, where we obtained b = 1.0171 (for IC) and b = 1.1006 (for CG), and there were 192 IC pulses and 177 CG pulses. The results are listed in Table 1.
According to Equation (3), when b = −1, it indicates that there is no peak value attenuation of the lightning pulse during the propagation process. Our result of b > 1 indicates that, for both IC and CG pulses, the propagation on the ground surface with finite conductivity caused the attenuation of the peak value. Under the same propagation conditions, the propagation attenuation index b of IC pulses was smaller than the attenuation index of CG pulses, which indicates that the IC pulses suffer less attenuation than CG pulses. As a matter of fact, Cooray 2012 used the propagation attenuation function of a dipole above the planar ground surface to simulate the propagation attenuation situation of IC discharges over the ground surface with finite conductivity, and revealed that the IC pulse mainly propagates in the air [10]. In comparison with the CG pulses that mainly propagate along the ground surface, IC pulses undergo less peak value attenuation. The results of field observations in this paper confirm this result.
We can also see from Table 1 that, even though the waveform data observed at the HF and JS stations are used, when we select different concentric rings, the propagation attenuation coefficient obtained from fitting is slightly different. Moreover, there is relatively large fluctuation in the fitting value of the amplitude ratios calculated for individual lightning events. This fluctuation is very likely related to the fluctuation present in the field gain of EM waves coming from various incident directions. As shown in the figure, even though we do not consider the influence of propagation attenuation, the ratio of E-field gain coefficient in the field is not a fixed constant, and it also undergoes fluctuation, which leads to fluctuation in the calculated ratio of E-field pulse peak value. Even though in this paper, according to the fitting results of numerous lightning events occurring in a broad range, we can eliminate the influence of this fluctuation in the field gain to some extent, our results indicate that the attenuation index obtained by the fitting of CG events is 1.12–1.14. This result is very close to the attenuation index of 1.13 obtained by Idone et al. 1993 according to the CG stroke of artificial rocket-triggered lightning [14]. It should be noted that the attenuation index obtained by Idone et al. 1993 according to individual rocket-triggered lightning varied in the range of −0.95 to −1.34, which also confirms that the field gain coefficient of the antenna is not a constant, because of its feature of random fluctuation. This probably indicates that when Idone et al. 1993 fitted the relationship between EM wave peak value and return stroke current according to the E-field strength corrected with the propagation attenuation, they could not improve the correlation coefficient.
4.3. Numerical Simulation
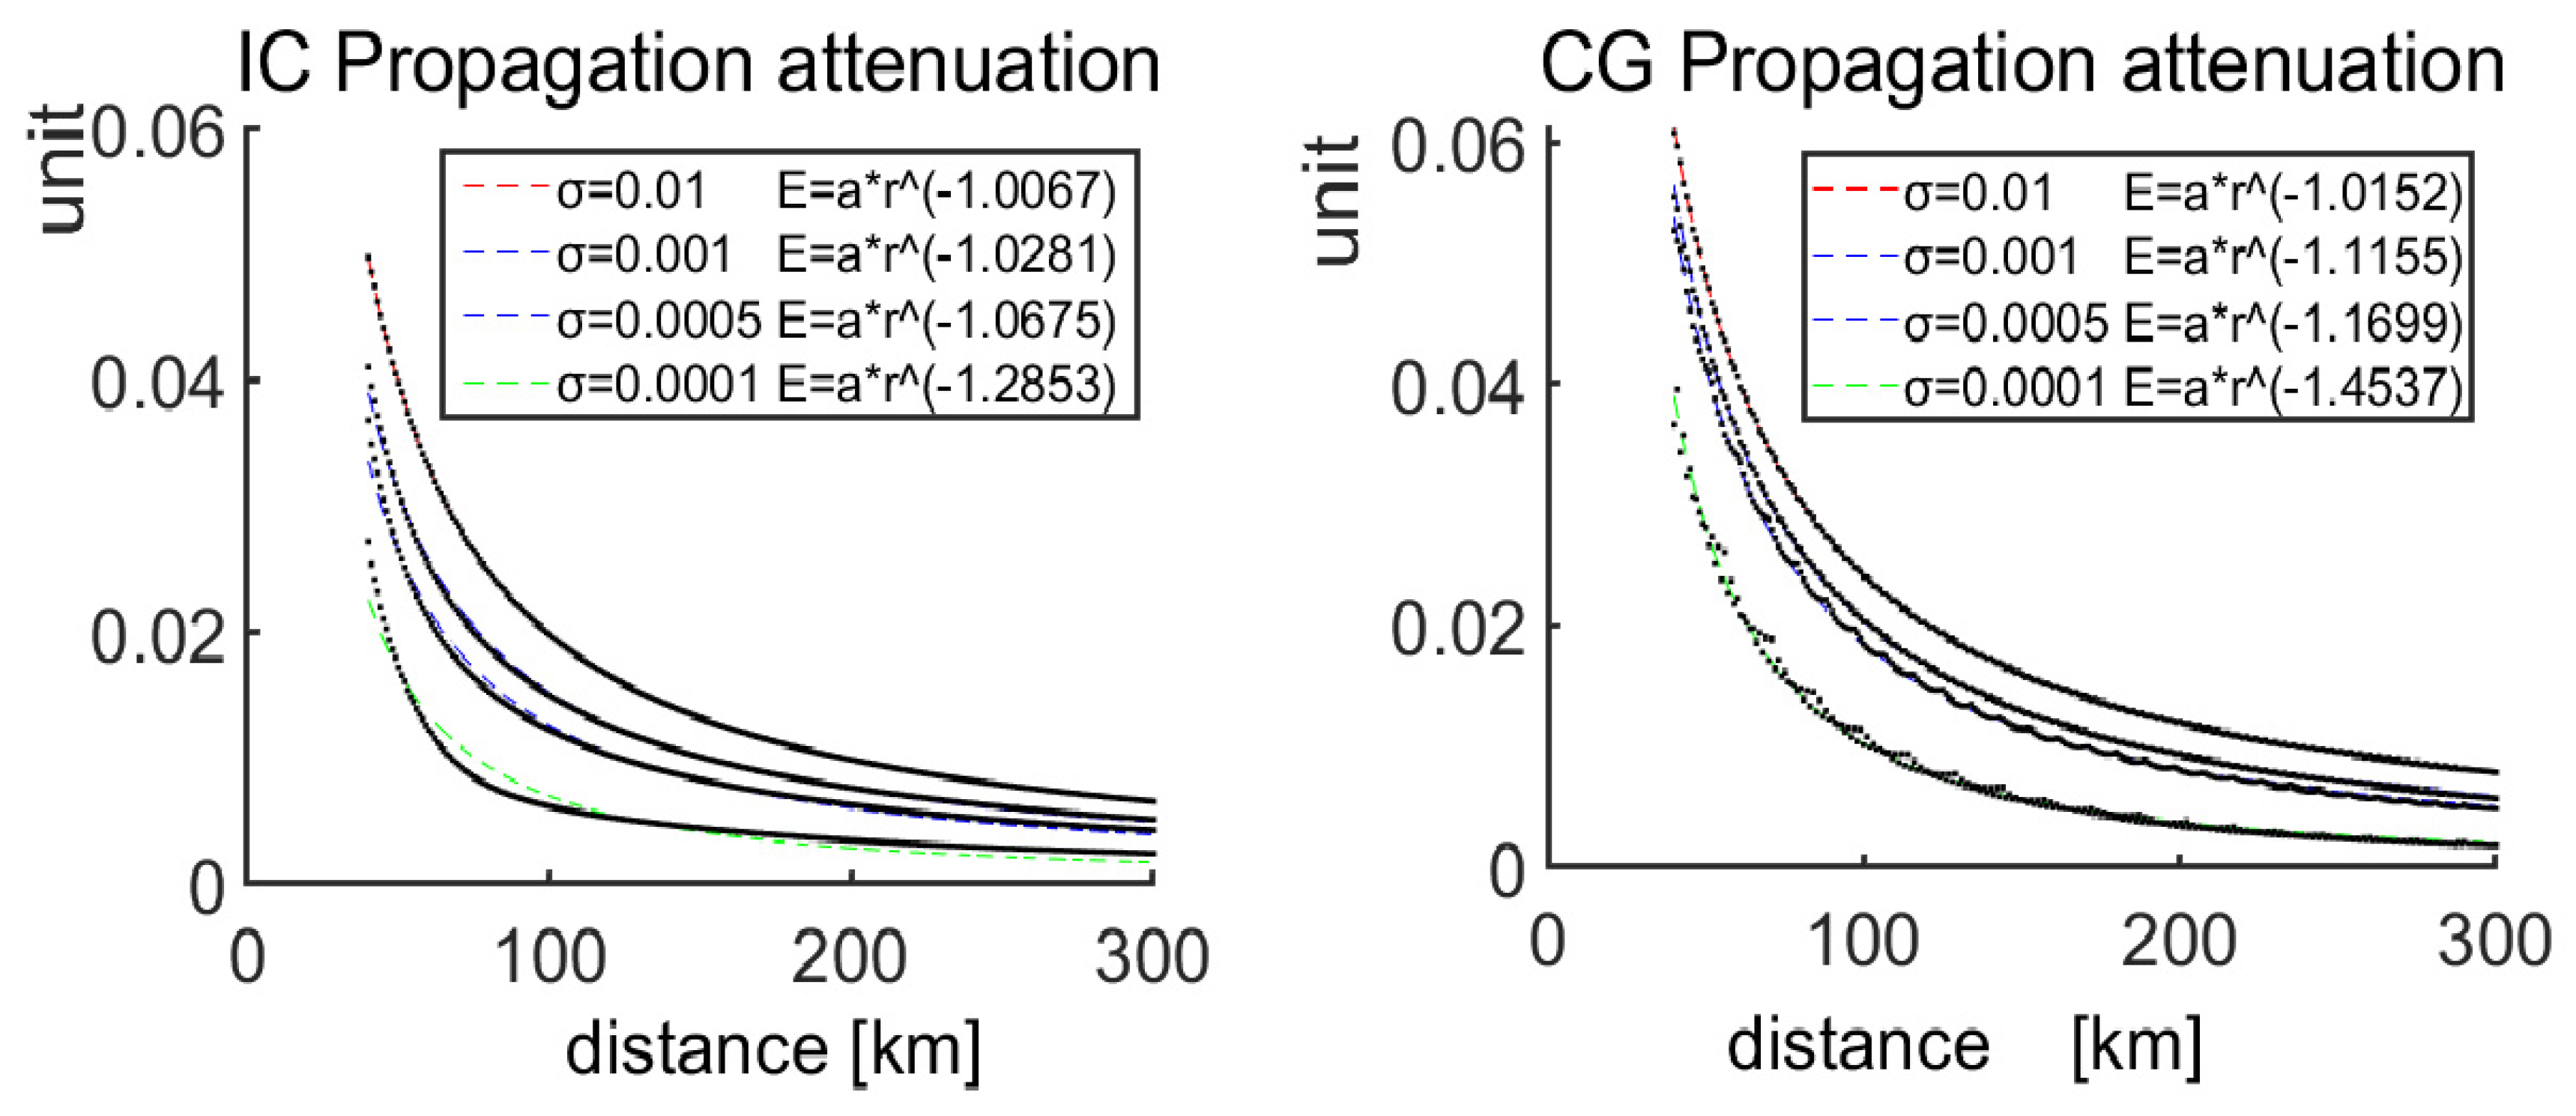
We further used COMSOL to simulate and characterize the propagation attenuation of IC and CG pulses over the ground surface with finite conductivity. COMSOL Multiphysics is based on the finite element method, and achieves the simulation of real physical phenomena by solving single-field or multifield partial differential equations, and solves the physical phenomena in the real world with mathematical methods. We took the vertical dipole model as the source of the lightning pulses. For the CG pulse, it was presumed that the height of occurrence was 200 m above the ground surface and the length of the simulated discharge was 199 m, while the IC pulse was assumed to be at a height of 8 km above the ground surface and the length of the simulated discharge was assumed to be 199 m. For the CG pulse, it was presumed that the frequency was mainly concentrated at 40 kHz, and the frequency of IC pulses was presumed to be concentrated at 120 kHz. According to the features of the actual observation dataset, the simulation studied an observation range of 300 km. The underlying surface was modeled with uniform conductivity, and the conductivity was set to be 0.01 S/m, 0.001 S/m, 0.0005 S/m, and 0.0001 S/m. Because the simulation range was within 300 km, this simulation did not consider the reflection of the ionosphere.
As for the IC pulses, when the conductivity is 10−4 S/m, the IC pulses will also be subject to relatively considerable attenuation, and the attenuation index is b = 1.285; for CG pulses, it is b = 1.454. When the ground conductivity is relatively high (e.g., 0.01), both IC and CG pulses will experience relatively small attenuation, and the attenuation index is b = 1.0067 (for IC pulses) and b = 1.0152 (for CG pulses). From the results of actual observations and numerical simulations, it can be seen that the ground conductivity has a considerable impact on the attenuation of lightning E-field. This influence provides a way to use the attenuation features of E-field strength to retrieve the ground conductivity. Johler 1961 [23] discussed how to use the LF/VLF electromagnetic pulse of lightning to determine the ground conductivity; by comparing the actual observed waveform and the predicted waveform under the influence of ground conductivity, he determined the conductivity between Leoti in west Kansas (Kansas, Brighton) and Colorado. Schueler and Thomson 2006 [24] used the ground wave signal of lightning received by the lightning location system of Florida KSC in 1992; by analyzing the variation in dE/dt with ground conductivity, they estimated the effective ground conductivity, and the geometric mean ground conductivity was 0.0059 S/m. Aoki et al. 2015 [25] observed a decrease in Ez peak and an increase in Ez rise time due to propagation over 200 km of Florida soil, which were reasonably well reproduced by the FDTD simulation with ground conductivity of 0.001 S/m. We can see from Figure 12 that when the ground conductivity is 5 × 10⁻³ S/m, the attenuation index is b = 1.0675 for IC and b = 1.1699 for CG. The measurement results of this paper were in the range of 5 × 10⁻³ S/m–10 × 10−3 S/m. Although this simulation only considers the uniform conductivity of the ground surface, and it does not consider the influence of roughness and earth curvature, this result is in good agreement with the electrical conductivity of 5 × 10⁻³ to 10 × 10−3 S/m in the plains region of the Huaihe River basin as published by Shaanxi Observatory, according to the empirical method used to predict the propagation delay of the ground wave for timing signal [26].
5. Conclusions
Based on the lightning pulse waveforms recorded by the modern lightning detection network, in this paper, we propose a method that applies the concentric ring technique to measure the propagation attenuation index of the lightning pulse waveform. This method does not need to precisely calibrate the field gain of sensors. Instead, it fixes the distance of lightning pulses with respect to a station, and uses the variation in the distance from another station to characterize the attenuation of a lightning pulse waveform with distance. For the large sample data recorded by the system, we found that for both IC and CG pulses, their peak values exhibit the relatively good power-law feature of E = ar−b with distance, while the attenuation index was b = 1.02 for IC discharges and b = 1.13 for CG strokes. On this basis, it can be concluded that under the condition of the same propagation path, the IC pulses experience less attenuation than CG pulses.
Our results also indicate that even when the condition of propagation attenuation is identical, there is also a relatively large fluctuation in the ratio of E-field gain. This indicates that even if we conduct the calibration of gain for the antenna sensor in the field, the gain coefficient of actual individual measurements could exhibit a relatively large fluctuation with respect to the calibrated gain coefficient.
Author Contributions
Conceptualization, B.Z.; methodology, W.W.; software, W.W.; validation, B.Z.; formal analysis, W.W.; investigation, W.W.; resources, data curation, writing—original draft preparation, W.W.; writing—review and editing, B.Z. All authors have read and agreed to the published version of the manuscript.
Funding
This research was funded by the National Key R&D Program of China (2017YFC1501501) and the National Natural Science Foundation of China (41831070, 41875006, 41974181, 42005068, and U1938115).
Institutional Review Board Statement
Not applicable.
Informed Consent Statement
Not applicable.
Data Availability Statement
The data that support this study are available from the author upon reasonable request.
Acknowledgments
The authors would like to thank Gaopeng Lu and Feifan Liu for helpful discussion and improving the English of this paper.
Conflicts of Interest
The authors declare no conflict of interest.
Abbreviations
List of abbreviations used in the paper:
| E-field | Electric field |
| CG | Cloud-to-ground discharges |
| NBE | Narrow bipolar events |
| IC | Intra-cloud discharges |
| TOA | The time of arrival |
| VLF/LF | Very-low-frequency/low-frequency |
| VHF | Very-high-frequency |
References
- Norton, K.A. The Propagation of Radio Waves over the Surface of the Earth and in the Upper Atmosphere. IEEE 1936, 25, 1203–1236. [Google Scholar] [CrossRef]
- Wait, J.R. Propagation effects for electromagnetic pulse transmission. Proc. IEEE 1986, 74, 1173–1181. [Google Scholar] [CrossRef]
- Wait, J.R. Concerning the horizontal electric field of lightning. IEEE Trans. Electromagn. Compat. 1997, 39, 186. [Google Scholar] [CrossRef]
- Wait, J.R.; Hill, D.A. Ground wave of an idealized lightning return stroke. IEEE Trans. Antennas Propag. 2000, 48, 1349–1353. [Google Scholar] [CrossRef]
- Cooray, V. Effects of propagation on the return stroke radiation fields. Radio Sci. 1987, 22, 757–768. [Google Scholar] [CrossRef]
- Caligaris, C.; Delfino, F.; Procopio, R. Cooray–Rubinstein formula for the evaluation of lightning radial electric fields: Derivation and implementation in the time domain. IEEE Trans. Electromagn. Compat. 2008, 50, 194–197. [Google Scholar] [CrossRef]
- Cooray, V. Propagation effects due to finitely conducting ground on lightning-generated magnetic fields evaluated using Sommerfeld’s integrals. IEEE Trans. Electromagn. Compat. 2009, 51, 526–531. [Google Scholar] [CrossRef]
- Zhu, B.; Zhou, H.; Thottappillil, R.; Rakov, V.A. Simultaneous observations of electric field changes, wideband magnetic field pulses, and VHF emissions associated with K processes in lightning discharges. J. Geophys. Res. Atmos. 2014, 119, 2699–2710. [Google Scholar] [CrossRef]
- Cooray, V. Horizontal electric field above-and underground produced by lightning flashes. IEEE Trans. Electromagn. Compat. 2010, 52, 936–943. [Google Scholar] [CrossRef]
- Cooray, V.; Rakov, V. On the upper and lower limits of peak current of first return strokes in negative lightning flashes. Atmos. Res. 2012, 117, 12–17. [Google Scholar] [CrossRef]
- Le Vine, D.M.; Gesell, L.; Kao, M. Radiation from lightning return strokes over a finitely conducting earth. J. Geophys. Res. Atmos. 1986, 91, 11897–11908. [Google Scholar] [CrossRef]
- Thottappillil, R.; Rakov, V.A.; Uman, M.A. Distribution of charge along the lightning channel: Relation to remote electric and magnetic fields and to return-stroke models. J. Geophys. Res. Atmos. 1997, 102, 6987–7006. [Google Scholar] [CrossRef]
- Orville, R.E. Calibration of a magnetic direction finding network using measured triggered lightning return stroke peak currents. J. Geophys. Res. Atmos. 1991, 9, 17135–17142. [Google Scholar] [CrossRef]
- Idone, V.P.; Saljoughy, A.B.; Henderson, R.W.; Moore, P.K.; Pyle, R.B. A reexamination of the peak current calibration of the National Lightning Detection Network. J. Geophys. Res. Atmos. 1993, 98, 18323–18332. [Google Scholar] [CrossRef]
- de Mesquita, C.R.; Dias, R.N.; Visacro, S. Comparison of peak currents estimated by lightning location system and ground truth references obtained in Morro do Cachimbo station. Atmos. Res. 2012, 117, 37–44. [Google Scholar] [CrossRef]
- Kolmašová, I.; Santolík, O.; Farges, T.; Cummer, S.A.; Lán, R.; Uhlíř, L. Subionospheric propagation and peak currents of preliminary breakdown pulses before negative cloud-to-ground lightning discharges. Geophys. Res. Lett. 2016, 43, 1382–1391. [Google Scholar] [CrossRef]
- Bils, J.R.; Thomson, E.M.; Uman, M.A.; MacKerras, D. Electric field pulses in close lightning cloud flashes. J. Geophys. Res. Atmos. 1988, 93, 15933–15940. [Google Scholar] [CrossRef]
- Smith, D.A.; Eack, K.B.; Harlin, J.; Heavner, M.J.; Jacobson, A.R.; Massey, R.S.; Shao, X.M.; Wiens, K.C. The Los Alamos Sferic Array: A research tool for lightning investigations. J. Geophys. Res. Atmos. 2002, 107, ACL 5-1–ACL 5-14. [Google Scholar] [CrossRef] [Green Version]
- Liu, F.; Zhu, B.; Lu, G.; Ma, M. Outbreak of Negative Narrow Bipolar Events in Two Mid-Latitude Thunderstorms Featuring Overshooting Tops. Remote Sens. 2021, 13, 5130. [Google Scholar] [CrossRef]
- Liu, F.; Zhu, B.; Lu, G.; Qin, Z.; Lei, J.; Peng, K.-M.; Chen, A.; Huang, A.; Cummer, S.A.; Chen, M.; et al. Observations of blue discharges associated with negative narrow bipolar events in active deep convection. Geophys. Res. Lett. 2018, 45, 2842–2851. [Google Scholar] [CrossRef]
- Cooray, V.; Fernando, M.; Sörensen, T.; Götschl, T.; Pedersen, A. Propagation of lightning generated transient electromagnetic fields over finitely conducting ground. J. Atmos. Sol.-Terr. Phys. 2000, 62, 583–600. [Google Scholar] [CrossRef]
- Qin, Z.; Chen, M.; Zhu, B.; Du, Y.-P. An improved ray theory and transfer matrix method-based model for lightning electromagnetic pulses propagating in Earth-ionosphere waveguide and its applications. J. Geophys. Res. Atmos. 2017, 122, 712–727. [Google Scholar] [CrossRef]
- Johler, J.R.; Lilley, C.M. Ground-conductivity determinations at low radio frequencies by an analysis of the sferic sinagures of thunderstorms. J. Geophys. Res. 1961, 66, 3233–3244. [Google Scholar] [CrossRef]
- Schueler, J.R.; Thomson, E.M. Estimating ground conductivity and improving lightning location goodness of fit by compensating propagation effects. Radio Sci. 2006, 41, RS1001. [Google Scholar] [CrossRef]
- Aoki, M.; Baba, Y.; Rakov, V.A. FDTD simulation of LEMP propagation over lossy ground: Influence of distance, ground conductivity, and source parameters. J. Geophys. Res. Atmos. 2015, 120, 8043–8051. [Google Scholar] [CrossRef]
- Liang, Z. Experimental method for forecasting propagation delay of ground wave for timing signal. CASO Publ. 1998, 21, 8–19. [Google Scholar]
Figure 1.
Schematic diagram for the derivation of E-field and B-field at point P on the ground surface. It is presumed that the ground plane is an ideal conductor, and r is the horizontal distance.
Figure 1.
Schematic diagram for the derivation of E-field and B-field at point P on the ground surface. It is presumed that the ground plane is an ideal conductor, and r is the horizontal distance.

Figure 2.
Geometric layout for using two measurement stations to investigate the peak value attenuation function with propagation distance. HF station and JS station are lightning observation stations. roa is the distance between point O and point A.
Figure 2.
Geometric layout for using two measurement stations to investigate the peak value attenuation function with propagation distance. HF station and JS station are lightning observation stations. roa is the distance between point O and point A.

Figure 3.
Layout of stations in the Jianghuai Area Sferic Array. The distance between the HF station and the JS station is 142 km.
Figure 3.
Layout of stations in the Jianghuai Area Sferic Array. The distance between the HF station and the JS station is 142 km.

Figure 4.
Waveforms of the same CG lightning stroke measured by stations of the Jianghuai Area Sferic Array.
Figure 4.
Waveforms of the same CG lightning stroke measured by stations of the Jianghuai Area Sferic Array.

Figure 5.
Waveforms of the same IC lightning stroke measured by stations of the Jianghuai Area Sferic Array.
Figure 5.
Waveforms of the same IC lightning stroke measured by stations of the Jianghuai Area Sferic Array.

Figure 6.
Map of the lightning events detected by the JASA from 26 August 2019 to 29 August 2019. The blue circle highlights the lightning that occurred at a distance of 200–210 km from the JS station.
Figure 6.
Map of the lightning events detected by the JASA from 26 August 2019 to 29 August 2019. The blue circle highlights the lightning that occurred at a distance of 200–210 km from the JS station.

Figure 7.
Observations at equal distance for (a) HF–FN station, (b) HF–HB station, and (c) HF–JS station links; d is 5 km, meaning within 5 km on both sides of the vertical bisector.
Figure 7.
Observations at equal distance for (a) HF–FN station, (b) HF–HB station, and (c) HF–JS station links; d is 5 km, meaning within 5 km on both sides of the vertical bisector.

Figure 8.
(a) Observations of field gain at equal distance for the HF–HB station link. (b) Observations of field gain at equal distance for the HF–FN station link. (c) Observations of field gain at equal distance for the HF–JS station link.
Figure 8.
(a) Observations of field gain at equal distance for the HF–HB station link. (b) Observations of field gain at equal distance for the HF–FN station link. (c) Observations of field gain at equal distance for the HF–JS station link.

Figure 9.
Logarithmic values of peak electric field value at the HF station vs. logarithmic values of distance for lightning events located at 205 km from the JS station.
Figure 9.
Logarithmic values of peak electric field value at the HF station vs. logarithmic values of distance for lightning events located at 205 km from the JS station.

Figure 10.
Observation results of EM pulse peak value at the HF station for lightning events located 150 km from the JS station.
Figure 10.
Observation results of EM pulse peak value at the HF station for lightning events located 150 km from the JS station.

Figure 11.
Observation results of EM pulse peak value at the HF station for lightning events located 250 km from the JS station.
Figure 11.
Observation results of EM pulse peak value at the HF station for lightning events located 250 km from the JS station.

Figure 12.
Variations in IC and CG peak values with distance obtained from the simulation.


Table 1.
Variation in the E-field peak values of CG and IC events with distance from the HF station.
Table 1.
Variation in the E-field peak values of CG and IC events with distance from the HF station.
| No. | Width of Distance Ring (km) | Radius of Circular Ring (km) | Attenuation Index of IC Events, b | Attenuation Index of CG Events, b |
|---|---|---|---|---|
| 1 | 5 | 150 | 1.0236 | 1.116 |
| 2 | 10 | 205 | 1.0422 | 1.1385 |
| 3 | 10 | 250 | 1.0171 | 1.1006 |
Publisher’s Note: MDPI stays neutral with regard to jurisdictional claims in published maps and institutional affiliations. |
© 2022 by the authors. Licensee MDPI, Basel, Switzerland. This article is an open access article distributed under the terms and conditions of the Creative Commons Attribution (CC BY) license (https://creativecommons.org/licenses/by/4.0/).
Share and Cite
MDPI and ACS Style
Wang, W.; Zhu, B. Characterizing Pulse Attenuation of Intra-Cloud and Cloud-to-Ground Lightning with E-Field Signal Measured at Multiple Stations. Remote Sens. 2022, 14, 1672. https://0-doi-org.brum.beds.ac.uk/10.3390/rs14071672
AMA Style
Wang W, Zhu B. Characterizing Pulse Attenuation of Intra-Cloud and Cloud-to-Ground Lightning with E-Field Signal Measured at Multiple Stations. Remote Sensing. 2022; 14(7):1672. https://0-doi-org.brum.beds.ac.uk/10.3390/rs14071672
Chicago/Turabian StyleWang, Wenwei, and Baoyou Zhu. 2022. "Characterizing Pulse Attenuation of Intra-Cloud and Cloud-to-Ground Lightning with E-Field Signal Measured at Multiple Stations" Remote Sensing 14, no. 7: 1672. https://0-doi-org.brum.beds.ac.uk/10.3390/rs14071672
Note that from the first issue of 2016, this journal uses article numbers instead of page numbers. See further details here.