
Numerical Analysis of Putative Rock Glaciers on Mount Sharp, Gale Crater, Mars


Department of Earth and Planetary Science, The University of New Mexico, Albuquerque, NM 87131, USA
*
Author to whom correspondence should be addressed.
Remote Sens. 2022, 14(8), 1887; https://0-doi-org.brum.beds.ac.uk/10.3390/rs14081887
Submission received: 1 March 2022
/
Revised: 2 April 2022
/
Accepted: 5 April 2022
/
Published: 14 April 2022
(This article belongs to the Special Issue Mars Remote Sensing)
Abstract
:The presence of buried glacial ice and putative extinct rock glaciers in Mars’ equatorial regions has implications for understanding its climate history and sensitivity to changes in insolation and has significant implications for past global redistribution of the water ice cryosphere. We quantify the morphology of rock glacier- “like” features on the northern slopes of Aeolis Mons (known also as Mount Sharp) within Gale crater and use this information to evaluate a possible rock glacier origin for these forms. Detailed morphometric evaluation of cross and long profiles of these lobate features, which exhibit higher slopes at their heads, lower slopes at their distal edge, and a convex upward cross-sectional profile and oversteepened sides, resembles active terrestrial rock glaciers. However, the absence of a chevron wrinkle pattern and sublimation features could indicate extensive aeolian reworking and the lack of deflation could indicate a higher rock to ice mixture. The lack of cratering surfaces relative to the cratered surfaces that they overly could indicate a younger age and are possibly indistinguishable in age from the capping units of Mount Sharp, which may have once been more laterally extensive and may have been the source of these mass wasting forms.
1. Introduction
Documenting evidence of past glacial and periglacial activity in the equatorial region of Mars is critical for understanding its climatic history and its sensitivity to insolation variability due to changes in orbital elements. At present, the equatorial region, while cold, receives insolation sufficient to prevent significant ice formation; hence, it is currently impossible to form and retain substantial volumes of surficial ice [1,2,3,4]. In contrast, the polar regions of Mars display CO2-rich ice caps that wax and wane at their equatorward margins, suggesting current conditions that are seasonally sensitive to changes in insolation and temperature [5,6].
Mid-latitude glacial forms have been documented by a number of researchers [7,8,9,10,11,12,13,14,15,16,17,18]. Baker et al. [7], using crater size frequency distributions, constrained the dating of the youngest of these cold-based glacially emplaced lineated valley fill (LVF) and lobate debris apron (LDA) features to ~100 Ma. While water ice at these mid-latitude sites is not currently stable [19,20,21,22], using a high-resolution climate simulation model and assuming a modern Mars water cycle, found that mid-latitude, and even low-latitude, sites could maintain water ice at obliquity angles approaching 45° [20]. Current Mars obliquity is 25.1° [23].
While glacier-like forms (GLF) and viscous flow features (VFF) [13,14,24] have been documented in the mid-latitudes, evidence of past glaciation and periglacial activity along the equatorial portion of the dichotomy boundary is incomplete, inconclusive, and/or missing. The dichotomy boundary, a global escarpment, stands several kilometers above datum and separates the northern lowlands (~−8000 m elevation locally) from the southern highlands (~3000 m elevation locally) and is high enough to be the first portion of the equatorial region capable of supporting long-lived ice, assuming insolation conditions are favorable. Modeled past obliquity change suggests that glacial ice may have formed several times over the past 200 MY [10,12,25,26,27,28,29,30,31,32,33,34,35]. This insolation change may have produced glacially modified forms in the equatorial portion of the dichotomy boundary [36], as well as periglacial features and rock glaciers [37,38].
During periods of high obliquity, past studies [39,40] suggest that Mars’ low latitudes/equatorial regions would see a decrease in average annual temperatures (<−50 °C), not an increase. However, these studies typically did not include the radiative effects of water vapor and clouds, including exchanges with the subsurface and water vapor. Some current studies suggest that further warming of the atmosphere by clouds during periods of high obliquity (~35 °C) modifies water cycles and increases temperatures. Further, the interaction of atmospheric dust particles obscures surface ice, which aids in reducing summer sublimation and provides dust nuclei for cloud production [41]. Therefore, higher obliquity rates that are necessary to transport water ice equatorward could also warm and enhance glacial flow rates [40] in the near past.
In our analysis, we quantify the morphology of rock glacier- “like” features on Mount Sharp within Gale crater, located on the dichotomy boundary, and use this information to evaluate a possible rock glacier origin for these forms. While initially documented by Anderson and Bell [42], and interpreted as potential rock glacier features [38,43], a detailed morphometric evaluation of their form and their potential flow rates has not been conducted. Here, we also analyze the potential relationship between flow rates and insolation variability.
In addition to the lobate features investigated in this paper, other features in Gale crater, associated with Mount Sharp and the crater floor, possibly attributable to glacial activity, have been noted by authors in the past [38,43], and with the present level of investigation, the possibility of their glacial origins range from likely to disproven. Quantitative analysis of most of the features has not been conducted, usually due to limitations of resolution or absence of topographic data. Long inverted channel deposits on the crater floor that have features in common with esker-type subglacial deposits have been rejected as glacial [43], but newer studies support a glacial hypothesis [44]. Recently, features on the rim of Gale crater and nearby, in the dichotomy boundary, have been attributed to glacial activity. Detailed examination of the Gale rim watersheds for Dulce Vallis and Peace Vallis (Figure 1c), in particular, have a sculpted surface and do not show evidence for a highly integrated and incised channel system consistent with the formation of the massive lake present in Gale, based on the lake deposits studied by Curiosity [45]. In addition, the crater rim topographic drainage floors contain inverted features, also suggestive of esker-like deposits [44,45]. Moreover, also present are rounded knobs on the slopes, extending down from the crater rim, that exhibit plucking on the downslope side, which are strongly similar to terrestrial roche moutonnée, formed from flowing ice [45]. Similar features have been observed on the lower slopes of Mount Sharp, but formed in the sediments making up the basement. Confirming this hypothesis from rover observations is difficult because the sub-ice features common in terrestrial situations are not present in the sediments, such as retention of glacial striations, and formation of glacial till with rounded and faceted boulders. Some features attributed to periglacial activity in Gale, including the presence of ice-wedge polygons [38], may be supported by observations in some formations in Gale [46].
An aim of this study was to quantify the morphology of the lobate features located on the northern face of Mount Sharp (Figure 1), and if they conform to a rock glacier morphology, to use their form to determine flow rates and possible formation times. The significance of a periglacial origin would imply that cold-based processes may have had a much larger role in the formation of the current landscape than previously thought, implying that the Martian climate may have been more variable than previously believed.
2. Study Area
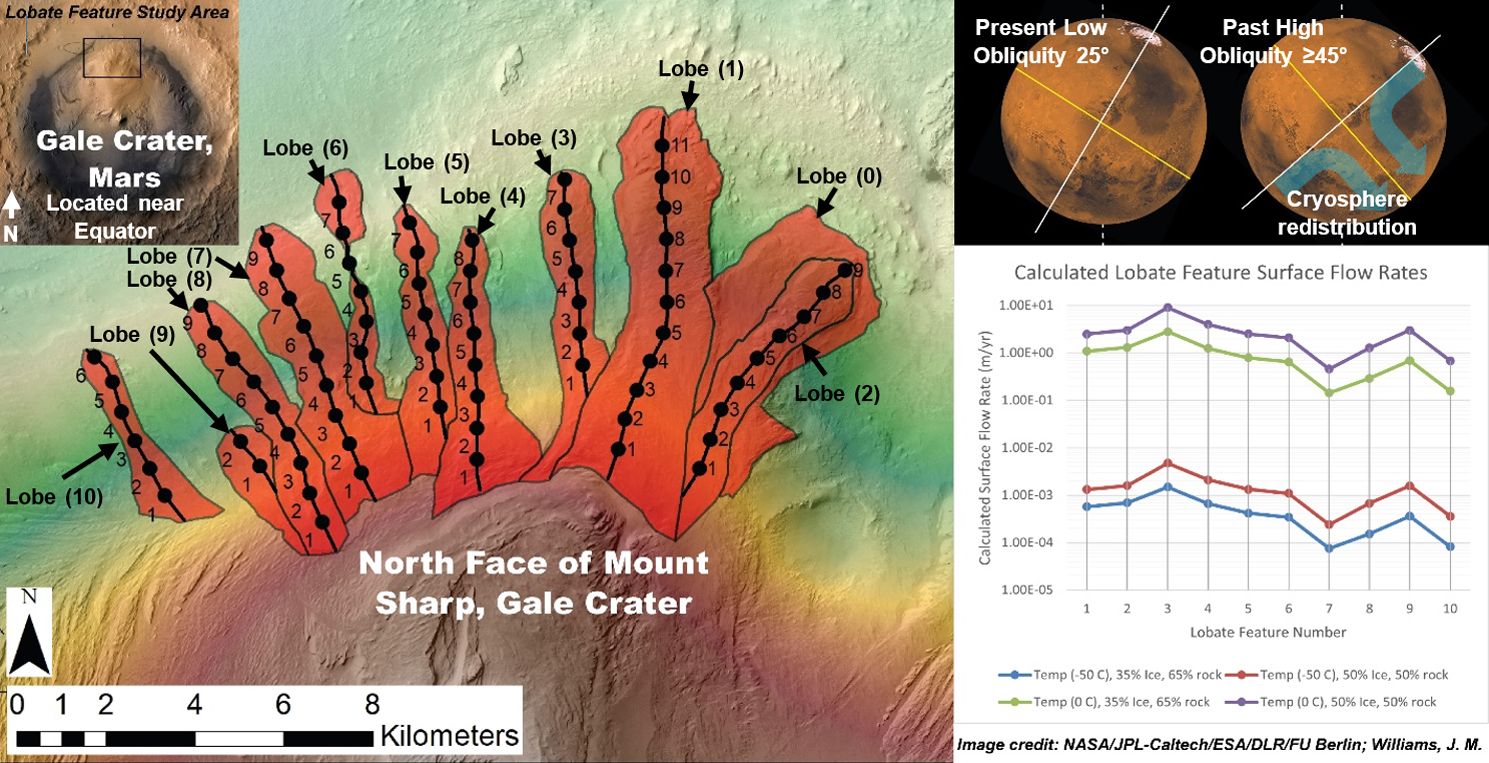
Gale (5.4°S 137.8°E) is a 154 km diameter crater located on the Martian dichotomy boundary (Figure 1a,b). Gale formed during the late Noachian to early Hesperian epochs (~3.6–3.8 Ga) [43,47,48] and has a thick sedimentary sequence, located in a central mound [47,49,50,51]. Gale’s floor, known today as Aeolis Palus, consists of a series of fluvial and fluvial deltaic sandstones and conglomerates [47]. Infilling of materials on the crater floor began shortly after crater formation and continued throughout the late Hesperian period, and likely into the Amazonian [43,47,48]. Ground-based observations by the Curiosity rover Mars Science Laboratory (MSL) [47,50] have confirmed the presence of fluvial, deltaic, lacustrine and aeolian sedimentary deposits on the floor of Gale crater.
After infilling, sedimentary deposits in Gale crater were likely exhumed by aeolian-driven erosion events, resulting in the creation of the central mound, Aeolis Mons—informally known as Mount Sharp [42,48,50,51]. Mount Sharp consists of a 5.2 km thick sequence of layered sedimentary deposits (Figure 1c), mantling a central uplift and is ~100 km at its widest, with an area of ~6000 km2 [38,42,51] (Figure 1c). Interpretation from orbitally derived data suggests that this sedimentary complex consists of phyllosilicates and sulfates, suggesting both a lacustrine and aeolian origin [48,50,52,53,54]. Multiple aeolian-driven erosion events, resulting in unconformities in the rock record are also evidenced by the decameter thick sandstone Stimpson formation, unconformably overlying the lacustrine Murray formation [53]. These stratigraphic relationships suggest a period characterized by multiple transitions between sustained cold wet and cold dry climates [54].
A lobate feature complex and associated mass wasting deposits on the north face of Mount Sharp (Figure 1c,d) extends nearly to the floor of Gale crater [42]. The complex appears to originate north of a concave depression, located close to the summit of Mount Sharp [38,42,43], and consists of at least 11 discrete lobate features that display a range of preservation states, from pristine forms to highly degraded remnants. The stratigraphically higher lobate features mantle other more degraded lobate features, suggesting multiple episodes of activity. La Deit et al. [37] suggests that the lobate deposits formed after the deposition of the early Hesperian Syu1 unit, which they overly at their western edge, and before the deposition of the late Hesperian to Early Amazonian Cyu and Bu units. Le Deit et al. [37] and Fairén et al. [38] have suggested that these lobate features could have had an origin as rock glaciers, but to date, no quantitative analysis using morphometric data has been conducted to test this hypothesis.
3. Scientific Background
Currently, Mars is a cold hyper-arid planet, with little to no liquid water phase. Geomorphically, it is dominated by aeolian processes, with wind-formed features found across the equatorial to mid latitudes. Aeolian erosion is the likely driving mechanism for removing many tens of thousands of cubic kilometers of sediment across Mars [49,51]. This interpretation is based primarily on irregularly distributed large kilometer-scale features that include kilometer-scale yardangs, decimeter-scale escarpments, and finer-scale ventifacts [49,55,56,57,58,59,60,61,62]. Aeolian deposition and erosion are believed to have played an important role in the genesis of Mount Sharp within Gale crater [50].
3.1. Water, Ice and Glacial Forms on Mars
Water is currently stored as ice in the Martian cryosphere at high latitudes (45–90°) in each hemisphere, primarily in the polar zone ice caps and other surface expressions, with buried ice deposits further equatorward [63]. A wide range of features at high latitudes, including banded terrain, lineated valley fills (LVF’s) and lobate debris aprons (LDAs) [15,37], suggest past and possibly even relatively recent glacial and periglacial activity. This is especially evident in lobate forms, such as those seen in LDAs that are clearly visible at high latitudes on the dichotomy boundary. These features, including the broadening and extension of valleys that create isolated mesas, suggest a retreat of the dichotomy boundary by many hundreds of kilometers [12,29].
This range of glacial morphologies is interpreted as likely representing disparate formative/ evolutionary processes. LDA (Figure 2) and LVF are the most prevalent and common glacial modification features documented at higher latitudes [15]. LDAs, which are similar in appearance to terrestrial rock or debris glaciers [9,64], hold significant amounts of water ice, as evidenced by data from the Shallow Radar (SHARAD) instrument on board the MRO [65], further supporting a glacial origin. However, LDA and LVF at lower latitudes are interpreted as having lost much, if not all, of their internal water ice and, therefore, represent relict forms that once held much larger ice volumes [9,14,19,66].
LDAs, found on low angled slopes and characterized by lobate outlines, have historically been interpreted to be evidence of debris flows, lubricated by basal ice or groundwater [9,66,67,68,69]. These features, typically sourced from arcuate valley-wall alcoves, extend onto lower adjacent lowlands and commonly exhibit down-valley flow, merging of multiple flow lines into a single main trunk valley form, and termination into lobe-shaped deposits.
They are usually found in fretted valleys, an abrupt escarpment of highly irregular planimetric configuration [60,70], on or near the dichotomy boundary and are widespread at mid-latitudes between 30° and 60° in both hemispheres [60]. However, while appearing analogous to terrestrial valley rock glaciers consisting of rocky debris material with interstitial pore ice [71,72,73], there is some question as to their actual genesis and formative process on Mars [66].
3.2. Terrestrial Rock Glacier Characteristics
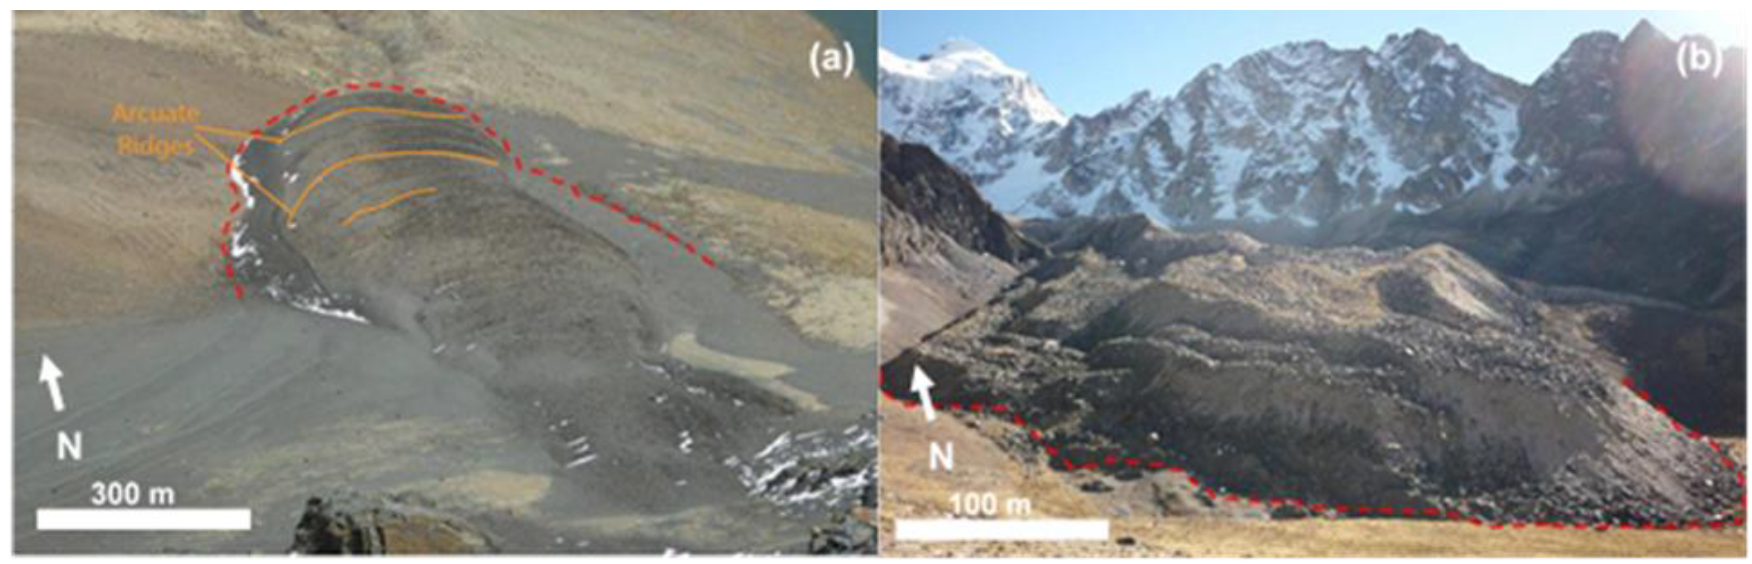
Terrestrial rock glaciers, typically found in high mountainous regions, are defined as lobate, or tongue-shaped landforms. They consist of angular, poorly sorted rock debris, with either an ice core or an ice-cemented rock matrix, with a surface characterized by a coarse-grained debris layer that acts to insulate ice contained in the cemented matrix. Terrestrial rock glacier clasts range in size, from pebble (4 mm) to boulder (>25 cm). Rock glacier surfaces are characterized by a distinctive series of linear to arcuate ridges and furrows, commonly known as a “wrinkled” pattern (Figure 3a), that typically run perpendicular to the flow direction [74,75].
Active rock glacier distal slopes are typically over-steepened (Figure 3b), with slopes of up to 40–45° [76]. Source zones are associated with the heads of steep-walled valleys and are typically part of a wide amphitheater-like catchment, such as a cirque basin or nivation hollow [73,77,78] (Figure 4). The ice/water accumulation zones of these features are associated with scree-covered slopes at the base of a cliff or steep rocky headwall that have accumulated through periodic rockfall (Figure 4).
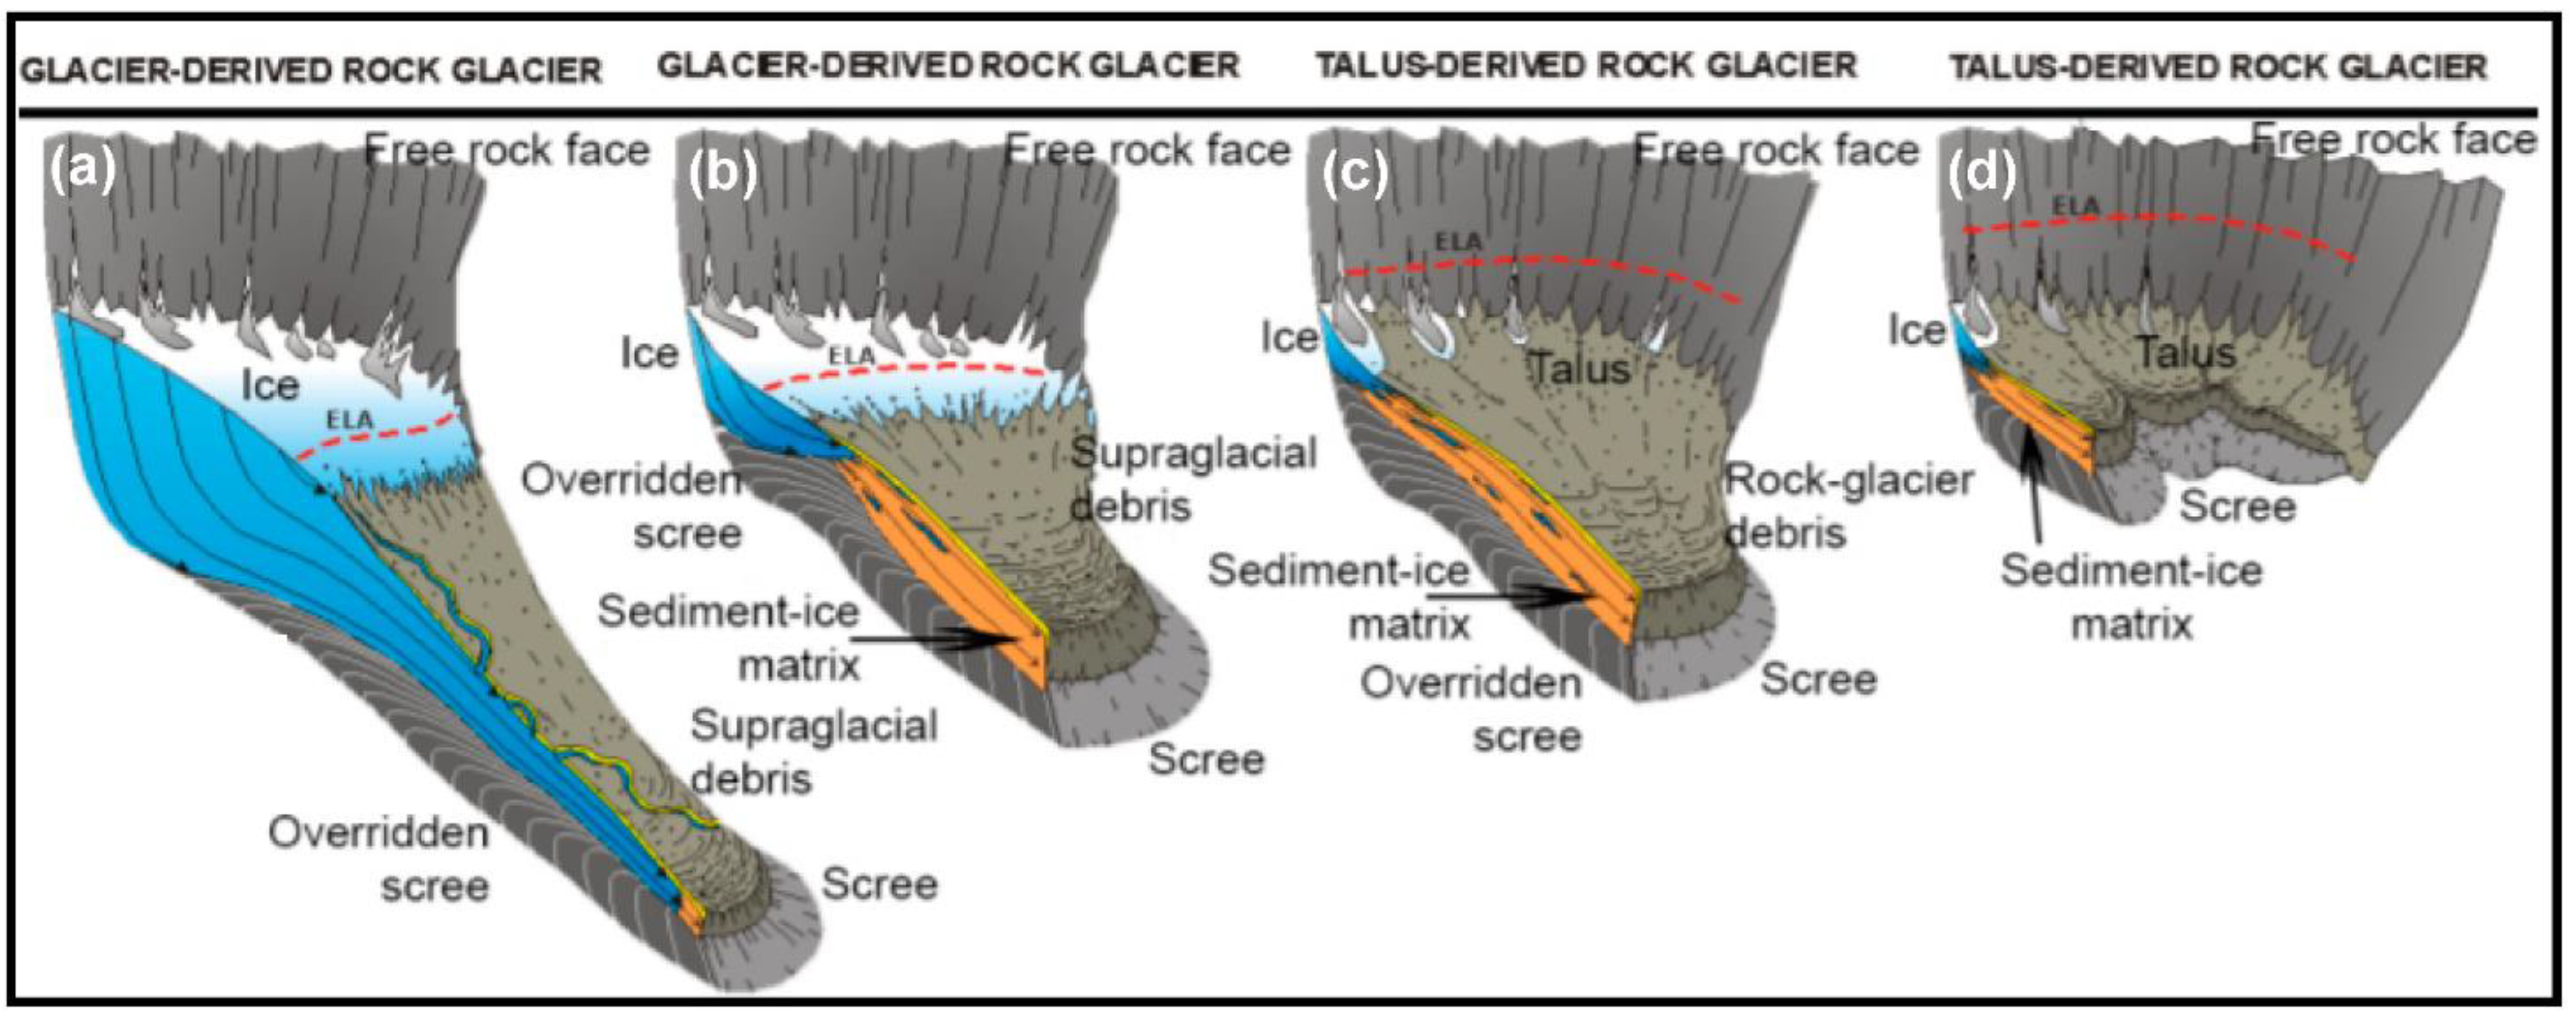
Rock glacier origin and formation models fall into three categories: (i) glacial (or former/relict glacial), (ii) permafrost, or (iii) landslide (mass wasting) (Figure 4) [79,80]. Glacial and permafrost models (Figure 4a,b) invoke the flow via creep, which acts through movement between or within ice crystals, as ice behaves as a nonlinear viscous material [79]. In contrast, the landslide model (Figure 4c,d) postulates origins by mass-wasting emplacement [80].
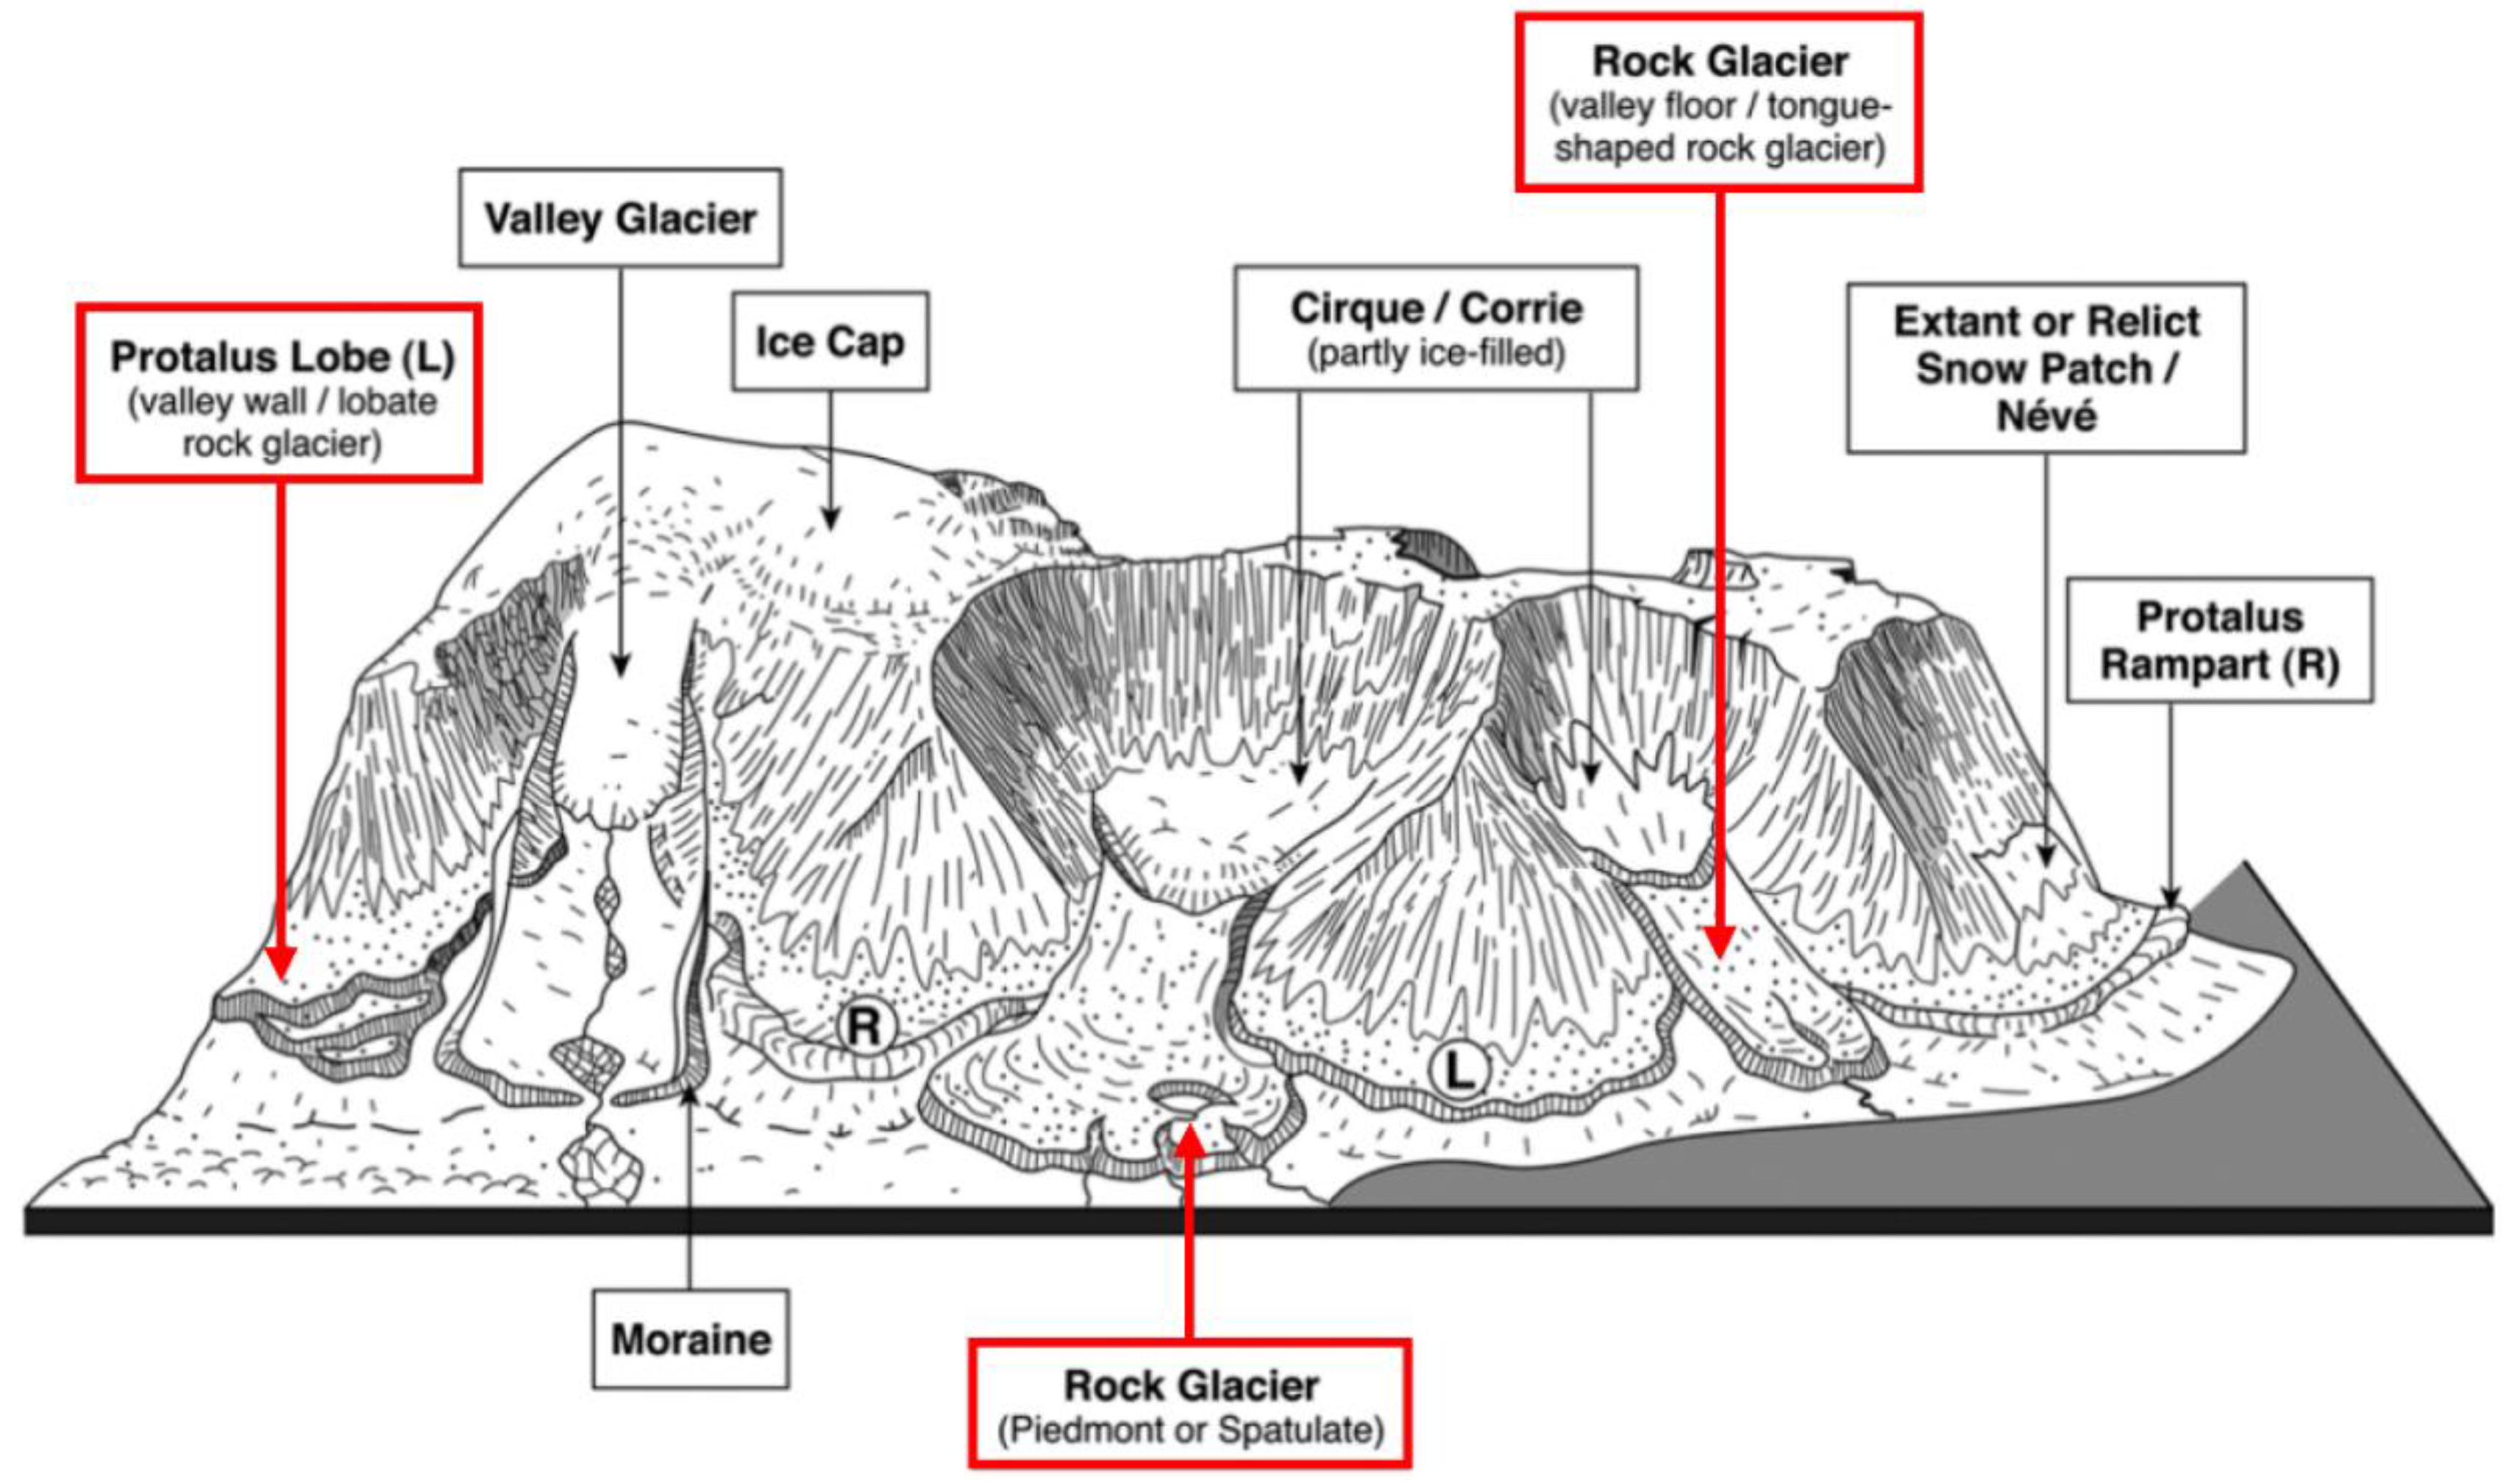
The ‘Glacial’ model depends directly on the preservation of a thin (<50 m) body of ice, insulated by a mantle of rock debris [74,80]. In this model, the thin glacial-derived ice creeps at lower rates than traditional valley glacial bodies. The debris mantle acts as a protective layer from ablation; therefore, these features are ‘azonal’ and can cross climatic zones, allowing a longer active period, even after climatic conditions become unfavorable for glacial processes. A subcategory of the glacial model is the ‘Protalus rampart’ model, typically associated with debris covering snow or ice accumulations or micro-glaciers [80] (Figure 5). ‘Protalus lobes’ are generally not thought to be associated with glacial processes, yet do not necessarily require permafrost conditions. These features may be preserved depending on azonal conditions (debris thickness, altitude, aspect and thermal conditions) [82,83] (Figure 5).
The ‘Permafrost’ model implies that the rock glacier ice is formed from freezing water injected under pressure or by ice segregation. This results in the formation of discrete layers or lenses of ice in freezing talus pore spaces, due to the migration and subsequent freezing of pore water [85]. Rock glacier features in this ‘talus-derived’ or ‘ice-cemented’ model typically have low flow rates due to ice creep in the pores and ice lenses associated with permafrost development. In this model, rock glaciers are typically found in climatic regimes with low precipitation and extreme temperature ranges [86]. However, the ‘zonal’ permafrost model implies a thermal condition, requiring an annual air temperature maximum of −1.5 °C, therefore, indicating relict or present-day permafrost [80].
The landslide genesis model implies that rock glaciers can be derived from rock avalanches [86,87]. Typically, these forms will not flow after emplacement. They can also be described as “instant” rock glaciers, as some rapid landslides or ‘Bergsturtz/Sturtzstroms’ fall on down-wasting/retreating glaciers [80] and are possibly a variation of the glacier ice core model. The three models produce forms that are, in theory, very similar, if not morphometrically identical. As such, it is important to note that the genesis for rock glaciers is widely debated, with no one theory accepted at this time.
Ice content in terrestrial rock glaciers ranges from none (relict forms, no movement [64,88]), to minor ice (stagnant forms, minor movement) to a nearly 100% ice composition, with a variable thickness debris mantle (active forms). Transitions between these stages are continuous [64]. While identification of the ice to rock volume is exceedingly difficult for terrestrial rock glaciers, studies have used ranges of rock/ice between 35/65 and 50/50 [89]. This range of compositions coupled with morphometrics (length, slope, height, surface curvature, etc.) can be used to reconstruct possible past flow dynamics. Virtually all terrestrial rock glaciers form in cryo-conditioned landscapes due to precipitation, groundwater or meltwater permeating into mechanically weathered debris, typically derived from headwalls and scarps, and subsequently freezing [90,91,92]. Surface mass exchange includes additions from snowfall, hoar frost, diamond dust and avalanche accumulations, as well as freezing rain, refreezing of meltwater, snow or ice melt, sublimation, redistribution through aeolian souring and calving of ice blocks at glacier terminus. For rock glaciers, the mass balance gradient differs significantly from debris-free glaciers; hence, debris cover can insulate glaciers from ablation [93]. Therefore, rock glaciers can persist in landscapes well beyond debris-free glaciers because they have a much longer response time to climate change [52].
4. Equations Controlling Rock Glacier Flow
Rock glaciers flow slowly, typically at a rate of <1 m/yr [94], an order of magnitude slower than pure ice glaciers [75,80,88]. Like traditional glaciers, they flow in response to stress produced by the gravity-driven deformation of ice, internal sediment/ice interactions, or by sliding at the ice–bed interface. Resistance to this strain depends on ice temperature, crystal structure, bed roughness, debris content, water pressure and other factors [95]. The surface pattern of transverse ridges and furrows is thought to be caused by fractures and debris bands, resulting from extensional flow [38,80].
Morphometric analysis of surface forms combined with calculations of the possible range of basal shear stress and subsequent flow rates can aid in determining whether they are in accord with similar rock glacier features on Earth.
Typically, basal shear stress (τb) is calculated as [96]:
where, ρ is the average density of the glacial body (kg/m3), g is the gravitational force of the planetary body, α is the slope at points along a transverse (center) of the form, from the head of the lobe to its distal end (Figure 6), while h is the height or thickness of the glacial body at each point along the central traverse.
τb = ρgh(tanα),
Shear strain flow rate (ε) is calculated using the Glen-Nye Flow Law [78], which quantifies the relationship between creep and stress:
where, ε is the strain rate, k (s−1(kPa−3)) is a constant defined by a material parameter that is dependent on the ice temperature, crystal orientation, impurity content and other factors [76,97,98,99], τb is the calculated basal shear stress (kPa) and n is the stress component constant. The exact value of the stress exponent for rock glaciers is typically difficult to determine [100], but it is at least larger than in the case where material moves as creep (i.e., Newtonian fluid). For pure Newtonian stresses, n = 1, while for pure non-Newtonian stresses, n = 3 [100]. Since rock glaciers rheology is complicated, relative to pure water ice glaciers and dominated by dislocations (non-viscous responses due to rock and ice mixture), the stress exponent for terrestrial rock glaciers is typically taken as 3 [76]. However,
ε = kτbn,
Mars’ gravity is approximately 1/3rd of Earth and, therefore, due to reduced stress on the glacial body, ice deformation is dominated by grain-size dependent deformation (n = 2) [101]. In order to calculate the surface flow rate (Us), we used the following formula [98]:
where, Ub is the base velocity (m/s), Us is the surface velocity (m/s), k, n and τb defined above (Formula (2)). Since we are assuming a cold base glaciation and no basal slip, Ub = 0. This gives us:
Us = Ub + ((2k)/(n + 1))τbn,
Us = ((2k)/(n + 1))τbn,
Variables defined above (Formulas (2) and (3)).
5. Methodology
In order to assess evidence supporting the hypothesis of a glacial or periglacial origin of lobate features on Mount Sharp, we performed a numerical analysis on the lobate forms. We first extracted morphometric data from each lobate feature, compiled using high-resolution orbitally derived imagery from two instruments on the Mars Reconnaissance Orbiter (MRO), the ~0.25 m/pixel resolution High Resolution Imaging Science Experiment (HiRISE) [102] and the ~6 m/pixel resolution Context Camera (CTX) [103].
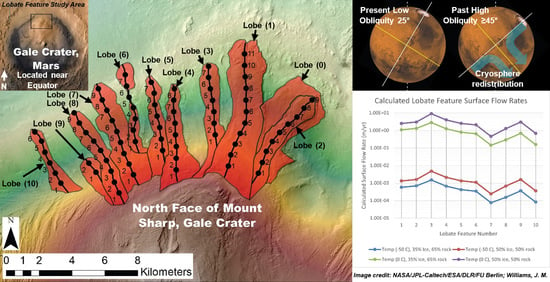
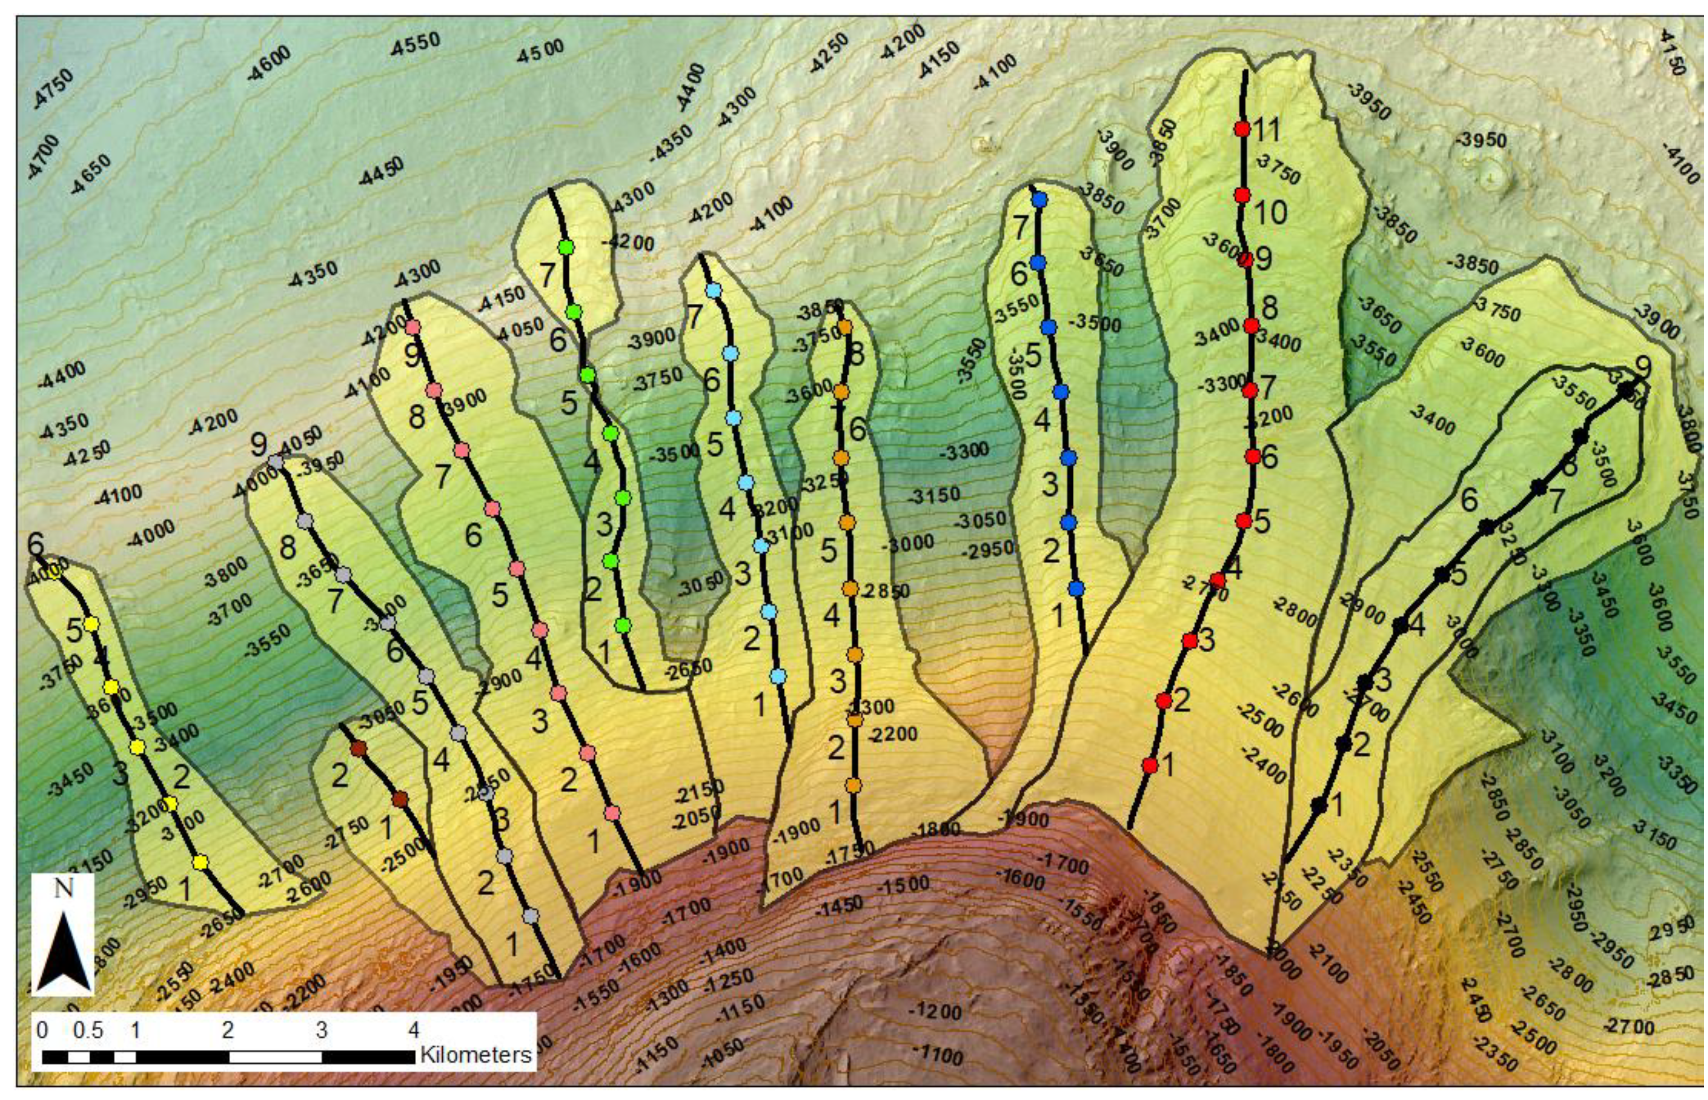
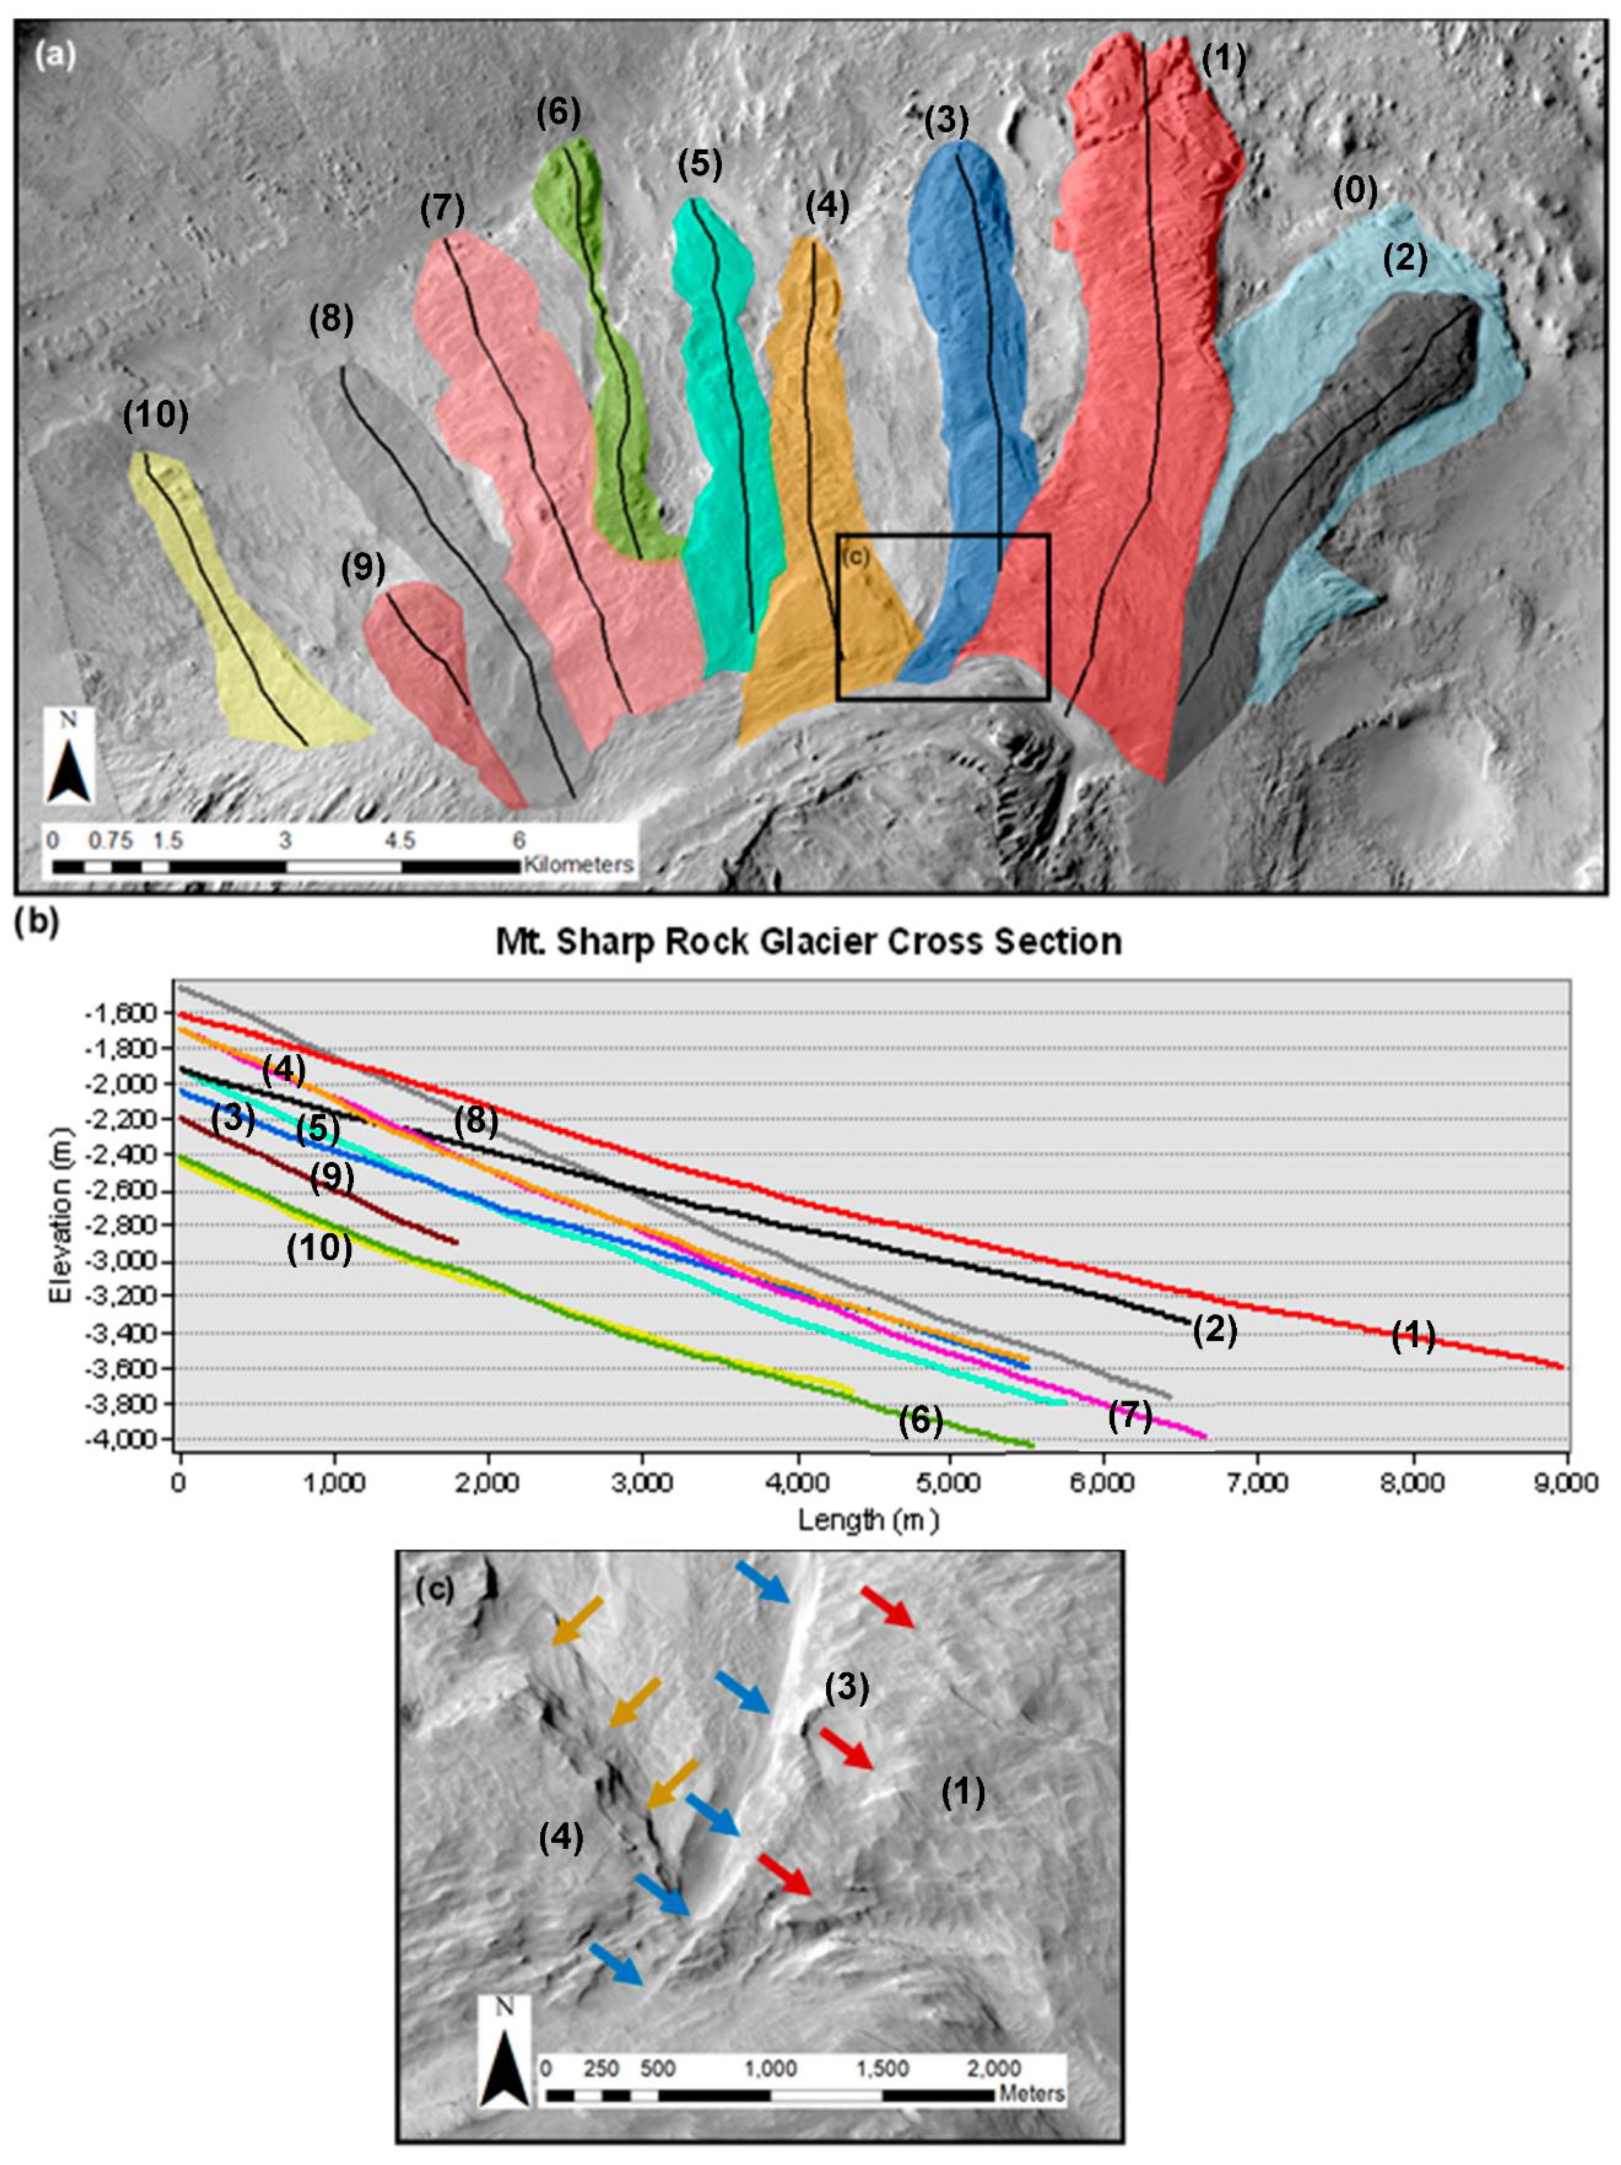
A Geographical Information System (GIS) database, consisting of the CTX and HiRISE imagery and DEM data, and vector outlines and center transect lines of 10 lobate forms (Figure 6) was compiled using ArcMap 10.8.1. Because of significant overlap of lobe (0) only lobes 1–10 were retained for analysis. The boundary outline of each lobate form was captured with heads-up vectorization using the 3D Analyst Interpolate Polygon tool in ArcGIS. The Identify tool was used to capture equidistant points for flow analysis at ~700 m spacing along each transect (Figure 6). A finer extraction was not merited due to the resolution of the source data. The CTX DEM and HiRISE imagery were used in ArcGIS to derive slope, aspect, contour, and shaded-relief layers as well as cross sections. Lobe length and area, and the elevation profile along each transect and cross-section, were calculated in ArcGIS and added to the database. Morphometric information for each of the lobate features is shown in Table 1.
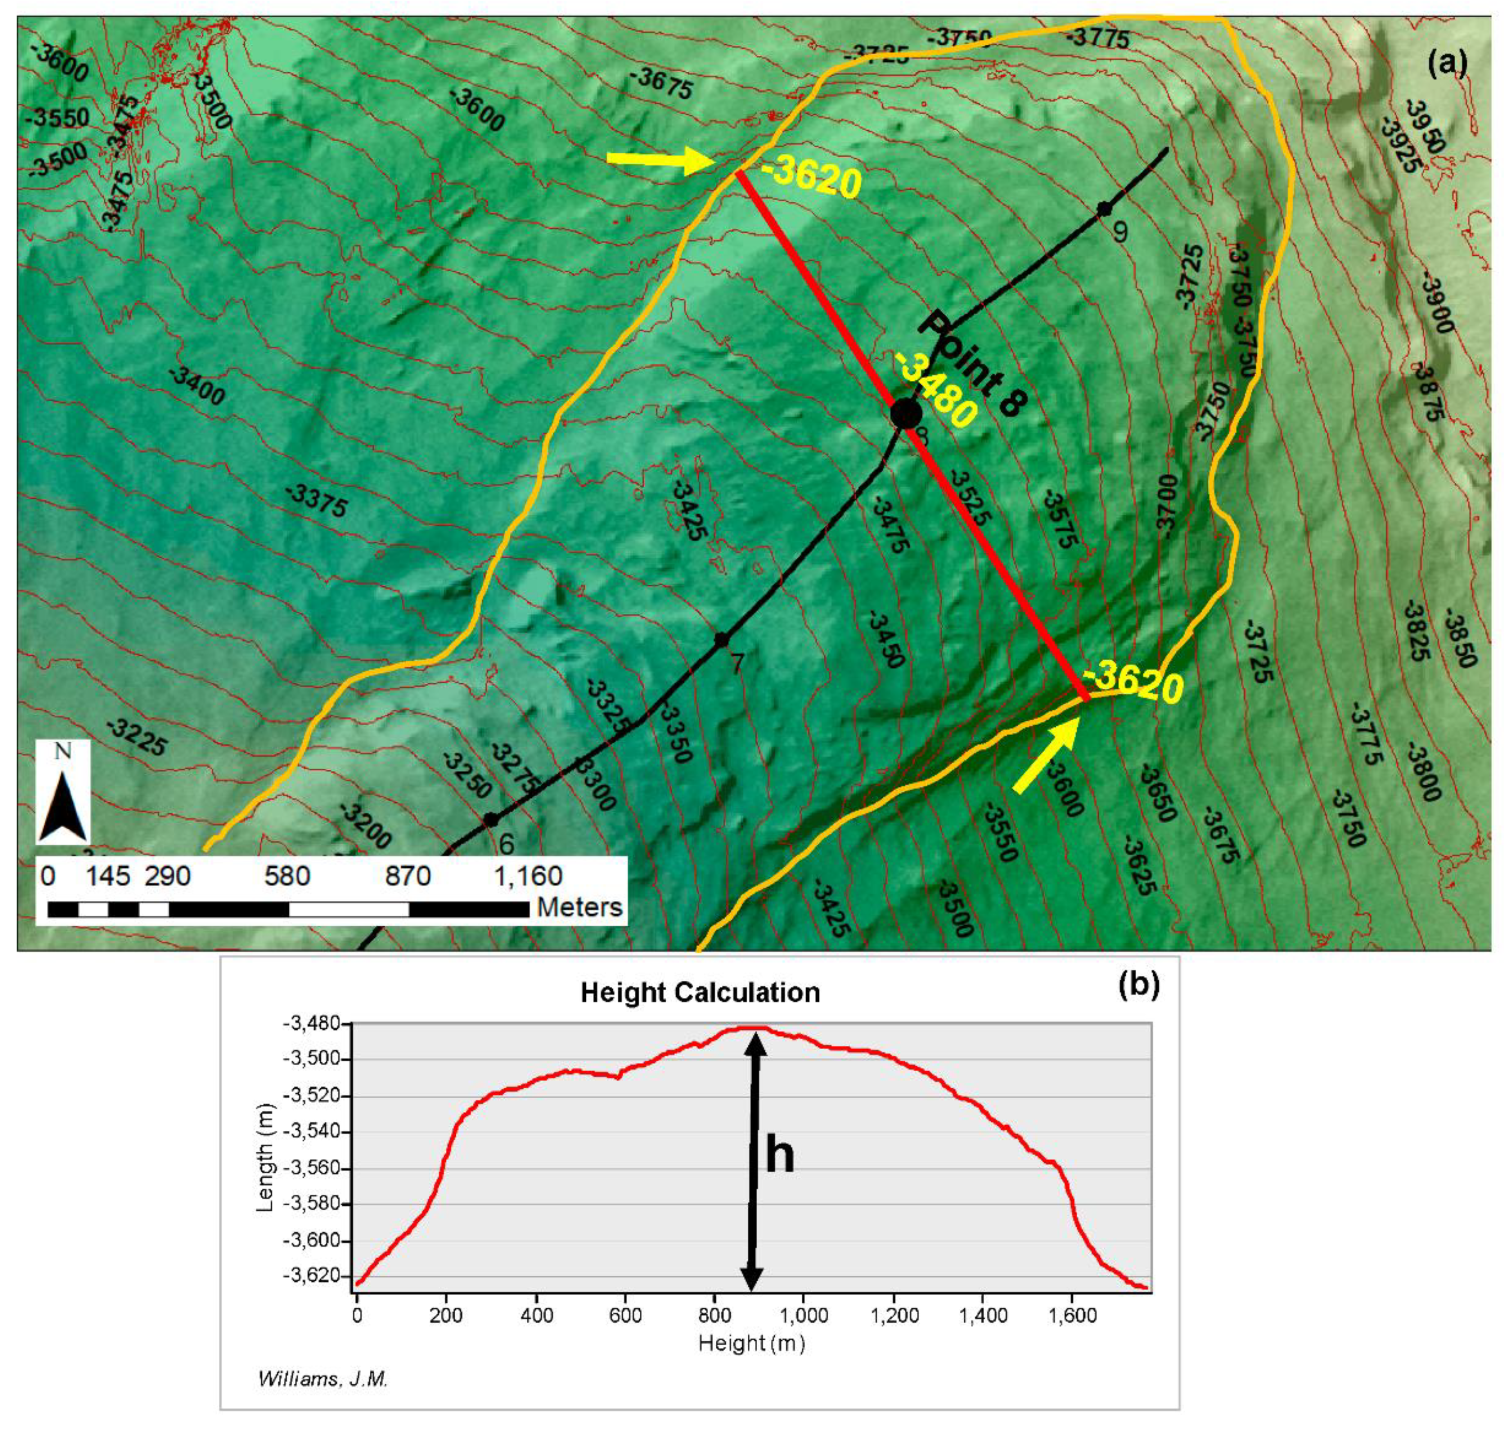
The underlying ground elevation below each lobate feature was derived by creating a perpendicular line through each transect point drawn to the edge of the lobate feature (Figure 7a). A line drawn connecting the ground elevations at endpoints of each perpendicular (yellow arrows Figure 7a) was used to estimate the ground elevation below each transect point. Maximum thickness at each transect point (h) was then estimated by subtracting the underlying ground elevation from the lobate spot elevation (Figure 7b). We did not include basal scouring and deepening effects as we believe these forms to be periglacial and therefore likely frozen to the underlying bedding at the time of formation.
The proportion of thickness attributable to rock and ice assuming admixtures ranging from 35/65 to a 50/50 basaltic rock/water ice mix was calculated at each location and used in subsequent flow modeling. Assuming modern ice content is zero, we added back ice from a 35/65 and a 50/50 basaltic rock/water ice mix and adjusted the past height with these percentages. The adjusted thickness (h) at the transect points (Figure 7b) was used to calculate basal shear stress (τb) (Formula (1)), where the average density (ρ) is the mixture of rock and ice (~1800 kg/m3) with Martian gravity (g) of 3.711 m/s2. Slope (α) was calculated for each transect point from the head of the lobe to its distal end (Figure 6).
Flow rate (ε) (Formula (2)) was calculated for a range of temperatures; the lowest estimated temperature value (−50 °C) has a flow parameter k of 3.6 × 10⁻¹⁸ (s−1(kPa)−3) while the rate for the highest possible temperature value is 0 °C and has a flow parameter k of 6.8 × 10⁻¹⁵ (s−1(kPa)−3) (Table 2). However, it is important to note that this simplified model did not account for possible hardening effects of suspended lithic fragments. At colder temperatures (−131 C to −50 °C) the effect of particulates is hardening due to tortuosity of ice flow paths around lithic particle and viscous drag of flowing ice. At warmer temperatures (−50 °C +) the effect of lithic particles actually impedes ice grain growth and thus retains creep within the GSS regime [101]. Glen Flow Law values were calculated for the lobe points using the estimated shear stress at both the 35/65 and 50/50 basaltic rock mix and water ice for the lowest (−50 °C) and highest (0 °C) temperatures (Table 2 and Table 3). Finally, we vertically integrated the strain rate to ice body surface flow velocity (Us) (Formula (4)) for both the lowest (−50 °C) and highest (0 °C) temperatures (Table 2 and Table 3).
6. Analysis
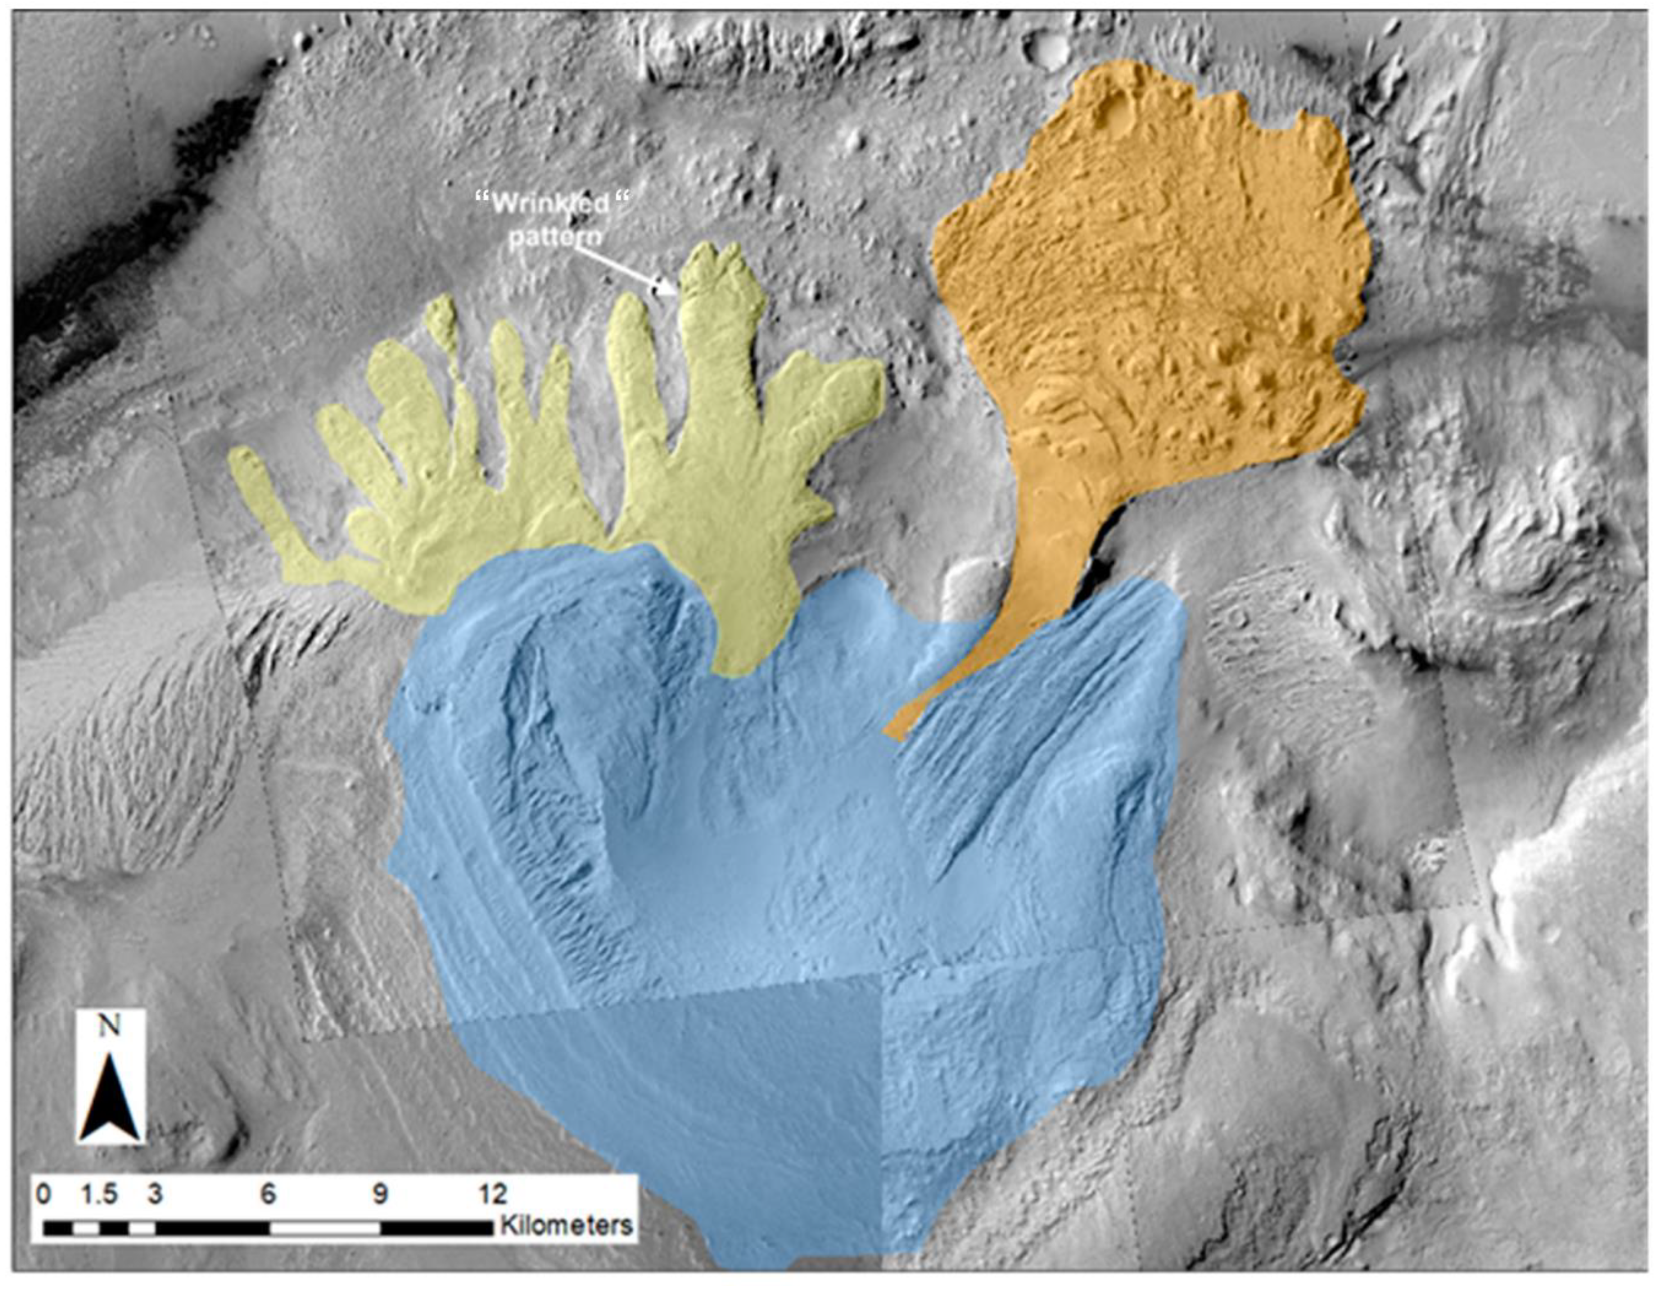
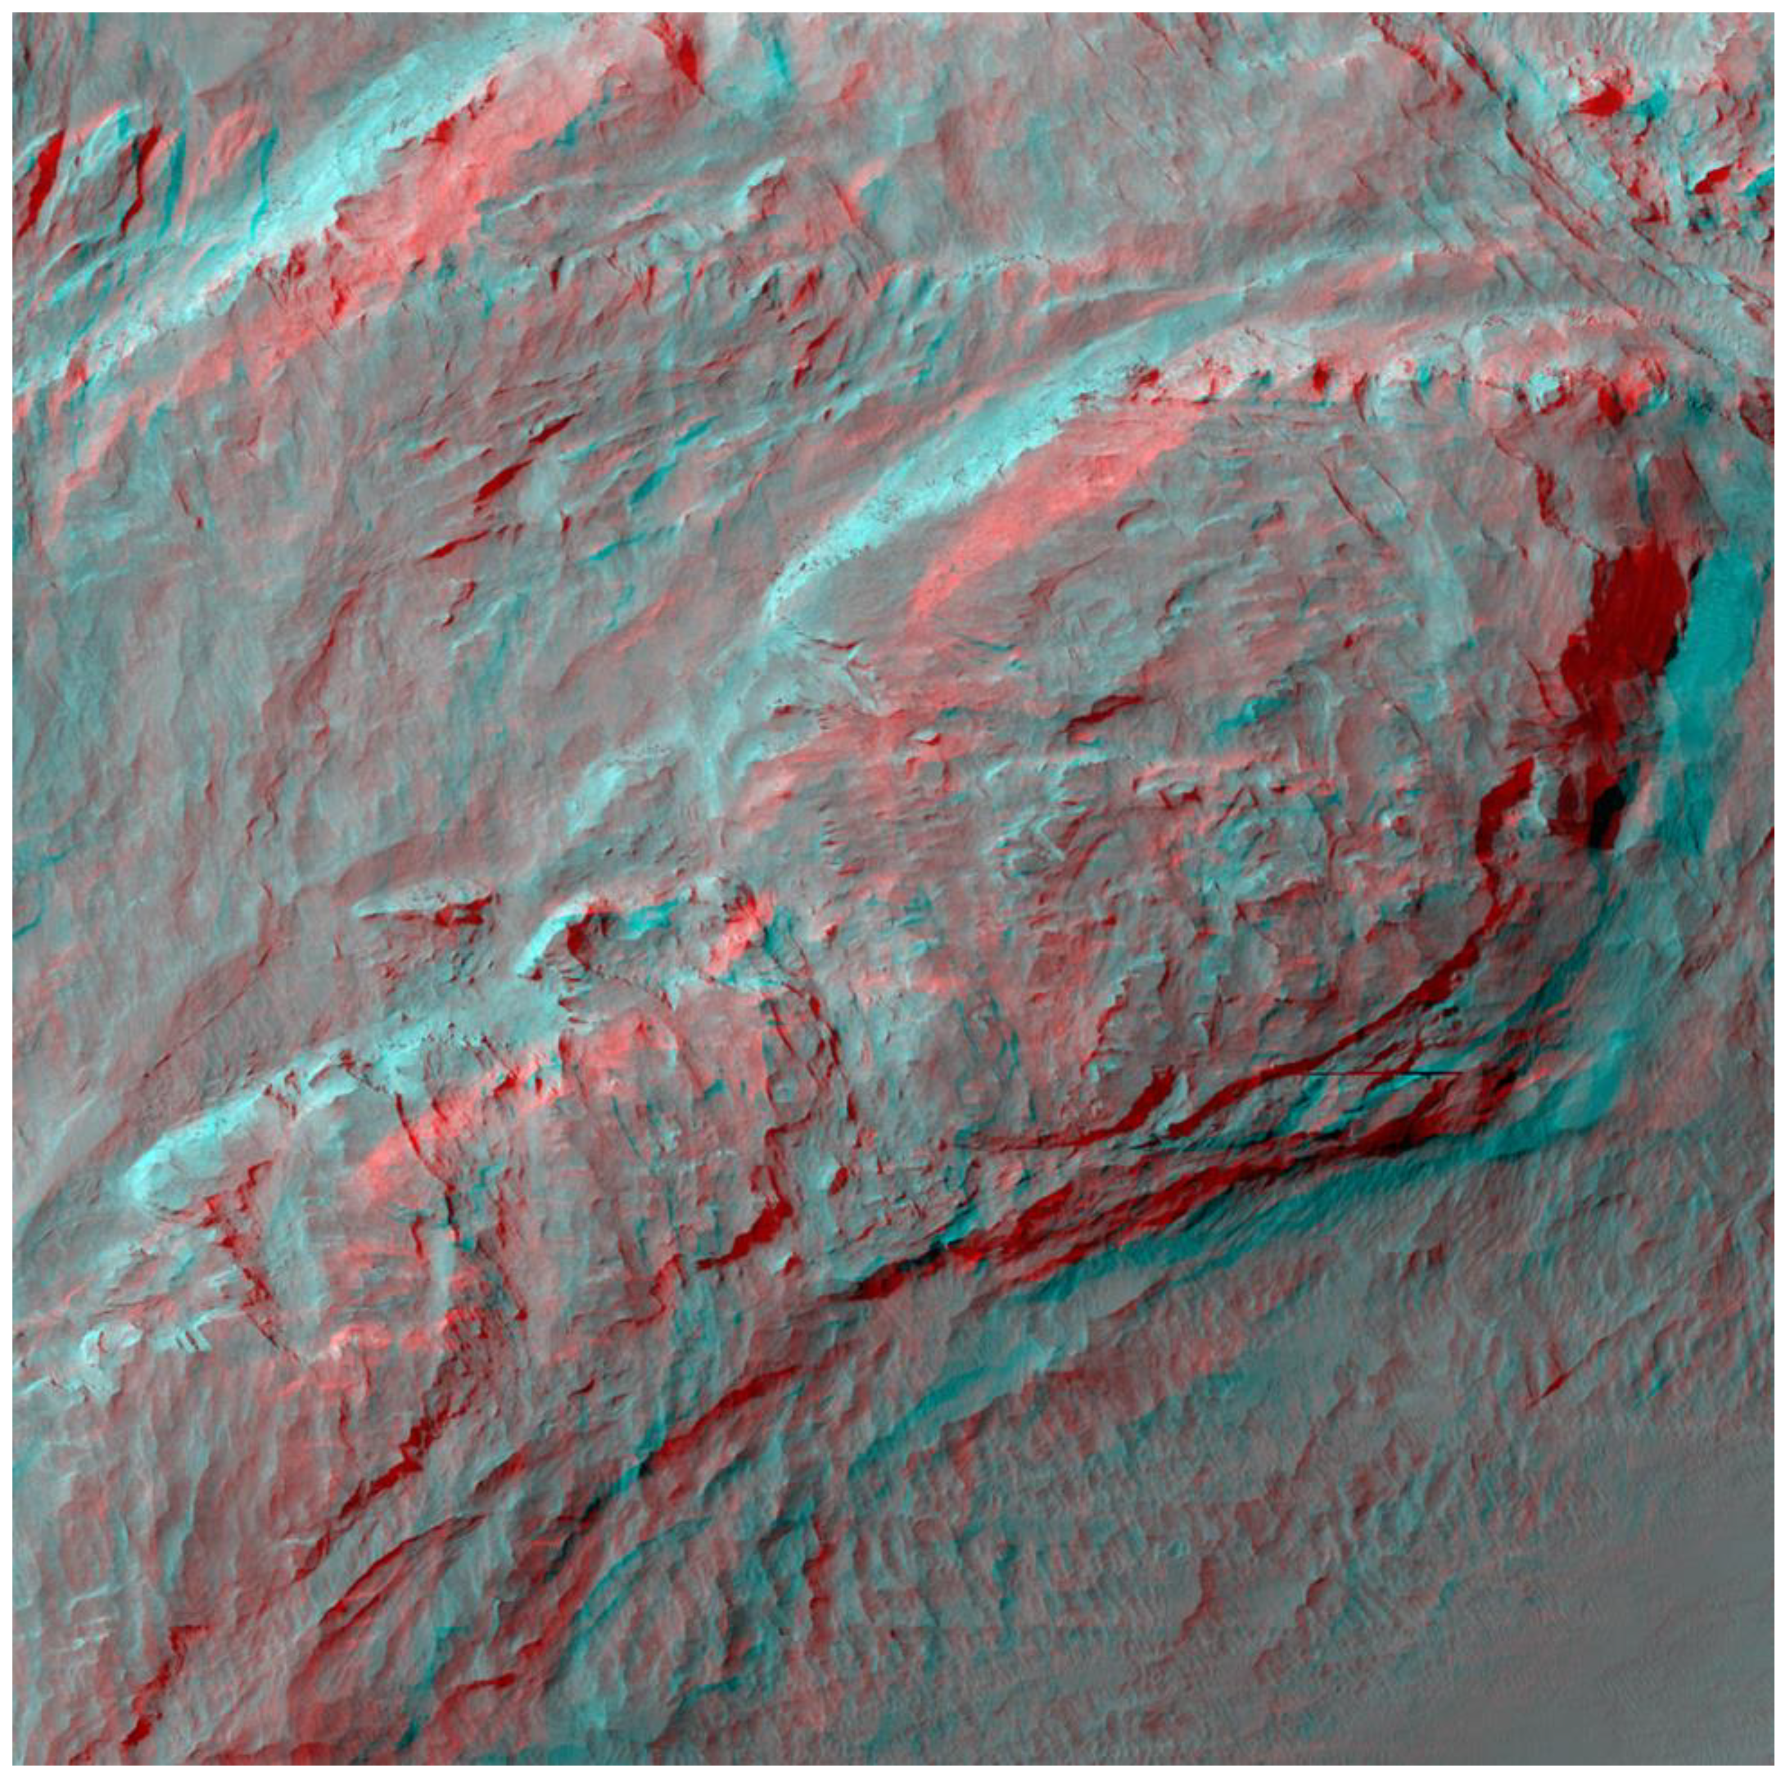
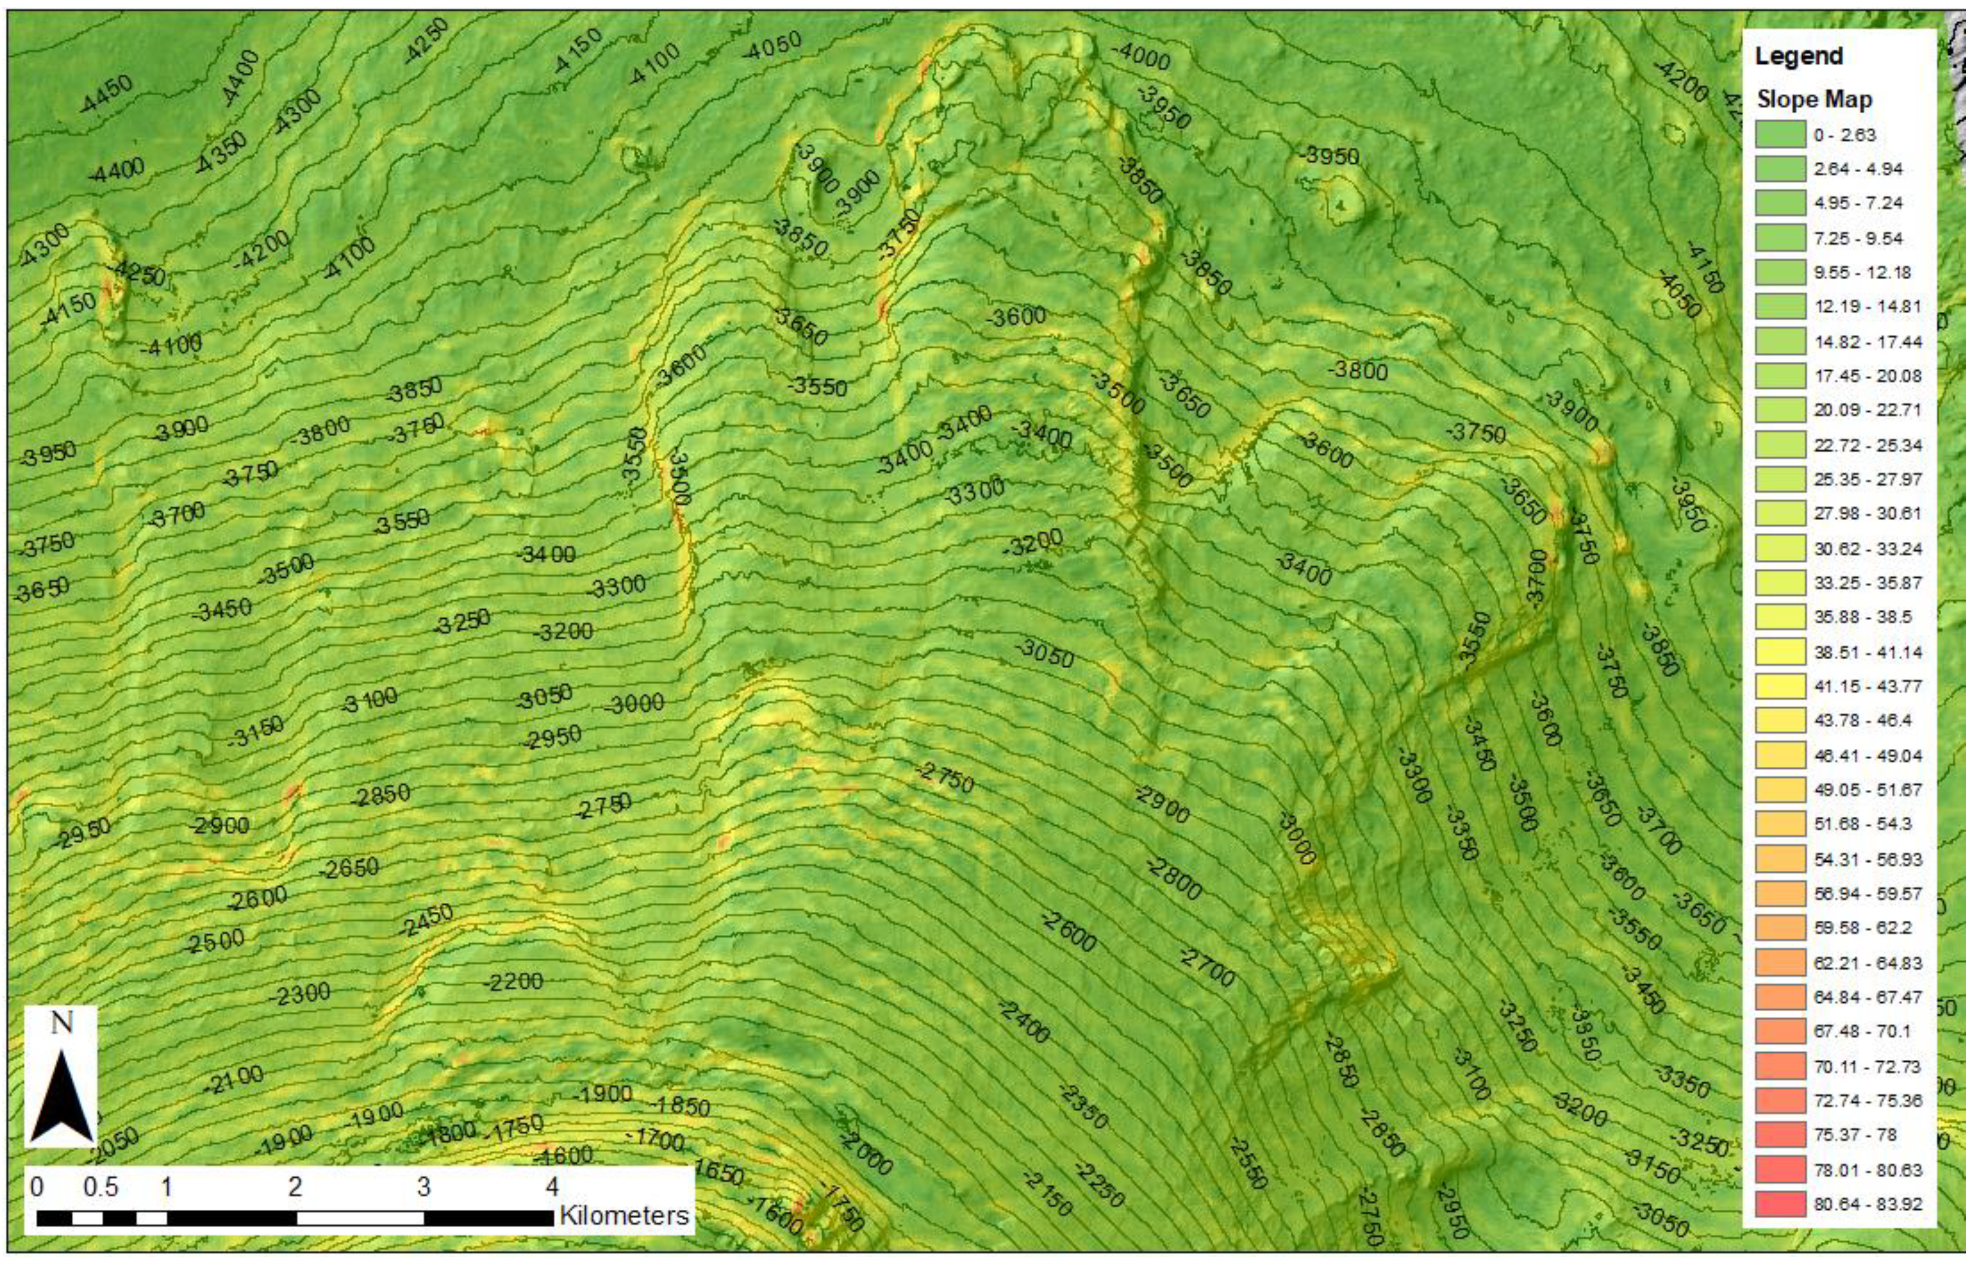
Figure 8 illustrates our mapping of lobate forms interpreted as rock glaciers [38,42,43], a ~20 km long, low slope angle (~4.5%) lobate spatulate feature that is 10–12 km at its widest, and the concave basin from which this spatulate feature originated. The spatulate form identified as a “fan-like” feature by Le Deit et al. [37] and mapped as a mass wasting unit, extends from an elevation of ~−3600 m and reaches to a lower elevation of ~−4250 m. It is sourced from the headwall and drainage of the concave basin that has a maximum elevation of +400 m. In contrast, the lobate forms extend downslope from a pronounced break in slope, between −1200 m and −1850 m, along an apparent northeast dipping bedding plane on the north side of Aeolis Mons. The longest and best-preserved lobate feature has a width of 1.8 km, an area of 18.64 km2 and extends downslope ~8.5 km from this slope break (Figure 8) to ~−3595 m. The lobate forms, unlike the relatively flat spatulate feature, exhibit surface In contrast, the lobate forms extend downslope from a pronounced break in slope, between −1200 m and −1850 m, along an apparent northeast dipping bedding plane on the north side of Aeolis Mons. The longest and best-preserved lobate feature has a width of 1.8 km, an area of 18.64 km2 and extends downslope ~8.5 km from this slope break (Figure 8) to ~−3595 m. The lobate forms, unlike the relatively flat spatulate feature, exhibit surface slopes of ~10–23° that are similar to, and which appear to be draped unconformably on, Mount Sharp’s northern slopes. Their upper surfaces tend to exhibit a convex upward form in cross-section, a concave downslope surface that follows the underlying slope of Mount Sharp ((Figure 7b and Figure 9) and highly over-steepened terminal and side slopes, estimated up to 53° using the CTX DEM-derived slope map (Figure 10). Both the convex upward cross-sectional form and over-steepened feature edges (Figure 9 and Figure 10) are typical of terrestrial rock glaciers. There appears to be no sublimation features found on the surface of the lobate features, as found on mid-latitude lobate features on Mars (Figure 2). These features, which have been interpreted to underlie the younger thin Bu capping member [37], may be, in part, mass-wasting features derived from erosion of the Bu member and, thus, may be younger, rather than older, than the Late Hesperian Bu unit.
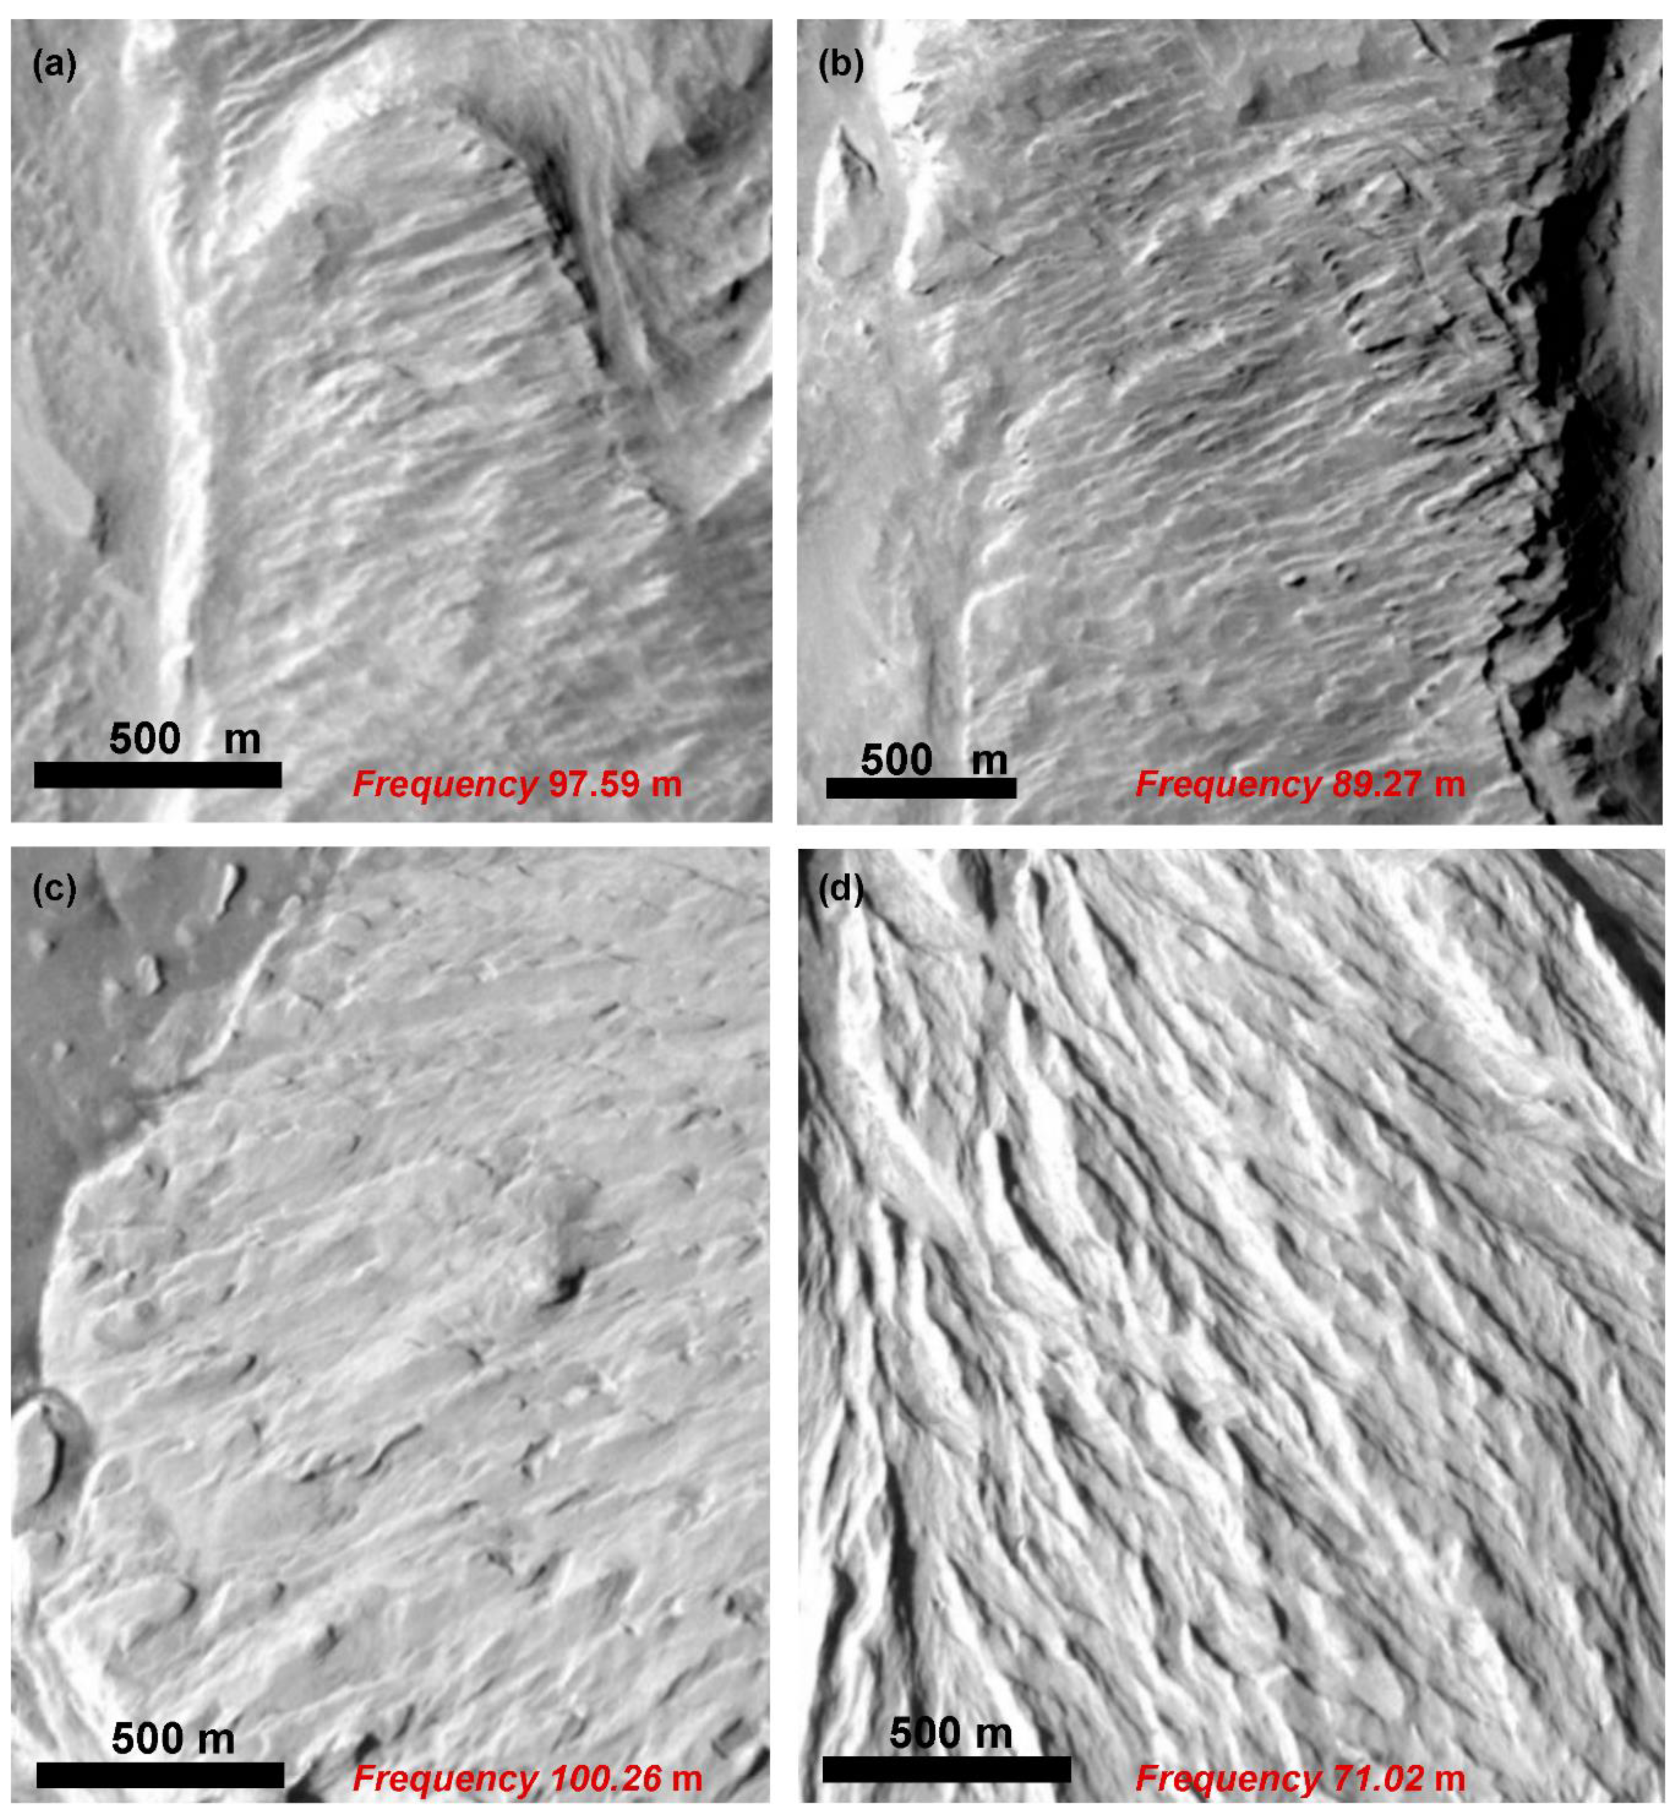
While the composition of the lobes is uncertain, they most likely comprise the capping Bu sedimentary unit aeolian lithologies, identified by Le Deit et al. [37] and Anderson et al. [52]. Analysis of lobate feature surface roughness indicates that the surfaces have few boulders and, in general, display a relatively smooth texture. Past studies [38] have suggested that, on a coarser scale, and similar to terrestrial rock glacier analogs, the lobate surfaces exhibit arcuate ridges, furrows and a wrinkled pattern, consistent with pressure ridges (Figure 2 and Figure 3). However, on further study, the aforementioned wrinkled pattern or pressure ridges texture are not arcuate, but rather appear to be linear, finely lamented features, similar to that of the nearby Light-Toned Yardang Unit (LTYu) [104] (Figure 11). Further, the average spacing between ridges is virtually identical, on average ~93 m (Figure 11). This suggests that the pattern seen on the lobate features are actually aeolian reworking of the surface and not pressure ridges associated with rock glaciers.
Lobe degradation appears to increase towards the west of the complex, with higher preservation states typically associated with higher standing lobes towards the east that override older, more degraded lobes (Figure 6 and Figure 12), suggesting multiple episodes of deposition. The ten lobes analyzed range in length from 1.74 km (dark red (9) lobe) to 8.5 km (red (1) lobe), with a mean length of 5.63 km (Figure 12a). The longest lobate form (red in Figure 12a) exhibits a decreasing slope, from head to terminus, with slope angles from 17° to 15° for points 1–5, 12° to 14° for points 6–8, and 9° to 12° points 9–11 (Table 1). Surface slopes for the remainder of the lobes range from 10.63° (blue (3) lobe) to 23.04° (dark red (9) lobe), with a mean of ~19.35° (Figure 12b). The lobate feature complex heights range from ~19.55 m (pink (7) lobe) to 123.18 m (red (1) lobe), with an average of ~59.59 m. The red (1), black (2) and blue (3) lobes have the largest calculated heights and are the best preserved. The red lobe overlies portions of the blue lobe (Figure 12c).
Calculated basal shear stress for the longest lobe, red (1), shows a decreasing trend from its head to its terminus; a trend is shared by all of the forms. For this lobate form, the calculated basal shear stress for a 35/65 rock/water ice mixture ranges from 93.85 kPa to 399.14 kPa, and is 122.00 kPa to 518.89 kPa for a 50/50 mix (Table 1). For the group of lobate features in the complex, the average surface flow rate calculations (Formula (4)) for the coldest modeled temperatures (−50 °C) indicate very slow mean rates of 4.85 × 10⁻⁴ m/yr for a 35/50 mix of rock and water ice and 1.02 × 10⁻³ m/yr for a 50/50 mix. Conversely, flow rates for warmer conditions (0 °C) were, on average, 0.91 m/yr for the 35/65 mix and 1.93 m/yr for the 50/50 mix (Table 2 and Table 3).
The fastest calculated flow rates are associated with the best-preserved lobes at 0 °C and a 50/50 ice/rock mix (Red (1): 6.36 m/yr.; Black (2): 6.11 m/yr.) (Table 1, Table 2 and Table 3) and averages ~1.93 m/yr. for all 10 lobes. Flow rates are orders of magnitude slower for the same mixture at −50 °C (mean flow rate of ~0.001 m/yr.). A more likely 35/65 rock ice mix, based on the finer-grained composition of the aeolian capping units on Mount Sharp in a periglacial environment would suggest flow rates approximating 0.92 m/yr. at a temperature of 0 °C.

Table 1.
Basal Shear Stress data for the Red (1) lobate feature shown in Figure 12a. Points 1–11 correspond to sites where flow rates were estimated (see Figure 6 for locations). Slope outliers may exist due to sampling issues, such as automated regular spacing to remove heads up vectorization sampling bias.
| Red Lobe | ||||||||||||
|---|---|---|---|---|---|---|---|---|---|---|---|---|
| Basal Shear Stress τb = ρgh(tan α) | ||||||||||||
| Point | Slope (deg) | Elevation (m) | Basal Elevation Calculation (m) | Adjusted Lobe Height (m) | 100% Rock Thickness (m) (Current) | 35% Ice, 65% Rock Thickness (m) (Low) | 50% Ice, 50% Rock Thickness (m) (High) | Tb (Basal Shear Stress) Pure Ice (kPa) | 35% Ice, 65% Rock τb (Basal Shear Stress) Rock/Ice mix (kPa) | 50% Ice, 50% Rock τb (Basal Shear Stress) Rock/Ice mix (kPa) | ||
| 1 | 17.41 | −2252 | −2331 | −79 | 79 | 122 | 158.20 | 84.38 | 254.90 | 331.37 | Density of Rock/Ice Mix (ρ) | 1800 kg/m3 |
| 2 | 14.31 | −2434 | −2494 | −60 | 60 | 93 | 120.96 | 52.50 | 158.59 | 206.16 | Density of Ice (ρ) | 917 kg/m3 |
| 3 | 14.50 | −2624 | −2659 | −35 | 35 | 54 | 70.62 | 31.07 | 93.85 | 122.00 | Gravity on Mars | 3.71 m/s2 |
| 4 | 16.65 | −2836 | −2887 | −51 | 51 | 78 | 101.12 | 51.44 | 155.39 | 202.00 | Middle lobe Length | 8.5 km |
| 5 | 14.61 | −3020 | −3069 | −49 | 49 | 75 | 97.58 | 43.27 | 130.71 | 169.92 | Average Height | 83 m |
| 6 | 12.99 | −3169 | −3213 | −44 | 44 | 68 | 87.88 | 34.47 | 104.13 | 135.37 | Average Slope | 13° |
| 7 | 13.99 | −3312 | −3404 | −92 | 92 | 142 | 184.04 | 77.98 | 235.57 | 306.24 | 35% Ice, 65% Rock Average Basal Shear Stress | 193 kPa |
| 8 | 13.89 | −3456 | −3613 | −157 | 157 | 242 | 314.06 | 132.13 | 399.14 | 518.89 | ||
| 9 | 8.86 | −3630 | −3750 | −120 | 120 | 185 | 240.04 | 63.66 | 192.30 | 249.99 | 50% Ice, 50% Rock Average Basal Shear Stress | 8.5251 kPa |
| 10 | 6.36 | −3717 | −3829 | −112 | 112 | 172 | 224.14 | 42.48 | 128.34 | 166.84 | ||
| 11 | 12.77 | −3838 | −3954 | −116 | 116 | 179 | 232.10 | 89.46 | 270.25 | 351.32 | ||
Table 2.
Surface Flow Calculations for the Red (1) lobate feature located on the north slope of Mount Sharp. Upper table for temperature of −50 °C. Lower table for temperature of 0 °C. Points 1–11 correspond to the data sites located on the Red (1) lobate feature (see Figure 6 for locations). Surface Flow Rate (m/yr) from (Formula (4)). Values of the flow parameter k for shear stress n = 2, for 0 °C = 6.8 × 10⁻¹⁵, and for −50 °C = 3.6 × 10⁻¹⁸. Units as in Equations (1), (2) and (4).
|
Temp (−50 °C) 35% Ice, 65% Rock |
Temp (−50 °C) 50% Ice, 50% Rock |
Temp (−50 °C) 35% Ice, 65% Rock |
Temp (−50 °C) 50% Ice, 50% Rock | ||||||||||
|---|---|---|---|---|---|---|---|---|---|---|---|---|---|
| Point | m/s | = | k | τ | ^n | m/s | = | k | τ | ^n | Point | m/yr | m/yr |
| 1 | 1.9 × 10⁻¹¹ | = | 3.6 × 10⁻¹⁸ | 255 | 2 | 5.9 × 10⁻⁴ | = | 3.6 × 10⁻¹⁸ | 331 | 2 | 1 | 0.0005984 | 0.0007780 |
| 2 | 5.6 × 10⁻¹² | = | 3.6 × 10⁻¹⁸ | 159 | 2 | 1.7 × 10⁻⁴ | = | 3.6 × 10⁻¹⁸ | 206 | 2 | 2 | 0.0001771 | 0.0002302 |
| 3 | 1.1 × 10⁻¹² | = | 3.6 × 10⁻¹⁸ | 94 | 2 | 3.6 × 10⁻⁵ | = | 3.6 × 10⁻¹⁸ | 122 | 2 | 3 | 0.0000362 | 0.0000471 |
| 4 | 4.5 × 10⁻¹² | = | 3.6 × 10⁻¹⁸ | 155 | 2 | 1.4 × 10⁻⁴ | = | 3.6 × 10⁻¹⁸ | 202 | 2 | 4 | 0.0001421 | 0.0001848 |
| 5 | 3.0 × 10⁻¹² | = | 3.6 × 10⁻¹⁸ | 131 | 2 | 9.7 × 10⁻⁵ | = | 3.6 × 10⁻¹⁸ | 170 | 2 | 5 | 0.0000971 | 0.0001262 |
| 6 | 1.7 × 10⁻¹² | = | 3.6 × 10⁻¹⁸ | 104 | 2 | 5.5 × 10⁻⁵ | = | 3.6 × 10⁻¹⁸ | 135 | 2 | 6 | 0.0000555 | 0.0000721 |
| 7 | 1.8 × 10⁻¹¹ | = | 3.6 × 10⁻¹⁸ | 236 | 2 | 5.9 × 10⁻⁴ | = | 3.6 × 10⁻¹⁸ | 306 | 2 | 7 | 0.0005946 | 0.0007730 |
| 8 | 9.2 × 10⁻¹¹ | = | 3.6 × 10⁻¹⁸ | 399 | 2 | 2.9 × 10⁻³ | = | 3.6 × 10⁻¹⁸ | 519 | 2 | 8 | 0.0029130 | 0.0037870 |
| 9 | 1.6 × 10⁻¹¹ | = | 3.6 × 10⁻¹⁸ | 192 | 2 | 5.1 × 10⁻⁴ | = | 3.6 × 10⁻¹⁸ | 250 | 2 | 9 | 0.0005168 | 0.0006718 |
| 10 | 6.8 × 10⁻¹² | = | 3.6 × 10⁻¹⁸ | 128 | 2 | 2.1 × 10⁻⁴ | = | 3.6 × 10⁻¹⁸ | 167 | 2 | 10 | 0.0002149 | 0.0002794 |
| 11 | 3.1 × 10⁻¹¹ | = | 3.6 × 10⁻¹⁸ | 270 | 2 | 9.8 × 10⁻⁴ | = | 3.6 × 10⁻¹⁸ | 351 | 2 | 11 | 0.0009869 | 0.0012830 |
| Average | 0.0005757 | 0.0007484 | |||||||||||
| Temp (0 °C) 35% Ice, 65% Rock | Temp (0 °C) 50% Ice, 50% Rock | Temp (0 °C) 35% Ice, 65% Rock | Temp (0 °C) 50% Ice, 50% Rock | ||||||||||
| Point | m/s | = | k | τ | ^n | m/s | = | k | τ | ^n | Point | m/yr | m/yr |
| 1 | 3.5 × 10⁻⁸ | = | 6.8 × 10⁻¹⁵ | 255 | 2 | 1.1 × 100 | = | 6.8 × 10⁻¹⁵ | 331 | 2 | 1 | 1.13039 | 1.46951 |
| 2 | 1.0 × 10⁻⁸ | = | 6.8 × 10⁻¹⁵ | 159 | 2 | 3.3 × 10⁻¹ | = | 6.8 × 10⁻¹⁵ | 206 | 2 | 2 | 0.33454 | 0.43490 |
| 3 | 2.1 × 10⁻⁹ | = | 6.8 × 10⁻¹⁵ | 94 | 2 | 6.8 × 10⁻² | = | 6.8 × 10⁻¹⁵ | 122 | 2 | 3 | 0.06840 | 0.08892 |
| 4 | 8.5 × 10⁻⁹ | = | 6.8 × 10⁻¹⁵ | 155 | 2 | 2.6 × 10⁻¹ | = | 6.8 × 10⁻¹⁵ | 202 | 2 | 4 | 0.26850 | 0.34905 |
| 5 | 5.8 × 10⁻⁹ | = | 6.8 × 10⁻¹⁵ | 131 | 2 | 1.8 × 10⁻¹ | = | 6.8 × 10⁻¹⁵ | 170 | 2 | 5 | 0.18333 | 0.23834 |
| 6 | 3.3 × 10⁻⁹ | = | 6.8 × 10⁻¹⁵ | 104 | 2 | 1.0 × 10⁻¹ | = | 6.8 × 10⁻¹⁵ | 135 | 2 | 6 | 0.10479 | 0.13622 |
| 7 | 3.5 × 10⁻⁸ | = | 6.8 × 10⁻¹⁵ | 236 | 2 | 1.1 × 100 | = | 6.8 × 10⁻¹⁵ | 306 | 2 | 7 | 0.10479 | 1.46010 |
| 8 | 1.7 × 10⁻⁷ | = | 6.8 × 10⁻¹⁵ | 399 | 2 | 5.5 × 100 | = | 6.8 × 10⁻¹⁵ | 519 | 2 | 8 | 1.12315 | 7.15315 |
| 9 | 3.1 × 10⁻⁸ | = | 6.8 × 10⁻¹⁵ | 192 | 2 | 9.7 × 10⁻¹ | = | 6.8 × 10⁻¹⁵ | 250 | 2 | 9 | 5.50242 | 1.26897 |
| 10 | 1.2 × 10⁻⁸ | = | 6.8 × 10⁻¹⁵ | 128 | 2 | 4.0 × 10⁻¹ | = | 6.8 × 10⁻¹⁵ | 167 | 2 | 10 | 0.97613 | 0.52778 |
| 11 | 5.9 × 10⁻⁸ | = | 6.8 × 10⁻¹⁵ | 270 | 2 | 1.8 × 100 | = | 6.8 × 10⁻¹⁵ | 351 | 2 | 11 | 0.40598 | 2.42343 |
| Average | 1.08744 | 1.41367 | |||||||||||
Table 3.
Basal Shear Stress and Surface Flow data averages for all 10 lobate forms shown in Figure 12a.
Table 3.
Basal Shear Stress and Surface Flow data averages for all 10 lobate forms shown in Figure 12a.
| Lobe Complex Study | |||||||||||
|---|---|---|---|---|---|---|---|---|---|---|---|
| Density of Rock (ρ) | 1800 kg/m3 | Basal Shear Stress τb = ρgh(tan α) | Surface Flow Rate Us = ((2A)/(n + 1)) τbnh | ||||||||
| Density of Ice (ρ) | 916.7 kg/m3 | ||||||||||
| Gravity on Mars | 3.711 m/s² | ||||||||||
| Lobe Color (#) | Average Slope (deg) | Lobe Length (km) | Average Height (m) | 35% Ice, 65% Rock Reconstructed Height (m) | 50% Ice, 50% Rock Reconstructed Height (m) | 35% Ice, 65% Rock Average Basal Shear Stress (kPa) | 50% Ice, 50% Rock Average Basal Shear Stress (kPa) | Temp (−50 °C) 35% Ice, 65% Rock (m/yr) | Temp (−50 °C) 50% Ice, 50% Rock (m/yr) | Temp (0 °C) 35% Ice, 65% Rock (m/yr) | Temp (0 °C) 50% Ice, 50% Rock m/yr |
| Red (1) | 13.30 | 8.50 | 123.18 | 189.51 | 246.36 | 193.01 | 250.92 | 5.76 × 10⁻⁴ | 7.48 × 10⁻⁴ | 1.087 | 1.414 |
| Black (2) | 13.45 | 6.56 | 84.92 | 130.64 | 169.84 | 212.12 | 275.75 | 6.91 × 10⁻⁴ | 8.99 × 10⁻⁴ | 1.306 | 1.697 |
| Blue (3) | 10.63 | 4.98 | 100.94 | 155.30 | 201.89 | 299.82 | 389.76 | 1.49 × 10⁻³ | 3.27 × 10⁻³ | 2.810 | 6.173 |
| Orange (4) | 20.73 | 5.93 | 52.27 | 80.42 | 104.54 | 200.41 | 260.53 | 6.61 × 10⁻⁴ | 1.45 × 10⁻³ | 1.248 | 2.743 |
| Light Blue (5) | 23.04 | 5.33 | 47.56 | 73.17 | 95.12 | 206.10 | 267.92 | 4.18 × 10⁻⁴ | 9.17 × 10⁻⁴ | 0.789 | 1.733 |
| Green (6) | 22.39 | 5.68 | 35.92 | 55.26 | 71.83 | 181.19 | 235.54 | 3.44 × 10⁻⁴ | 7.56 × 10⁻⁴ | 0.650 | 1.427 |
| Pink (7) | 22.95 | 6.68 | 19.55 | 30.08 | 39.11 | 86.50 | 112.45 | 7.55 × 10⁻⁵ | 1.66 × 10⁻⁴ | 0.143 | 0.313 |
| Grey (8) | 21.40 | 6.35 | 33.84 | 52.06 | 67.68 | 156.46 | 203.40 | 1.54 × 10⁻⁴ | 5.20 × 10⁻⁴ | 0.291 | 0.982 |
| Dark Red (9) | 22.91 | 1.74 | 56.54 | 86.98 | 113.08 | 249.92 | 324.89 | 3.63 × 10⁻⁴ | 1.23 × 10⁻³ | 0.685 | 2.316 |
| Yellow (10) | 16.64 | 4.55 | 41.21 | 63.40 | 82.42 | 130.18 | 169.23 | 8.24 × 10⁻⁵ | 2.78 × 10⁻⁴ | 0.156 | 0.526 |
Close examination of HiRISE imagery of the 10 lobate features reveals a near absence of craters of almost all sizes. Again, barring burial or removal by subsequent erosion, this suggests a young age for these features. Le Deit et al. [37] noted that no scarp or surface rupture is visible at the uphill limit of the lobate forms, and suggest that these features may have been buried below the younger Bu and Cyu Hesperian units. The actual contact, as visible in HiRISE imagery (Figure 12a), is at best indeterminate, with the lobate forms appearing at the base of a cliff at the Bu unit contact with the lobate complex. This cliff form represents the over-steepened edge of the Bu unit, with an average slope ranging from 20 to 25° above the lobate features (Figure 12b).
7. Discussion/Synthesis
Rock glaciers are lobate-shaped landforms of unconsolidated sediment and rock debris, with interstitial ice and ice lenses that move downslope by creep [37,75]. Based on a cross-sectional and long profile form, with higher slopes at their heads and lower slopes at their distal edge [52,64,73], and as previously suggested by Anderson and Bell [42] and Le Deit et al. [37], the well-defined and uniform width lobate forms found on the north side of Mount Sharp correspond to terrestrial rock glacier morphology [38,80,87,105,106,107]. However, they do not exhibit characteristics, such as sublimation pits or “brain-terrain” (Figure 2a) [71,108], that are typically associated with relict rock glaciers found elsewhere on Mars. Further, the observed concave up-cross-sections (Figure 7b) do not suggest a deflated surface due to ice loss.
Besides a few possible equatorial locations [4], it is currently thought that low/equatorial latitudes cannot support stable water ice today. Therefore, it is highly unlikely that these lobate forms currently retain water ice. Based on likely sourcing from the aeolian units capping Mount Sharp [50,52], the unstratified lobate forms likely contained ice/rock mixtures with a higher percentage of fine-grained material than a typical rock glacier on Earth under the same thermal conditions. As such, movement of entrained rock and ice was likely less viscous than the typical ice/rock mixture range (35/65 to 50/50) that typifies terrestrial rock glaciers. The lack of both sublimation features and a concave depressed central region, such as that found in terrestrial rock glaciers, also suggests that these forms may have had their genesis in original features that contained a much higher percentage of rock and aeolian-derived fine-grained sediment. This difference may also explain why these forms, with an average length of ~6 km, are significantly longer than terrestrial rock glaciers that range from 100 s of meters to several kilometers in length [75].
The lack of wrinkle ridges similar to those found on terrestrial rock glaciers are likely the result of aeolian reworking similar to that found on the yardang units found to the east of these lobate deposits [104]. The lobate forms also exhibit a small number of craters relative to the surrounding non-lobate surfaces that they overly. While possible, one scenario for the existence of young uncratered surfaces relative to the cratered surfaces that they overly is that they are indistinguishable in age from the relatively uncratered Bu and Cp units. However, like the absence of wrinkle ridges, this cratering difference may once again be due to aeolian reworking that removed traces of small craters on the lobate forms.
If water or water ice were present during the emplacement of the lobate features, then subsequent cementation during lithification would suggest that they are composed of erosion-resistant sediments. Lobate cementation is supported by an observed high thermal emissivity for these units that is similar to that found on debris-covered glaciers elsewhere on Mars [109]. Later burial by less resistant and poorly lithified aeolian deposits would have preserved the original forms. The sharp appearance of the lobate forms is, therefore, likely the result of subsequent differential weathering of a poorly consolidated/lithified overlying unit, as well as interlobate material, a process similar to erosion observed during aeolian-dominated scarp retreat [62]. Other possible, but low-probability, scenarios include that these forms were formed by mudflows or other viscous flow processes. These were not evaluated in this study but remain a possible explanation for these features.
The lobate complex drapes the northern slopes of Mount Sharp [37], with surface slopes of individual lobate forms between 11 and 23°. Anderson and Bell [42] and Le Deit et al. [37] suggest that these low-angled lobate forms emerge from beneath the aeolian-sourced benched (Bu) and caprock units (Cp) on Mount Sharp. However, due to the covered nature of the contact [37,38], interpretation of stratigraphic order is, at best, uncertain. As Le Deit et al. [37] note, “… it is not trivial to determine the absolute ages of the possible periglacial landforms. They appear to modify the landscape and could have formed much later than the surfaces that they modify”. Detailed analysis of HiRISE imagery reveals a 300–400 m high angled scarp at the upper limit of the lobate forms, from which these features emanate, suggesting that mass wasting of the Bu and Cp units may have played a role in the formation of the lobate forms, possibly calling an interpretation of formation prior to the Bu and Cp units into question.
Flow rates coupled to lobate form lengths for the three most well-preserved lobes (1–3) provide a rough estimate of formation times. At the coldest temperature modeled (−50 °C), average formation times are in excess of 2.4 Ma and 1.4 Ma for the 35/65 and 50/50 rock/ice mixtures, respectively. This timing would require the addition of rock and/or fine-grained debris to the head of the rock glacier form during a persistent cold climate with extremely slow weathering. At the warmest modeled temperature (0 °C), mean formation times range from 700 years for a 50/50 rock/ice mixture to ~2.2 Ka years for the 35/65 mixture. These ages are similar to surface flow rates and formation times associated with large rock glaciers on Earth, which range between a few thousand to several tens of thousands of years [110,111,112]. However, warm (0 °C) temperatures have only been observed on the surface of Mars during peak insolation conditions [39].
Le Deit et al. [37] postulated that melting snow, a possible source of water ice for rock glacier formation, might have been enhanced due to higher insolation on Mount Sharp’s northern slopes relative to its southern ones. The high elevation of Mount Sharp may have also played a role in the formation of conditions amenable to perennial periglacial conditions on Mt Sharp’s northern slopes through most of its history. These periglacial conditions may have been enhanced by variations in obliquity, which, at its extreme, would have transferred water from polar to equatorial regions [11,12,20,25,26,30,31,32,33,34,35,113].
Dickson et al. [9] and Fairén et al. [38] suggest that the last occurrence of ice near the equator could have occurred during the late Amazonian Epoch, though, Fairén et al. [38] suggested that the latest obliquity-driven ice migration might not have been responsible for the observed evidence of glacial and periglacial activity interpreted in Gale crater. Studies of obliquity/temperature relationships are inconclusive and often contradictory, with some [114] suggesting that during periods of high obliquity, Mars’ low latitudes/equatorial regions would see a decrease in average annual temperatures (<−50 °C). Alternatively, some recent studies [41] suggest that this is not the case and that temperatures could increase during periods of high obliquity.
Ground water seepage during warmer periods may have injected water ice directly into the sediments, allowing them to flow, potentially at close to modern pressures. However, it is unlikely that modern (20 Ma to present) temperatures would be able to support the warmest temperatures used in our calculations. This suggests that these lobate forms were formed much earlier (>>20 Ma) in Martian history, when increased global atmospheric pressure and temperatures [115], coupled with liquid water, would further support the periglacial processes discussed in this study.
8. Conclusions
The presence of periglacial features on Mount Sharp in the form of rock glaciers and a spatulate lobe emanating from the upper elevation of Mount Sharp indicates a past equatorial climate that had water available for the production of ice bodies. The presence of these features on Mount Sharp, in combination with other glacial features in highland drainage source areas of the Peace Vallis drainage, north of Gale crater and glacial forms within Gale crater, including possible roche moutonnée and eskers, marks a possible former extensive glacial modification of the equatorial region.
The presence of possible cold-based rock glaciers on the north face of Mount Sharp at equatorial latitudes has significant implications for understanding the past global redistribution of the water ice cryosphere, due to obliquity-driven insolation variability. Periglacial conditions may have been enhanced by variations in obliquity, which, at its extreme, would have transferred water from polar to equatorial regions.
As well, the possible presence of ice within Gale crater and its surrounding environment has profound implications for understanding Martian climate and landscape evolution. Further study is necessary to investigate these possible glacial forms, by obtaining higher resolution data sets, such as digital elevation models of Gale crater and its surrounding area. Further, by conducting extensive crater counting of the different glacial/periglacial forms, we can then better understand the relative timing of these processes and possibly the role of aeolian erosion in modifying these features. Finally, the various glacier/periglacial forms found in Gale crater and surrounding areas are most likely not directly linked temporally; rather, they likely represent a spectrum of different obliquity-driven ice migrations.
Author Contributions
Conceptualization, J.M.W. and L.A.S.; methodology, J.M.W. and L.A.S.; software, J.M.W.; formal analysis, J.M.W., L.A.S., H.E.N.; investigation, J.M.W., L.A.S., H.E.N.; resources, L.A.S.; data curation, J.M.W.; writing—original draft preparation, J.M.W. and L.A.S.; writing—review and editing, J.M.W., L.A.S., H.E.N.; visualization, J.M.W., L.A.S.; supervision, L.A.S.; project administration, L.A.S.; funding acquisition, L.A.S. All authors have read and agreed to the published version of the manuscript.
Funding
This research was funded under NASA MUREP grant 80NSSC19K1676 to L.A.S.
Data Availability Statement
All imagery analyzed was provided by NASA and is available online in NASA repositories.
Conflicts of Interest
The authors declare no conflict of interest.
References
- Clifford, S.M. A model for the hydrologic and climatic behavior of water on Mars. J. Geophys. Res. Planets 1993, 98, 10973–11016. [Google Scholar] [CrossRef] [Green Version]
- Mège, D.; Bourgeois, O. Equatorial glaciations on Mars revealed by gravitational collapse of Valles Marineris wallslopes. Earth Planet. Sci. Lett. 2011, 310, 182–191. [Google Scholar] [CrossRef]
- Wordsworth, R.D. The climate of early Mars. Annu. Rev. Earth Planet. Sci. 2016, 44, 381–408. [Google Scholar] [CrossRef] [Green Version]
- Mitrofanov, I.; Malakhov, A.; Djachkova, M.; Golovin, D.; Litvak, M.; Mokrousov, M.; Sanin, A.; Svedhem, H.; Zelenyi, L. The evidence for unusually high hydrogen abundances in the central part of Valles Marineris on Mars. Icarus 2022, 374, 114805. [Google Scholar] [CrossRef]
- Forget, F. Mars CO 2 Ice Polar Caps. In Solar System Ices; Springer: New York, NY, USA, 1998; pp. 477–507. [Google Scholar]
- Parry Rubincam, D. Mars secular obliquity change due to water ice caps. J. Geophys. Res. Planets 1999, 104, 30765–30771. [Google Scholar] [CrossRef]
- Baker, D.M.; Head, J.W.; Marchant, D.R. Flow patterns of lobate debris aprons and lineated valley fill north of Ismeniae Fossae, Mars: Evidence for extensive mid-latitude glaciation in the Late Amazonian. Icarus 2010, 207, 186–209. [Google Scholar] [CrossRef]
- Brough, S.; Hubbard, B.; Hubbard, A. Area and volume of mid-latitude glacier-like forms on Mars. Earth Planet. Sci. Lett. 2019, 507, 10–20. [Google Scholar] [CrossRef] [Green Version]
- Dickson, J.L.; Head, J.W.; Marchant, D.R. Late Amazonian glaciation at the dichotomy boundary on Mars: Evidence for glacial thickness maxima and multiple glacial phases. Geology 2008, 36, 411–414. [Google Scholar] [CrossRef]
- Head, J.; Neukum, G.; Jaumann, R.; Hiesinger, H.; Hauber, E.; Carr, M.; Masson, P.; Foing, B.; Hoffmann, H.; Kreslavsky, M. Tropical to mid-latitude snow and ice accumulation, flow and glaciation on Mars. Nature 2005, 434, 346–351. [Google Scholar] [CrossRef]
- Head, J.W.; Marchant, D.; Agnew, M.; Fassett, C.; Kreslavsky, M. Extensive valley glacier deposits in the northern mid-latitudes of Mars: Evidence for Late Amazonian obliquity-driven climate change. Earth Planet. Sci. Lett. 2006, 241, 663–671. [Google Scholar] [CrossRef]
- Head, J.W.; Marchant, D.R.; Dickson, J.L.; Kress, A.M.; Baker, D.M. Northern mid-latitude glaciation in the Late Amazonian period of Mars: Criteria for the recognition of debris-covered glacier and valley glacier landsystem deposits. Earth Planet. Sci. Lett. 2010, 294, 306–320. [Google Scholar] [CrossRef]
- Hubbard, B.; Milliken, R.E.; Kargel, J.S.; Limaye, A.; Souness, C. Geomorphological characterisation and interpretation of a mid-latitude glacier-like form: Hellas Planitia, Mars. Icarus 2011, 211, 330–346. [Google Scholar] [CrossRef]
- Hubbard, B.; Souness, C.; Brough, S. Glacier-like forms on Mars. Cryosphere 2014, 8, 2047–2061. [Google Scholar] [CrossRef] [Green Version]
- Levy, J.S.; Head, J.W.; Marchant, D.R. Lineated valley fill and lobate debris apron stratigraphy in Nilosyrtis Mensae, Mars: Evidence for phases of glacial modification of the dichotomy boundary. J. Geophys. Res. Planets 2007, 112. [Google Scholar] [CrossRef] [Green Version]
- Scanlon, K.; Head, J.; Marchant, D. Remnant Buried Ice in the Arsia Mons Fan-Shaped Deposit, Mars. In Proceedings of the Lunar and Planetary Science Conference, The Woodlands, TX, USA, 16–20 March 2015. [Google Scholar]
- Shean, D.E.; Head, J.W., III; Fastook, J.L.; Marchant, D.R. Recent glaciation at high elevations on Arsia Mons, Mars: Implications for the formation and evolution of large tropical mountain glaciers. J. Geophys. Res. Planets 2007, 112. [Google Scholar] [CrossRef] [Green Version]
- Gourronc, M.; Bourgeois, O.; Mège, D.; Pochat, S.; Bultel, B.; Massé, M.; le Deit, L.; le Mouélic, S.; Mercier, D. One million cubic kilometers of fossil ice in Valles Marineris: Relicts of a 3.5 Gy old glacial landsystem along the Martian equator. Geomorphology 2014, 204, 235–255. [Google Scholar] [CrossRef]
- Brough, S.; Hubbard, B.; Hubbard, A. Former extent of glacier-like forms on Mars. Icarus 2016, 274, 37–49. [Google Scholar] [CrossRef] [Green Version]
- Forget, F.; Haberle, R.; Montmessin, F.; Levrard, B.; Head, J. Formation of glaciers on Mars by atmospheric precipitation at high obliquity. Science 2006, 311, 368–371. [Google Scholar] [CrossRef]
- Mellon, M.T.; Feldman, W.C.; Prettyman, T.H. The presence and stability of ground ice in the southern hemisphere of Mars. Icarus 2004, 169, 324–340. [Google Scholar] [CrossRef]
- Mellon, M.T.; Jakosky, B.M. The distribution and behavior of Martian ground ice during past and present epochs. J. Geophys. Res. Planets 1995, 100, 11781–11799. [Google Scholar] [CrossRef] [Green Version]
- Ward, W.R. Large-scale variations in the obliquity of Mars. Science 1973, 181, 260–262. [Google Scholar] [CrossRef] [PubMed]
- Brunetti, M.T.; Guzzetti, F.; Cardinali, M.; Fiorucci, F.; Santangelo, M.; Mancinelli, P.; Komatsu, G.; Borselli, L. Analysis of a new geomorphological inventory of landslides in Valles Marineris, Mars. Earth Planet. Sci. Lett. 2014, 405, 156–168. [Google Scholar] [CrossRef]
- Abe, Y.; Numaguti, A.; Komatsu, G.; Kobayashi, Y. Four climate regimes on a land planet with wet surface: Effects of obliquity change and implications for ancient Mars. Icarus 2005, 178, 27–39. [Google Scholar] [CrossRef]
- Bills, B.; Keane, J. Mars Obliquity Variations are Both Non-Chaotic and Probably Fully Damped. In Proceedings of the 50th Annual Lunar and Planetary Science Conference, The Woodlands, TX, USA, 18–22 March 2019. [Google Scholar]
- Fastook, J.L.; Head, J.W.; Marchant, D.R.; Forget, F. Tropical mountain glaciers on Mars: Altitude-dependence of ice accumulation, accumulation conditions, formation times, glacier dynamics, and implications for planetary spin-axis/orbital history. Icarus 2008, 198, 305–317. [Google Scholar] [CrossRef]
- Head, J.W.; Marchant, D.R. Cold-based mountain glaciers on Mars: Western Arsia Mons. Geology 2003, 31, 641–644. [Google Scholar] [CrossRef]
- Head, J.W.; Nahm, A.L.; Marchant, D.R.; Neukum, G. Modification of the dichotomy boundary on Mars by Amazonian mid-latitude regional glaciation. Geophys. Res. Lett. 2006, 33. [Google Scholar] [CrossRef]
- Laskar, J.; Correia, A.; Gastineau, M.; Joutel, F.; Levrard, B.; Robutel, P. Long term evolution and chaotic diffusion of the insolation quantities of Mars. Icarus 2004, 170, 343–364. [Google Scholar] [CrossRef] [Green Version]
- Toigo, A.D.; Waugh, D.W.; Guzewich, S.D. Atmospheric transport into polar regions on Mars in different orbital epochs. Icarus 2020, 347, 113816. [Google Scholar] [CrossRef]
- Vos, E.; Aharonson, O.; Schorghofer, N. Dynamic and isotopic evolution of ice reservoirs on Mars. Icarus 2019, 324, 1–7. [Google Scholar] [CrossRef] [Green Version]
- Vos, E.; Aharonson, O.; Schorghofer, N.; Forget, F.; Millour, E. Milankovitch-driven redistribution and fractionation of ice deposits on Mars. In Proceedings of the 50th EPSC-DPS Joint Meeting 2019, Geneva, Switzerland, 15–20 September 2019. [Google Scholar]
- Weiss, D.K. Mars in ice ages for∼25% of post-Noachian geologic history. Earth Planet. Sci. Lett. 2019, 528, 115847. [Google Scholar] [CrossRef]
- Williams, J.P.; van der Bogert, C.H.; Pathare, A.V.; Michael, G.G.; Kirchoff, M.R.; Hiesinger, H. Dating very young planetary surfaces from crater statistics: A review of issues and challenges. Meteorit. Planet. Sci. 2018, 53, 554–582. [Google Scholar] [CrossRef] [Green Version]
- Williams, J.; Scuderi, L.A.; Newsom, H.E. Constraining Possible Glacial Reworking of Ancient Fluvial Channels on the Dichotomy Boundary at Equatorial Regions, Mars. In Proceedings of the AGU Fall Meeting Abstracts, 2020; Available online: https://ui.adsabs.harvard.edu/abs/2020AGUFMP038...02W/abstract (accessed on 28 February 2022).
- Deit, L.L.; Hauber, E.; Fueten, F.; Pondrelli, M.; Rossi, A.P.; Jaumann, R. Sequence of infilling events in Gale Crater, Mars: Results from morphology, stratigraphy, and mineralogy. J. Geophys. Res. Planets 2013, 118, 2439–2473. [Google Scholar] [CrossRef] [Green Version]
- Fairén, A.G.; Stokes, C.R.; Davies, N.S.; Schulze-Makuch, D.; Rodríguez, J.A.P.; Davila, A.F.; Uceda, E.R.; Dohm, J.M.; Baker, V.R.; Clifford, S.M. A cold hydrological system in Gale crater, Mars. Planet. Space Sci. 2014, 93, 101–118. [Google Scholar] [CrossRef]
- Schorghofer, N. Temperature response of Mars to Milankovitch cycles. Geophys. Res. Lett. 2008, 35. [Google Scholar] [CrossRef] [Green Version]
- Ward, W.R. Climatic variations on Mars: 1. Astronomical theory of insolation. J. Geophys. Res. 1974, 79, 3375–3386. [Google Scholar] [CrossRef]
- Madeleine, J.B.; Head, J.W.; Forget, F.; Navarro, T.; Millour, E.; Spiga, A.; Colaïtis, A.; Määttänen, A.; Montmessin, F.; Dickson, J.L. Recent ice ages on Mars: The role of radiatively active clouds and cloud microphysics. Geophys. Res. Lett. 2014, 41, 4873–4879. [Google Scholar] [CrossRef] [Green Version]
- Anderson, R.B.; Bell, J.F., III. Geologic mapping and characterization of Gale Crater and implications for its potential as a Mars Science Laboratory landing site. Mars J. 2010, 5, 76–128. [Google Scholar] [CrossRef] [Green Version]
- Le Deit, L.; Hauber, E.; Fueten, F.; Pondrelli, M.; Rossi, A.; Mangold, N.; Jaumann, R. Geological study of Gale Crater on Mars. In Proceedings of the AGU Fall Meeting Abstracts, San Francisco, CA, USA, 5–9 December 2011. [Google Scholar]
- Gallegos, Z.; Newsom, H.; Scuderi, L.; Gasnault, O.; le Mouélic, S.; Wiens, R.; Maurice, S. New Insights into the Extensive Inverted Features Within Gale Crater, Mars. In Proceedings of the Lunar and Planetary Science Conference, Woodlands, TX, USA, 16–20 March 2020. [Google Scholar]
- Newsom, H.; Scuderi, L.; Gallegos, Z.; Williams, J.; Dimitracopoulos, G.; Tornabene, L.; Wiens, R.; Gasnault, O. Evidence for Glacial and Fluvial Processes on Gale Crater Rim–Dulce Vallis. In Proceedings of the Lunar and Planetary Science Conference, Woodlands, TX, USA, 15–19 March 2021. [Google Scholar]
- Oehler, D.Z.; Mangold, N.; Hallet, B.; Fairén, A.G.; le Deit, L.; Williams, A.J.; Sletten, R.S.; Martínez-Frías, J. Origin and significance of decameter-scale polygons in the lower Peace Vallis fan of Gale crater, Mars. Icarus 2016, 277, 56–72. [Google Scholar] [CrossRef]
- Stack, K.M.; Grotzinger, J.P.; Lamb, M.P.; Gupta, S.; Rubin, D.M.; Kah, L.C.; Edgar, L.A.; Fey, D.M.; Hurowitz, J.A.; McBride, M. Evidence for plunging river plume deposits in the Pahrump Hills member of the Murray formation, Gale crater, Mars. Sedimentology 2019, 66, 1768–1802. [Google Scholar] [CrossRef] [Green Version]
- Thomson, B.; Bridges, N.; Milliken, R.; Baldridge, A.; Hook, S.; Crowley, J.; Marion, G.; Filho, C.d.; Brown, A.; Weitz, C. Constraints on the origin and evolution of the layered mound in Gale Crater, Mars using Mars Reconnaissance Orbiter data. Icarus 2011, 214, 413–432. [Google Scholar] [CrossRef]
- Day, M.; Anderson, W.; Kocurek, G.; Mohrig, D. Carving intracrater layered deposits with wind on Mars. Geophys. Res. Lett. 2016, 43, 2473–2479. [Google Scholar] [CrossRef]
- Grotzinger, J.P.; Gupta, S.; Malin, M.C.; Rubin, D.M.; Schieber, J.; Siebach, K.; Sumner, D.Y.; Stack, K.M.; Vasavada, A.R.; Arvidson, R.E. Deposition, exhumation, and paleoclimate of an ancient lake deposit, Gale crater, Mars. Science 2015, 350, aac7575. [Google Scholar] [CrossRef] [PubMed]
- Malin, M.C.; Edgett, K.S. Sedimentary rocks of early Mars. Science 2000, 290, 1927–1937. [Google Scholar] [CrossRef]
- Anderson, R.B.; Edgar, L.A.; Rubin, D.M.; Lewis, K.W.; Newman, C. Complex bedding geometry in the upper portion of Aeolis Mons, Gale crater, Mars. Icarus 2018, 314, 246–264. [Google Scholar] [CrossRef]
- Banham, S.G.; Gupta, S.; Rubin, D.M.; Watkins, J.A.; Sumner, D.Y.; Edgett, K.S.; Grotzinger, J.P.; Lewis, K.W.; Edgar, L.A.; Stack-Morgan, K.M. Ancient Martian aeolian processes and palaeomorphology reconstructed from the Stimson formation on the lower slope of Aeolis Mons, Gale crater, Mars. Sedimentology 2018, 65, 993–1042. [Google Scholar] [CrossRef] [Green Version]
- Rapin, W.; Dromart, G.; Rubin, D.; Deit, L.L.; Mangold, N.; Edgar, L.A.; Gasnault, O.; Herkenhoff, K.; le Mouélic, S.; Anderson, R. Alternating wet and dry depositional environments recorded in the stratigraphy of Mount Sharp at Gale crater, Mars. Geology 2021, 49, 842–846. [Google Scholar] [CrossRef]
- Bridges, N.; Calef, F.; Hallet, B.; Herkenhoff, K.E.; Lanza, N.; le Mouélic, S.; Newman, C.; Blaney, D.; de Pablo, M.; Kocurek, G. The rock abrasion record at Gale crater: Mars Science Laboratory results from Bradbury landing to Rocknest. J. Geophys. Res. Planets 2014, 119, 1374–1389. [Google Scholar] [CrossRef] [Green Version]
- Bridges, N.; Greeley, R.; Haldemann, A.; Herkenhoff, K.E.; Kraft, M.; Parker, T.; Ward, A. Ventifacts at the Pathfinder landing site. J. Geophys. Res. Planets 1999, 104, 8595–8615. [Google Scholar] [CrossRef] [Green Version]
- Hobbs, S.W.; Paull, D.J.; Bourke, M.C. Aeolian processes and dune morphology in Gale Crater. Icarus 2010, 210, 102–115. [Google Scholar] [CrossRef]
- Knight, J. The environmental significance of ventifacts: A critical review. Earth-Sci. Rev. 2008, 86, 89–105. [Google Scholar] [CrossRef]
- Laity, J.E.; Bridges, N.T. Ventifacts on Earth and Mars: Analytical, field, and laboratory studies supporting sand abrasion and windward feature development. Geomorphology 2009, 105, 202–217. [Google Scholar] [CrossRef]
- Sharp, R.P. Mars: Fretted and chaotic terrains. J. Geophys. Res. 1973, 78, 4073–4083. [Google Scholar] [CrossRef] [Green Version]
- Ward, A.W. Yardangs on Mars: Evidence of recent wind erosion. J. Geophys. Res. Solid Earth 1979, 84, 8147–8166. [Google Scholar] [CrossRef]
- Williams, J.; Day, M.; Chojnacki, M.; Rice, M. Scarp orientation in regions of active aeolian erosion on Mars. Icarus 2020, 335, 113384. [Google Scholar] [CrossRef]
- Piqueux, S.; Buz, J.; Edwards, C.S.; Bandfield, J.L.; Kleinböhl, A.; Kass, D.M.; Hayne, P.O.; S, M.C.; Teams, T. Widespread shallow water ice on Mars at high latitudesand midlatitudes. Geophys. Res. Lett. 2019, 46, 14290–14298. [Google Scholar] [CrossRef]
- Jones, D.B.; Harrison, S.; Anderson, K.; Whalley, W.B. Rock glaciers and mountain hydrology: A review. Earth-Sci. Rev. 2019, 193, 66–90. [Google Scholar] [CrossRef]
- Holt, J.W.; Safaeinili, A.; Plaut, J.J.; Head, J.W.; Phillips, R.J.; Seu, R.; Kempf, S.D.; Choudhary, P.; Young, D.A.; Putzig, N.E. Radar sounding evidence for buried glaciers in the southern mid-latitudes of Mars. Science 2008, 322, 1235–1238. [Google Scholar] [CrossRef] [Green Version]
- Sinha, R.K.; Murty, S. Amazonian modification of Moreux crater: Record of recent and episodic glaciation in the Protonilus Mensae region of Mars. Icarus 2015, 245, 122–144. [Google Scholar] [CrossRef]
- Fastook, J.L.; Head, J.W.; Marchant, D.R. Form. Lobate Debris Aprons Mars: Assess. Reg. Ice Sheet Collapse Debris-Cover. Armoring. Icarus 2014, 228, 54–63. [Google Scholar]
- Lucchitta, B.K. Ice Debris Frett. Terrain Mars. J. Geophys. Res. Solid Earth 1984, 89, B409–B418. [Google Scholar] [CrossRef]
- Squyres, S.W. Martian Frett. Terrain: Flow Eros. Debris. Icarus 1978, 34, 600–613. [Google Scholar]
- Van Gasselt, S.; Hauber, E.; Neukum, G. Lineated valley fill at the Martian dichotomy boundary: Nature and history of degradation. J. Geophys. Res. Planets 2010, 115. [Google Scholar] [CrossRef] [Green Version]
- Irwin, R.P., III; Watters, T.R.; Howard, A.D.; Zimbelman, J.R. Sedimentary resurfacing and fretted terrain development along the crustal dichotomy boundary, Aeolis Mensae, Mars. J. Geophys. Res. Planets 2004, 109. [Google Scholar] [CrossRef] [Green Version]
- Mangold, N. Geomorphic analysis of lobate debris aprons on Mars at Mars Orbiter Camera scale: Evidence for ice sublimation initiated by fractures. J. Geophys. Res. Planets 2003, 108. [Google Scholar] [CrossRef]
- Pierce, T.L.; Crown, D.A. Morphologic and topographic analyses of debris aprons in the eastern Hellas region, Mars. Icarus 2003, 163, 46–65. [Google Scholar] [CrossRef]
- Wahrhaftig, C.; Cox, A. Rock glaciers in the Alaska Range. Geol. Soc. Am. Bull. 1959, 70, 383–436. [Google Scholar] [CrossRef]
- Elizabeth Martin, H.; Whalley, W.B. Rock glaciers: Part 1: Rock glacier morphology: Classification and distribution. Prog. Phys. Geogr. 1987, 11, 260–282. [Google Scholar] [CrossRef]
- Giardino, J.R.; Shroder, J.F.; Vitek, J.D. Rock Glaciers; Allen & Unwin: Crow’s Nest, Australia, 1987. [Google Scholar]
- Mahaney, W.C.; Miyamoto, H.; Dohm, J.M.; Baker, V.R.; Cabrol, N.A.; Grin, E.A.; Berman, D.C. Rock glaciers on Mars: Earth-based clues to Mars’ recent paleoclimatic history. Planet. Space Sci. 2007, 55, 181–192. [Google Scholar]
- Easterbrook, D.J. Surface Processes and Landforms; Macmillan: New York, NY, USA, 1993. [Google Scholar]
- Emmert, A.; Kneisel, C. Internal structure of two alpine rock glaciers investigated by quasi-3-D electrical resistivity imaging. Cryosphere 2017, 11, 841–855. [Google Scholar] [CrossRef] [Green Version]
- Degenhardt, J.J., Jr.; Giardino, J.R. Subsurface investigation of a rock glacier using ground-penetrating radar: Implications for locating stored water on Mars. J. Geophys. Res. Planets 2003, 108. [Google Scholar] [CrossRef]
- Whalley, W.B.; Azizi, F. Rock glaciers and protalus landforms: Analogous forms and ice sources on Earth and Mars. J. Geophys. Res. Planets 2003, 108. [Google Scholar] [CrossRef] [Green Version]
- Humlum, O. Rock glaciers in northern Spitsbergen: A discussion. J. Geol. 1982, 90, 214–217. [Google Scholar] [CrossRef]
- Azizi, F.; Whalley, W. Finite element analysis of the creep of debris containing thin ice bodies. In Proceedings of the Fifth International Offshore and Polar Engineering Conference, Hague, The Netherlands, 11–16 June 1995; OnePetro: Richardson, TX, USA, 1995. [Google Scholar]
- Azizi, F.; Whalley, W. Numerical modelling of the creep behaviour of ice-debris mixtures under variable thermal regimes. In Proceedings of the Sixth International Offshore and Polar Engineering Conference, Los Angeles, CA, USA, 26–31 May 1996; OnePetro: Richardson, TX, USA, 1996. [Google Scholar]
- Xue, K.; Wen, Z.; Zhu, Z.; Wang, D.; Luo, F.; Zhang, M. An experimental study of the relationship between the matric potential, unfrozen water, and segregated ice of saturated freezing soil. Bull. Eng. Geol. Environ. 2021, 80, 2535–2544. [Google Scholar] [CrossRef]
- Whalley, W.B.; Krinsley, D.H. A scanning electron microscope study of surface textures of quartz grains from glacial environments. Sedimentology 1974, 21, 87–105. [Google Scholar] [CrossRef]
- Whalley, W.B.; Martin, H.E. Rock glaciers: II models and mechanisms. Prog. Phys. Geogr. 1992, 16, 127–186. [Google Scholar] [CrossRef]
- Kaab, A. Rock glaciers and protalus forms. En-Cyclopedia Quat. Sci. 2007, 2236–2242. Available online: https://ci.nii.ac.jp/naid/20001586454/ (accessed on 28 February 2022).
- Hamilton, S.J.; Whalley, W.B. Rock glacier nomenclature: A re-assessment. Geomorphology 1995, 14, 73–80. [Google Scholar] [CrossRef]
- Halla, C.; Blöthe, J.H.; Baldis, C.T.; Liaudat, D.T.; Hilbich, C.; Hauck, C.; Schrott, L. Ice content and interannual water storage changes of an active rock glacier in the dry Andes of Argentina. Cryosphere 2021, 15, 1187–1213. [Google Scholar] [CrossRef]
- Berthling, I. Beyond confusion: Rock glaciers as cryo-conditioned landforms. Geomorphology 2011, 131, 98–106. [Google Scholar] [CrossRef]
- Francou, B.; Fabre, D.; Pouyaud, B.; Jomelli, V.; Arnaud, Y. Symptoms of degradation in a tropical rock glacier, Bolivian Andes. Permafr. Periglac. Process. 1999, 10, 91–100. [Google Scholar] [CrossRef]
- Johnson, G.; Chang, H.; Fountain, A. Active rock glaciers of the contiguous United States: Geographic information system inventory and spatial distribution patterns. Earth Syst. Sci. Data 2021, 13, 3979–3994. [Google Scholar] [CrossRef]
- Koutnik, M.R.; Pathare, A.V. Contextualizing lobate debris aprons and glacier-like forms on Mars with debris-covered glaciers on Earth. Prog. Phys. Geogr. Earth Environ. 2021, 45, 130–186. [Google Scholar] [CrossRef]
- Konrad, S.; Humphrey, N.; Steig, E.; Clark, D.; Potter, N., Jr.; Pfeffer, W. Rock glacier dynamics and paleoclimatic implications. Geology 1999, 27, 1131–1134. [Google Scholar] [CrossRef]
- Whalley, W.B.; Azizi, F. Rheological models of active rock glaciers: Evaluation, critique and a possible test. Permafr. Periglac. Process. 1994, 5, 37–51. [Google Scholar] [CrossRef]
- Sergienko, O.; Creyts, T.T.; Hindmarsh, R. Similarity of organized patterns in driving and basal stresses of Antarctic and Greenland ice sheets beneath extensive areas of basal sliding. Geophys. Res. Lett. 2014, 41, 3925–3932. [Google Scholar] [CrossRef] [Green Version]
- Azuma, N. A flow law for anisotropic ice and its application to ice sheets. Earth Planet. Sci. Lett. 1994, 128, 601–614. [Google Scholar] [CrossRef]
- Cuffey, K.M.; Paterson, W.S.B. The Physics of Glaciers; Academic Press: Cambridge, MS, USA, 2010. [Google Scholar]
- Goldsby, D.; Kohlstedt, D.L. Superplastic deformation of ice: Experimental observations. J. Geophys. Res. Solid Earth 2001, 106, 11017–11030. [Google Scholar] [CrossRef]
- Colaprete, A.; Jakosky, B.M. Ice flow and rock glaciers on Mars. J. Geophys. Res. Planets 1998, 103, 5897–5909. [Google Scholar] [CrossRef]
- Durham, W.; Stern, L. Rheological properties of water ice—Applications to satellites of the outer planets. Annu. Rev. Earth Planet. Sci. 2001, 29, 295–330. [Google Scholar] [CrossRef] [Green Version]
- McEwen, A.S.; Eliason, E.M.; Bergstrom, J.W.; Bridges, N.T.; Hansen, C.J.; Delamere, W.A.; Grant, J.A.; Gulick, V.C.; Herkenhoff, K.E.; Keszthelyi, L. Mars reconnaissance orbiter’s high resolution imaging science experiment (HiRISE). J. Geophys. Res. Planets 2007, 112. [Google Scholar] [CrossRef] [Green Version]
- Malin, M.C.; Bell, J.F., III; Cantor, B.A.; Caplinger, M.A.; Calvin, W.M.; Clancy, R.T.; Edgett, K.S.; Edwards, L.; Haberle, R.M.; James, P.B. Context camera investigation on board the Mars Reconnaissance Orbiter. J. Geophys. Res. Planets 2007, 112. [Google Scholar] [CrossRef] [Green Version]
- Dromart, G.; Le Deit, L.; Rapin, W.; Gasnault, O.; le Mouélic, S.; Quantin-Nataf, C.; Mangold, N.; Rubin, D.; Lasue, J.; Maurice, S. Deposition and erosion of a Light-Toned Yardang-forming unit of Mt Sharp, Gale crater, Mars. Earth Planet. Sci. Lett. 2021, 554, 116681. [Google Scholar] [CrossRef]
- Kenner, R.; Phillips, M.; Beutel, J.; Hiller, M.; Limpach, P.; Pointner, E.; Volken, M. Factors controlling velocity variations at short-term, seasonal and multiyear time scales, Ritigraben rock glacier, Western Swiss Alps. Permafr. Periglac. Process. 2017, 28, 675–684. [Google Scholar] [CrossRef]
- Whalley, W.B.; Hamilton, S.J.; Palmer, C.F.; Gordon, J.E.; Martin, H.E. The dynamics of rock glaciers: Data from Tröllaskagi, north Iceland. In Steepland Geomorphology; ResearchGate: Berlin, Germany, 1995; pp. 129–145. [Google Scholar]
- Levy, J.S.; Head, J.W.; Marchant, D.R. Concentric crater fill in Utopia Planitia: History and interaction between glacial “brain terrain” and periglacial mantle processes. Icarus 2009, 202, 462–476. [Google Scholar] [CrossRef]
- Fraeman, A.; Ehlmann, B.; Arvidson, R.; Edwards, C.; Grotzinger, J.; Milliken, R.; Quinn, D.; Rice, M. The stratigraphy and evolution of lower Mount Sharp from spectral, morphological, and thermophysical orbital data sets. J. Geophys. Res. Planets 2016, 121, 1713–1736. [Google Scholar] [CrossRef]
- Frauenfelder, R.; Laustela, M.; Kääb, A. Relative age dating of Alpine rockglacier surfaces. Z. Geomorphol. 2005, 49, 145–166. [Google Scholar]
- Haeberli, W.; Brandova, D.; Burga, C.; Egli, M.; Frauenfelder, R.; Kääb, A.; Maisch, M.; Mauz, B.; Dikau, R. Methods for absolute and relative age dating of rock-glacier surfaces in alpine permafrost. In Proceedings of the 8th International Conference on Permafrostm, Zurich, Switzerland, 21–25 July 2003. [Google Scholar]
- Krainer, K.; Bressan, D.; Dietre, B.; Haas, J.N.; Hajdas, I.; Lang, K.; Mair, V.; Nickus, U.; Reidl, D.; Thies, H. A 10,300-year-old permafrost core from the active rock glacier Lazaun, southern Ötztal Alps (South Tyrol, northern Italy). Quat. Res. 2015, 83, 324–335. [Google Scholar] [CrossRef]
- Fassett, C.I.; Levy, J.S.; Dickson, J.L.; Head, J.W. An extended period of episodic northern mid-latitude glaciation on Mars during the Middle to Late Amazonian: Implications for long-term obliquity history. Geology 2014, 42, 763–766. [Google Scholar] [CrossRef]
- Hauber, E.; Ulrich, M.; Preusker, F.; Trauthan, F.; Reiss, D.; Hiesinger, H.; Zanetti, M.; Team, S. Svalbard (Norway) as a terrestrial analogue for Martian landforms: Results on alluvial fans. EPSC Abstr. 2009, 4, EPSC2009-772. [Google Scholar]
- Carr, M.H. Retention of an atmosphere on early Mars. J. Geophys. Res. Planets 1999, 104, 21897–21909. [Google Scholar] [CrossRef]
Figure 1.
(a) Mars MGS MOLA Global Color Shaded Relief 463 m/pixel context map; (b) inset (yellow box) showing location of Gale crater and dichotomy boundary in the northwest portion of the Aeolis Quadrangle (red dashed box); (c) HRSC DEM combined with CTX image data and Viking Orbiter imagery. White: outline of Gale crater, yellow: outline of Mount Sharp. Brown oval: MSL landing ellipse; (d) HRSC image mosaic of the lobate feature complex and concave basin. Photo credit: NASA/JPL-Caltech/ESA/DLR/FU Berlin; Williams, J.M.

Figure 2.
Examples of lobate debris aprons (LDA) in Deuteronilus Mensae (mid-latitude, Mars) and a tongue-shaped flow feature in eastern Hellas Planitia (mid-latitude, Mars): (a) Deuteronilus Mensae LDA. Feature shows possible sublimation pits (yellow arrows). HiRISE/MRO image ESP_028721_2225_MIRB; (b) tongue-shaped lobate flow feature along an interior crater wall with a length approximately 5 km, width of 1 km. Feature portrays a double inner ridge and raised outer margin and surface is generally devoid of impact craters. HiRISE/MRO image PSP_003243_1415_MIRB. Image credit: NASA/JPL.

Figure 3.
Terrestrial rock glacier Martian analogs. Bolivian rock glaciers; (a) well-defined arcuate ridges and depressions extent marked orange at Pico Austria, Tuni Condoriri region; (b) rock glacier front analog at Huayna Potosi, rock glacier with an over-steepened front slope ~43°. Photo credit: S Rangecroft, July 2011, August 2012.

Figure 4.
Glacier-derived rock glacier to talus-derived rock glacier examples. Images with higher elevation equilibrium lines (decreasing ice accumulation) towards the right. (a) Glacier-derived rock glacier, ELA present on glacial body; (b) glacier-derived rock glacier, ELA migrated up closer to rock face; (c) talus-derived rock glacier, ELA now above glacier body; (d) talus-derived rock glacier, ELA migrating further above glacier body. Figure adapted from Humlum et al. [81].

Figure 5.
Three classifications of rock glaciers geometry; lobate rock glacier, piedmont/spatulate rock glacier and tongue-shaped rock glacier (indicated in red). After Humlum et al. [81], Martin and Whalley [74], and Hamilton and Whalley [84].

Figure 6.
Lobate features on the north face of Mount Sharp. Eleven lobes mapped (0–10) and ten analyzed (1–10). Lobe (0) is overlapped and partially obscured by lobe (2), therefore, was not included in this study. Lobe-center transect lines with corresponding equidistant points. Point colors indicate lobe color designation used in text. CTX base image: B16_016085_1750_XN_05S222W and CTX DEM derived from CTX stereo pairs P01_001422_1747_XN_05S222W and P18_008002_1748_XN_05S222W. Image: NASA/JPL-Caltech/MSSS; DTM: NASA/JPL-Caltech/MSSS/NHM; the stereo DTM processing was carried out at the Natural History Museum, London; slope and contour overlay map: Williams J.M.

Figure 7.
(a) Ground estimation method using bounding elevations of a perpendicular drawn line to a lobate feature boundary (orange line) and from the centerline transect point. In this example, the Point 1 elevation is −3000 m and basal elevation is −3100, giving a height of 100 m. (b) Basal elevation range below the cross-sectional profile and the underlying ground elevation with no basal scouring. The maximum thickness h corresponds to the center of the transect line. Vertical exaggeration 10X. CTX image: B16_016085_1750_XN_05S222W. CTX DEM derived from CTX stereo pairs P01_001422_1747_XN_05S222W and P18_008002_1748_XN_05S222W. Image: NASA/JPL-Caltech/MSSS; DTM: NASA/JPL-Caltech/MSSS/NHM; the stereo DTM processing was carried out at the Natural History Museum, London; slope and contour overlay map: Williams J.M.

Figure 8.
CTX Mosaic image of the north Mount Sharp glacial features. Yellow: Lobate Feature Complex; Orange: Spatulate feature; Blue: Concave Basin. Slope break occurs at the boundary of the concave basin and the upper edge of the lobate feature complex boundary. Background image credit: NASA/JPL-Caltech/ESA/DLR/FU Berlin.

Figure 9.
Anaglyph of lobate form shown in Figure 7. This feature has a convex cross profile with oversteepened distal and lateral sides. Image derived from HiRise Images ESP_018287_1755_ESP_018788_1755. Credit: NASA/JPL/University of Arizona.
Figure 9.
Anaglyph of lobate form shown in Figure 7. This feature has a convex cross profile with oversteepened distal and lateral sides. Image derived from HiRise Images ESP_018287_1755_ESP_018788_1755. Credit: NASA/JPL/University of Arizona.

Figure 10.
CTX DEM-derived Slope Map with contour 50 m interval. Slope map and contour created from CTX DEM. Image covers 6 of the 10 lobes reviewed in this study due to higher preservation states. Image derived from HiRISE images ESP_018788_1755, slope map created in ArcGIS 10.8.1 using CTX DEM derived from CTX stereo pairs P01_001422_1747_XN_05S222W and P18_008002_1748_XN_05S222W. Image: NASA/JPL-Caltech/MSSS; DTM: NASA/JPL-Caltech/MSSS/NHM; the stereo DTM processing was carried out at the Natural History Museum, London; slope and contour overlay map: Williams J.M.

Figure 11.
Lamented features examples on lobate feature complex and Mount Sharp light-toned unit. Frequency average of the two lobate features is 93.43 m and for the Mount Sharp light-toned units frequency averages are 91.94 m. (a) Detailed image of finely lamented features of the medial portion of the blue (3) lobe. Frequency of lamented features ~97.59 m on average; (b) Detail image of finely lamented features of the medial/distal portion of the red (1). Frequency of lamented features ~89.27 m on average; (c) detailed image of finely lamented features of the Light-Toned Yardang Unit (LTYu). Frequency of lamented features ~100.26 m on average; (d) detailed image of finely lamented features of Light-Toned Yardang Unit (LTYu). Frequency of lamented features ~71.02 m on average. Background image credit: NASA/JPL.

Figure 12.
(a) Mount Sharp Rock Glacier complex with lobes and central traverse lines identified. Blue (3) lobe (right) is highly degraded and mantled and therefore not included in this analysis. Scarp in the Bu unit of LeDeit et al. [37] occurs at the upper edge of the orange (4), blue (3) and red (1) lobate forms. Boxed area is context location for [c]; (b) profiles down the center transverse of the ten lobate features deposits located on the north face of Mount Sharp (Figure 1d). No vertical exaggeration: (c) overprinting lobes, red (1) lobe (Red Arrows) overlies the blue (3) lobe (Blue arrows) that overlies orange (4) lobe (orange arrows). CTX image: G01_018788_1754_XN_04S222W; background image credit: JPL/NASA.

Publisher’s Note: MDPI stays neutral with regard to jurisdictional claims in published maps and institutional affiliations. |
© 2022 by the authors. Licensee MDPI, Basel, Switzerland. This article is an open access article distributed under the terms and conditions of the Creative Commons Attribution (CC BY) license (https://creativecommons.org/licenses/by/4.0/).
Share and Cite
MDPI and ACS Style
Williams, J.M.; Scuderi, L.A.; Newsom, H.E. Numerical Analysis of Putative Rock Glaciers on Mount Sharp, Gale Crater, Mars. Remote Sens. 2022, 14, 1887. https://0-doi-org.brum.beds.ac.uk/10.3390/rs14081887
AMA Style
Williams JM, Scuderi LA, Newsom HE. Numerical Analysis of Putative Rock Glaciers on Mount Sharp, Gale Crater, Mars. Remote Sensing. 2022; 14(8):1887. https://0-doi-org.brum.beds.ac.uk/10.3390/rs14081887
Chicago/Turabian StyleWilliams, Joshua M., Louis A. Scuderi, and Horton E. Newsom. 2022. "Numerical Analysis of Putative Rock Glaciers on Mount Sharp, Gale Crater, Mars" Remote Sensing 14, no. 8: 1887. https://0-doi-org.brum.beds.ac.uk/10.3390/rs14081887
Note that from the first issue of 2016, this journal uses article numbers instead of page numbers. See further details here.