
Georeferencing Urban Nighttime Lights Imagery Using Street Network Maps


German Aerospace Center (DLR), Earth Observation Center (EOC), 82234 Oberpfaffenhofen, Germany
*
Author to whom correspondence should be addressed.
Remote Sens. 2022, 14(11), 2671; https://0-doi-org.brum.beds.ac.uk/10.3390/rs14112671
Submission received: 30 April 2022
/
Revised: 27 May 2022
/
Accepted: 29 May 2022
/
Published: 2 June 2022
(This article belongs to the Special Issue Light Pollution Monitoring Using Remote Sensing Data II)
Abstract
:Astronaut photography acquired from the International Space Station presently is the only available option for free global high-resolution nighttime light (NTL) imagery. Unfortunately, these data are not georeferenced, meaning they cannot easily be used for many remote sensing applications such as change detection or fusion. Georeferencing such NTL data manually, for example, by finding tie points, is difficult due to the strongly differing appearance of any potential references. Therefore, realizing an automatic method for georeferencing NTL imagery is preferable. In this article, such an automatic processing chain for the georeferencing of NTL imagery is presented. The novel approach works by simulating reference NTL images from vector-based street network maps and finding tie points between these references and the NTL imagery. To test this approach, here, publicly available open street maps are used. The tie points identified in the reference and NTL imagery are then used for rectification and thereby for georeferencing. The presented processing chain is tested using nine different astronaut photographs of urban areas, illustrating the strengths and weaknesses of the algorithm. To evaluate the geometric accuracy, the photography is finally matched manually against an independent reference. The results of this evaluation depict that all nine astronaut photographs are georeferenced with accuracies between 2.03 px and 6.70 px. This analysis demonstrates that an automatic georeferencing of high-resolution urban NTL imagery is feasible even with limited attitude and orbit determination (AOD). Furthermore, especially for future spaceborne NTL missions with precise AOD, the algorithm’s performance will increase and could also be used for quality-control purposes.

1. Introduction
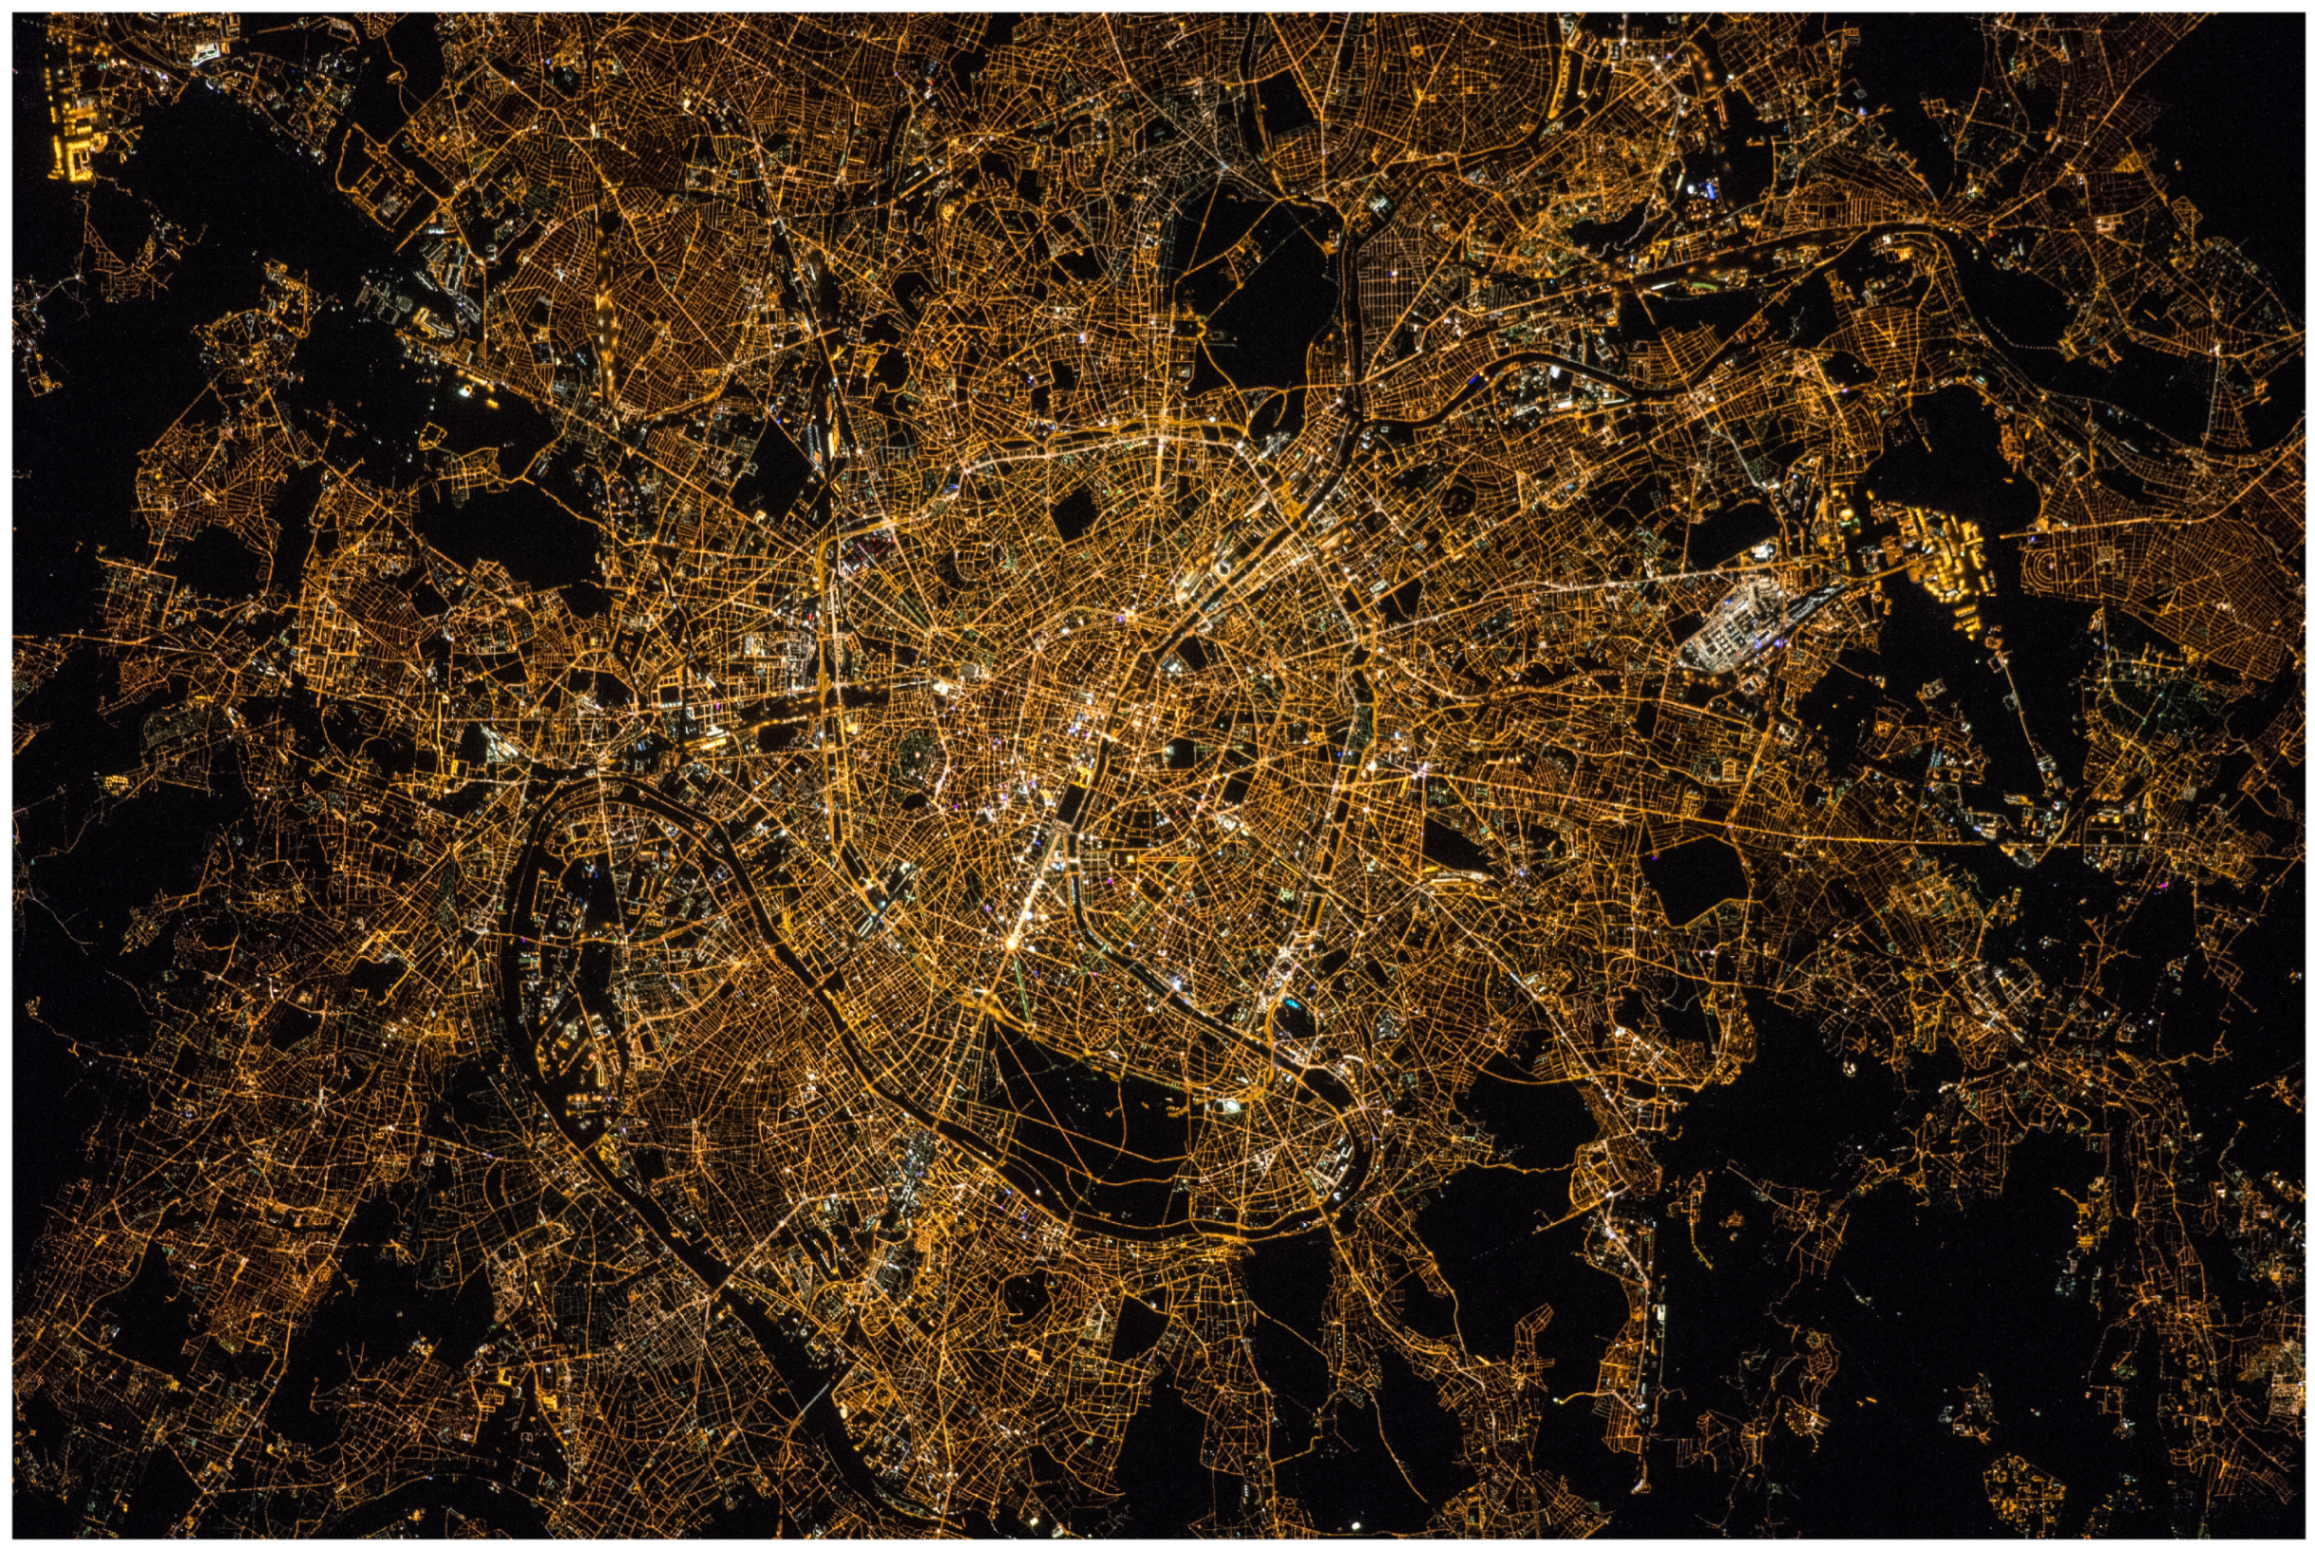
Georeferenced Earth imagery acquired at daylight is widely available nowadays, even in free and open forms from public missions such as Landsat or Sentinel-2 [1]. For nighttime light (NTL) imagery, however, the variety of data is much lower. For low-resolution needs, the Day/Night Band (DNB) of the Visible Infrared Imaging Radiometer Suite (VIIRS) has been providing NTL data since 2011 with a resolution of 750 m [2] with a daily global revisit and pan-chromatic band. For high-resolution needs, there are presently no publicly available global NTL data. The only available option in this case is the imagery acquired manually and sporadically by astronauts on the International Space Station (ISS), which is available on the Gateway to astronaut photography of Earth [3,4]. An example of such an astronaut photograph is shown in Figure 1. This image of Paris, France, for example, was acquired in April 2015 using a Nikon D4 electronic still camera with a focal length of 400 mm. From the horizontal sensor size of 36.0 mm with 4928 px, approximate altitude of 394 km and the tilt angle of , provided for this image, a ground sampling distance of ~7.6 m is derived. This collection of high-resolution data acquired at nighttime is unique and enables completely novel applications. As almost all light sources at night are man-made, their changes over time, in particular in urban areas, provide a good estimate of human impact and light pollution. The extent of night-time illumination provides valuable information on energy consumption for artificial light, urbanization, electricity access, socio-economy, hazards, risks, disasters, monitoring of conflicts, natural properties of the atmosphere and surface, and biological risks and opportunities: for example, human health, well-being, and influences on animals and plants [5]. A prerequisite for any of these studies, however, is a high geolocation accuracy of the NTL data. Unfortunately, due to the manual acquisition of these astronaut photographs, the images do not offer much geocoding information. Typically, information is available on time, position, camera model, sensor format and focal length, but not, in particular, on the precise attitude. The citizens science project Cities at Night and the associated project Lost at Night have been started to tag, locate and geocode the astronaut photographs [6]. Such an approximate geocoding is already useful for several use cases. For many applications, however, such as change detection over time or fusion with other data sources, a more accurate georeferencing is required.
The geolocation of satellite imagery acquired at daylight is often improved by finding tie points based on image matching in reference daylight images and rectifying the images based on these matches [7]. For NTL images, such an approach is not viable, as currently, no global high-resolution reference is available for nocturnal images. Depending on the scene content, a manual operator is able to use daytime imagery to find point correspondences with NTL images. Something similar was performed with low-resolution DNB data of VIIRS [8], where features such as lights from oil platforms, power plants, gas flares, volcanoes, and bridges were used to monitor the geolocation accuracy. For an automatic method to be used in an operational processing chain, finding matches between daytime and nighttime images is a highly complex task due to the heterogeneity of the image contents.
Especially when focusing on NTL imagery with urban content, it is evident that the main features visible are illuminated streets, see, for example, Figure 1. Considering the high resemblance to street network maps, it almost suggests itself to use a georeferenced street network map as a matching reference for these urban NTL images. To evaluate if such an approach is really viable, in this article, we used a street network extracted from OpenStreetMap (OSM) [9] in February 2022 to perform an automatic feature matching followed by image rectification. Of course, apart from OSM, any comparable street database is also suitable for the proposed methodology. The main advantages of OSM data are the world-wide coverage, free and open availability, and a wide range of supporting tools and libraries. However, the fact that OSM is based on crowdsourcing by volunteers could be regarded as a qualitative disadvantage. There is no general statement on the accuracy of OSM data, but some accuracy studies have been conducted at least for local regions. For example, in [10] an RMSE (Root Mean Squared Error) of 4.35 m was measured in West Lafayette, USA, and in [11], an average accuracy of 5.83 m was measured in selected areas of London, UK. This order of magnitude should be sufficient for the used NTL data, with a spatial resolution of 6.4 m or coarser. Nevertheless, it makes sense to double-check the achieved absolute accuracies using an independent reference.
2. Methodology
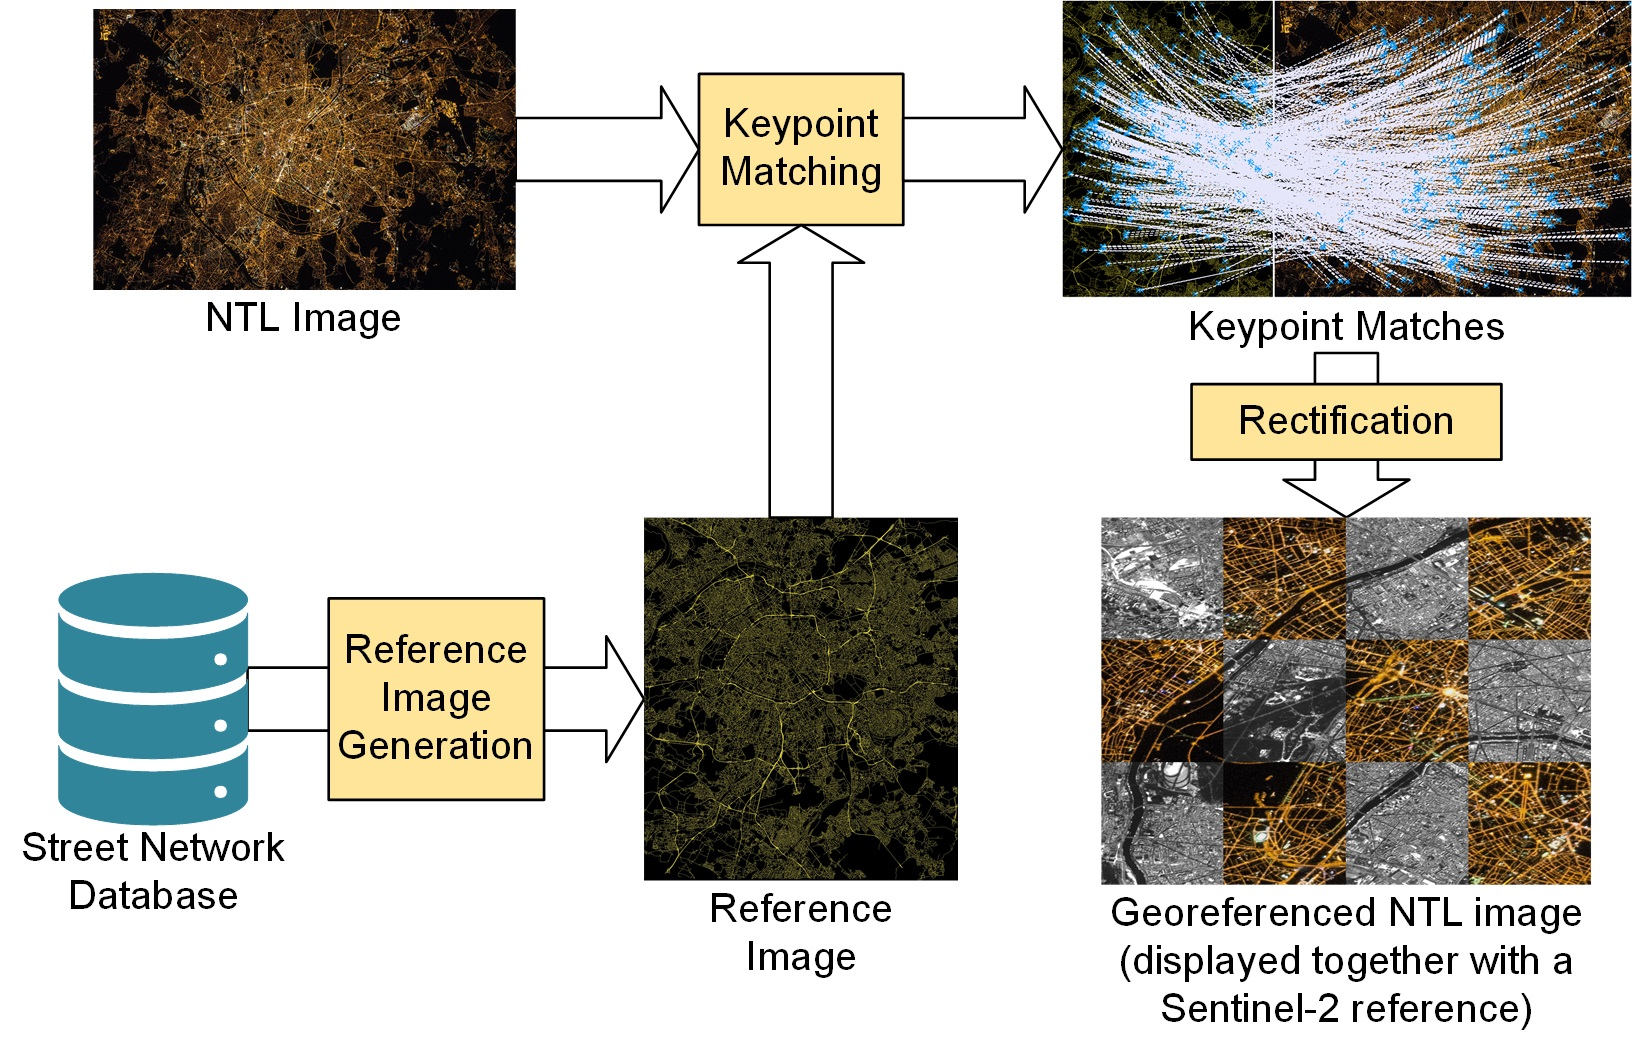
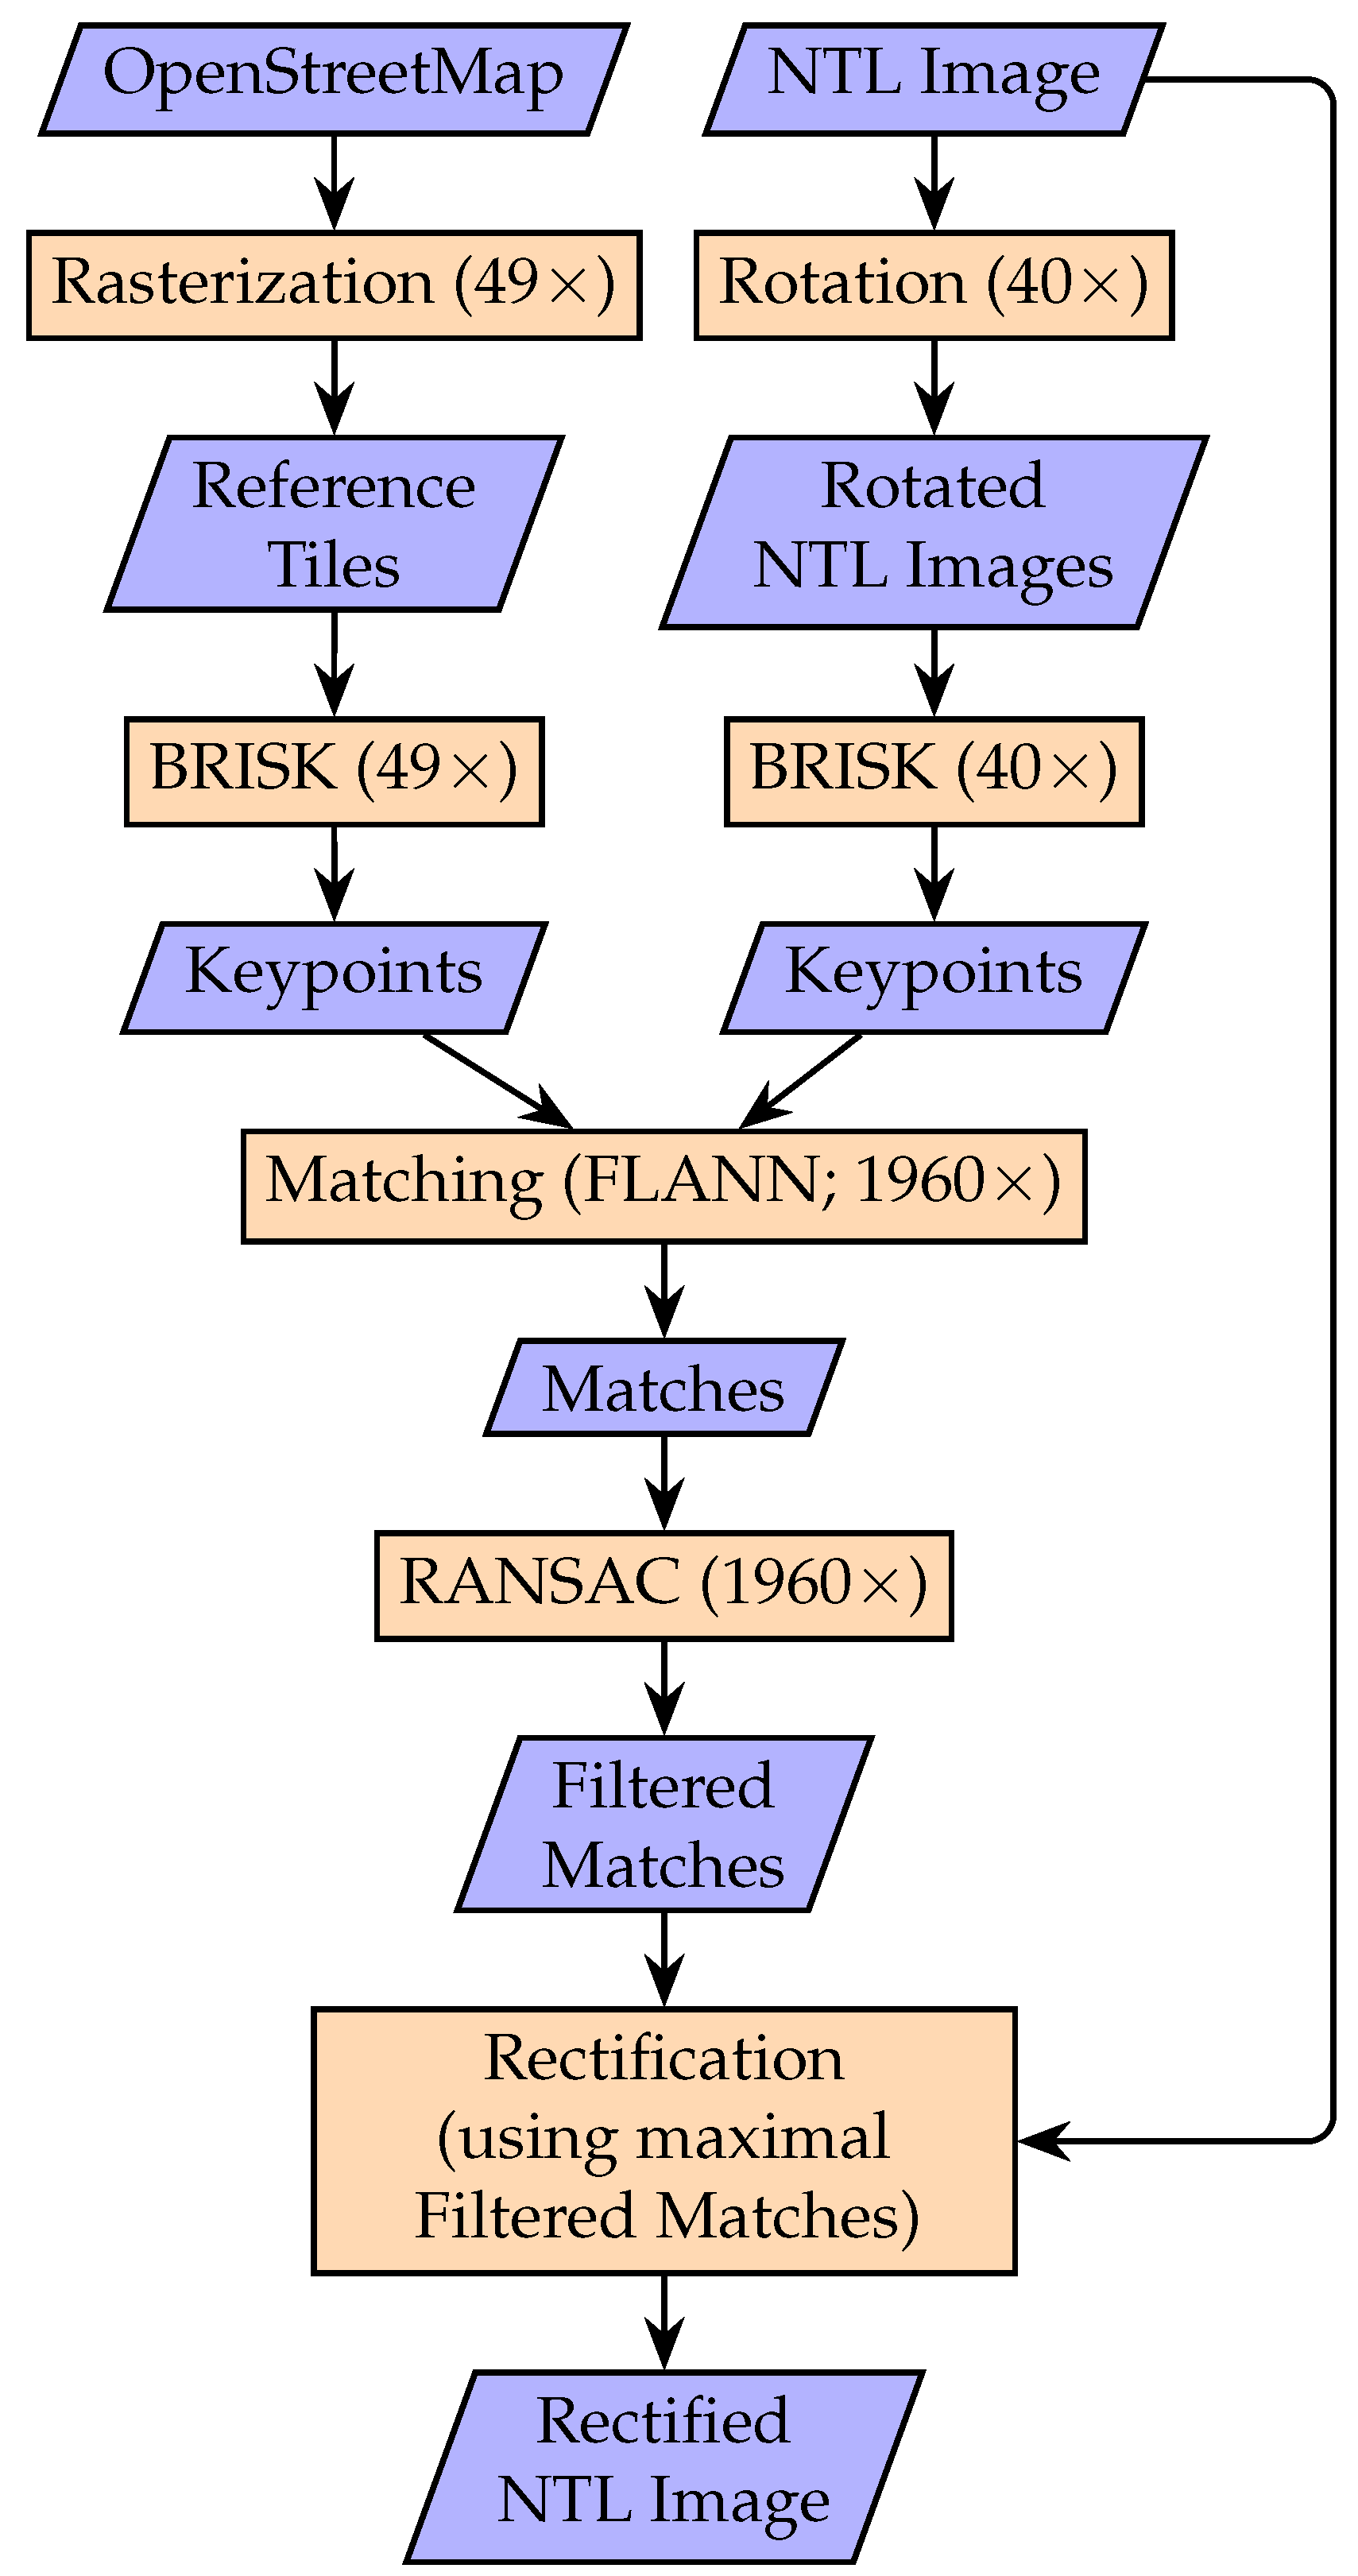
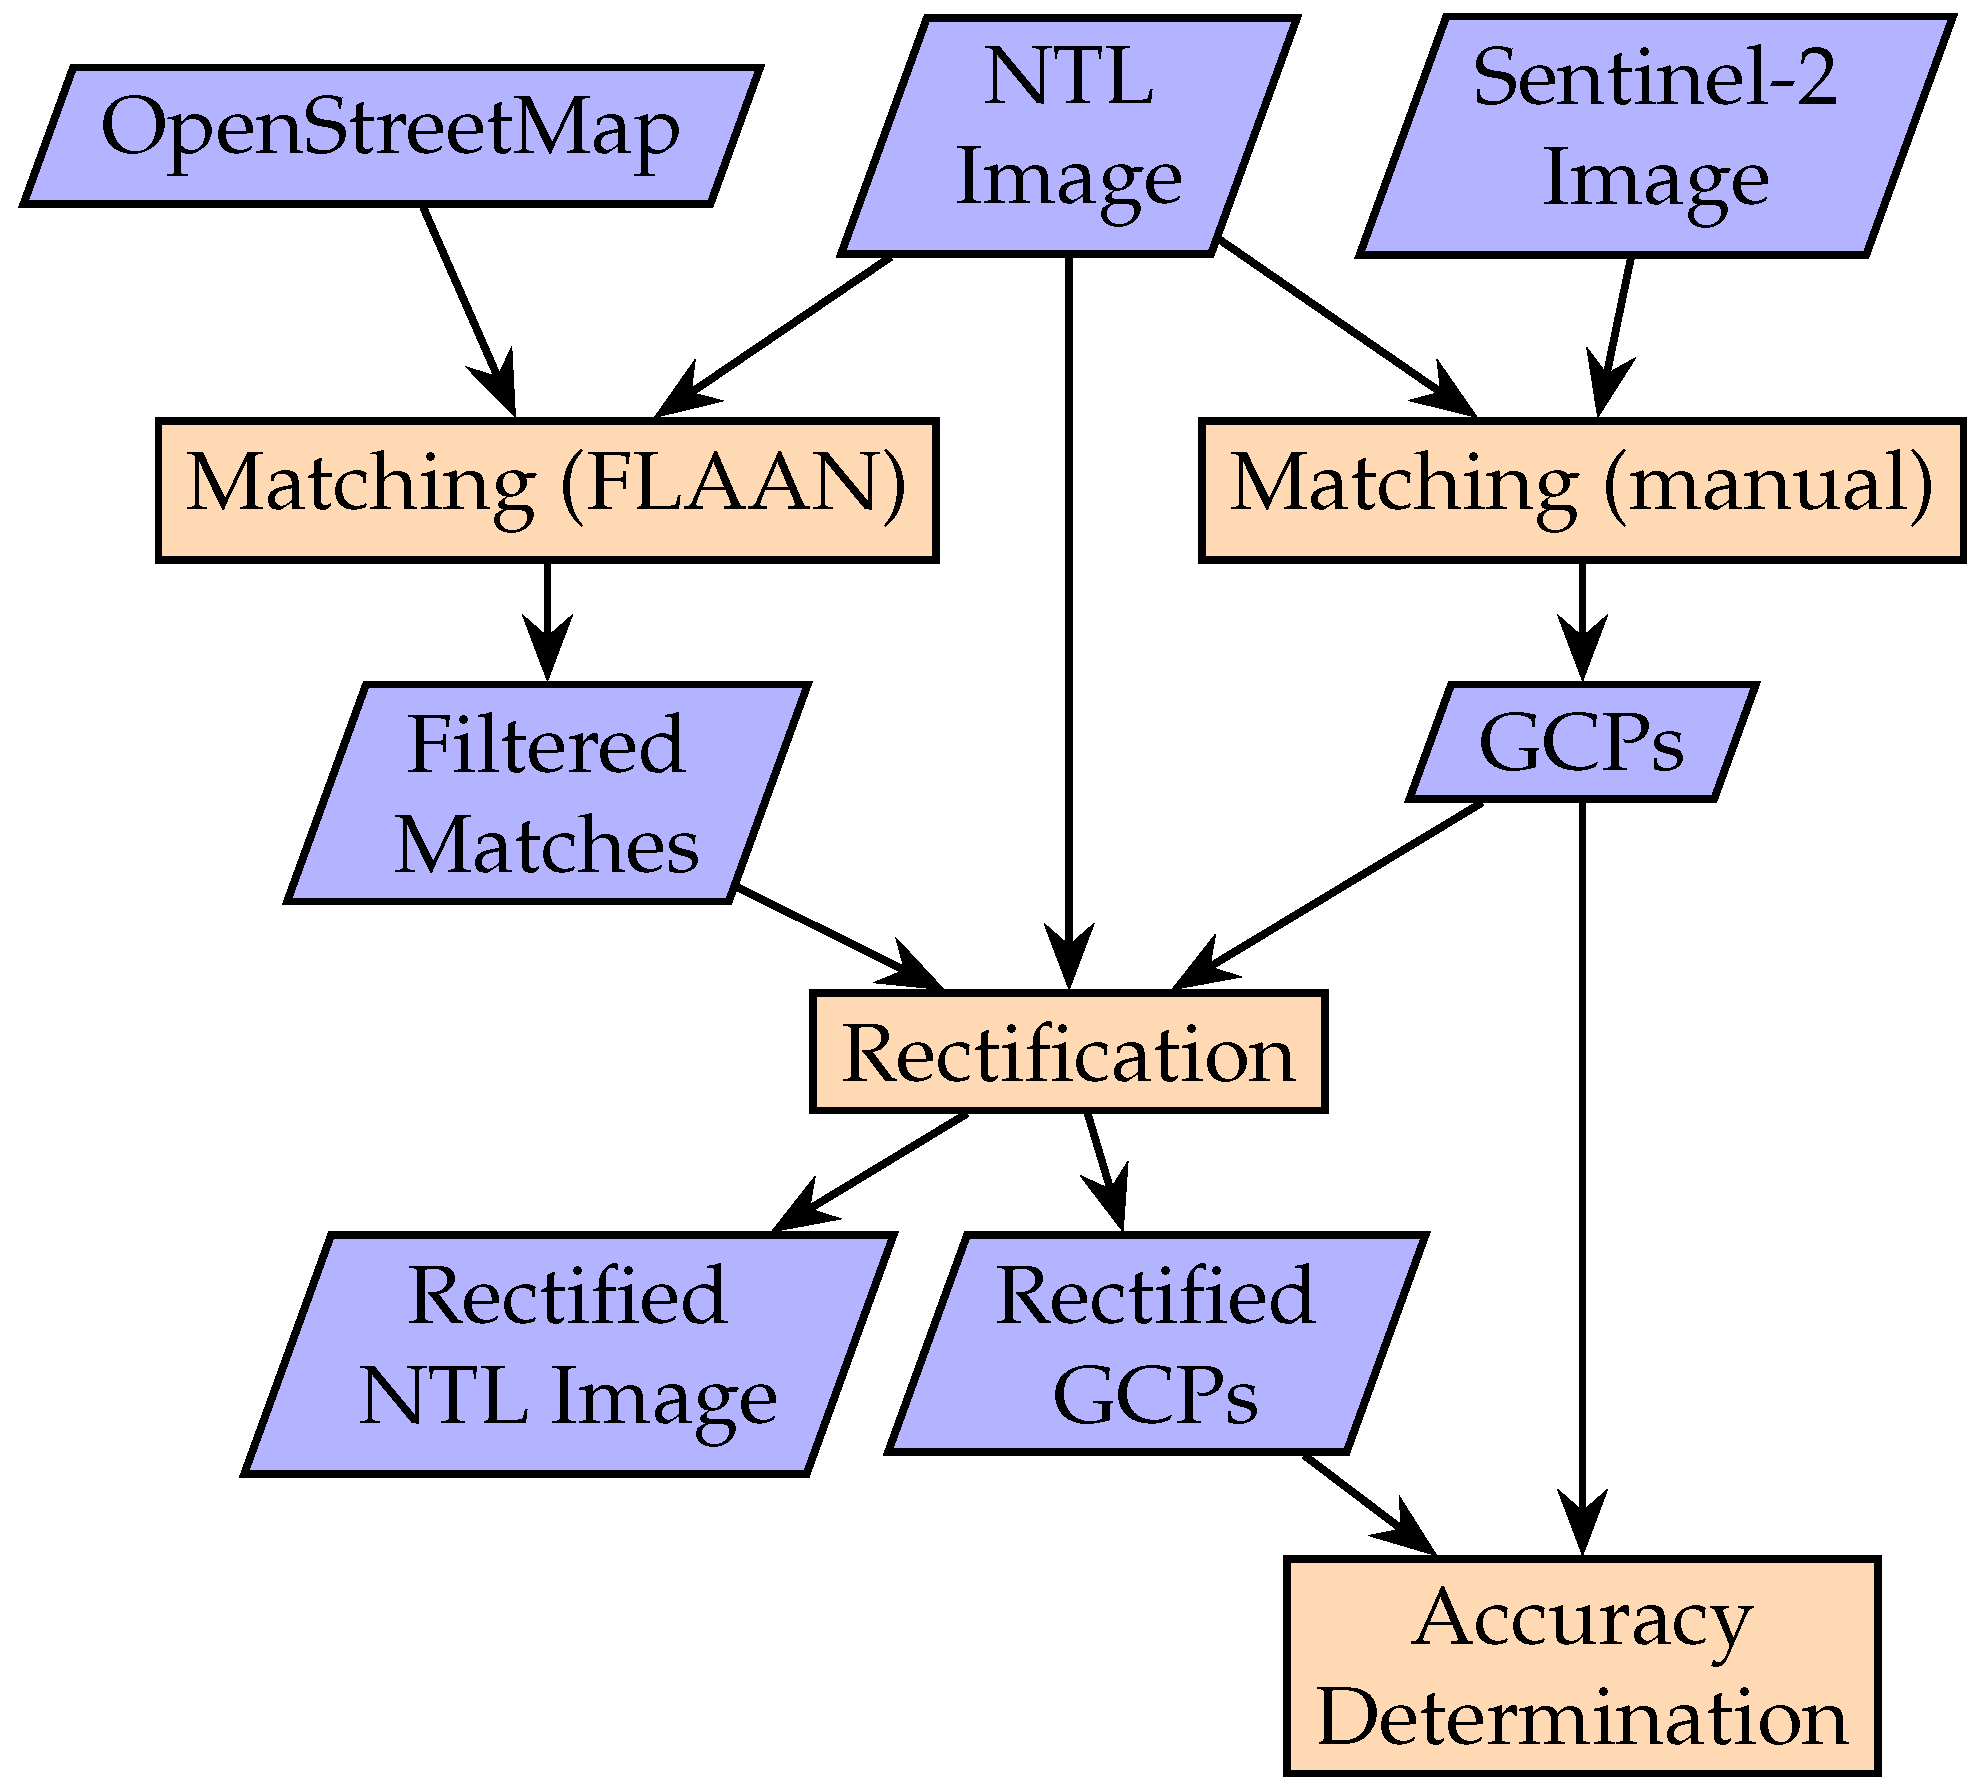
The proposed algorithm is straightforward (see Figure 2): The main features visible in urban NTL imagery from space are illuminated roads. To rectify such images, the street network of the area of interest is extracted from OSM and used as a reference. As the position of the NTL images is often not known, this is performed for up to 49 overlapping tiles in the area of with respect to the known nadir point of the ISS at the time of acquisition. These simulated reference NTL images are then matched against the NTL photos, rotated in 40 steps, using the BRISK feature detector. This results in combinations for references and rotations. Based on the identified keypoint correspondences, the NTL photos are finally rectified onto the coordinate system of the reference NTL images.
The four main processing steps are described in more detail in the following subsections:
- Reference image generation;
- BRISK keypoint extraction;
- Keypoint matching and outlier removal;
- Original imagery rectification.
2.1. Reference Image Generation
The simulated reference NTL images from OSM are extracted and rasterized automatically using the Python package OSMnx [12].
First, the approximate resolution of the NTL images is calculated using the sensor size, focal length, and ISS altitude. When available on the Gateway to astronaut photography of Earth, the camera tilt, based on the coarse location of the ISS and center of the NTL images, is also taken into account for this calculation. Even if this is not available, the approximated resolution assuming a camera tilt of is usually sufficiently accurate for further matching.
Next, in an Area-Of-Interest (AOI) of , namely, ~450 km × 450 km, around the nadir point, tiles with an overlap of are determined, as the spatial extent of the NTL images is typically smaller than . If the coarse center point is provided for the NTL photo, only the four tiles containing that point need to be considered; otherwise, all 49 tiles are extracted using the estimated resolution. This tiling approach over such a large AOI is necessary, as the coarse center point of the NTL image is unknown for many of the NTL scenes. Furthermore, the tiling allows for improved computational parallelization, the consideration of even larger AOI if necessary, and more robust image matching because of there being fewer outliers. For a nighttime light satellite imagery including more accurate geolocation information, it would be possible to work with only one reference tile.
The OSMnx package supports extensive filtering of the extracted street networks. For example, roads which are tagged as footpaths, abandoned or underground are excluded during the extraction, as only sufficiently illuminated roads are of interest for the following matching step. It is also possible to distinguish bigger roads such as highways from the smaller roads using the OSM tags motorway and trunk. For these roads, a width of 20 m is assumed, while all other roads are plotted with a width of 10 m. The assumption is motivated as the average street width is 11 m for 30 globally distributed cities [13], in particular 10.8 m for Paris and considering 10% bigger and 90% smaller roads.
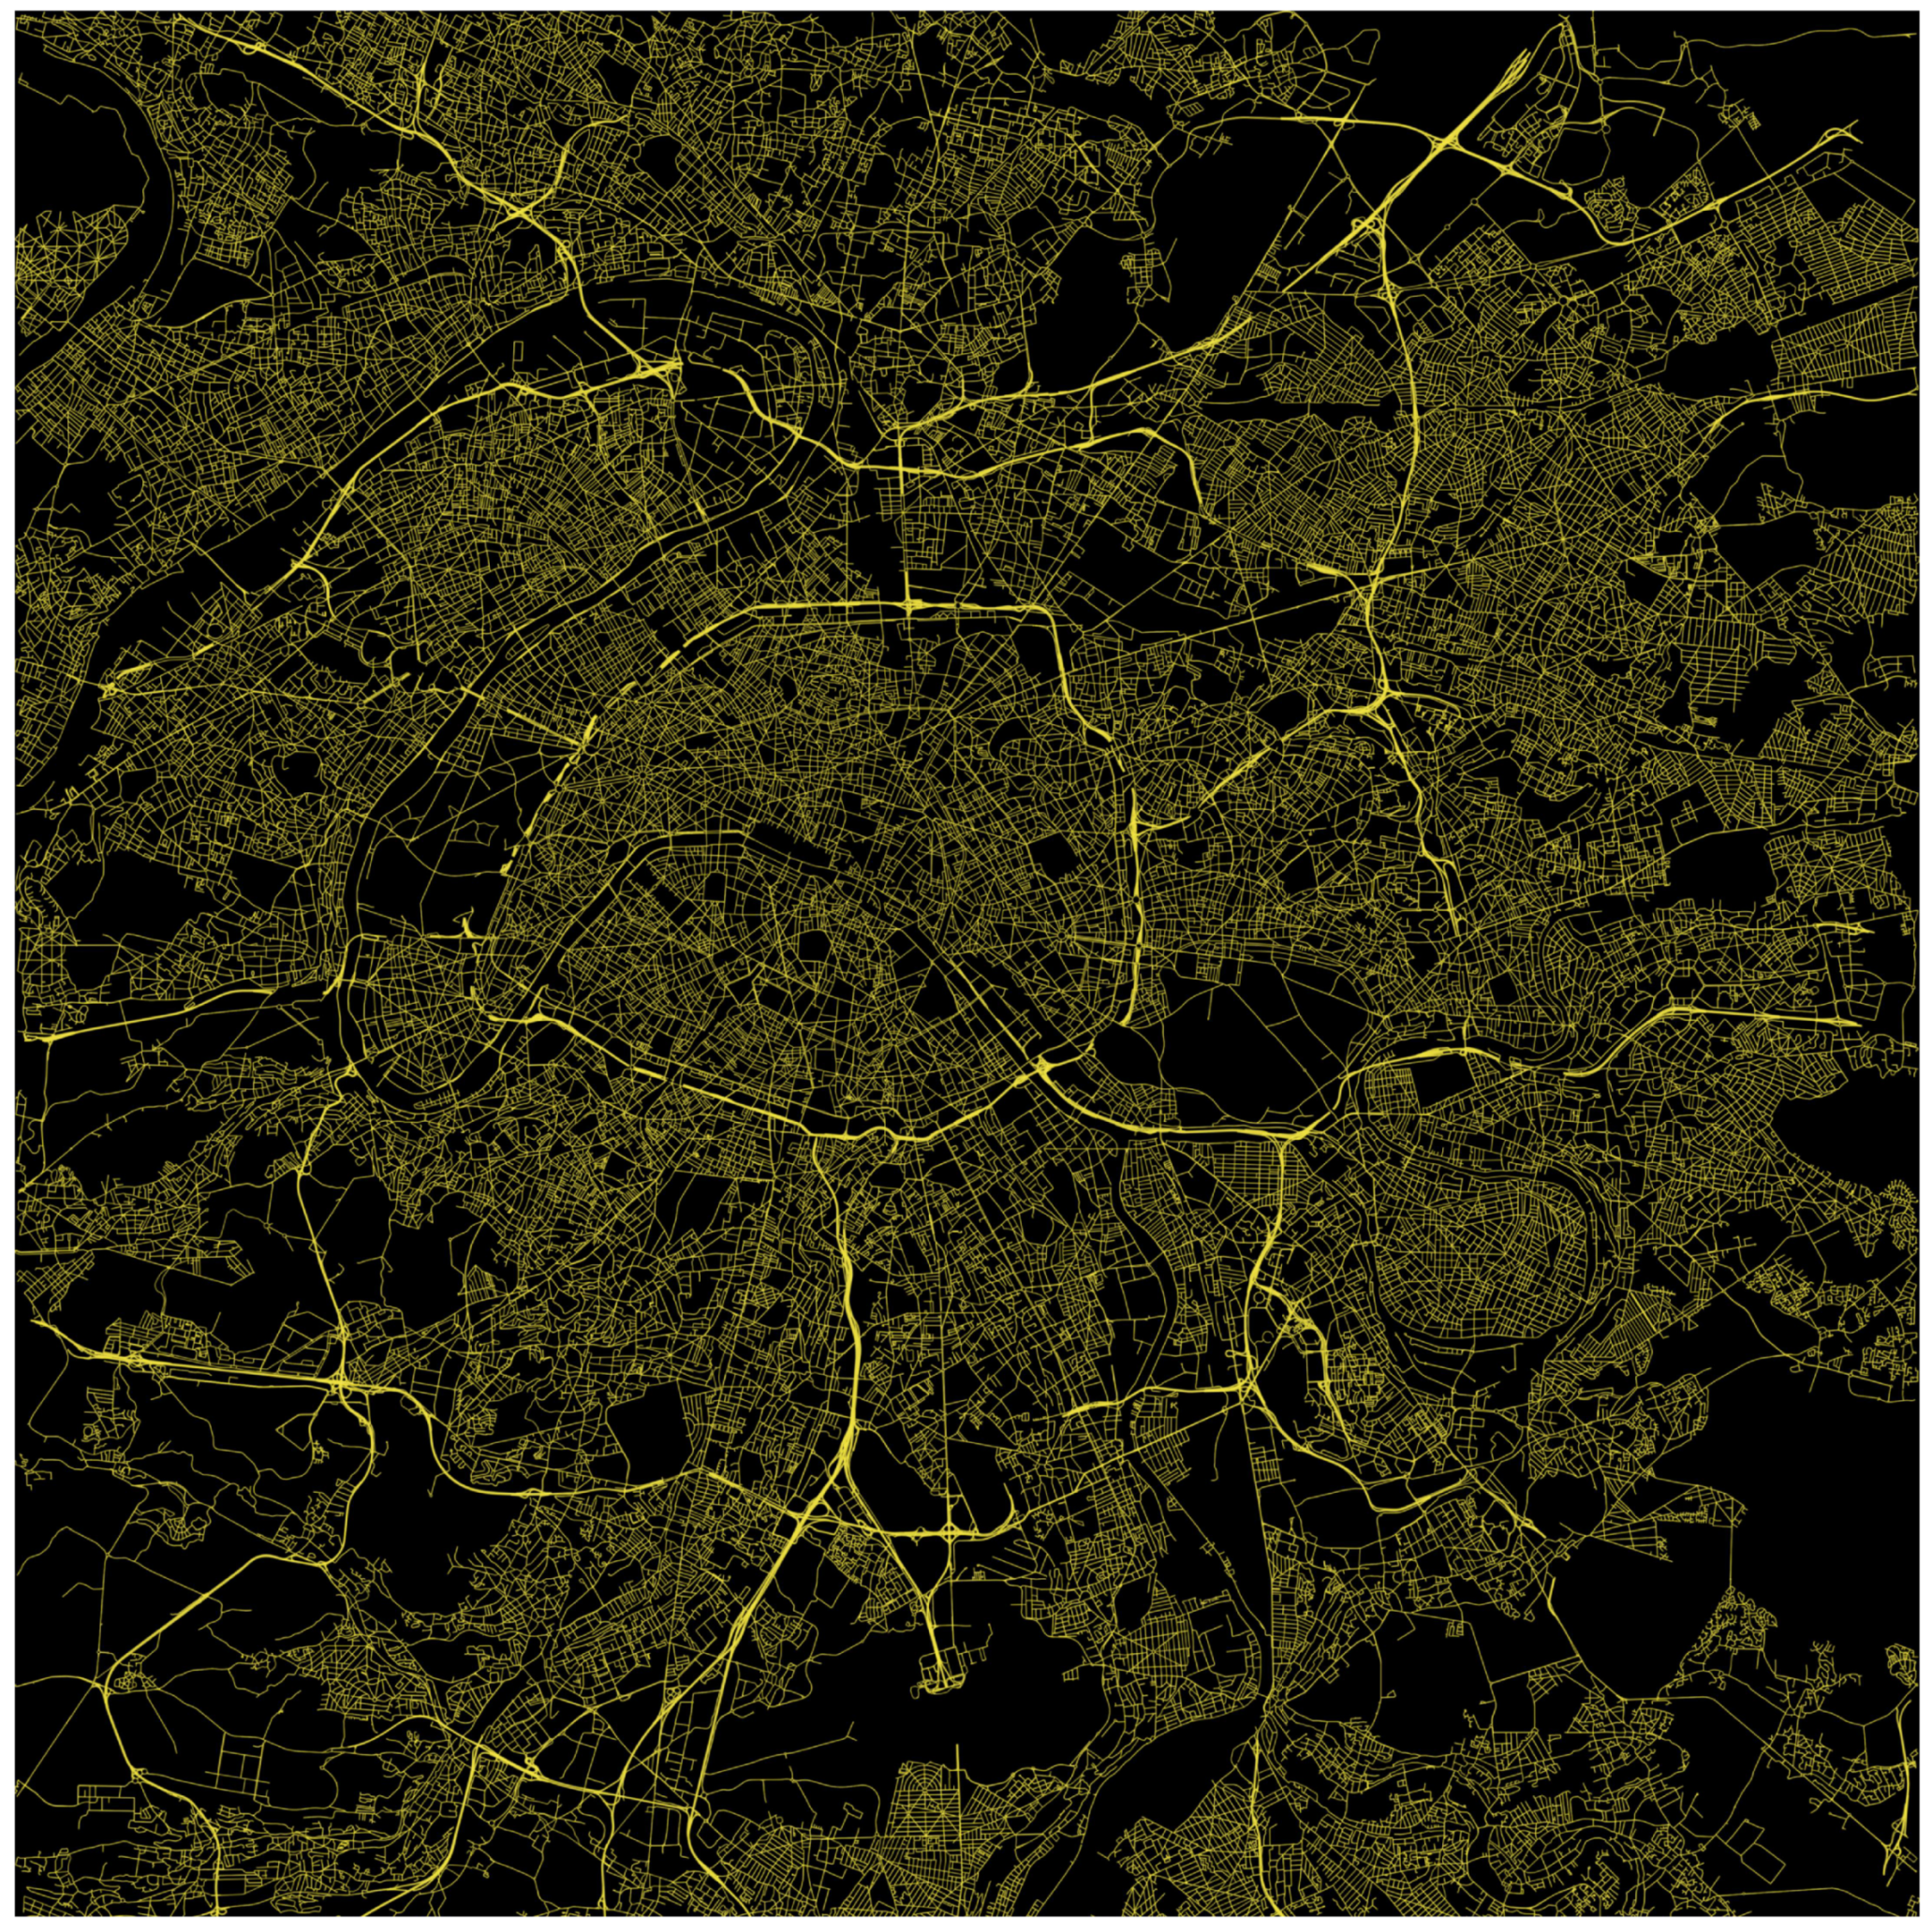
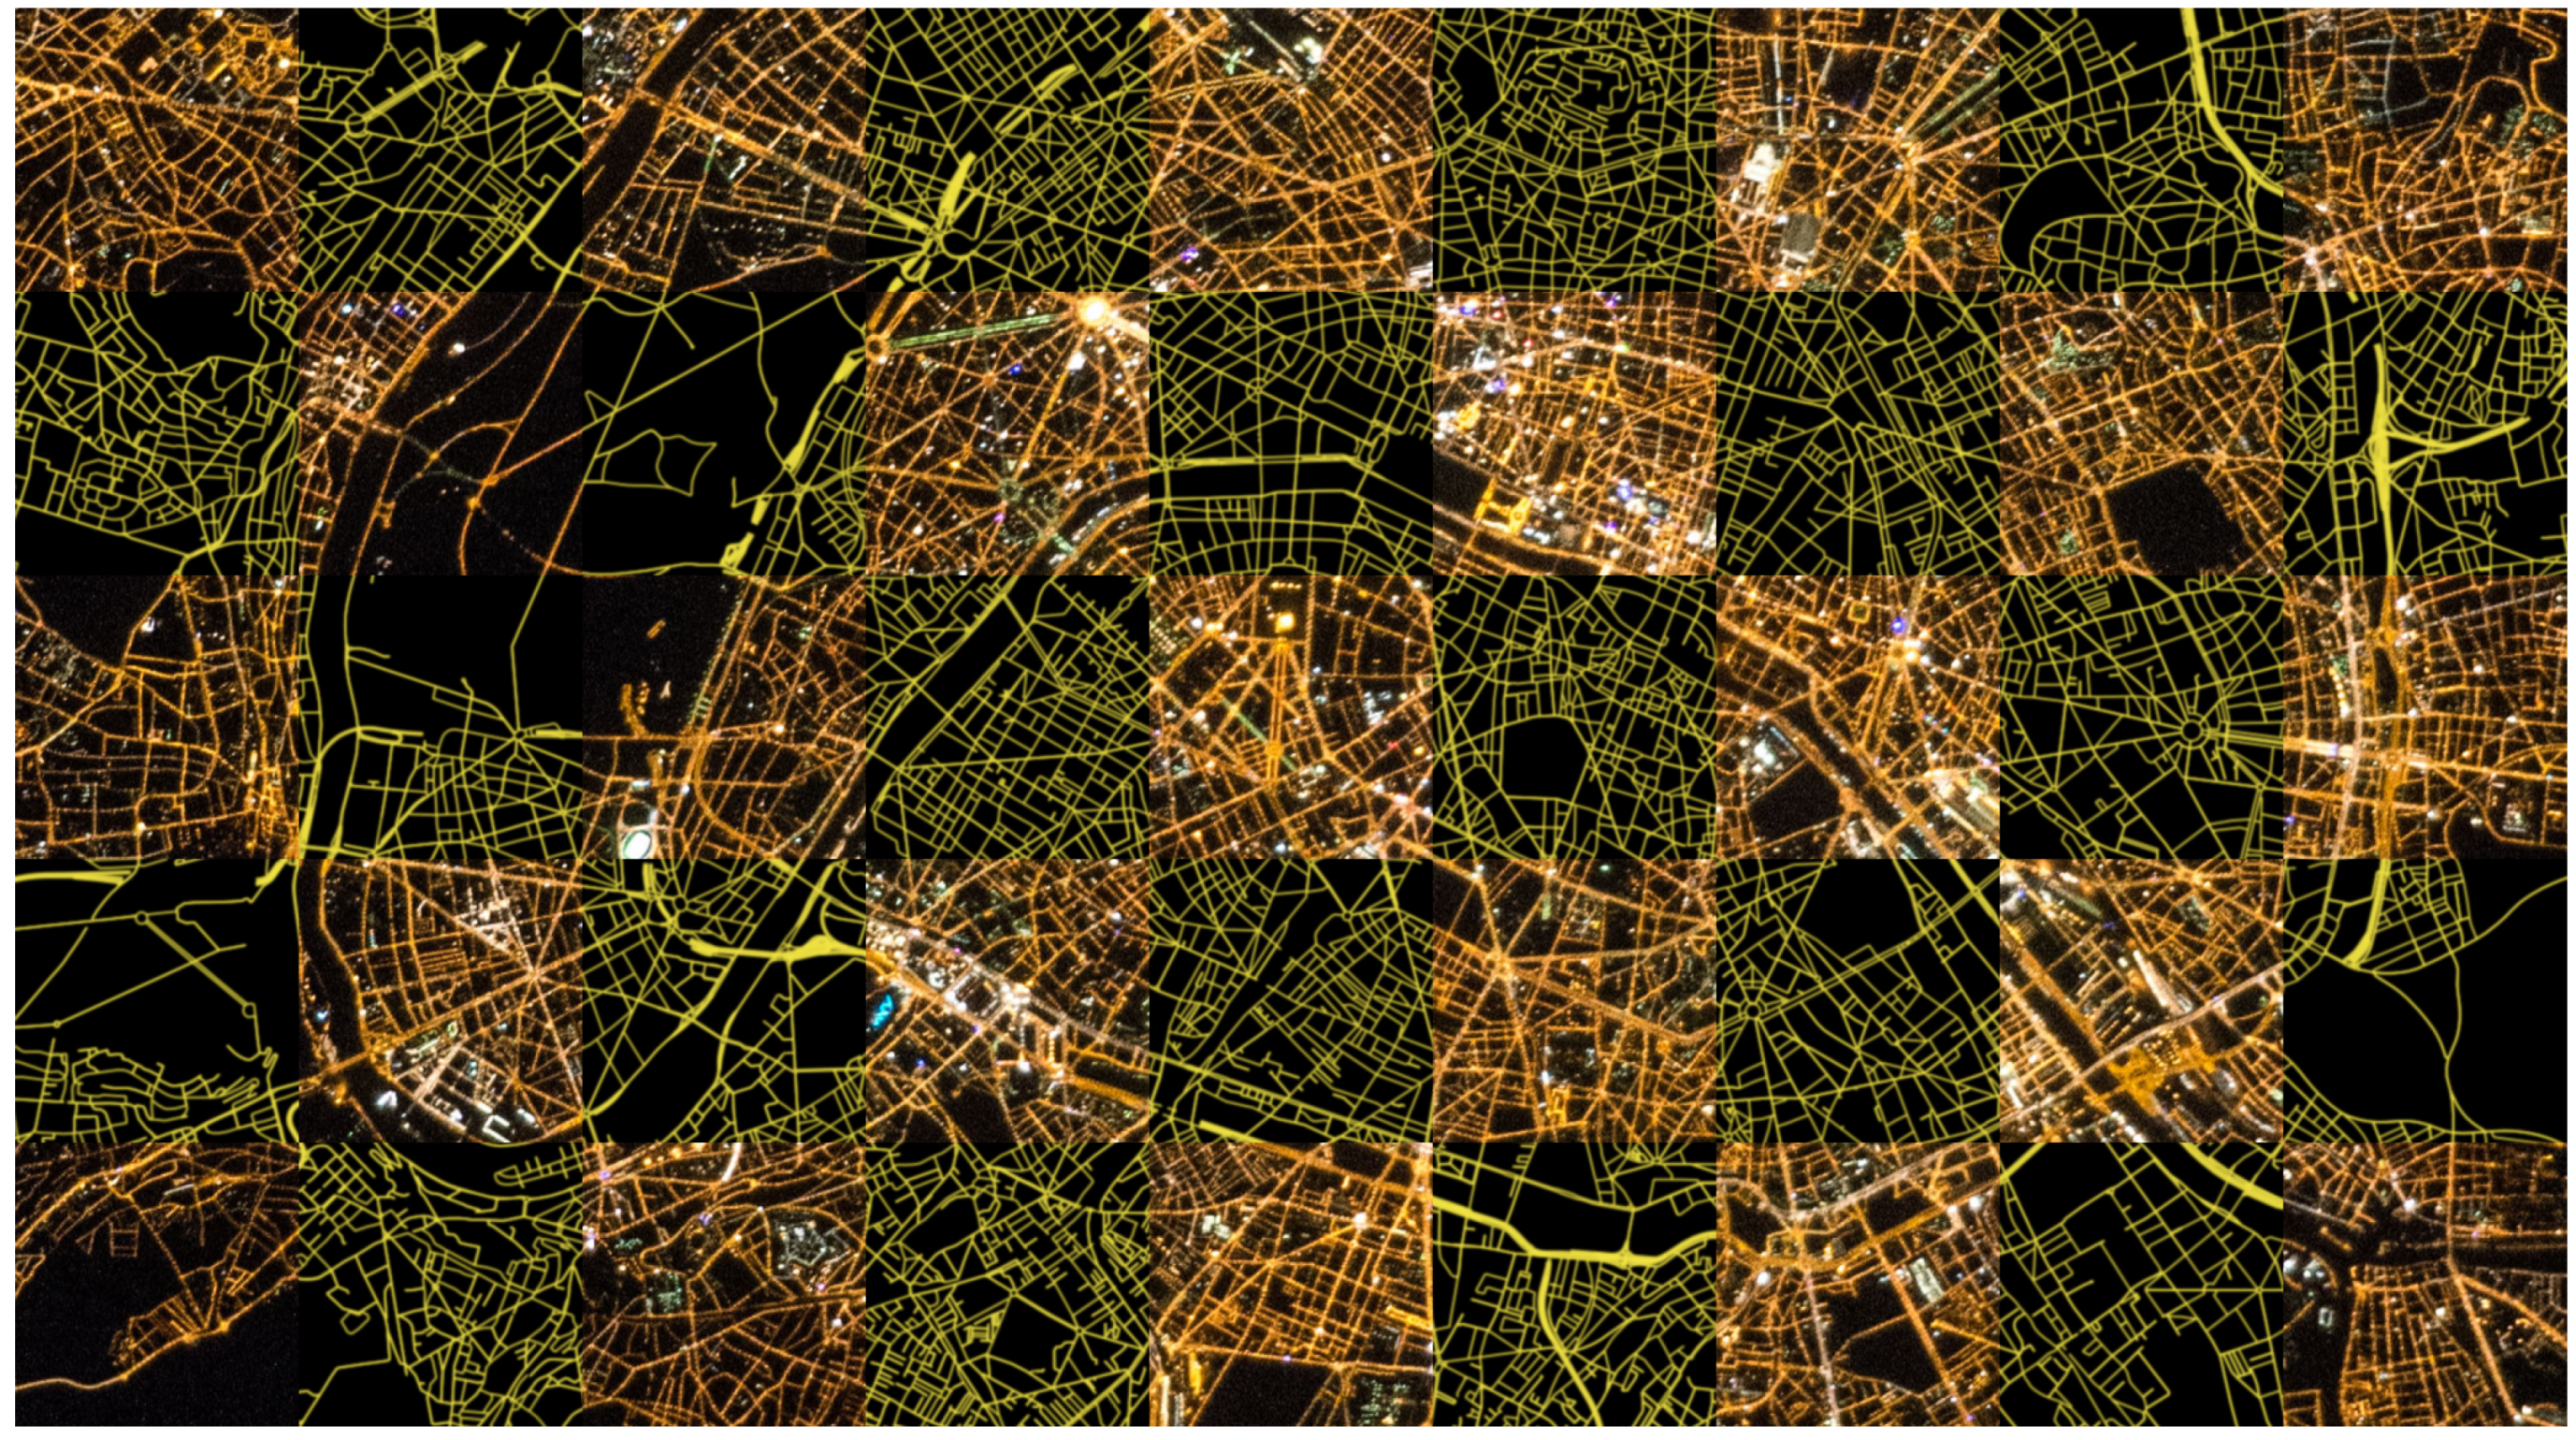
An example of a street network extracted and rasterized using this approach is illustrated for Paris in Figure 3. In Figure 4, a subset of a reference NTL image is displayed together with the original NTL imagery. Here, the similarity of the created reference to the original is clearly observed. Note that the rasterized roads are displayed in yellow to highlight the visual similarity to urban night images. For the following processing steps, the color is not considered, and only one channel is used for matching, as the BRISK detector only works with monochromatic values, not with color information. Furthermore, considering only monochromatic values results in a wider applicable approach.
2.2. BRISK Keypoint Extraction
For the keypoint extraction, Binary Robust Invariant Scalable Keypoints (BRISK) [14] is used. This keypoint detector is notable for its speed and robustness. In [15], an Image Registration Processing Chain for remote sensing daytime images based on BRISK was presented. There, the high accuracy and repeatability of BRISK in remote sensing was proven, while the runtime was often significantly faster compared to other approaches. BRISK was chosen because the BRISK descriptor is well suited for the presented methodology: The BRISK descriptor only contains binary information, meaning it stores only whether the intensity of each location in the descriptor area is higher or lower than that of another location. Considering the BRISK descriptor does not depend on the magnitude of intensity differences, the intensities of the street network in the synthetic reference images do not have to be fine-tuned to match the NTL images, simplifying the reference image generation considerably. Of course, other keypoint detectors (e.g., SIFT [16], SURF [17], ORB [18]) might be considered for this processing step.
In theory, the orientations of the images are not needed, as the original BRISK algorithm is supposed to be rotation invariant. In practice, however, it is observed that matching results improve significantly if the rotation invariance in the BRISK algorithm is deactivated. Instead, to achieve rotation invariance, several orientations of the original NTL imagery are considered because its orientation is unknown. To be more precise, the image is rotated by in 40 steps. The orientation which resulted in the most matches was finally used for the following processing steps. The number of sampling steps was chosen since it doubles the number of the 20 sampling locations on the outermost ring of the BRISK descriptor, see [14].
While this approach of image rotation is significantly slower than using the built-in rotation invariance of BRISK, it resulted in much more matches overall. Of course, if the orientation of the images would be known, the entire method should be executed excluding any rotation invariance, improving the runtime significantly. Since the approximate resolution of the NTL photos is known, the scale invariance feature of BRISK is deactivated, too, to further improve the matching results.
As was explained in Section 2.1, multiple reference tiles are extracted for each NTL image to enable complete automation of the process. A drawback of this method is the computational effort for the keypoint extraction of up to 49 tiles. For a modified and even more operational processing chain, however, it would be possible to generate a database of keypoints extracted from the entire area of interest, maybe even world-wide, in advance. Any future NTL image would then be matched quickly against a subsection of that database. The advantage, however, would be a compact database of reference keypoints compared to an image reference database and rapid georeferencing of all future NTL images matched against this database.
As BRISK works with monochromatic images, only the red band of the NTL images was used for keypoint extraction. This band was chosen, as it typically has the highest contrast out of the available bands. For this work, the keypoint extraction was also tested using the two other bands, as well as the mean and the maximum value of all the available bands. In all cases, no significant differences compared to simply using the red band was observed.
2.3. Keypoint Matching and Outlier Removal
To identify correspondences for the extracted BRISK keypoints, the locality-sensitive hashing (LSH) algorithm in the publicly available Fast Library for Approximate Nearest Neighbors (FLANN) is used [19]. Using LSH, for each keypoint in the NTL image, the two matches in the reference image with the smallest Hamming distance are determined. Only if the ratio of the Hamming distances between these two matching candidates is below 0.7, a match is accepted. The ratio of 0.7 typically eliminates more than 95% of the incorrect matches and less than 10% of the correct matches [16]. Finally, outliers within the matched keypoints are filtered out using RANSAC (RANdom SAmple Consensus). RANSAC iteratively fits an affine transformation to a subset of three randomly selected matches. Each iteration, the determined fit is applied to all the remaining matches, and their deviation from the actual measured keypoint locations is determined. All matches with a displacement lower than the threshold of 15 px are assumed to be matching inliers. The fitted transformation with most inliers is finally used to remove the matching outliers. For more details on RANSAC, see [20]. The entire matching and outlier removal procedure described above is repeated for all of the 49 reference tiles and 40 rotations. The combination with most matches is then used for further processing.
While the used matching procedure is strongly based on the Image Registration Processing Chain in [15], there is one notable difference. Instead of a sensor model-based RANSAC implementation for the outlier removal, an affine transformation-based RANSAC implementation is used here. This is necessary, as a highly accurate sensor model for the original NTL imagery is not available for the camera models.
Affine transformations are estimable using only three tie points (six dimensions) but already account for the major transformations, namely, translation (two dimensions) and rotation (one dimension), as the attitude is unknown, as well as tilting (one dimension) and scale (two dimensions), as the orbit and sensor geometry are not precisely known. However, some remaining minor transformations are accounted for by the threshold of 15 px. These are especially the precision of the matching (at most 2 px), the differences in the geolocation within the reference NTL image (at most 15 m; 2 px), the geometric distortions in the sensor within the original NTL imagery (at most 2 px), and the not considered changes in terrain elevation within the images (e.g., change of 75 m viewed at 400 km and results in differences in the geolocation of at most 62.9 m; 9 px).
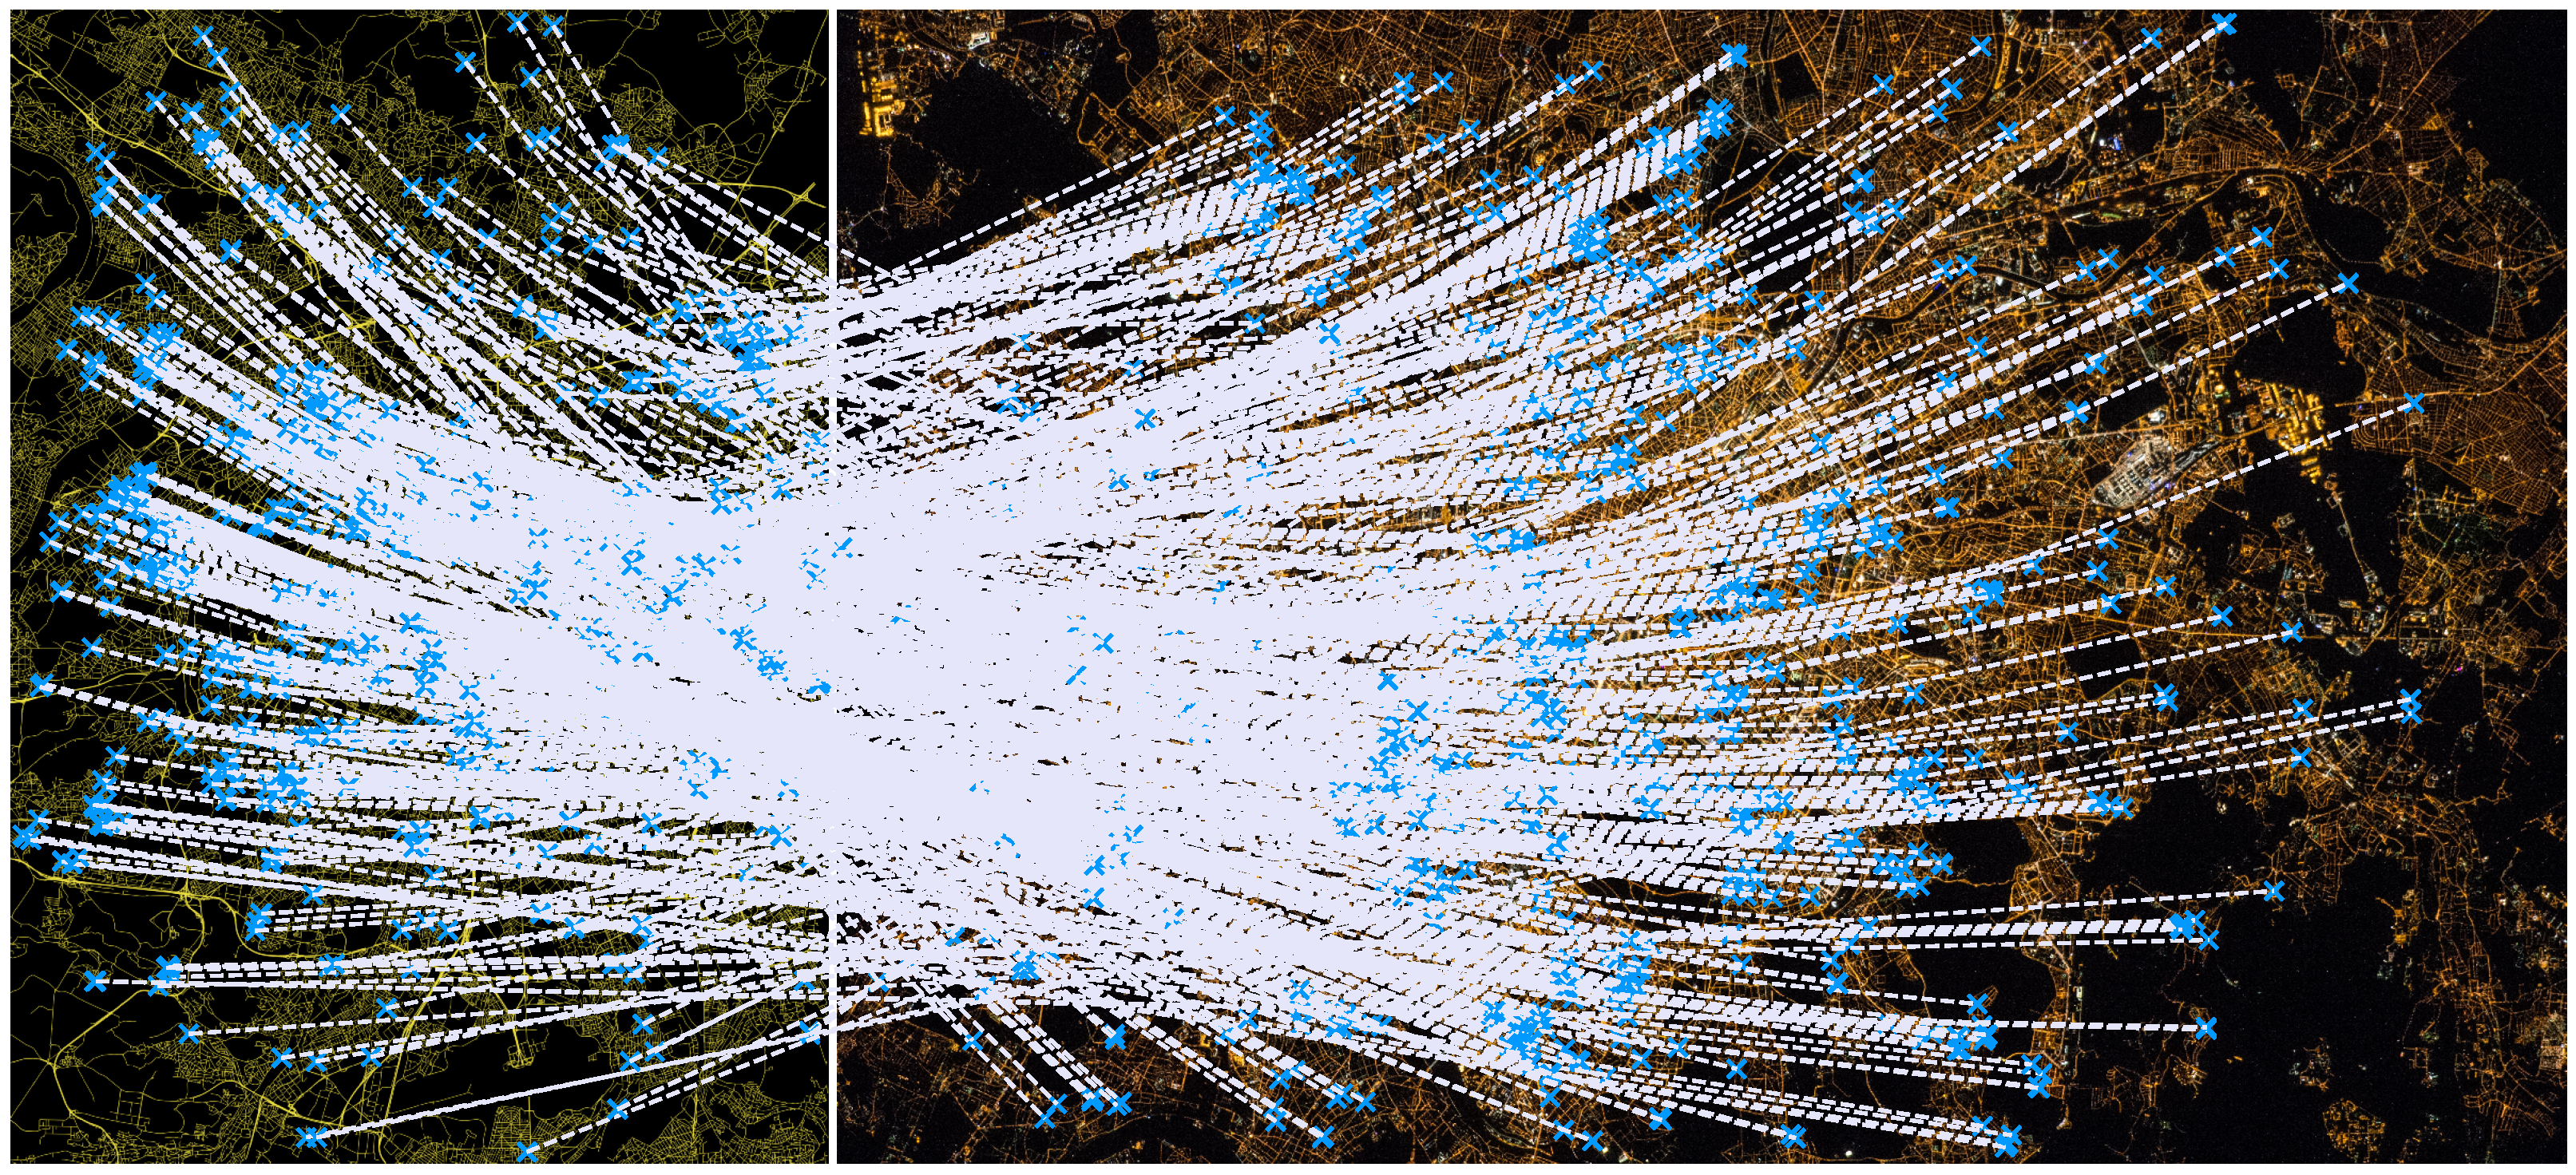
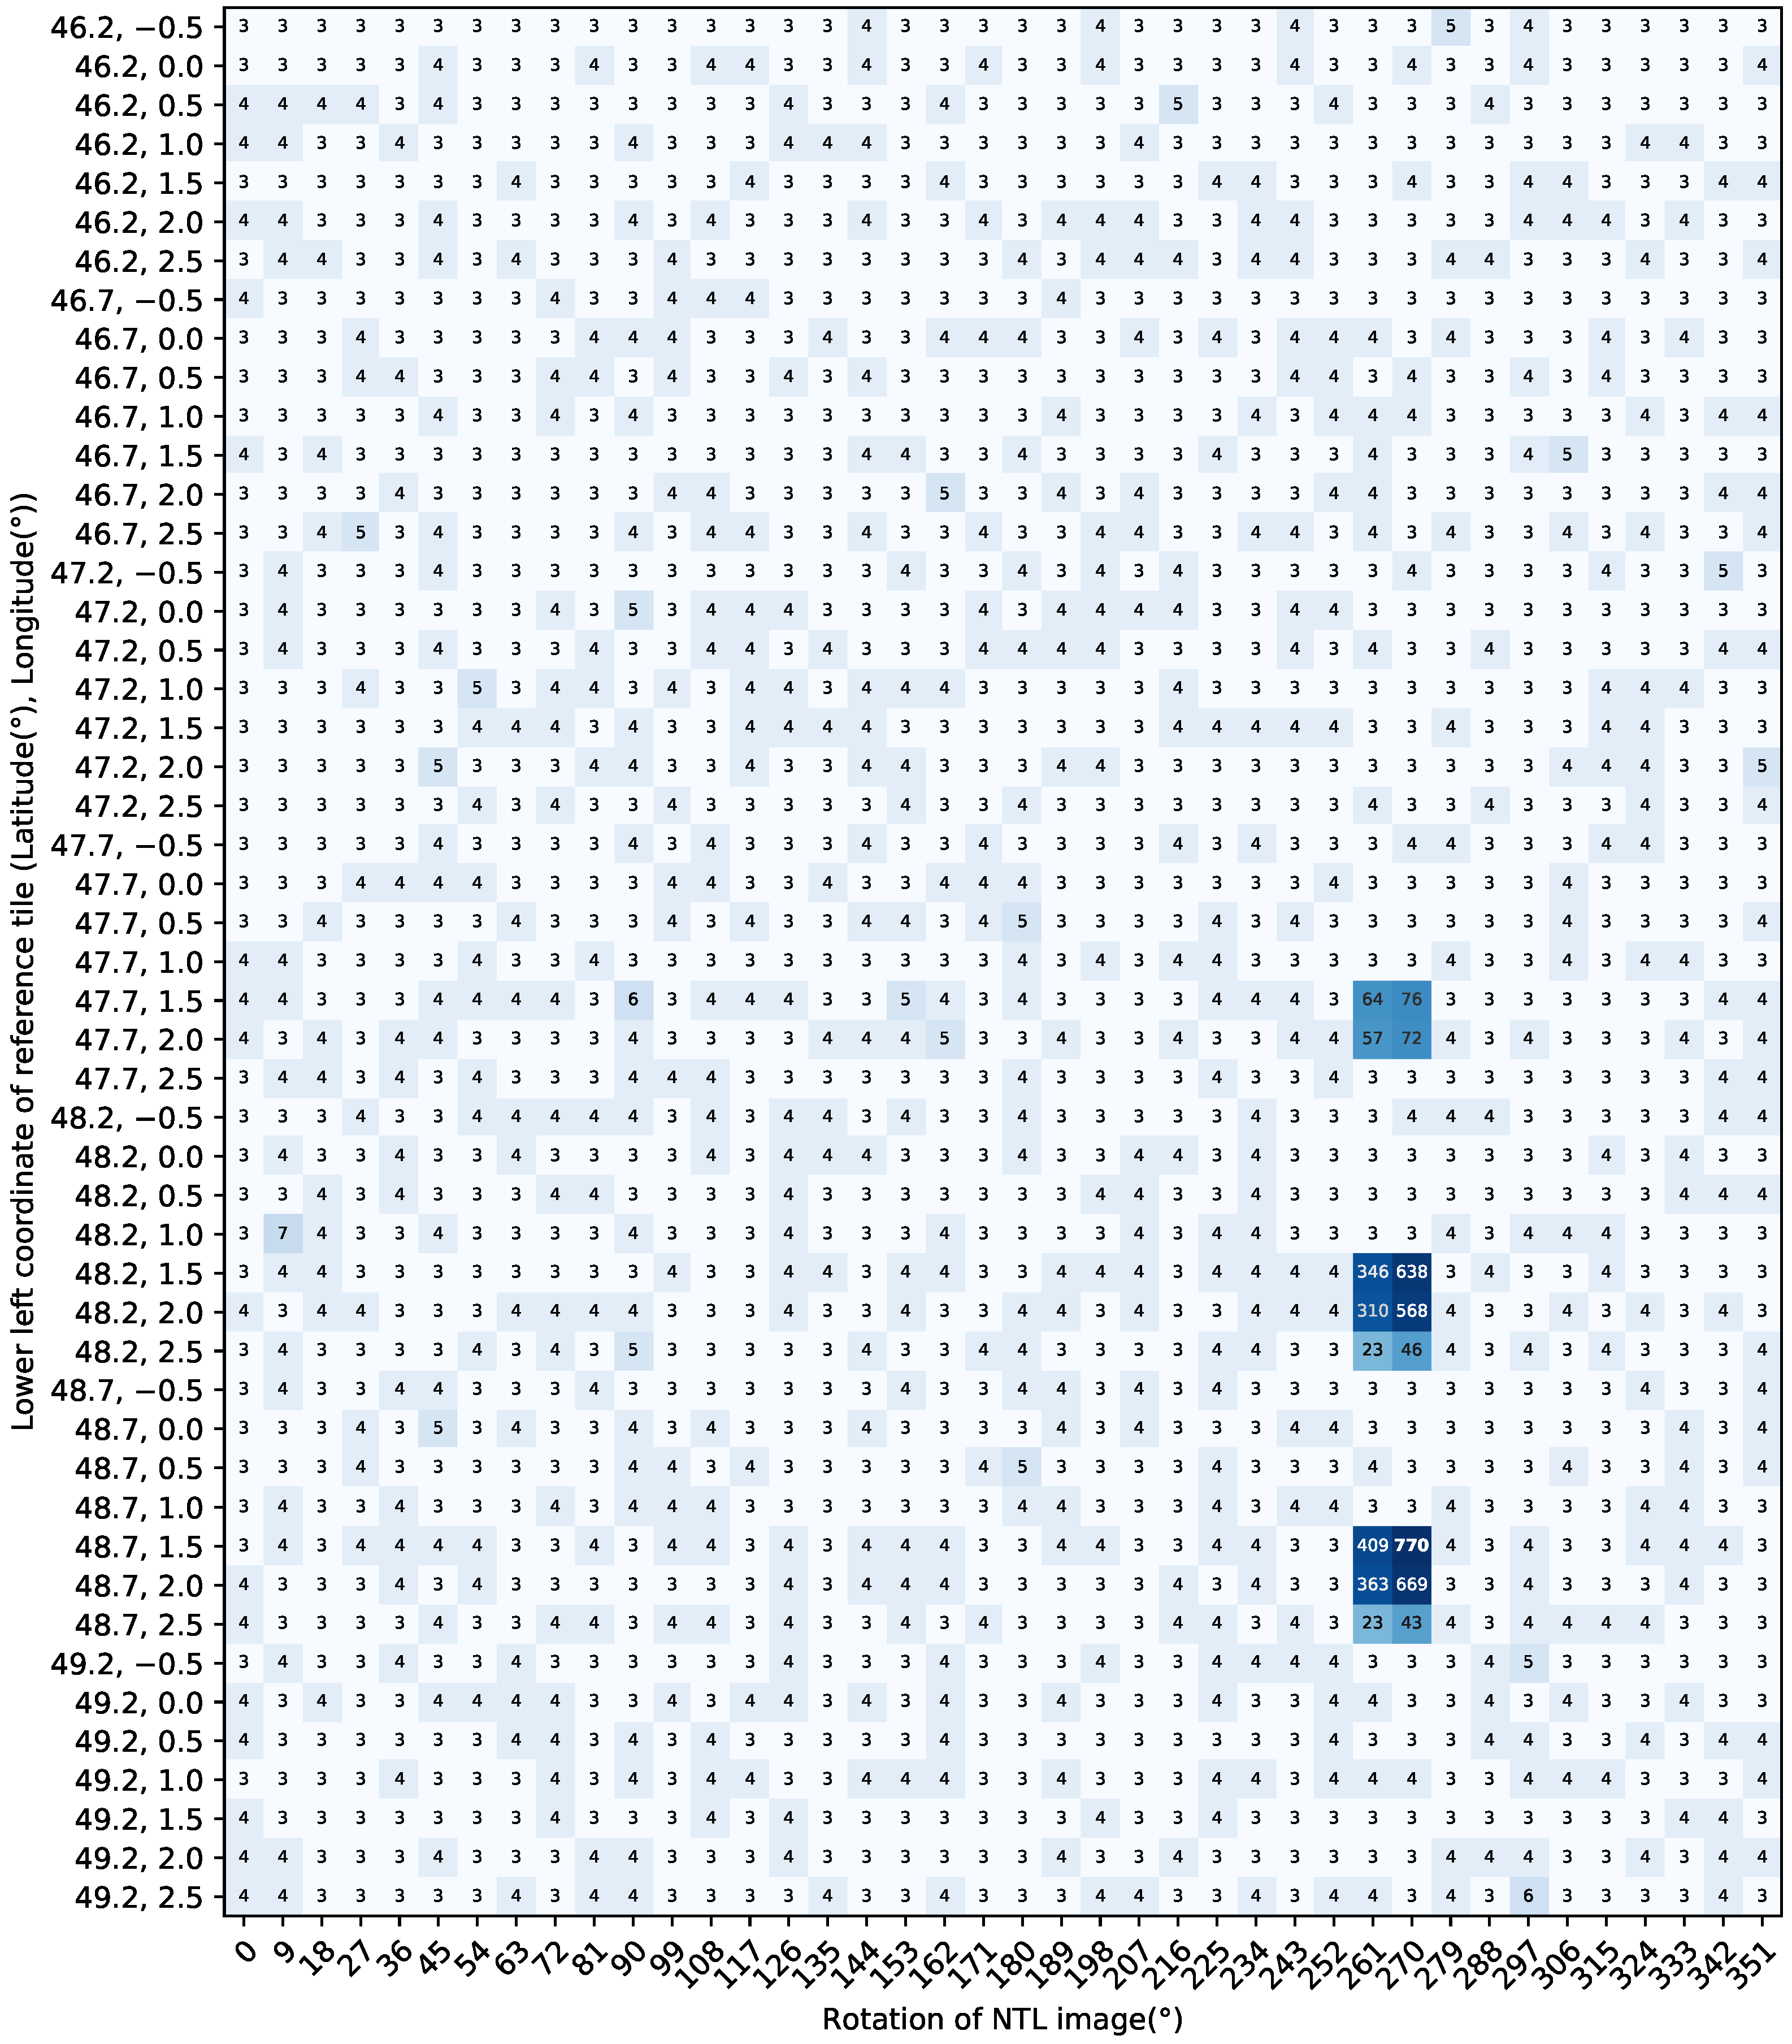
An example for BRISK matches obtained for a NTL photo and a simulated reference NTL image is illustrated in Figure 5. The matching results for all 1960 combinations of tiles and rotations are plotted in Figure 6. It is observed that combinations which are not matched successfully rarely have more than five remaining matches after the outlier removal. Apart from the low number of matches, the parameters of the affine model determined by RANSAC might also be used to decide whether a tile was matched successfully at a given rotation or not, as these are often nonsensical for mismatched tiles. For the datasets used in this article, it was, however, sufficient to simply proceed with the combination of tile and rotation resulting in the most matches. For the Paris dataset, that was the tile with the lower left coordinates at Latitude and Longitude, where 770 matches were obtained.
2.4. Original Imagery Rectification
Based on the robustly selected consistent tie points based on affine transformations, polynomial transformations are estimable using six tie points (12 dimensions), which allow us to account also for some minor transformations compared to affine transformations: for example, geometric distortions in the sensor and the not considered changes in terrain elevation within the image. Rectifying the image is straightforward. First, a quadratic polynomial (Equations (1) and (2)) is fitted to the keypoint matches:
Here, row and col are the keypoint coordinates in the reference and NTL image, respectively, while and are the coefficients determined by the fit. Next, the resulting coefficients are used to rectify the NTL image onto the reference image. It should be mentioned that a polynomial transformation is used here because only limited information about the sensor model is available. With a more detailed sensor model, orbit, and attitude information, a more sophisticated rectification approach, optionally including a digital elevation model, is possible. Such a more rigorous approach will further improve the overall geolocation accuracy.
3. Evaluation
To evaluate the presented methodology, eight Sentinel-2 Level 1C products were selected as ground-truth, and the geometric accuracy of the processed NTL images was compared against these references. The details of the evaluation approach, the used datasets and the achieved results are presented hereafter.
3.1. Evaluation Approach
To determine the geometric accuracy of the images rectified using the presented method, it was decided to use Sentinel-2 images as an independent ground-truth. That way, not just the relative accuracy between OSM and the NTL images is evaluated but, instead, the absolute accuracy of the entire method. As Sentinel-2 has a reported absolute accuracy of ~11 m [21] (corresponding to 0.6–2.4 px for the considered NTL images), it is a reasonable choice as an absolute ground-truth for this evaluation.
An overview of the evaluation methodology is shown in Figure 7. First, the selected NTL images were matched manually against the corresponding Sentinel-2 images. Here, for each pair of NTL and Sentinel-2 images, ten evenly distributed ground control points (GCPs) were matched; see Figure 8 for an example.
Next, the NTL images were matched and rectified as described in Section 2. The point correspondences located in the NTL images were rectified using the polynomial transformation, and the resulting coordinates were compared to the corresponding GCPs coordinates, see Figure 9 for an example for visual inspection.
3.2. Datasets
Nine exemplary datasets were selected to test the presented rectification methodology, see Table 1. The focus was laid on urban centers, featuring large, well-illuminated street networks. Datasets from different cultural areas with different evolution of urban areas were used. In addition to that, the chosen NTL images were acquired with different models, different focal lengths, and different tilt angles to test the robustness of the approach and over a large range of eleven years to test if matching less up-to-date NTL images against a more up-to-date street database would pose challenges.
- Paris
- The Paris dataset (see Figure 1) is regarded as the optimal dataset for this methodology. With a spatial resolution of ~7.6 m, a visual interpretation indicates a well-defined and easily recognizable street network.
- Berlin
- Even though the Berlin dataset only has a slightly lower spatial resolution of ~8.7 m than the Paris dataset, it features a much more blurry street network, which is expected to make it more difficult to identify point matches with the reference NTL image. An interesting aspect of this dataset is the fact that, for historic reasons, two different types of street lamps are used in Berlin. In West Berlin, fluorescent and mercury vapor lamps are emitting white light. The lamps in East Berlin, on the other hand, mostly use sodium vapor, resulting in light with a yellow hue, see [22].
- Milan
- The two datasets selected from Milan offer the opportunity to study the influence of the lighting type on the presented methodology. The first image, acquired in March 2012, features street lighting almost exclusively based on sodium vapor lamps. The second image from April 2015 was acquired after LED lighting was installed in the city center, which features a different radiance in the used NTL imagery. For more details on the change in radiance for these datasets, see [23].
- Vienna
- The dataset from Vienna features a higher tilt angle of 26. This not only results in a slightly lower spatial resolution but also means that the direct view of many of the roads might be obstructed.
- Rome
- The dataset from Rome features a mix of organically grown networks and grid plans. With a smaller tilt angle of 15, it shows well-recognizable streets.
- Harbin
- The dataset from Harbin, acquired in 2021, is one of the most up-to-date datasets. It features a mostly grid plan based street network, typical for modern Asian cities. While this regular pattern might be challenging for the used matching approach, the image features very well-recognizable roads and is expected to be well-suited for keypoint detection.
- Algiers
- The dataset from Algiers features an organically grown street network shaped by the mountainous terrain. For this scene, no tilt angle is provided, but according to the provided ISS position and the manually determined center of the image, it is determined to be be close to nadir view. In some parts of the image, the view is obstructed by clouds, which might impair the matching process.
- Las Vegas
- The dataset from Las Vegas is one of the less up-to-date datasets and is selected to test the limitations of the proposed approach. It is acquired with a shorter focal length of 180 mm and therefore features an estimated spatial resolution of ~26.6 m, which means only major roads are distinguished. In addition to that, the regular street pattern poses an additional challenge for the matching, as it may result in very similar looking descriptors for the selected keypoints.
It is noted that the datasets were hand-picked, selecting images featuring somehow well-recognizable street networks, suitable for matching with a street map. Not all of the astronaut NTL photos available are suitable for the presented method, either because they are too blurry, e.g., due to the movement of clouds or astronauts during acquisition, or because they do not feature well-illuminated street networks, e.g., due to limited urban structures or coarse spatial resolution.
3.3. Results
For all datasets, the number of matches returned by BRISK, before and after outlier filtering using RANSAC, are shown in Table 2 for the combination of reference tile and rotation with a maximal number of filtered matches. In addition to that, the deviations in the remaining matches to the fitted affine transformation are shown together with a plot of the minimum, maximum, mean, and standard deviations of these matches. The minimum and maximum deviations are just included in the table for completeness and are not meaningful in this case. The minimum of 0 px in all cases is a result of the mode of operation of RANSAC, as three of the matches are used to determine the affine transformation itself. The maximum of 15 px is predetermined by the used RANSAC threshold.
The matches remaining after outlier filtering are illustrated in Figure 5 and Figure 10. It is noted that the reference images shown here were reduced to the areas containing matches and rescaled for better visualization. The actual reference images are much bigger and have a spatial resolution similar to the NTL images. A visual inspection of the matches after outlier removal indicates that RANSAC worked without challenges in all tested datasets as no clear mismatches are observable.
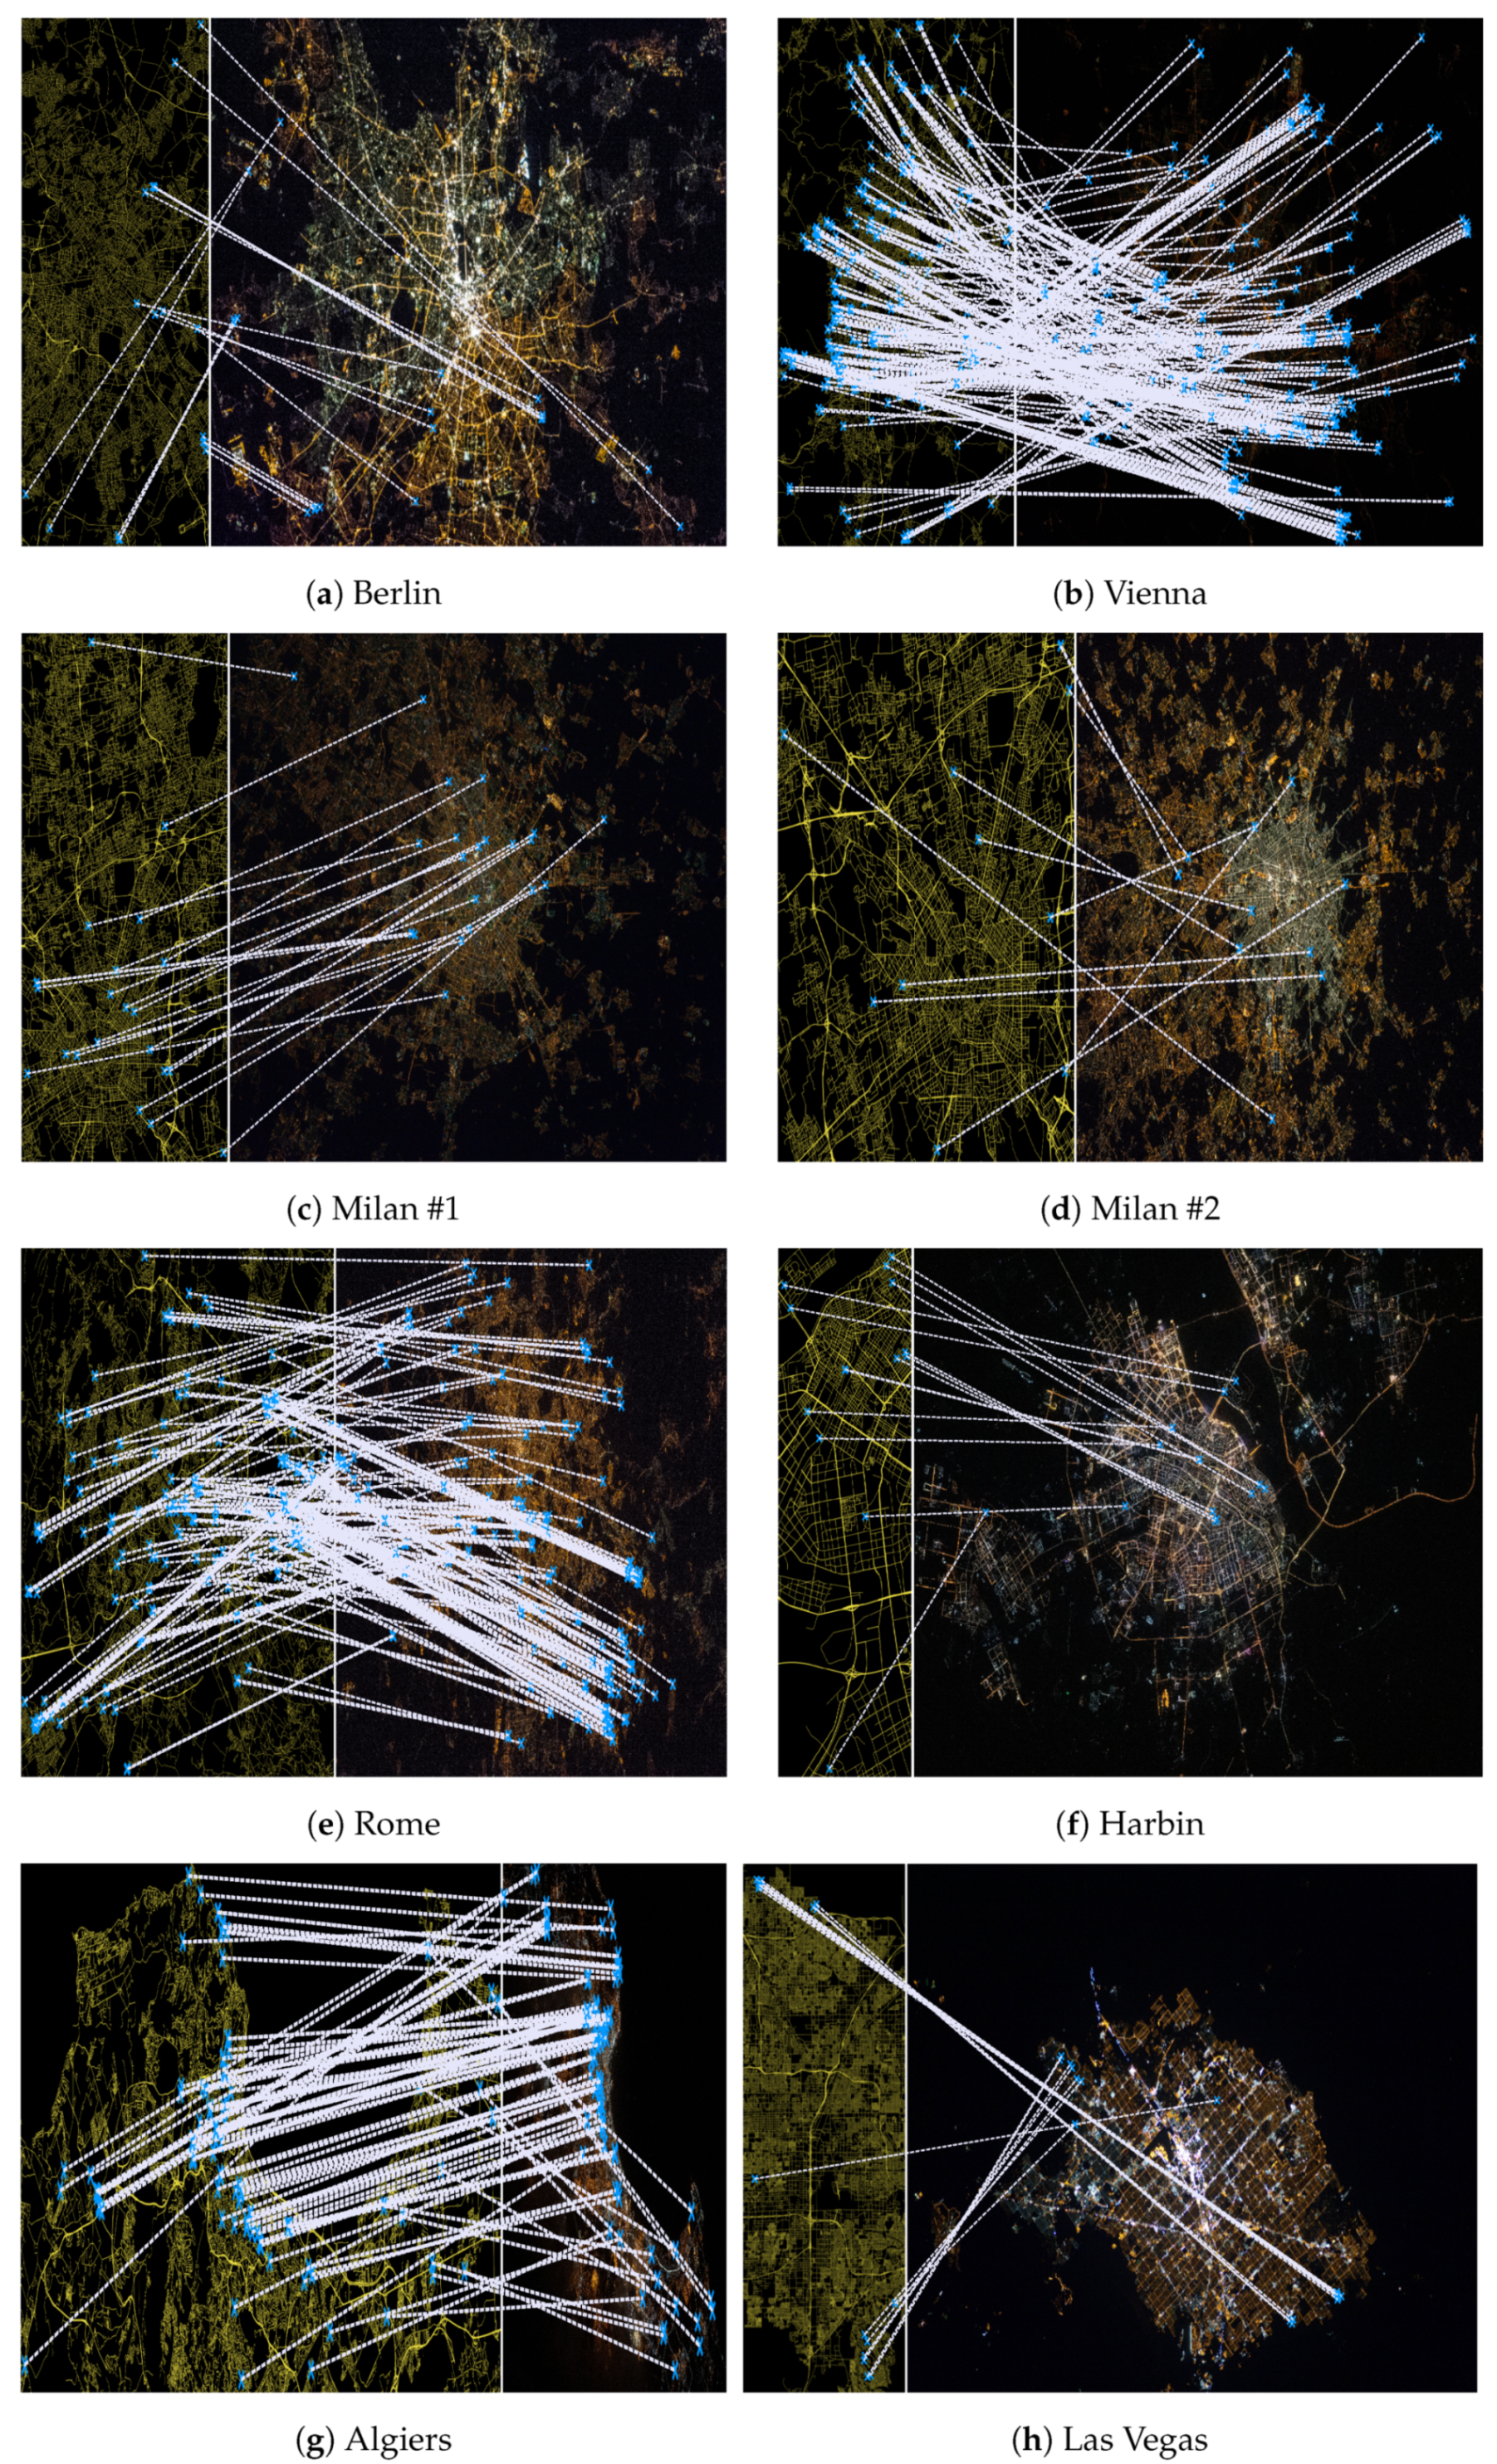
The number of remaining matches after RANSAC varies a lot, ranging from 770 in Paris to 11 in Milan #2. Apart from the dataset from Paris, the datasets from Vienna, Rome and Algiers feature most of the matches. It is noticeable that these are all datasets containing relatively irregular street networks. In Figure 10b,e,g, it is observed that not only the number of matches is more than sufficient for the image rectification but also that the matches are well-distributed over the entire scene.
Contrary to that, in the dataset from Berlin most of the matches are located in the eastern part of the city, which is illuminated using sodium vapor lamps (Figure 10a). In the dataset of Milan #2, a similar clustering of the matches can be observed (Figure 10d). Here, most of the matches are located outside the city center, where LEDs are used for street lighting.
Not only the type of illumination seems to be important for the matching performance. From the relatively low amount and distribution of matches in the datasets from Milan, Harbin and Las Vegas, it is also observed that grid-plan-based street networks are more challenging for the used matching approach. For Las Vegas, the temporal difference between the acquisition of the NTL photo and the OSM reference is also large, and the concerned street network changed in the meantime.
The relatively low maximum deviation of 8.22 px and RMSE of 3.44 px for Las Vegas is a bit misleading, as the matches are not well-distributed over the scene. As is seen in the later evaluation of the absolute accuracy, the RANSAC deviations alone are not usable to determine matching quality. Except for one match, all matches which were found for this dataset are all located on the city borders (Figure 10h). Many of the few matches are clustered on golf courses, which exhibit more irregular road patterns.
For all matched datasets, the absolute rectification accuracy was further evaluated. The results are listed in Table 3, together with a plot of the minimum, maximum, mean and standard deviation of the GCPs.
The GCPs measured in all the datasets have an RMSE ranging from 2.03 px to 6.70 px. Taking into account the different image resolutions, this corresponds to an RMSE of 15.43 m to 140.34 m. The dataset from Paris, for which the highest number of matches was found (see Table 2), also features the lowest RMSE value of 2.03 px. However, the accuracy of the datasets from Milan #1, Milan #2, Vienna, Rome, and Algiers is only slightly worse, with RMSE values of 3.08 px, 3.34 px, 2.52 px, 2.20 px, and 3.40 px, respectively. This indicates that a smaller number of matches is already sufficient to achieve accuracies comparable to the dataset from Paris.
The datasets from Berlin, Harbin, and Las Vegas exhibit a slightly lower accuracy with RMSE values of 4.85 px, 6.70 px, and 5.28 px, respectively. This is explained by the fact that the found matches are not well-distributed over the images, see Figure 10a,f,h. The GCP measured close to these matches have a relatively high accuracy, while those further away are less accurate.
4. Conclusions
An automatic processing approach for the georeferencing of high-resolution NTL images was presented for urban centers. The results based on all processed datasets show that, using street networks extracted for example from OpenStreetMap, point matches with NTL images are identified and used to rectify the images. For suitable imagery, accuracies of approximately 2 px are achieved, while for more challenging images, accuracies no worse than 7 px were measured.
The results show that the matching algorithm performance strongly depends on the scene content. Almost all of the matches found in the Berlin dataset are located in the eastern part of the city. It is only speculated that the light emitted from the sodium vapor lamps results in better recognizable contours in the NTL imagery and is therefore more suitable for matching. This theory is further substantiated by the comparison of the Milan scenes, where the installation of LEDs in the city center has lead to a significant reduction in found matches. In the datasets from Las Vegas and Milan, most matches were found outside of the city centers, which are dominated by grid plan street networks. For such kind of street networks, the used matching scheme is less than ideal. The assumption that the Hamming distance of the closest match is significantly better than the distance of the second-closest match does not hold in this case, as most road crossings look identical in a grid plan. Nevertheless, the fact that the Las Vegas dataset, which also features a rather low spatial resolution of 26.6 m, is still matched to the OSM reference highlights the robustness of the presented algorithm.
There is no general statement about the accuracy of OSM data in literature, only for some local regions. Therefore, the accuracy evaluation using Sentinel-2 as an independent reference also serves as an independent assessment of the OSM data accuracy. Fortunately, the achieved accuracies indicate that OSM is usable as a reliable reference, at least for major metropolitan areas. Of course, it would also be possible to use other, comparable street databases as a matching reference, for example, roads directly extacted from daytime imagery such as from Sentinel-2 imagery [24].
For an operational processing chain, tailored for a dedicated nighttime satellite mission, the significant improvements in the performance of the presented approach are straight forward. Unlike for the astronaut photos used in this work, a detailed sensor model as well as attitude and orbit information would be included in the processing. Such additional data would enable bringing the images to the same scale, rotation and coarse location before matching. This would improve the matching performance significantly. Using the sensor model and a digital elevation model, a precise orthorectification is performable based on the found matches, which would further improve the geolocation accuracy of the presented method.
This work focused on urban areas, first of all because these are the most promising for the presented methodology, but also because most of the high-resolution NTL imagery available on the Gateway to astronaut photography of Earth is focused on cities. Of course, it would also be relevant to test and adapt the presented approach on more challenging, less illuminated rural areas. Furthermore, towards a fully automatic operational processing chain, more and more challenging scenarios, such as the effect of clouds, should be exercised in the future.
Author Contributions
Software, P.S.; Writing—original draft, P.S.; Writing—review & editing, T.S. All authors have read and agreed to the published version of the manuscript.
Funding
This research received no external funding.
Data Availability Statement
The NTL imagery used in this work was downloaded from https://eol.jsc.nasa.gov (accessed on 18 March 2022). The street network maps were downloaded from https://www.openstreetmap.org (accessed on 30 March 2022). The Sentinel-2 references were downloaded from https://scihub.copernicus.eu (accessed on 11 April 2022). The datasets generated during this study are available from the corresponding author on reasonable request.
Acknowledgments
Concerning astronaut photography: Image courtesy of the Earth Science and Remote Sensing Unit, NASA Johnson Space Center. Concerning OpenStreetMap data: Map data copyrighted OpenStreetMap contributors. Concerning Copernicus Sentinel-2 products: Image courtesy of the European Space Agency (ESA).
Conflicts of Interest
The authors declare no conflict of interest.
References
- Claverie, M.; Ju, J.; Masek, J.G.; Dungan, J.L.; Vermote, E.F.; Roger, J.C.; Skakun, S.V.; Justice, C. The Harmonized Landsat and Sentinel-2 Surface Reflectance Data Set. Remote Sens. Environ. 2018, 219, 145–161. [Google Scholar] [CrossRef]
- Elvidge, C.D.; Baugh, K.; Zhizhin, M.; Hsu, F.C.; Ghosh, T. VIIRS Night-Time Lights. Int. J. Remote Sens. 2017, 38, 5860–5879. [Google Scholar] [CrossRef]
- Sánchez de Miguel, A.; Kyba, C.C.M.; Aubé, M.; Zamorano, J.; Cardiel, N.; Tapia, C.; Bennie, J.; Gaston, K.J. Colour Remote Sensing of the Impact of Artificial Light at Night (I): The Potential of the International Space Station and Other DSLR-based Platforms. Remote Sens. Environ. 2019, 224, 92–103. [Google Scholar] [CrossRef]
- Sánchez de Miguel, A.; Zamorano, J.; Aubé, M.; Bennie, J.; Gallego, J.; Ocaña, F.; Pettit, D.R.; Stefanov, W.L.; Gaston, K.J. Colour Remote Sensing of the Impact of Artificial Light at Night (II): Calibration of DSLR-based Images from the International Space Station. Remote Sens. Environ. 2021, 264, 112611. [Google Scholar] [CrossRef]
- Ghosh, T.; Hsu, F. Advances in Remote Sensing with Nighttime Lights (Special Issue). Remote Sens. 2019, 11, 2194. [Google Scholar]
- Sánchez de Miguel, A.; Gomez Castaño, J.; Lombraña, D.; Zamorano, J.; Gallego, J. Cities at Night: Citizens Science to Rescue an Archive for the Science. IAU Gen. Assem. 2015, 29, 2251113. [Google Scholar]
- Müller, R.; Lehner, M.; Müller, R.; Reinartz, P.; Schroeder, M.; Vollmer, B. A Program for Direct Georeferencing of Airborne and Spaceborne Line Scanner Images. In Proceedings of the Proceedings of ISPRS Commission I Symposium, Hyderabad, India, 3–6 December 2002; pp. 148–153. [Google Scholar]
- Wang, W.; Cao, C.; Bai, Y.; Blonski, S.; Schull, M.A. Assessment of the NOAA S-NPP VIIRS Geolocation Reprocessing Improvements. Remote Sens. 2017, 9, 974. [Google Scholar] [CrossRef] [Green Version]
- Mooney, P.; Minghini, M. A Review of OpenStreetMap Data. In Mapping and the Citizen Sensor; Ubiquity Press: London, UK, 2017. [Google Scholar]
- Canavosio-Zuzelski, R.; Agouris, P.; Doucette, P. A Photogrammetric Approach for Assessing Positional Accuracy of OpenStreetMap Roads. ISPRS Int. J. Geo-Inf. 2013, 2, 276–301. [Google Scholar] [CrossRef]
- Haklay, M. How Good is Volunteered Geographical Information? A Comparative Study of OpenStreetMap and Ordnance Survey Datasets. Environ. Plann. B Plann. Des. 2010, 37, 682–703. [Google Scholar] [CrossRef] [Green Version]
- Boeing, G. OSMnx: New Methods for Acquiring, Constructing, Analyzing, and Visualizing Complex Street Networks. Comput. Environ. Urban Syst. 2017, 65, 126–139. [Google Scholar] [CrossRef] [Green Version]
- United Nations Centre for Human Settlements (Habitat). The Relevance of Street Patterns and Public Space in Urban Areas; UN: Nairobi, Kenya, 2013. [Google Scholar]
- Leutenegger, S.; Chli, M.; Siegwart, R.Y. BRISK: Binary Robust Invariant Scalable Keypoints. In Proceedings of the 2011 IEEE International Conference on Computer Vision (ICCV), Barcelona, Spain, 6–13 November 2011; pp. 2548–2555. [Google Scholar]
- Schwind, P.; d’Angelo, P. Evaluating the Applicability of BRISK for the Geometric Registration of Remote Sensing Images. Remote Sens. Lett. 2015, 6, 677–686. [Google Scholar] [CrossRef] [Green Version]
- Lowe, D.G. Distinctive Image Features from Scale-Invariant Keypoints. Int. J. Comput. Vis. 2004, 60, 91110. [Google Scholar] [CrossRef]
- Bay, H.; Tuytelaars, T.; Van Gool, L. SURF: Speeded Up Robust Features. In Computer Vision–ECCV 2006; Springer: Berlin/Heidelberg, Germany, 2006; pp. 404–417. [Google Scholar]
- Rublee, E.; Rabaud, V.; Konolige, K.; Bradski, G. ORB: An efficient alternative to SIFT or SURF. In Proceedings of the 2011 IEEE International Conference on IEEE Computer Vision (ICCV), Barcelona, Spain, 6–13 November 2011; pp. 2564–2571. [Google Scholar]
- Muja, M.; Lowe, D.G. Fast Approximate Nearest Neighbors with Automatic Algorithm Configuration. In Proceedings of the International Conference on Computer Vision Theory and Application 2009 (VISSAPP), Lisboa, Portugal, 5–8 February 2009; pp. 331–340. [Google Scholar]
- Fischler, M.A.; Bolles, R.C. Random Sample Consensus: A Paradigm for Model Fitting with Applications to Image Analysis and Automated Cartography. Commun. ACM 1981, 24, 381–395. [Google Scholar] [CrossRef]
- Clerc, S.; Team, M. Sentinel-2 L1C Data Quality Report; Technical Report; ESA: Paris, France, 2020. [Google Scholar]
- Levin, N.; Kyba, C.C.M.; Zhang, Q.; Sánchez de Miguel, A.; Román, M.O.; Li, X.; Portnov, B.A.; Molthan, A.L.; Jechow, A.; Miller, S.D.; et al. Remote sensing of night lights: A review and an outlook for the future. Remote Sens. Environ. 2020, 237, 111443. [Google Scholar] [CrossRef]
- Kyba, C.C.M.; Kuester, T.; Sánchez de Miguel, A.; Baugh, K.; Jechow, A.; Hölker, F.; Bennie, J.; Elvidge, C.D.; Gaston, K.J.; Guanter, L. Artificially Lit Surface of Earth at Night Increasing in Radiance and Extent. Sci. Adv. 2017, 3, e1701528. [Google Scholar] [CrossRef] [Green Version]
- Ayala, C.; Aranda, C.; Galar, M. Towards Fine-Grained Road Maps Extraction using Sentinel-2 Imagery. ISPRS Ann. Photogram. Remote Sens. Spat. Inf. Sci. 2021, 3, 9–14. [Google Scholar] [CrossRef]
Figure 1.
Paris at Night acquired by an astronaut from the ISS. (NASA Photo ID ISS043-E-93480).

Figure 2.
Proposed matching and rectification algorithm for NTL imagery.

Figure 3.
Reference NTL image of Paris extracted from OpenStreetMap.

Figure 4.
Subset of georeferenced NTL image of Paris overlaid onto the reference NTL image.

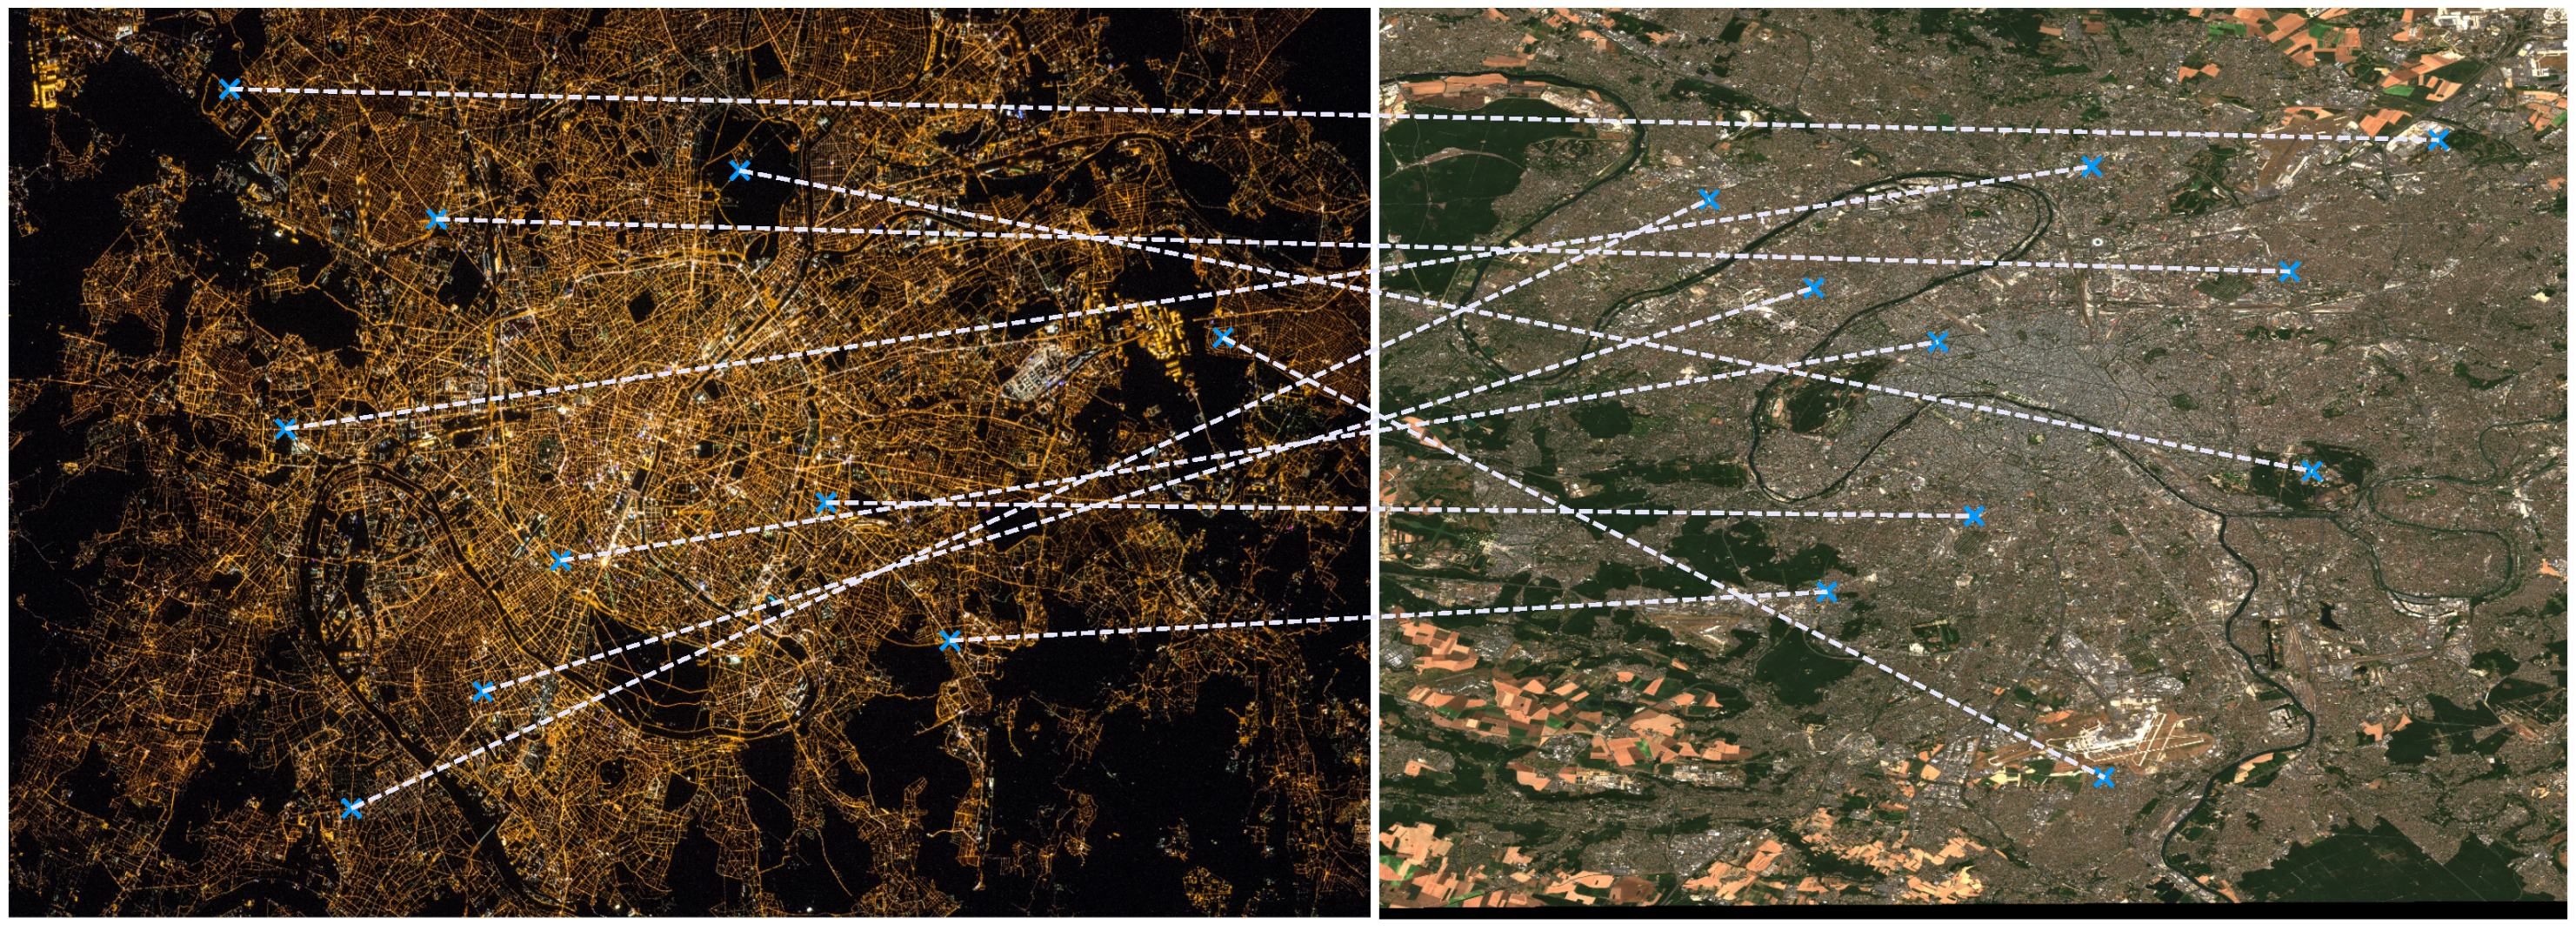
Figure 5.
Total of 770 filtered matches obtained for Paris. The reference image generated from OSM is shown on the left, while the NTL image is shown on the right.
Figure 5.
Total of 770 filtered matches obtained for Paris. The reference image generated from OSM is shown on the left, while the NTL image is shown on the right.

Figure 6.
Number of filtered matches for each combination of reference tile and rotation for Paris. The maximum number of matches (770) was found for the reference tile with the lower left coordinates at Latitude and Longitude and a rotation difference of .
Figure 6.
Number of filtered matches for each combination of reference tile and rotation for Paris. The maximum number of matches (770) was found for the reference tile with the lower left coordinates at Latitude and Longitude and a rotation difference of .

Figure 7.
Evaluation approach used to determine the absolute accuracy of the georeferenced NTL images.
Figure 7.
Evaluation approach used to determine the absolute accuracy of the georeferenced NTL images.

Figure 8.
Manually selected GCPs for Paris, to be used for the evaluation of the absolute geometric accuracy. The NTL image is shown on the left, and the Sentinel-2 reference is shown on the right.
Figure 8.
Manually selected GCPs for Paris, to be used for the evaluation of the absolute geometric accuracy. The NTL image is shown on the left, and the Sentinel-2 reference is shown on the right.

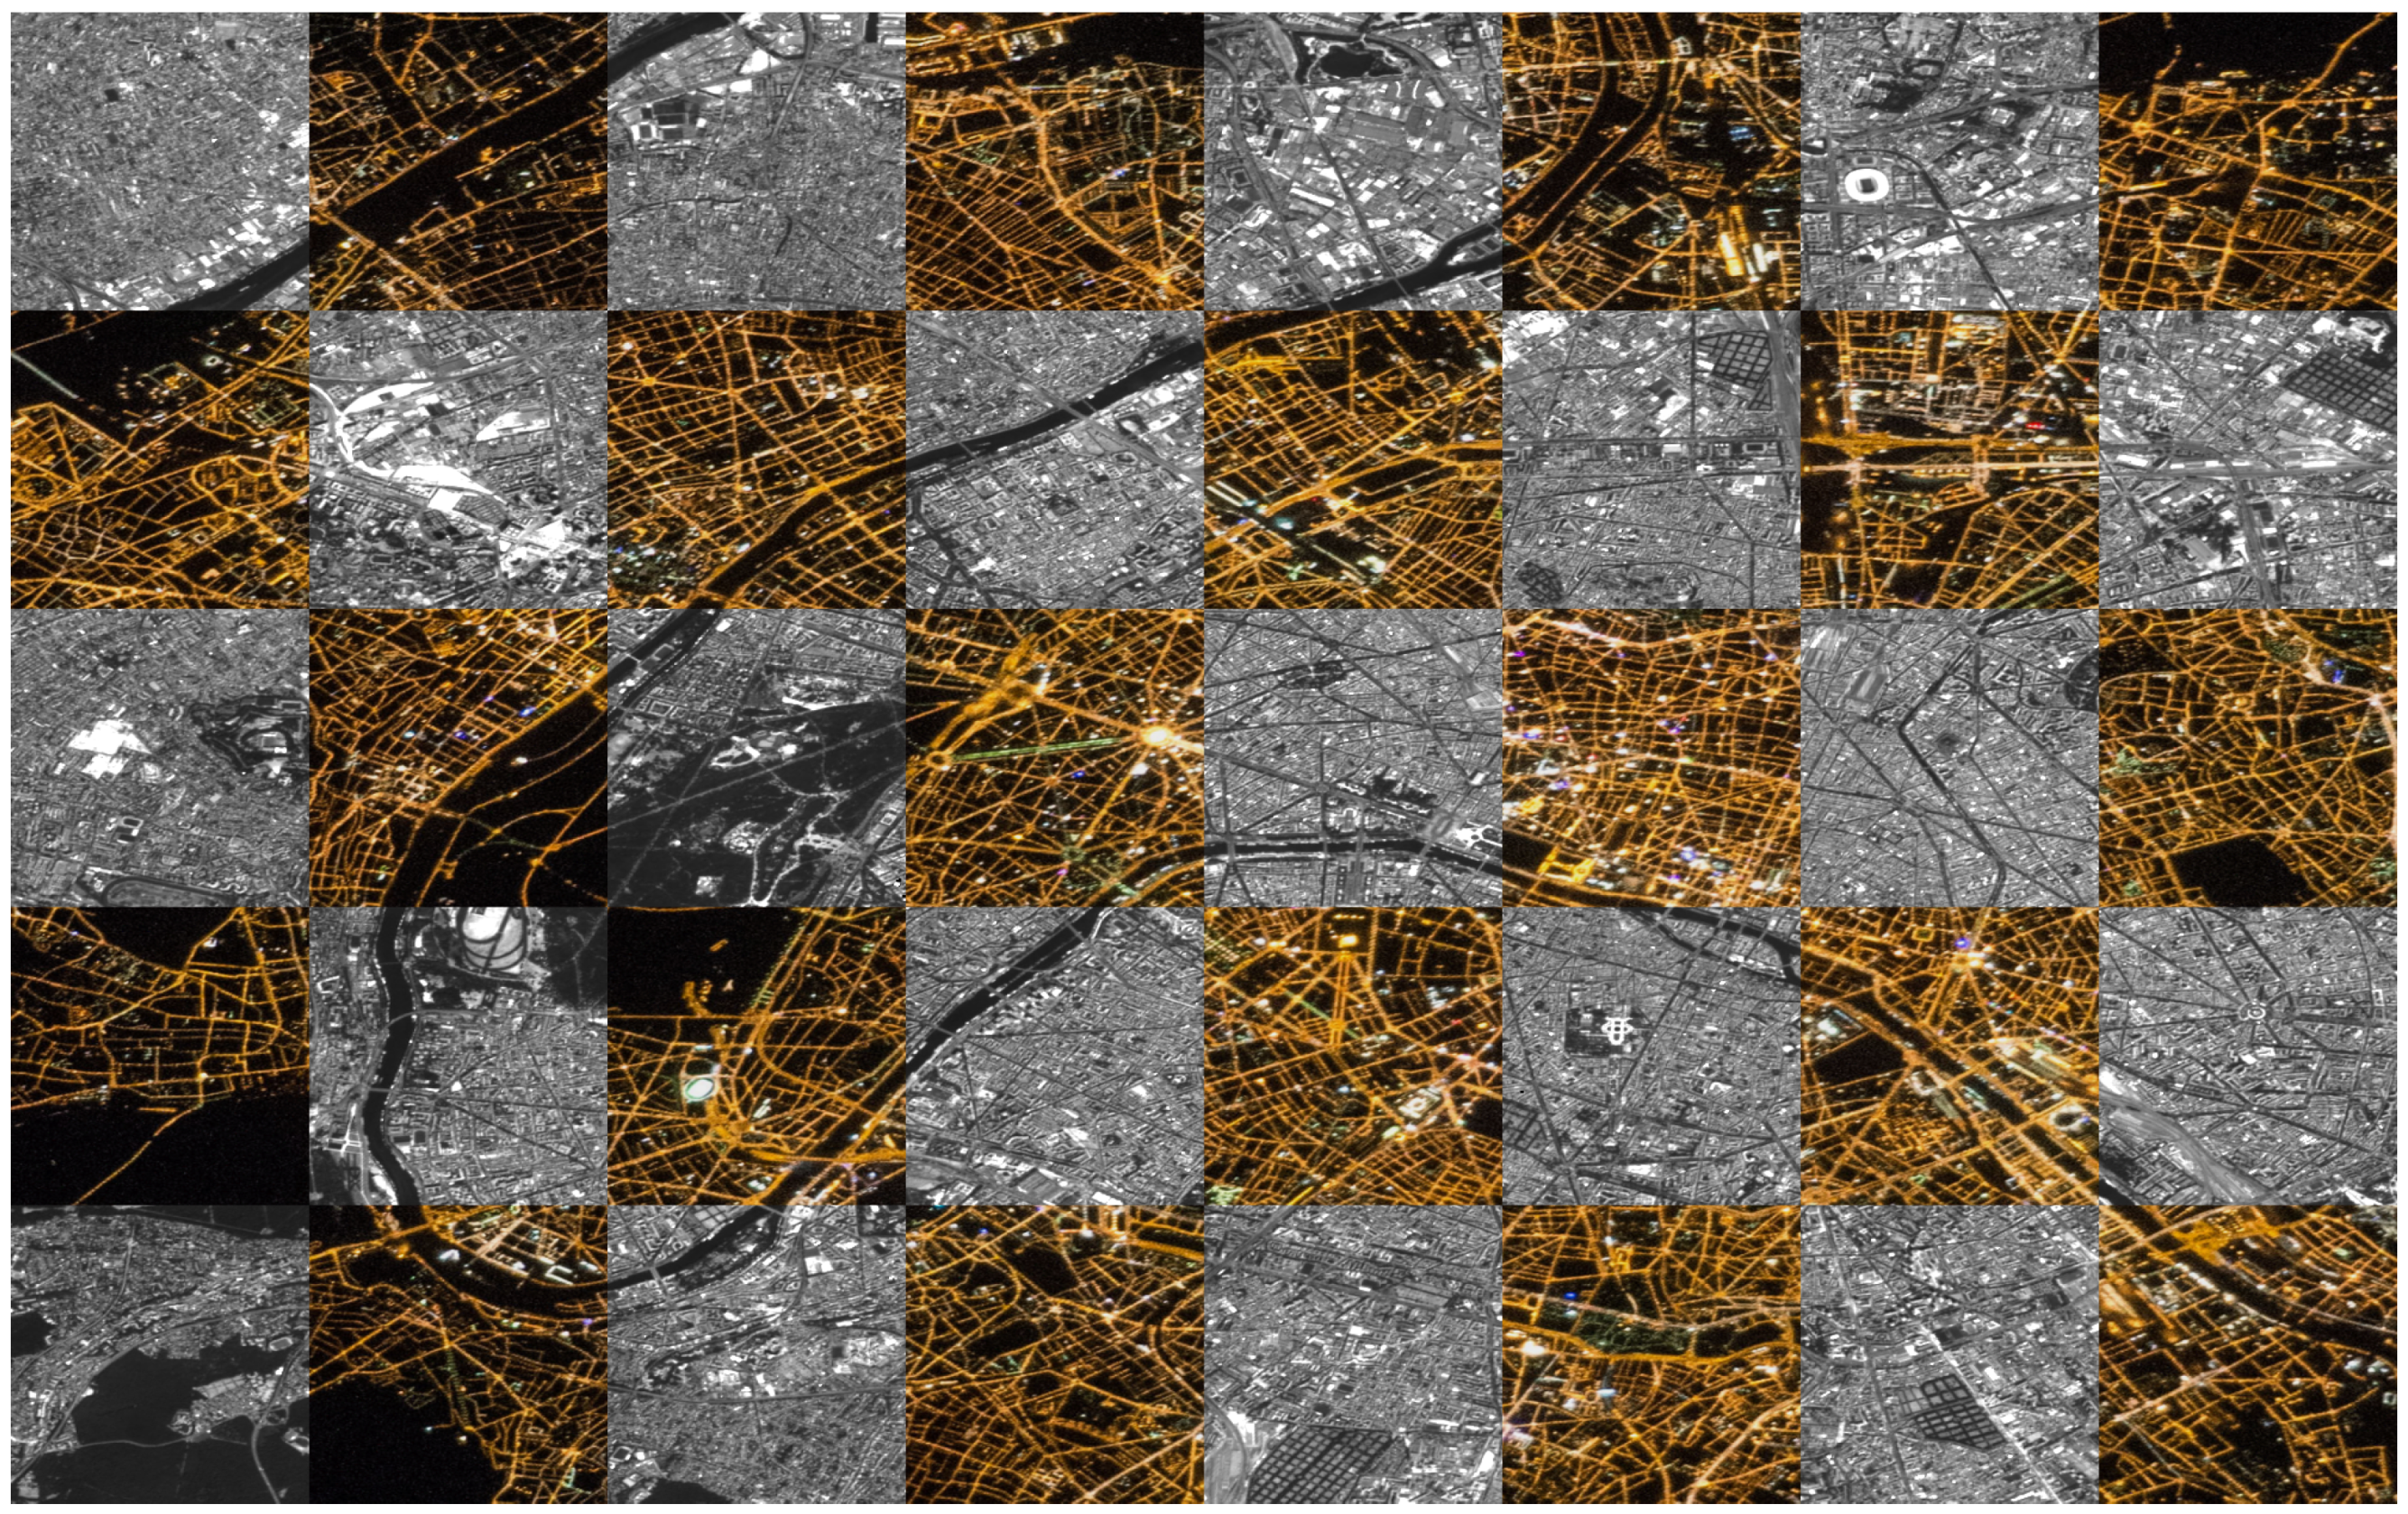
Figure 9.
Subsection of georeferenced NTL image of Paris (color image) overlaid onto reference Sentinel-2 image (greyscale).
Figure 9.
Subsection of georeferenced NTL image of Paris (color image) overlaid onto reference Sentinel-2 image (greyscale).

Figure 10.
Filtered matches obtained for datasets. For each dataset, a subsection of the reference image containing all identified matches is shown on the left, and the complete NTL photo is shown on the right.
Figure 10.
Filtered matches obtained for datasets. For each dataset, a subsection of the reference image containing all identified matches is shown on the left, and the complete NTL photo is shown on the right.

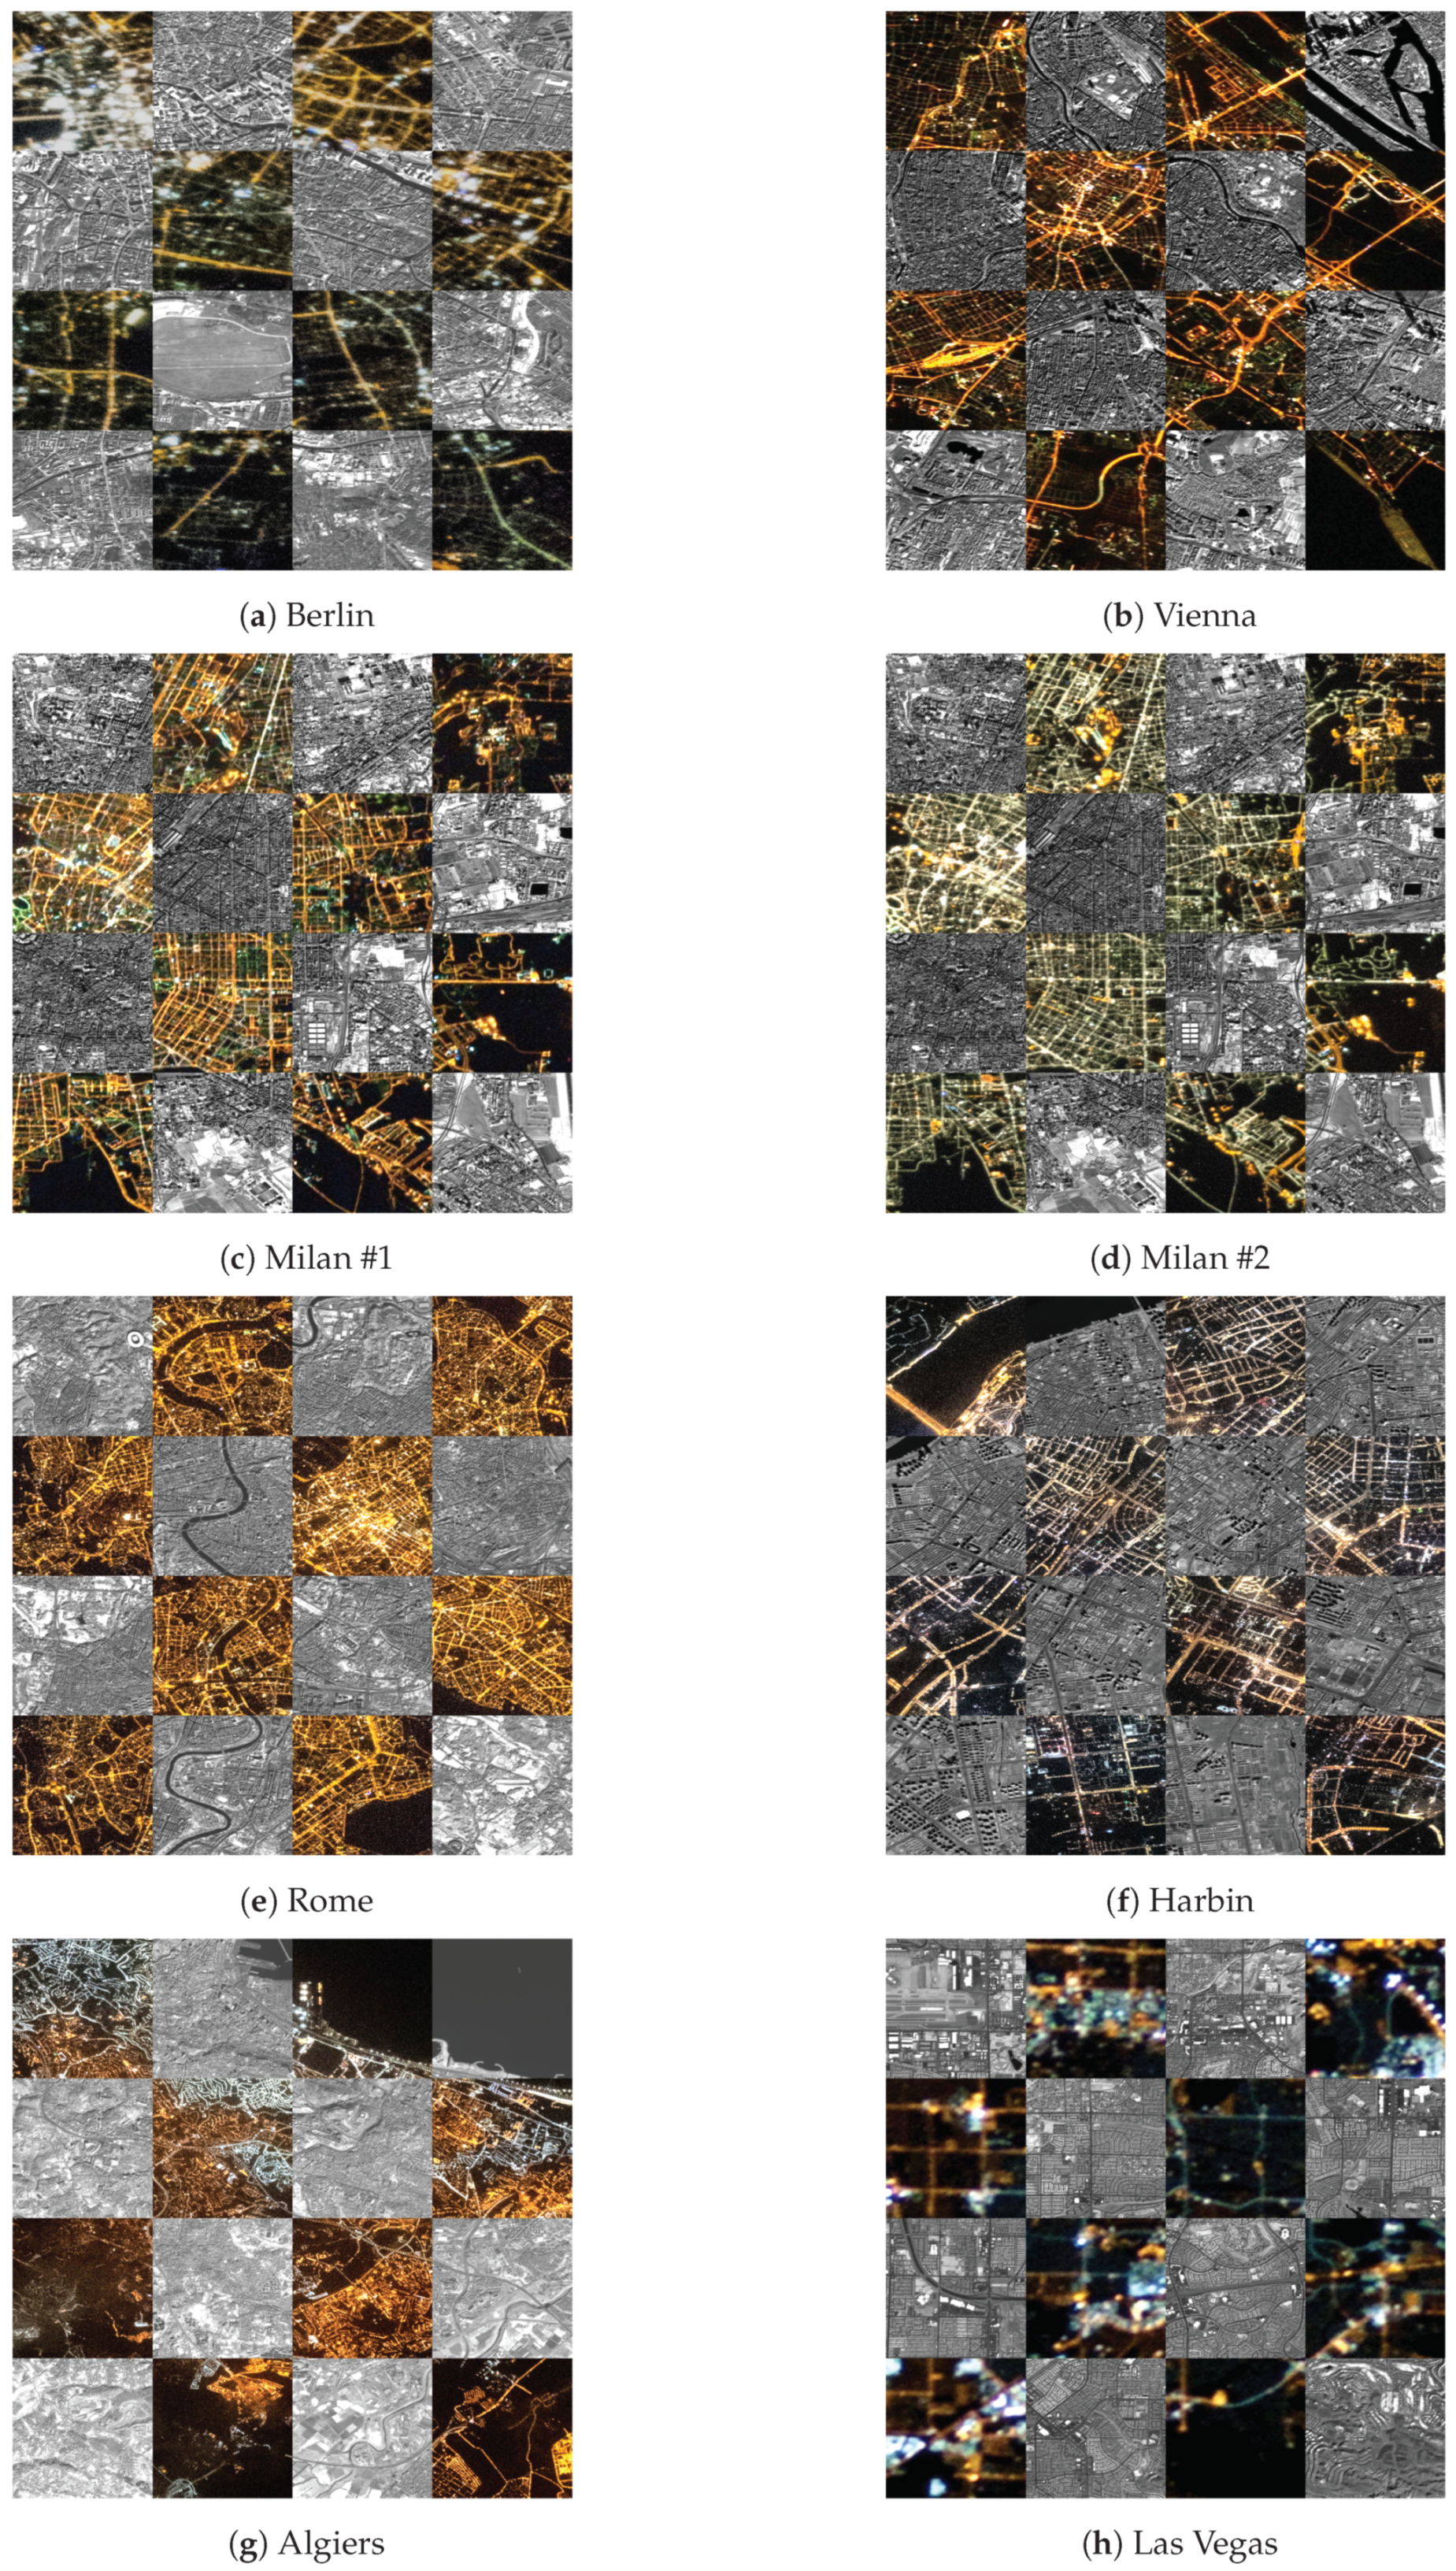
Figure 11.
Subsection of georeferenced NTL scene (color image) overlaid onto reference Sentinel-2 image (greyscale).
Figure 11.
Subsection of georeferenced NTL scene (color image) overlaid onto reference Sentinel-2 image (greyscale).


Table 1.
Details of the NTL imagery used for evaluation.
| PhotoID | ISS043- E-93480 | ISS035- E-17210 | ISS030- E-258865 | ISS043- E-93510 | ISS030- E-211480 | ISS043- E-121713 | ISS064- E-28381 | ISS065- E-203810 | ISS026- E-6241 |
|---|---|---|---|---|---|---|---|---|---|
| Quicklook (rotated 90) |  |  |  |  |  |  |  |  |  |
| Name | Paris, France | Berlin, Germany | Milan #1, Italy | Milan #2, Italy | Vienna, Austria | Rome, Italy | Harbin, China | Algiers, Algeria | Las Vegas, USA |
| Center point (Lat (), Long ()) | 48.9, 2.3 | 52.5, 13.4 | 45.5, 9.2 | 45.5, 9.2 | 48.2, 16.4 | 41.9, 12.5 | 45.8, 126.6 | 36.7, 3.1 | 36.1, −115.2 |
| Spatial resolution (m) | 7.6 | 8.7 | 8.5 | 7.3 | 9.4 | 7.6 | 6.9 | 6.4 | 26.6 |
| Acquisition time (GMT) | 08.04.2015 23:18:37 | 06.04.2013 22:37:37 | 31.03.2012 00:45:28 | 08.04.2015 23:19:50 | 11.04.2012 00:02:41 | 14.04.2015 21:12:33 | 30.01.2021 11:47:52 | 24.07.2021 23:36:27 | 30.11.2010 12:05:27 |
| Camera position (Lat (), Long (), Altitude (km)) | 48.2, 1.5, 394 | 51.7, 13.2, 396 | 46.7, 10.1, 391 | 46.3, 7.5, 394 | 47.8, 18.1, 391 | 42.6, 13.1, 394 | 44.5, 126.3, 415 | 36.7, 2.9, 415 | 38.7, −112.2, 350 |
| Camera model | Nikon D4 | Nikon D3S | Nikon D3 | Nikon D4 | Nikon D3S | Nikon D4 | Nikon D5 | Nikon D5 | Nikon D3S |
| Sensor format (mm × mm) | |||||||||
| Focal length (mm) | 400 | 400 | 400 | 400 | 400 | 400 | 400 | 400 | 180 |
| Tilt angle () | 17 | 13 | 23 | N/A (22) | 26 | 15 | 20 | N/A (2) | 52 |
Table 2.
Matching results.
| Name | Before RANSAC (#machtes) | After RANSAC (#matches) |
Range (px) |
Mean (px) |
RMSE (px) |
|---|---|---|---|---|---|
| Paris | 816 | 770 | 0.00–15.00 | 4.73 | 5.82 |
| Berlin | 49 | 19 | 0.00–14.38 | 5.07 | 6.36 |
| Milan #1 | 42 | 23 | 0.00–14.75 | 6.16 | 7.22 |
| Milan #2 | 28 | 11 | 0.00–12.30 | 5.59 | 6.84 |
| Vienna | 339 | 306 | 0.00–14.79 | 4.80 | 5.78 |
| Rome | 248 | 233 | 0.00–13.19 | 4.86 | 5.76 |
| Harbin | 38 | 14 | 0.00–14.43 | 5.41 | 6.89 |
| Algiers | 122 | 100 | 0.00–14.48 | 7.39 | 8.21 |
| Las Vegas | 58 | 18 | 0.00–8.22 | 2.62 | 3.44 |

Table 3.
Evaluation results of the manually selected GCPs.
| Name | Sentinel-2 Image ((Unit) Acquisition Time) | Min (px) | Max (px) | Mean (px) | RMSE (px) |
|---|---|---|---|---|---|
| Paris | (A) 25.07.2019 10:50:31 | 0.72 | 3.51 | 1.87 | 2.03 |
| Berlin | (A) 16.02.2019 10:21:11 | 0.40 | 9.93 | 4.15 | 4.85 |
| Milan #1 | (B) 16.01.2022 10:22:49 | 0.63 | 5.05 | 2.73 | 3.08 |
| Milan #2 | (B) 16.01.2022 10:22:49 | 0.14 | 6.62 | 2.62 | 3.34 |
| Vienna | (B) 07.01.2022 09:53:09 | 0.72 | 5.48 | 2.10 | 2.52 |
| Rome | (A) 25.01.2022 10:03:11 | 0.97 | 3.33 | 2.08 | 2.19 |
| Harbin | (B) 20.04.2021 02:25:49 | 1.46 | 13.95 | 5.53 | 6.70 |
| Algiers | (B) 18.02.2022 10:29:49 | 0.29 | 5.22 | 3.02 | 3.40 |
| Las Vegas | (A) 04.02.2022 18:25:41 | 0.62 | 8.55 | 4.38 | 5.28 |

Publisher’s Note: MDPI stays neutral with regard to jurisdictional claims in published maps and institutional affiliations. |
© 2022 by the authors. Licensee MDPI, Basel, Switzerland. This article is an open access article distributed under the terms and conditions of the Creative Commons Attribution (CC BY) license (https://creativecommons.org/licenses/by/4.0/).
Share and Cite
MDPI and ACS Style
Schwind, P.; Storch, T. Georeferencing Urban Nighttime Lights Imagery Using Street Network Maps. Remote Sens. 2022, 14, 2671. https://0-doi-org.brum.beds.ac.uk/10.3390/rs14112671
AMA Style
Schwind P, Storch T. Georeferencing Urban Nighttime Lights Imagery Using Street Network Maps. Remote Sensing. 2022; 14(11):2671. https://0-doi-org.brum.beds.ac.uk/10.3390/rs14112671
Chicago/Turabian StyleSchwind, Peter, and Tobias Storch. 2022. "Georeferencing Urban Nighttime Lights Imagery Using Street Network Maps" Remote Sensing 14, no. 11: 2671. https://0-doi-org.brum.beds.ac.uk/10.3390/rs14112671
Note that from the first issue of 2016, this journal uses article numbers instead of page numbers. See further details here.