
Influence of Spatial Resolution on Satellite-Based PM2.5 Estimation: Implications for Health Assessment


1
Research Center for Intelligent Information Technology, Nantong University, Nantong 226019, China
2
School of Remote Sensing and Geomatics Engineering, Nanjing University of Information Science and Technology, Nanjing 210044, China
3
State Key Laboratory of Atmospheric Boundary Layer Physics and Atmospheric Chemistry, Institute of Atmospheric Physics, Chinese Academy of Sciences, Beijing 100029, China
4
Nanjing Environmental Monitoring Center of Jiangsu Province, Nanjing 210013, China
*
Author to whom correspondence should be addressed.
Remote Sens. 2022, 14(12), 2933; https://0-doi-org.brum.beds.ac.uk/10.3390/rs14122933
Submission received: 10 May 2022
/
Revised: 16 June 2022
/
Accepted: 17 June 2022
/
Published: 19 June 2022
(This article belongs to the Special Issue Observation and Impact Evaluation of Atmospheric Pollution by Remote Sensing)
Abstract
:Satellite-based PM2.5 estimation has been widely used to assess health impact associated with PM2.5 exposure and might be affected by spatial resolutions of satellite input data, e.g., aerosol optical depth (AOD). Here, based on Multi-Angle Implementation of Atmospheric Correction (MAIAC) AOD in 2020 over the Yangtze River Delta (YRD) and three PM2.5 retrieval models, i.e., the mixed effects model (ME), the land-use regression model (LUR) and the Random Forest model (RF), we compare these model performances at different spatial resolutions (1, 3, 5 and 10 km). The PM2.5 estimations are further used to investigate the impact of spatial resolution on health assessment. Our cross-validated results show that the model performance is not sensitive to spatial resolution change for the ME and LUR models. By contrast, the RF model can create a more accurate PM2.5 prediction with a finer AOD spatial resolution. Additionally, we find that annual population-weighted mean (PWM) PM2.5 concentration and attributable mortality strongly depend on spatial resolution, with larger values estimated from coarser resolution. Specifically, compared to PWM PM2.5 at 1 km resolution, the estimation at 10 km resolution increases by 7.8%, 22.9%, and 9.7% for ME, LUR, and RF models, respectively. The corresponding increases in mortality are 7.3%, 18.3%, and 8.4%. Our results also show that PWM PM2.5 at 10 km resolution from the three models fails to meet the national air quality standard, whereas the estimations at 1, 3 and 5 km resolutions generally meet the standard. These findings suggest that satellite-based health assessment should consider the spatial resolution effect.
1. Introduction
Exposure to fine particulate matter (particulate matter with a diameter <2.5 μm, PM2.5) causes a variety of negative effects on human health [1,2]. Thus, it is crucial to accurately estimate the PM2.5 exposures for health assessment. Satellite remote sensing is an effective way to estimate PM2.5 with continuous temporal and spatial coverage [3,4].
Satellite-derived aerosol optical depth (AOD) is a widely used proxy for PM2.5 [5]. Many scholars have estimated PM2.5 concentrations with different spatio-temporal resolutions by using AOD data and various models [6,7,8,9,10]. Wei et al. [11,12] developed the space–time extremely randomized tree model to generate daily PM2.5 data at a spatial resolution of 1 km in China by using MAIAC AOD products. Geng et al. [13] provided near real-time PM2.5 data in China on a daily scale at a spatial resolution of 10 km. These data were based on a two-stage machine learning model and multiple data sources, including official MODIS AOD products. Zhang et al. [14] created monthly PM2.5 estimates in China by using a land-use regression model and MODIS AOD product. Numerous studies have also used satellite AOD data to retrieve PM2.5 concentrations at a regional scale, such as the Yangtze River Delta (YRD) [15,16,17,18,19,20].
The performance of the AOD-based PM2.5 retrieval models may be affected by the AOD spatial resolution. However, the conclusions of this issue are not consistent in previous studies [17,21,22,23]; their work mainly focuses on the traditional statistical regression models, and such analysis is lacking for machine learning models. Lee et al. [23] used the linear mixed-effect model to estimate PM2.5 in the Southeastern United States. They found that the model using 1 km AOD data showed a better performance than that using 10 km AOD data. Li et al. [21] conducted similar work in northern China but found that the 1 km model performance was slightly lower than the 10 km model. The YRD region also experienced such a difference in performance between 3 and 10 km AOD data [17]. The inconsistent conclusions may be because the linear model can not effectively capture the nonlinear relationship between AOD and PM2.5 involving different spatial scales [24].
Previous studies have extensively used satellite-derived PM2.5 data to assess PM2.5-related health effects [9,25,26,27,28,29,30,31]. These health assessments were performed at a wide range of spatial resolutions from 1 to 50 km and may suffer from a potential uncertainty due to the impact of satellite data resolution on PM2.5 estimations. Numerous studies have investigated the impact of spatial resolution on PM2.5 attributable mortality, and they found that the coarser resolution typically leads to lower estimated mortality [32,33,34,35]. These studies, however, were based on the air quality model simulations. Few studies have evaluated the sensitivity of human health to spatial resolution using satellite-derived PM2.5 data. Furthermore, the findings of previous model studies above were mainly for the United States and European regions. Whether these findings hold for heavily polluted areas, such as the YRD region, remains unclear.
As outlined above, satellite AOD spatial resolution may affect the performance of the PM2.5 retrieval model. Previous studies, however, have drawn inconsistent conclusions on this topic [17,21,22,23], and fewer have investigated the spatial resolution effect using machine learning models. Regarding the sensitivity of the PM2.5-related health impacts to spatial resolution, existing studies were mostly based on the air quality model simulations and mainly focused on Western countries or regions [32,33,34,35]. The application of their findings is questionable for satellite-derived PM2.5 data, especially in heavily polluted areas.
The above limitations motivate us to conduct this work with the following contributions. First, we explore AOD spatial resolution effect on PM2.5 retrieval model performance, including machine learning and statistical regression methods. Second, this work uses satellite-derived PM2.5 to investigate the sensitivity of the associated health impacts to spatial resolution in the YRD region, one of the most polluted areas in China.
Here, by using satellite AOD at spatial resolutions of 1, 3, 5 and 10 km, this study analyzes the impact of spatial resolution on the AOD–PM2.5 correlation. Additionally, satellite AOD is used to estimate PM2.5 based on three different retrieval models (i.e., the mixed effects model (ME), the land-use regression model (LUR) and the Random Forest model (RF)), and we compare these model performances at different AOD spatial resolutions. Finally, this work uses AOD-based PM2.5 estimation to assess population-weighted PM2.5 and attributable mortality and further explores these health assessments’ sensitivity to spatial resolution.
2. Data and Methods
2.1. Study Area
The study region is the Yangtze River Delta (YRD), which is located in Eastern China. This region contains a total of 26 cities and covers 2.2% of the national land area [36]. Based on the latest statistical yearbook in 2020, YRD accounts for 11.4% of the national population and 20.2% of the national gross domestic product. Despite a significant declining trend of PM2.5 concentrations in the recent decades observed in YRD, this region is still one of the most polluted areas in China [12].
2.2. Data Sets
2.2.1. MAIAC AOD Product
The study used the Multi-Angle Implementation of Atmospheric Correction (MAIAC) AOD with a 1 km spatial resolution (MCD19A2 product). This product over YRD in 2020 was obtained from the NASA Earthdata website (https://earthdata.nasa.gov/ (accessed on 18 October 2021)). We used AOD retrievals at a wavelength of 550 nm with high-quality assurance (QACloudMask = Clear and QAAdjacenyMask = Clear) [11]. The MAIAC algorithm generates AOD retrievals from the darkest to the brightest surfaces over land, and a detailed description of this algorithm can be seen elsewhere [37,38]. Previous studies have shown a good performance of MAIAC AOD data over China [11,39].
Aqua and Terra MAIAC AOD retrievals were averaged to enlarge the spatial coverage and to increase the number of valid data samples [11]. This new 1 km AOD dataset was further averaged to create AOD data at three additional spatial resolutions (3, 5 and 10 km).
2.2.2. Ground-Based PM2.5 Measurements
Hourly PM2.5 observations at 163 stations over YRD in 2020 were collected from the China National Environmental Monitor Center (CNEMC, http://www.cnemc.cn (accessed on 13 August 2021)). Hourly measurements < 1 µg/m3 were removed because they are below the instruments’ limit of detection [16]. Daily mean PM2.5 values were then calculated from the hourly time series when there were more than 18 measurements on each day [40]. We adopted 24 h average PM2.5 concentrations here because they are widely used for PM2.5-related health assessment. During matching MAIAC AOD and ground-based PM2.5 data, one AOD pixel may cover multiple PM2.5 sites, especially for coarser resolutions. For these cases, PM2.5 concentrations from multiple sites were averaged to ensure one matchup for a given AOD value. The spatial distribution of 163 stations is shown in Figure 1a.
2.2.3. Population and Mortality Data
The population data came from the Gridded Population of the World, Version 4 [41]. The data are available from the Socioeconomic Data and Applications Center (https://sedac.ciesin.columbia.edu/data/collection/gpw-v4 (accessed on 27 June 2021)). This study used the 2020 population count with 1 km spatial resolution. The gridded population data were adjusted by using the Seventh China Census in 2020. Specifically, for a given city in YRD, we scaled the gridded values by the ratio of the city’s total population from census data to gridded data. The spatial distribution of 2020 adjusted population estimates with 1 km spatial resolution in YRD is shown in Figure 1b. Additionally, the 1 km population count data were summed up to generate data with three coarser resolutions (3, 5 and 10 km). Note that the spatial coverage of the 1 × 1 km grid cell is different between MCD19A2 and the gridded population data. Thus, we interpolated these two datasets to the same regular grid using the nearest neighbor algorithm before generating coarser resolution data. The national-level age structure and the age-specific and disease-specific mortality for 2019 were obtained from the Global Burden of Disease Study 2019 (GBD 2019) dataset (https://vizhub.healthdata.org/gbd-compare/ (accessed on 29 March 2021)). Note that all datasets used in this study are for 2020 except the GBD data, which are only available until 2019.
2.2.4. Auxiliary Data
The auxiliary data used in this study include land use, surface elevation and meteorological data. The land-use data contain land cover and normalized difference vegetation index (NDVI). Ten types of land cover at 30 m resolution for 2020 were obtained from GlobeLand30 dataset (http://www.globallandcover.com/ (accessed on 13 October 2021)). Land cover data at multiple spatial resolutions (1, 3, 5 and 10 km) were generated by calculating land cover percentages for each grid in YRD at corresponding spatial scales. Monthly NDVI data at 1 km resolution came from the MODIS product (MOD13A3) and were simply aggregated to three additional spatial resolutions (3, 5 and 10 km). Elevation data were obtained from the Shuttle Radar Topography Mission (SRTM) Digital Elevation Model (DEM) at 90 m resolution (https://earthexplorer.usgs.gov/ (accessed on 13 October 2021)). We resampled the 90 m elevation data to 1 km resolution data (shown in Figure 1a) and further aggregated the resampled the DEM data to coarser resolutions (3, 5 and 10 km).
Meteorological variables associated with surface PM2.5 were extracted from the ECMWF ERA5 hourly reanalysis (https://cds.climate.copernicus.eu/ (accessed on 12 October 2021)). These variables include air temperature at an altitude of 2 m (T), the surface atmospheric pressure (P), 10 m u-wind (U10) and v-wind (V10) component, total column water (TCW), total column ozone (TCO), relative humidity (RH), and planetary boundary layer height (PBLH). The hourly meteorological data for 2020 between 10:00 a.m. and 2:00 p.m. local time were averaged to be consistent with satellite overpass times [11]. Another reanalysis dataset of ERA5-Land had a high resolution of 0.1° × 0.1°; however, we did not use the ERA5-Land data given that PBLH, RH, TCW and TCO variables are not included in the dataset. The meteorological data have a spatial resolution of 0.25° × 0.25° and were resampled to four finer spatial resolutions (1, 3, 5 and 10 km) using the nearest neighbor algorithm.
2.3. Methods
Gridded data at four spatial resolutions were collocated with daily surface PM2.5 measurements. These collocated pairs were used to build three satellite-based PM2.5 retrieval models including the mixed effects model (ME), the land-use regression model (LUR) and the Random Forest model (RF). Based on PM2.5 retrievals using the above models, we further estimated the deaths attributable to PM2.5 pollution in YRD in 2020. The detailed introduction of each model is as follows.
2.3.1. The Mixed Effects Model
The ME model is a linear approach, which takes into consideration both fixed and random effects. The model is represented by Equation [42]:
where is the daily average PM2.5 concentration at monitoring site i on day j; is the AOD value for the pixel corresponding to site i on day j; and are the fixed and day-specific random effects for intercept, respectively; and are the fixed and day-specific random effect for slope, respectively; is the error term; Σ is an unstructured varianceؘ–covariance matrix for day-specific random effects. In the ME model, the fixed effect explains the average effect of AOD on PM2.5 for the entire study period. The random effect represents the daily variability in the PM2.5–AOD relationship [42].
2.3.2. The Land-use regression Model
A stepwise linear regression method is adopted for building the LUR model [43]. Input predictors for the LUR model include land cover, NDVI, population, DEM, AOD, meteorological parameters, geographical locations and dummy variables (month and day). Note that predictors for the final LUR model with four spatial resolutions are different, especially for land cover variables. For instance, land cover predictors for the 1 km LUR model only include cultivated land, wetland and water body, whereas the land cover predictors additionally contain forest, grass land and artificial land for the 3 km LUR model. One possible explanation for this is that distributions of some land cover variables of the LUR model samples differ obviously among different resolutions. For instance, since most air quality monitoring stations in the YRD region are located in urban areas [44], artificial land cover ratios of 1 km LUR model samples are primarily equal to 1. Thus, the 1 km LUR model could hardly capture the relationship between PM2.5 and the artificial land cover ratio, thus discarding this land cover variable. The artificial land cover ratio increasingly varies between samples as the resolution of LUR model samples becomes coarser (not shown). Therefore, the LUR model possibly captures the response of PM2.5 to changes in artificial land cover ratio variation and finally includes this variable as an input predictor. Note that other input predictors besides land use generally hold for different spatial resolutions.
2.3.3. The Random Forest Model
The RF model is based on a set of decision trees [45,46]. It can be used for both classification and regression. The model has only two important hyperparameters to tune: the number of predictors randomly sampled as candidates at each split (max_features) and the number of trees to grow (n_estimators). Input predictors for the RF model are the same as the LUR model. We carried out a grid search approach to find the optimized hyperparameters [15]. For the RF model at 1, 3, 5 and 10 km resolution, the optimized values of max_features (n_estimators) are 9 (900), 10 (800), 13 (700) and 11 (300), respectively.
2.3.4. Model Evaluation
We used 10-fold cross validation (CV) to evaluate the performance of the above satellite-based PM2.5 retrieval models. All samples were randomly divided into 10 subsets; nine of them were used for training, and the remaining one was used for validation. This process was repeated 10 times until every subset was tested. Based on predicted PM2.5 concentrations from 10-fold CV and surface measurements, this study calculated the determination coefficient (R2) and root-mean-square error (RMSE) to assess the model performance.
2.3.5. Exposure and Health Impact Assessments
For each PM2.5 retrieval model and each spatial resolution, the daily PM2.5 retrievals in YRD were averaged to annual values. These annual values were further used to calculate annual population-weighted mean (PWM) PM2.5 concentration over the entire YRD area. Additionally, we adopted a method from the GBD 2019 project to estimate deaths attributable to exposure to annual mean PM2.5, based on the following equation [47]:
where M is attributable death in YRD in 2020; i, a, and d represent grid, age group and cause of death, respectively; POP is population count; MB stands for the baseline mortality rate; RR(PM) is the relative risk associated with exposure at level PMi. This work used an updated RR, which is based on a Meta Regression–Bayesian, Regularized, Trimmed (MR-BRT) spline from the GBD 2019 [48]. Five mortality endpoints associated with PM2.5 pollution were estimated, including stroke, ischemic heart disease (IHD), chronic obstructive pulmonary disease (COPD), lung cancer (LC) and lower respiratory infection (LRI). Note that age group and MB used in this study are both national level due to a lack of refined data.
3. Results
3.1. The Impact of Spatial Resolution on AOD–PM2.5 Correlation
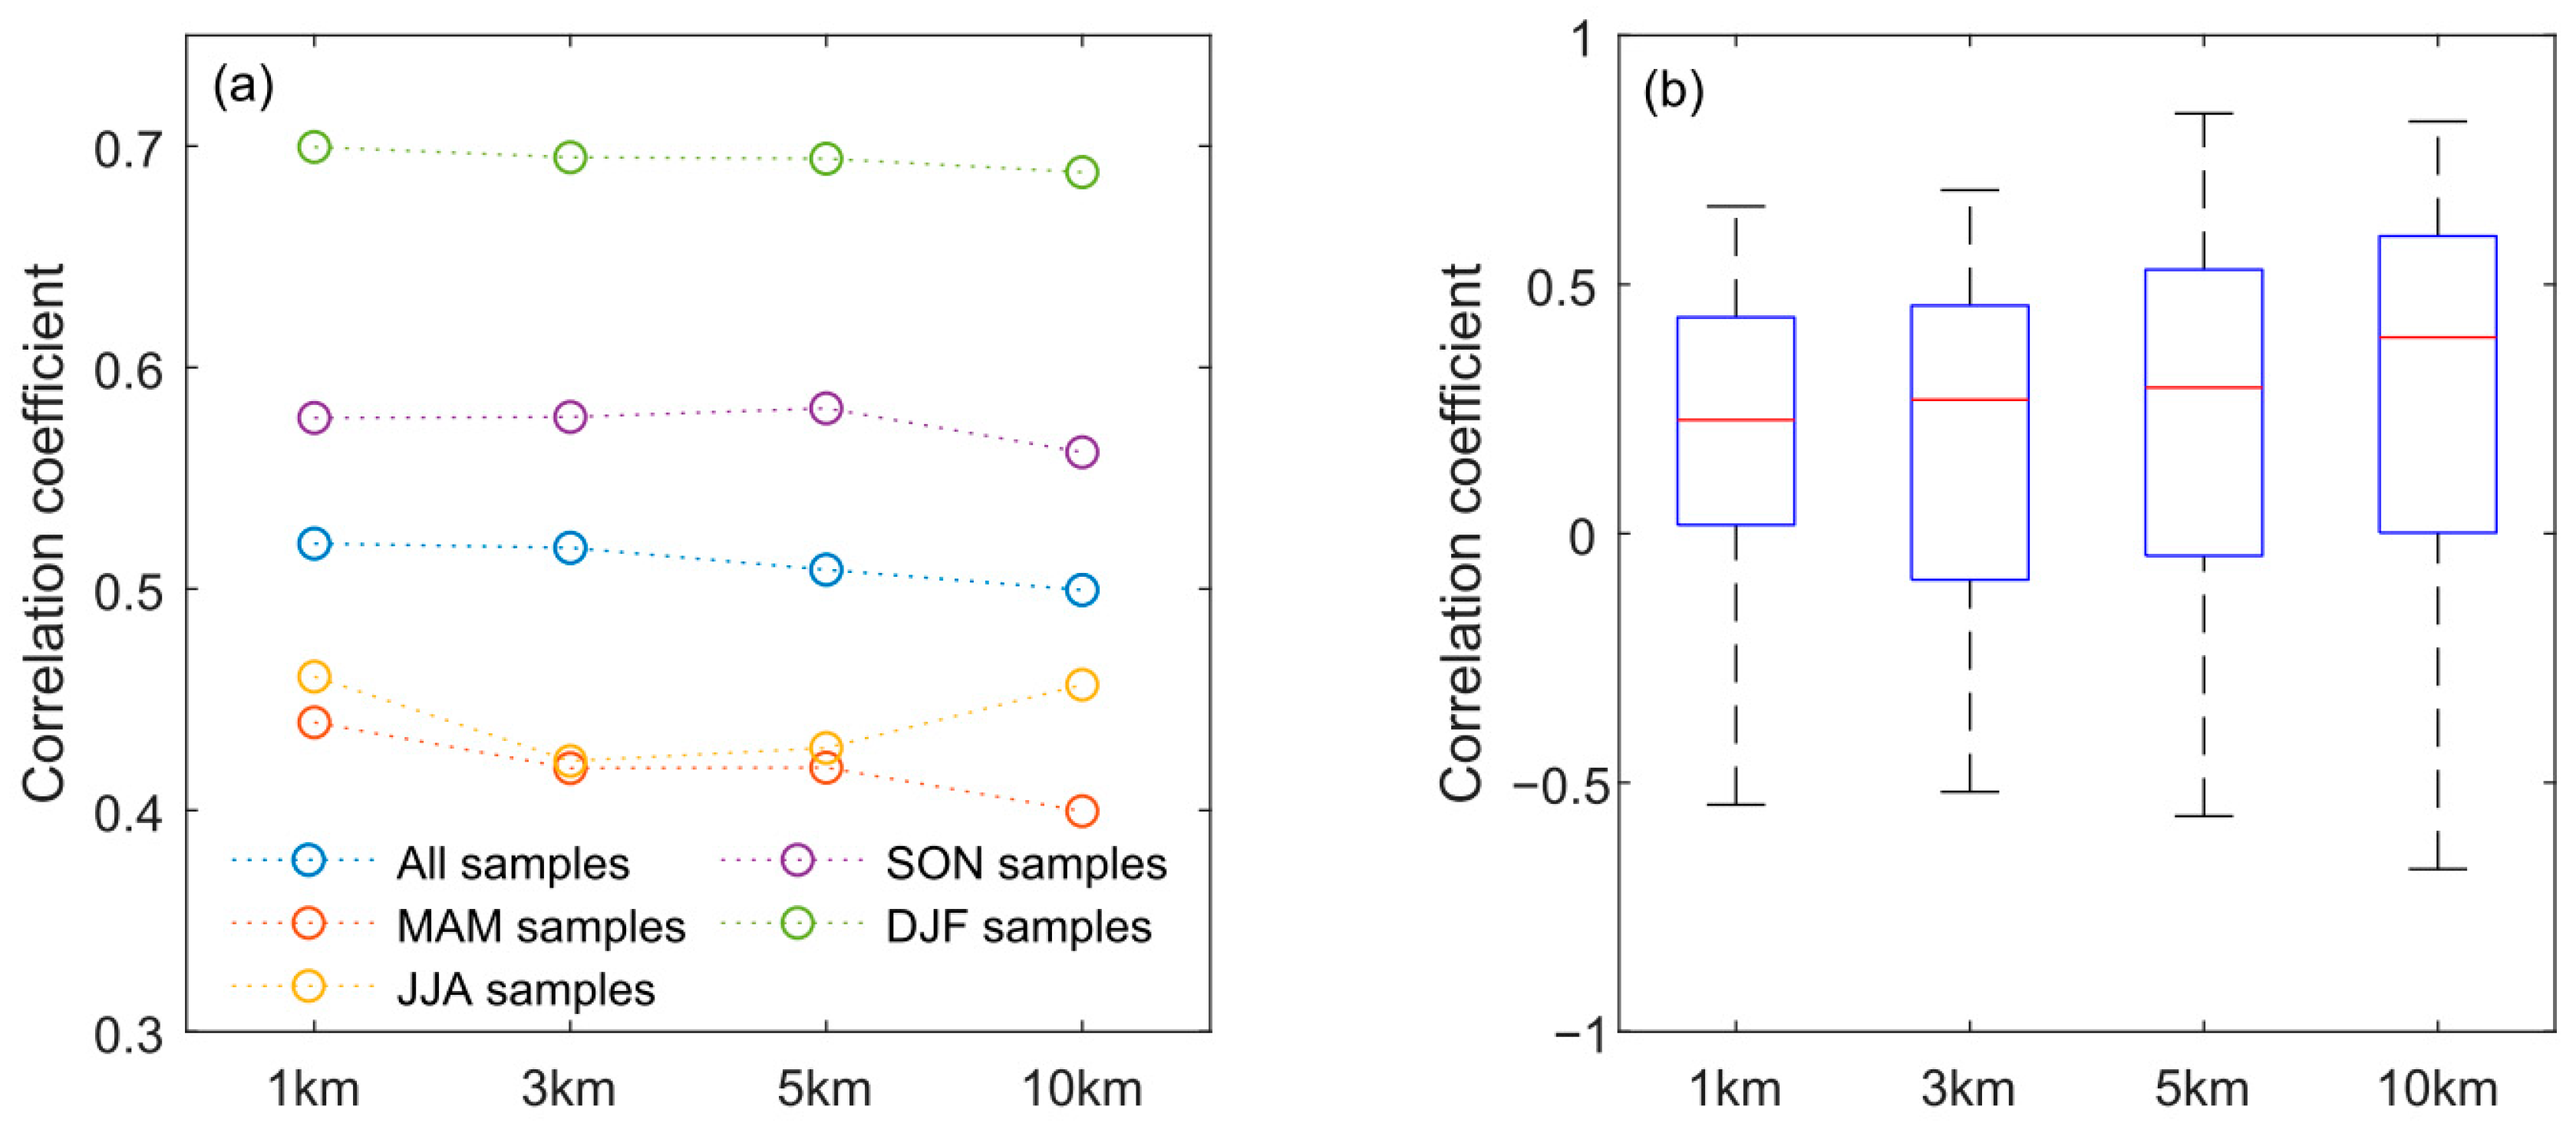
Figure 2a shows the correlation coefficients between PM2.5 concentration and AOD at 1, 3, 5 and 10 km resolutions for different seasons. As can be seen, the correlation generally decreases with the decrease in AOD spatial resolution. This pattern is evident for spring, and the correlation decreases from 0.44 to 0.40 as resolution decreases from 1 to 10 km. Additionally, Figure 2a shows a seasonal variation of the correlation irrespective of AOD spatial resolution, with the highest value in winter and the lowest in spring. Note that this seasonal pattern may change over time. For instance, Yang et al. [49] found that the AOD–PM2.5 correlation in YRD in 2016 was highest in January and lowest in March. In contrast, the highest and lowest in 2014 appeared in September and July, respectively.
The AOD–PM2.5 correlation in summer initially decreases as the resolution changes from 1 to 3 km and then increases gradually as the resolution continues to become coarser (Figure 2a). This spatial resolution effect is partly because a coarser AOD resolution can better capture the spatial variation of PM2.5 in summer. To examine this explanation, we plot the box-and-whisker based on the spatial AOD–PM2.5 correlation for each day in summer (Figure 2b). As the resolution becomes coarser, the median of spatial AOD–PM2.5 correlation in summer dramatically increases from 0.23 to 0.39 (Figure 2b). However, this feature does not hold for other seasons (not shown).
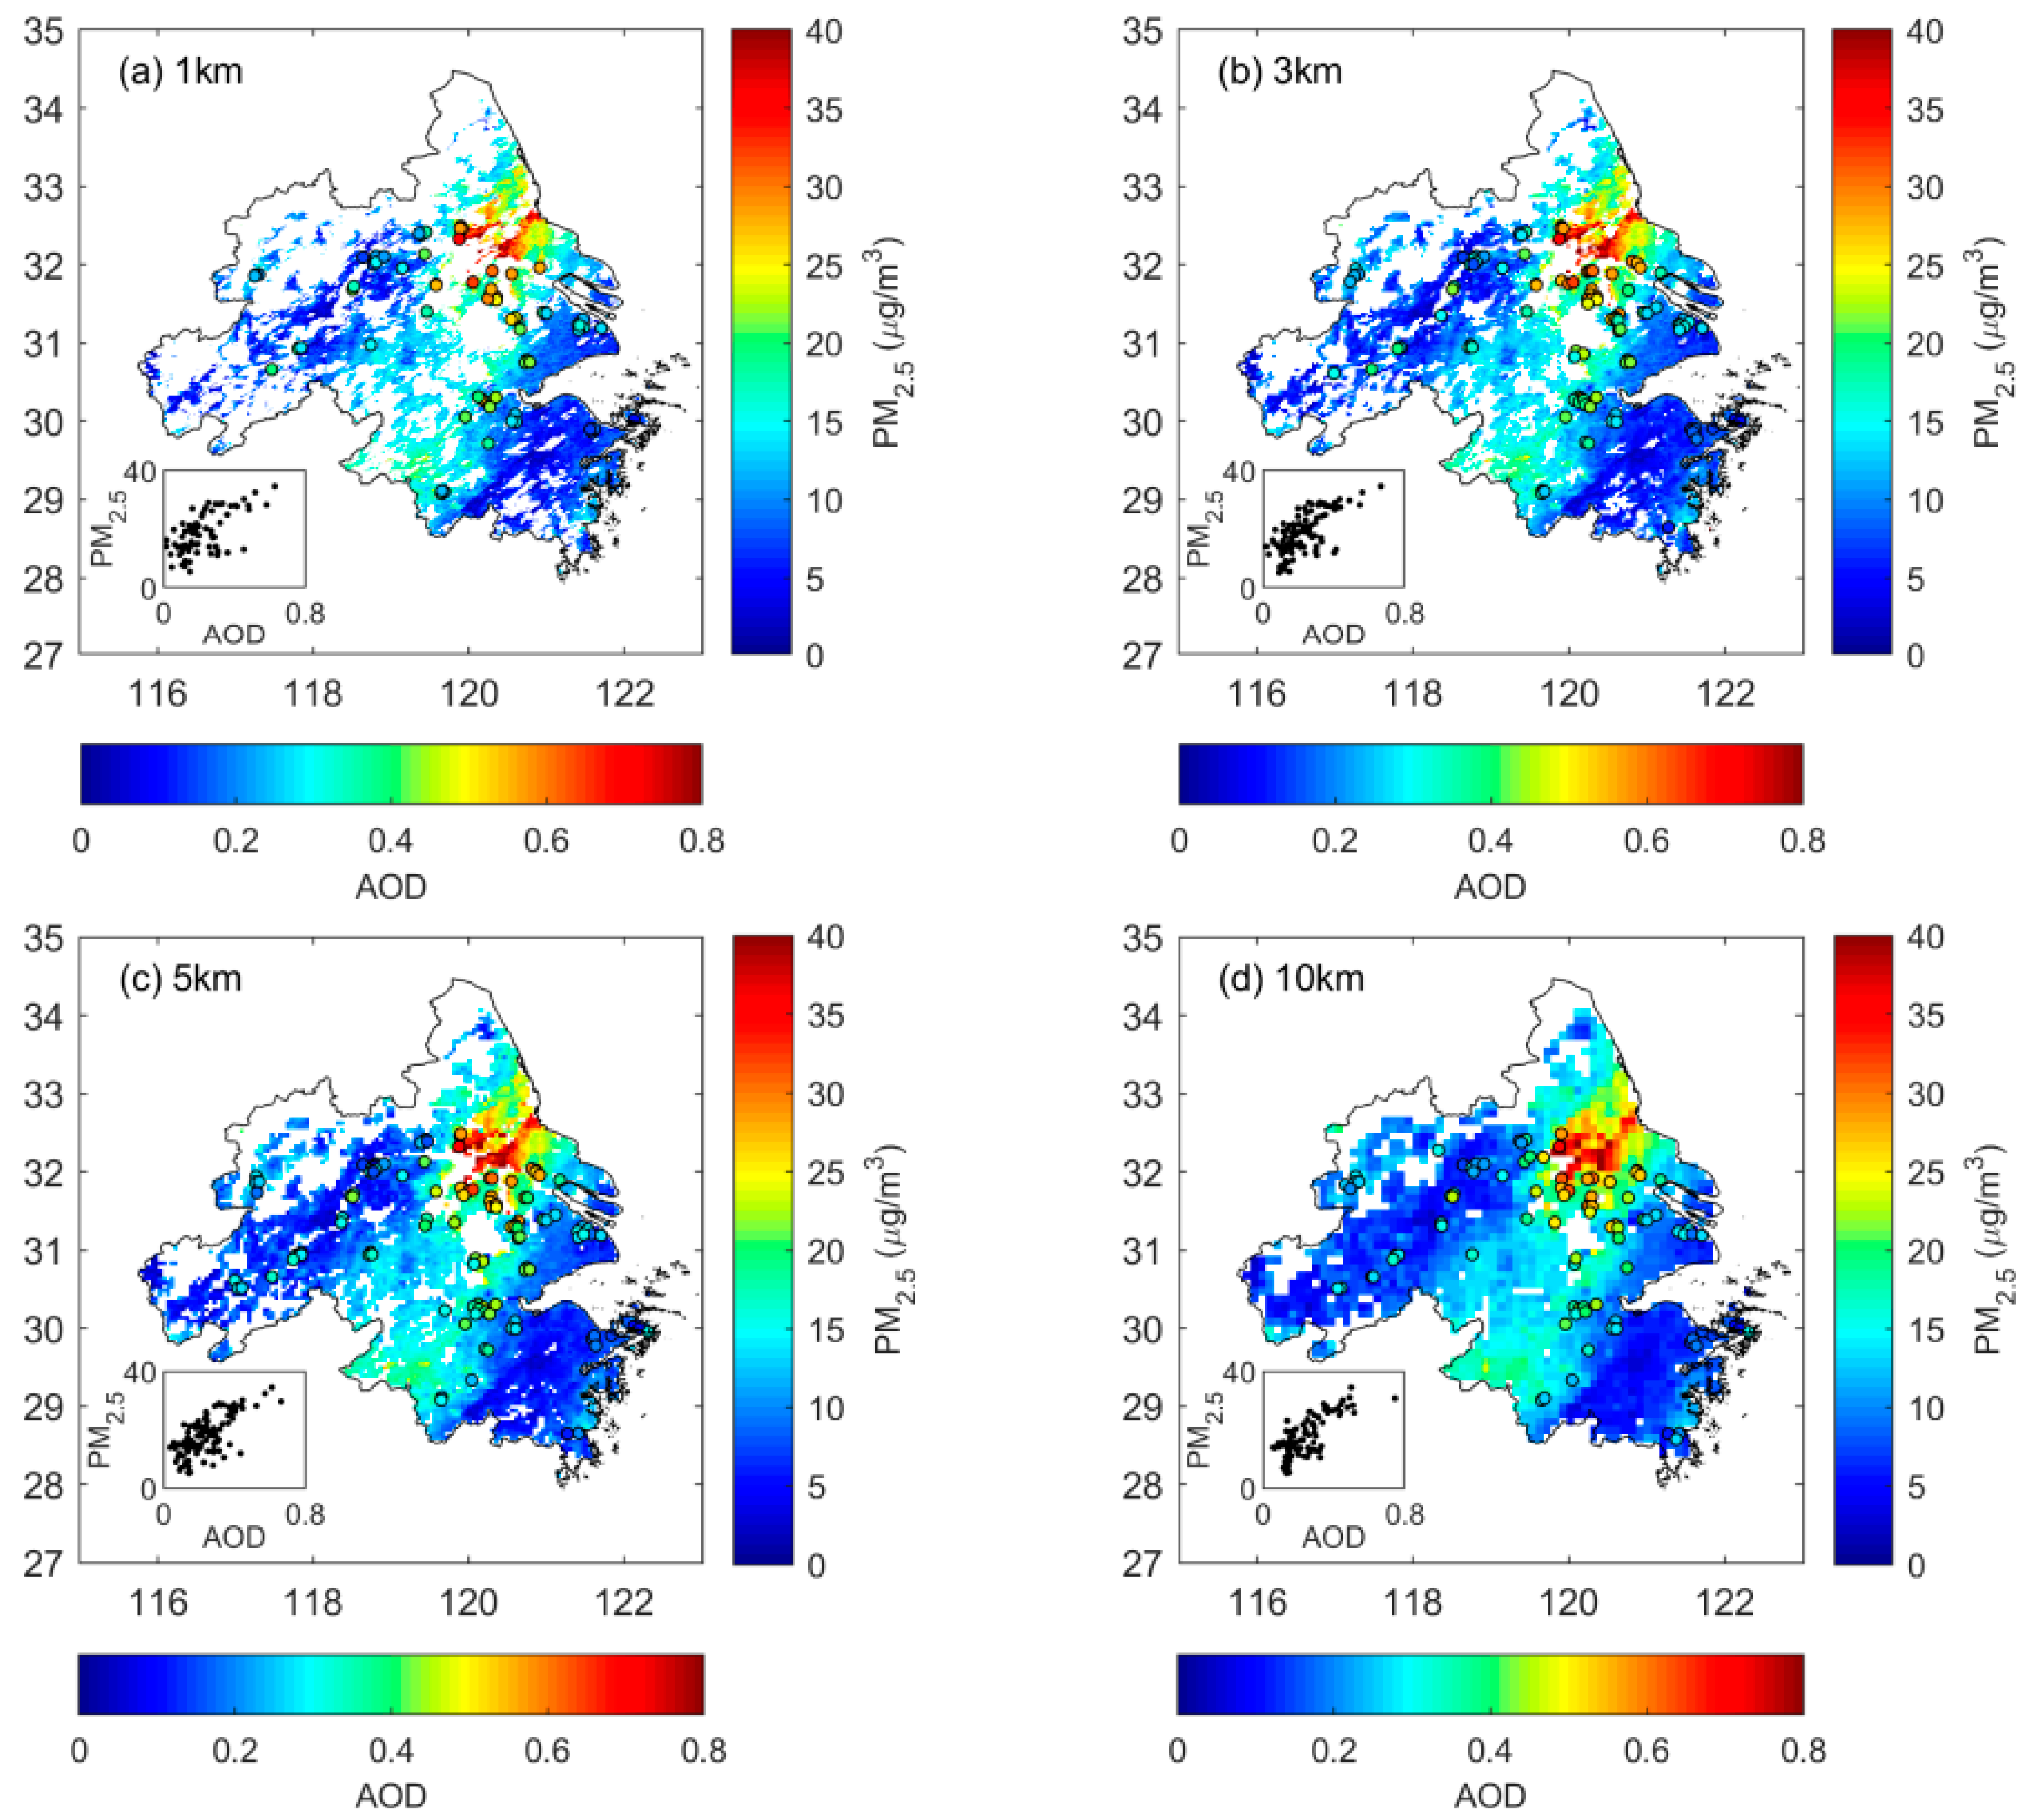
Figure 2b shows a higher spatial correlation at a coarser AOD resolution in summer. One possible explanation is that AOD values are overestimated for these retrievals near cloud pixels [50,51]. This situation appears more frequently in summer when the cloud amount is the highest versus other seasons [52]. After aggregating AOD products for coarser resolutions, the overestimated AOD values tend to be smoothed, thereby improving the AOD–PM2.5 correlation. To examine this point, we choose a case on 15 August 2020 when the number of AOD–PM2.5 pairs is the highest in summer and plot the spatial distributions of AOD and PM2.5 in this case for different resolutions, as shown in Figure 3. In this case, AOD at a 1 km resolution is widely missing due to cloud cover, and some AOD values are likely high due to cloud contamination rather than high pollution levels. Aggregating AOD products for coarser resolutions may mitigate this situation. In this case, the AOD–PM2.5 correlations at the resolutions of 1, 3, 5, and 10 km are 0.64, 0.69, 0.70, and 0.75, respectively.
3.2. The Impact of Spatial Resolution on PM2.5 Retrieval Model
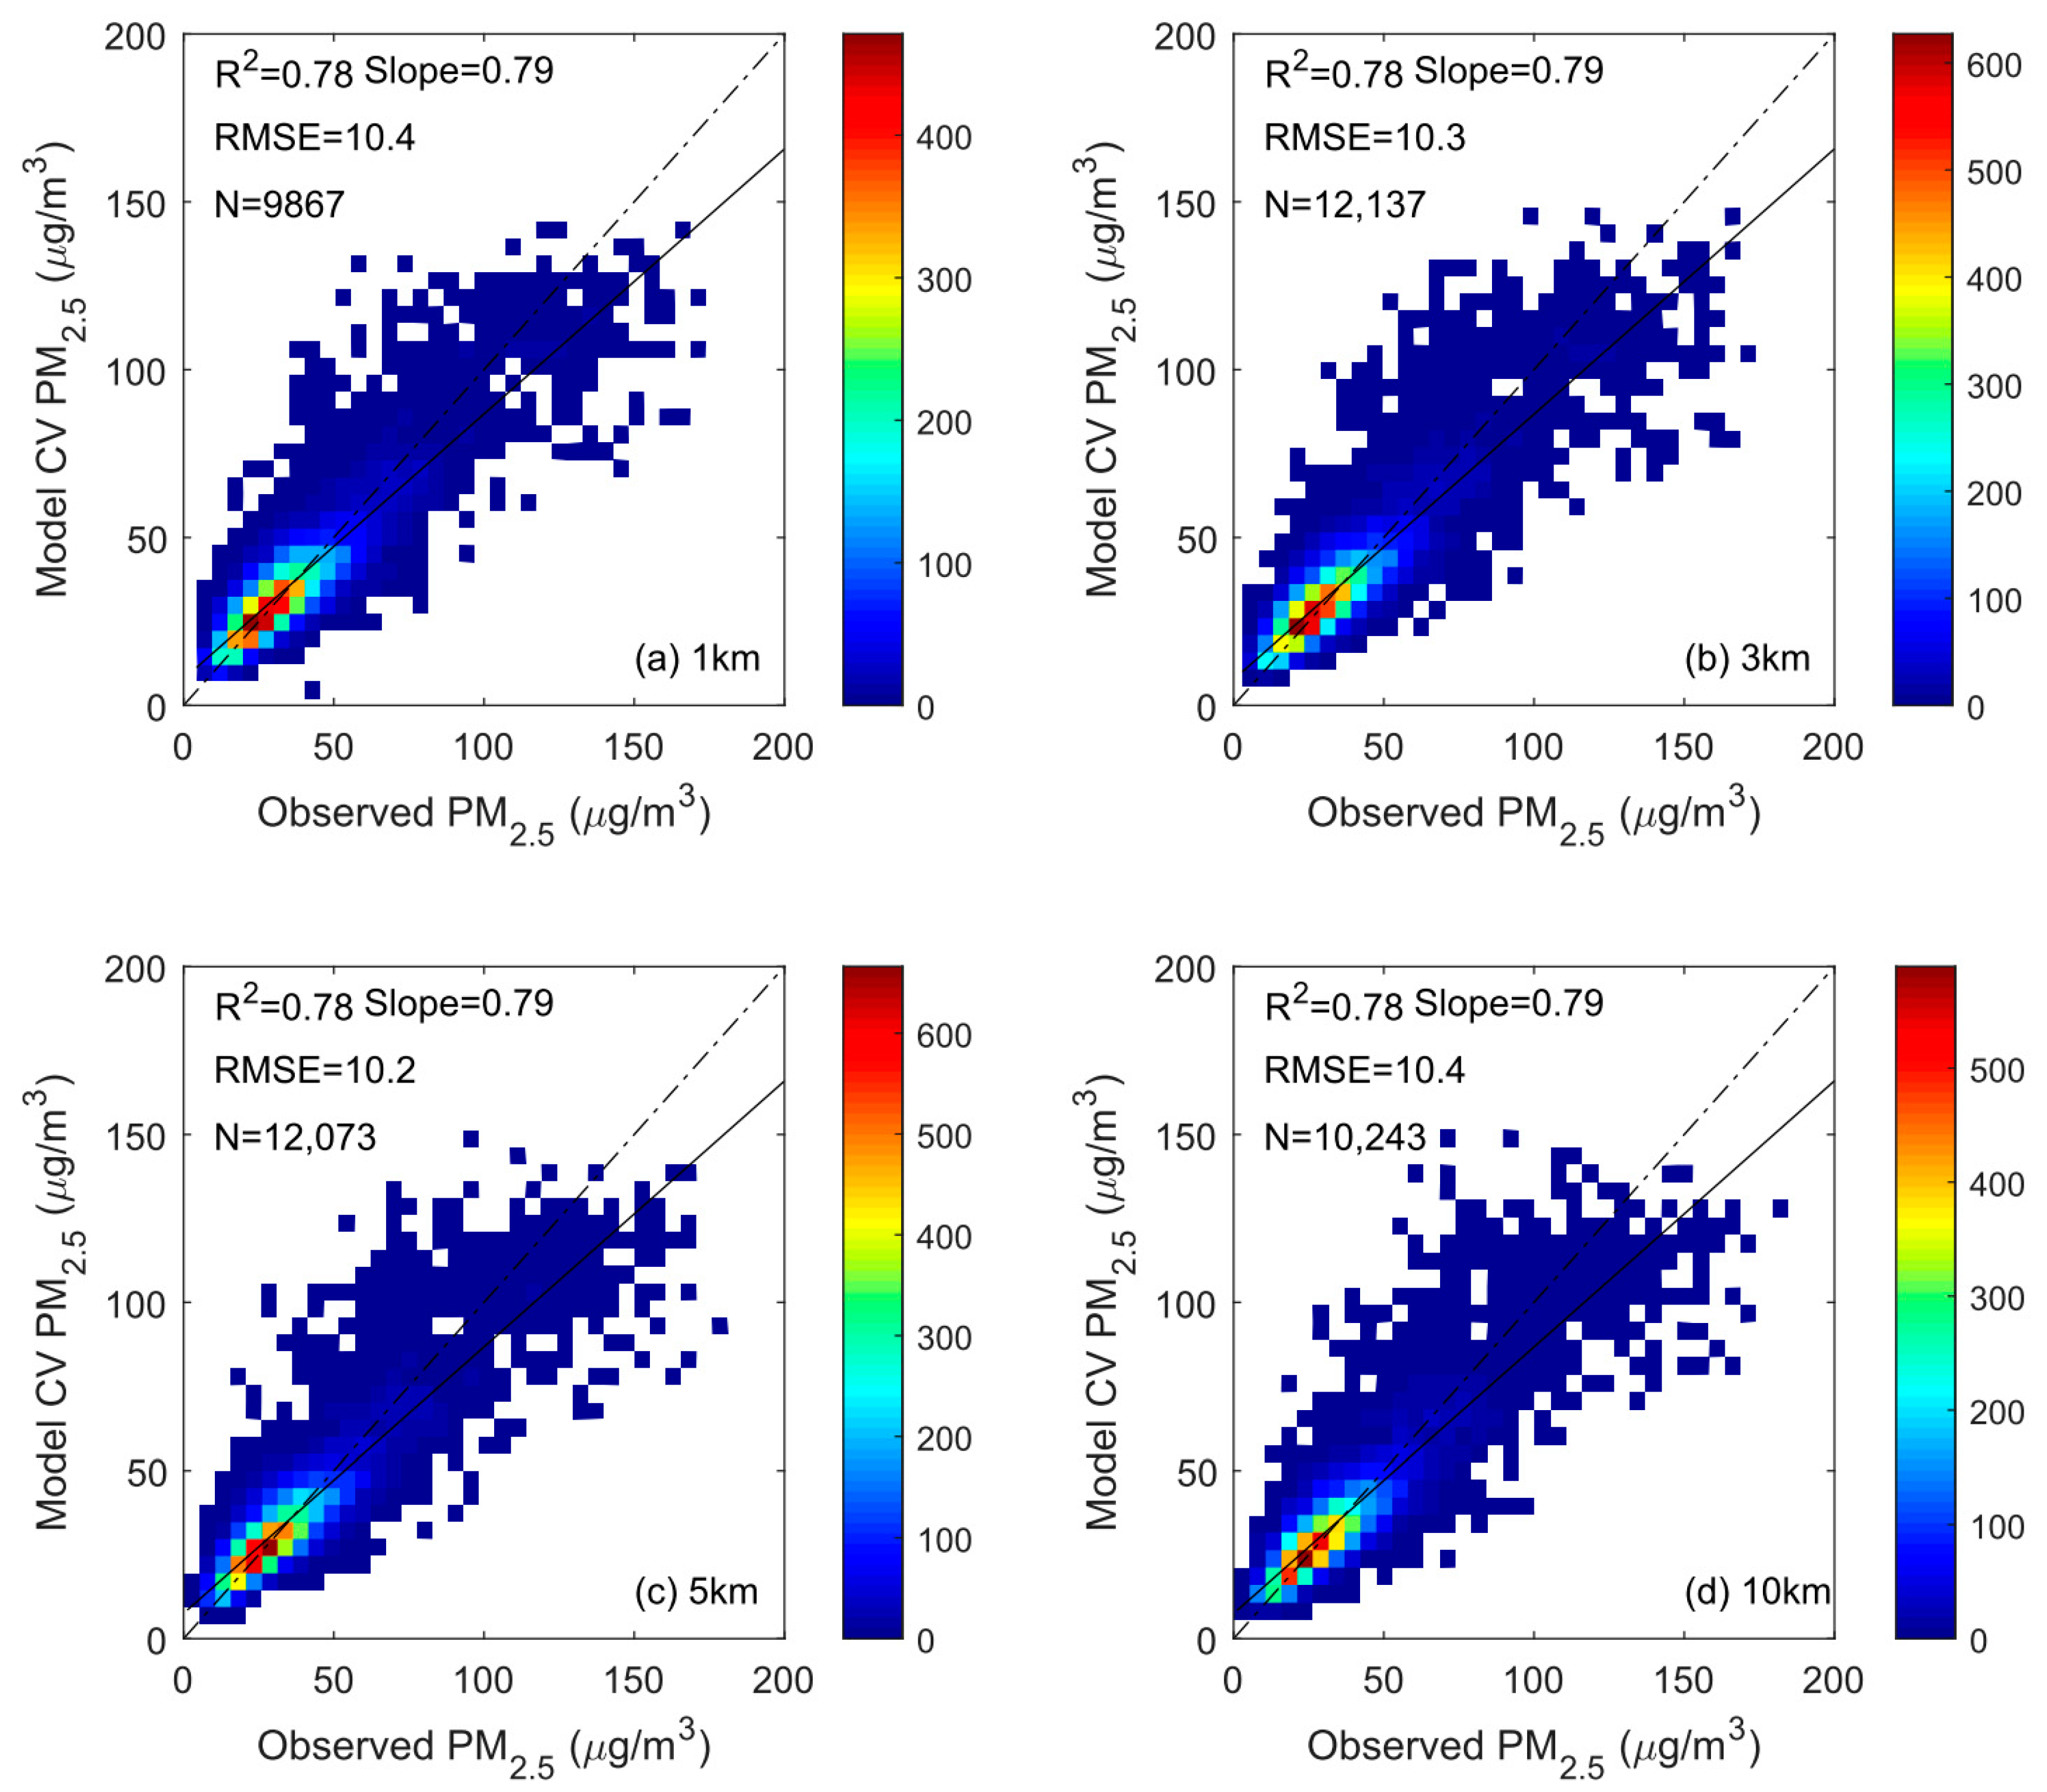
Here, we investigate the impact of AOD spatial resolution on model performance for different PM2.5 retrieval algorithms, i.e., the mixed effects model (ME), the land-use regression model (LUR) and the Random Forest model (RF). The 10-fold cross validation results for these three models are shown in Figure 4, Figure 5 and Figure 6. As can be seen, the performance is not sensitive to the AOD spatial resolution for both ME and LUR models. Specifically, for the ME model with different resolutions (Figure 4), R2 remains at 0.78, and RMSE ranges from 10.2 to 10.4 μg/m3. R2 ranges from 0.51 to 0.52, and RMSE ranges from 15.5 to 15.7 μg/m3 for the LUR model (Figure 5). The LUR model shows the poorest performance compared to other models. This is partly because the LUR model severely underestimates high-level PM2.5 (Figure 5). Our results show that AOD data at a finer spatial resolution cannot improve the performance of ME and LUR models in the YRD region. This finding was also observed in the same region [17], northern China [21], and the southeastern United States [22] based on the traditional statistical regression. Nevertheless, it still needs to further examine this finding by using multi-year AOD data with finer resolution and more spatial coverage in the future.
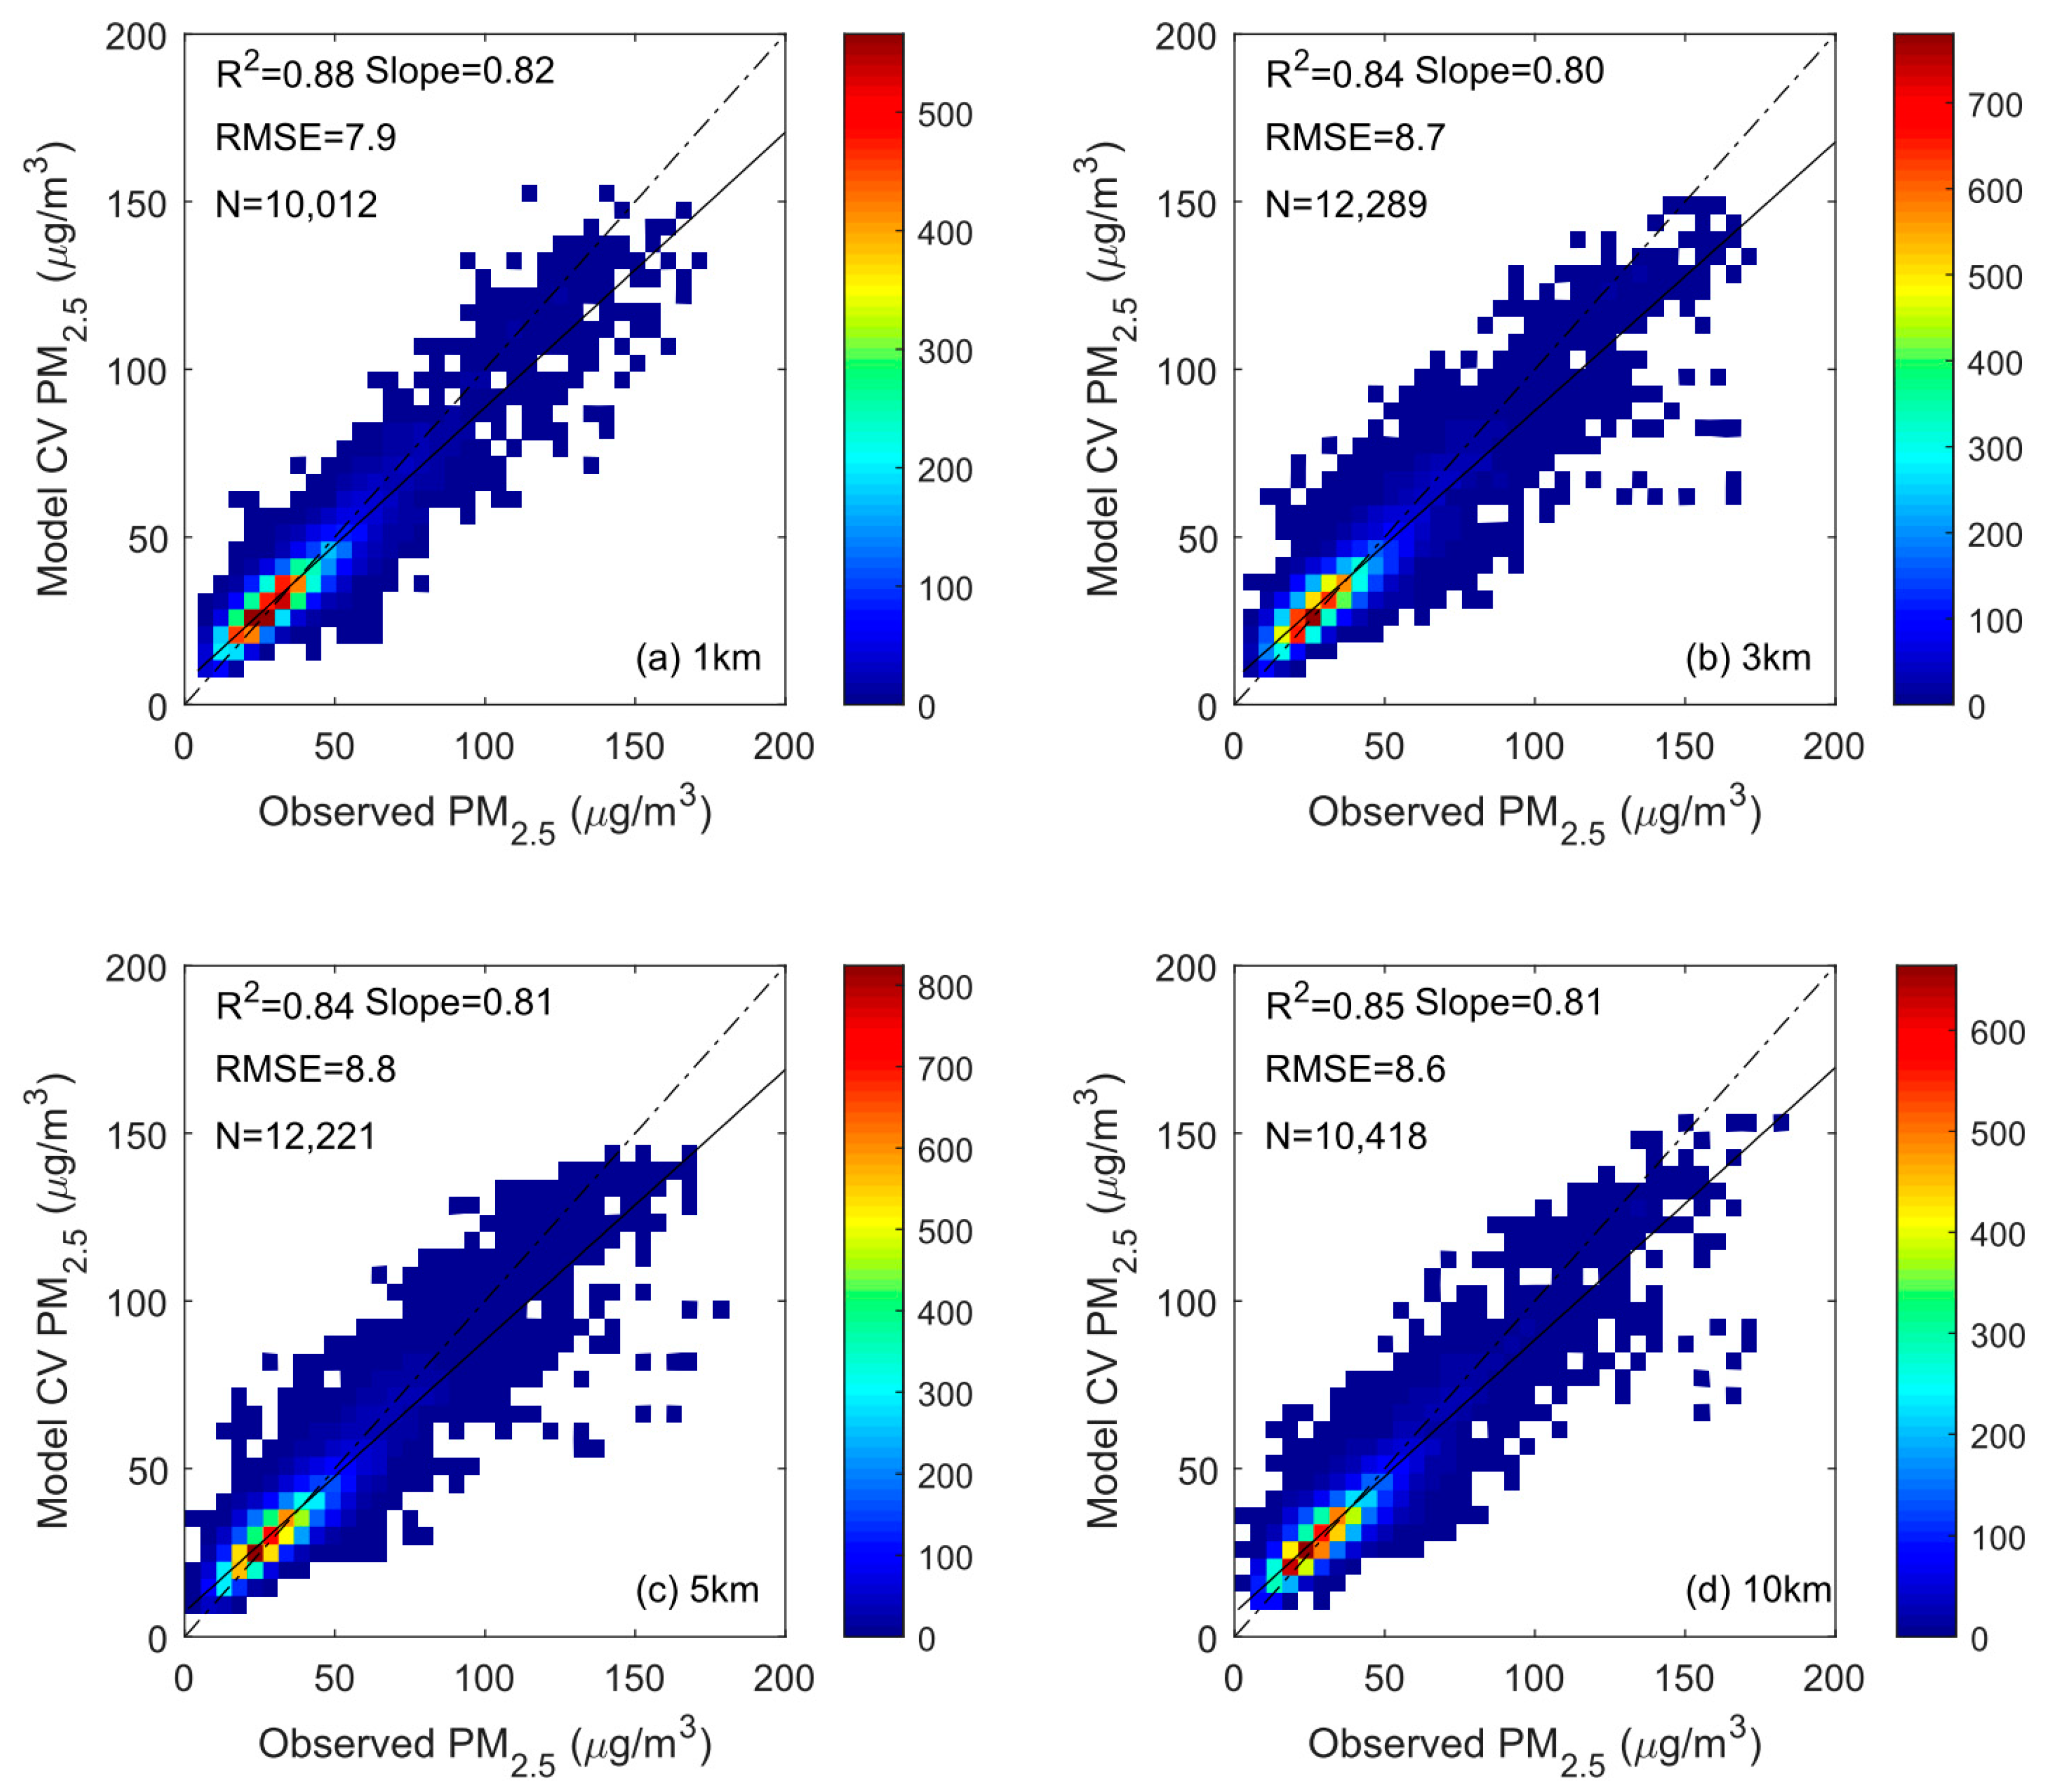
By contrast, the performance of the RF model is sensitive to AOD spatial resolution, with higher prediction accuracy at a finer resolution (Figure 6). Specifically, by comparing the performance between 1 and 10 km, R2 improves from 0.85 to 0.88, and RMSE decreases from 8.6 to 7.9 μg/m3. Furthermore, the RF model at a 1 km resolution successfully predicts the high-level PM2.5 observation (Figure 6a), whereas the RF model at coarser resolution commonly underestimates them (Figure 6b–d). We also compared PM2.5 estimates from the 1 km RF model with the currently available data, e.g., ChinaHighPM2.5 from CHAP data set [11,12] (https://weijing-rs.github.io/product.html (accessed on 19 June 2021)). The PM2.5 estimates from ChinaHighPM2.5 data have higher accuracy with CV R2 of 0.90 than our 1 km RF model (CV R2 as 0.88). Furthermore, the spatial distribution of annual PM2.5 concentrations in 2020 over the YRD region is overall similar between these two data sources (Figure 7). Compared to the CHAP dataset, the annual PM2.5 concentration from our RF model is relatively high, especially in the southern YRD region. One possible reason for this is the difference in data sampling since this study did not consider the missing values in satellite AOD product under cloudy or snow/ice surfaces.
In general, the performance of the ME model in this work is comparable to previous studies focusing on the YRD region. In contrast, our RF model has better prediction accuracy (see Table 1). Specifically, CV R2 values of the 10 km LME model are 0.80 and 0.73 from Zheng et al. [18] and Ma et al. [17], respectively. By comparison, CV R2 of our 10 km ME model is 0.78. Note that our LUR model performance is worse than the traditional statistical regression model in the YRD region from previous studies [16,17,18,19]. This may be partly because input predictors for our LUR model do not include additional geographic information, e.g., road length and density. Additionally, Bai et al. [15] and Wang et al. [20] used 5 km RF model and 3 km XGBoost model to retrieve PM2.5 in the YRD region, respectively, and they reported CV R2 as 0.65 and 0.80. Our RF model has better performance, with CV R2 of 0.84 for both 3 and 5 km models.
Although the RF model performance is sensitive to resolution, regional annual averages of PM2.5 concentrations based on this model are similar among different resolutions and are all about 36 μg/m3 (see Table 2). The standard deviation (SD) and interquartile range (IQR) of annual PM2.5 throughout all grids in YRD generally increase as the resolution becomes coarser, indicating that the RF model at coarser resolution can create a larger spatial variability of annual PM2.5 concentrations. For the ME model, as resolution decreases from 1 to 10 km, the regional annual average of PM2.5 gradually decreases from 37.0 to 35.4 μg/m3, and SD and IQR both slightly increase (Table 2). For the LUR model, regional mean, SD and IQR values all fluctuate as the resolution changes (Table 2).
Given that the RF model has a better performance compared to the ME and LUR models, and the prediction accuracy of the 1 km RF model is the best among the four different resolutions, we recommend using the 1 km RF model to estimate PM2.5 in the YRD region.
3.3. The Impact of Spatial Resolution on Health Assessment
Annual population-weighted mean (PWM) PM2.5 estimated at different spatial resolutions is shown in Figure 8a. As the resolution becomes coarser, PWM PM2.5 clearly increases regardless of which PM2.5 retrieval model is used (Figure 8a). Based on the ME model, PWM PM2.5 at 10 km resolution is 7.8% higher than the result at 1 km resolution. This difference is 22.9% and 9.7% for the LUR and RF models, respectively. Additionally, Figure 8a shows that the spatial resolution has an essential impact on achievement of the national air quality standard (35 μg/m3). PWM PM2.5 concentrations estimated at 1, 3 and 5 km resolution meet the standard for LUR and RF models, whereas estimates at 10 km resolution fails to meet the standard for all models (Figure 8a). Furthermore, mortality attributable to PM2.5 is also sensitive to resolution change, as shown in Figure 8b. Mortality estimated at 10 km resolution increases by 7.3% compared to that at 1 km resolution for ME model. This increase is 18.3% and 8.4% for the LUR and RF models, respectively.
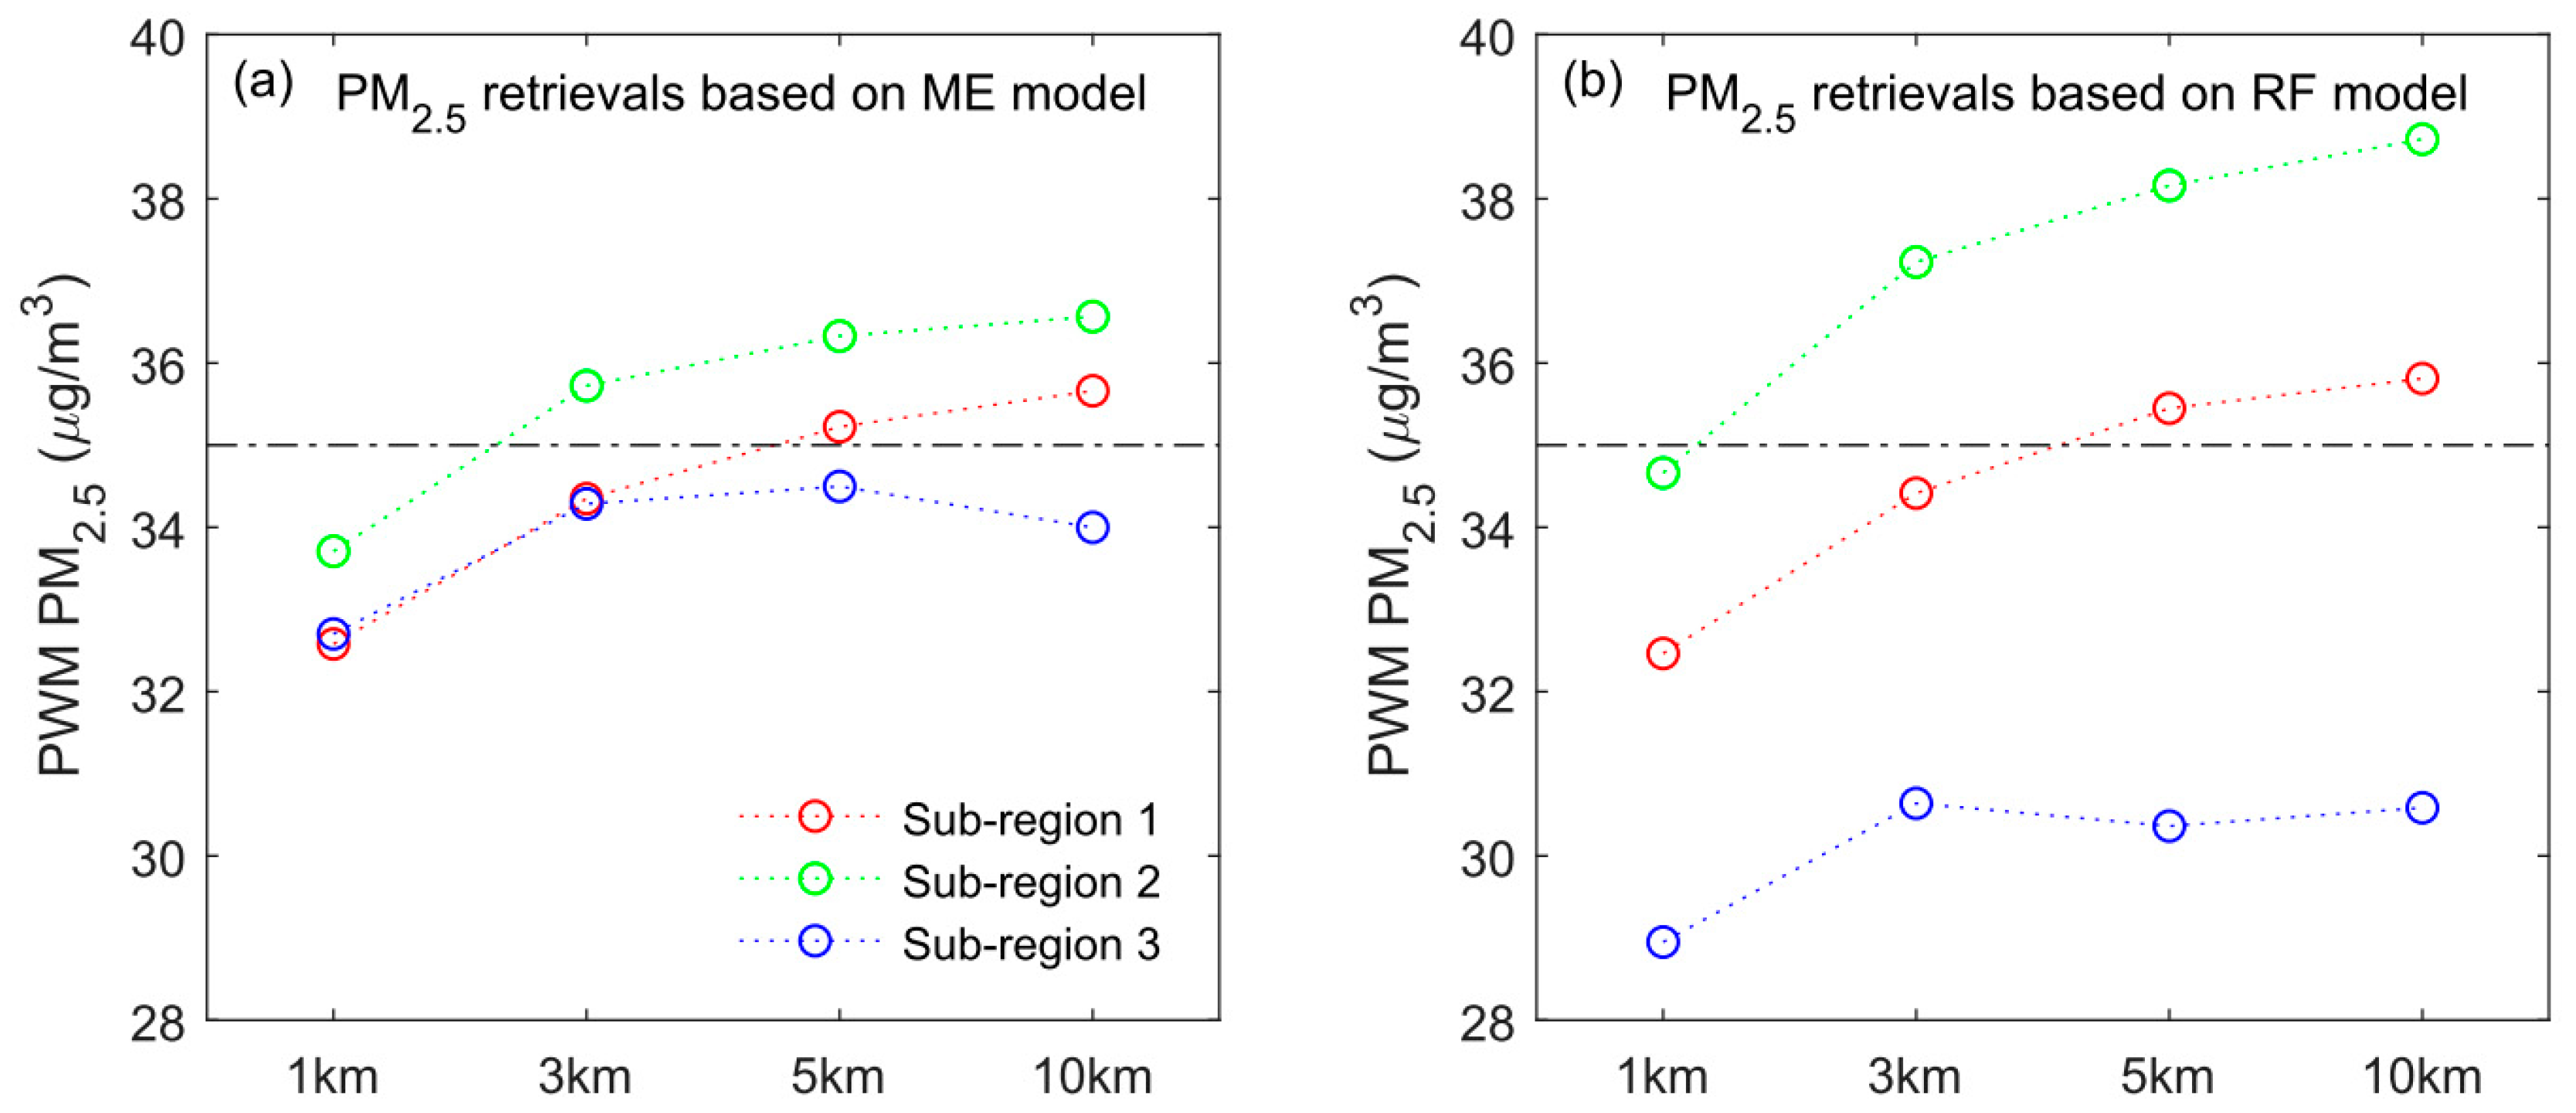
PWM PM2.5 and attributable mortality notably increase with decreasing spatial resolution in YRD (Figure 8). One reason for this sensitivity is that annual PM2.5 increases with coarser spatial resolutions in the northern YRD, especially in areas along the Yangtze River; these areas usually correspond to highly polluted and densely populated regions. Figure 9 shows the spatial distribution of annual PM2.5 at 1 km from the RF model and its difference from coarser resolutions. As can be seen, annual PM2.5 at 3 km increases widely in YRD compared to 1 km (Figure 9b), and this pattern still holds in the northern YRD when going to coarser resolutions (Figure 9c,d). The sensitivity of PWM PM2.5 to spatial resolution is further investigated for different sub-regions of YRD, as shown in Figure 10. For annual PWM PM2.5 from the ME and RF models, the estimation gradually increases as resolution decreases from 1 to 10 km in northeast YRD (sub-region 1) and northwest YRD (sub-region 2). By contrast, PWM PM2.5 is less sensitive to resolution in southern YRD (sub-region 3). Although not shown here, PWM PM2.5 from the LUR model is sensitive to resolution for all sub-regions in YRD.
Another possible reason for the sensitivity of health assessments to spatial resolution is that resolution affects the spatial coverage of PM2.5 retrievals. Annual PM2.5 estimated at 1 km resolution is commonly invalid over water bodies (e.g., rivers and lakes), which is because high-quality assurance used in this study masks AOD values over inland water bodies and coastal water areas with high uncertainty [39,53]. As the resolution becomes coarser, PM2.5 estimates cover of more water bodies where annual PM2.5 is usually high; meanwhile, coarser population grids include more densely populated sub-grids near water bodies. These spatial expansions likely result in an increase in PWM PM2.5 with decreasing resolution. An example of the above explanation is shown in Figure 11. As can be seen, the annual 1 km PM2.5 from the RF model over Yangtze River and Taihu Lake is invalid. In contrast, the annual PM2.5 tends to be valid and takes high values when decreasing resolution (Figure 11a–d). This tendency is also observed for the population (Figure 11e–h). Consequently, both high-level PM2.5 and dense population spatially expand, leading to a higher PWM PM2.5.
4. Discussion
Our results show that the AOD–PM2.5 correlation generally decreases as the AOD spatial resolution becomes coarser, consistent with previous studies [54,55,56]. This pattern, however, is the opposite in summer. One possible explanation for this unexpected result is that AOD values collocated to PM2.5 observations are frequently near cloud pixels in summer, and these AOD retrievals at finer resolution are likely unreliable due to cloud contamination. By contrast, Chudnovsky et al. [55] indicated that MAIAC 1 km AOD retrievals remain reliable under partly cloudy conditions. This cloud effect should be further investigated in the future, perhaps in combination with a full-coverage AOD dataset.
Additionally, after applying vertical and humidity corrections of AOD following previous works [57,58], the spatial resolution effect on the AOD–PM2.5 correlation still holds (not shown). Note that the spatial resolution range may affect the sensitivity of AOD–PM2.5 correlation on resolution. For instance, Wu et al. [57] found that, as degrading spatial resolution, the correlation in Shenzhen City in summer rapidly increases until reaching the peak at about 1 km resolution and then slowly decreases when going to coarser resolutions.
This work indicates that AOD data at a finer spatial resolution cannot improve the performance of the PM2.5 retrieval models based on the traditional statistical regression (i.e., ME and LUR models). The spatial resolution effect on the PM2.5 retrieval model is inconsistent among the previous studies [21,22,23]. For instance, Lee et al. [23] showed a better performance of the ME model at a 1 km AOD resolution in the southeastern United States (US) compared with 10 km resolution. Conversely, this trend is opposite in northern China [21]. Hence, we speculate that the sensitivity of the PM2.5 retrieval model on AOD spatial resolution varies by region. Northwest YRD (sub-region 2 in Figure 1a) shows a better performance of the ME model as the resolution becomes coarser (not shown). For the other two sub-regions, the ME model performance is still insensitive to AOD spatial resolution (not shown).
For the PM2.5 retrieval model based on machine learning (i.e., the RF model), the results presented here show that a finer AOD spatial resolution can produce a more accurate PM2.5 prediction. This conclusion still holds for the three sub-regions in YRD (not shown). Therefore, machine learning is likely a good way to solve the spatial resolution effect on PM2.5 prediction. Note that PM2.5 prediction accuracy may not keep improving when satellite data spatial resolution continues to be enhanced. For instance, based on micro-satellite images, Zheng et al. [59] used a convolutional neural network and random forest approach to estimate PM2.5 and compared prediction accuracy between different input image sizes (i.e., 670, 500, 200 and 100 m). They found that as the image size decreases, the performance improves at first until reaching the peak at 200 m, after which the performance degrades.
We find that health assessment strongly depends on spatial resolution, with larger values estimated from coarser resolution. This sensitivity holds for all three PM2.5 retrieval models. Previous studies have drawn inconsistent conclusions regarding the spatial resolution effect on health assessment. Most of them have shown that PWM PM2.5 decreases as spatial resolution becomes coarser [33,34,60,61]. By contrast, Thompson et al. [62] found that PWM PM2.5 and attributable death are not sensitive to resolution. Furthermore, Punger and West [32] showed that PWM PM2.5 increases with resolution from 12 to 36 km and then decreases when going to coarser resolutions. A possible reason for the above inconsistent conclusions may be that the spatial resolution range is different among different studies. For instance, Li et al. [35] found that PM2.5 attributable mortality in the US gradually decreases at degrading resolution (0.5° × 0.66°, 1° × 1.25°, 2° × 2.5°, and 4° × 5°). Punger and West [32] reproduced this result for a similar resolution range but found an opposite change in health assessment when comparing estimations between 12 and 36 km. To further examine this resolution range effect, we create PWM PM2.5 at resolutions ranging from 1 to 15 km (in 2 km increments) by simply averaging 1 km PM2.5 concentrations. Although not shown here, we find that, as resolution becomes coarser, PWM PM2.5 gradually increases until reaching a peak at 9 km, after which PWM PM2.5 is relatively flat.
Our study has some limitations. First, this work is limited to the YRD region in 2020. The findings presented here may not be applicable for different periods and/or different regions. Given that the impact of satellite data spatial resolution on the PM2.5 retrieval model likely varies by region, it would be highly interesting to examine regional variation in this resolution impact in the future. This further work should include different representative areas and long-term satellite data. Second, we set a limited spatial resolution range (i.e., 1, 3, 5, and 10 km) to investigate the sensitivity of the PM2.5 retrieval model on AOD spatial resolution. It remains unclear whether our sensitivity findings are reproduced for a wider resolution range (e.g., sub-km scale). Higher spatial resolution satellite data are likely beneficial for PM2.5 retrieval. However, this benefit may be clearly shown when supported by additional refined data, e.g., meteorological fields, given the complex relationship between satellite observation and ground PM2.5 measurements. This speculation is supported by a recent study in which they used ultrahigh-resolution top-of-atmosphere reflectance (TOAR) to build different PM2.5 retrieval models without including additional factors [63]. They found that the model performance changes little, with the resolution varying from 30 m to 9 km (see their Figure 2a). They speculated that incorporating urban micro-climate products may improve the PM2.5 prediction accuracy at a high resolution, e.g., 90 m [63]. In the future, we will further check our findings by using satellite data at higher spatial resolution than MAIAC data (e.g., 20 m AOD product from Sentinel-2), in combination with meteorological fields from Computational Fluid Dynamics (CFD) simulations.
5. Conclusions
Based on Multi-Angle Implementation of Atmospheric Correction (MAIAC) aerosol optical depth (AOD) and other auxiliary data in 2020 over the Yangtze River Delta (YRD), this work investigates the effect of AOD spatial resolution on the performance of satellite-based PM2.5 retrieval models. Overall, we find that the spatial resolution effect varies by method. Specifically, the PM2.5 retrieval model performance is not sensitive to resolution change (i.e., 1, 3, 5 and 10 km) for the mixed effects model (ME) and the land-use regression model (LUR). By contrast, the PM2.5 retrieval model based on Random Forest (RF) can perform a more accurate PM2.5 prediction with a finer AOD spatial resolution. R2 increases from 0.85 to 0.88, and RMSE decreases from 8.6 to 7.9 μg/m3 when comparing the RF model performance between 1 and 10 km. These findings provide further evidence that machine learning may be an effective way to build the AOD–PM2.5 relationship involving different spatial scales.
We also examine the spatial resolution effect on health assessment using the satellite-derived PM2.5 estimation at spatial resolutions of 1, 3, 5 and 10 km. Our results show that annual population-weighted mean (PWM) PM2.5 concentration and attributable mortality gradually increase as the resolution becomes coarser. Mortality estimated at 10 km resolution increases by 18.3%, 8.4% and 7.3% compared to that at 1 km resolution for the LUR, RF and ME models, respectively. Note that PWM PM2.5 at 10 km fails to meet the national air quality standard (35 μg/m3), whereas the estimate at finer resolutions generally meets the standard. These findings suggest that caution is needed when interpreting the health assessment at the coarser resolution for the YRD region. Overall, we recommend using satellite-derived PM2.5 based on a machine learning method and finer spatial resolution AOD data for regional health assessment. Nevertheless, the resolution effect covering a wider range of finer spatial resolution (e.g., <1 km) should be further investigated in the future.
Author Contributions
Conceptualization, H.B.; methodology, Y.S. and W.G.; software, Y.L.; validation, H.B. and M.S.; formal analysis, M.S.; investigation, H.B. and Y.S.; resources, W.G.; data curation, H.B. and W.G.; writing—original draft preparation, H.B.; writing—review and editing, H.B.; visualization, Y.L.; supervision, H.B.; project administration, H.B.; funding acquisition, H.B. and W.G. All authors have read and agreed to the published version of the manuscript.
Funding
This work was funded by the National Key Research and Development Program of China (no. 2018YFC1507701), Jiangsu Provincial Double-Innovation Doctor Program (no. JSSCBS20211072), Nantong University Scientific Research Foundation for the Introduced Talents (no. 135419629079), and the Environmental Science Research Program of Nanjing Municipal Ecology and Environment Bureau (No. 202104).
Data Availability Statement
Publicly available datasets were analyzed in this study. MCD19A2 product was obtained from the NASA Earthdata website (https://earthdata.nasa.gov/ (accessed on 18 October 2021)). Hourly PM2.5 observations at 163 stations over YRD in 2020 were collected from the China National Environmental Monitor Center (CNEMC, http://www.cnemc.cn (accessed on 13 August 2021)). The population data came from the Gridded Population of the World, Version 4, which are available from the Socioeconomic Data and Applications Center (https://sedac.ciesin.columbia.edu/data/collection/gpw-v4 (accessed on 27 June 2021)). The national-level age structure and the age-specific and disease-specific mortality for 2019 were obtained from the Global Burden of Disease Study 2019 (GBD 2019) dataset (https://vizhub.healthdata.org/gbd-compare/ (accessed on 29 March 2021)). Land cover at 30 m resolution for 2020 were obtained from GlobeLand30 dataset (http://www.globallandcover.com/ (accessed on 13 October 2021)). ECMWF ERA5 data were obtained from https://cds.climate.copernicus.eu/ (accessed on 12 October 2021). ChinaHighPM2.5 came from CHAP data set (https://weijing-rs.github.io/product.html (accessed on 19 June 2021)). The data produced in this study are available on request from the corresponding author.
Acknowledgments
The authors appreciate MODIS MAIAC team for the aerosol products used.
Conflicts of Interest
The authors declare that they have no known competing financial interests or personal relationships that could have appeared to influence the work reported in this paper.
References
- Yin, P.; Brauer, M.; Cohen, A.; Burnett, R.T.; Liu, J.; Liu, Y.; Liang, R.; Wang, W.; Qi, J.; Wang, L.; et al. Long-term fine particulate matter exposure and nonaccidental and cause-specific mortality in a large national cohort of chinese men. Environ. Health Perspect. 2017, 125, 117002. [Google Scholar] [CrossRef] [PubMed]
- Liu, C.; Chen, R.; Sera, F.; Vicedo-Cabrera, A.M.; Guo, Y.; Tong, S.; Coelho, M.S.Z.S.; Saldiva, P.H.N.; Lavigne, E.; Matus, P.; et al. Ambient particulate air pollution and daily mortality in 652 cities. N. Engl. J. Med. 2019, 381, 705–715. [Google Scholar] [CrossRef] [PubMed]
- van Donkelaar, A.; Martin, R.V.; Brauer, M.; Hsu, N.C.; Kahn, R.A.; Levy, R.C.; Lyapustin, A.; Sayer, A.M.; Winker, D.M. Global estimates of fine particulate matter using a combined geophysical-statistical method with information from satellites, models, and monitors. Environ. Sci. Technol. 2016, 50, 3762–3772. [Google Scholar] [CrossRef] [PubMed]
- van Donkelaar, A.; Martin, R.V.; Spurr, R.J.D.; Drury, E.; Remer, L.A.; Levy, R.C.; Wang, J. Optimal estimation for global ground-level fine particulate matter concentrations. J. Geophys. Res. Atmos. 2013, 118, 5621–5636. [Google Scholar] [CrossRef] [Green Version]
- Shin, M.; Kang, Y.; Park, S.; Im, J.; Yoo, C.; Quackenbush, L.J. Estimating ground-level particulate matter concentrations using satellite-based data: A review. GISci. Remote Sens. 2020, 57, 174–189. [Google Scholar] [CrossRef]
- Geng, G.; Zhang, Q.; Martin, R.V.; van Donkelaar, A.; Huo, H.; Che, H.; Lin, J.; He, K. Estimating long-term PM2.5 concentrations in China using satellite-based aerosol optical depth and a chemical transport model. Remote Sens. Environ. 2015, 166, 262–270. [Google Scholar] [CrossRef]
- Lin, C.; Li, Y.; Lau, A.K.H.; Deng, X.; Tse, T.K.T.; Fung, J.C.H.; Li, C.; Li, Z.; Lu, X.; Zhang, X.; et al. Estimation of long-term population exposure to PM2.5 for dense urban areas using 1-km MODIS data. Remote Sens. Environ. 2016, 179, 13–22. [Google Scholar] [CrossRef] [Green Version]
- Park, Y.; Kwon, B.; Heo, J.; Hu, X.; Liu, Y.; Moon, T. Estimating PM2.5 concentration of the conterminous United States via interpretable convolutional neural networks. Environ. Pollut. 2020, 256, 113395. [Google Scholar] [CrossRef]
- van Donkelaar, A.; Martin, R.V.; Brauer, M.; Boys, B.L. Use of satellite observations for long-term exposure assessment of global concentrations of fine particulate matter. Environ. Health Perspect. 2015, 123, 135–143. [Google Scholar] [CrossRef] [Green Version]
- Di, Q.; Kloog, I.; Koutrakis, P.; Lyapustin, A.; Wang, Y.; Schwartz, J. Assessing PM 2.5 exposures with high spatiotemporal resolution across the continental United States. Environ. Sci. Technol. 2016, 50, 4712–4721. [Google Scholar] [CrossRef] [Green Version]
- Wei, J.; Li, Z.; Cribb, M.; Huang, W.; Xue, W.; Sun, L.; Guo, J.; Peng, Y.; Li, J.; Lyapustin, A.; et al. Improved 1 km resolution PM2.5 estimates across China using enhanced space–time extremely randomized trees. Atmos. Chem. Phys. 2020, 20, 3273–3289. [Google Scholar] [CrossRef] [Green Version]
- Wei, J.; Li, Z.; Lyapustin, A.; Sun, L.; Peng, Y.; Xue, W.; Su, T.; Cribb, M. Reconstructing 1-km-resolution high-quality PM2.5 data records from 2000 to 2018 in China: Spatiotemporal variations and policy implications. Remote Sens. Environ. 2021, 252, 112136. [Google Scholar] [CrossRef]
- Geng, G.; Xiao, Q.; Liu, S.; Liu, X.; Cheng, J.; Zheng, Y.; Xue, T.; Tong, D.; Zheng, B.; Peng, Y.; et al. Tracking air pollution in China: Near real-time PM 2.5 retrievals from multisource data fusion. Environ. Sci. Technol. 2021, 55, 12106–12115. [Google Scholar] [CrossRef] [PubMed]
- Zhang, Z.; Wang, J.; Hart, J.E.; Laden, F.; Zhao, C.; Li, T.; Zheng, P.; Li, D.; Ye, Z.; Chen, K. National scale spatiotemporal land-use regression model for PM2.5, PM10 and NO2 concentration in China. Atmos. Environ. 2018, 192, 48–54. [Google Scholar] [CrossRef]
- Bai, H.; Zheng, Z.; Zhang, Y.; Huang, H.; Wang, L. Comparison of satellite-based PM2.5 estimation from aerosol optical depth and top-of-atmosphere reflectance. Aerosol Air Qual. Res. 2021, 21, 1–17. [Google Scholar] [CrossRef]
- Xiao, Q.; Wang, Y.; Chang, H.H.; Meng, X.; Geng, G.; Lyapustin, A.; Liu, Y. Full-coverage high-resolution daily PM 2.5 estimation using MAIAC AOD in the Yangtze River Delta of China. Remote Sens. Environ. 2017, 199, 437–446. [Google Scholar] [CrossRef]
- Ma, Z.; Liu, Y.; Zhao, Q.; Liu, M.; Zhou, Y.; Bi, J. Satellite-derived high resolution PM2.5 concentrations in Yangtze River Delta Region of China using improved linear mixed effects model. Atmos. Environ. 2016, 133, 156–164. [Google Scholar] [CrossRef]
- Zheng, Y.; Zhang, Q.; Liu, Y.; Geng, G.; He, K. Estimating ground-level PM2.5 concentrations over three megalopolises in China using satellite-derived aerosol optical depth measurements. Atmos. Environ. 2016, 124, 232–242. [Google Scholar] [CrossRef]
- Jiang, M.; Sun, W.; Yang, G.; Zhang, D. Modelling seasonal GWR of daily PM2.5 with proper auxiliary variables for the Yangtze River Delta. Remote Sens. 2017, 9, 346. [Google Scholar] [CrossRef] [Green Version]
- Wang, J.; He, L.; Lu, X.; Zhou, L.; Tang, H.; Yan, Y.; Ma, W. A full-coverage estimation of PM2.5 concentrations using a hybrid XGBoost-WD model and WRF-simulated meteorological fields in the Yangtze River Delta Urban Agglomeration, China. Environ. Res. 2022, 203, 111799. [Google Scholar] [CrossRef]
- Li, R.; Mei, X.; Chen, L.; Wang, Z.; Jing, Y.; Wei, L. Influence of spatial resolution and retrieval frequency on applicability of satellite-predicted PM2.5 in Northern China. Remote Sens. 2020, 12, 736. [Google Scholar] [CrossRef] [Green Version]
- Hu, X.; Waller, L.A.; Lyapustin, A.; Wang, Y.; Al-Hamdan, M.Z.; Crosson, W.L.; Estes, M.G.; Estes, S.M.; Quattrochi, D.A.; Puttaswamy, S.J.; et al. Estimating ground-level PM2.5 concentrations in the Southeastern United States using MAIAC AOD retrievals and a two-stage model. Remote Sens. Environ. 2014, 140, 220–232. [Google Scholar] [CrossRef]
- Lee, M.; Kloog, I.; Chudnovsky, A.; Lyapustin, A.; Wang, Y.; Melly, S.; Coull, B.; Koutrakis, P.; Schwartz, J. Spatiotemporal prediction of fine particulate matter using high-resolution satellite images in the Southeastern US 2003–2011. J. Expo. Sci. Environ. Epidemiol. 2016, 26, 377–384. [Google Scholar] [CrossRef] [PubMed] [Green Version]
- Yang, Q.; Yuan, Q.; Yue, L.; Li, T.; Shen, H.; Zhang, L. Mapping PM2.5 concentration at a sub-km level resolution: A dual-scale retrieval approach. ISPRS J. Photogramm. Remote Sens. 2020, 165, 140–151. [Google Scholar] [CrossRef]
- Wang, C.; Wang, Y.; Shi, Z.; Sun, J.; Gong, K.; Li, J.; Qin, M.; Wei, J.; Li, T.; Kan, H.; et al. Effects of using different exposure data to estimate changes in premature mortality attributable to PM2.5 and O3 in China. Environ. Pollut. 2021, 285, 117242. [Google Scholar] [CrossRef] [PubMed]
- Ford, B.; Heald, C.L. Exploring the uncertainty associated with satellite-based estimates of premature mortality due to exposure to fine particulate matter. Atmos. Chem. Phys. 2016, 16, 3499–3523. [Google Scholar] [CrossRef] [PubMed] [Green Version]
- Ghude, S.D.; Chate, D.M.; Jena, C.; Beig, G.; Kumar, R.; Barth, M.C.; Pfister, G.G.; Fadnavis, S.; Pithani, P. Premature mortality in India due to PM 2.5 and ozone exposure. Geophys. Res. Lett. 2016, 43, 4650–4658. [Google Scholar] [CrossRef] [Green Version]
- Li, T.; Guo, Y.; Liu, Y.; Wang, J.; Wang, Q.; Sun, Z.; He, M.Z.; Shi, X. Estimating mortality burden attributable to short-term PM2.5 exposure: A national observational study in China. Environ. Int. 2019, 125, 245–251. [Google Scholar] [CrossRef]
- Lu, X.; Lin, C.; Li, W.; Chen, Y.; Huang, Y.; Fung, J.C.H.; Lau, A.K.H. Analysis of the adverse health effects of PM2.5 from 2001 to 2017 in China and the role of urbanization in aggravating the health burden. Sci. Total Environ. 2019, 652, 683–695. [Google Scholar] [CrossRef]
- Apte, J.S.; Marshall, J.D.; Cohen, A.J.; Brauer, M. Addressing global mortality from ambient PM 2.5. Environ. Sci. Technol. 2015, 49, 8057–8066. [Google Scholar] [CrossRef]
- Li, J.; Liu, H.; Lv, Z.; Zhao, R.; Deng, F.; Wang, C.; Qin, A.; Yang, X. Estimation of PM2.5 mortality burden in China with new exposure estimation and local concentration-response function. Environ. Pollut. 2018, 243, 1710–1718. [Google Scholar] [CrossRef] [PubMed]
- Punger, E.M.; West, J.J. The effect of grid resolution on estimates of the burden of ozone and fine particulate matter on premature mortality in the USA. Air Qual. Atmos. Health 2013, 6, 563–573. [Google Scholar] [CrossRef] [PubMed]
- Parvez, F.; Wagstrom, K. Impact of regional versus local resolution air quality modeling on particulate matter exposure health impact assessment. Air Qual. Atmos. Health 2020, 13, 271–279. [Google Scholar] [CrossRef]
- Korhonen, A.; Lehtomäki, H.; Rumrich, I.; Karvosenoja, N.; Paunu, V.-V.; Kupiainen, K.; Sofiev, M.; Palamarchuk, Y.; Kukkonen, J.; Kangas, L.; et al. Influence of spatial resolution on population PM2.5 exposure and health impacts. Air Qual. Atmos. Health 2019, 12, 705–718. [Google Scholar] [CrossRef] [Green Version]
- Li, Y.; Henze, D.K.; Jack, D.; Kinney, P.L. The influence of air quality model resolution on health impact assessment for fine particulate matter and its components. Air Qual. Atmos. Health 2016, 9, 51–68. [Google Scholar] [CrossRef] [Green Version]
- Hu, C.; Liu, S.; Wang, Y.; Zhang, M.; Xiao, W.; Wang, W.; Xu, J. Anthropogenic CO2 emissions from a megacity in the Yangtze River Delta of China. Environ. Sci. Pollut. Res. 2018, 25, 23157–23169. [Google Scholar] [CrossRef]
- Lyapustin, A.; Wang, Y.; Korkin, S.; Huang, D. MODIS Collection 6 MAIAC algorithm. Atmos. Meas. Tech. 2018, 11, 5741–5765. [Google Scholar] [CrossRef] [Green Version]
- Lyapustin, A.; Wang, Y.; Laszlo, I.; Kahn, R.; Korkin, S.; Remer, L.; Levy, R.; Reid, J.S. Multiangle implementation of atmospheric correction (MAIAC): 2. Aerosol algorithm. J. Geophys. Res. 2011, 116, D03211. [Google Scholar] [CrossRef]
- Zhang, Z.; Wu, W.; Fan, M.; Wei, J.; Tan, Y.; Wang, Q. Evaluation of MAIAC aerosol retrievals over China. Atmos. Environ. 2019, 202, 8–16. [Google Scholar] [CrossRef]
- Barrero, M.A.; Orza, J.A.G.; Cabello, M.; Cantón, L. Categorisation of air quality monitoring stations by evaluation of PM10 variability. Sci. Total Environ. 2015, 524, 225–236. [Google Scholar] [CrossRef]
- Doxsey-Whitfield, E.; MacManus, K.; Adamo, S.B.; Pistolesi, L.; Squires, J.; Borkovska, O.; Baptista, S.R. Taking advantage of the improved availability of census data: A first look at the gridded population of the world, version 4. Pap. Appl. Geogr. 2015, 1, 226–234. [Google Scholar] [CrossRef]
- Lee, H.J.; Liu, Y.; Coull, B.A.; Schwartz, J.; Koutrakis, P. A novel calibration approach of MODIS AOD data to predict PM2.5 concentrations. Atmos. Chem. Phys. 2011, 11, 7991–8002. [Google Scholar] [CrossRef] [Green Version]
- Shi, T.; Hu, Y.; Liu, M.; Li, C.; Zhang, C.; Liu, C. Land use regression modelling of PM2.5 spatial variations in different seasons in urban areas. Sci. Total Environ. 2020, 743, 140744. [Google Scholar] [CrossRef] [PubMed]
- Bai, H.; Yan, R.; Gao, W.; Wei, J.; Seong, M. Spatial representativeness of PM2.5 monitoring stations and its implication for health assessment. Air Qual. Atmos. Health 2022, 1, 1–11. [Google Scholar] [CrossRef]
- Breiman, L. Random forests. Mach. Learn. 2001, 45, 5–23. [Google Scholar] [CrossRef] [Green Version]
- Tin Kam Ho Random decision forests. In Proceedings of the 3rd International Conference on Document Analysis and Recognition, Montreal, QC, Canada, 14–16 August 1995; Volume 1, pp. 278–282.
- GBD 2019 Risk Factors Collaborators Global burden of 87 risk factors in 204 countries and territories, 1990–2019: A systematic analysis for the Global Burden of Disease Study 2019. Lancet 2020, 396, 1223–1249. [CrossRef]
- McDuffie, E.E.; Martin, R.V.; Spadaro, J.V.; Burnett, R.; Smith, S.J.; O’Rourke, P.; Hammer, M.S.; van Donkelaar, A.; Bindle, L.; Shah, V.; et al. Source sector and fuel contributions to ambient PM2.5 and attributable mortality across multiple spatial scales. Nat. Commun. 2021, 12, 3594. [Google Scholar] [CrossRef]
- Yang, Q.; Yuan, Q.; Yue, L.; Li, T.; Shen, H.; Zhang, L. The relationships between PM2.5 and aerosol optical depth (AOD) in mainland China: About and behind the spatio-temporal variations. Environ. Pollut. 2019, 248, 526–535. [Google Scholar] [CrossRef]
- Christensen, M.W.; Neubauer, D.; Poulsen, C.A.; Thomas, G.E.; McGarragh, G.R.; Povey, A.C.; Proud, S.R.; Grainger, R.G. Unveiling aerosol–cloud interactions—Part 1: Cloud contamination in satellite products enhances the aerosol indirect forcing estimate. Atmos. Chem. Phys. 2017, 17, 13151–13164. [Google Scholar] [CrossRef] [Green Version]
- Chand, D.; Wood, R.; Ghan, S.J.; Wang, M.; Ovchinnikov, M.; Rasch, P.J.; Miller, S.; Schichtel, B.; Moore, T. Aerosol optical depth increase in partly cloudy conditions. J. Geophys. Res. Atmos. 2012, 117. [Google Scholar] [CrossRef]
- Zhao, W.; Zhang, N.; Sun, J. Spatiotemporal variations of cloud amount over the Yangtze River Delta, China. J. Meteorol. Res. 2014, 28, 371–380. [Google Scholar] [CrossRef]
- Wang, Y.; Wang, J.; Levy, R.C.; Shi, Y.R.; Mattoo, S.; Reid, J.S. First retrieval of AOD at fine resolution over shallow and turbid coastal waters from MODIS. Geophys. Res. Lett. 2021, 48, 1–9. [Google Scholar] [CrossRef]
- Chudnovsky, A.A.; Kostinski, A.; Lyapustin, A.; Koutrakis, P. Spatial scales of pollution from variable resolution satellite imaging. Environ. Pollut. 2013, 172, 131–138. [Google Scholar] [CrossRef] [PubMed]
- Chudnovsky, A.A.; Tang, C.; Lyapustin, A.; Wang, Y.; Schwartz, J.; Koutrakis, P. A critical assessment of high-resolution aerosol optical depth retrievals for fine particulate matter predictions. Atmos. Chem. Phys. 2013, 13, 10907–10917. [Google Scholar] [CrossRef] [Green Version]
- Mei, L.; Strandgren, J.; Rozanov, V.; Vountas, M.; Burrows, J.P.; Wang, Y. A study of the impact of spatial resolution on the estimation of particle matter concentration from the aerosol optical depth retrieved from satellite observations. Int. J. Remote Sens. 2019, 40, 7084–7112. [Google Scholar] [CrossRef]
- Wu, J.; Liang, J.; Zhou, L.; Yao, F.; Peng, J. Impacts of AOD correction and spatial scale on the correlation between high-resolution AOD from gaofen-1 satellite and in situ PM2.5 measurements in Shenzhen City, China. Remote Sens. 2019, 11, 2223. [Google Scholar] [CrossRef] [Green Version]
- Wang, Z.; Chen, L.; Tao, J.; Zhang, Y.; Su, L. Satellite-based estimation of regional particulate matter (PM) in Beijing using vertical-and-RH correcting method. Remote Sens. Environ. 2010, 114, 50–63. [Google Scholar] [CrossRef]
- Zheng, T.; Bergin, M.H.; Hu, S.; Miller, J.; Carlson, D.E. Estimating ground-level PM2.5 using micro-satellite images by a convolutional neural network and random forest approach. Atmos. Environ. 2020, 230, 117451. [Google Scholar] [CrossRef]
- Karvosenoja, N.; Kangas, L.; Kupiainen, K.; Kukkonen, J.; Karppinen, A.; Sofiev, M.; Tainio, M.; Paunu, V.V.; Ahtoniemi, P.; Tuomisto, J.T.; et al. Integrated modeling assessments of the population exposure in Finland to primary PM2.5 from traffic and domestic wood combustion on the resolutions of 1 and 10 km. Air Qual. Atmos. Health 2011, 4, 179–188. [Google Scholar] [CrossRef]
- Tainio, M.; Sofiev, M.; Hujo, M.; Tuomisto, J.T.; Loh, M.; Jantunen, M.J.; Karppinen, A.; Kangas, L.; Karvosenoja, N.; Kupiainen, K.; et al. Evaluation of the European population intake fractions for European and Finnish anthropogenic primary fine particulate matter emissions. Atmos. Environ. 2009, 43, 3052–3059. [Google Scholar] [CrossRef]
- Thompson, T.M.; Saari, R.K.; Selin, N.E. Air quality resolution for health impact assessment: Influence of regional characteristics. Atmos. Chem. Phys. 2014, 14, 969–978. [Google Scholar] [CrossRef] [Green Version]
- Yang, Q.; Yuan, Q.; Li, T. Ultrahigh-resolution PM2.5 estimation from top-of-atmosphere reflectance with machine learning: Theories, methods, and applications. Environ. Pollut. 2022, 306, 119347. [Google Scholar] [CrossRef] [PubMed]
Figure 1.
Panel (a) presents the locations of PM2.5 monitoring stations (magenta dots) and DEM at 1 km spatial resolution in the Yangtze River Delta. Panel (b) shows the spatial distribution of the natural logarithm of population count in 2020.
Figure 1.
Panel (a) presents the locations of PM2.5 monitoring stations (magenta dots) and DEM at 1 km spatial resolution in the Yangtze River Delta. Panel (b) shows the spatial distribution of the natural logarithm of population count in 2020.

Figure 2.
(a) The correlation coefficients between PM2.5 concentration and AOD at the resolutions of 1, 3, 5 and 10 km over the Yangtze River Delta for different seasons. Based on the spatial AOD–PM2.5 correlation for each day in summer, the box-and-whisker in panel (b) shows 10th, 25th, 50th, 75th and 90th percentile values of the correlation for different resolutions. Note that the spatial AOD–PM2.5 correlation for a given day is excluded in panel (b) if the number of AOD–PM2.5 pairs is less than 10.

Figure 3.
The spatial distributions of AOD and PM2.5 concentration on 15 August 2020 at the resolutions of (a) 1, (b) 3, (c) 5 and (d) 10 km. The colored dots and background color represent PM2.5 concentration and AOD, respectively. The inset in each panel is the scatterplot between PM2.5 and AOD.
Figure 3.
The spatial distributions of AOD and PM2.5 concentration on 15 August 2020 at the resolutions of (a) 1, (b) 3, (c) 5 and (d) 10 km. The colored dots and background color represent PM2.5 concentration and AOD, respectively. The inset in each panel is the scatterplot between PM2.5 and AOD.

Figure 4.
Scatter plots of 10-fold cross validation (CV) results for the mixed effects (ME) model at the resolutions of (a) 1, (b) 3, (c) 5 and (d) 10 km. The color bar represents the counts of samples. R2, RMSE and N are the coefficient of determination, root-mean-square error and number of samples, respectively. The dashed line stands for the 1:1 line.

Figure 5.
Scatter plots of 10-fold cross validation (CV) results for the land-use regression (LUR) model at the resolutions of (a) 1, (b) 3, (c) 5 and (d) 10 km. The color bar represents the counts of samples. R2, RMSE and N are the coefficient of determination, root-mean-square error and number of samples, respectively. The dashed line stands for the 1:1 line.

Figure 6.
Scatter plots of 10-fold cross validation (CV) results for the Random Forest (RF) model at the resolutions of (a) 1, (b) 3, (c) 5 and (d) 10 km. The color bar represents the counts of samples. R2, RMSE and N are the coefficient of determination, root-mean-square error and number of samples, respectively. The dashed line stands for the 1:1 line.

Figure 7.
Spatial distribution of annual PM2.5 in 2020 over the YRD region from our (a) 1 km RF model and (b) CHAP dataset (https://weijing-rs.github.io/product.html (accessed on 19 June 2021)).
Figure 7.
Spatial distribution of annual PM2.5 in 2020 over the YRD region from our (a) 1 km RF model and (b) CHAP dataset (https://weijing-rs.github.io/product.html (accessed on 19 June 2021)).

Figure 8.
(a) Annual population-weighted mean (PWM) PM2.5 and (b) difference in attributable mortality as a function of spatial resolution. Red, green and blue lines in each panel represent results estimated by the mixed effects (ME), the land-use regression (LUR) and the Random Forest (RF) models, respectively.

Figure 9.
(a) Spatial distribution of annual PM2.5 at 1 km and (b–d) its difference from coarser resolutions. PM2.5 retrievals in this figure are based on the Random Forest (RF) model. Annual PM2.5 estimations at 1 km are first aggregated to arithmetic mean values at a coarse resolution. Then, these aggregated values are compared to that from the PM2.5 retrieval model at the coarse resolution.

Figure 10.
Annual population-weighted mean (PWM) PM2.5 as a function of spatial resolution. Panels (a,b) are based on PM2.5 retrievals from the mixed effects (ME) and Random Forest (RF) models. Red, green and blue lines in each panel stand for sub-region 1 (northeast YRD), sub-region 2 (northwest YRD) and sub-region 3 (southern YRD), respectively. See Figure 1a for different sub-regions.

Figure 11.
Spatial distribution of (top panels) annual PM2.5 estimated by the Random Forest (RF) model and (bottom panels) population in northeast YRD (sub-region 1 in Figure 1a) for the resolutions of (a,e) 1, (b,f) 3, (c,g) 5 and (d,h) 10 km. Population data in bottom panels are normalized by using standardized z-scores.


Table 1.
Comparison of performances of different AOD-based PM2.5 retrieval models in the Yangtze River Delta region.
Table 1.
Comparison of performances of different AOD-based PM2.5 retrieval models in the Yangtze River Delta region.
| Related Study | Model | Spatial Resolution | Model Cross-Validation | |
|---|---|---|---|---|
| R2 | RMSE | |||
| Zheng et al. [18] | LME | 10 km | 0.80 | 17.89 |
| Ma et al. [17] | LME | 10 km | 0.73 | 18.30 |
| 3 km | 0.67 | 15.82 | ||
| Jiang et al. [19] | GWR | 10 km | 0.79 | - |
| Xiao et al. [16] | Two-stage | 1 km | 0.77 | - |
| Bai et al. [15] | RF | 5 km | 0.65 | 15.69 |
| Wang et al. [20] | XGBoost | 3 km | 0.80 | 11.57 |
| This study | ME | 1 km | 0.78 | 10.39 |
| 3 km | 0.78 | 10.25 | ||
| 5 km | 0.78 | 10.20 | ||
| 10 km | 0.78 | 10.39 | ||
| This study | LUR | 1 km | 0.51 | 15.72 |
| 3 km | 0.51 | 15.49 | ||
| 5 km | 0.51 | 15.46 | ||
| 10 km | 0.52 | 15.57 | ||
| This study | RF | 1 km | 0.88 | 7.86 |
| 3 km | 0.84 | 8.71 | ||
| 5 km | 0.84 | 8.80 | ||
| 10 km | 0.85 | 8.60 | ||
LME: linear mixed effect; GWR: geographically weighted regression; RF: Random Forest; XGBoost: extreme gradient boosting; ME: mixed effect; LUR: land-use regression. Input predictors for the ME model in this study only include AOD, whereas the LME model requires additional input predictors, e.g., air temperature.
Table 2.
Main statistics of annual (2020) PM2.5 concentration (μg/m3) estimated by the mixed effects (ME), the land-use regression (LUR) and the Random Forest (RF) models.
Table 2.
Main statistics of annual (2020) PM2.5 concentration (μg/m3) estimated by the mixed effects (ME), the land-use regression (LUR) and the Random Forest (RF) models.
| PM2.5 Retrieval Models | Statistics | Spatial Resolutions | |||
|---|---|---|---|---|---|
| 1 km | 3 km | 5 km | 10 km | ||
| ME model | Mean | 37.0 | 36.3 | 35.7 | 35.4 |
| SD | 2.2 | 2.2 | 2.1 | 2.3 | |
| IQR | 2.9 | 3.0 | 3.0 | 3.2 | |
| LUR model | Mean | 23.6 | 32.2 | 31.2 | 33.8 |
| SD | 25.1 | 8.0 | 11.7 | 7.9 | |
| IQR | 21.6 | 8.9 | 14.2 | 8.9 | |
| RF model | Mean | 36.3 | 36.4 | 35.7 | 35.9 |
| SD | 4.0 | 4.2 | 4.7 | 4.6 | |
| IQR | 6.2 | 6.4 | 7.3 | 7.0 | |
Notes: SD, standard deviation; IQR, interquartile range.
Publisher’s Note: MDPI stays neutral with regard to jurisdictional claims in published maps and institutional affiliations. |
© 2022 by the authors. Licensee MDPI, Basel, Switzerland. This article is an open access article distributed under the terms and conditions of the Creative Commons Attribution (CC BY) license (https://creativecommons.org/licenses/by/4.0/).
Share and Cite
MDPI and ACS Style
Bai, H.; Shi, Y.; Seong, M.; Gao, W.; Li, Y. Influence of Spatial Resolution on Satellite-Based PM2.5 Estimation: Implications for Health Assessment. Remote Sens. 2022, 14, 2933. https://0-doi-org.brum.beds.ac.uk/10.3390/rs14122933
AMA Style
Bai H, Shi Y, Seong M, Gao W, Li Y. Influence of Spatial Resolution on Satellite-Based PM2.5 Estimation: Implications for Health Assessment. Remote Sensing. 2022; 14(12):2933. https://0-doi-org.brum.beds.ac.uk/10.3390/rs14122933
Chicago/Turabian StyleBai, Heming, Yuli Shi, Myeongsu Seong, Wenkang Gao, and Yuanhui Li. 2022. "Influence of Spatial Resolution on Satellite-Based PM2.5 Estimation: Implications for Health Assessment" Remote Sensing 14, no. 12: 2933. https://0-doi-org.brum.beds.ac.uk/10.3390/rs14122933
Note that from the first issue of 2016, this journal uses article numbers instead of page numbers. See further details here.