
Satellite-Observed Thermal Anomalies and Deformation Patterns Associated to the 2021, Central Crete Seismic Sequence


1
Institute of Physics of the Earth’s Interior & Geohazards, UNESCO Chair on Solid Earth Physics and Geohazards Risk Reduction, Hellenic Mediterranean University Research Center, 73133 Chania, Greece
2
Faculty of Electronic Engineering, Hellenic Mediterranean University, Romanou 3, 73133 Chania, Greece
3
Department of Geophysics and Geothermics, Faculty of Geology and Geoenvironment, National and Kapodistrian University of Athens, 15784 Athens, Greece
*
Author to whom correspondence should be addressed.
Remote Sens. 2022, 14(14), 3413; https://0-doi-org.brum.beds.ac.uk/10.3390/rs14143413
Submission received: 9 June 2022
/
Revised: 13 July 2022
/
Accepted: 14 July 2022
/
Published: 16 July 2022
(This article belongs to the Special Issue Application of Satellite Remote Sensing in Solving Urban Geo-Environmental Issues)
Abstract
:Nowadays, there has been a growing interest in understanding earthquake forerunners, i.e., anomalous variations that are possibly associated with the complex process of earthquake evolution. In this context, the Robust Satellite Technique was coupled with 10 years (2012–2021) of daily night-time MODIS-Land Surface Temperature remote sensing data to detect thermal anomalies likely related to the 27 September 2021, strong onshore earthquake of magnitude Mw6.0 occurring near the Arkalochori village in Central Crete, Greece. Eight intense (signal-to-noise ratio > 3) and infrequent, quite extensive, and temporally persistent thermal signal transients were detected and characterized as pre-seismic anomalies, while one thermal signal transient was identified as a co-seismic effect on the day of the main tectonic event. The thermal anomalies dataset was combined with tectonic parameters of Central Crete, such as active faults and fault density, seismogenic zones and ground displacement maps produced using Sentinel-1 satellite imagery and the Interferometric Synthetic Aperture Radar technique. Regarding the thermal anomaly of 27 September, its greatest portion was observed over the footwall part of the fault where a significant subsidence up to 20 cm exists. We suggest that the thermal anomalies are possibly connected with gas release which happens due to stress changes and is controlled by the existence of tectonic lines and the density of the faults, even if alternative explanations could not be excluded.
1. Introduction
Recently, a growing interest in the physics of precursors that could be used to develop a system for short-term (days to weeks) forecasting of strong earthquake events and support the understanding of the evolution of seismicity exists [1]. To create a multiparametric prediction system, it would first be necessary to identify the parameters whose anomalous variants might be potentially related to the complex and dynamic tectonic processes [2,3].
Among the various parameters, variations in the Earth’s emitted thermal radiation measured by space-born sensors operating in the thermal infrared (TIR) spectrum and the variations on the Earth’s surface deformation recorded by satellite radar interferometry have long been suggested as potential precursors [3,4]. Nevertheless, although much research has been undertaken on the investigation of several precursors simultaneously (e.g., [5]), the analysis of patterns of the different parameters has attracted less attention.
Several satellite sensors, which have channels in the infrared portion of the electromagnetic spectrum, can monitor Earth’s thermal field and generate a Land Surface Temperature (LST) product with variable spatiotemporal resolution depending on the satellite/sensor system chosen [6,7,8,9]. Therefore, LST can be used as a critical guide to the understanding of land surface processes at various scales [10,11,12,13,14,15,16,17,18,19,20] and environments, especially in areas with a variability in geophysical parameters such as vegetation, topography, geology and geomorphometry.
On 27 September 2021, a rare and strong onshore earthquake of magnitude Mw6.0 occurred in Central Crete, near the village of Arkalochori at 06:17:21 UTC [21]. The epicenter of the seismic event was located at latitude 35.15 N and longitude 25.27 E, while the focal depth was about 10 km and associated with the Kastelli Fault Zone [22] whose mean recurrence interval has been estimated at approximately 800 years [23]. Since the beginning of June, almost 4 months earlier, a significant number of foreshocks had beenrecorded in the broader area, while a rich aftershock sequence was observed in the months after the main shock occurrence [21,22,24,25]. On 24 July, a strong preseismic event appeared with magnitude Mw4.8. After that, more than 250 earthquakes with magnitudes up to 3.8 were recorded in an approximately N-S-oriented, 15-km-long area west of Arkalochori until the occurrence of the main event [24,26]. Eight aftershocks of magnitudes equal to or greater than M4.2 occurred during the day of the main event, while the strongest aftershock occurred on 28 September with Mw5.3. The earthquake had devastating consequences in the area near the Arkalochori village as one person lost his life, while many buildings collapsed affecting thousands of people.
The objective of the present work is to identify thermal anomalies associated with the rare major tectonic deformation event of Central Crete and to correlate them with co-seismic regional crustal deformation. Thermal and crustal deformation anomalies will be calculated using data mining techniques over a period of three months before and one month after the occurrence of the earthquake; similarities or discrepancies between the behavioral changes of these anomalies will then be analyzed. Based on a preliminary analysis, we note that in the period May 2021 to July 2021, where the first foreshock appeared, no thermal anomalies were observed in the region.
The Robust Satellite Techniques (RST) [27,28,29] was used to detect the spatial evolution of thermal anomalies probably connected with the evolution of the seismic sequence. During the last two decades, the RST has been widely used to distinguish thermal signals possibly related with earthquake evolution from variations in the Earth’s thermal emission due to other phenomena [27,28,29]. For the RST, any anomaly in the space–time domain is considered as a deviation from a “normal” behavior. The latter can be calculated by processing a multiyear dataset of cloud-free satellite images of the same month, the same spectral channel (s) and the same acquisition times.
In addition, the regional co-seismic deformation was mapped using the Interferometric Synthetic Aperture Radar (InSAR) technique. The term SAR stands for Synthetic Aperture Radar [30]. SAR systems that record microwave radiation are called active because of their ability to emit pulses of microwave radiation lasting a few minutes, thus being autonomous sources of energy. The recording of the pulse return time by the satellite sensors determines the position of the earth features on the image. Compared to conventional geodetic methods, the ability of radar to measure distances through time and at an angle, over long distances from either two different systems or with repeated shots of the same system was a new technique, Interferometric SAR (InSAR). Differential Interferometry (Differential InSAR technique-DInSAR) is an advanced technique [31] aimed at detecting surface movements due to geophysical phenomena or human interventions. Since the 1990s, the DInSAR technique has proven to be an interesting tool for measuring and observing ground deformation suitable for analyzing geodynamic processes (e.g., [32,33,34,35]). In this context, we used SAR images of the Sentinel-1 Copernicus satellite in both ascending and descending orbits to create the differential interferograms and to produce deformation patterns through phase unwrapping, using open ESA’s SNAP software.
The contribution of the present work is to study thermal anomalies observed before a very rare and strong earthquake event. Its innovation is that it associates the observed thermal anomalies with regional tectonic characteristics. We note that the thermal anomalies mapped in the area are coupled with co-seismic deformation patterns observed by the InSAR method.
2. Geotectonic Setting
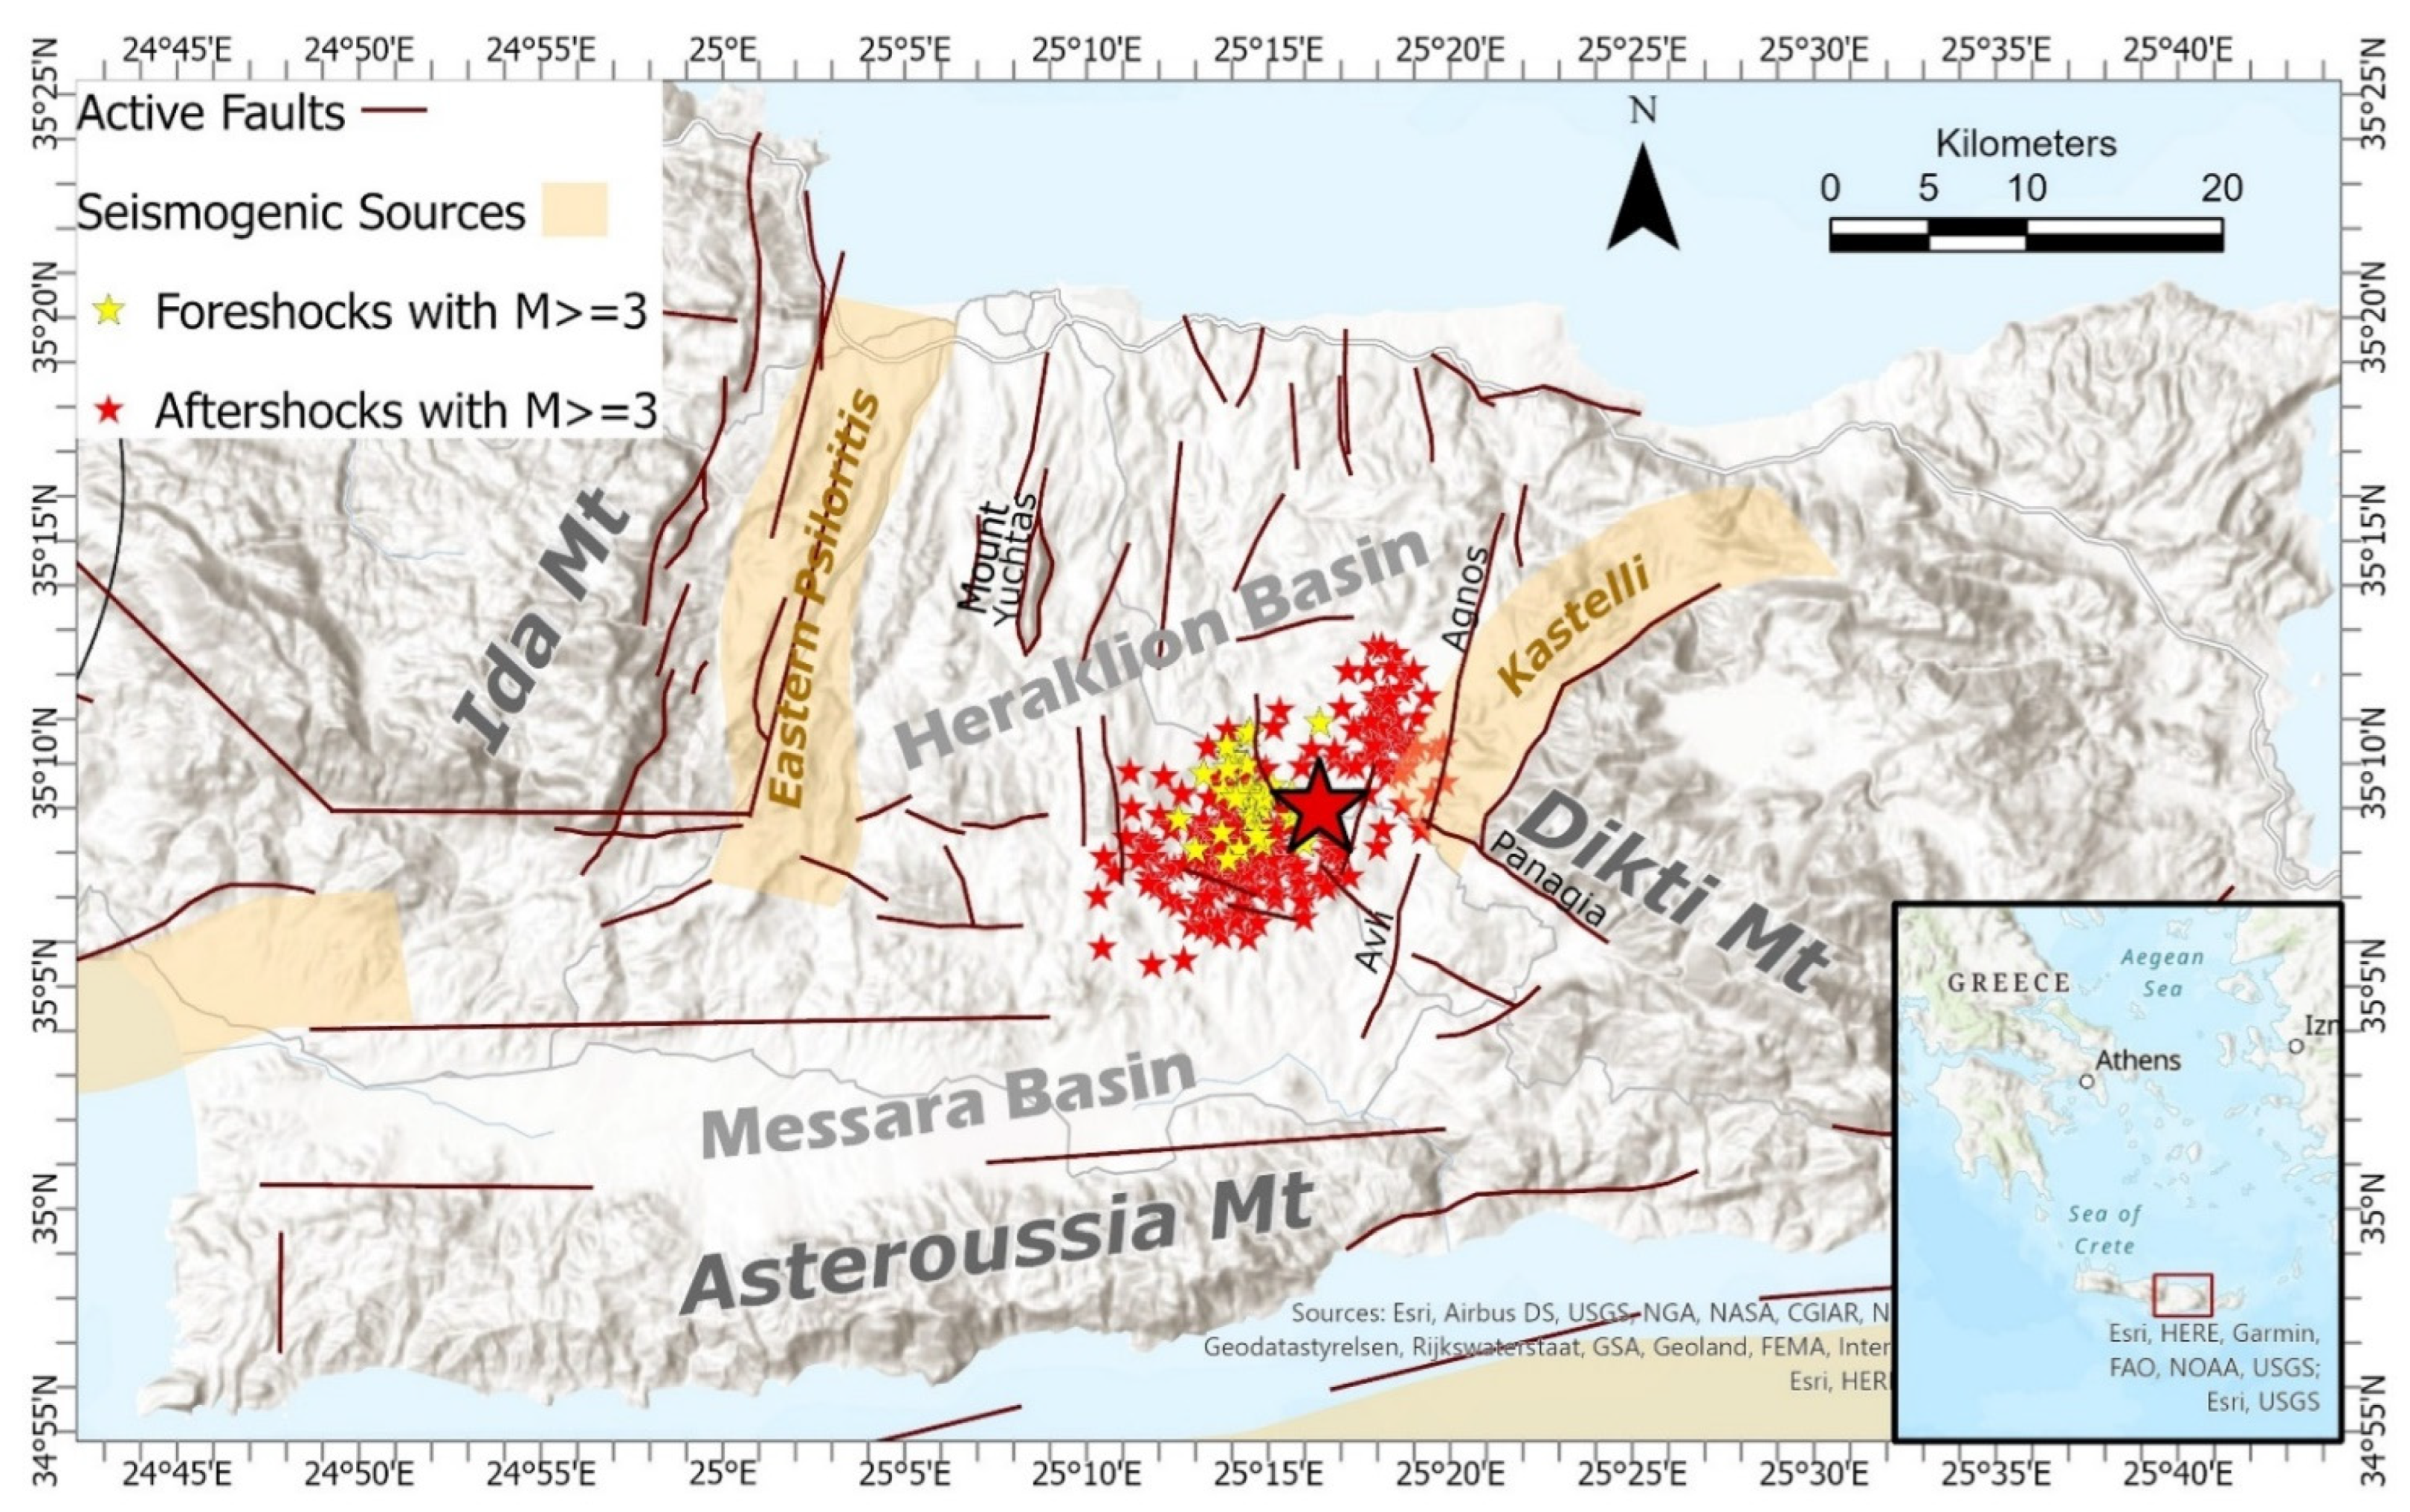
Crete is situated at the southernmost part of the Hellenic Island arc and has high seismic activity due to the subduction of the African plate underneath the Eurasian plate [36,37,38]. Both extensional and compressional stresses that exist in this area result in the creation of an extremely complex tectonic environment characterized by significant horizontal and vertical movements [39]. The Heraklion tectonic graben to the north and the Messara tectonic graben in the southwest dominate the central Crete region on shore (Figure 1).
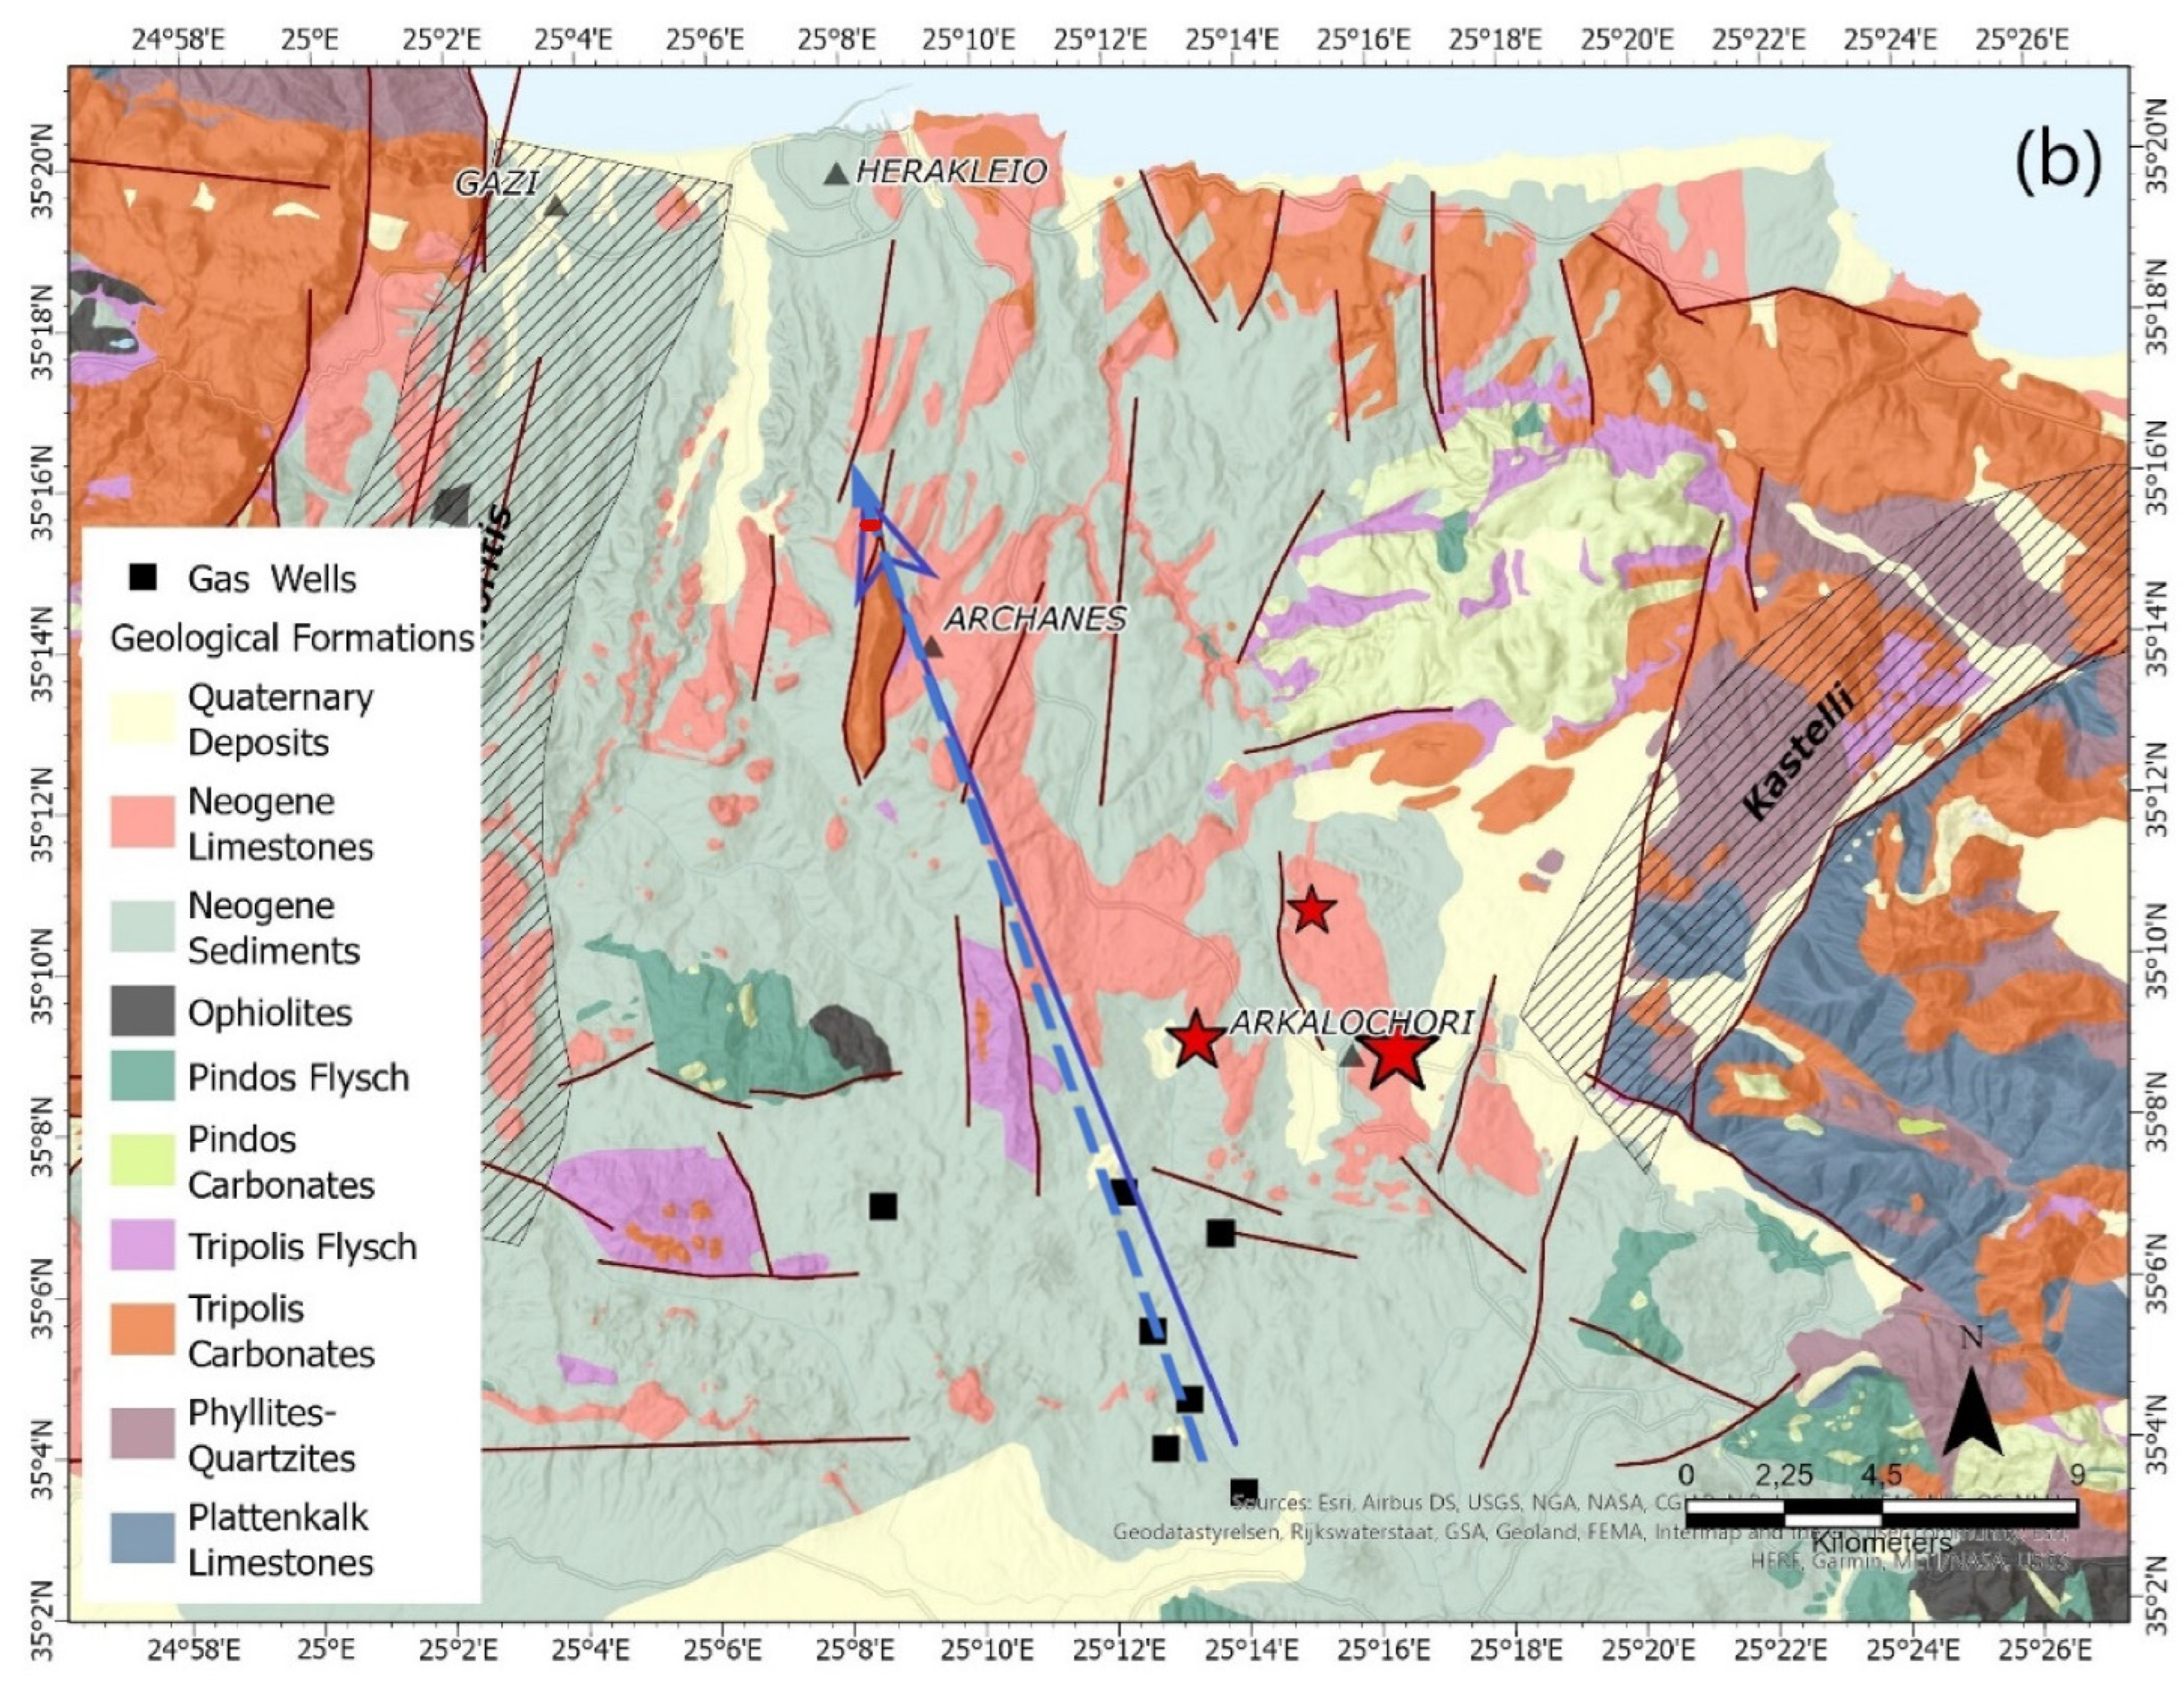
The Heraklion graben is bounded on the west by the Ida Mountains and on the east by the Dicti Mountains along the eastern Psiloritis and Kastelli fault zones, respectively, [39,40,41]. Both fault zones exhibit an almost NE–SW direction, with the eastern Psiloritis fault zone being more prominent due to the topography of the Ida Mountains. The Messara graben is bounded to the north by the Ida Mountains and to the south by the Asteroussia Mountains, along two EW oriented fault zones (Figure 1). According to previous studies [38,41,42] the faults on Central Crete can be classified in four groups. The first group consists of E–W trending faults that cut mainly bedrock or bound bedrock and Miocene sediments. The second group consists of large and medium N–S striking faults that cut the aforementioned group. The third and fourth groups are trending towards NE–SW and NW–SE, respectively. The geology of the area of interest is composed mainly of Miocene to Pliocene sediments which cover the central and western part of the study area overlaid by Quaternary deposits forming depositional plains. The Neogene deposits were formed in terrestrial to deep marine environments, giving evidence for significant changes in depositional depths attributed to vertical movements and climatic changes [43]. Carbonates of the Tripolis nappe are exposed in the northeastern part of the area. Dissected hills of phyllites and quartzites coupled with Plattenkalk limestones are mainly outcroppings to the eastern part of the area of interest [43].
3. Materials and Methods
3.1. Robust Satellite Techniques
The Robust Satellite Technique (RST) [27,28,29] is applied herein to distinguish anomalous thermal variations probably related to earthquake activity from normal variations in Earth’s thermally emitted radiation due to other phenomena. The RST is a well-known multitemporal remotely sensed data analysis technique having as its main advantage the reduction of “natural noise” [28]. The cause of this “natural noise” can be the atmospheric weather or several variations in vegetation (natural or planted) or man-made constructions, topography and climate over space and time. As shown in previous works (e.g., [2,19,20,27,28,44,45]), the advantage of the RST methodology compared to other approaches is its ability to isolate residual thermal variations which are probably connected to tectonic activity. Over the past two decades, the RST method has been applied worldwide in several geotectonic regimes and to earthquakes with magnitudes greater than 4.0. Both polar and geostationary satellite images have been used, and connections between thermal anomalies and tectonic activity in a temporal window from 30 days before to 15 days after earthquakes occurrence have been found ([2] and references therein). Among others, TIR anomalies associated with the 7 September 1999, M5.9 earthquake in Athens [44], to the M7.8 Izmit earthquake on 17 August 1999 [28] and to the M5.8 earthquake in Abruzzo (Italy) on 6 April 2009 [46] have been reported. Moreover, the 10 years analysis of continuous data over Greece by [45] showed the general correlation between earthquakes and the thermal anomalies computed by the RST. A similar investigation of RST capabilities recently took place in Turkey and confirmed a nonrandom correlation between RST-based thermal anomalies and earthquake occurrence [20].
In the present work, the RETIRA-index computed as [28]:
where r = (x,y) represents the accurate location of each pixel (x,y) on the satellite image, t is the acquisition time of the satellite image, ΔΤ(r,t) refers to the difference (T(r,t) − Τ(t)) of the observed TIR signal value T(x,y,t) with the spatial mean value T(t) of all the pixels of the satellite image. T(x,y,t) is measured for each pixel (r), while T(t) is calculated in place on the satellite image, excluding the cloudy pixels defines the time average and the standard deviation of ΔΤ(r,t) measured at site r, computed only on cloud-free pixels of the homogenous satellite images.
The RETIRA index calculates the local spatiotemporal excess of the current ΔT(r,t) signal over its historical mean value, weighted by its variability σΔΤ(x,y) at the given location. Using ∆T(r,t) instead of T(r,t) reduces the possible contributions due to meteorological variations (e.g., periods of abnormally hot weather) and/or seasonal time changes. Note that the signal (S) is evaluated by comparing it to the standard deviation σΔT(r); therefore, the signal-to-noise ratio (S/N) can be used to characterize the intensity of anomalous thermal transients.
For the RETIRA index calculation, the MOD11A1 Version 6.1 product, available from 24 February 2000 was used. It provides daily per-pixel “Land Surface Temperature and Emissivity” with 1 km pixel size in a 1200 by 1200 km grid. The pixel temperature value is derived from the MOD11_L2 (https://0-doi-org.brum.beds.ac.uk/10.5067/MODIS/MOD11_L2.006, accessed on 1 November 2021) swath product [47]. The retrieved MODIS Land Surface Temperature uses the MODIS cloud mask product and as a result contains only cloud-free pixels. Images from LST were preferably taken at night because they are affected to a lesser extent by temperature differences between the ground and air than images taken at any other time of day. In addition, they are also less sensitive to local solar radiation variations and shade, an important source of land surface temperature variability not related to the seismic activity. Specifically, 10 years of remotely sensed data (from 2012 to 2021) were included in the calculation of the RETIRA index since the use of multi-year time series of satellite data is crucial to establish the required regional thermal background. Initially, the “ Night-time and Surface Temperature” layer dataset was isolated for the 10-year period and then spatially subset to the Central Crete area. Monthly reference fields μ∆T(x,y) and σ∆T(x,y) were then generated for the four months period, i.e., from July to October. Nevertheless, it has been shown that in cases where the cloudy fraction of the scene is greater than 80%, the remaining values lead to a non-reliable signal [45]. For this reason, such images were excluded from the computation of the final reference fields.
To identify any possible variations, a RETIRA index was calculated for each day of the period of 3 months before and a month after the main earthquake. We note that RETIRA is a Gaussian standardized variable, and the selection of its relative threshold value, quantitatively reflects the rareness and the significance of the identified anomalies. In this work, to define a thermal anomaly, we used a RETIRA index greater than 3, following a very strict rule as a distribution value greater than 3 or 4 suggests an anomaly with a probability 99.7% or 99.99%, respectively. In some cases, the computation of thermal anomalies is affected by relatively rare physical phenomena such as heatwaves, wildfires, cloud coverage and/or observational changes as in the case of inaccurate image navigation/co-location. The RETIRA index is based on time-averaged quantities and as shown in previous research [28,44,45] is sensitive to the abrupt appearance of extreme signal due to the abovementioned natural [48] or anthropogenic [44,49] phenomena. However, these signal variations are characterized by specific spatiotemporal patterns such as limited duration, similar and expected spatial distribution and known date of occurrence, allowing their exclusion from further analysis [28]. As a result, the RETIRA index anomalies related to seismicity were isolated from those due to wildfire and those induced by cloud-coverage or/and imprecise image navigation/co-location.
3.2. Interferometric Synthetic Aperture Radar (InSAR)
The Sentinel-1 mission of the European Commission (EC) and the European Space Agency (ESA), comprises a constellation of two polar-orbiting satellites, Sentinel-1A and Sentinel-1B, operating 24 h per day with a short revisit cycle of 6 days. They are performing C-band synthetic aperture radar imaging under all weather conditions [50]. To map the co-seismic deformation due to the 27 September 2021 earthquake, we used one ascending and one descending SAR image pair (with acquisition dates of 23 September 2021–29 September 2021 and 25 September 2021–1 October 2021, respectively) from ESA’s Sentinel-1A and Sentinel-1B satellites. In both cases, the reference image was the one before the earthquake occurrence, while the repeat image was the one that refers to the date after the event.
Each reference–repeat pair was processed using the ESA’s open SNAP software, and two individual interferograms were generated. The topographic phase was subtracted using the SRTM 1 arc-second Digital Terrain Model, a 30 m resolution Shuttle Radar Topography Mission Digital Elevation Model (USGS 1 ARC-second SRTM DEM, https://doi.org/10.5066/F7DF6PQS), while the signal-to-noise ratio was enhanced by applying the adaptive power spectrum filter of [51] with a coherence threshold of 0.4.
4. Results
We proceed now to present the results achieved after applying the RETIRA index and to compare them with the co-seismic crustal deformation pattern.
For a period of 10 years (i.e., 2012–2021) and for each of the 4 months spanning the period before and after the main event (i.e., July to October), 1230 images were obtained. Each cloud-free image contains 3525 pixels. The cloud-covered pixels in the images are recognized as “no data”, and as a result, pixels reduce as the cloud coverage increases. Finally, 1086 images were used in the calculation of the monthly reference fields μ∆T(x,y) and σ∆T(x,y). Then, the RETIRA index was computed for 105 images (i.e., for 105 of the 123 days in the period July to October 2022). Among the images used, 31 were in July, 31 in August, 28 in September and 15 in October. The remaining 20 images during September and October 2021 presented cloud cover greater than 80% and were therefore excluded from further analysis. The daily analysis led to the detection of 18 (out of the 105) images containing pixels with RETIRA values greater than three. Applying the previously described methodology to all MODIS-LST images from July 2021 to October 2021, we finally identified nine thermal anomalies, three for each of the months of July, August and September 2021 (Figure 2, Figure 3 and Figure 4). During October 2021, there was no observed RETIRA index following the post-seismic thermal anomaly criteria.
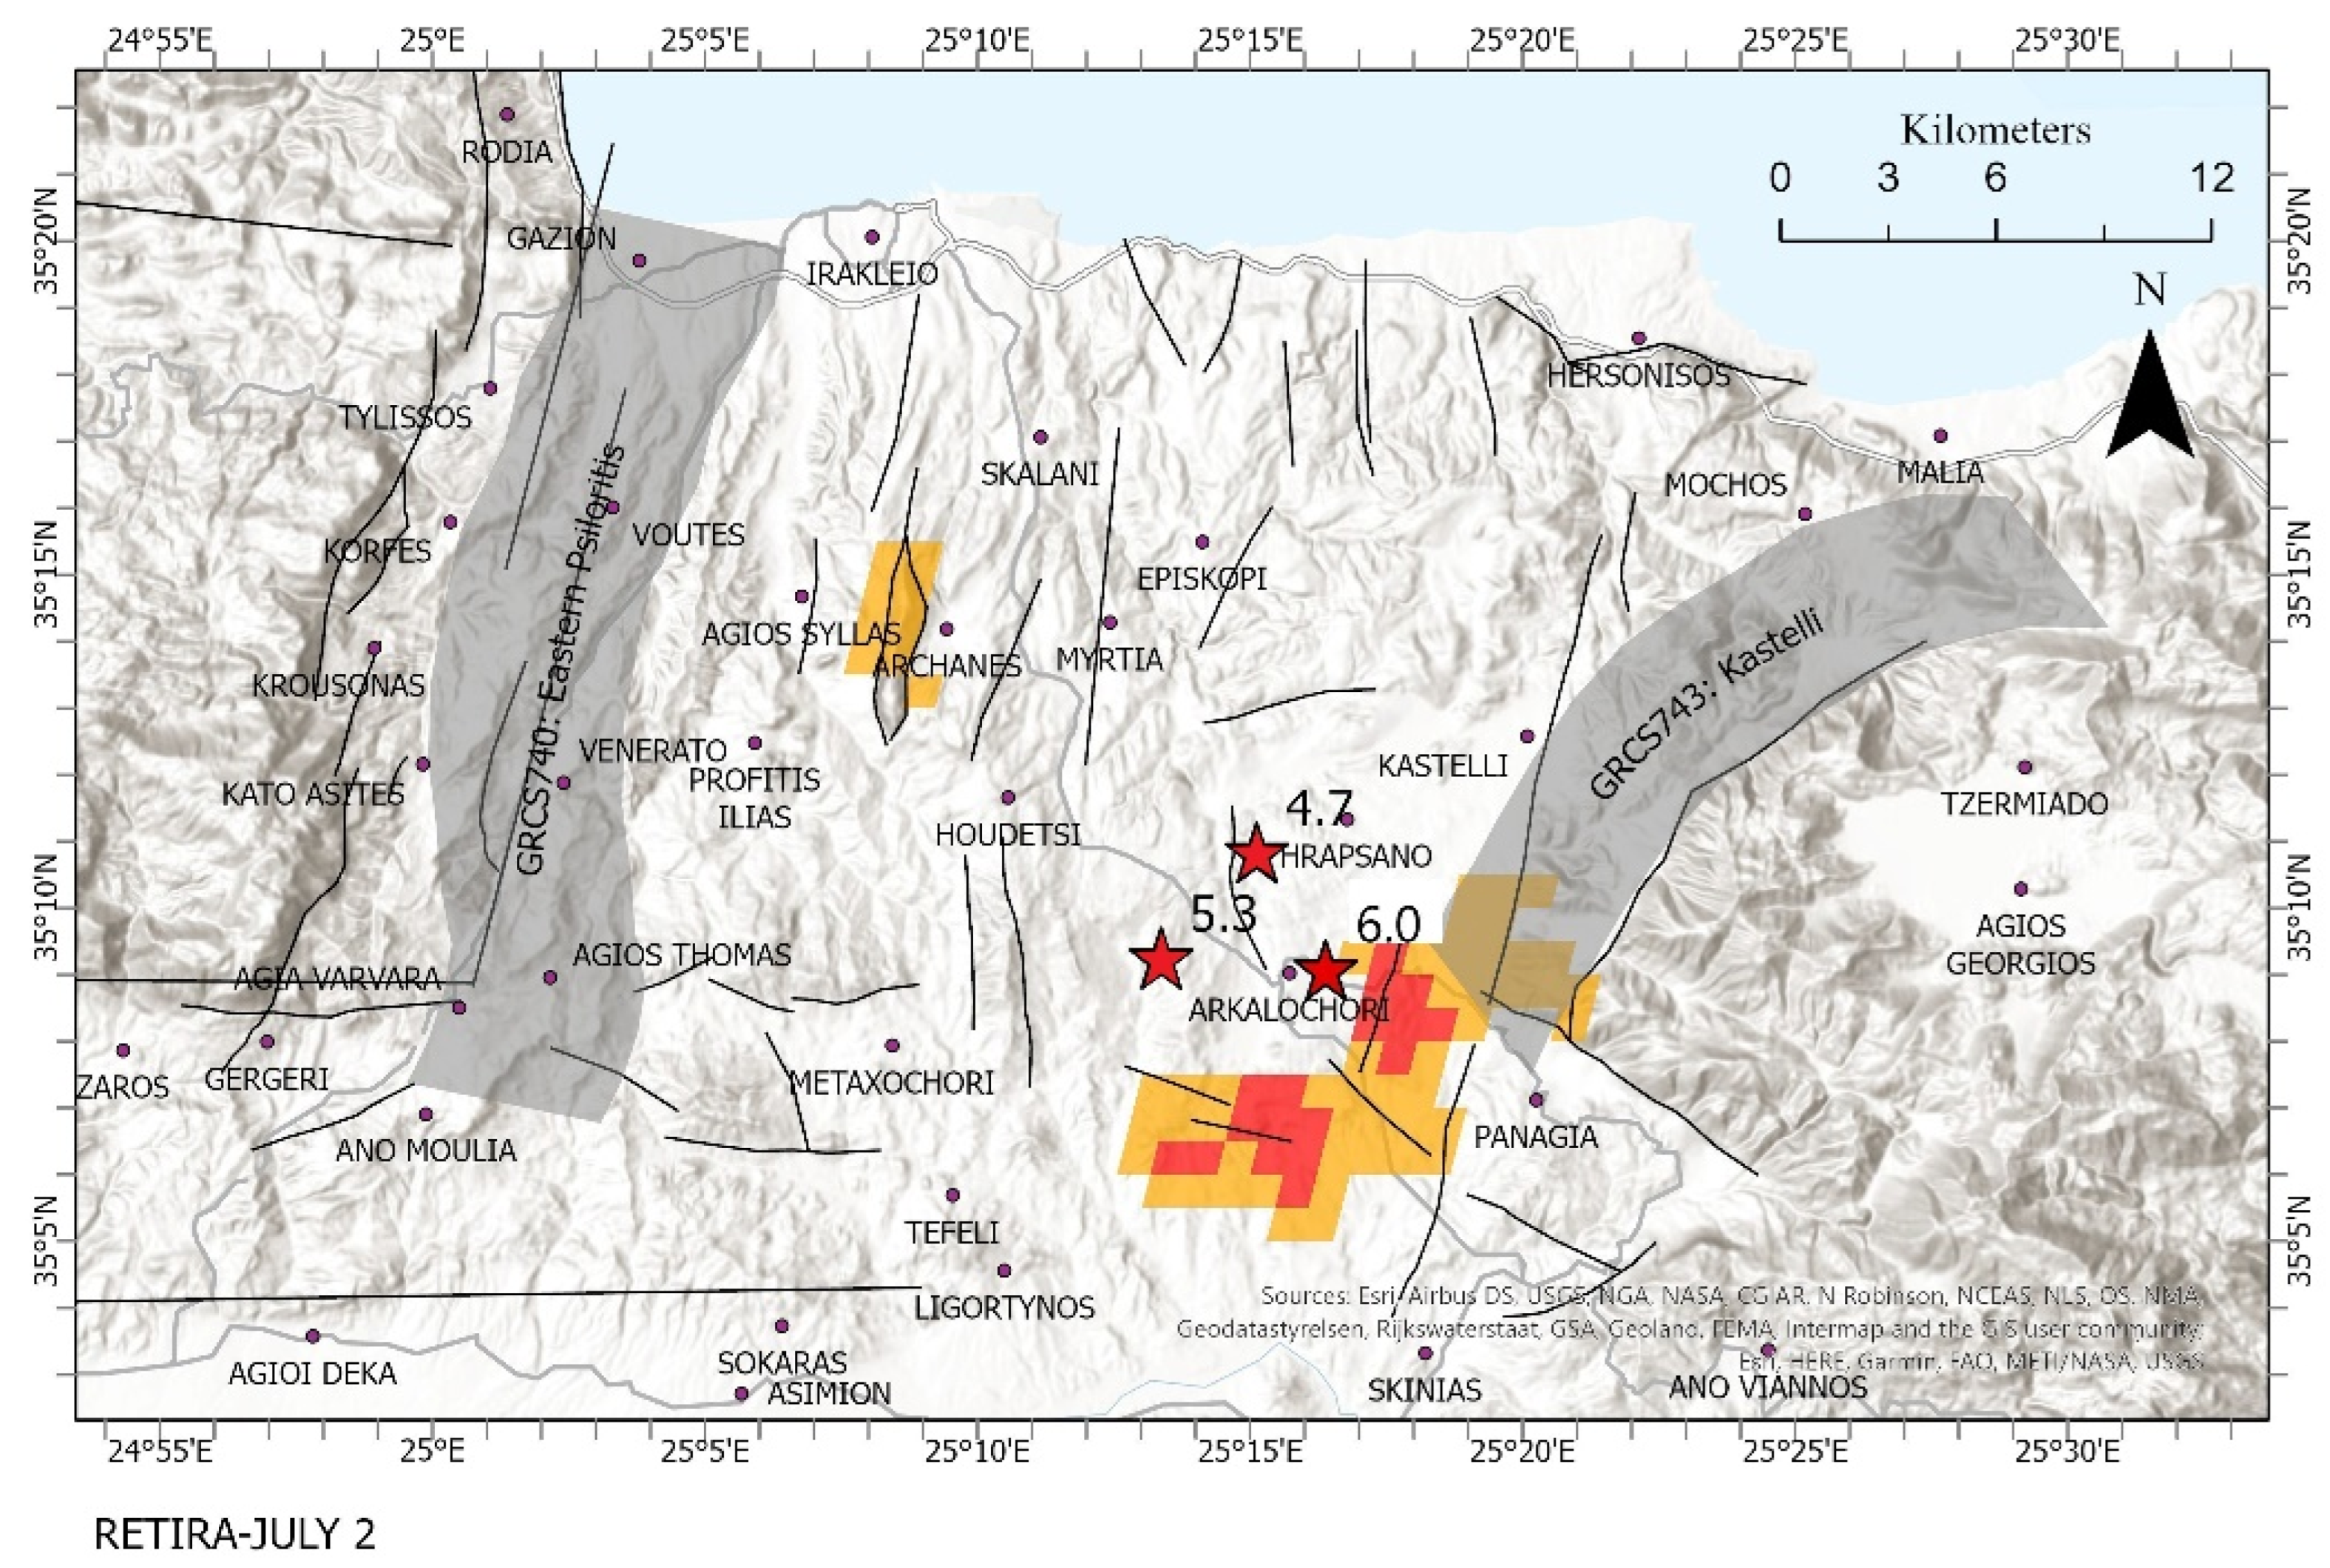
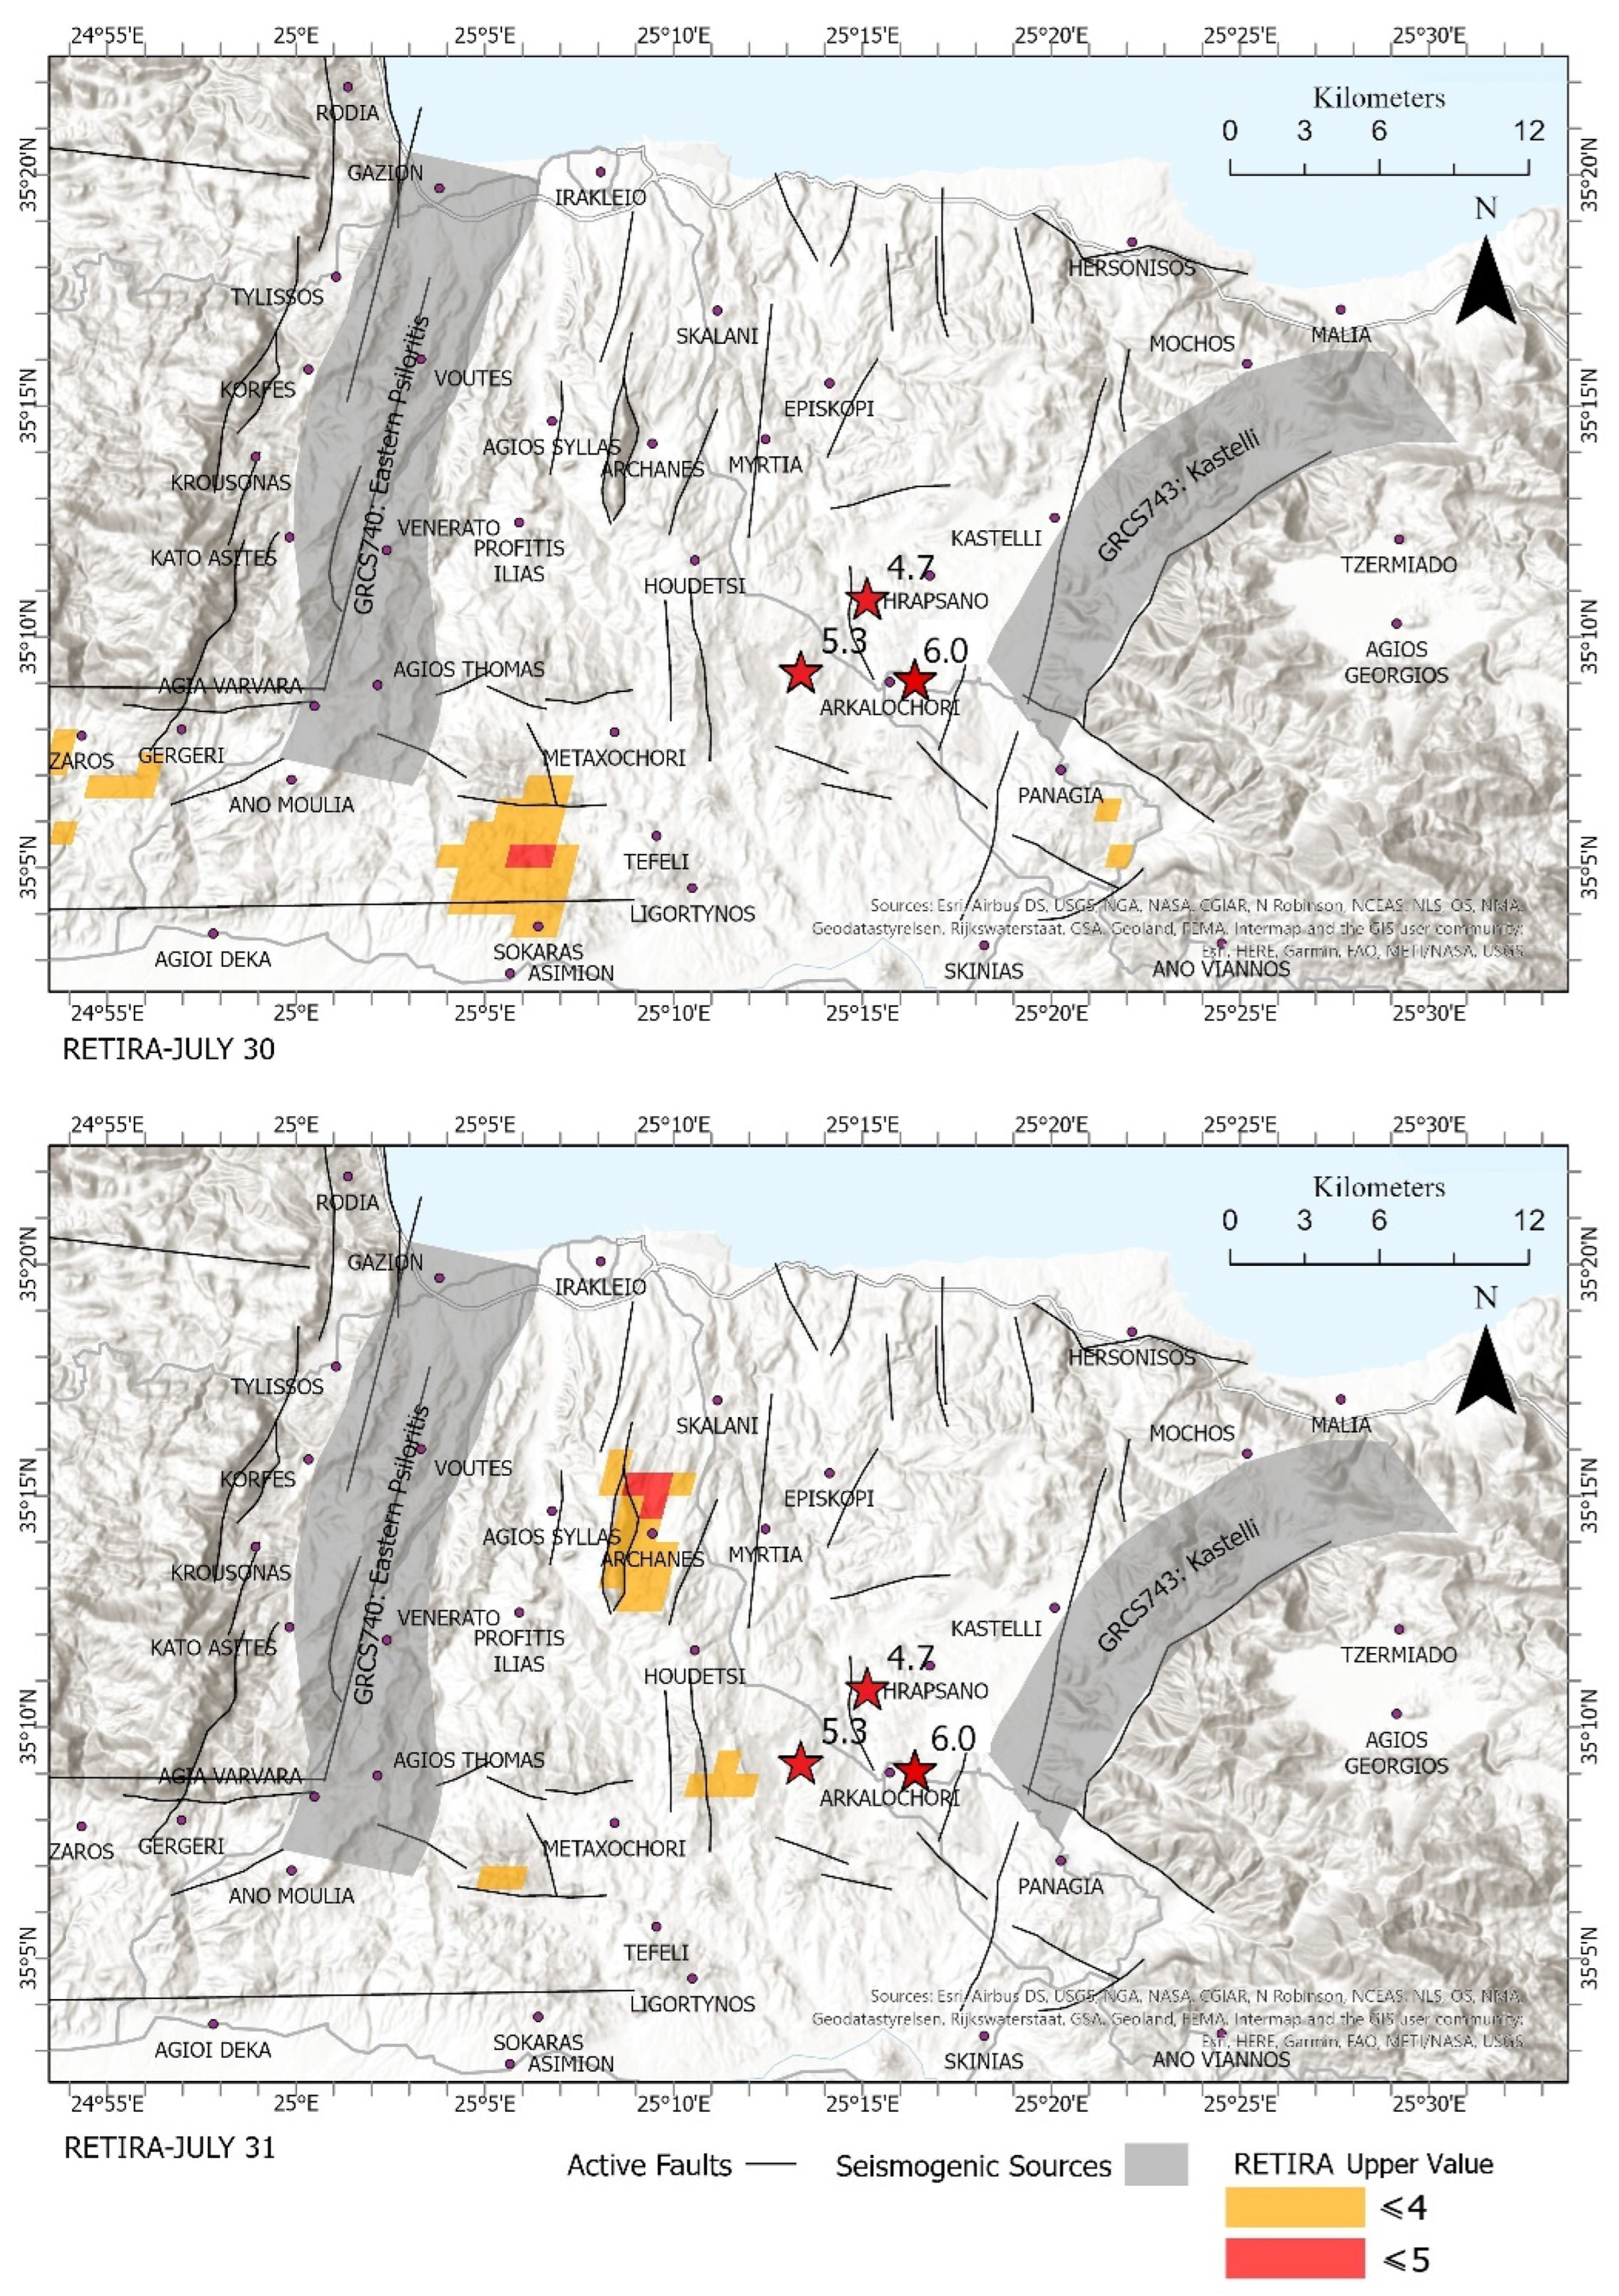
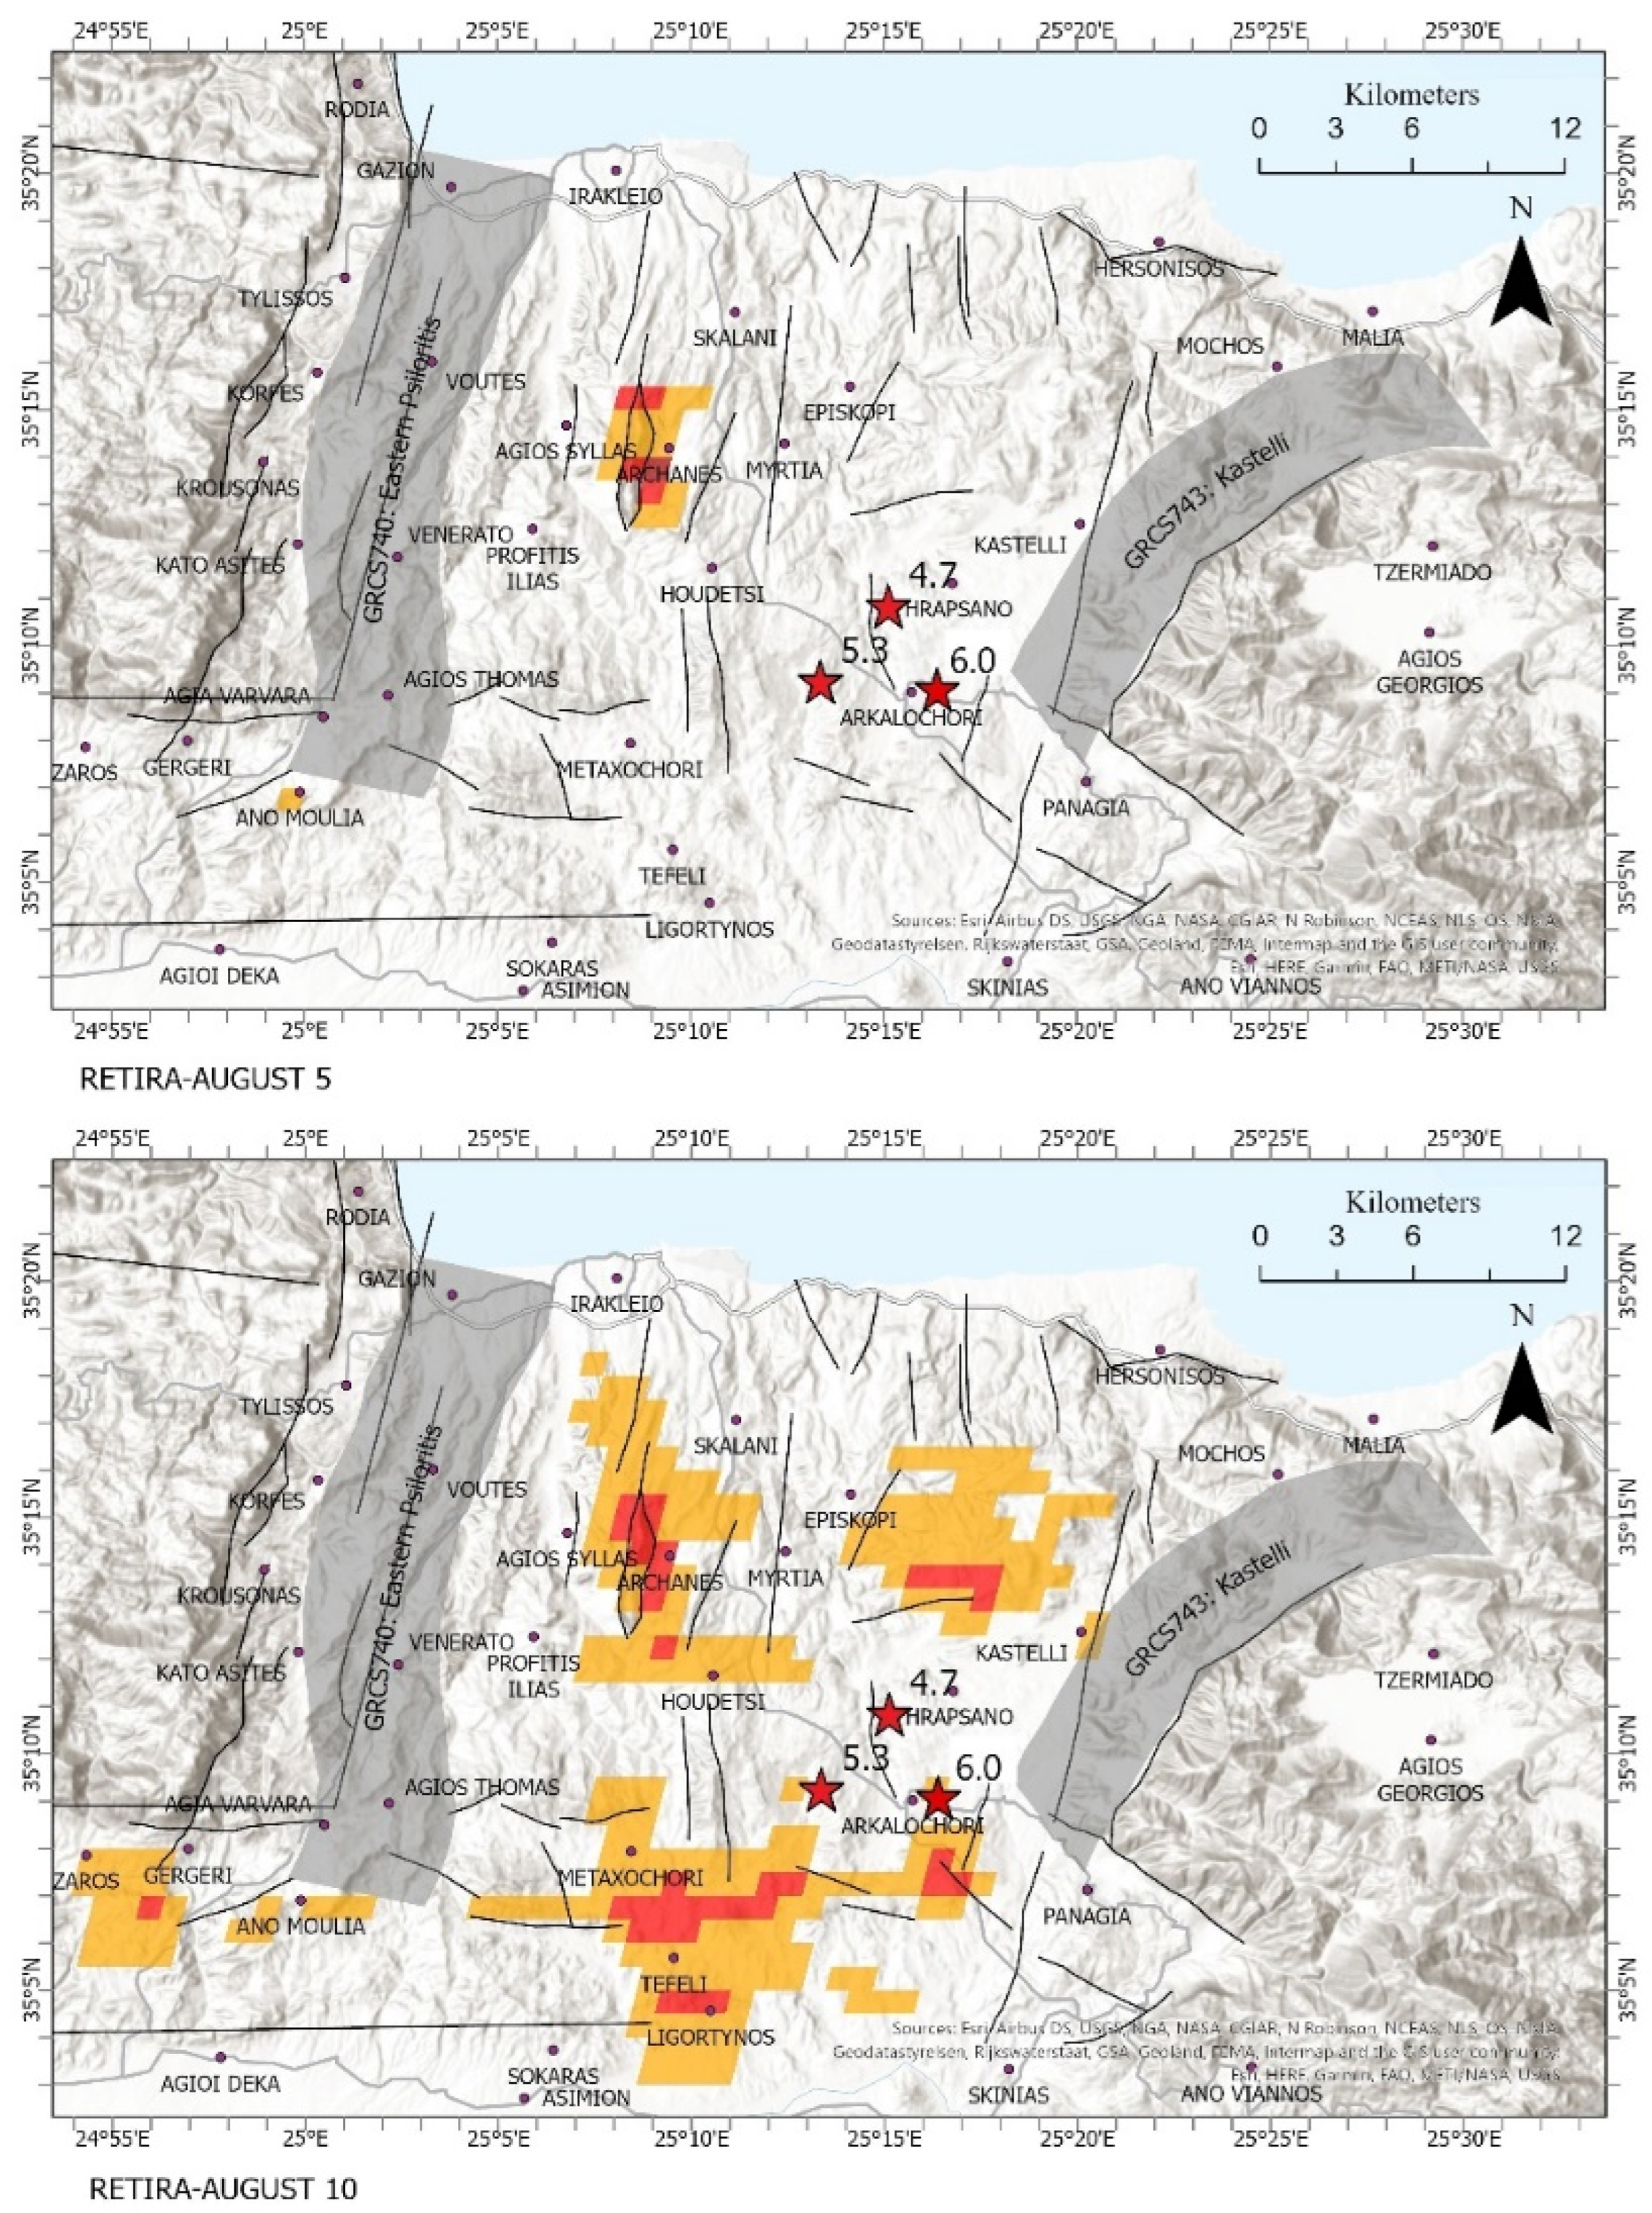
In detail, eight quite intense (Signal/Noise > 3.0) and rare, spatially extensive TIR signal transients were identified before the main earthquake. The first was recorded on 2 July, a few hours after the occurrence of a M4.1 earthquake and three days before the 5 July M4.2 event. The second thermal anomaly was recorded on 30 July, 6 days after the 24 July M4.8 earthquake. A new thermal anomaly was mapped one day later (Figure 2). During 5, 10 and 29 August, three thermal anomalies were identified (Figure 3). We note that during August, the earthquake activity appeared with lower magnitude events, with the strongest on 8 August with a magnitude M3.8. The last two pre-seismic thermal anomalies were identified on 18 and 20 September, nine and seven days before the main event on 27 September, respectively, and the last thermal anomaly was detected on the day of the main earthquake (co-seismic anomaly) (Figure 4). As can be seen in Figure 2, Figure 3 and Figure 4, in some cases the RETIRA index exceeded the value five (see dark brown pixels), and this could be used as an evaluation of the intensity of the thermal anomalous events. As for the spatial distribution of the observed thermal activity in Central Crete, the thermal anomaly of 2 July occurred to the south and east of the village of Arkalochori and occupied the southern part of the Kastelli seismogenic zone. In the northern part, the thermal anomaly spatially coincided with Mount Yuchtas, where a conjunction of two active tectonic faults exists. The 31 July thermal anomaly was also located near Mount Yuchtas and south of Arkalochori, while the thermal anomaly observed on 30 July was located to the south and was bounded by the two large faults, oriented east–west (Figure 2). On 5 August, one more thermal anomaly appeared near Mount Yuchtas northwest of Arkalochori. An extended thermal anomaly was identified on 10 August and occupied the previous area located further on north, south and southwest of Arkalochori. On 29 August, a much weaker, spatially limited thermal anomaly was located near Houdetsi village (Figure 3).
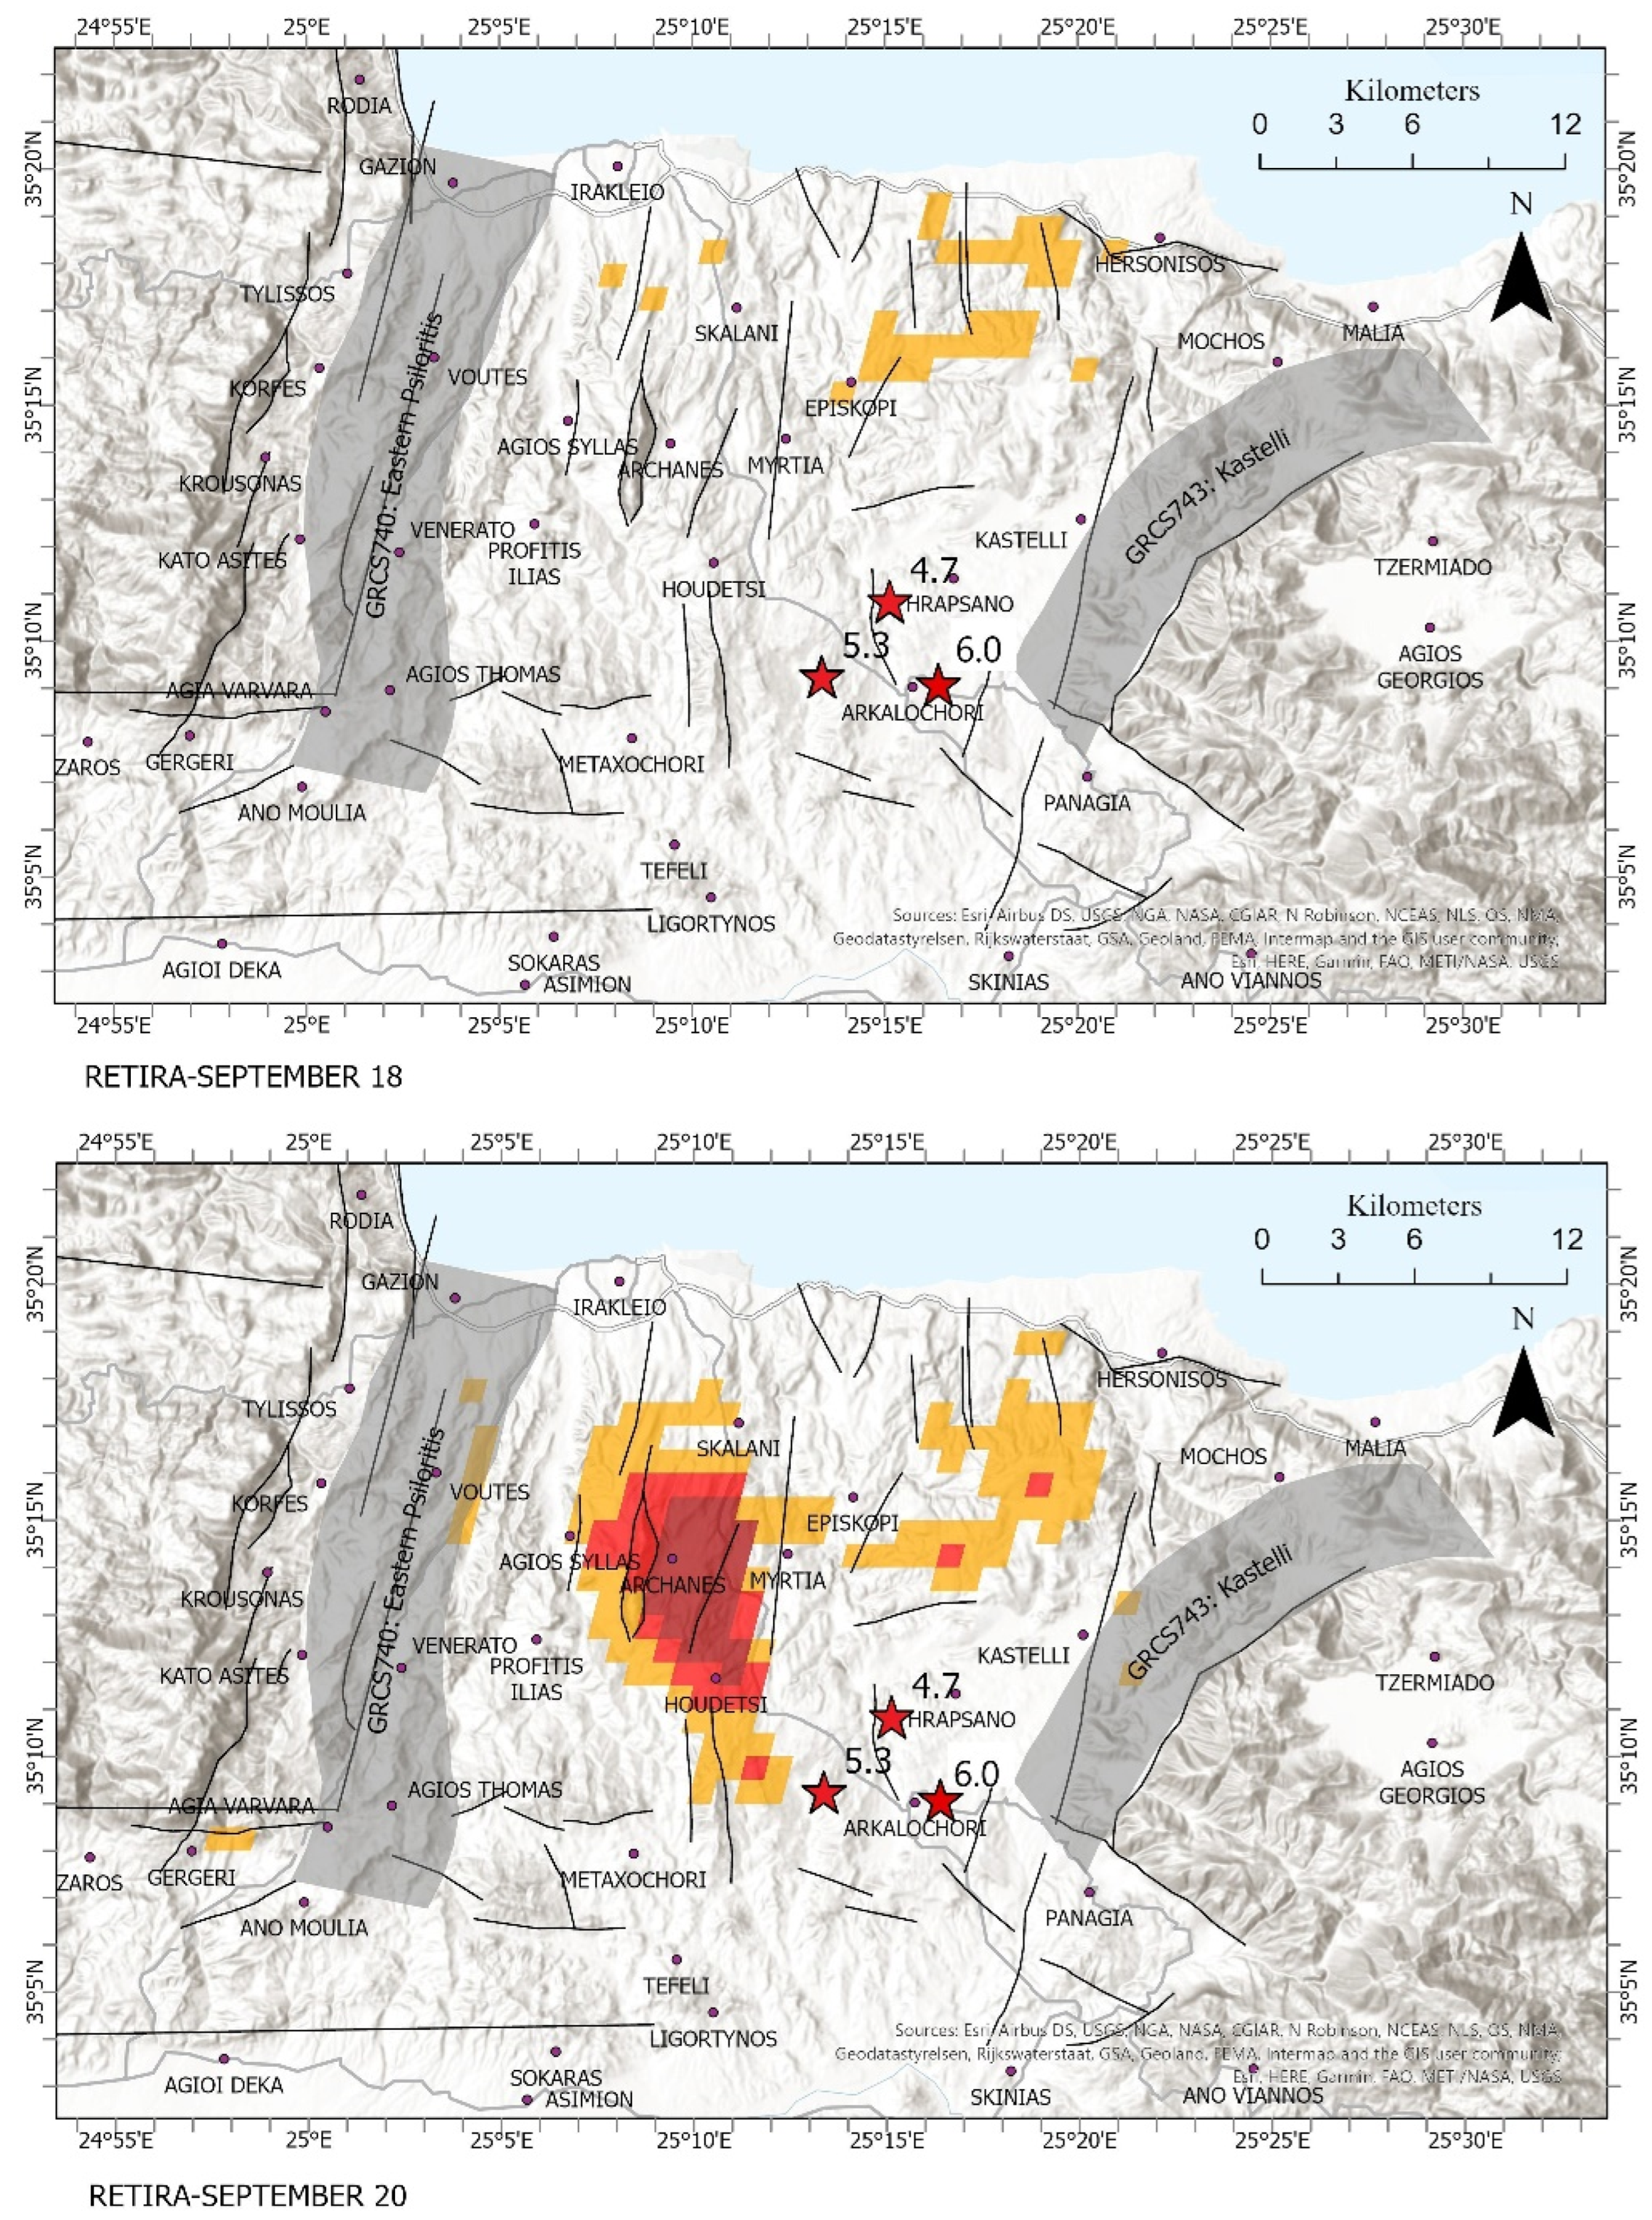
On 18 September, a thermal anomaly occurred north of the earthquake epicenter. Two days later, on 20 September, a RETIRA thermal anomaly with values up to 6.0 was observed over Mount Yuchtas, with the largest values occurring east of the mountain and extending to the south (Figure 4).
On the day of the earthquake occurrence, the thermal anomaly was located near an east–west oriented zone south of the epicenter, occupying an extensive area bounded by the villages of Metaxochori to the north and Ligortynos to the south, reaching as far as the vicinity of Arkalochori (Figure 4).
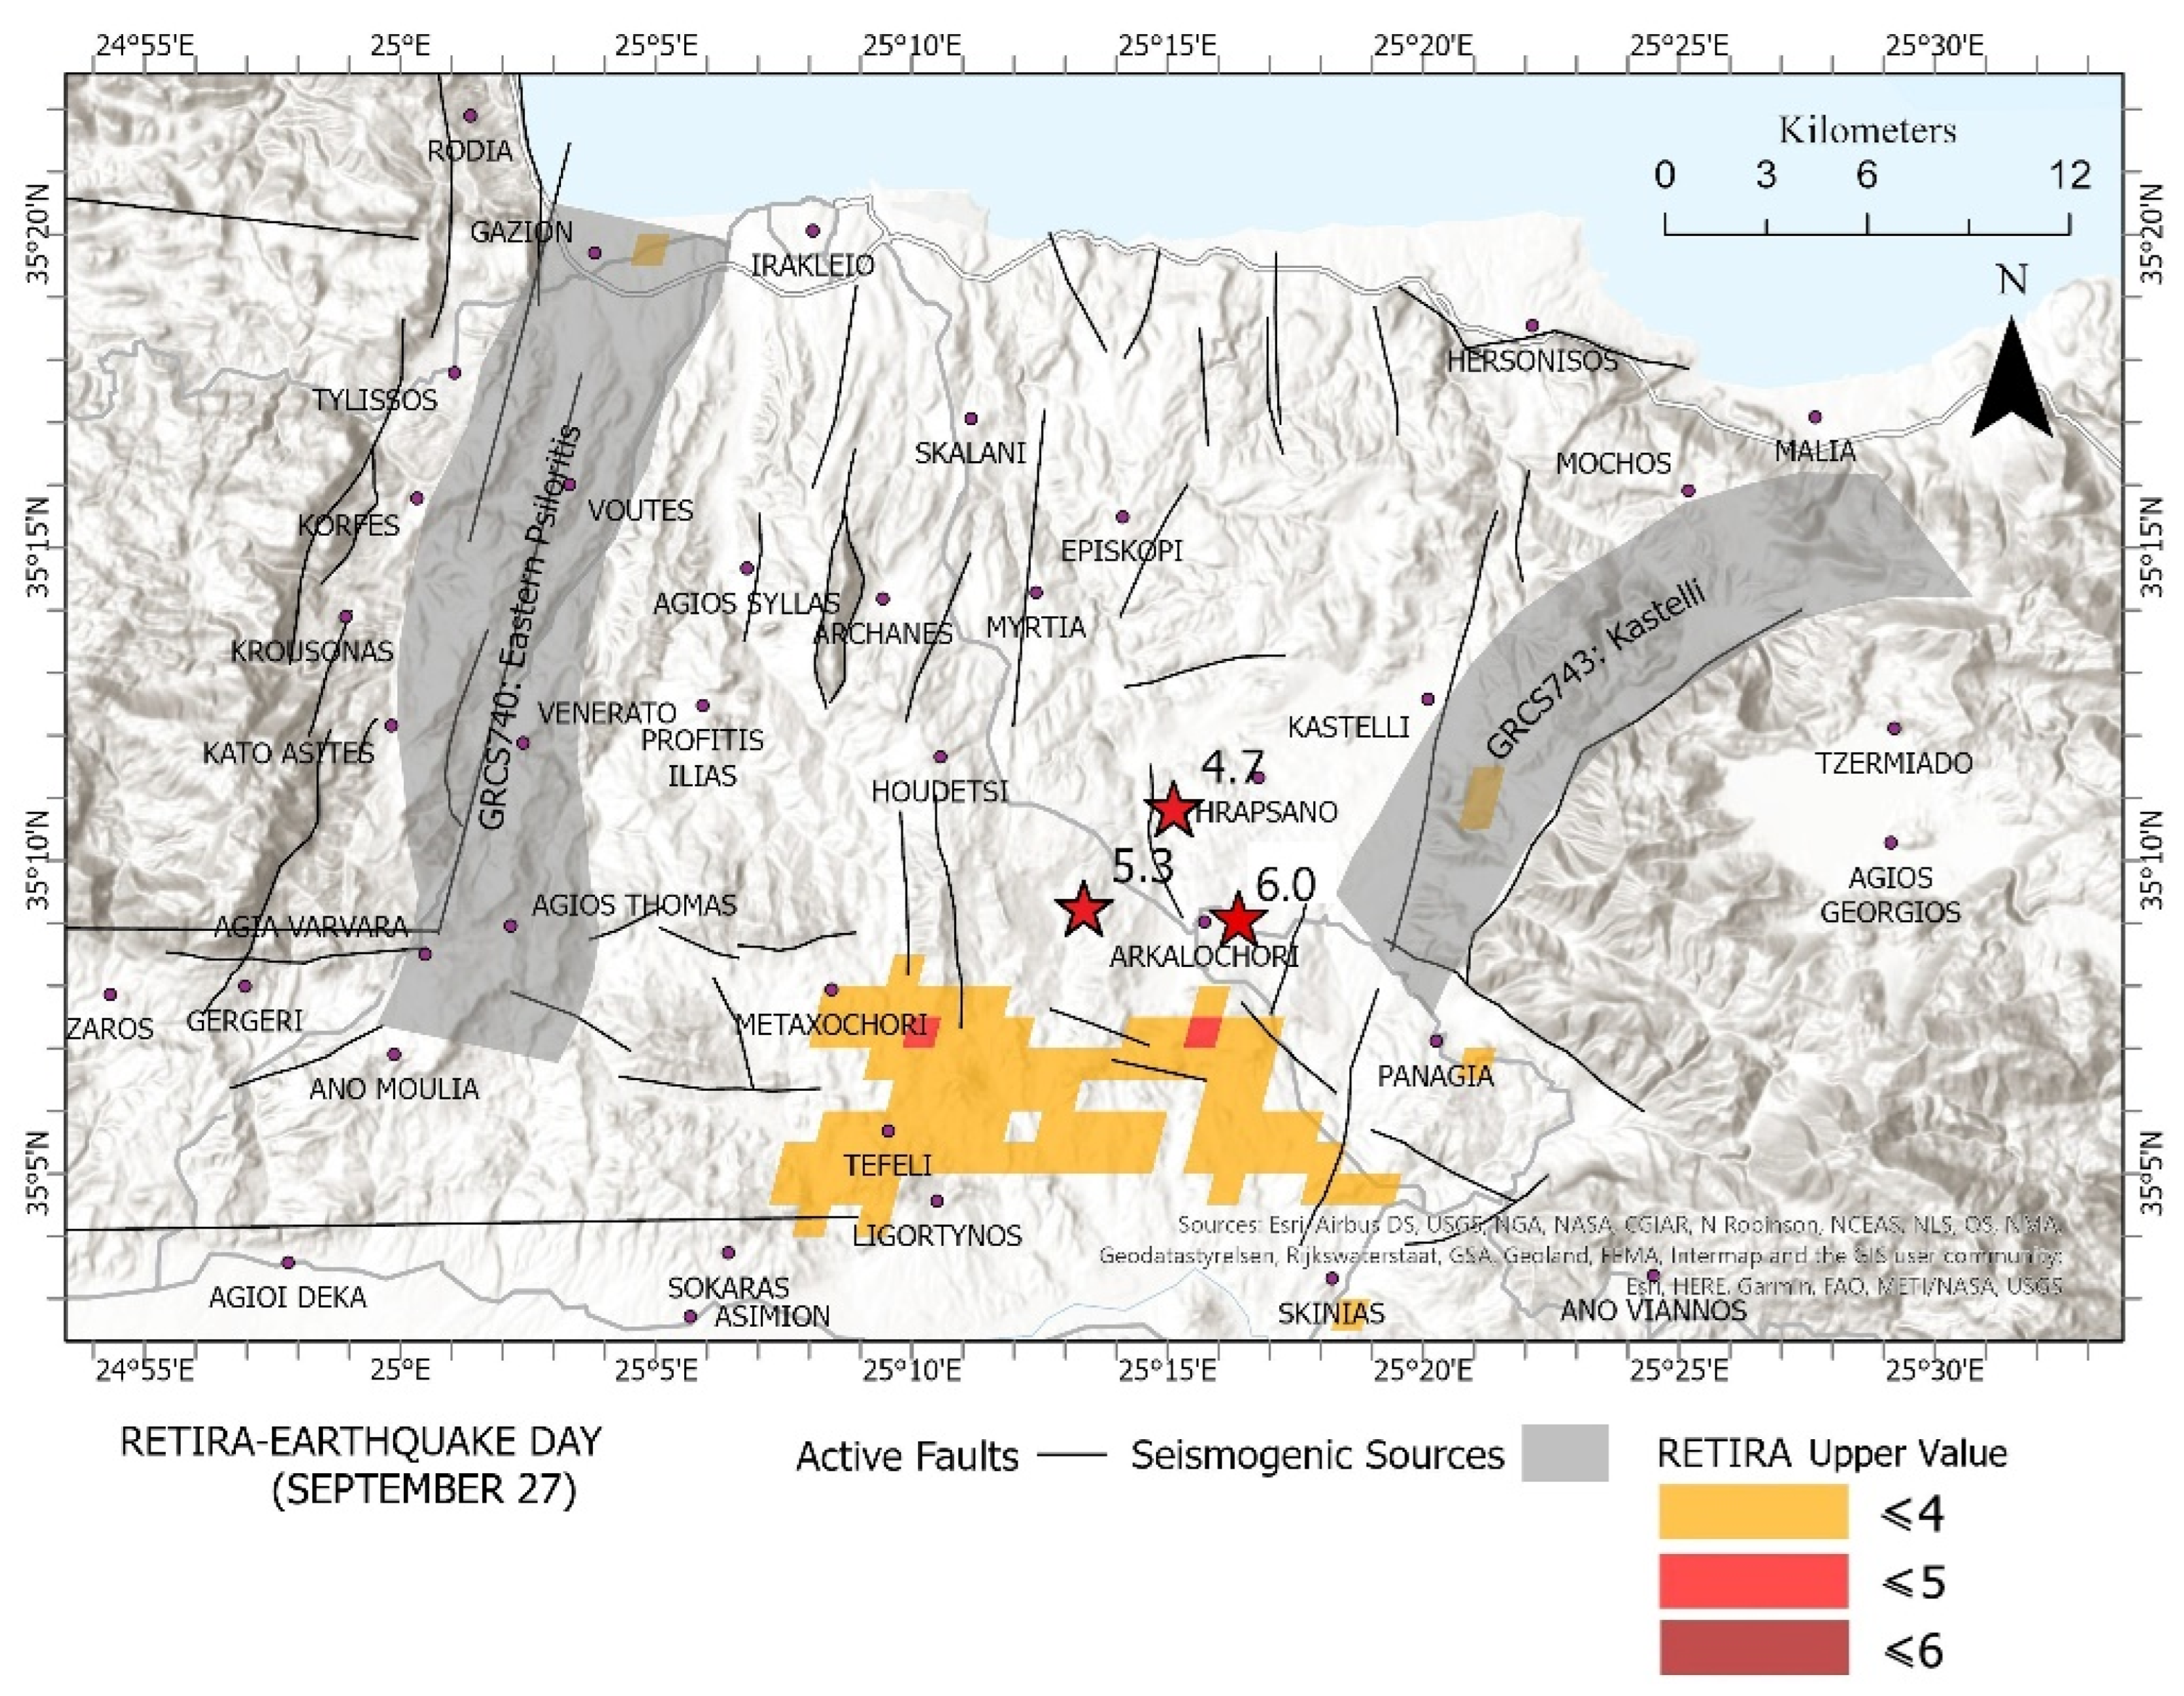
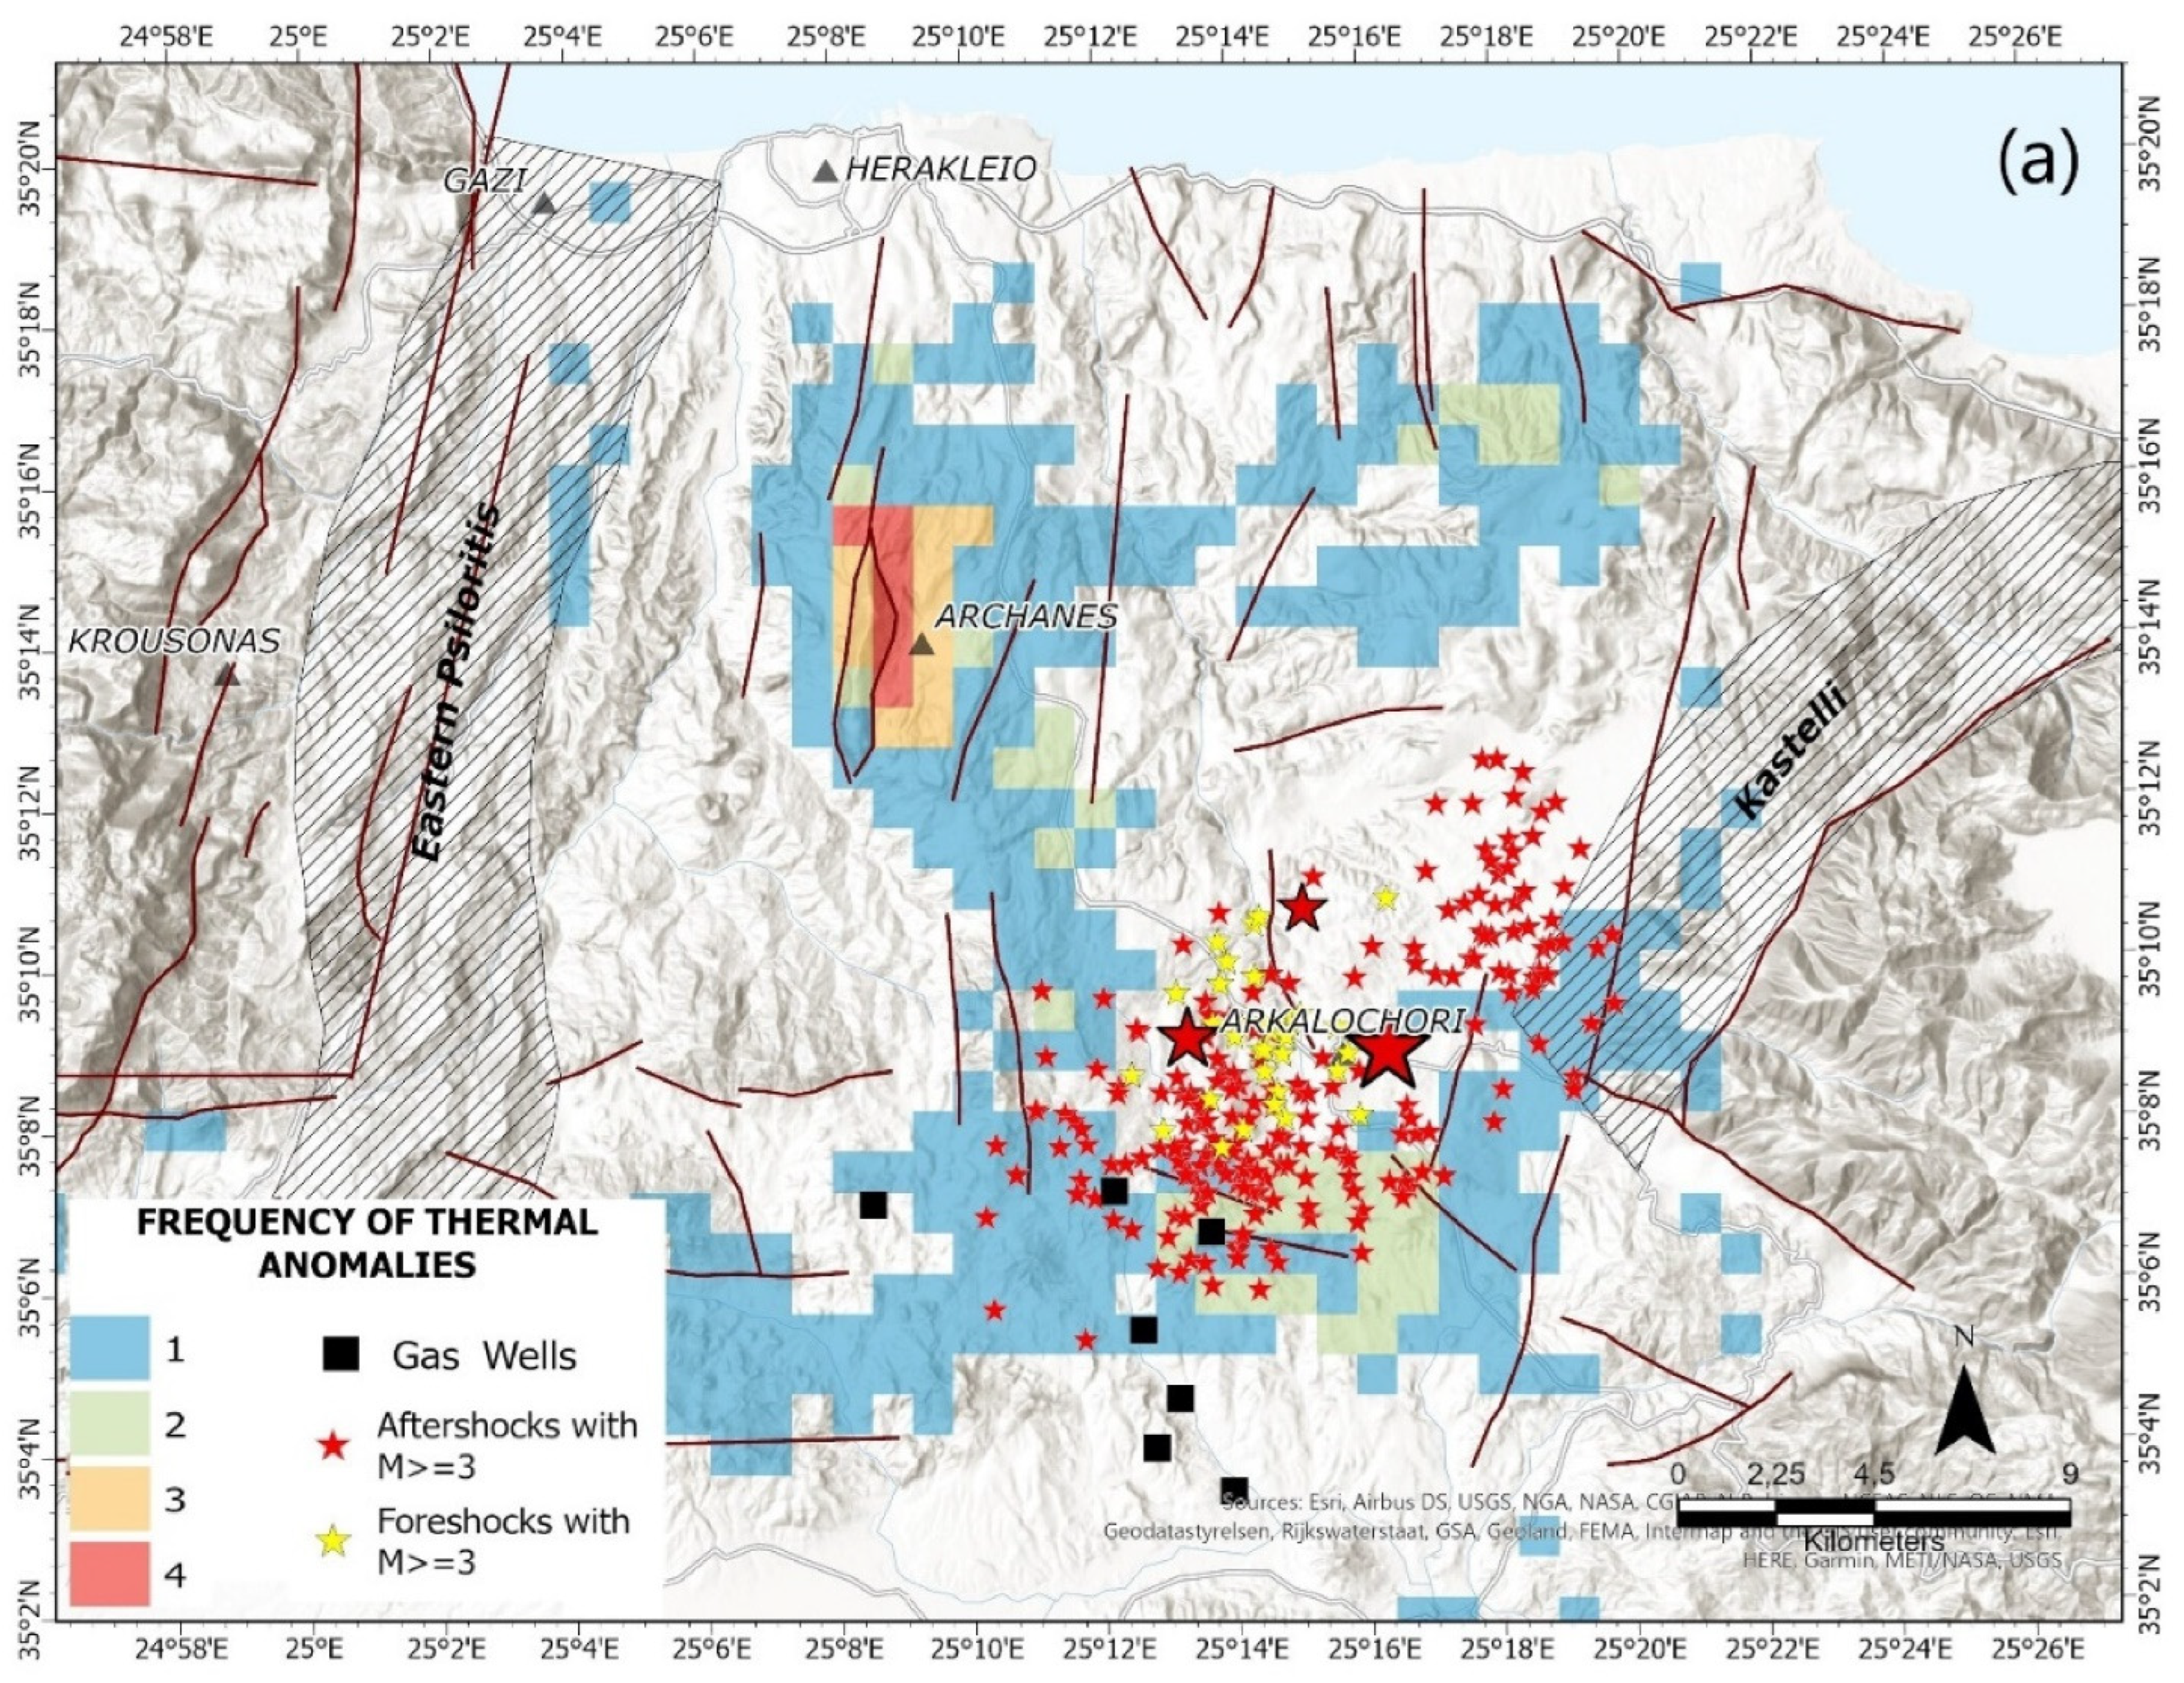
To visualize the frequency of thermal anomalies and their spatial distribution, Figure 5a was constructed. With the aim to define the areas where the thermal anomalies were spatiotemporally persistent, a map showing the frequency of the occurrence of thermal anomalies (i.e., the number of times a pixel participated in one of the nine identified thermal anomalies during the period from July to September 2021) was created. The frequency map of thermal anomalies was then compared with the normalized map of fault density obtained by calculating the density of linear features (faults) in the neighborhood of each output raster cell according to [52]. More specifically, a normalized lineament density map was created by counting the faults per unit area (number/km2), dividing the output by the maximum calculated density and then plotted in the respective grid centers.
The frequency ranges from one to four indicating that especially in the vicinity of Mount Yuchtas, the thermal anomalies were particularly persistent, as they occurred on four of the nine days in total. The frequency map of thermal anomalies was then compared with the normalized fault density map (Figure 5b). It is worth noting that the region north of the earthquake epicenter exhibits a medium-high value of fault density and the highest persistence of thermal anomalies, in contrast to the area south of Arkalochori, which shows anomalies with medium persistence and low fault density (Figure 5).
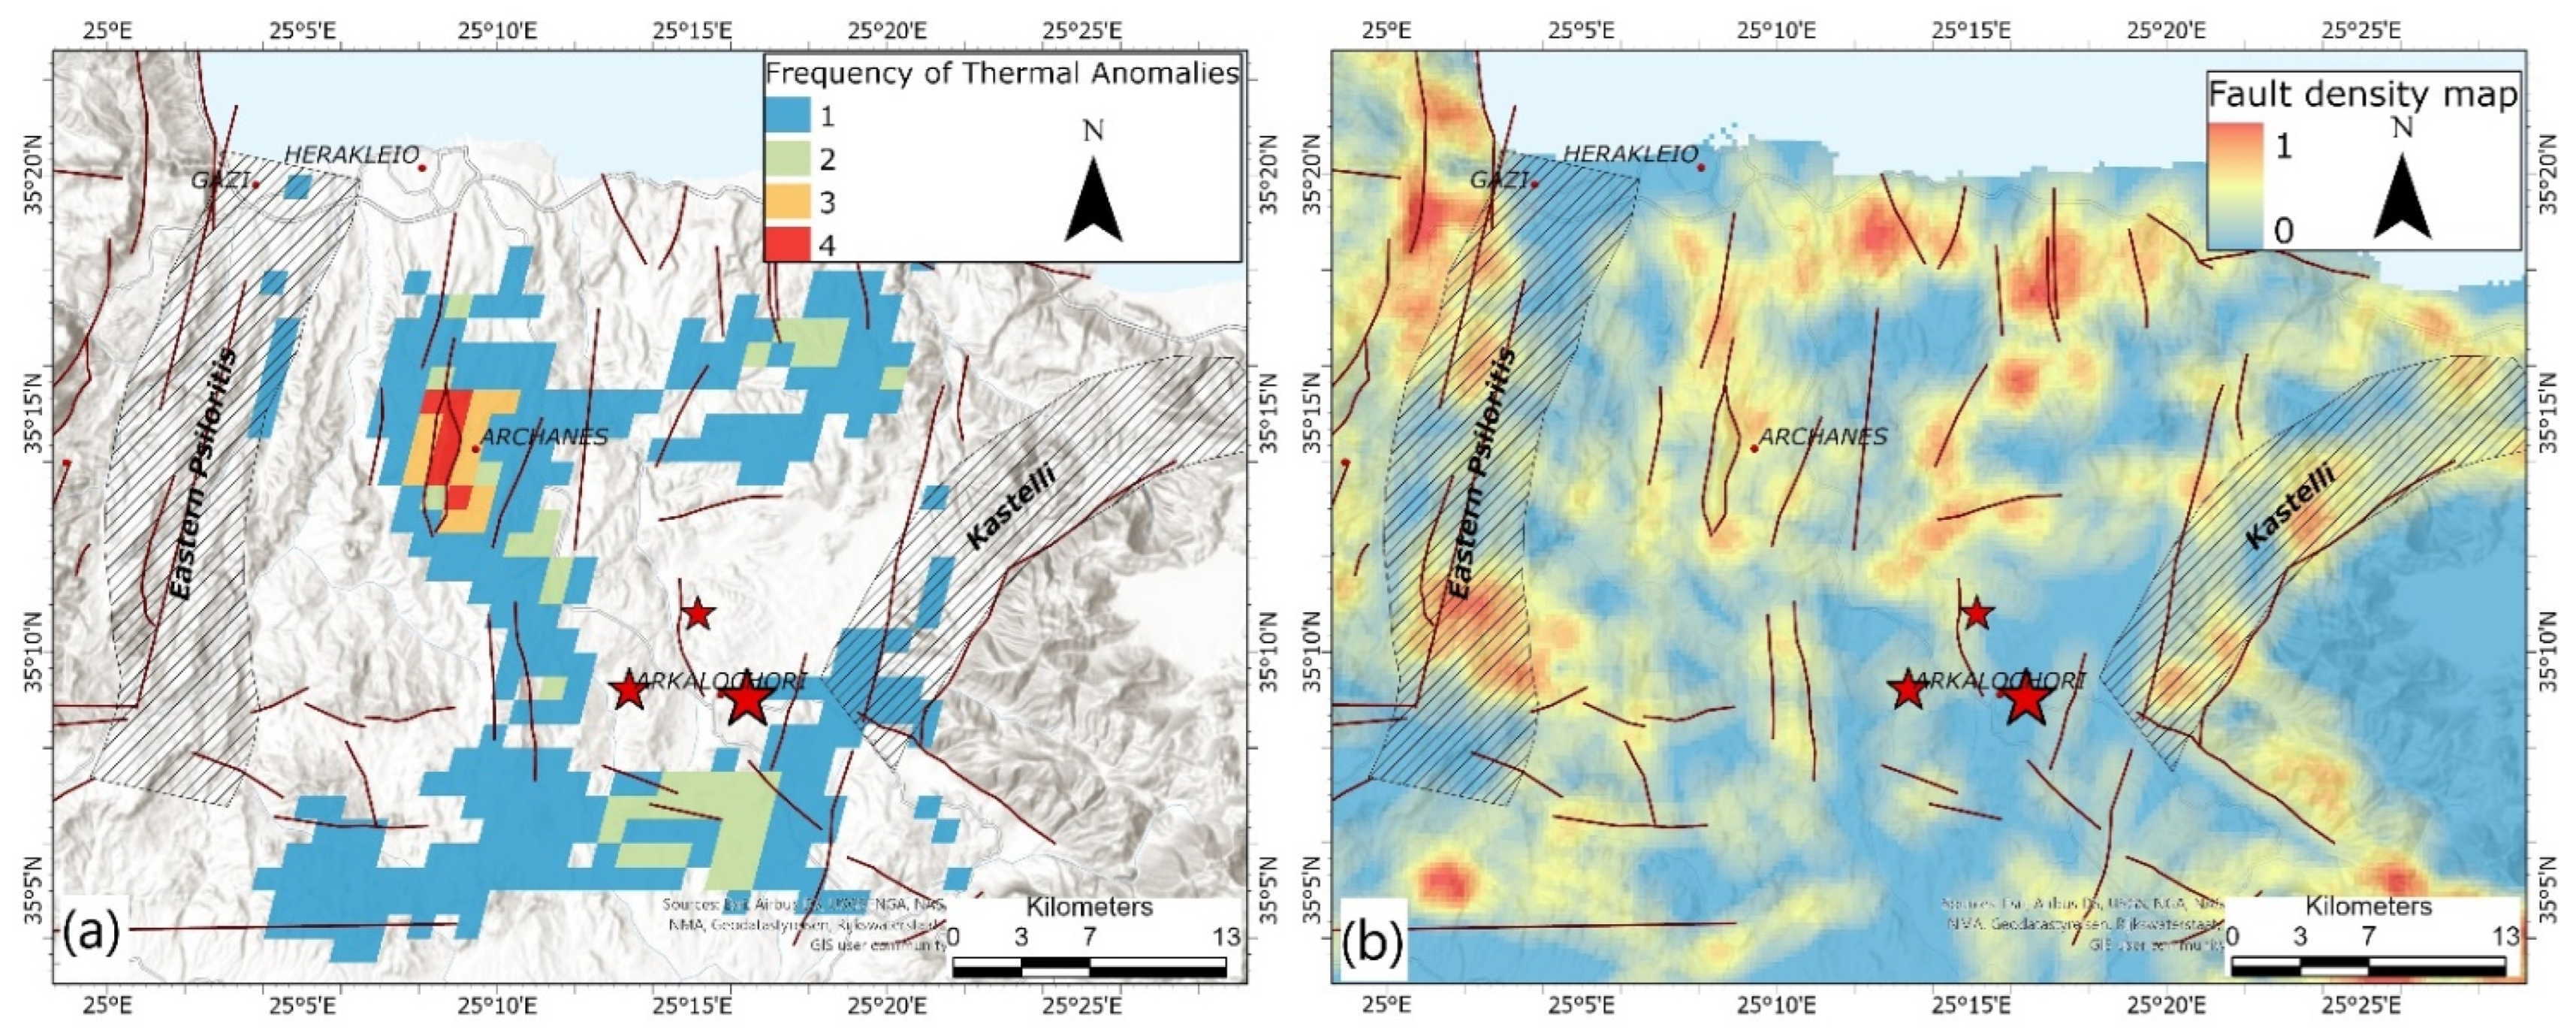
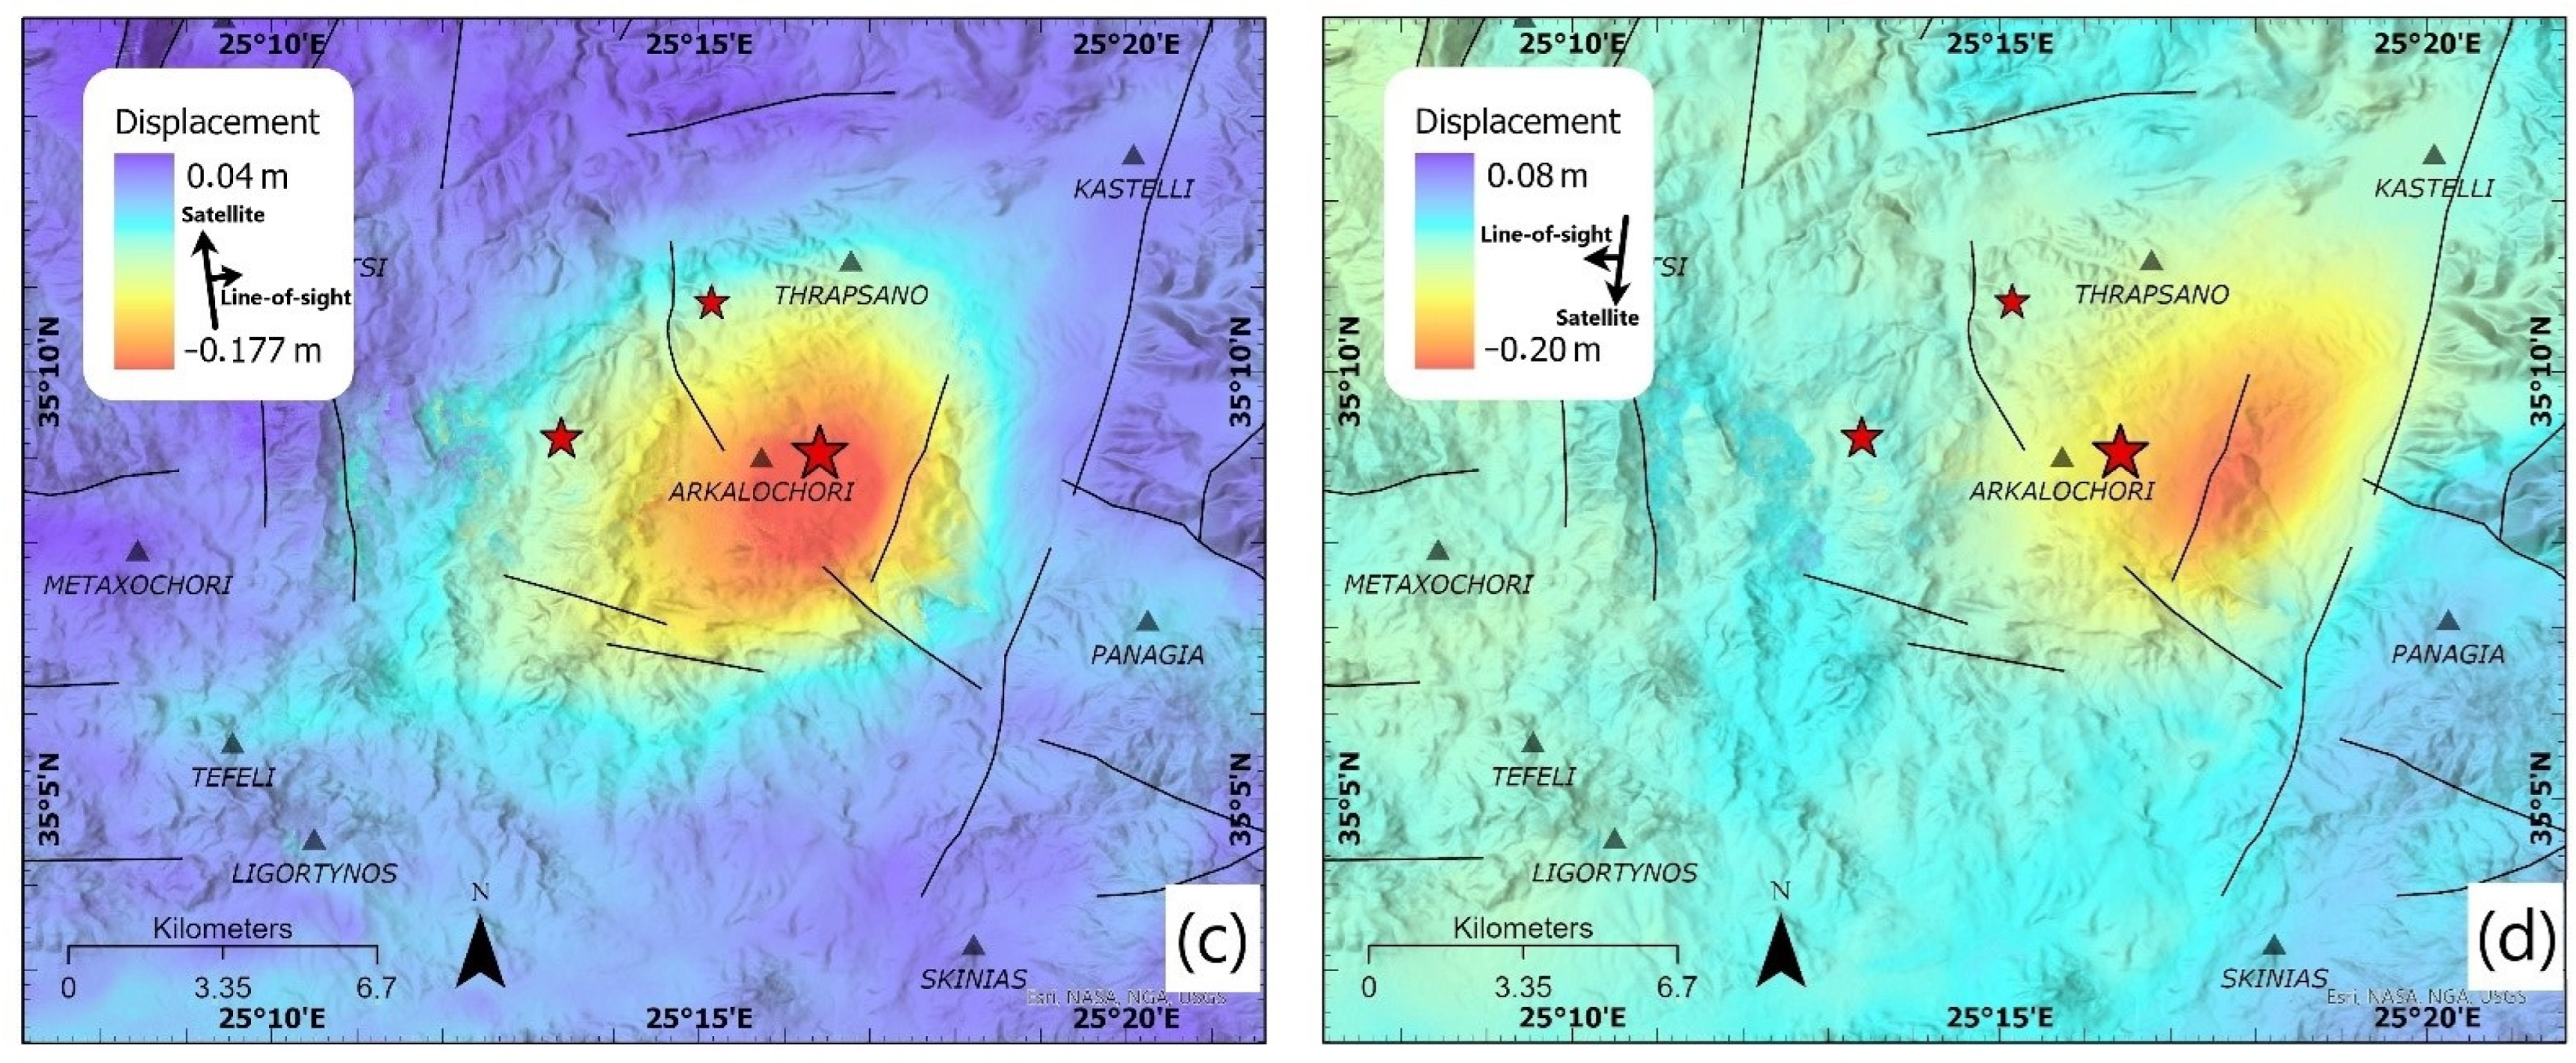
We proceed now to present the two co-seismic interferograms that emerged for the Arkalochori earthquake of 27 September 2021. The two wrapped (ascending and descending) interferograms are of good quality due to the low temporal geometric baselines and the high temporal resolution of Sentinel-1. As a result, the interferograms exhibit high coherence, with 80% and 68% at ≥0.4 and 0.6, respectively. They contain the phase difference between master and slave images produced by the main seismic event and its aftershocks until 29 September (ascending orbit) and 1 October (descending orbit). A clear pattern of six fringes, i.e., six concentric “circles” quite similar in shape, forming a lobe (Figure 6a,b), which is misaligned mainly due to the different geometry of the images in the two different orbits, is evident, indicating subsidence. Each interference fringe is a phase change which corresponds to motion of 2.8 cm in the satellite line of sight. The two wrapped interferograms were then used in the second stage; to calculate the terrain displacement, an unwrapping process was performed, and the phase unit was transformed into distance units in the line of sight (LoS) (differential interferograms) for every interferometric pair.
The InSAR results show that the area surrounding Arkalochori moved roughly downwards and are in a good agreement with previous works [21,22,53]. Note that dip-slip earthquakes have a very asymmetrical displacement pattern: i.e., the subsidence will be larger than the uplift for normal-faulting earthquakes. The terrain displacement products are similarly shifted. In the ascending orbit, we observe the epicenter of the main earthquake in the center of the ground deformation which has a maximum value of 18 cm (Figure 6c) which is the result of the superimposed effect of all the seismic events, mainly between 27 September and 29 September. In the descending orbit, the ground deformation has a maximum value of about 20 cm which results from the seismic events mainly between 27 September to 1 October and is located mainly east of the epicenter of the main earthquake (Figure 6d).
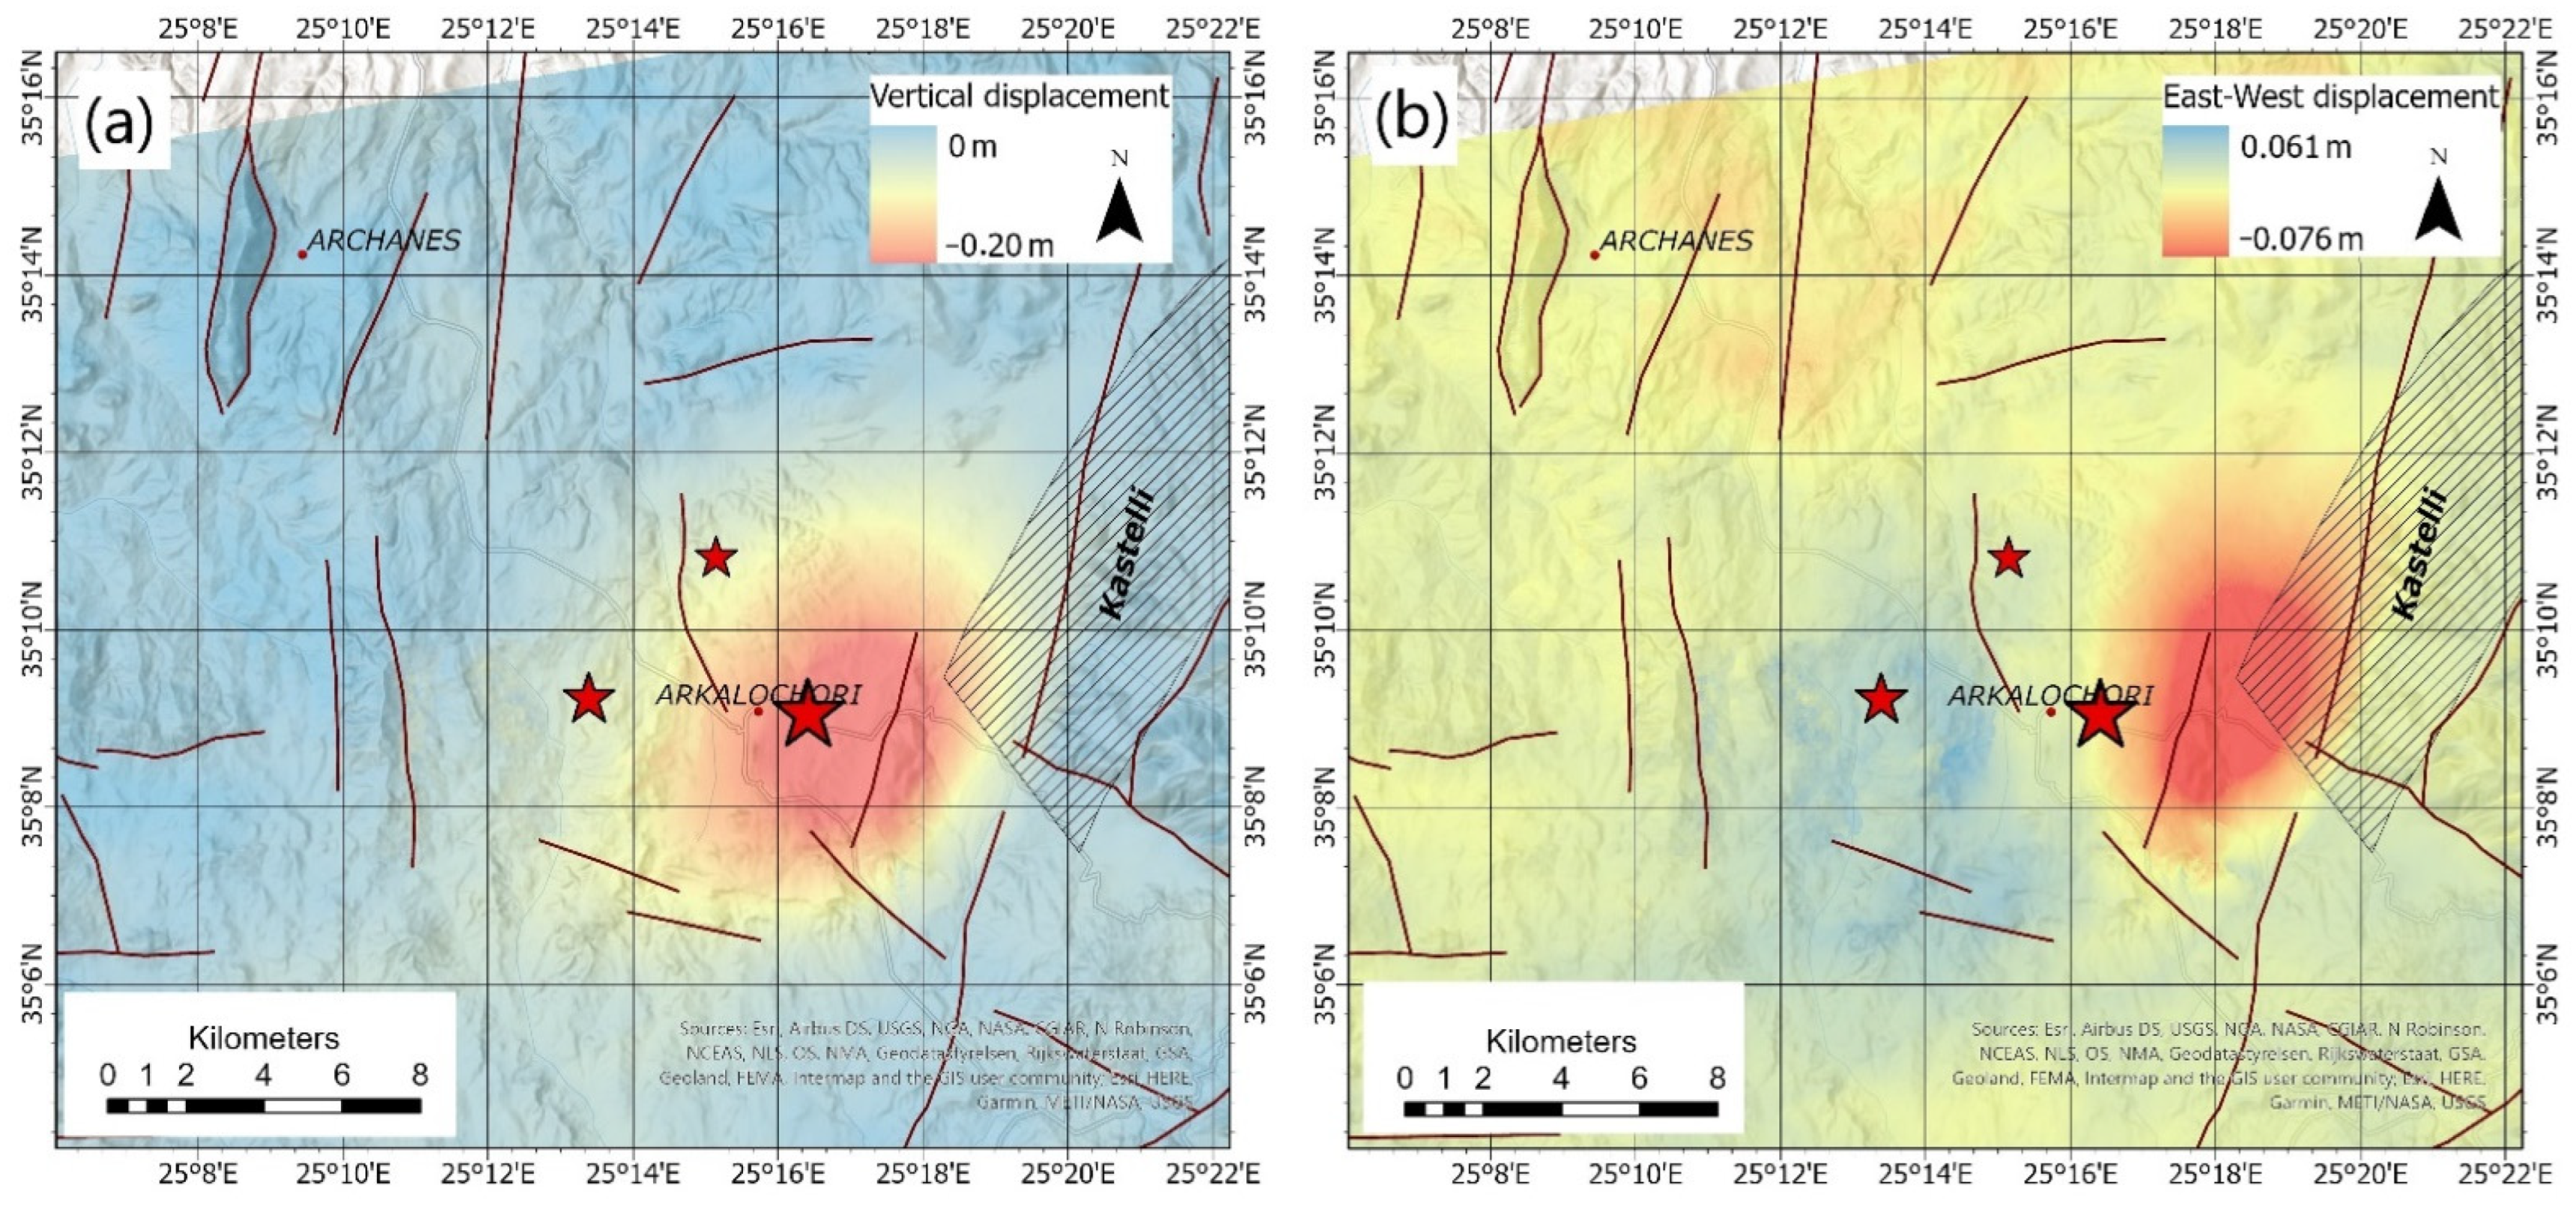
Finally, to map the vertical (up–down) and horizontal (east–west) displacement, decomposition of ascending and descending LOS displacement products was performed. After the decomposition, the ground deformation in the vertical (up–down) direction showed subsidence up to 20 cm, while no uplift displacement was detected (Figure 7a). The horizontal (east–west) displacement map indicated a maximum displacement of about 8 cm towards the east of the footwall block and about 6 cm towards the west of the hanging wall (Figure 7b) in agreement with that observed in [21,22] and modeled in [53], probably attributed to the strike–slip component of the earthquake focal mechanism as suggested in [21].
5. Conclusions
In the present work the RST (Robust Satellite Technique) was used to detect and map thermal anomalies possibly associated to the 27 September 2021, strong, rare, and unexpected earthquake of magnitude Mw6.0 occurring onshore of Central Crete (Greece), in the vicinity of Arkalochori village. A total of 10 years (2012–2021) of daily night-time Land Surface Temperature (LST) remote sensing data from Moderate Resolution Imaging Spectroradiometer (MODIS) were used to create the background pattern of the area. The seismic activity began several months before the main event, and nine intense (signal-to-noise ratio > 3), infrequent, spatially extensive, and temporally persistent TIR signal transients were identified from July to September 2021. Eight of them could be characterized as pre-seismic thermal anomalies, while the last one as co-seismic, since it was observed the day the main event occurred. Concerning their spatial distribution, five of the pre-seismic thermal anomalies coincided with the Mount Yuchtas area, while two (observed on 2 July and 10 August, respectively) were located south of Arckalochori village in the proximity of the Kastelli seismogenic source. Similar spatial distribution existed in the thermal anomaly observed during the day the main event occurred. The latter possibly implies that the two thermal anomalies observed south of the earthquake epicenter before the earthquake occurrence could be related to the future co-seismic displacement of the region due to the activation of the Kastelli zone.
Moreover, using InSAR patterns, we confirmed that the Mw = 6.0 earthquake and its strongest aftershock of 28 September 2021 (Mw5.3) produced mainly subsidence up to 20 cm combined with a less important horizontal eastward movement up to 6 cm and a westward movement up to 8 cm to the west and to the east of Arckalochori town respectively.
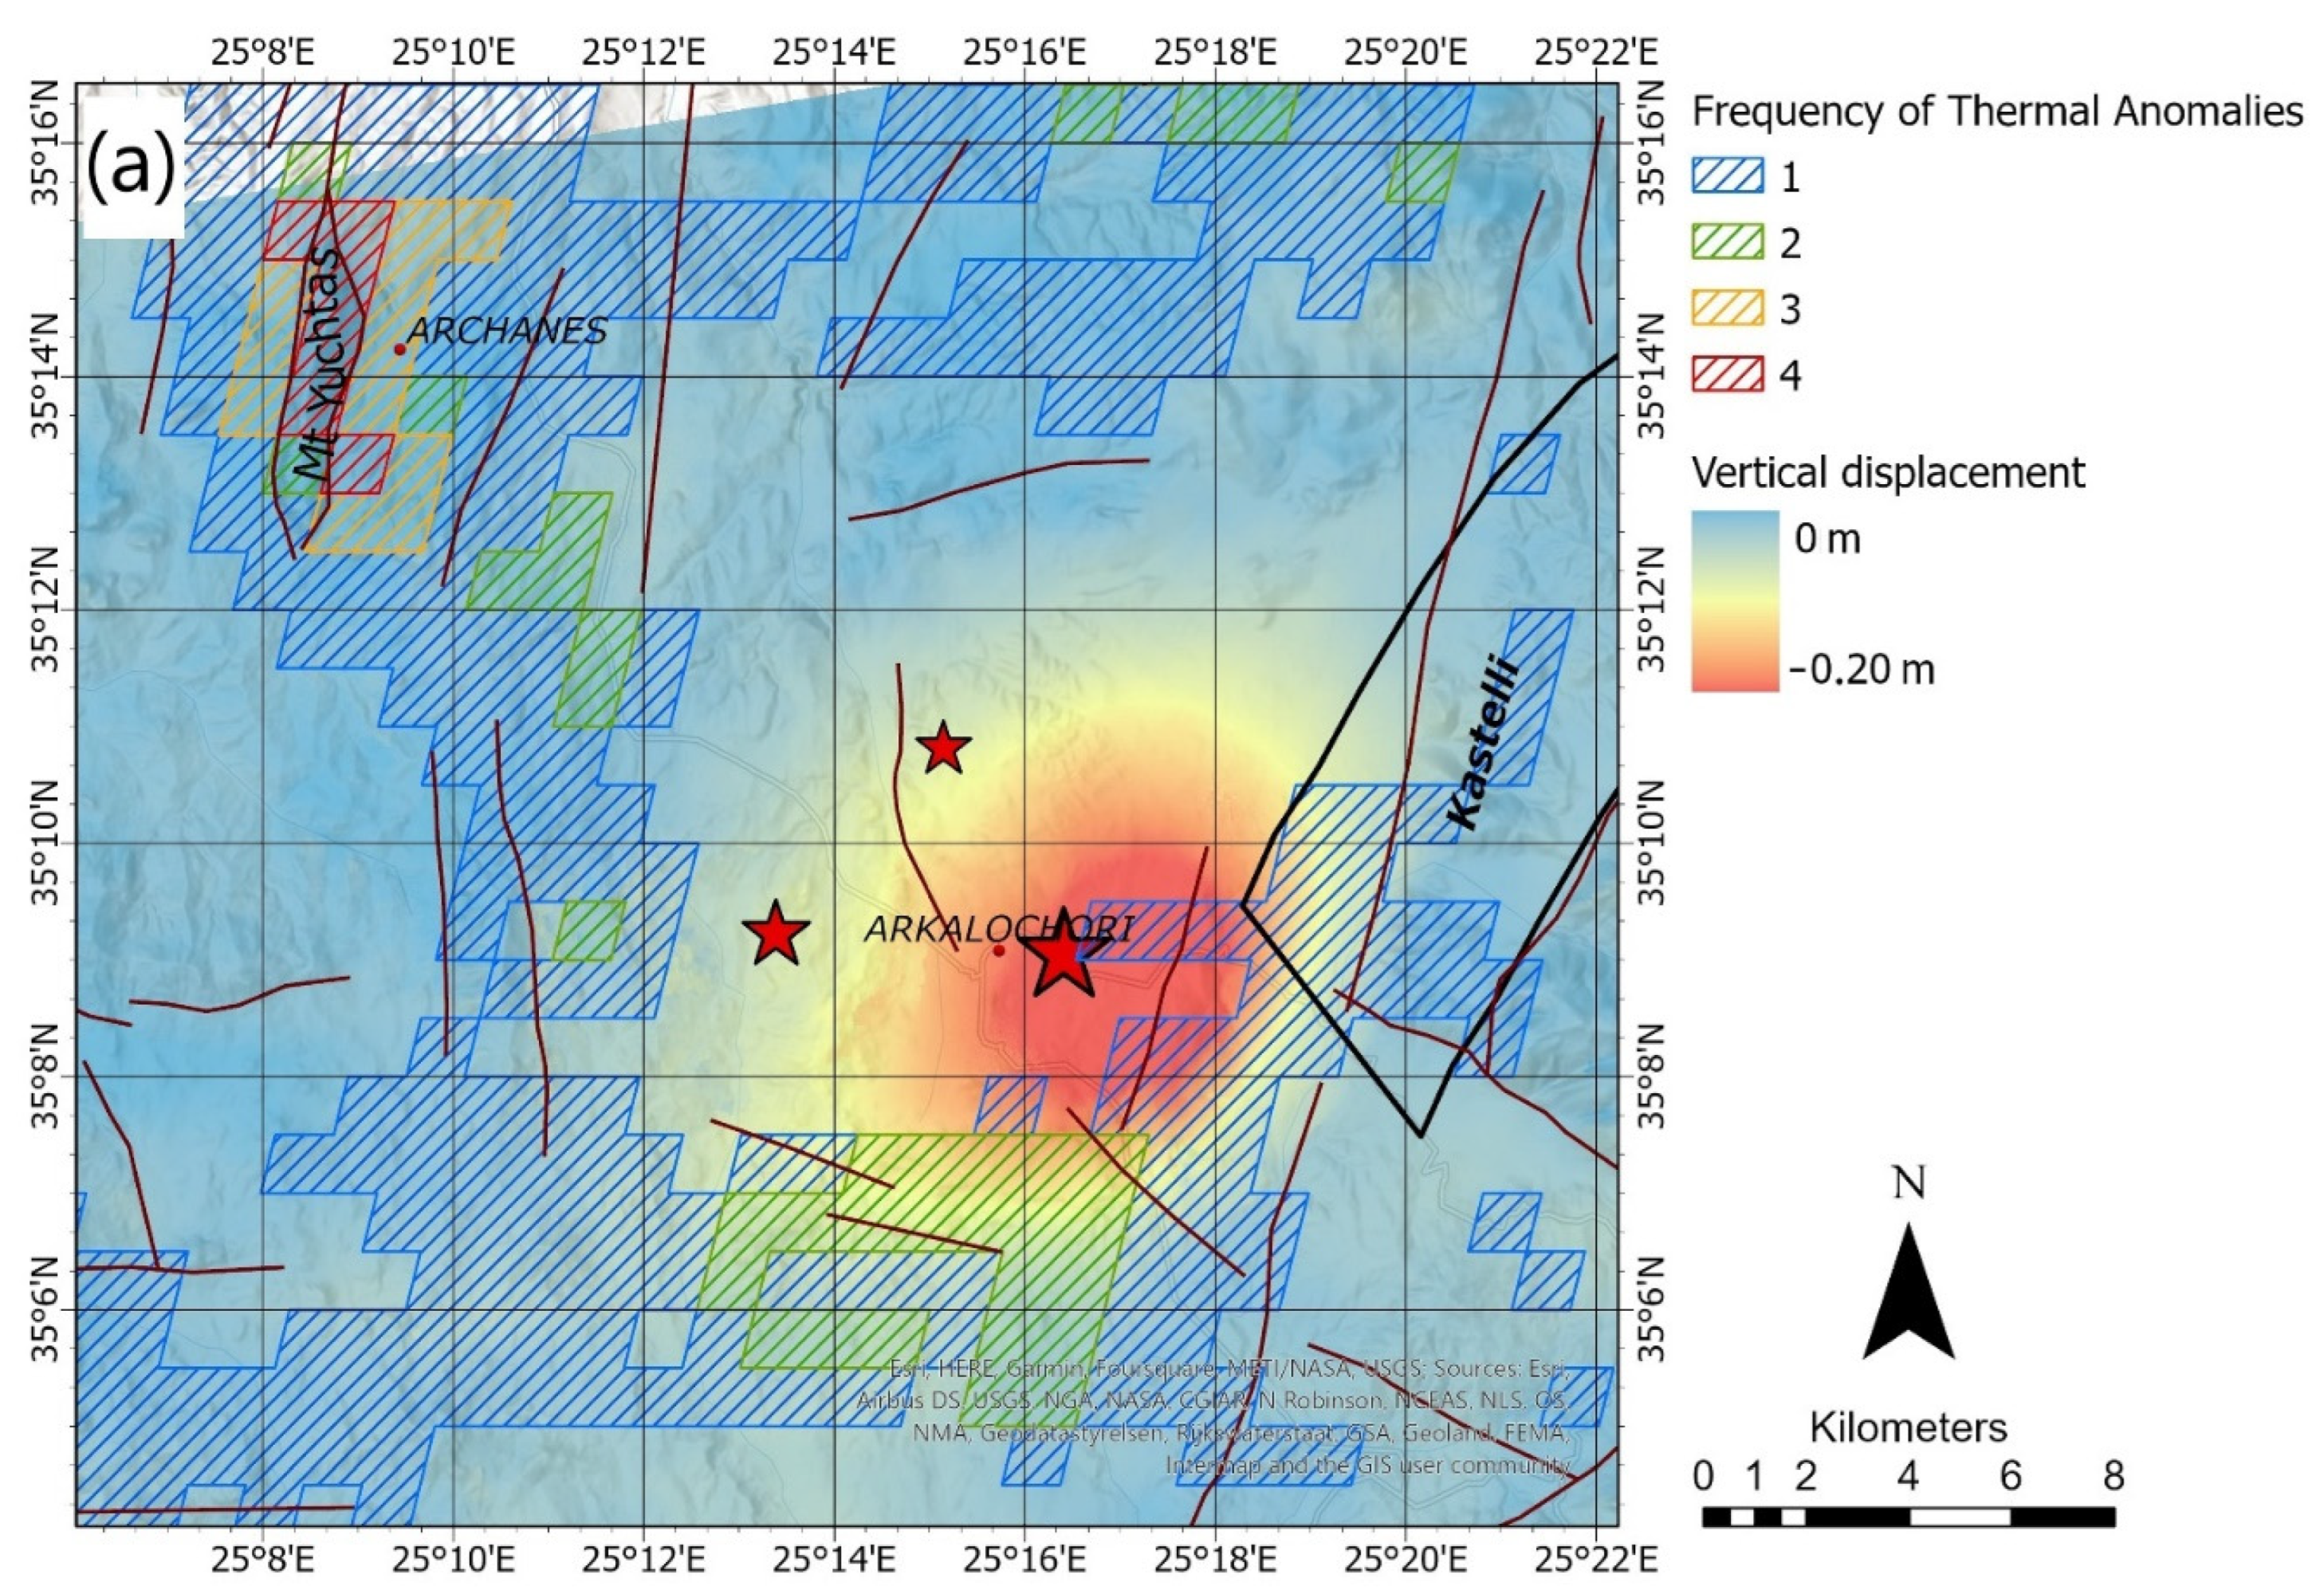
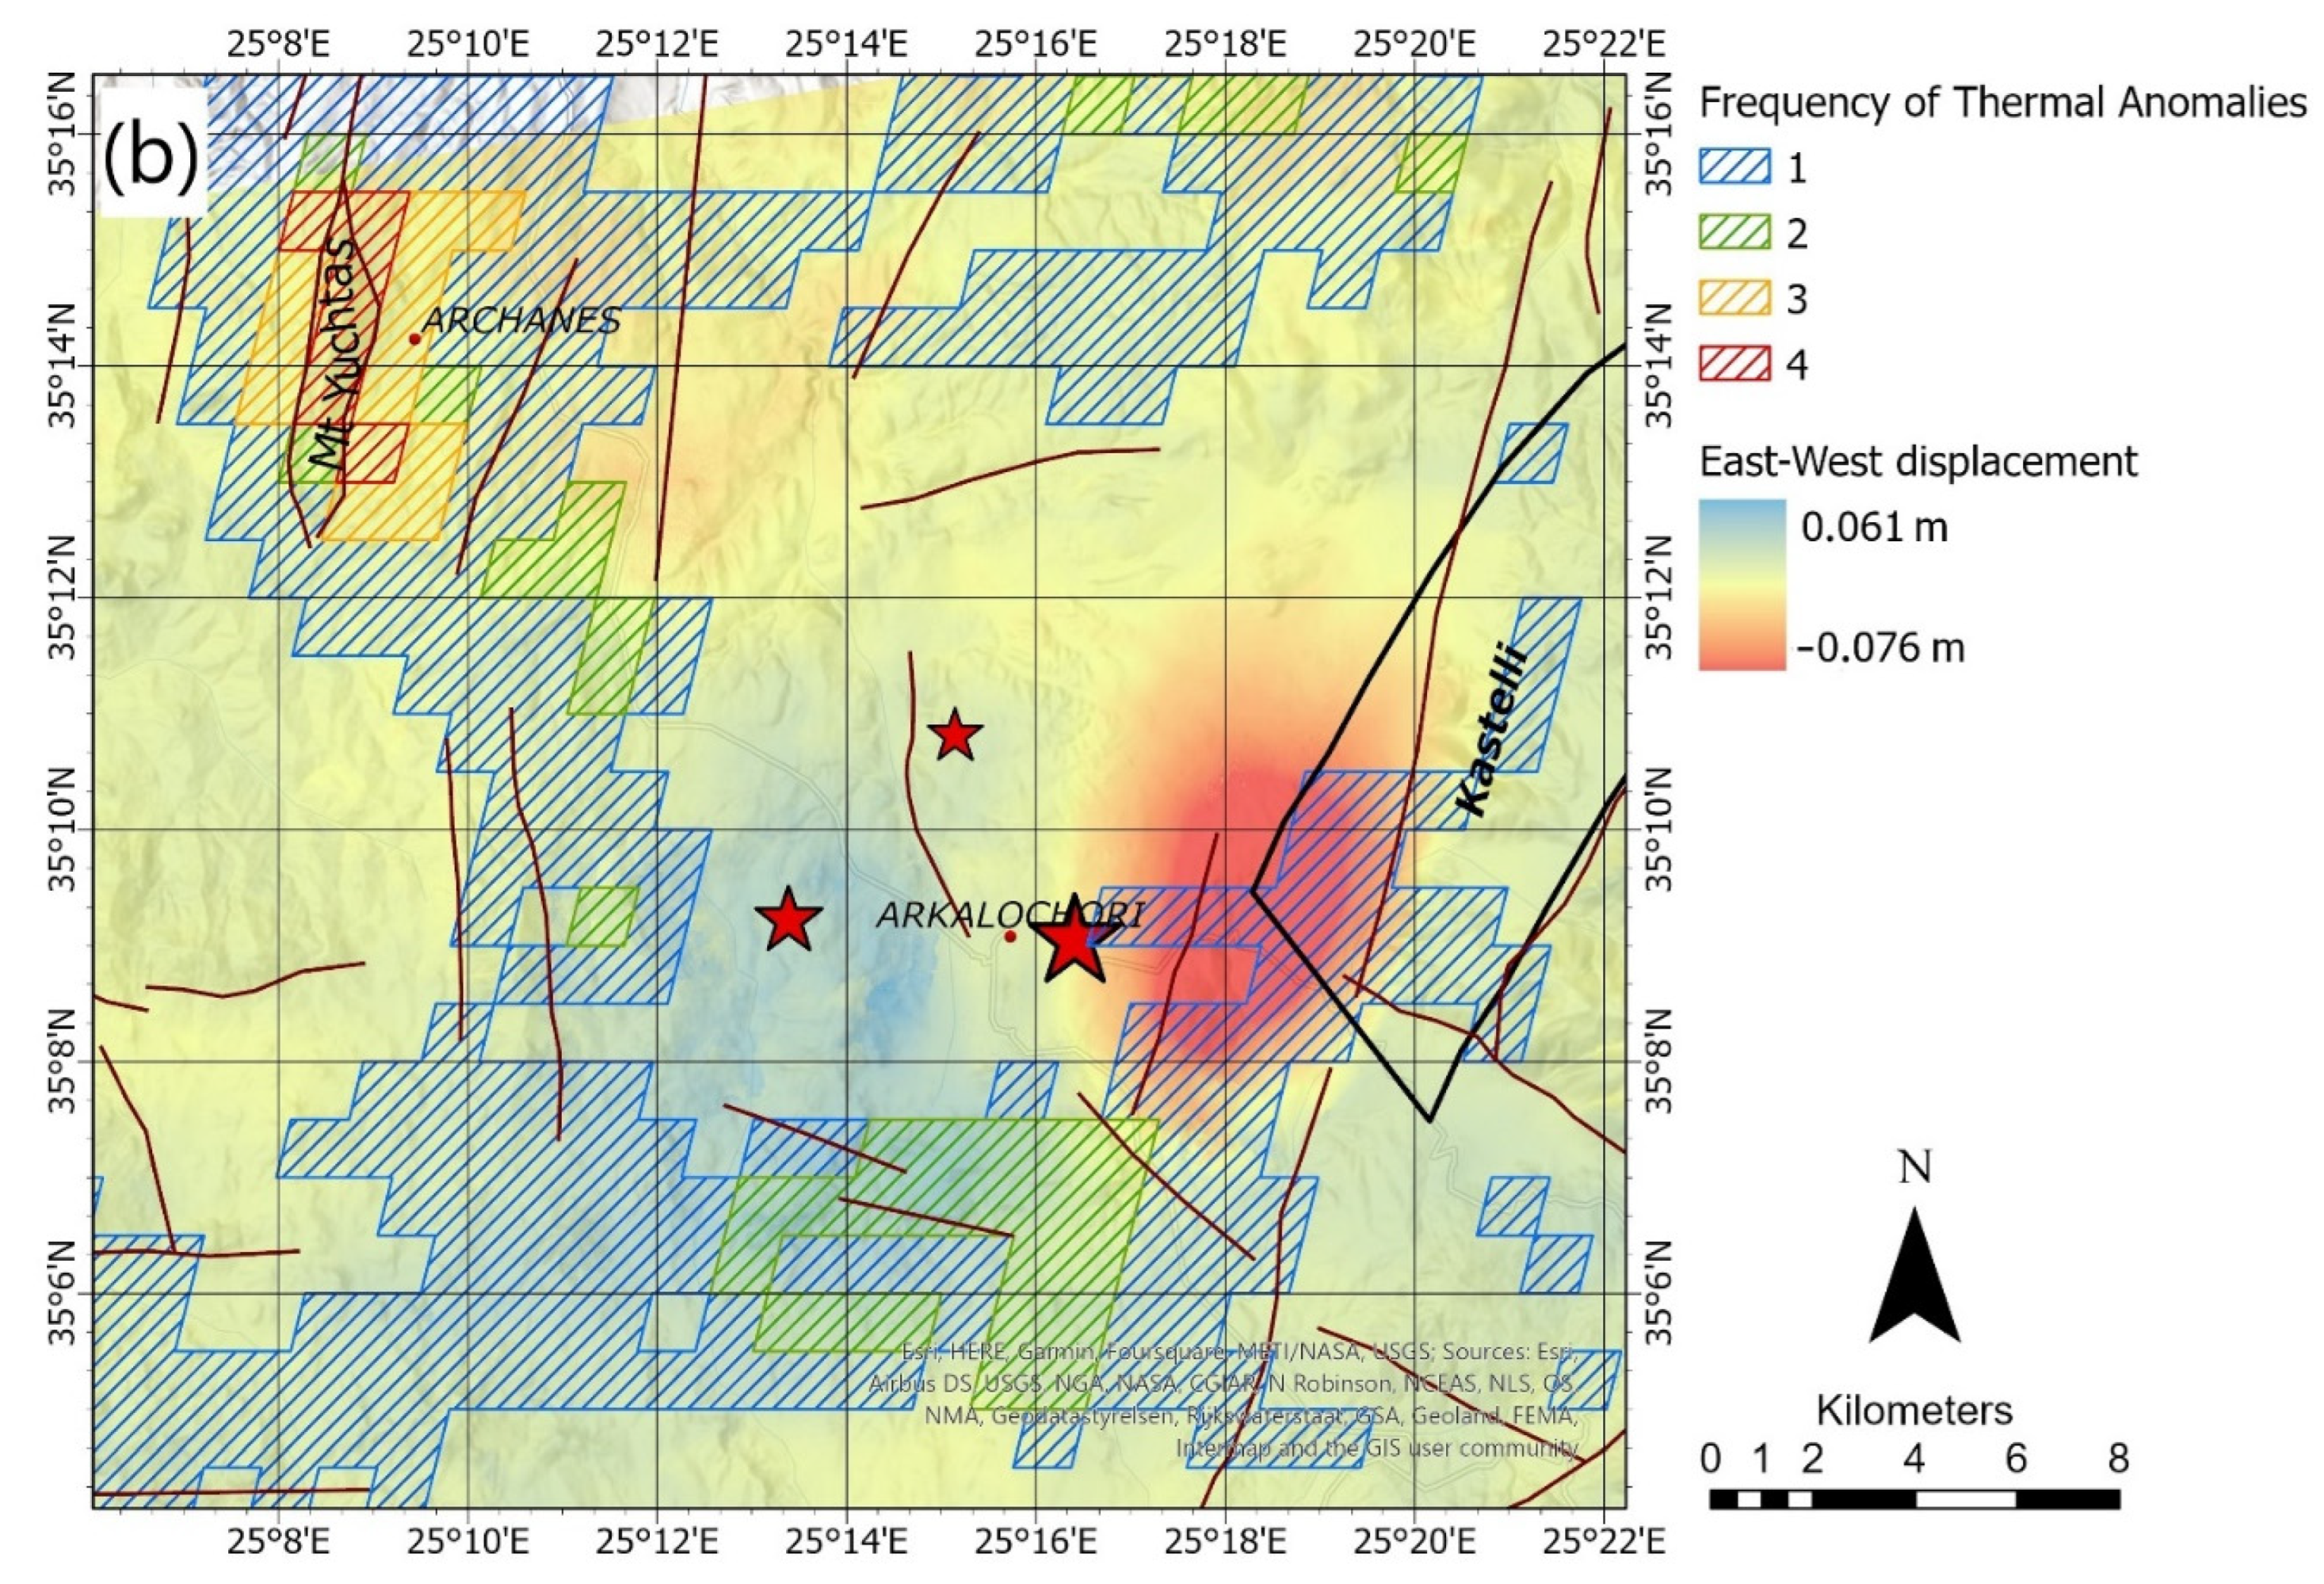
The superimposition of the frequency thermal anomaly map to the ground deformation maps (produced using Sentinel-1 satellite images) (Figure 8) reveals the existence of a common area in the south of Arkalochori village. As far as we know, this is the first time that the spatiotemporal correlation between the two different phenomena, i.e., thermally emitted radiation anomalies and the Earth’s surface deformation, has been revealed.
Concerning the day the main event occurred, the two datasets partially overlap with a great portion of thermally anomalous pixels to be contained by the area that significantly deformed. This is more evident in the case of horizontal displacement where a significant portion of the thermal anomaly coincided with the westward-moving terranes and the southern part of the Kastelli fault zone.
What is worth noting is the fact that part of the deformed area was characterized as thermally anomalous twice during the four months (Figure 8). This observation, although needing further investigation, could be of great importance for the development of a short-term forecasting system of strong earthquake events.
Herein, we attempt to propose a preliminary physical mechanism for the observed thermal anomalies in agreement with the deformation pattern associated to the Mw6.0 main event. Thermal anomalies seem to exhibit a selective spatial distribution, as they appear to be preferentially concentrated in areas with high fault densities, such as areas where two faults are joined, as in the case of Mount Yuchtas. This significant increase of thermal radiation can be attributed to greenhouse gas (mainly CO2 and CH4) reservoirs whose spatial relationship with seismogenic fault systems has been reported (e.g., [54,55]). As stated by [54], an increase of stress can cause the release of gases, such as CO2, CH4 and N2, that are trapped in the pores of the rocks. The gases are released from the Earth’s surface with the activation of cracks since micro-fracturing can lead to permeability changes and gas diffusion, which is supported by their high mobility [55,56]. In some cases, and especially in extensional tectonic environments, CO2 is produced from the melting of subducted carbonates and accumulates in crustal reservoirs triggering earthquakes at crustal depth [57,58].
An alternative explanation which could be active in parallel with that proposed above is based on the activation of electrical charges (electrons and positive holes) in rocks by the activation of peroxy defects during the increasing of tectonic stresses prior to any major seismic activity [59]. The positive holes are able to flow out of the stressed rock volume through the surrounding unstressed rock traveling fast, while electrons remain trapped locally [60]. The presence of hole charge carriers that form a surface charge layer could be an alternative explanation since when holes accumulate in the surface or near surface structure, they can recombine and return to the self-trapped positive hole pair from which they exited before their stress activation at depth. Furthermore, laboratory experiments till failure on a constant rated load anorhosite sample (a nominally monomineralic feldspar rock) suggests an IR emission that appears and disappears as the stress build-up progresses, interpreted as a hole pair recombination process ([59,60] and references therein).
The hypothesis of thermal anomalies due to the release of gases is suggested for the Central Crete earthquake sequence, and it is reinforced by the recent report of the presence of biogenic gases in water wells in the Messara basin [61] and the broader Arkalochori area as well [62] (Figure 9). The extended thick Neogene sediments are suggested as the host of the gas whose migration follows the general dip direction of the Miocene strata and the faults charging the sediments located several kilometers away to the NNW of the basin depocenter. This could explain the intense and persistent thermal anomalies on Mount Yuchtas. Given the fact that the Neogene sediments are extremely extended in the study area, with the western and the eastern parts of the Messara basin exhibiting the greatest depths, while the central part is significantly more elevated, one could similarly explain the existence of thermal anomalies southeast of Arkalochori and the absence of the phenomenon to the north and northeast of Arkalochori (Figure 9). The continuously increasing stress during the preseismic phase resulted to an increase in degassing activity. As the stress evolution creates a network of micro- and meso-scaled cracks that superimposed to the already existing faulting system, a pathway is created that supports the discharge of trapped gas buffers. As the earthquake approaches, due to the creation of a significant fracture in the rupture zone, a new rise in degassing activity can occur before normality is gradually restored [20]. The absence of thermal anomalies during October could indicate that after the earthquake occurrence, the stress field relaxed ([63] and references therein) and thus reduced the above-described processes. A crucial note is that the appearance of thermal anomalies was in the time period where the system presented critical dynamics [25].
Further analysis of the proposed mechanism could help in understanding the earthquake preparation process and may indicate a hopeful pathway of research. The RST technique in combination with InSAR images and geological data can play a very important role in this direction. In conclusion, the present work is an attempt that will increase the scientific effort to define earthquake forerunners, and its future fusion with other state-of-the-art methods (e.g., [5]) will support our knowledge for earthquake preparatory processes.
Author Contributions
Conceptualization, M.K. and F.V.; methodology, M.K., F.V. and S.P.; software, S.P.; validation, S.P., M.K. and F.V.; formal analysis, S.P.; investigation, M.K., F.V. and S.P.; resources, S.P.; data curation, S.P. and M.K; writing—original draft preparation, S.P. and M.K; writing—review and editing, M.K. and F.V.; visualization, S.P.; supervision, M.K.; project administration, M.K. and F.V.; funding acquisition, M.K. All authors have read and agreed to the published version of the manuscript.
Funding
This research received no external funding.
Data Availability Statement
The MOD11A1 Version 6.1 product, available from 24 February 2000 was downloaded from https://earthdata.nasa.gov/ (accessed on 1 November 2021). Sentinel images were obtained from “The Copernicus Open Access Hub” (https://scihub.copernicus.eu/dhus/, accessed on 10 October 2021). All data products generated in this study is available from the authors upon request.
Acknowledgments
The authors gratefully acknowledge the comments and suggestions from three anonymous reviewers. InSAR processing and data modeling were carried out with SNAP (ESA). We used data from the HC (Seismological Network of Crete, doi:10.7914/SN/HC). We acknowledge support of Region of Crete by the project “Operation of the Hellenic Seismological Network of Crete”.
Conflicts of Interest
The authors declare no conflict of interest.
References
- Ouzounov, D.; Pulinets, S.; Hattori, K.; Taylor, P. Pre-Earthquake Processes: A Multidisciplinary Approach to Earthquake Prediction Studies. In Geophysical Monograph Series; John Wiley & Sons Inc.: Hoboken, NJ, USA, 2018; 365p. [Google Scholar]
- Genzano, N.; Filizzola, C.; Lisi, M.; Pergola, N.; Tramutoli, V. Toward the development of a multi parametric system for a short-term assessment of the seismic hazard in Italy. Ann. Geophys. 2020, 63, PA550. [Google Scholar] [CrossRef]
- Picozza, P.; Conti, L. Looking for earthquake precursors from space: A critical review. Front. Earth Sci. 2021, 9, 578. [Google Scholar] [CrossRef]
- Tramutoli, V.; Aliano, C.; Corrado, R.; Filizzola, C.; Genzano, N.; Lisi, M.; Martinelli, G.; Pergola, N. On the possible origin of thermal infrared radiation (TIR) anomalies in earthquake-prone areas observed using robust satellite techniques (RST). Chem. Geol. 2013, 339, 157–168. [Google Scholar] [CrossRef]
- De Santis, A.; Marchetti, D.; Pavón-Carrasco, F.J.; Cianchini, G.; Perrone, L.; Abbattista, C.; Alfonsi, L.; Amoruso, L.; Campuzano, S.A.; Carbone, M.; et al. Precursory worldwide signatures of earthquake occurrences on Swarm satellite data. Sci. Rep. 2019, 9, 20287. [Google Scholar] [CrossRef] [PubMed] [Green Version]
- Li, Z.L.; Tang, B.H.; Wu, H.; Ren, H.; Yan, G.; Wan, Z.; Sobrino, J.A. Satellite-derived land surface temperature: Current status and perspectives. Remote Sens. Environ. 2013, 131, 14–37. [Google Scholar] [CrossRef] [Green Version]
- Lillesand, T.M.; Kiefer, R.W.; Chipman, J.W. Remote Sensing and Image Interpretation; John Wiley & Sons: Hoboken, NJ, USA, 1987. [Google Scholar]
- Anderson, M.C.; Allen, R.G.; Morse, A.; Kustas, W.P. Use of Landsat thermal imagery in monitoring evapotranspiration and managing water resources. Remote Sens. Environ. 2012, 122, 50–65. [Google Scholar] [CrossRef]
- Vollmer, M.; Möllmann, K.P. Infrared Thermal Imaging: Fundamentals, Research and Applications, 2nd ed.; John Wiley & Sons: Hoboken, NJ, USA, 2017; ISBN 978-3-527-41351-5. [Google Scholar]
- Anderson, M.; Kustas, W. Thermal remote sensing of drought and evapotranspiration. EOS Trans. Am. Geophys Union 2008, 89, 233–234. [Google Scholar] [CrossRef]
- Kustas, W.; Anderson, M. Advances in thermal infrared remote sensing for land surface modeling. Agric. Forest Meteorol. 2009, 149, 2071–2081. [Google Scholar] [CrossRef]
- Karnieli, A.; Agam, N.; Pinker, R.T.; Anderson, M.; Imhoff, M.L.; Gutman, G.G.; Panof, N.; Goldberg, A. Use of NDVI and land surface temperature for drought assessment: Merits and limitations. J. Clim. 2010, 23, 618–633. [Google Scholar] [CrossRef]
- Ganas, A.; Lagios, E.; Petropoulos, G.; Psiloglou, B. Thermal imaging of Nisyros volcano (Aegean Sea) using ASTER data: Estimation of radiative heat flux. Int. J. Remote Sens. 2010, 31, 4033–4047. [Google Scholar] [CrossRef]
- Keramitsoglou, I.; Kiranoudis, C.T.; Ceriola, G.; Weng, Q.; Rajasekar, U. Identification and analysis of urban surface temperature patterns in Greater Athens, Greece, using MODIS imagery. Remote Sens. Environ. 2011, 115, 3080–3090. [Google Scholar] [CrossRef]
- Christman, Z.; Rogan, J.; Eastman, J.R.; Turner, B.L. Distinguishing Land Change from Natural Variability and Uncertainty in Central Mexico with MODIS EVI, TRMM Precipitation, and MODIS LST Data. Remote Sens. 2008, 8, 478. [Google Scholar] [CrossRef] [Green Version]
- Scambos, T.A.; Campbell, G.G.; Pope, A.; Haran, T.; Muto, A.; Lazzara, M.; Reijmer, C.H.; van den Broeke, M.R. Ultralow surface temperatures in East Antarctica from satellite thermal infrared mapping: The coldest places. Earth Geophys. Res. Lett. 2018, 45, 6124–6133. [Google Scholar] [CrossRef] [Green Version]
- Aguilar-Lome, J.; Espinoza-Villar, R.; Espinoza, J.C.; Rojas-Acuña, J.; Willems, B.L.; Leyva-Molina, W.M. Elevation-dependent warming of land surface temperatures in the Andes assessed using MODIS LST time series (2000–2017). Int. J. Appl. Earth Obs. 2018, 77, 119–128. [Google Scholar] [CrossRef]
- Peleli, S.; Kouli, M.; Marchese, F.; Lacava, T.; Vallianatos, F.; Tramutoli, V. Monitoring temporal variations in the geothermal activity of Miocene Lesvos volcanic field using remote sensing techniques and MODIS—LST imagery. Int. J. Appl. Earth Obs. Geoinf. 2021, 95, 102251. [Google Scholar] [CrossRef]
- Kouli, M.; Peleli, S.; Saltas, V.; Makris, J.P.; Vallianatos, F. Robust Satellite Techniques for mapping thermal anomalies possibly related to seismic activity of March 2021, Thessaly Earthquakes. Bull. Geol. Soc. Greece 2021, 58, 105–130. [Google Scholar] [CrossRef]
- Filizzola, C.; Corrado, A.; Genzano, N.; Lisi, M.; Pergola, N.; Colonna, R.; Tramutoli, V. RST Analysis of Anomalous TIR Sequences in Relation with Earthquakes Occurred in Turkey in the Period 2004–2015. Remote Sens. 2022, 14, 381. [Google Scholar] [CrossRef]
- Triantafyllou, I.; Karavias, A.; Koukouvelas, I.; Papadopoulos, G.A.; Parcharidis, I. The Crete Isl. (Greece) Mw6.0 Earthquake of 27 September 2021: Expecting the Unexpected. Geo. Hazards 2022, 3, 6. [Google Scholar] [CrossRef]
- Vassilakis, E.; Kaviris, G.; Kapetanidis, V.; Papageorgiou, E.; Foumelis, M.; Konsolaki, A.; Petrakis, S.; Evangelidis, C.P.; Alexopoulos, J.; Karastathis, V. The 27 September 2021 Earthquake in Central Crete (Greece)—Detailed Analysis of the Earthquake Sequence and Indications for Contemporary Arc-Parallel Extension to the Hellenic Arc. Appl. Sci. 2022, 12, 2815. [Google Scholar] [CrossRef]
- Caputo, R.; Catalano, S.; Monaco, C.; Romagnoli, G.; Tortorici, G.; Tortorici, L. Active faulting on the island of Crete (Greece). Geophys. J. Int. 2010, 183, 111–126. [Google Scholar] [CrossRef]
- Karakonstantis, A.; Pavlou, K.; Kouli, M.; Michas, G.; Avgerinou, S.E.; Anyfadi, E.A.; Chatzopoulos, G.; Hloupis, G.; Makris, J.P.; Vallianatos, F. Preliminary results of the 2021–2022 central Crete seismic sequences: Seismological, Satellite and Geophysical observations. In Proceedings of the 3rd European Conference on Earthquake Engineering & Seismology, Bucharest, Romania, 4–9 September 2022. [Google Scholar]
- Vallianatos, F.; Michas, G.; Hloupis, G.; Chatzopoulos, G. The Evolution of Preseismic Patterns Related to the Central Crete (Mw6.0) Strong Earthquake on 27 September 2021 Revealed by Multiresolution Wavelets and Natural Time Analysis. Geosciences 2022, 12, 33. [Google Scholar] [CrossRef]
- Hellenic Unified Seismic Network (H.U.S.N.). Available online: http://www.gein.noa.gr/en/networks/husn (accessed on 1 November 2021).
- Tramutoli, V.; Di Bello, G.; Pergola, N.; Piscitelli, S. Robust satellite techniques for remote sensing of seismically active areas. Ann. di Geofis. 2001, 44, 295–312. [Google Scholar] [CrossRef]
- Tramutoli, V.; Cuomo, V.; Filizzola, C.; Pergola, N.; Pietrapertosa, C. Assessing the potential of thermal infrared satellite surveys for monitoring seismically active areas: The case of Kocaeli (Izmit) earthquake, August 17, 1999. Remote Sens. Environ. 2005, 96, 409–426. [Google Scholar] [CrossRef]
- Tramutoli, V. Robust Satellite Techniques (RST) for Natural and Environmental Hazards Monitoring and Mitigation: Theory and Applications. In Proceedings of the 2007 International Workshop on the Analysis of Multi-Temporal Remote Sensing Images, Leuven, Belgium, 18–20 July 2007; pp. 1–6. [Google Scholar] [CrossRef]
- Curlander, J.; McDonough, R. Synthetic Aperture Radar: Systems and Signal Processing; John Wiley & Sons: Hoboken, NJ, USA, 1991; ISBN 978-0-471-85770-9. [Google Scholar]
- Hooper, A.; Bekaert, D.; Spaans, K.; Arıkan, M. Recent advances in SAR interferometry time series analysis for measuring crustal deformation. Tectonophysics 2012, 514–517, 1–13. [Google Scholar] [CrossRef]
- Massonnet, D.; Rabaute, T. Radar interferometry: Limits and potential. IEEE Geosci. Remote Sens. 1993, 31, 455–464. [Google Scholar] [CrossRef]
- Bamler, R.; Hartl, P. Synthetic aperture radar interferometry. Inverse. Prob. 1998, 14, 1–54. [Google Scholar] [CrossRef]
- Elliott, J.; Walters, R.; Wright, T. The role of space-based observation in understanding and responding to active tectonics and earthquakes. Nat. Communs. 2016, 7, 13844. [Google Scholar] [CrossRef] [Green Version]
- Markogiannaki, O.; Karavias, A.; Bafi, D.; Angelou, D.; Parcharidis, I. A geospatial intelligence application to support post-disaster inspections based on local exposure information and on coseismic DInSAR results: The case of the Durres (Albania) earthquake on November 26, 2019. Nat. Hazards 2020, 103, 3085–3100. [Google Scholar] [CrossRef]
- McKenzie, D. Active tectonics of the Mediterranean region. Geophys. J. Roy. Astr. Soc. 1972, 30, 109–185. [Google Scholar] [CrossRef] [Green Version]
- McKenzie, D. Active tectonics of the Alpine–Himalayan belt: The Aegean Sea and surrounding regions. Geophys. J. Int. 1978, 55, 217–254. [Google Scholar] [CrossRef] [Green Version]
- Le Pichon, X.; Angelier, J. The Hellenic arc and trench system: A key to the neotectonic evolution of the Eastern Mediterranean area. Tectonophysics 1979, 60, 1–42. [Google Scholar] [CrossRef]
- Kassaras, I.; Kapetanidis, V.; Ganas, A.; Tzanis, A.; Kosma, C.; Karakonstantis, A.; Valkaniotis, S.; Chailas, S.; Kouskouna, V.; Papadimitriou, P. The New Seismotectonic Atlas of Greece (v1.0) and Its Implementation. Geosciences 2020, 10, 447. [Google Scholar] [CrossRef]
- Ganas, A.; Oikonomou, Ι.; Tsimi, C. NOAfaults: A digital database for active faults in Greece. Bull. Geol. Soc. Greece 2013, 47, 518–530. [Google Scholar] [CrossRef] [Green Version]
- Caputo, R.; Pavlides, S. The Greek Database of Seismogenic Sources (GreDaSS), version 2.0.0: A Compilation of Potential Seismogenic Sources (Mw > 5.5) in the Aegean Region. 2013. Available online: https://gredass.unife.it/ (accessed on 1 November 2021). [CrossRef]
- Kokinou, E.; Moisidi, M.; Tsanaki, I.; Tsakalaki, E.; Tsiskaki, E.; Sarris, A.; Vallianatos, F. A seismotectonic study for the Heraklion basin in Crete (Southern Hellenic arc, Greece). Int. J. Geol. 2008, 2, 9–16. [Google Scholar]
- Van Hinsbergen, D.J.J.; Meulenkamp, J.E. Neogene supradetachment basin development on Crete (Greece) during exhumation of the South Aegean core complex. Basin Res. 2006, 18, 103–124. [Google Scholar] [CrossRef]
- Filizzola, C.; Pergola, N.; Pietrapertosa, C.; Tramutoli, V. Robust satellite techniques for seismically active areas monitoring: A sensitivity analysis on September 7, 1999 Athens’s earthquake. Phys. Chem. Earth 2004, 29, 517–527. [Google Scholar] [CrossRef]
- Eleftheriou, A.; Filizzola, C.; Genzano, N.; Lacava, T.; Lisi, M.; Paciello, R.; Pergola, N.; Vallianatos, F.; Tramutoli, V. Long-term RST analysis of anomalous TIR sequences in relation with earthquakes occurred in Greece in the period 2004–2013. Pure Appl. Geophys. 2016, 173, 285–303. [Google Scholar] [CrossRef] [Green Version]
- Pergola, N.; Aliano, C.; Coviello, I.; Filizzola, C.; Genzano, N.; Lacava, T.; Lisi, M.; Mazzeo, G.; Tramutoli, V. Using RST approach and EOS-MODIS radiances for monitoring seismically active regions: A study on the 6 April 2009 Abruzzo earthquake. Nat. Hazards Earth Syst. Sci. 2010, 10, 239–249. [Google Scholar] [CrossRef]
- Wan, Z. MODIS Land Surface Temperature Products User’s Guide. 2013. Available online: https://icess.eri.ucsb.edu/modis/LstUsrGuide/usrguide.html (accessed on 1 November 2021).
- Aliano, C.; Corrado, R.; Filizzola, C.; Genzano, N.; Pergola, N.; Tramutoli, V. Robust TIR satellite techniques for monitoring earthquake active regions: Limits, main achievements and perspectives. Ann. Geophys. 2008, 51, 303–317. [Google Scholar] [CrossRef]
- Aliano, C.; Corrado, R.; Filizzola, C.; Genzano, N.; Pergola, N.; Tramutoli, V. Robust satellite techniques (RST) for the thermal monitoring of earthquake prone areas: The case of Umbria-Marche October, 1997 seismic events. Ann. Geophys. 2008, 51, 451–459. [Google Scholar] [CrossRef]
- ESA Sentinel Online—Sentinel-1. Available online: https://sentinel.esa.int/web/sentinel/missions/sentinel-1 (accessed on 20 April 2020).
- Goldstein, R.M.; Werner, C.L. Radar interferogram filtering for geophysical applications. Geophys. Res. Lett. 1998, 25, 4035–4038. [Google Scholar] [CrossRef] [Green Version]
- Silverman, B.W. Density Estimation for Statistics and Data Analysis; Chapman and Hall: New York, NY, USA, 1986. [Google Scholar]
- Ganas, A.; Hamiel, Y.; Serpetsidaki, A.; Briole, P.; Valkaniotis, S.; Fassoulas, C.; Piatibratova, O.; Kranis, H.; Tsironi, V.; Karamitros, I.; et al. The Arkalochori Mw = 5.9 Earthquake of 27 September 2021 Inside the Heraklion Basin: A Shallow, Blind Rupture Event Highlighting the Orthogonal Extension of Central Crete. Geosciences 2022, 12, 220. [Google Scholar] [CrossRef]
- Pulinets, S.; Ouzounov, D. Lithosphere–atmosphere–ionosphere coupling (LAIC) model–an unified concept for earthquake precursors validation. J. Asian Earth Sci. 2011, 41, 371–382. [Google Scholar] [CrossRef]
- Thomas, D. Geochemical Precursors to Seismic Activity. Pure Appl. Geophys. 1988, 126, 241–266. [Google Scholar] [CrossRef]
- Martinelli, G. Previous, Current, and Future Trends in Research into Earthquake Precursors in Geofluids. Geosciences 2020, 10, 189. [Google Scholar] [CrossRef]
- Chiodini, G.; Cardellini, C.; Di Luccio, F.; Selva, J.; Frondini, F.; Caliro, S.; Rosiello, A.; Beddini, G.; Ventura, G. Correlation between tectonic CO2 Earth degassing and seismicity is revealed by a 10-year record in the Apennines, Italy. Sci. Adv. 2020, 6, 35. [Google Scholar] [CrossRef]
- Tamburello, G.; Pondrelli, S.; Chiodini, G.; Rouwet, D. Global-scale control of extensional tectonics on CO2 earth degassing. Nat. Commun. 2018, 9, 4608. [Google Scholar] [CrossRef]
- Freund, F.T. Pre-earthquake signals: Underlying physical processes. J. Southeast. Asian Earth Sci. 2011, 41, 383–400. [Google Scholar] [CrossRef]
- Freund, F.; Ouillon, G.; Scoville, J.; Sornette, D. Earthquake precursors in the light of peroxy defects theory: Critical review of systematic observations. Eur. Phys. J. Spéc. Top. 2021, 230, 7–46. [Google Scholar] [CrossRef]
- Panagopoulos, G.; Vafidis, A.; Soupios, P.; Manoutsoglou, E. A study on the Gas-bearing Miocene Sediments of MESSARA Basin in Crete (Greece) by Using Seismic Reflection, Geochemical and Petrophysical Data. Arab. J. Sci. Eng. 2022. [Google Scholar] [CrossRef]
- Panagopoulos, G.; Pyliotis, I.; Zelilidis, A.; Spyridonos, E.; Hamdan, H.; Vafidis, A.; Manoutsoglou, E. 3D modeling of biogenic gas-bearing Neogene deposits at Arkalochori region, Messara, Crete, Greece. Proc. IAMG Saltzburg. 2011, 431–440. [Google Scholar] [CrossRef]
- Vallianatos, F.; Sakkas, V. Multiscale Post-Seismic Deformation Based on cGNSS Time Series Following the 2015 Lefkas (W. Greece) Mw6.5 Earthquake. Appl. Sci. 2021, 11, 4817. [Google Scholar] [CrossRef]
- Institute of Geology and Mineral Exploration—IGME. Geological Map of Greece—Mochos Sheet (Scale 1:50.000); IGME: Athens, Greece, 1989. [Google Scholar]
Figure 1.
The map of Central Crete showing the epicenter of the main event and the foreshocks and aftershocks with magnitudes greater than or equal to M3.0 [26], the major active faults (adopted from [40]) and the seismogenic sources (adopted from [41]) located in the area.

Figure 2.
RETIRA thermal anomalies observed in the broader earthquake area of Central Crete during July 2021 are depicted with graduated colors depending on their value. The seismogenic source zones and the active faults are also indicated. The epicenters of the main event and of the two major aftershocks are shown with red stars.


Figure 3.
RETIRA thermal anomalies during August 2021 as observed on Central Crete are depicted with graduated colors depending on their value. The seismogenic source zones and the active faults are also indicated. The epicenters of the main event and of the two major aftershocks are shown with red stars.


Figure 4.
Pre-seismic and co-seismic (last image) RETIRA thermal anomalies of the broader earthquake area of Central Crete occurring during September 2021. The epicenters of the main event and of the two major aftershocks are shown with red stars.
Figure 4.
Pre-seismic and co-seismic (last image) RETIRA thermal anomalies of the broader earthquake area of Central Crete occurring during September 2021. The epicenters of the main event and of the two major aftershocks are shown with red stars.


Figure 5.
(a) Frequency map counting for each pixel the number of times it participated in one of the nine identified thermal anomalies during the pre-seismic period from July to September 2021; (b) normalized density faults map (see details in the text). The epicenters of the main event and of the two major aftershocks are shown with red stars.

Figure 6.
(a,b). Wrapped ascending (image pair 23 September–29 September 2021(track 102)) and descending (image pair 25 September–1 October 2021 (track 36)) co-seismic interferograms over the Arkalochori area; (c,d) LoS displacement maps in the ascending and descending orbit. The epicenters of the main event and of the two major aftershocks are shown with red stars.


Figure 7.
Displacement maps for: (a) the vertical (up–down); and (b) the E–W direction for Central Crete due to the 27 September 2021 earthquake overlain by the active faults of the broader area. The epicenters of the main event and of the two major aftershocks are shown with red stars.
Figure 7.
Displacement maps for: (a) the vertical (up–down); and (b) the E–W direction for Central Crete due to the 27 September 2021 earthquake overlain by the active faults of the broader area. The epicenters of the main event and of the two major aftershocks are shown with red stars.

Figure 8.
Displacement maps for: (a) the vertical (up–down); and (b) the E–W direction for the Central Crete earthquake overlain by the thermal anomaly frequency map. The epicenter of the main event and of the two major aftershocks are shown with red stars.
Figure 8.
Displacement maps for: (a) the vertical (up–down); and (b) the E–W direction for the Central Crete earthquake overlain by the thermal anomaly frequency map. The epicenter of the main event and of the two major aftershocks are shown with red stars.


Figure 9.
(a) Frequency of thermal anomalies combined with the wells that encountered gas, the active faults and the strongest earthquakes; and (b) the lithological map of the study area [64] showing the extended Neogene sediments and the proposed route followed by the gases before being released in the vicinity of Mount Youchtas. The epicenters of the main event and of the two major aftershocks are shown with red stars.


Publisher’s Note: MDPI stays neutral with regard to jurisdictional claims in published maps and institutional affiliations. |
© 2022 by the authors. Licensee MDPI, Basel, Switzerland. This article is an open access article distributed under the terms and conditions of the Creative Commons Attribution (CC BY) license (https://creativecommons.org/licenses/by/4.0/).
Share and Cite
MDPI and ACS Style
Peleli, S.; Kouli, M.; Vallianatos, F. Satellite-Observed Thermal Anomalies and Deformation Patterns Associated to the 2021, Central Crete Seismic Sequence. Remote Sens. 2022, 14, 3413. https://0-doi-org.brum.beds.ac.uk/10.3390/rs14143413
AMA Style
Peleli S, Kouli M, Vallianatos F. Satellite-Observed Thermal Anomalies and Deformation Patterns Associated to the 2021, Central Crete Seismic Sequence. Remote Sensing. 2022; 14(14):3413. https://0-doi-org.brum.beds.ac.uk/10.3390/rs14143413
Chicago/Turabian StylePeleli, Sofia, Maria Kouli, and Filippos Vallianatos. 2022. "Satellite-Observed Thermal Anomalies and Deformation Patterns Associated to the 2021, Central Crete Seismic Sequence" Remote Sensing 14, no. 14: 3413. https://0-doi-org.brum.beds.ac.uk/10.3390/rs14143413
Note that from the first issue of 2016, this journal uses article numbers instead of page numbers. See further details here.