Article

Identifying the Impact of Regional Meteorological Parameters on US Crop Yield at Various Spatial Scales Using Remote Sensing Data

1
Department of Land Surveying and Geo-Informatics, The Hong Kong Polytechnic University, Hong Kong SAR 999077, China
2
School of Urban and Environmental Engineering, Ulsan National Institute of Science and Technology (UNIST), Ulsan 44919, Korea
3
Center for Sustainable Environment Research, Korea Institute of Science and Technology, Seoul 02792, Korea
4
Department of Applied Artificial Intelligence, Seoul National University of Science and Technology, Seoul 01811, Korea
*
Author to whom correspondence should be addressed.
These authors contributed equally to this work.
Remote Sens. 2022, 14(15), 3508; https://0-doi-org.brum.beds.ac.uk/10.3390/rs14153508
Submission received: 8 June 2022 / Revised: 18 July 2022 / Accepted: 18 July 2022 / Published: 22 July 2022
(This article belongs to the Special Issue Impacts of Climate Change on Agriculture)

Abstract

:
This study investigates the influence of meteorological parameters such as temperature and precipitation on gross primary production (GPP) in the continental United States (CONUS) during boreal summer using satellite-based temperature and precipitation indices and GPP data at various scales (i.e., pixel, county, and state levels). The strong linear relationship between temperature and precipitation indices is presented around the central United States, particularly in the Great Plains, where the year-to-year variation of GPP is very sensitive to meteorological conditions. This sensitive GPP variation is mostly attributable to the semi-arid climate in the Great Plains, where crop productivity and temperature are closely related. The more specific information for the regionality of the relationships across the variables manifests itself at higher resolutions. The impact of the summer meteorological condition on the annual crop yield is particularly significant. Maize and soybean yields show a strong correlation with both Temperature Condition Index (TCI) and Precipitation Condition Index (PCI) in the Great Plains, with a relatively higher relationship with TCI than PCI, which is consistent with the relationship compared with GPP. This study suggests that in-depth investigations into the relationship between maize and soybean yields and the climate are required. The region-dependent relationship between GPP and meteorological conditions in our study would guide agricultural decision making in the future climate.

1. Introduction

The United States (US) is one of the world’s major crop producers, accounting for roughly one-third of world maize and soybean production [1]. Crop yields in the US show a positive long-term trend tied to continued developments in crop genetics and agronomic practices [2], while representing substantial variation associated with climate conditions [3,4,5]. Studies have shown that the annual variability of agricultural production is sensitive to year-to-year fluctuations in regional climate [5,6]. As discussed in Ray et al. [7], more than 36% of the annual variability of crop yield in the US Midwest is due to regional climate variability. Many studies have attempted to investigate the relationship between US crop yield and global climate variability, such as the El Niño–Southern Oscillation (ENSO), which can affect regional climate conditions [8,9,10,11,12,13].
The influence of regional climate conditions on crop yield can be attributed primarily to soil moisture variations, which result mostly from the interaction between temperature and precipitation. The anomalously high temperature and low precipitation during the growing season have been regarded as the main drivers creating unfavorable conditions for crop growth [4,14]. Excessively high temperatures in the growing season can decrease crop yield exponentially [15,16], cause pollen sterility, and reduce seed sets [6,17]. Prolonged lack of precipitation leads to a decrease in soil moisture that harms crop growth [18,19], indicating that the influence of these climatic factors can intensify under drought conditions [6]. As mentioned in Park et al. [18], two–three months before harvesting (July and August for maize and soybean) is the most important period because maize silking and soybean blooming occur during that season. Obviously, it is hard to demonstrate which climate condition is most responsible for crop yield variation, because (i) regional temperature and precipitation in boreal summer are highly correlated and (ii) the relative importance of the climate conditions depends on the regional characteristics. The analysis in this paper seeks to resolve the above-mentioned aspects to provide detailed information about the role of climate conditions in US agriculture.
Although many observational station data and the census of agriculture are available in the continental United States (CONUS) at national and state levels, they are still insufficient to represent the relationship between regional crop yield and climate conditions. What is required is an understanding of the relationships between crop yields and climate variability at finer spatiotemporal scales (e.g., county level and pixel level) [20]. Local-scale climate conditions usually demand spatiotemporally continuous high-resolution data to understand the effect on crop yield. Satellite-derived data provide spatiotemporally continuous climate conditions (e.g., precipitation, land surface temperature (LST), and soil moisture) covering large areas at relatively high resolution. Therefore, satellite data are useful for analyzing the influence of climate conditions on crop yield at local and regional scales. This study uses satellite-based precipitation, LST, and gross primary production (GPP) to identify the influence of local climate on crop growth. For better spatiotemporally continuous investigations, GPP is used as a surrogate variable representing agricultural production [21]. Maize and soybean yields are also used to identify the influence of climate conditions.
This study aims to identify the influence of climate conditions from high-resolution satellite images and to understand the role of climate conditions affecting regional maize and soybean production. Because anomalous climate conditions such as unusually hot and dry summers cause significant modulation in the US crop yield via excessive heat stress [6,18,22], this study focused on July–August. Another goal is to investigate whether the climate–US maize and soybean yield relationship exhibits regional dependency. The sensitivity of maize and soybean yield to temperature and precipitation depends on local factors, including irrigation rates, dry soil conditions, and farming methods [23,24,25]. These considerations strongly suggest that detailed investigations of regional characteristics of the climate–maize and soybean yield relationship are necessary. A better understanding of the relative role of regional temperature and precipitation on crop productivity will greatly benefit a wide range of agricultural applications. The specific objectives of this paper are to: (i) examine correlations between satellite-based temperature and precipitation indices and GPP data at various scales (i.e., pixel, county, and state levels); (ii) identify what causes the regionally dependent sensitivity of GPP to the meteorological conditions; and (iii) examine the extent to which GPP can explain maize and soybean yield in the census.

2. Data and Methodology

The considered study area CONUS comprises 48 states and the District of Columbia. This study was conducted using LST, precipitation, GPP, and crop yield data across CONUS (Table 1). Moderate resolution imaging spectroradiometer (MODIS) provides various surface products which are useful to monitor crop growth. Monthly MODIS daytime Terra satellite LST data (MOD11C3) in summer were used in this study. The LST data are obtained at about 10:30 a.m. local time and have 0.05° spatial resolution. The generalized split-window algorithm was used for retrieving the LST products [26]. GPP data based on daily net photosynthesis was used to diagnose the condition of the growth of crops (maize and soybean). In this study, an 8-day composite MODIS GPP product (MOD17A2) at daytime (10:30 a.m.) with 1 km resolution was used. The MODIS LST and GPP products for July and August from 2000 to 2020 were downloaded from NASA Earthdata Search (https://lpdaac.usgs.gov/tools/earthdata-search; assessed on 1 February 2022). Monthly precipitation data for July and August from 2000 to 2020 was obtained from Climate Hazards Group InfraRed Precipitation with Station data (CHIRPS) (https://www.chc.ucsb.edu/data; assessed on 1 February 2022), which combines satellite imagery with 0.05° resolution and in situ station data to produce a gridded rainfall time series [27]. CHIRPS especially shows good agreements with the station data in CONUS [28]. The MODIS GPP data with 1 km resolution were mean aggregated to 0.05° resolution and transformed to a monthly time scale by considering the number of days in the composite data. Precipitation data were reprojected onto MODIS imagery. Crop yield data from 2000 to 2020 were obtained from the US Department of Agriculture National Agricultural Statistics Service Quick Stats (USDA NASS; https://quickstats.nass.usda.gov/; assessed on 1 February 2022). Total maize (grain) and soybean yield data from survey data measured in units of bushels per acre were used. The bsh/ac can be converted to tonnes/hectare (t/ha) using a conversion factor of 0.063 and 0.067 for maize and soybean, respectively.
Figure 1 shows the long-term mean spatial distribution of LST and precipitation averaged from July to August (Figure 1a,b), the amount of state maize and soybean production (Figure 1c,d), and the irrigation rate (Figure 1e). The percentages of US maize and soybean production are indicated for each state (Figure 1f). The Midwest shows relatively lower LSTs in summer compared with other regions, while the western US exhibits high LSTs due to low evaporation from their dry condition (i.e., arid, desert, or steppe climate) [29]. For precipitation, the eastern US has a huge amount of rainfall in the summer, particularly in the southeastern US. The large rainfall in these regions is associated with the moisture transport from the Gulf of Mexico via the Caribbean low-level jet [30]. The Midwest also exhibits relatively large summer rainfall, due to moisture convergence based on the Great Plains low-level jet [31]. With the cool and rainy background climate, the major regions for maize and soybean production are located in the midwestern maize/soybean belt area (Figure 1). The states that make up 80% of total maize and soybean production are highlighted with a specific boundary (Figs. 1c and e). Nine states—South Dakota (SD), Nebraska (NE), Kansas (KS), Minnesota (MN), Iowa (IA), Wisconsin (WI), Illinois (IL), Indiana (IN), and Ohio (OH)—for maize, and eleven states—SD, NE, KS, MN, IA, IL, IN, OH, North Dakota (ND), Missouri (MO), and Arkansas (AR)—for soybean are included in these boundaries. The irrigation rate is relatively high in arid regions (>60%) and relatively low in humid regions (<20%) (Figure 1e).
Since the quantitative range of values for LST and precipitation differ, we normalized each of their pixels for July and August between 2000 and 2020. These normalized LST and precipitation products are known as the Temperature Condition Index (TCI; [32]) and the Precipitation Condition Index (PCI; [33]). In particular, they are widely used indices in drought research (Equations (1) and (2)).
TCI = ( LST max LST i ) /   ( LST max LST min )
PCI = ( PR i PR min ) /   ( PR max PR min )
where LSTmax and LSTmin, and PR max, and PRmin are the maximum and minimum values of LST and precipitation of given study periods. LSTi and PRi are the LST and precipitation values of the pixel of a particular ith year.
Moreover, the county-level and state-level TCI, PCI, and GPP data were produced by mean aggregation. The correlations were analyzed between TCI and PCI, TCI and GPP, and PCI and GPP for pixel-level, county-level, and state-level for July and August. We further assessed the correlation between crop production and the climate variables (i.e., TCI and PCI) based on the respective state levels for the major maize and soybean production. As mentioned above, maize and soybean have positive trends because of the developments in crop genetics and agriculture. Therefore, the linear trend of maize and soybean yield was removed.

3. Results and Discussion

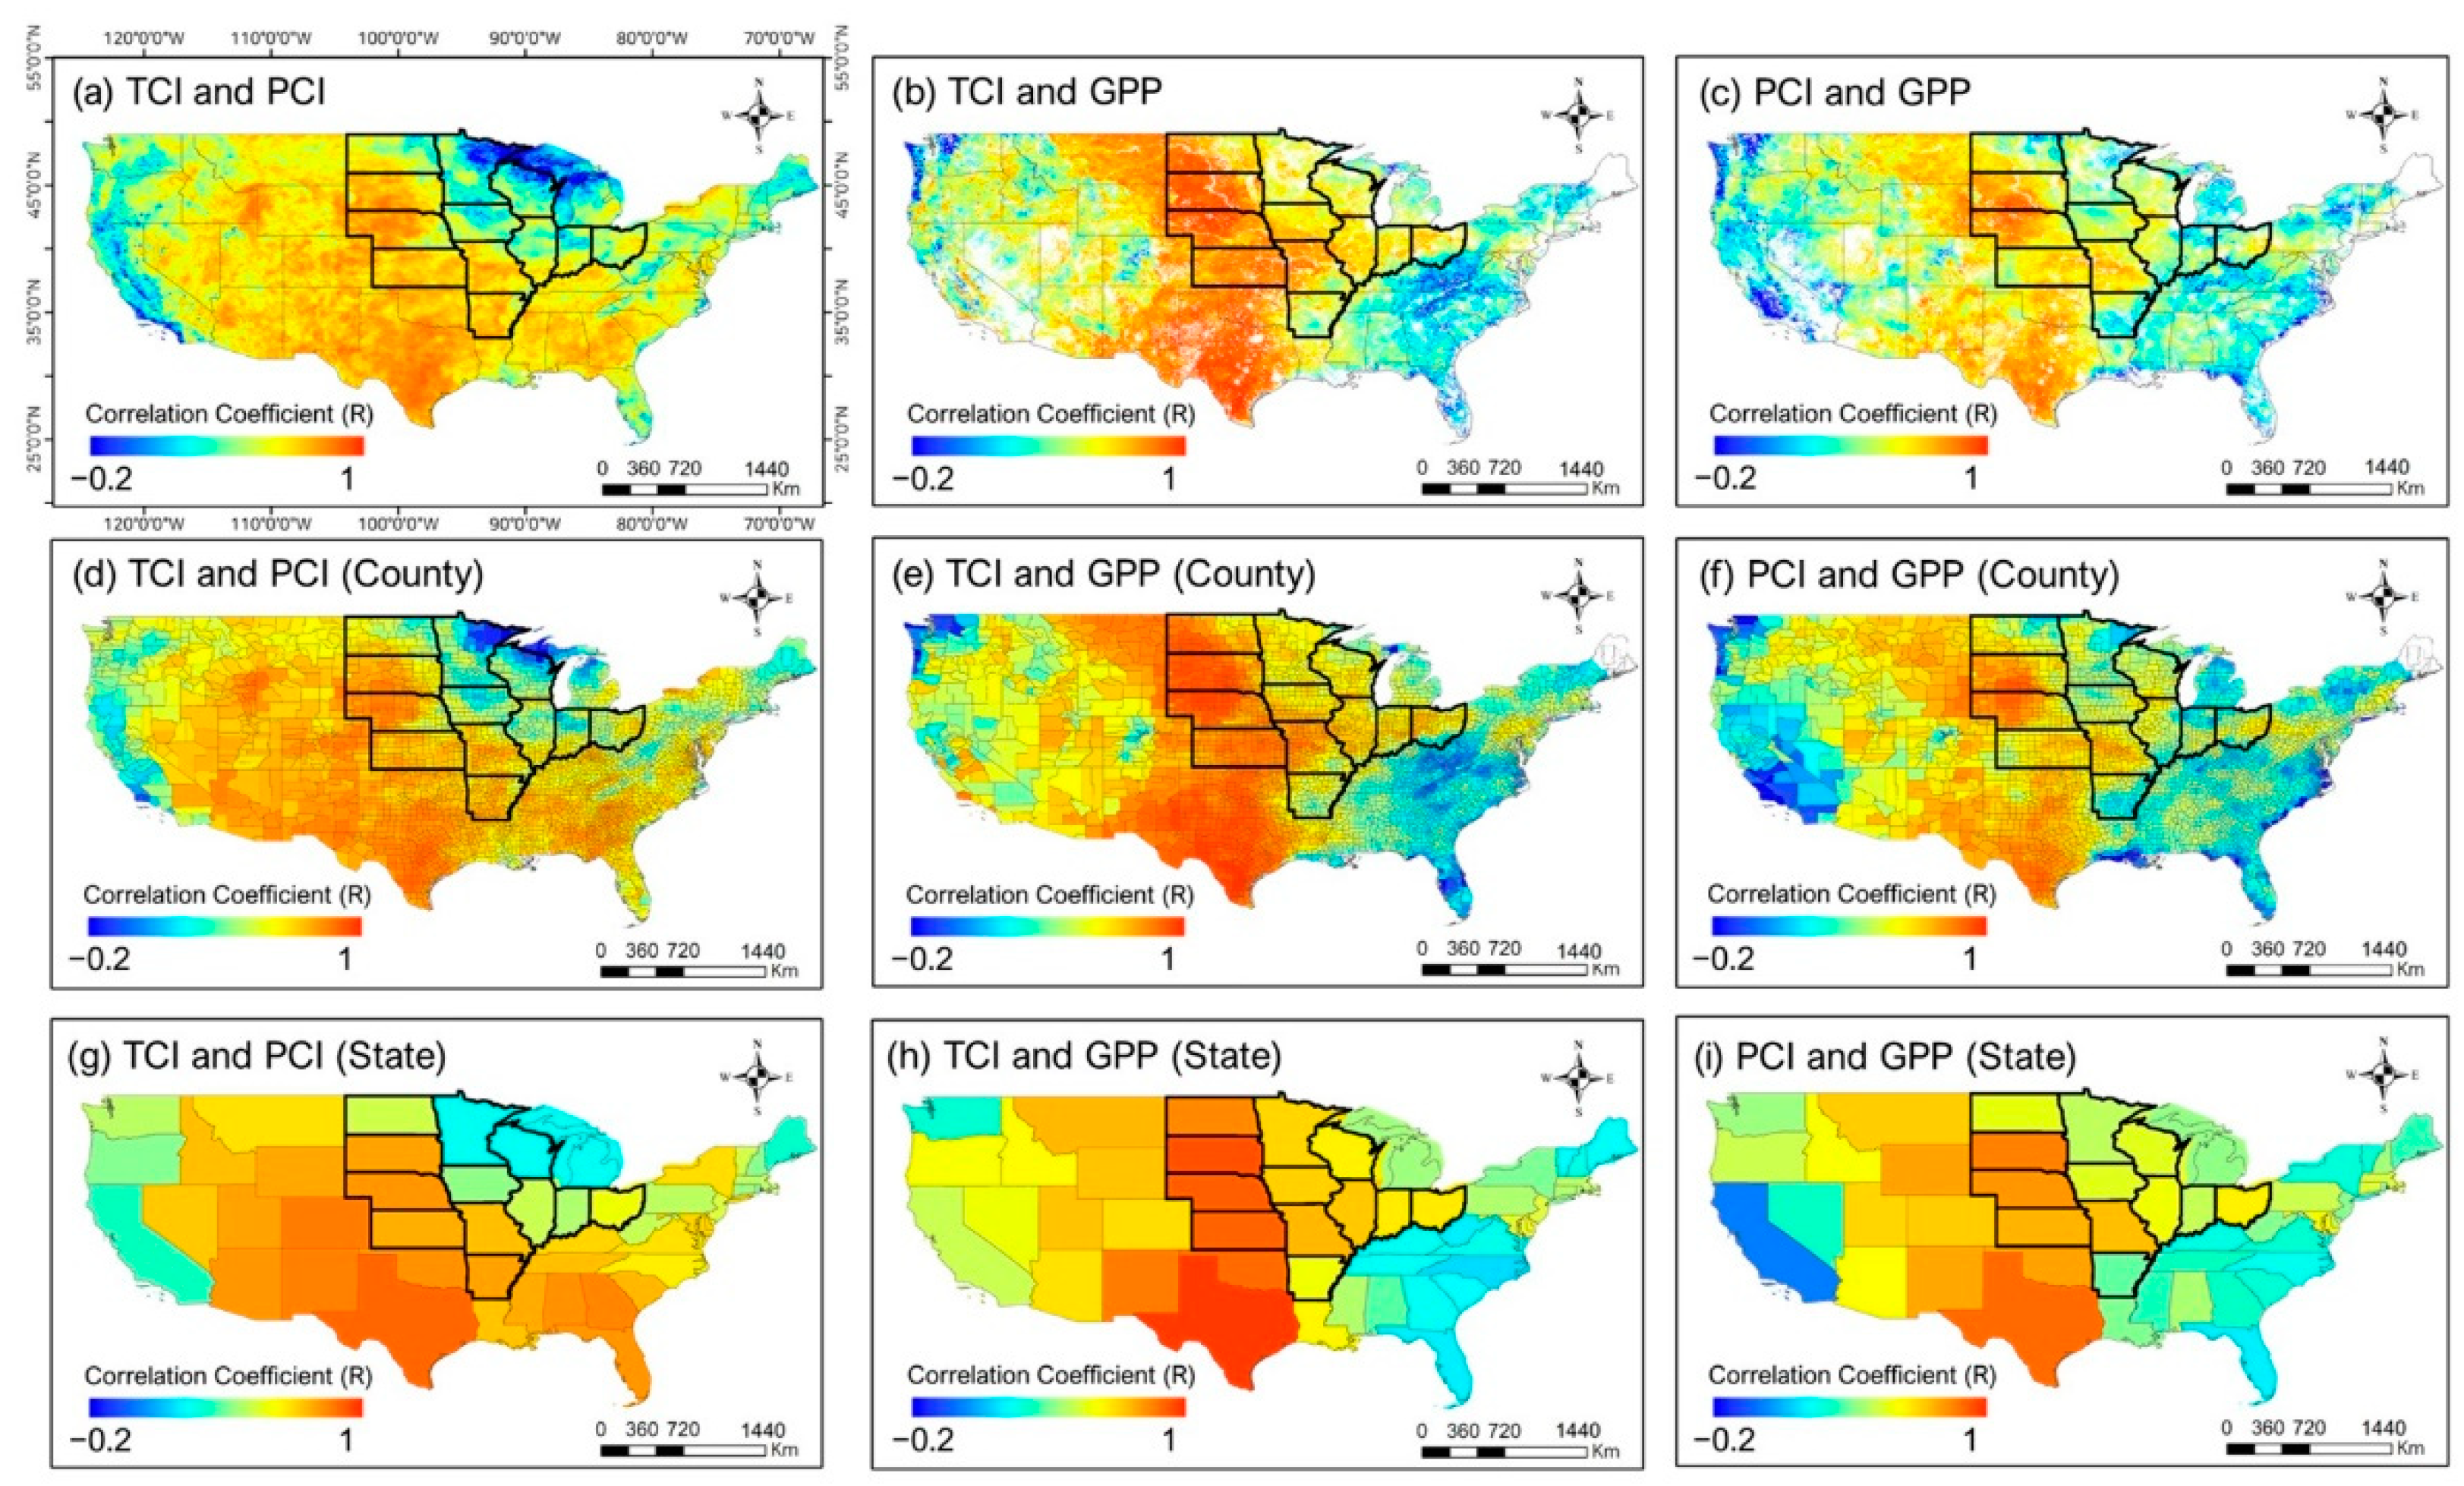
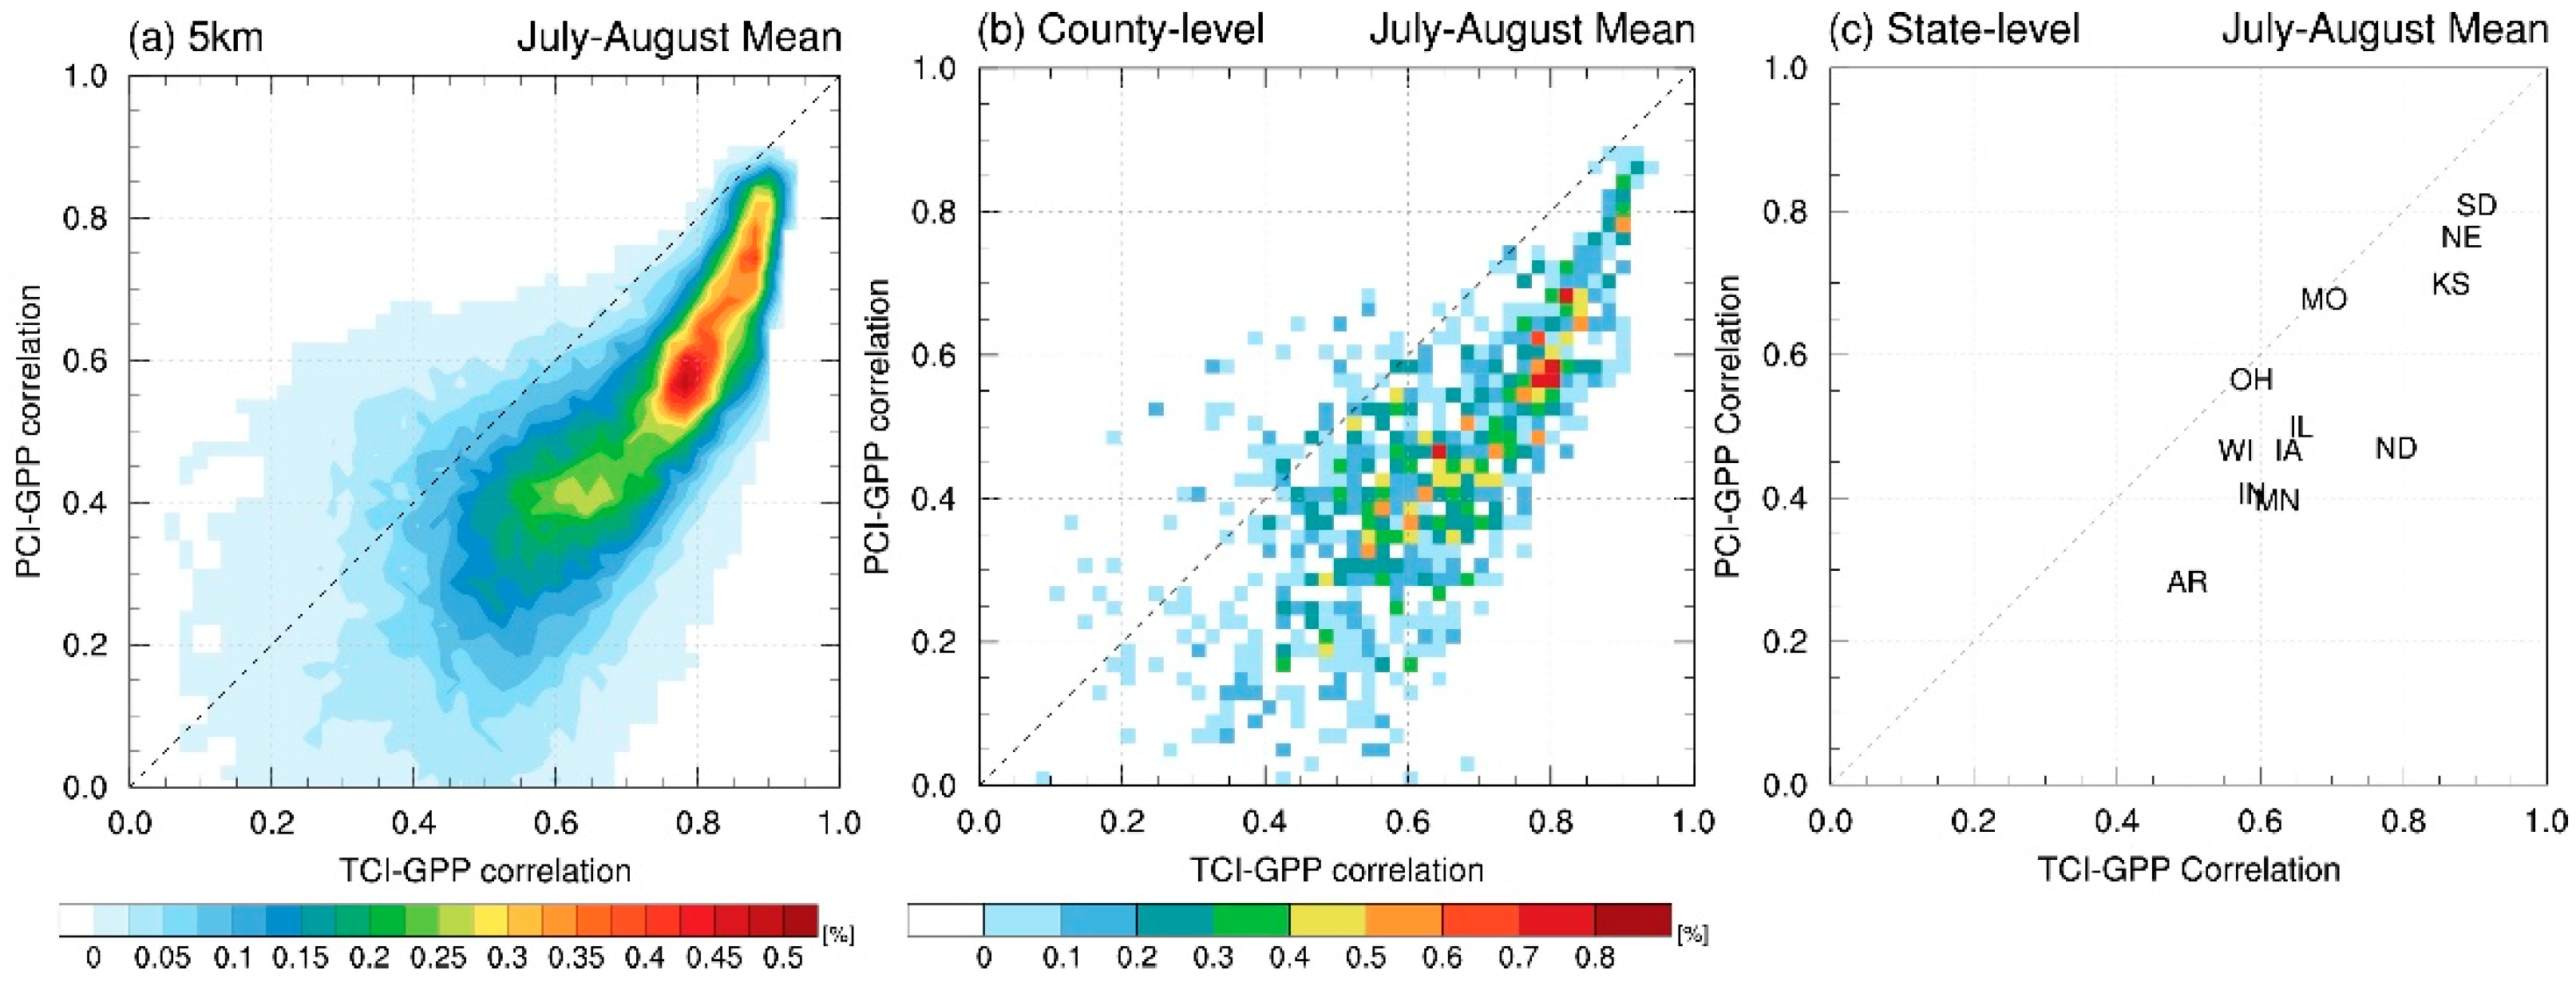
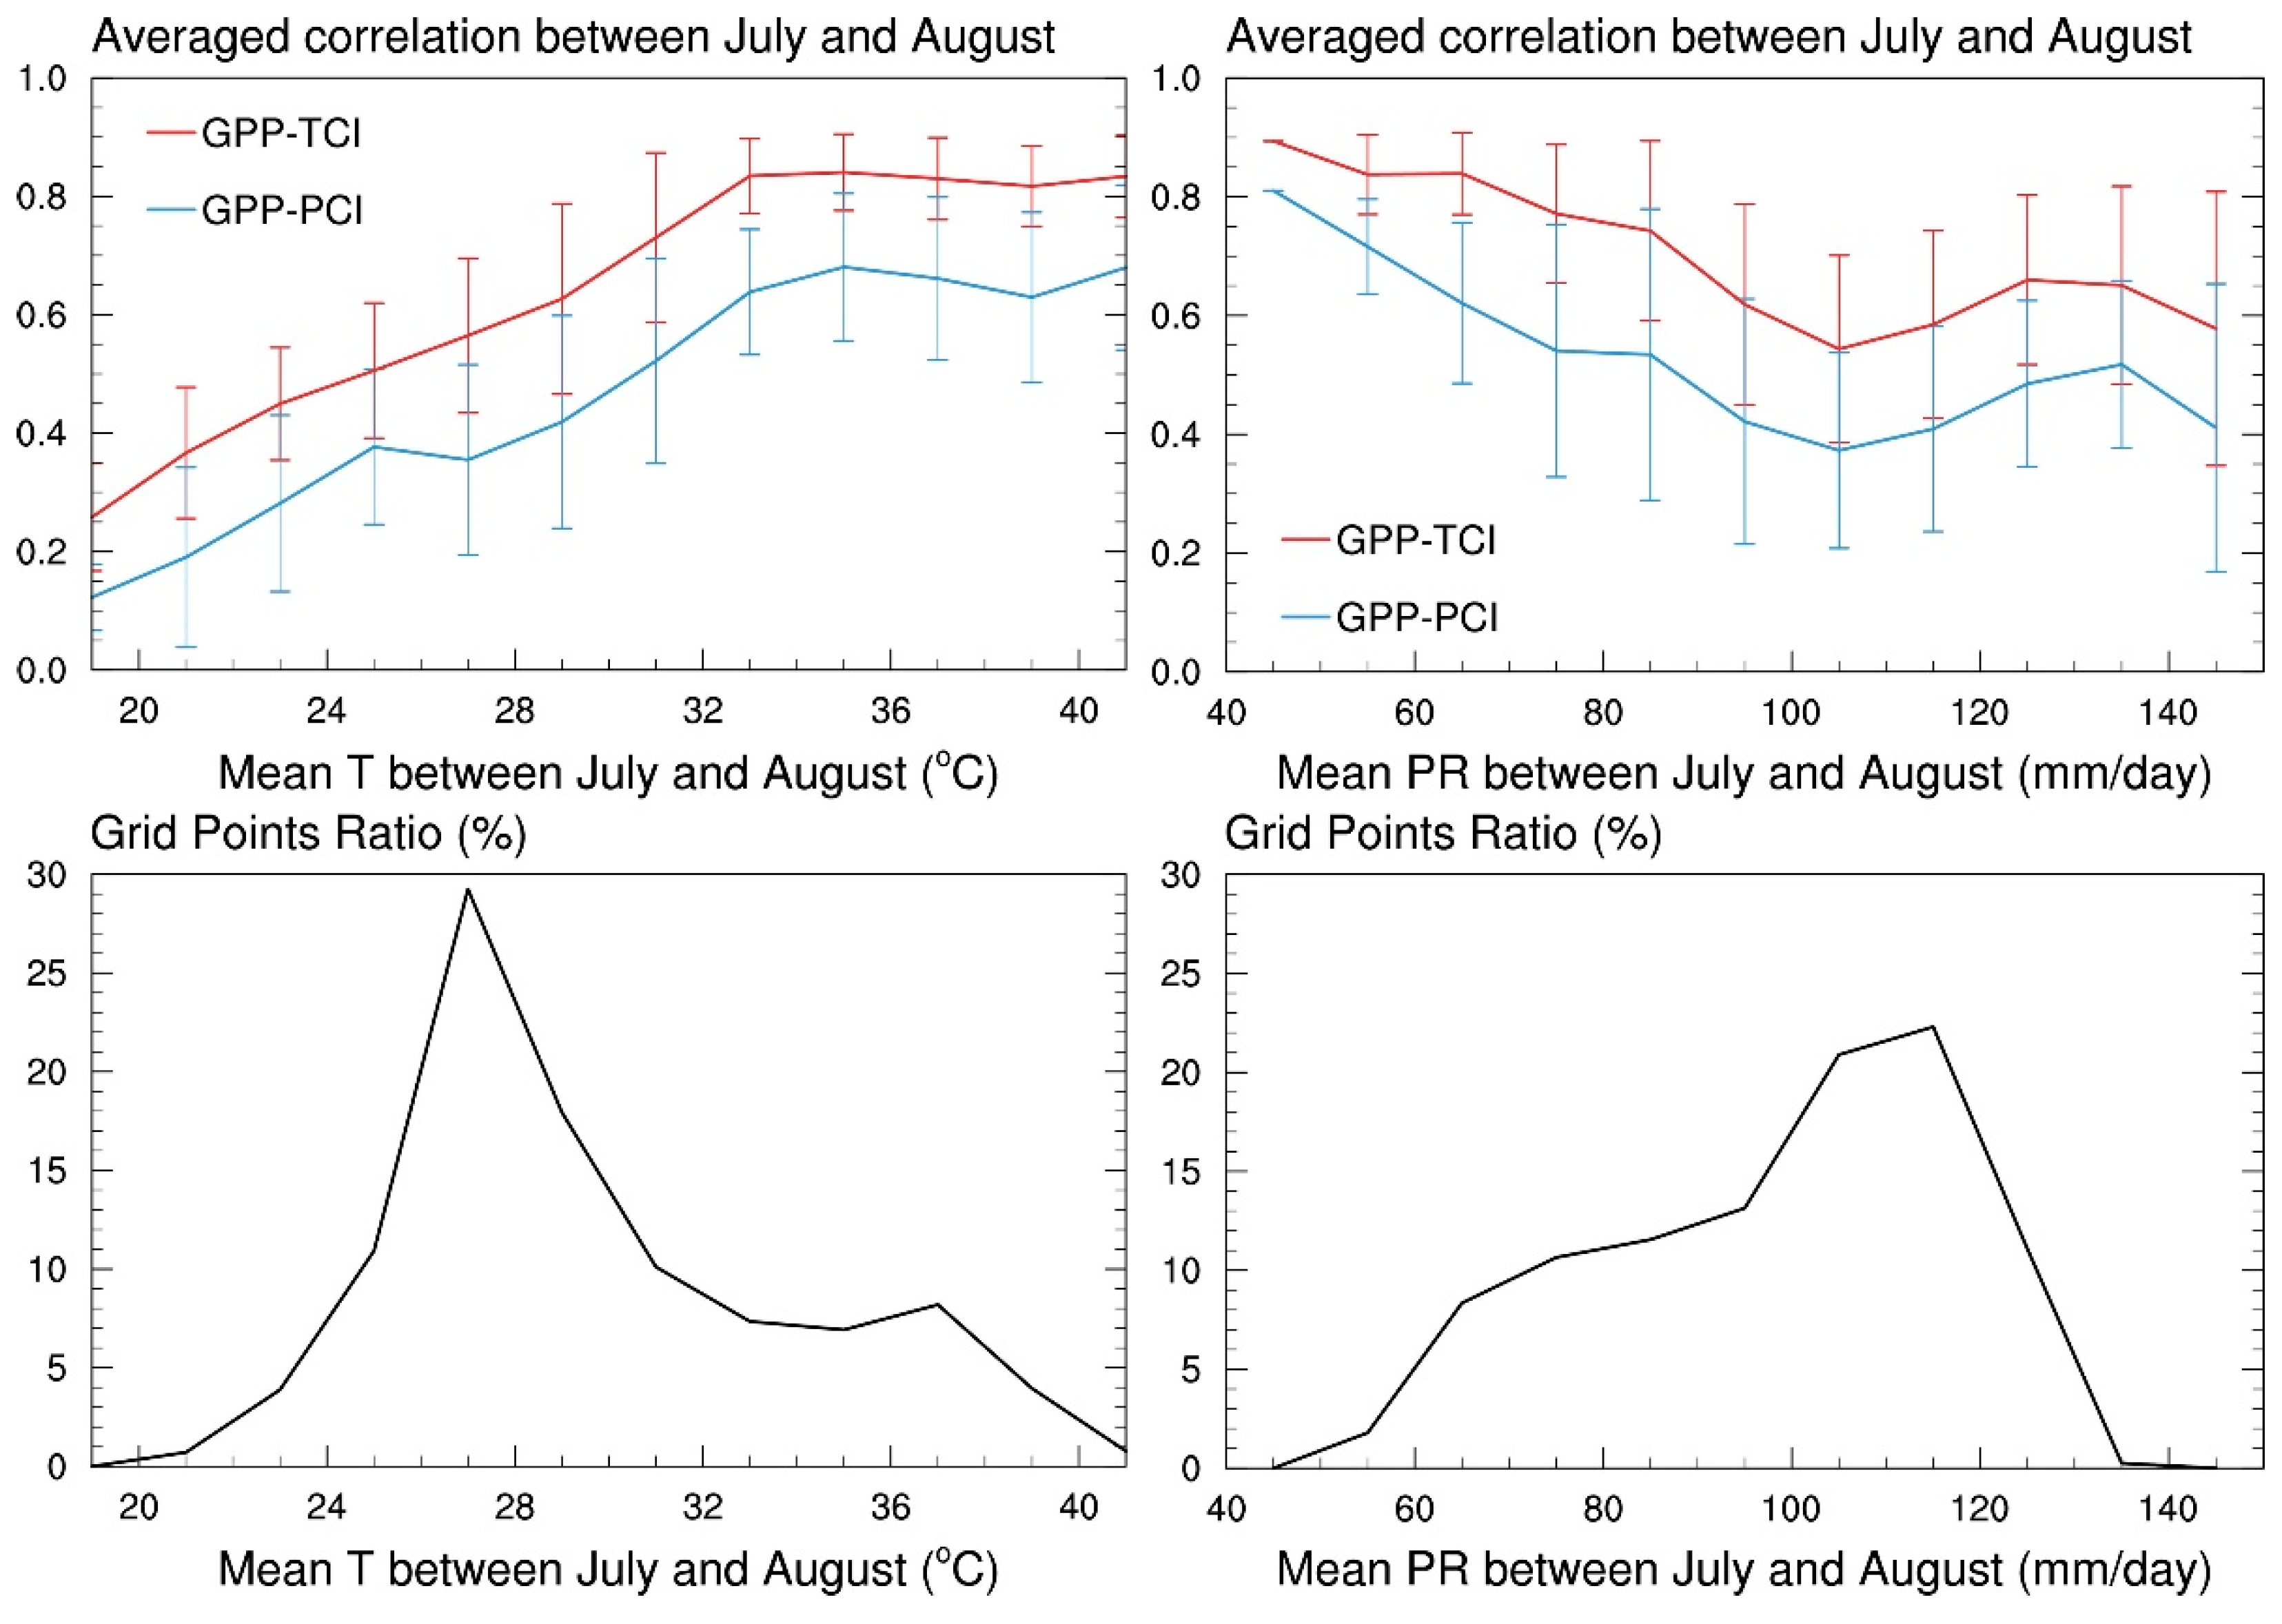
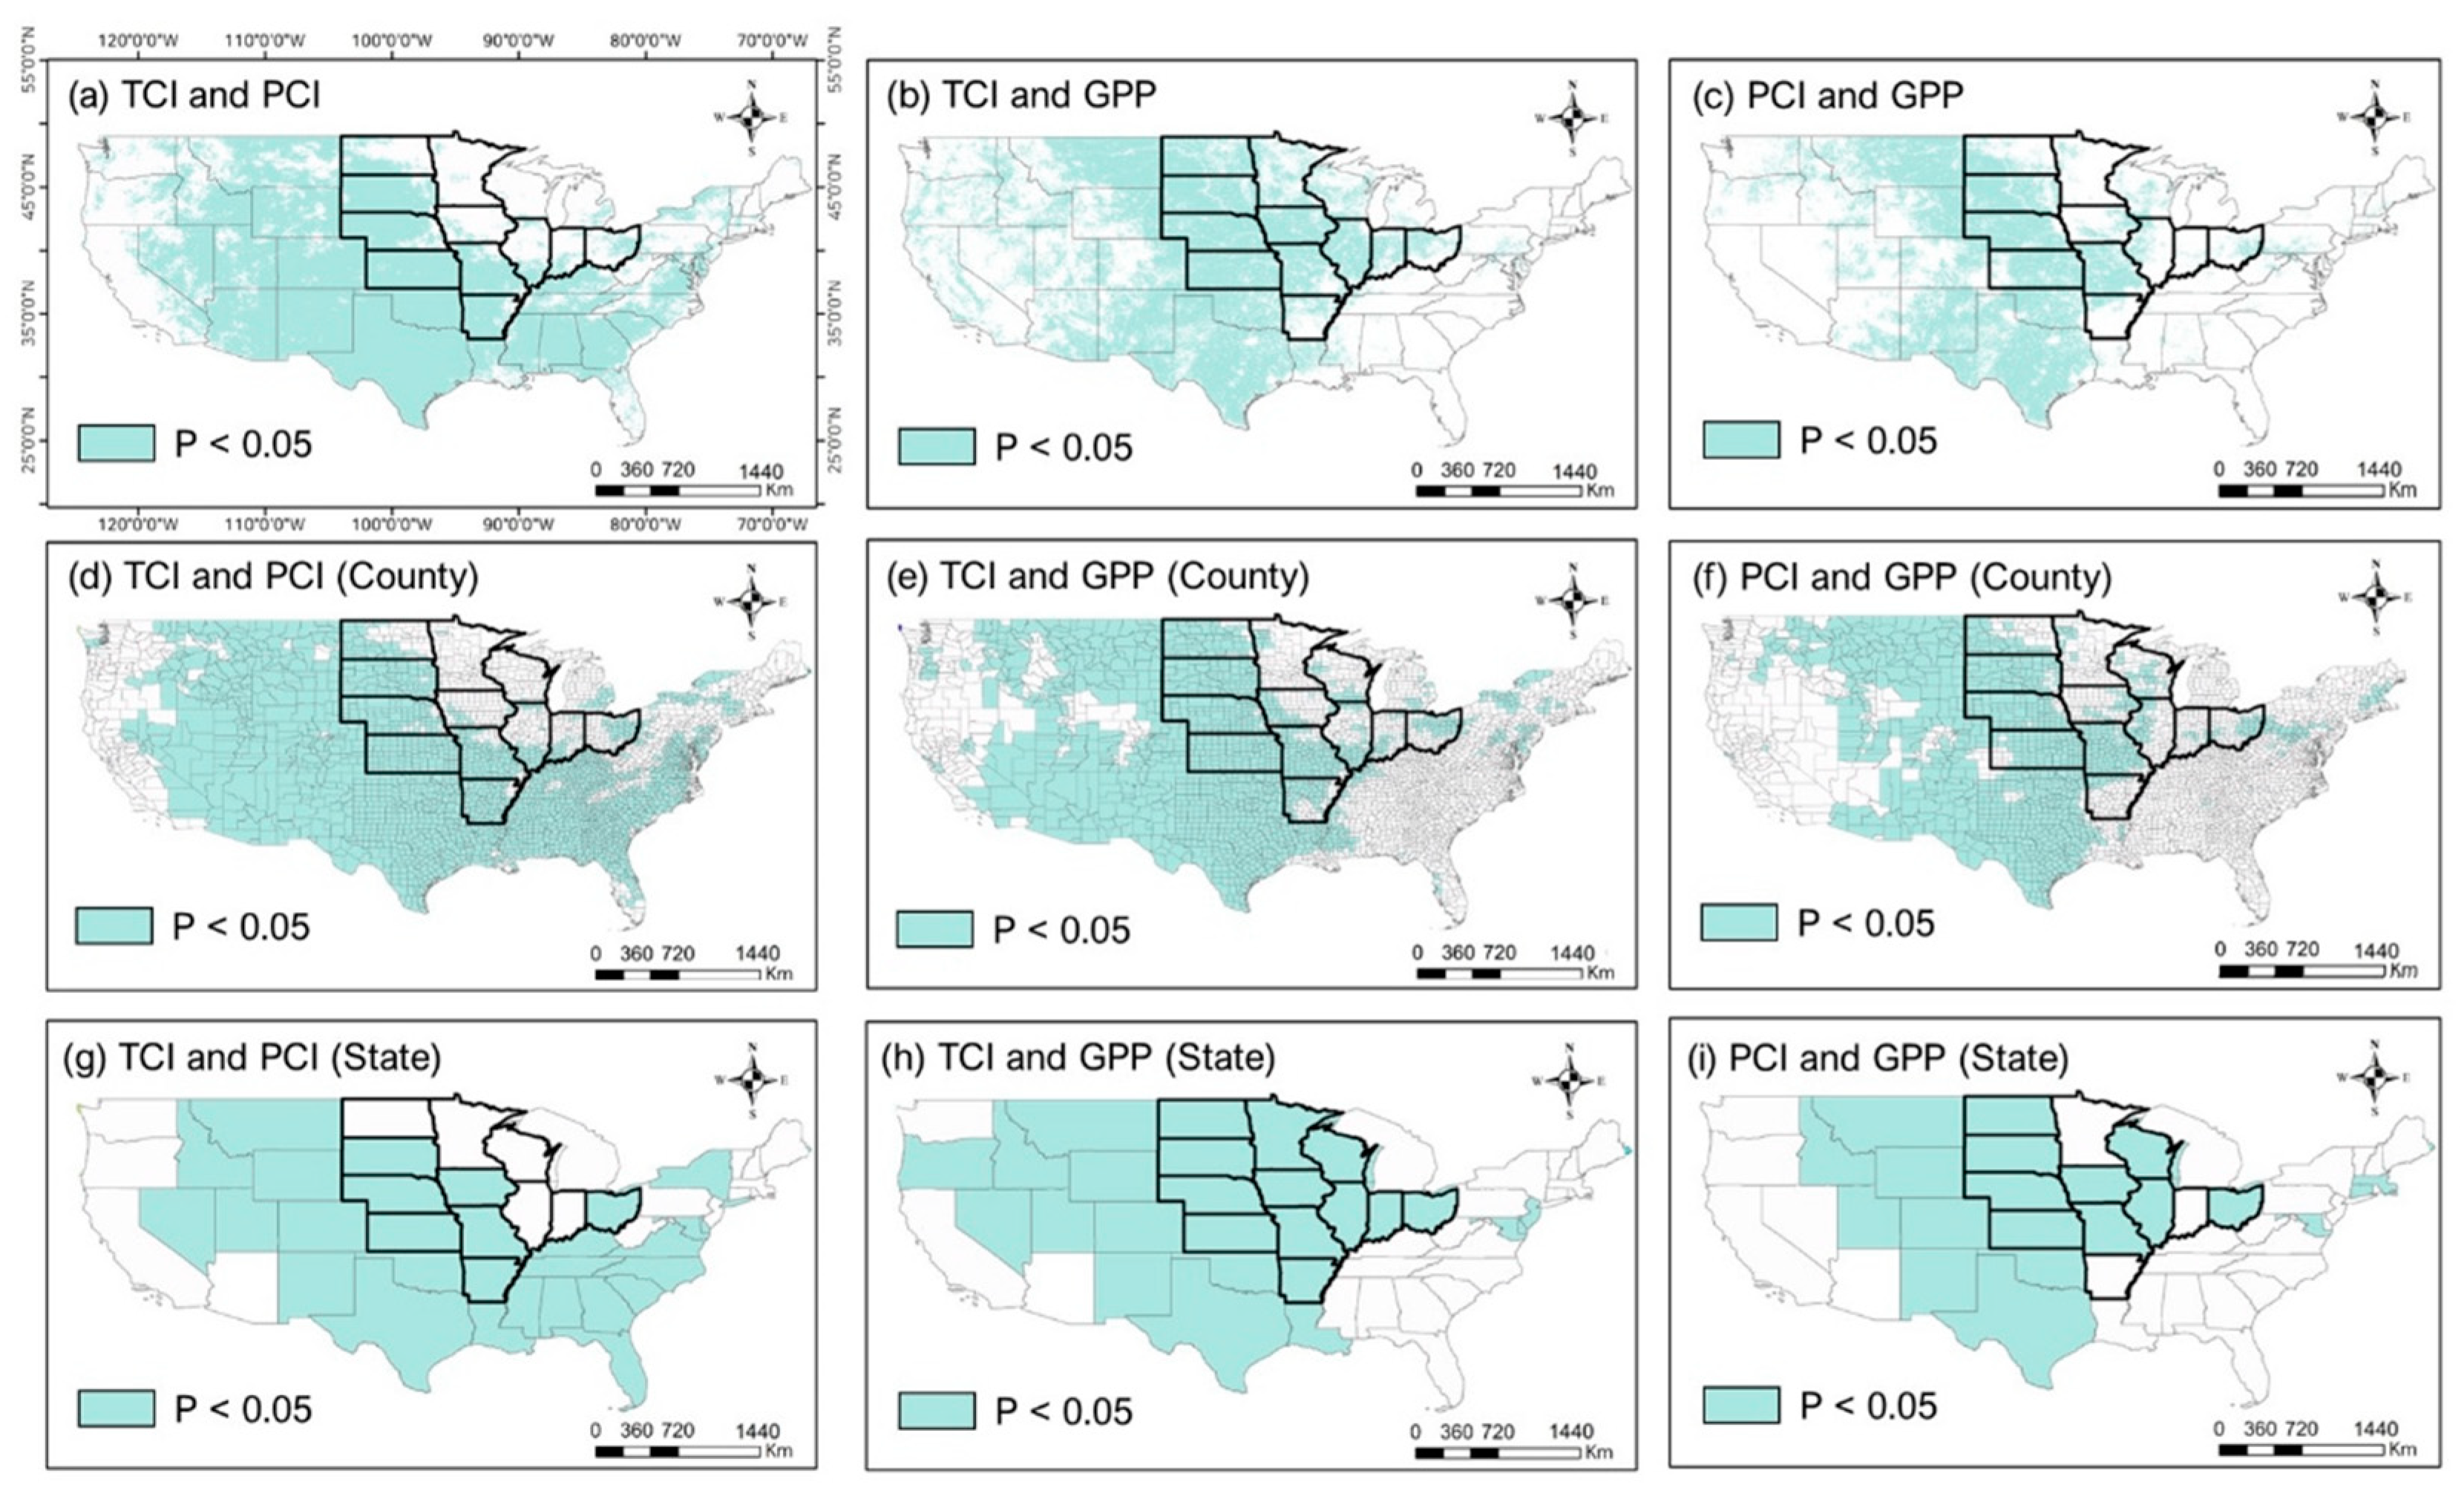
3.1. The Influence of Meteorological Conditions on GPP

Figure 2 compares year-to-year relationships across TCI, PCI, and GPP at the various spatial scales in the CONUS during summer. In the central and southeast US, TCI, and PCI are highly correlated (p < 0.05; see Appendix A Figure A1), indicating that a warm summer tends to be accompanied by a dryer condition, while their relationship is less clear on the northeast and west coasts (Figure 2a). In these regions, an anomalously warm summer is occasionally accompanied by moist atmospheric advection resulting in the weaker relationship between TCI and PCI. In seeking GPP sensitivity to the meteorological conditions, GPP shows a higher correlation (p < 0.05) with TCI and PCI in the central US (Figure 2b,c and Appendix A Figure A1b,c), where a strong relationship between TCI and PCI exists (Figure 2a). The regions of larger GPP sensitivity are stretched from south to north, particularly across the Great Plains. Contrarily, GPP in the southeastern US is less sensitive to TCI and PCI in spite of the higher correlation between them. It is presumably because a semi-arid climate in the Great Plains and a wet climate in the southeast have a different plant type, resulting in different sensitivity, which will be discussed below. In the southwest, the relationship between PCI and GPP is much weaker than in the other states, presumably due to widespread irrigation (Figure 1e and Figure 2i). The GPP sensitivity to TCI in the Great Plains is remarkably stronger than that of PCI, implying that crop productivity can be linearly related more to the temperature than precipitation. The above-mentioned features shown in the 0.05° grid resolution are consistent with those at the county and state levels (Figure 2d–j). To aid an advantage of high-resolution data, we compare a few states in the Great Plains in the form of different spatial resolutions. The regional meteorological impact can be assessed effectively using high-resolution satellite images (Figure 3). In North Dakota (ND), for example, the correlation between TCI, PCI, and GPP varies significantly within the finer scales at the 0.05° and county levels but it is difficult to identify at the state level. Furthermore, in the western part of South Dakota (SD), a region with the Black Hills National Forest (BHNF) showed a low correlation between TCI, PCI, and GPP locally. The distinct characteristics of these forestry regions become more apparent as the scale is increased from state level to 0.05° resolution.
To further examine the relationship between GPP and each meteorological condition (i.e., TCI and PCI), their correlation coefficients are compared at the various spatial scales in the 12 states representing major maize and soybean production (Figure 4). The majority of regional GPP values in 0.05° grid points exhibits a stronger relationship with TCI than PCI (i.e., the probability below the diagonal line in Figure 4a). This result indicates that GPP variation in summer is more sensitive to variation of temperature than that of precipitation, which is consistent with that shown in Figure 2. The correlation between GPP and TCI in most grid points exceeds 0.5. A stronger GPP-TCI relationship than the GPP-PCI relationship is also discerned in the county-level and state-level data (Figure 4b,c). However, their distribution of population density is statistically less evident than that in the 0.05° data due to the sparse number of the samples.
The GPP-TCI and GPP-PCI relationships in the 0.05° data and the county-level data spread out widely, indicating a prominent regional dependency (Figure 4a,b). The state-level data reveal that GPP in which state is the most sensitive to the meteorological condition (Figure 4c). For example, GPP values in the Great Plains (KS, NE, and SD) exhibit a stronger relationship with meteorological conditions than that in the Midwest. This regional dependency, consistent with the results shown in Figure 2, can be associated with the background summer climate in each region. The background climate in the Great Plains is arid, while the Midwest has a relatively cool and wet climate (Figure 1a,b). To investigate the influence of background climate on regional dependency of the relationship between GPP and meteorological variable, the correlation values at the 0.05° data in the 12 states are sorted by long-term mean temperature and precipitation during summer (Figure 5).
Figure 5 shows the relationship between GPP and the meteorological variables as a function of the regional background climate. The long-term mean climate determines GPP sensitivity to TCI and PCI each year. The relationship between GPP and the meteorological condition tends to be strong in a higher (lower) long-term mean temperature (precipitation). GPP in a region is more sensitive to changes in meteorological conditions if a regional background climate is warm and dry in summer. The more sensitive GPP response to TCI and PCI in these regions is likely due to the non-linear relationship between GPP and temperature, particularly evident in the semi-arid area [34]. Since GPP tends to decrease exponentially with increasing temperature above a certain threshold, a larger decrease in GPP with an anomalous warming is expected in the regions of higher background temperature [34]. This prominent role of background temperature might be one of the reasons for the aspect that GPP is more sensitive to TCI than PCI. Note that this non-linear relationship with increasing temperature also appears in comparison with the crop yield [16]. The results in this section strongly suggest that the temperature and precipitation sensitivity of GPP is much more prominent in the Great Plains due to the warm and dry background conditions. If the variation of GPP is consistent with crop yield, the regionally dependent sensitivity to meteorological conditions would be valid in the annual crop yield.

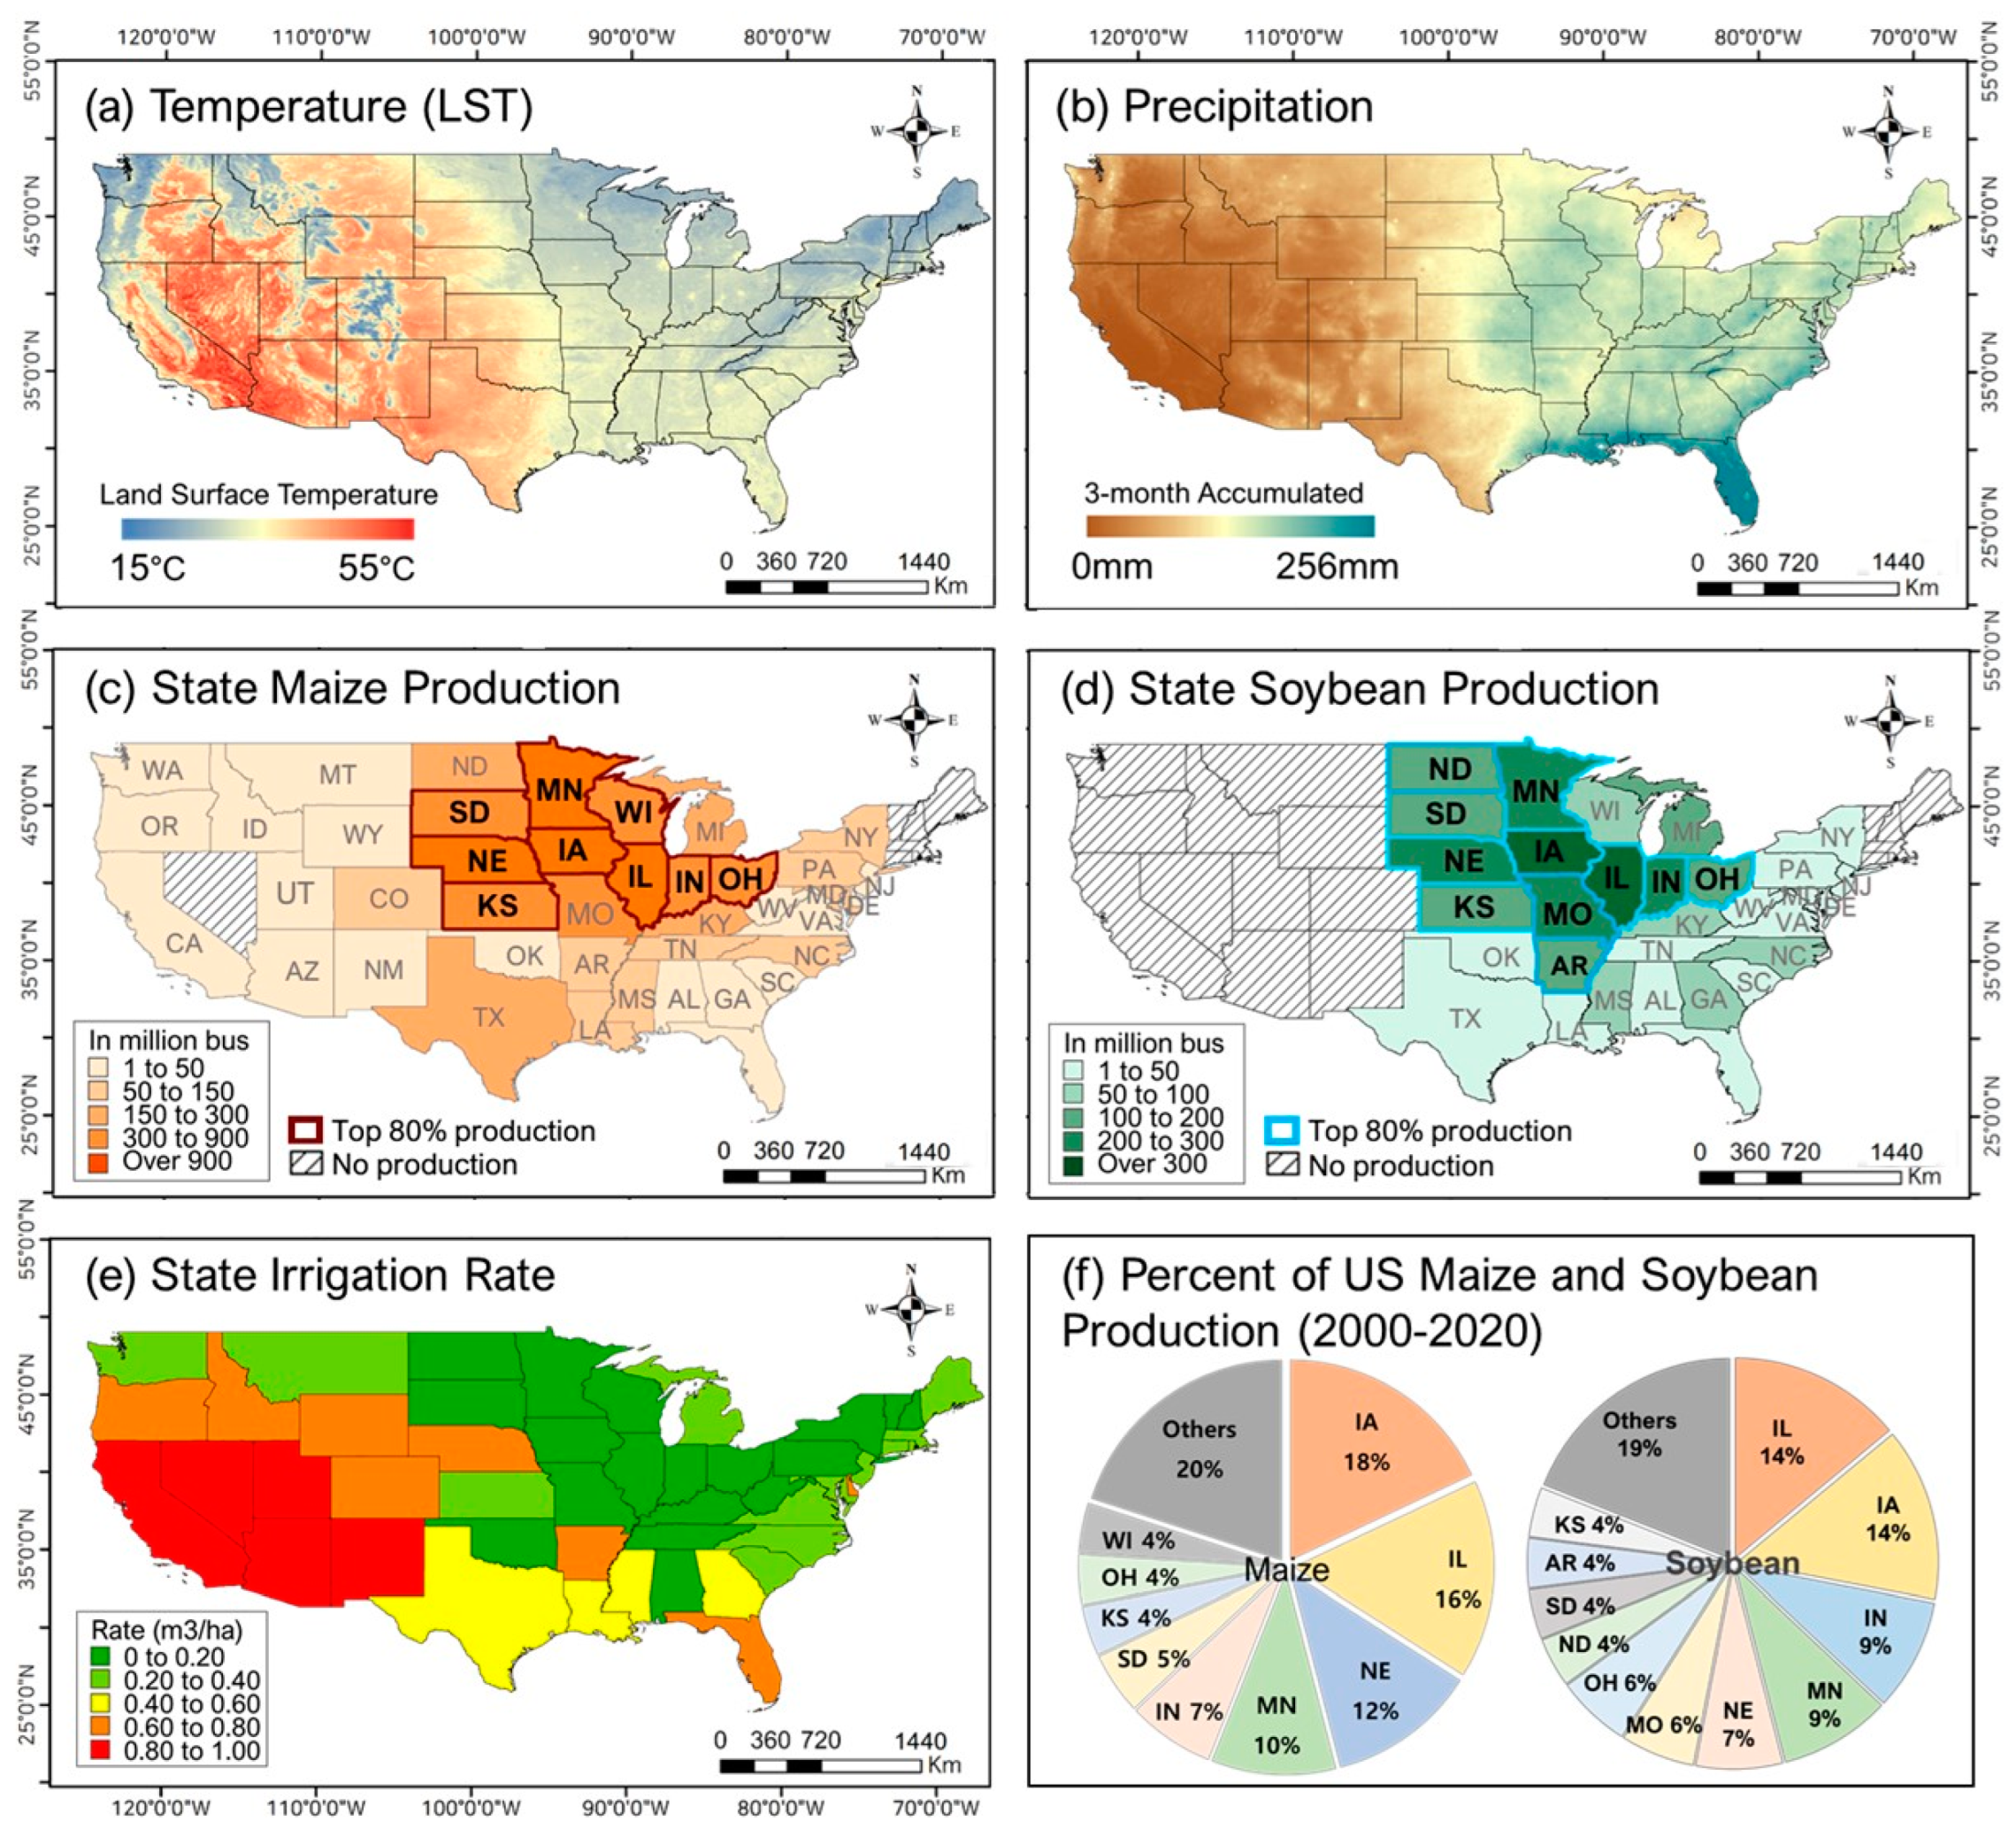
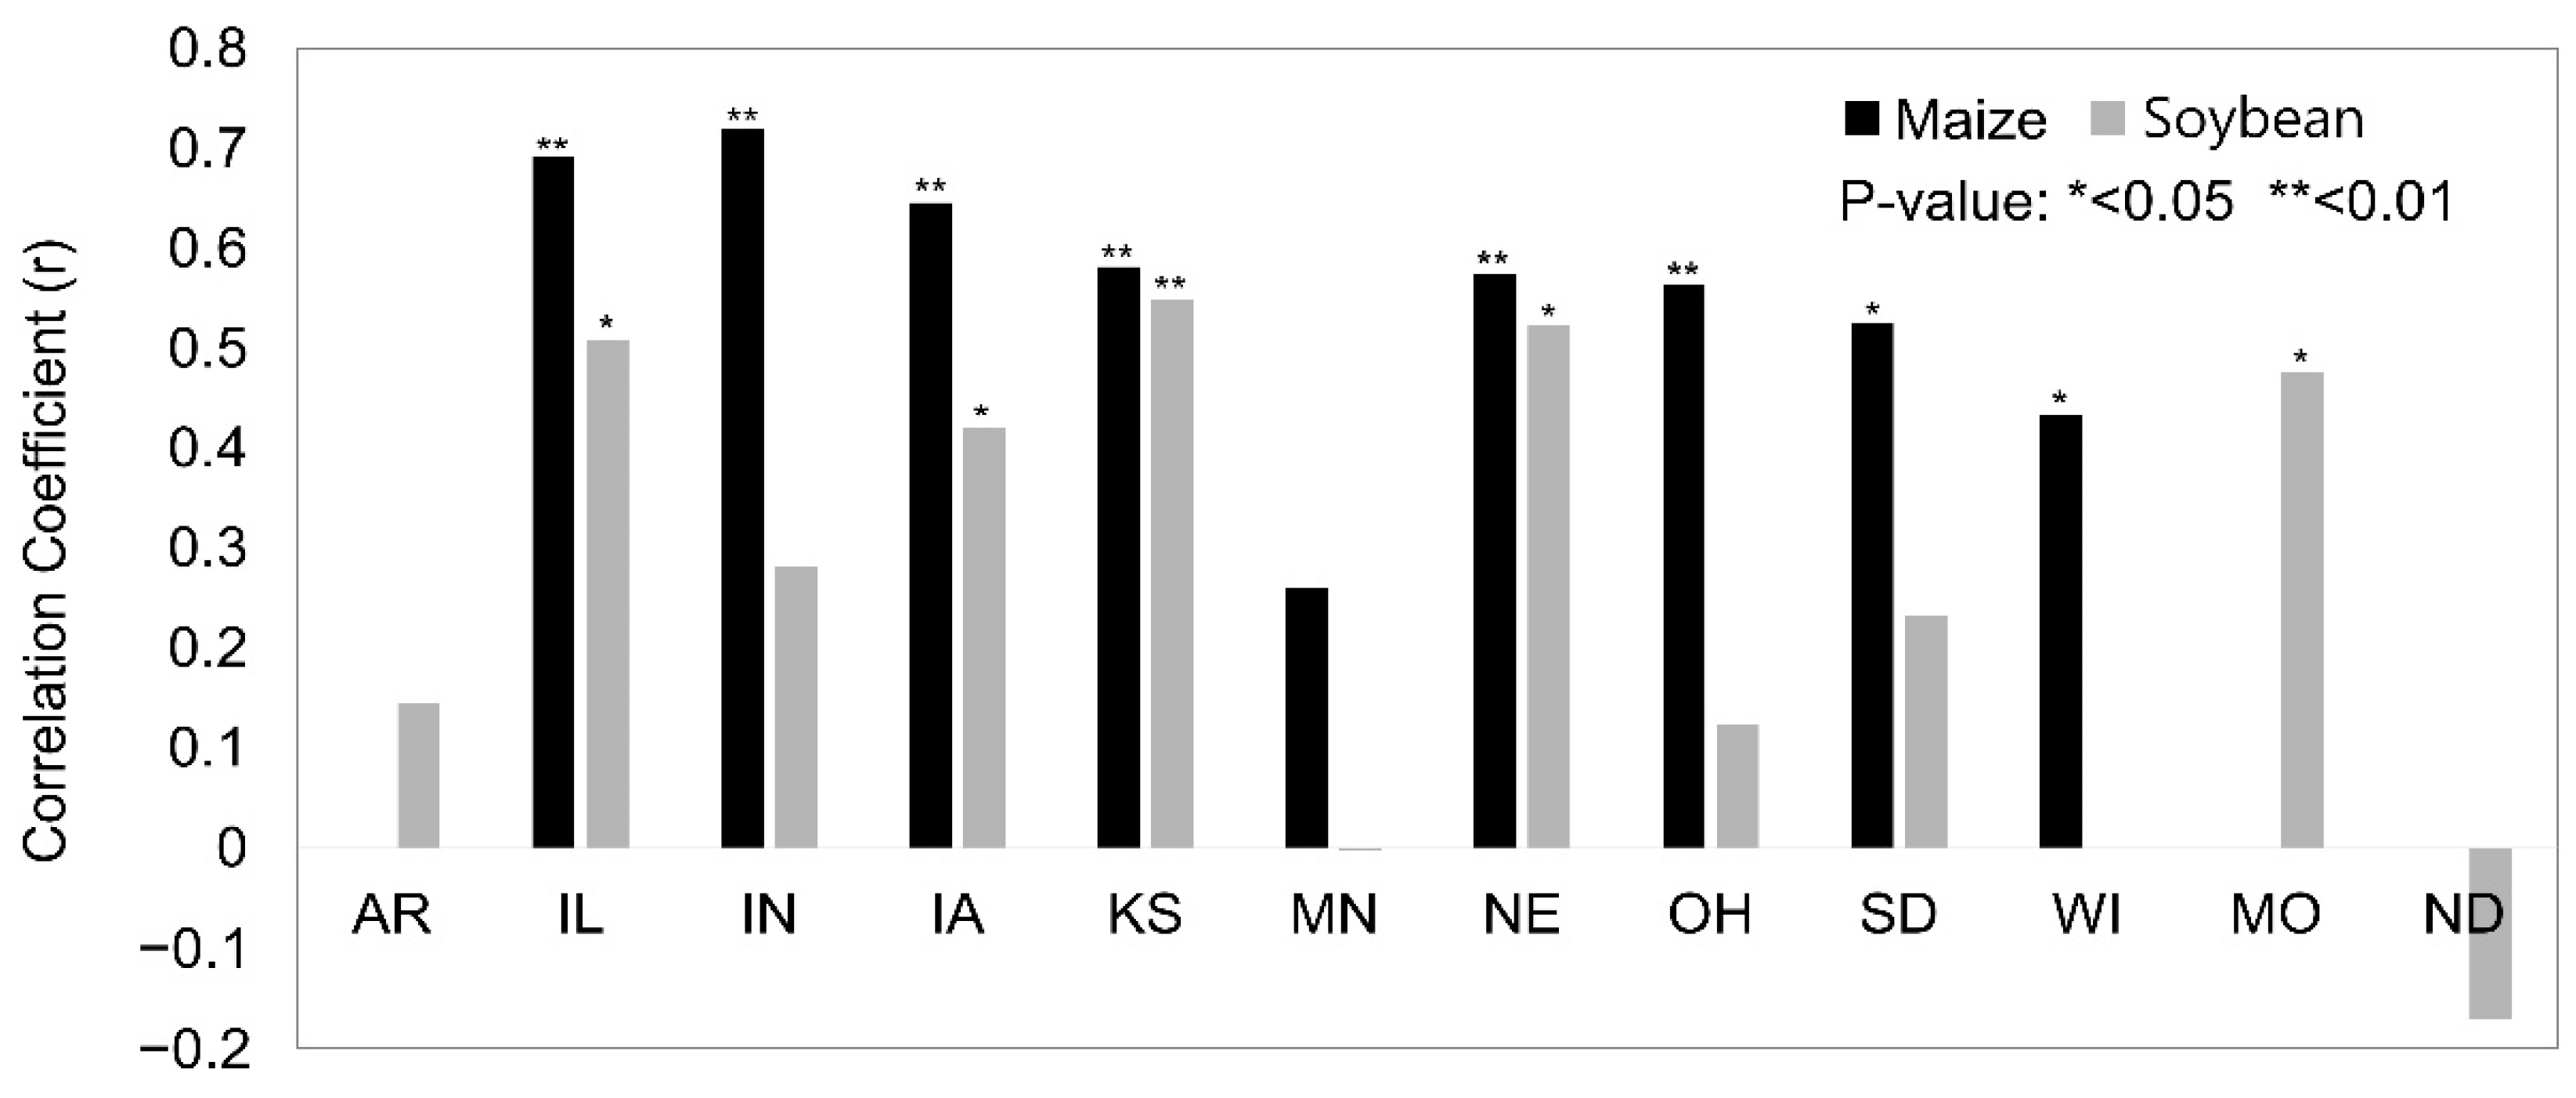
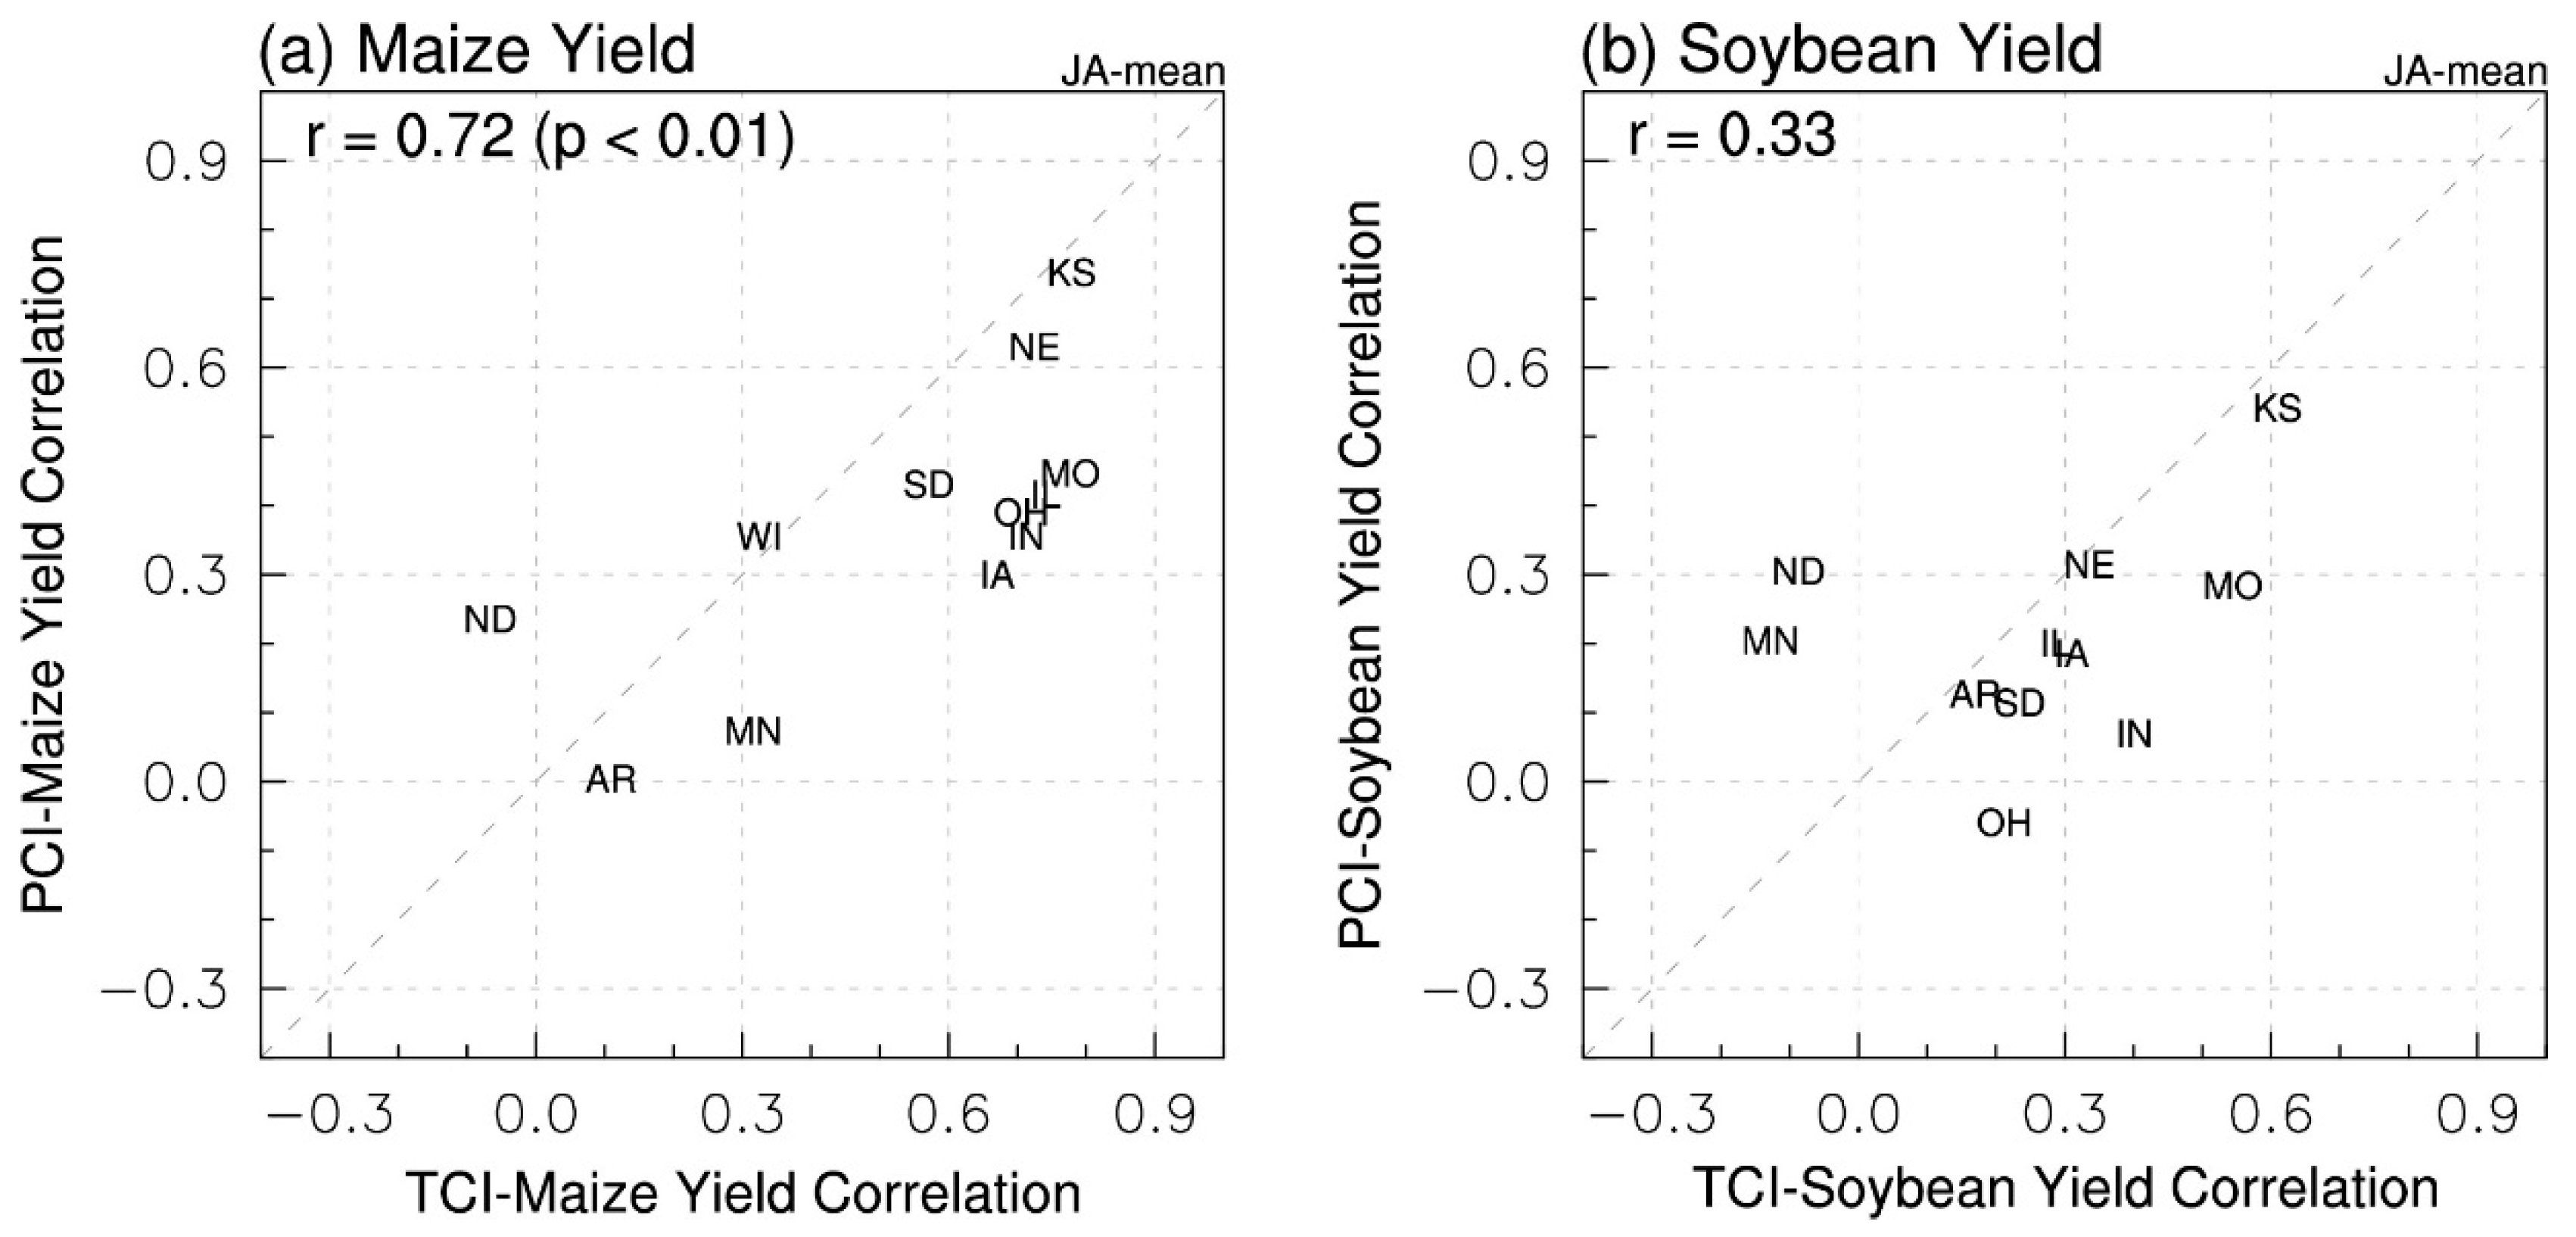
3.2. Maize and Soybean Yield

It is examined whether the regional dependency in the relationship between GPP and meteorological conditions also appears with the maize and soybean yields. First, the relationship between the average July–August GPP and annual crop yield is identified in Figure 6. The majority of states exhibit high correlations between summer GPP and maize and soybean yields, except for some states such as AR, ND, and MN. Despite the high correlation between summer GPP and maize yield, soybean yield exhibits a relatively low correlation with summer GPP (Figure 6). GPP is the photosynthetic accumulation of carbon by plants from the atmosphere, and plants having high radiation use efficiency (RUE) are efficient at carbon uptake for a given condition [35,36]. Maize and soybean have different photosynthesis pathways. Generally, the four-carbon compound (C4) plant (maize) has a much higher RUE value than the three-carbon compound (C3) plant (soybean), so it is considered that maize yield has a higher correlation with GPP than soybean yield [37].
The correlations of state-level crop yields and the summer meteorological conditions are compared to investigate whether the regional sensitivity of the crop yield to TCI and PCI exists as it does in GPP (Figure 7). TCI has a higher relationship with crop yields than PCI, consistent with the results in GPP. As previously stated, it is considered that maize and soybean yields are more sensitive to variations in temperature than precipitation. As discussed by Park et al. [18], maize is resistant to a shortage of precipitation, and soybeans, which have an optimal daytime temperature of 29 °C, can suffer from pollen sterility and reduced seed sets during periods of heat stress [6,17]. Crop yields in KS (maize and soybean) and NE (maize) had high associations with both TCI and PCI, which is consistent with the strong GPP-TCI and GPP-PCI link in the Great Plains (refer to Figure 2) where the background climate is warm and dry (refer to Figure 1). Although maize and soybean yields have larger correlations with TCI than PCI, the correlations with PCI tend to be larger in some states located at high latitudes, such as MN (soybean) and ND (maize and soybean). It is considered that heat stress within an extreme range is not critical in high-latitude regions [38]. Generally, maize yield shows high correlations with the meteorological conditions than soybean yield. The lower correlations of soybean yield are likely due to soybean aphids, which only influence soybean yield and have no effect the other plant species [39].

4. Conclusions

The influence of summer meteorological conditions on GPP was identified using satellite-based temperature, precipitation indices, and GPP data at various scales (i.e., pixel, county, and state levels). The distinct characteristics of the regional climate impact were precisely assessed as the scale increased from state level to 0.05° resolution. In investigating the relationship across the variables over the twelve major crop-producing states in CONUS, the temperature and precipitation indices exhibit a strong linear relationship (r > 0.7) around the central United States. Consistently, the variation of GPP also exhibits a higher relationship with the summer TCI and PCI in the central United States, while GPP shows a relatively higher linear relationship with TCI (r~0.9) than PCI (r~0.75). Remarkably, their relationship was more robust in the Great Plains, which represent a semi-arid background climate. In seeking the factor affecting the regionality of GPP sensitivity to meteorological conditions, it was the long-term mean climate that determines GPP sensitivity to meteorological conditions primarily due to the non-linear relationship between them.
The regional impact of the variation of meteorological conditions on the maize and soybean yields was investigated, as was whether the regional dependency in the relationship between meteorological conditions and GPP also exists in maize and soybean yields. The correlations between GPP and maize and soybean yields are high in the majority of states, showing that the impact of meteorological conditions on GPP is similar to that on maize and soybean yields. Maize yield appeared to have a stronger association with GPP than soybean production because maize has a significantly higher RUE value than soybeans. Maize and soybean yields tend to be more sensitive to temperature variations than to precipitation variations. Consistent with the relationship between GPP and meteorological conditions, maize and soybean yields had a stronger correlation with TCI and PCI in the Great Plains. This indicates that a more vulnerable crop growth in a hot extreme is expected in the Great Plains with a more sensitive GPP response [16]. This study still has some limitations. This study used statistical methods at the statistical–descriptive level, and the analysis focused on calendar timing rather than crop timing. Future studies will implement crop models to describe the mechanisms in-depth and consider the phenology, the lengths of the soybean and maize crop cycles, and other factors. The regional dependence would provide useful insights into the more intense, frequent, and long-lasting heat extremes expected in the future climate [40]. In conclusion, this study suggests that more research into the climate–crop yield relationship at the local scale is required. Greater knowledge of the relative roles of regional temperature and precipitation on crop development would help a variety of agricultural applications.

Author Contributions

Conceptualization, C.Y., D.K. and S.P.; formal analysis, C.Y., D.K. and S.P.; investigation, C.Y., D.K. and S.P.; methodology, C.Y., D.K. and S.P.; supervision, S.P.; writing—original draft, C.Y., D.K. and S.P.; writing—review and editing, S.P.; funding acquisition, S.P. All authors have read and agreed to the published version of the manuscript.

Funding

This work was supported by Seoul National University of Science and Technology.

Data Availability Statement

Not applicable.

Conflicts of Interest

The authors declare no conflict of interest.

Appendix A

Figure A1. Significance maps (p-value under 0.05) for the correlation of annual variation between TCI and PCI, TCI and GPP, and PCI and GPP for pixel-level (ac), county-level (df), and state-level (gi) data for the average of July and August.
Remotesensing 14 03508 g0a1

References

  1. Basche, A.D.; Archontoulis, S.V.; Kaspar, T.C.; Jaynes, D.B.; Parkin, T.B.; Miguez, F.E. Simulating long-term impacts of cover crops and climate change on crop production and environmental outcomes in the Midwestern United States. Agric. Ecosyst. Environ. 2016, 218, 95–106. [Google Scholar] [CrossRef] [Green Version]
  2. Pingali, P.L. Green revolution: Impacts, limits, and the path ahead. Proc. Natl. Acad. Sci. USA 2012, 109, 12302–12308. [Google Scholar] [CrossRef] [PubMed] [Green Version]
  3. Handler, P. Corn yields in the United States and sea surface temperature anomalies in the equatorial Pacific Ocean during the period 1868–1982. Agric. For. Meteorol. 1984, 31, 25–32. [Google Scholar] [CrossRef]
  4. Lobell, D.B.; Hammer, G.L.; McLean, G.; Messina, C.; Roberts, M.J.; Schlenker, W. The critical role of extreme heat for maize production in the United States. Nat. Clim. Chang. 2013, 3, 497–501. [Google Scholar] [CrossRef]
  5. Wolfe, D.W.; DeGaetano, A.T.; Peck, G.M.; Carey, M.; Ziska, L.H.; Lea-Cox, J.; Kemanian, A.R.; Hoffmann, M.P.; Hollinger, D.Y. Unique challenges and opportunities for northeastern US crop production in a changing climate. Clim. Chang. 2018, 146, 231–245. [Google Scholar] [CrossRef] [Green Version]
  6. Eck, M.A.; Murray, A.R.; Ward, A.R.; Konrad, C.E. Influence of growing season temperature and precipitation anomalies on crop yield in the southeastern United States. Agric. For. Meteorol. 2020, 291, 108053. [Google Scholar] [CrossRef]
  7. Ray, D.K.; Gerber, J.S.; MacDonald, G.K.; West, P.C. Climate variation explains a third of global crop yield variability. Nat. Commun. 2015, 6, 5989. [Google Scholar] [CrossRef] [Green Version]
  8. Anderson, W.; Seager, R.; Baethgen, W.; Cane, M. Trans-Pacific ENSO teleconnections pose a correlated risk to agriculture. Agric. For. Meteorol. 2018, 262, 298–309. [Google Scholar] [CrossRef]
  9. Cane, M.A.; Eshel, G.; Buckland, R.W. Forecasting Zimbabwean maize yield using eastern equatorial Pacific sea surface temperature. Nature 1994, 370, 204–205. [Google Scholar] [CrossRef]
  10. Iizumi, T.; Luo, J.-J.; Challinor, A.J.; Sakurai, G.; Yokozawa, M.; Sakuma, H.; Brown, M.E.; Yamagata, T. Impacts of El Niño Southern Oscillation on the global yields of major crops. Nat. Commun. 2014, 5, 3712. [Google Scholar] [CrossRef] [Green Version]
  11. Mauget, S.A.; Upchurch, D.R. El Niño and La Niña related climate and agricultural impacts over the Great Plains and Midwest. J. Prod. Agric. 1999, 12, 203–215. [Google Scholar] [CrossRef]
  12. Phillips, J.; Rajagopalan, B.; Cane, M.; Rosenzweig, C. The role of ENSO in determining climate and maize yield variability in the US cornbelt. Int. J. Climatol. J. R. Meteorol. Soc. 1999, 19, 877–888. [Google Scholar] [CrossRef]
  13. Podesta, G.; Letson, D.; Messina, C.; Royce, F.; Ferreyra, R.A.; Jones, J.; Hansen, J.; Llovet, I.; Grondona, M.N.; O’Brien, J.J. Use of ENSO-related climate information in agricultural decision making in Argentina: A pilot experience. Agric. Syst. 2002, 74, 371–392. [Google Scholar] [CrossRef]
  14. Butler, E.E.; Huybers, P. Variations in the sensitivity of US maize yield to extreme temperatures by region and growth phase. Environ. Res. Lett. 2015, 10, 034009. [Google Scholar] [CrossRef]
  15. Petersen, L.K. America’s Farming Future: The Impact of Climate Change on Crop Yields. In Proceedings of the AMS, Austin, TX, USA, 7–11 January 2018. [Google Scholar]
  16. Schlenker, W.; Roberts, M.J. Nonlinear temperature effects indicate severe damages to US crop yields under climate change. Proc. Natl. Acad. Sci. USA 2009, 106, 15594–15598. [Google Scholar] [CrossRef] [PubMed] [Green Version]
  17. Annan, F.; Schlenker, W. Federal crop insurance and the disincentive to adapt to extreme heat. Am. Econ. Rev. 2015, 105, 262–266. [Google Scholar] [CrossRef] [Green Version]
  18. Park, S.; Im, J.; Jang, E.; Rhee, J. Drought assessment and monitoring through blending of multi-sensor indices using machine learning approaches for different climate regions. Agric. For. Meteorol. 2016, 216, 157–169. [Google Scholar] [CrossRef]
  19. Rhee, J.; Im, J.; Carbone, G.J. Monitoring agricultural drought for arid and humid regions using multi-sensor remote sensing data. Remote Sens. Environ. 2010, 114, 2875–2887. [Google Scholar] [CrossRef]
  20. Zipper, S.C.; Qiu, J.; Kucharik, C.J. Drought effects on US maize and soybean production: Spatiotemporal patterns and historical changes. Environ. Res. Lett. 2016, 11, 094021. [Google Scholar] [CrossRef]
  21. Marshall, M.; Tu, K.; Brown, J. Optimizing a remote sensing production efficiency model for macro-scale GPP and yield estimation in agroecosystems. Remote Sens. Environ. 2018, 217, 258–271. [Google Scholar] [CrossRef]
  22. Hamed, R.; Van Loon, A.F.; Aerts, J.; Coumou, D. Impacts of hot-dry compound extremes on US soybean yields. Earth Syst. Dyn. Discuss. 2021, 2021, 1–26. [Google Scholar] [CrossRef]
  23. Grassini, P.; Torrion, J.A.; Cassman, K.G.; Yang, H.S.; Specht, J.E. Drivers of spatial and temporal variation in soybean yield and irrigation requirements in the western US Corn Belt. Field Crops Res. 2014, 163, 32–46. [Google Scholar] [CrossRef] [Green Version]
  24. Payero, J.O.; Tarkalson, D.D.; Irmak, S.; Davison, D.; Petersen, J.L. Effect of irrigation amounts applied with subsurface drip irrigation on corn evapotranspiration, yield, water use efficiency, and dry matter production in a semiarid climate. Agric. Water Manag. 2008, 95, 895–908. [Google Scholar] [CrossRef] [Green Version]
  25. Phelan, P.; Mason, J.; Stinner, B. Soil-fertility management and host preference by European corn borer, Ostrinia nubilalis (Hübner), on Zea mays L.: A comparison of organic and conventional chemical farming. Agric. Ecosyst. Environ. 1995, 56, 1–8. [Google Scholar] [CrossRef]
  26. Wan, Z.; Dozier, J. A generalized split-window algorithm for retrieving land-surface temperature from space. IEEE Trans. Geosci. Remote Sens. 1996, 34, 892–905. [Google Scholar]
  27. Funk, C.; Peterson, P.; Landsfeld, M.; Pedreros, D.; Verdin, J.; Shukla, S.; Husak, G.; Rowland, J.; Harrison, L.; Hoell, A. The climate hazards infrared precipitation with stations—a new environmental record for monitoring extremes. Sci. Data 2015, 2, 150066. [Google Scholar] [CrossRef] [Green Version]
  28. Beck, H.E.; Pan, M.; Roy, T.; Weedon, G.P.; Pappenberger, F.; Van Dijk, A.I.; Huffman, G.J.; Adler, R.F.; Wood, E.F. Daily evaluation of 26 precipitation datasets using Stage-IV gauge-radar data for the CONUS. Hydrol. Earth Syst. Sci. 2019, 23, 207–224. [Google Scholar] [CrossRef] [Green Version]
  29. Griffiths, J.F. Applied Climatology: An Introduction; Oxford University Press: Oxford, UK, 1966. [Google Scholar]
  30. Cook, K.H.; Vizy, E.K. Hydrodynamics of the Caribbean low-level jet and its relationship to precipitation. J. Clim. 2010, 23, 1477–1494. [Google Scholar] [CrossRef]
  31. Mondal, S.; Mishra, A.K.; Leung, L.R. Spatiotemporal characteristics and propagation of summer extreme precipitation events over United States: A complex network analysis. Geophys. Res. Lett. 2020, 47, e2020GL088185. [Google Scholar] [CrossRef]
  32. Unganai, L.S.; Kogan, F.N. Drought monitoring and corn yield estimation in Southern Africa from AVHRR data. Remote Sens. Environ. 1998, 63, 219–232. [Google Scholar] [CrossRef]
  33. Zhang, A.; Jia, G. Monitoring meteorological drought in semiarid regions using multi-sensor microwave remote sensing data. Remote Sens. Environ. 2013, 134, 12–23. [Google Scholar] [CrossRef]
  34. Bennett, A.C.; Arndt, S.K.; Bennett, L.T.; Knauer, J.; Beringer, J.; Griebel, A.; Hinko-Najera, N.; Liddell, M.J.; Metzen, D.; Pendall, E. Thermal optima of gross primary productivity are closely aligned with mean air temperatures across Australian wooded ecosystems. Glob. Change Biol. 2021, 27, 4727–4744. [Google Scholar] [CrossRef] [PubMed]
  35. Coops, N.C.; Black, T.A.; Jassal, R.P.S.; Trofymow, J.T.; Morgenstern, K. Comparison of MODIS, eddy covariance determined and physiologically modelled gross primary production (GPP) in a Douglas-fir forest stand. Remote Sens. Environ. 2007, 107, 385–401. [Google Scholar] [CrossRef]
  36. Garbulsky, M.F. On the Remote Sensing of the Radiation Use Efficiency and the Gross Primary Productivity of Terrestrial Vegetation; Universitat Autònoma de Barcelona: Barcelona, Spain, 2011. [Google Scholar]
  37. Xin, Q.; Gong, P.; Yu, C.; Yu, L.; Broich, M.; Suyker, A.E.; Myneni, R.B. A production efficiency model-based method for satellite estimates of corn and soybean yields in the Midwestern US. Remote Sens. 2013, 5, 5926–5943. [Google Scholar] [CrossRef] [Green Version]
  38. Li, J.; Tam, C.-Y.; Tai, A.P.; Lau, N.-C. Vegetation-heatwave correlations and contrasting energy exchange responses of different vegetation types to summer heatwaves in the Northern Hemisphere during the 1982–2011 period. Agric. For. Meteorol. 2021, 296, 108208. [Google Scholar] [CrossRef]
  39. Irwin, S.; Good, D. Forming Expectations for the 2016 US Average Corn Yield: What About El Niño? Farmdoc Dly. 2016, 6, 41. [Google Scholar]
  40. Meehl, G.A.; Stocker, T.F.; Collins, W.D.; Friedlingstein, P.; Gaye, A.T.; Gregory, J.M.; Kitoh, A.; Knutti, R.; Murphy, J.M.; Noda, A. Global climate projections: Chapter 10. In Climate Change 2007: The Physical Science Basis; Cambridge University Press: Cambridge, UK, 2007. [Google Scholar]
Figure 1. The spatial distribution of mean LST and precipitation for July–August (a,b), the amount of state maize and soybean production, and the average irrigation rate for the state (ce), and the percentage of US maize and soybean production indicated for each state (f).
Remotesensing 14 03508 g001
Figure 2. Correlations of annual variation between TCI and PCI, TCI and GPP, and PCI and GPP for pixel level (ac), county level (df), and state level (gi) for the average of July and August. Their significance maps for the correlation are represented in Figure A1.
Remotesensing 14 03508 g002
Figure 3. Detailed correlation analysis of annual variation between TCI and PCI, TCI and GPP, and PCI and GPP for pixel-level, county-level, and state-level 0.05° grids for the average of July and August over North Dakota (ND), South Dakota (SD), Nebraska (NE), and Kansas (KS). The dotted circle line represents the region of Black Hills National Forest (BHNF).
Remotesensing 14 03508 g003
Figure 4. Joint histogram of TCI-GPP relationship (x-axis) and PCI-GPP relationship (y-axis) at (a) satellite-, (b) county-, and (c) state-level data for the average of July and August. In (a,b), the x and y axes are separated by a 0.02 interval for each bin.
Remotesensing 14 03508 g004
Figure 5. Correlations of GPP-TCI (red) and GPP-PCI binned by long-term mean summer (left) temperature and (right) precipitation using the 0.05° data in the 12 states of major maize and soybean production. Top rows indicate the average of correlation between July and August, and bottom rows indicate a ratio of the number of grid points in each bin. In the top rows, standard deviation of correlations in each bin is indicated as vertical ranges.
Remotesensing 14 03508 g005
Figure 6. Correlations of state-level maize and soybean yields with GPP for the average of July–August (detrend).
Remotesensing 14 03508 g006
Figure 7. Scatter plot of TCI–crop yield relationship (x-axis) and PCI–crop yield relationship (y-axis) at the state-level data from (a) maize and (b) soybean, respectively, averaged for July and August. In Figure 7b, the correlation for Wisconsin is omitted due to the lack of data.
Remotesensing 14 03508 g007
Table 1. Data used in this study. The spatial resolution is described based on the original product.
TypeProductSpatial ResolutionUnits
Land surface temperature (LST)MODIS/Terra Monthly LST (MOD11C3)0.05°Kelvin
Gross primary production (GPP)MODIS/Terra 8-day GPP (MOD17A2)1 kmkg C/m²
PrecipitationClimate Hazards Group InfraRed Precipitation with Station data (CHIRPS)0.05°mm
Crop yield data for maize and soybeansUS Department of Agriculture National Agricultural Statistics Service Quick StatsVector (State-level)Bushels per Acre
Publisher’s Note: MDPI stays neutral with regard to jurisdictional claims in published maps and institutional affiliations.

