
The 2021 Greece Central Crete ML 5.8 Earthquake: An Example of Coalescent Fault Segments Reconstructed from InSAR and GNSS Data

 , ,
, ,  , , ,
, , ,
Abstract
:
1. Introduction

2. Materials and Methods
- a two-pass SAR phase interferometric analysis to get the surface displacement field;
- determination of punctual 3D coseismic offset through the differential analysis of GNSS data;
- reconstruction of the source model through joint inversion of InSAR and GNSS data.
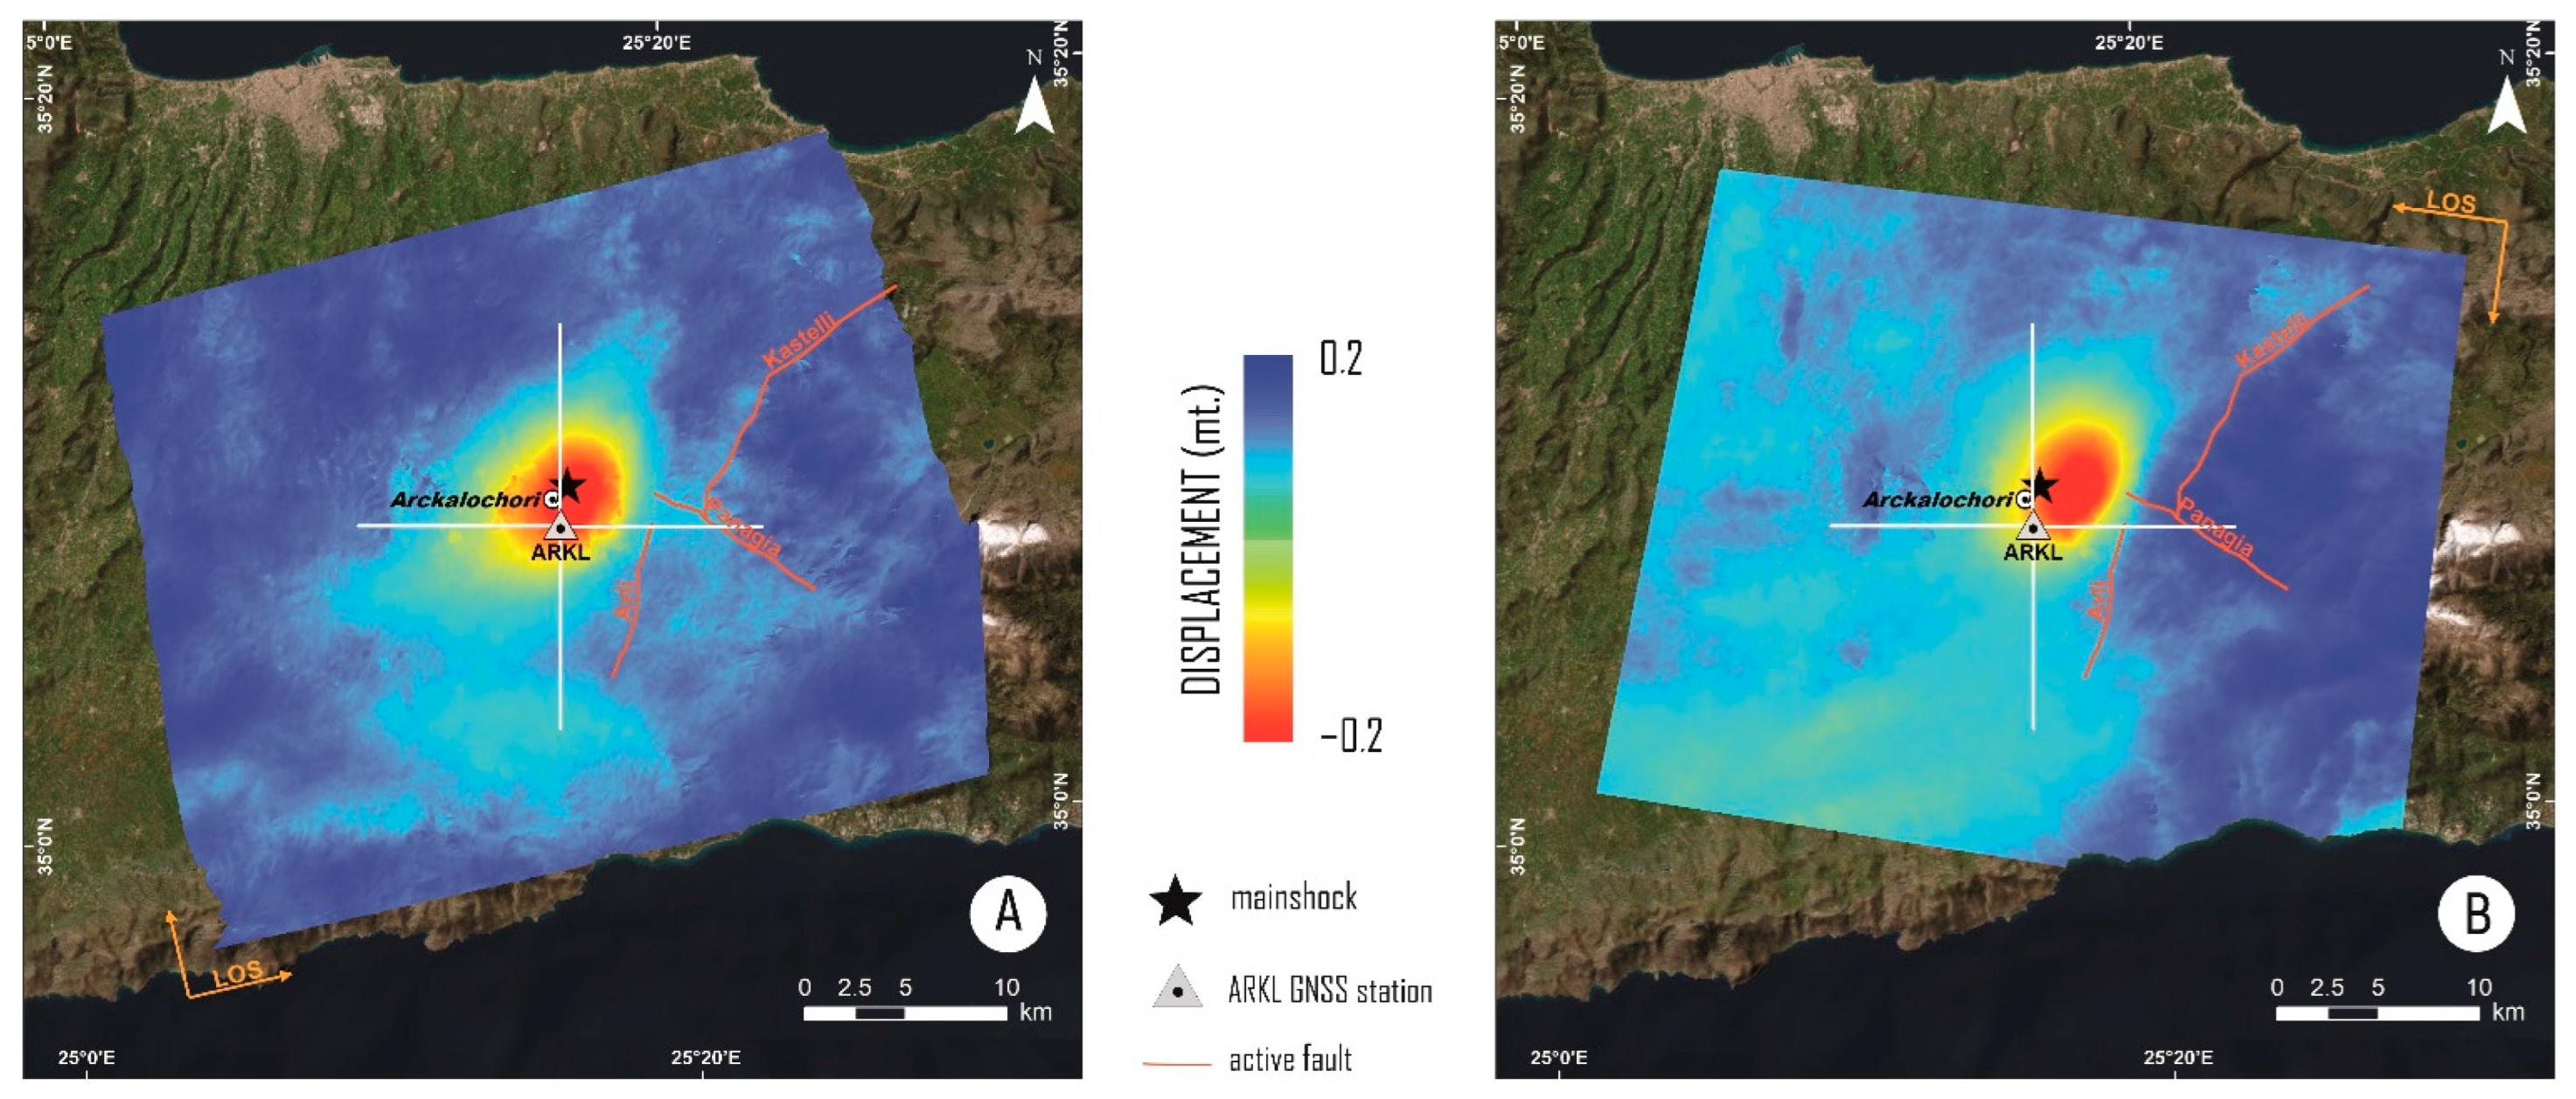
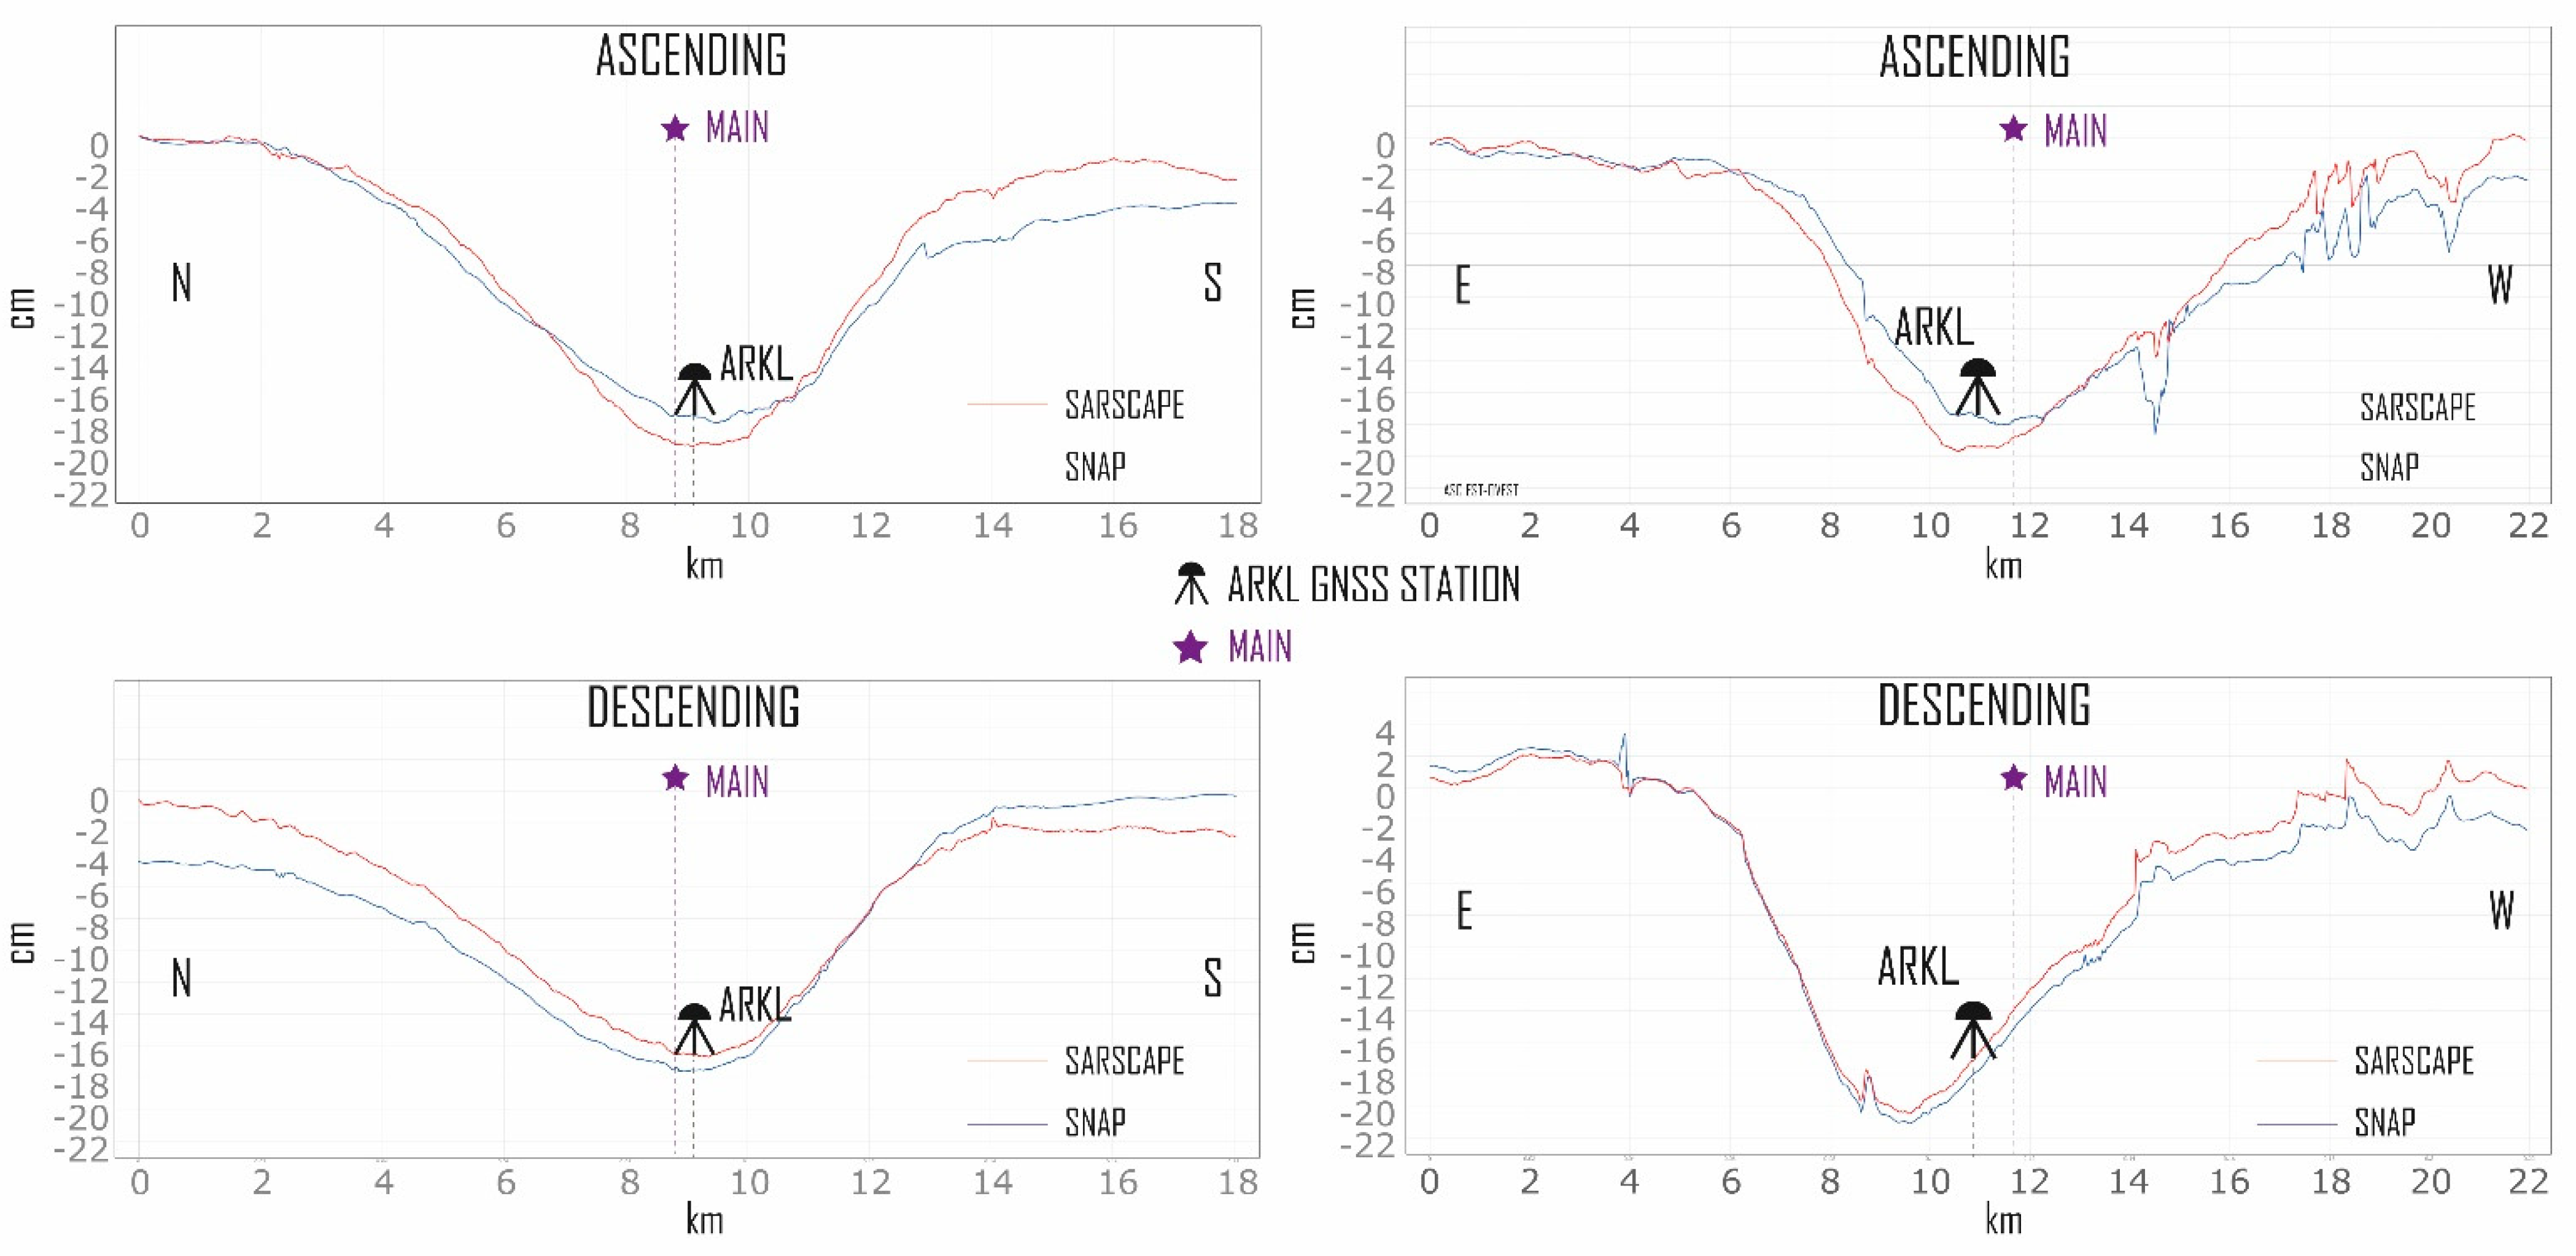
2.1. InSAR Analysis
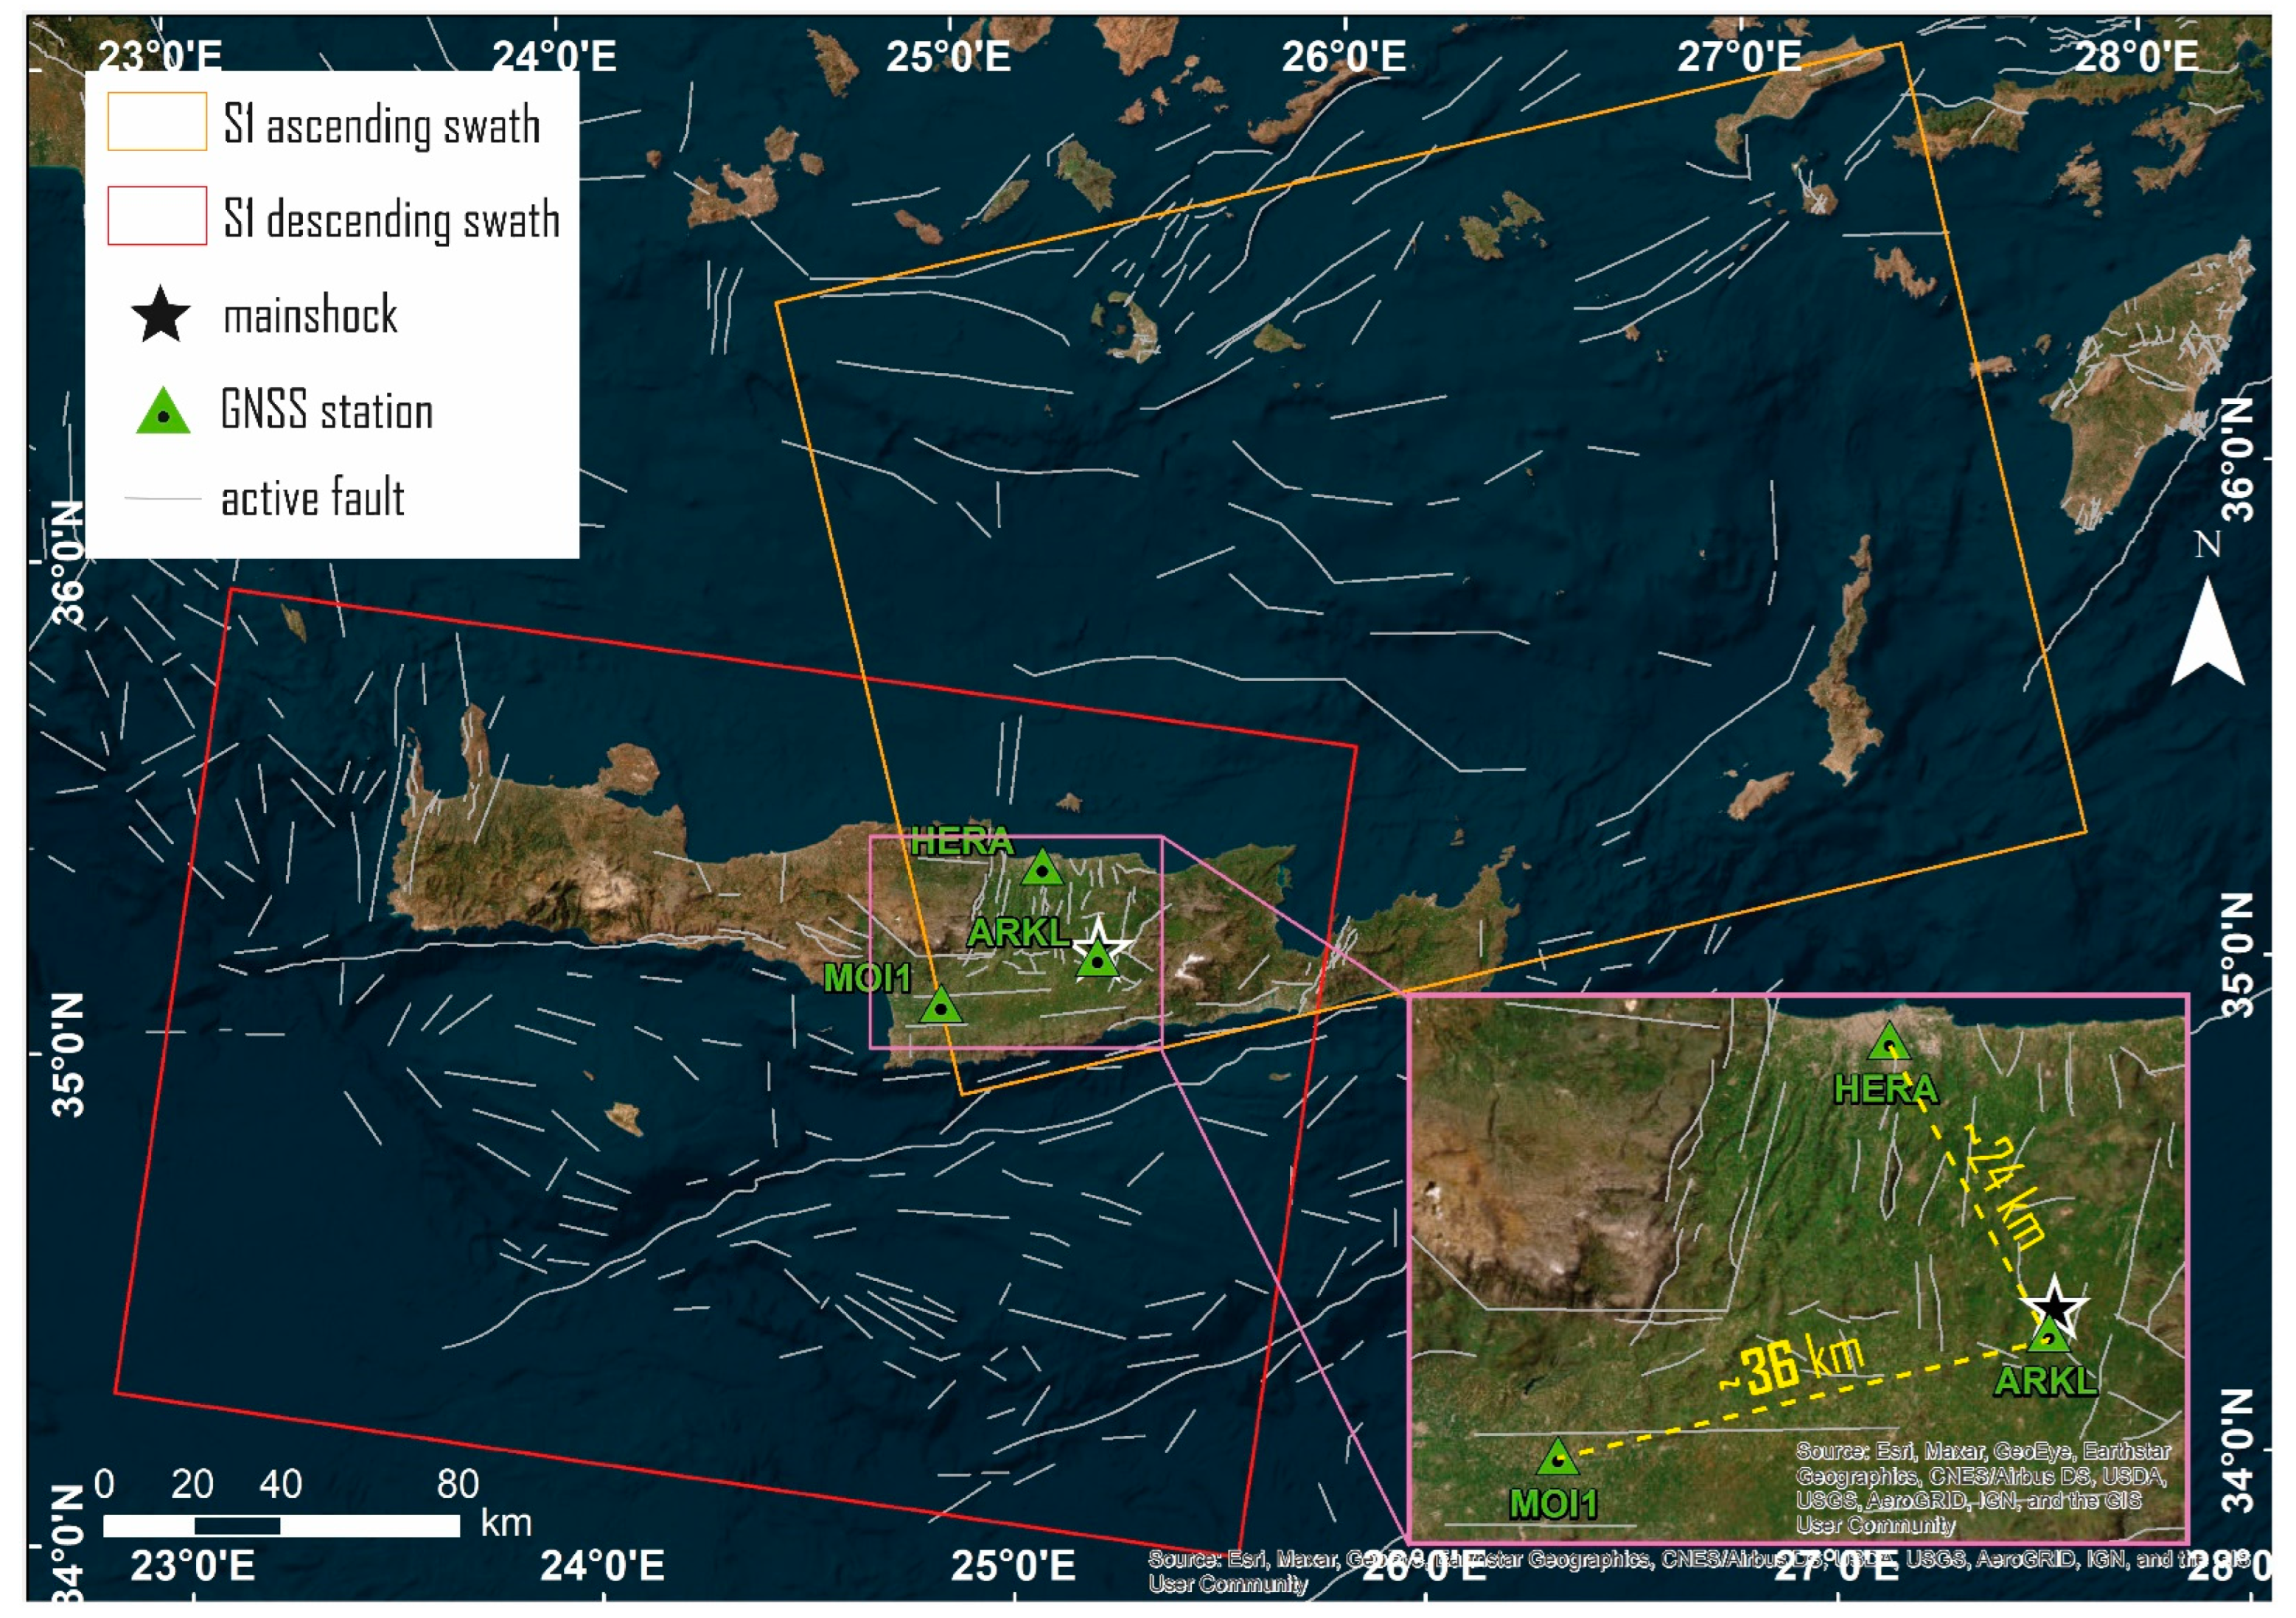
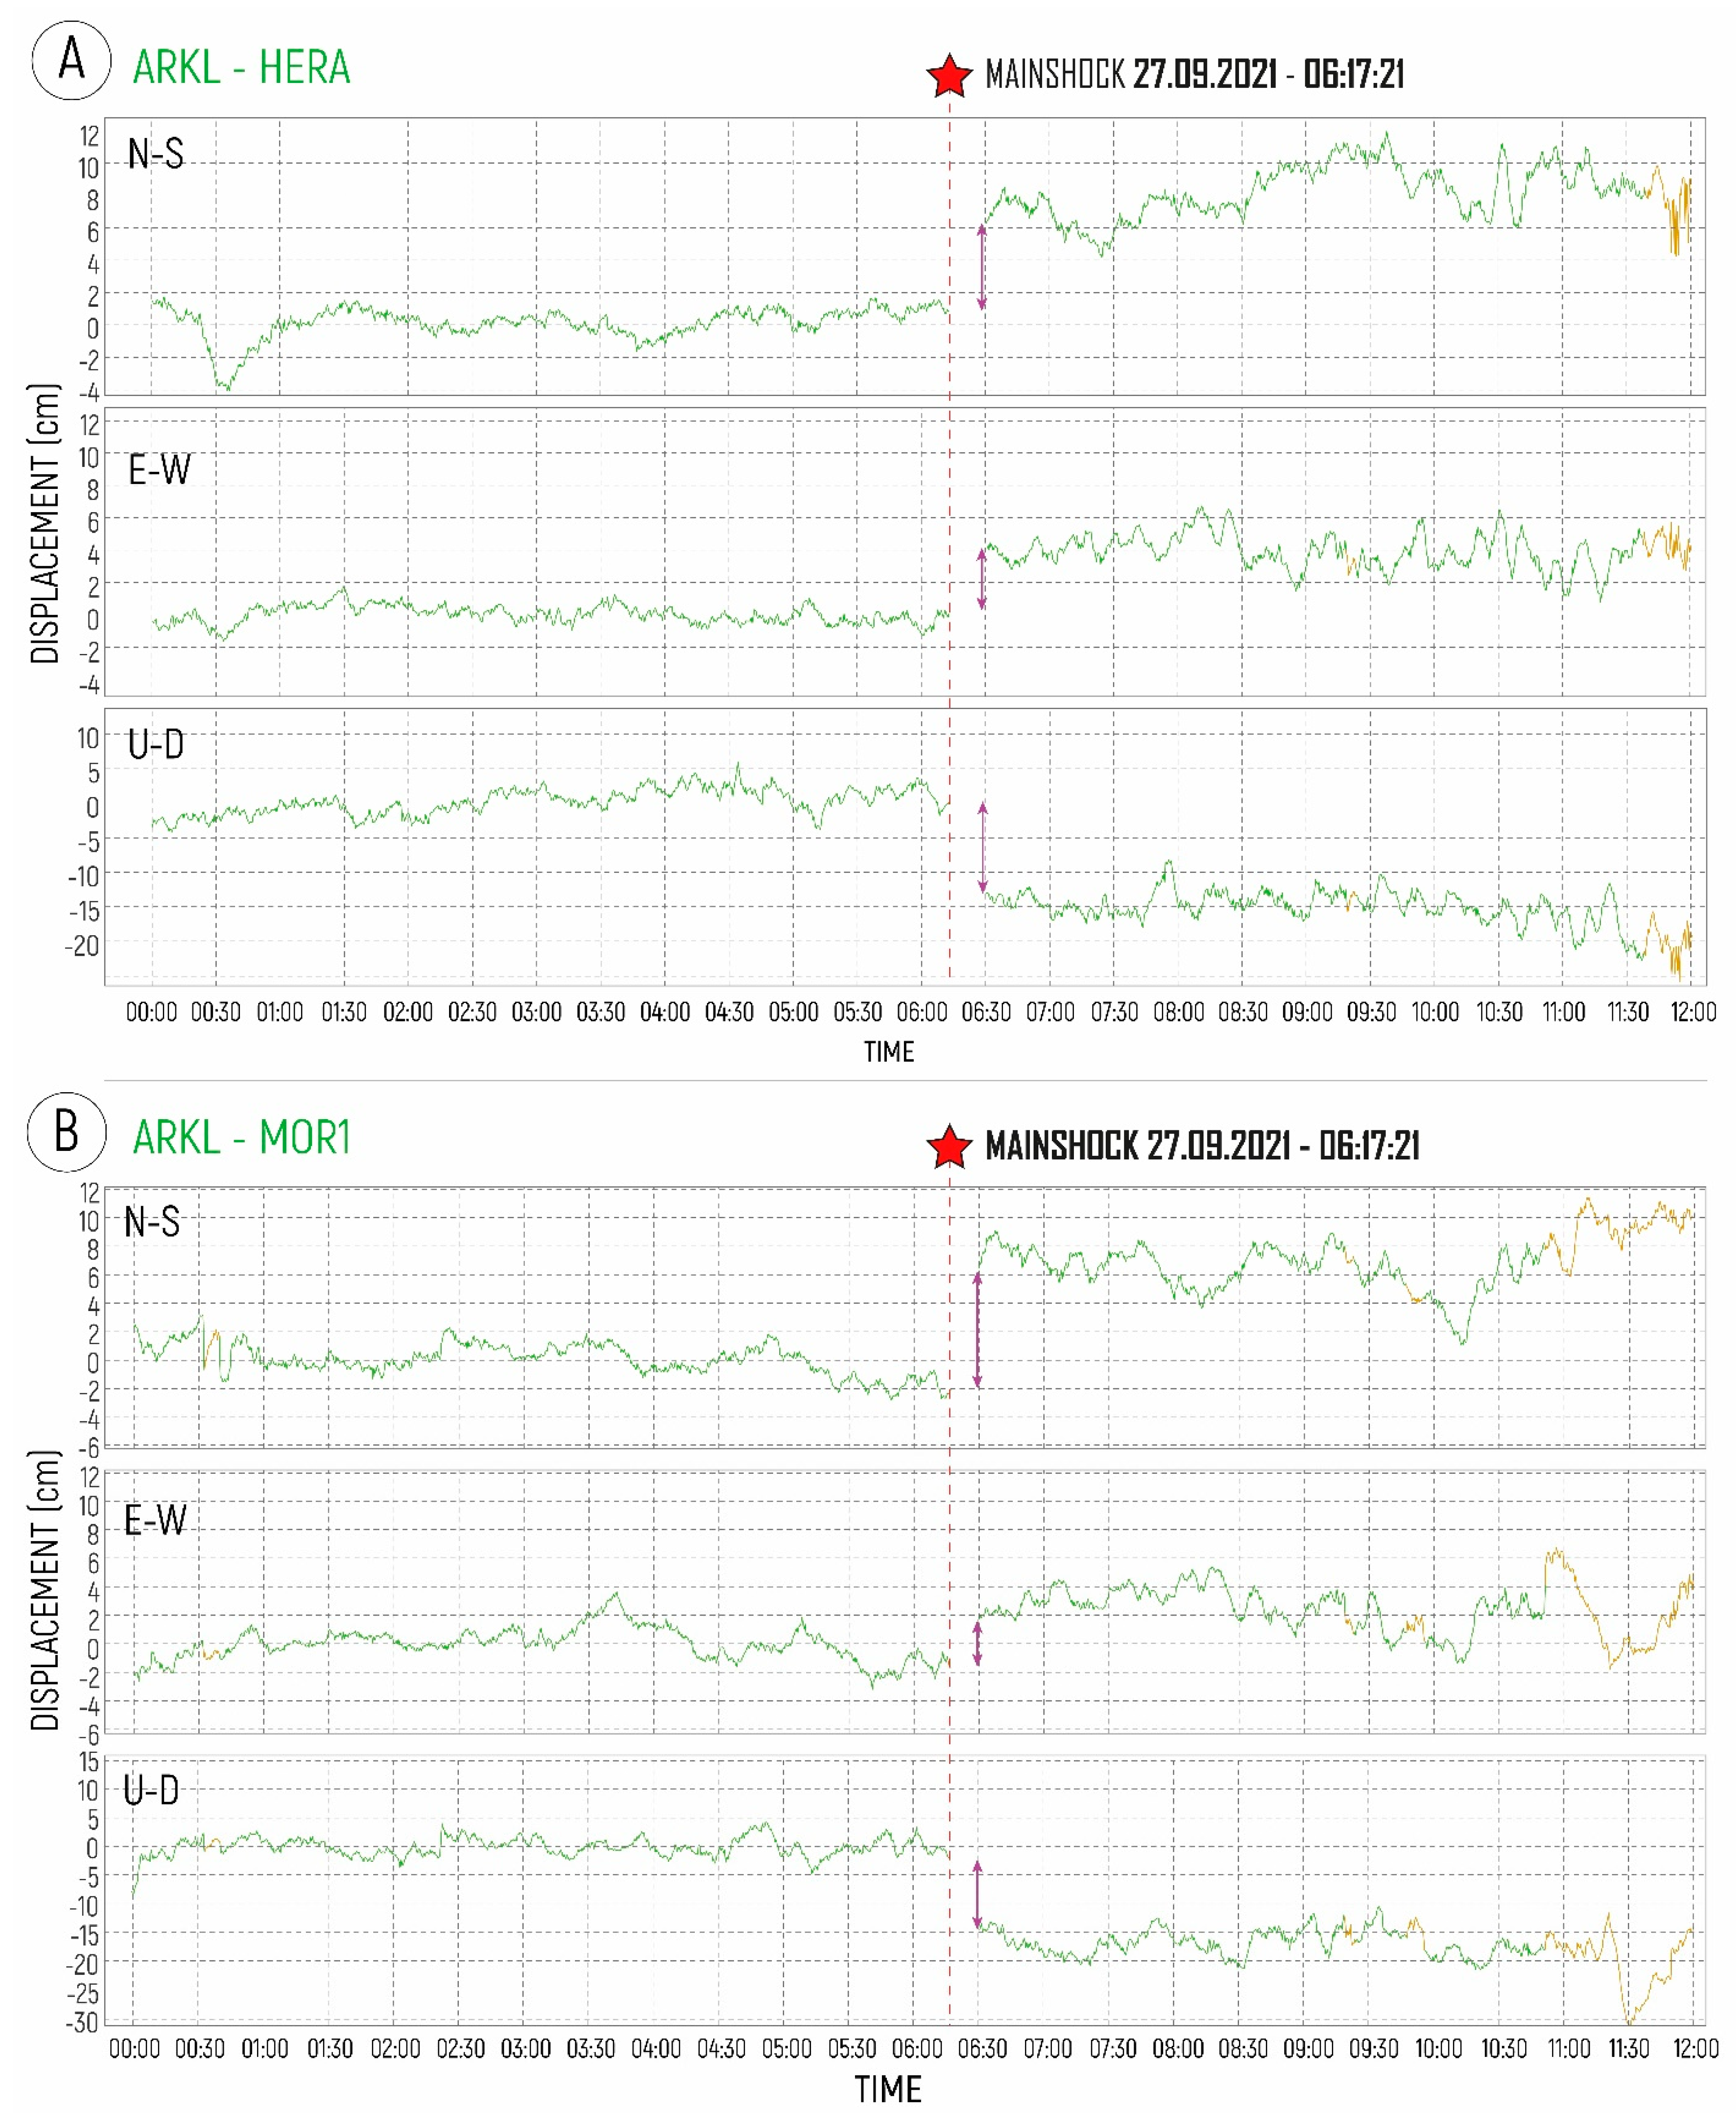
2.2. GNSS Analysis
- ARKL located in the epicentral area (used as a Rover);
- HERA and MOI1 (located at Heraklion and Mires, respectively), which are both outside the area that suffered instability following the earthquake (used as Bases).
- HERA: Receiver LEICA GRX1200 + GNSS, Antenna LEIAR10 NONE;
- ARKL: Receiver LEICA GR10, Antenna LEIAR10 NONE;
- MOI1: Receiver LEICA GR30, Antenna LEIAR10 NONE.
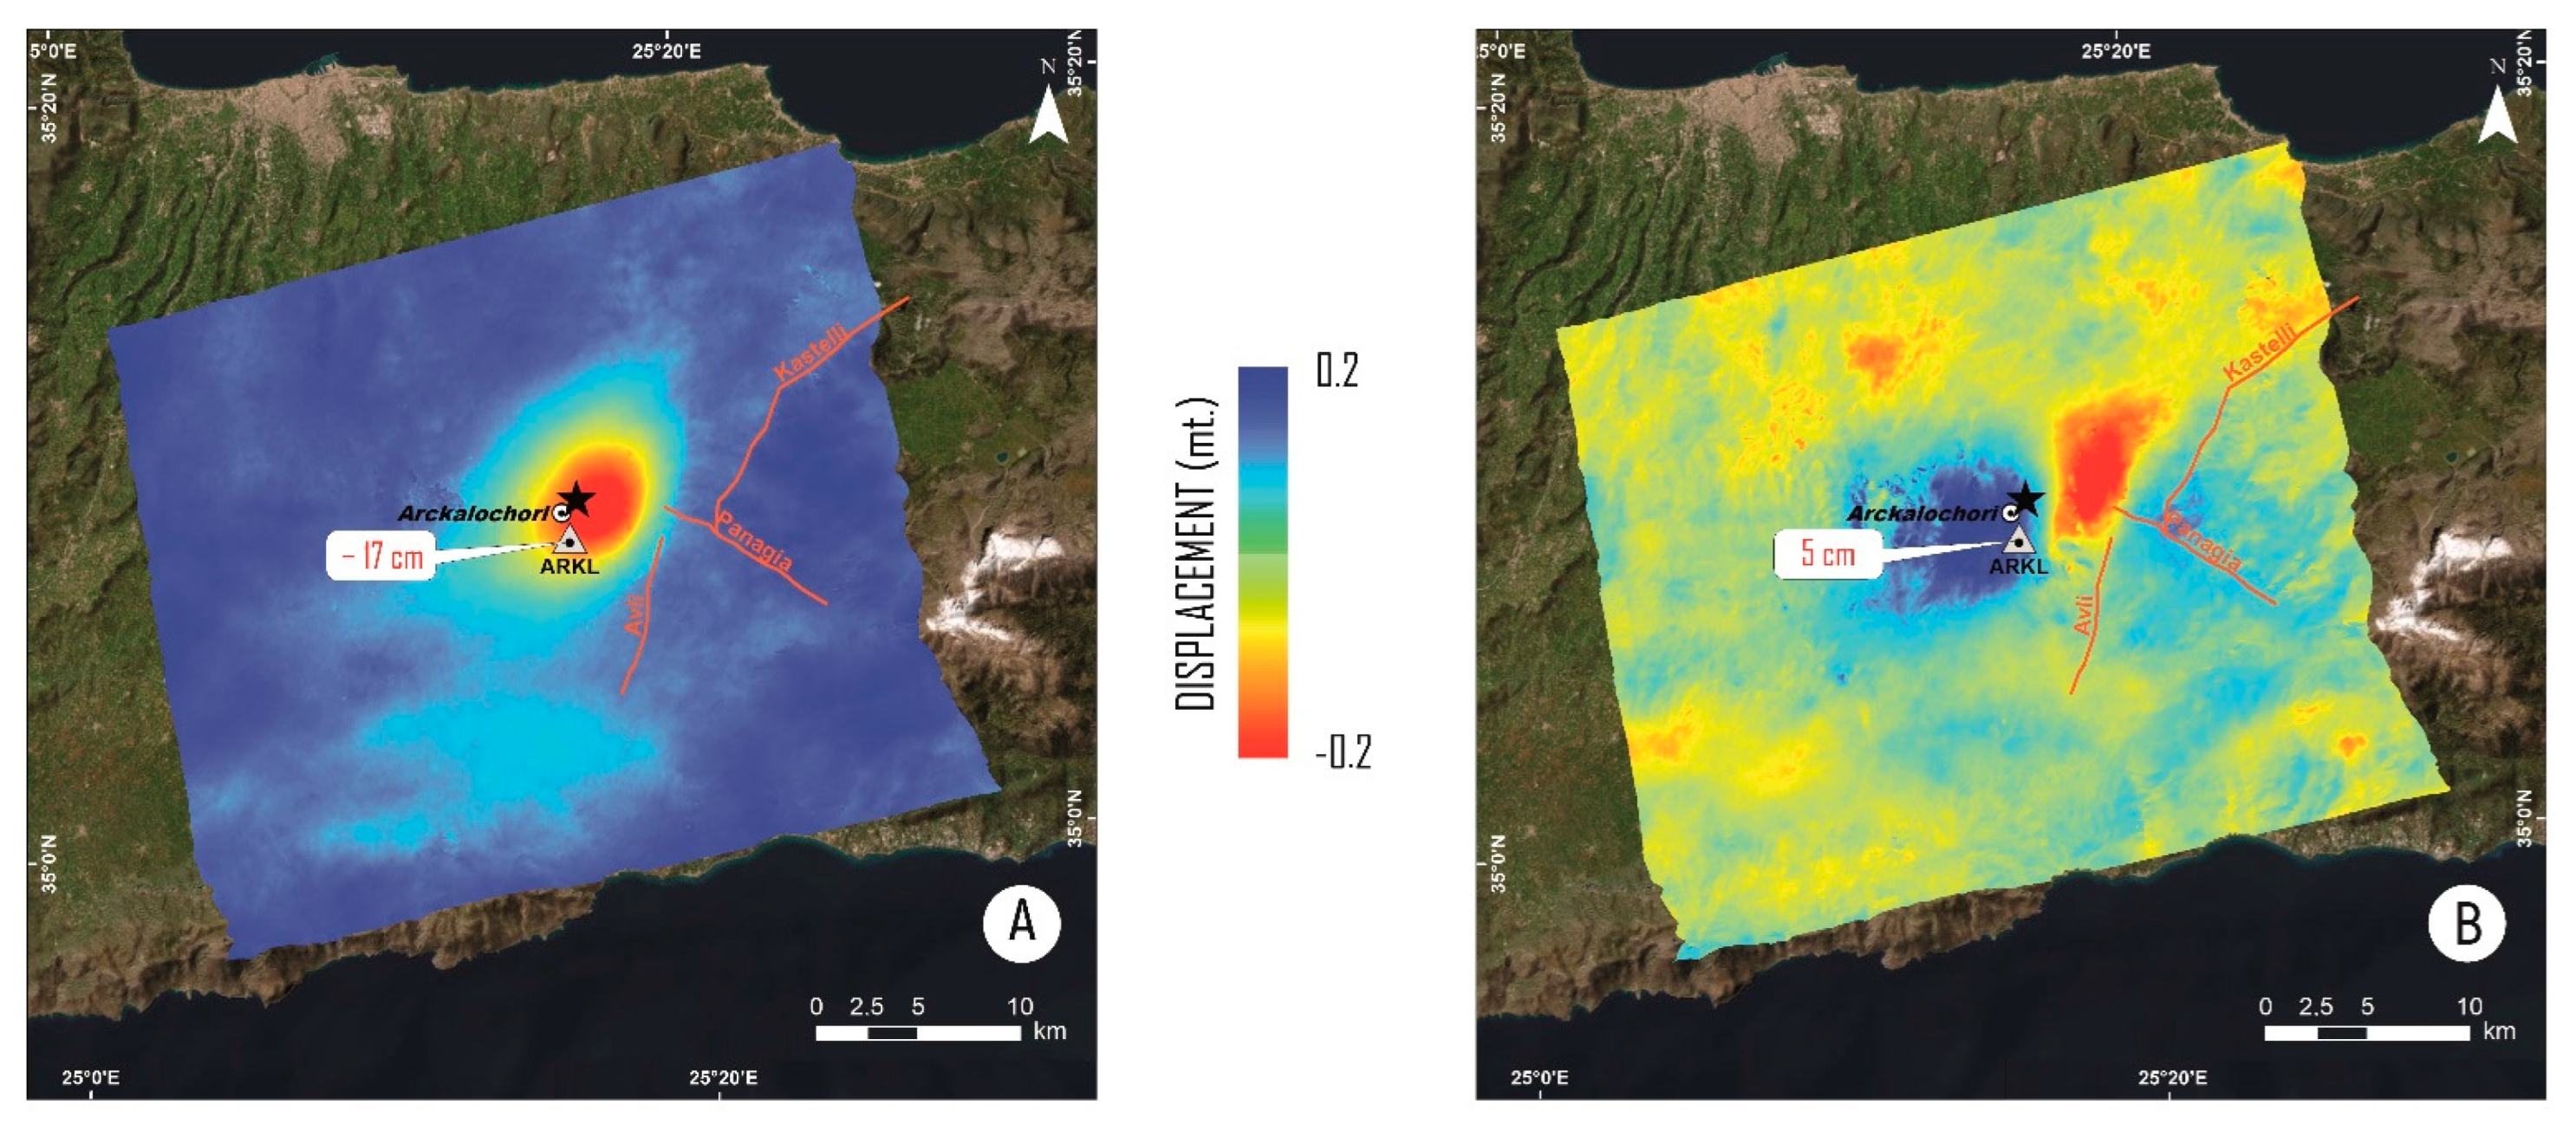
2.3. Source Modelling Analysis
3. Results
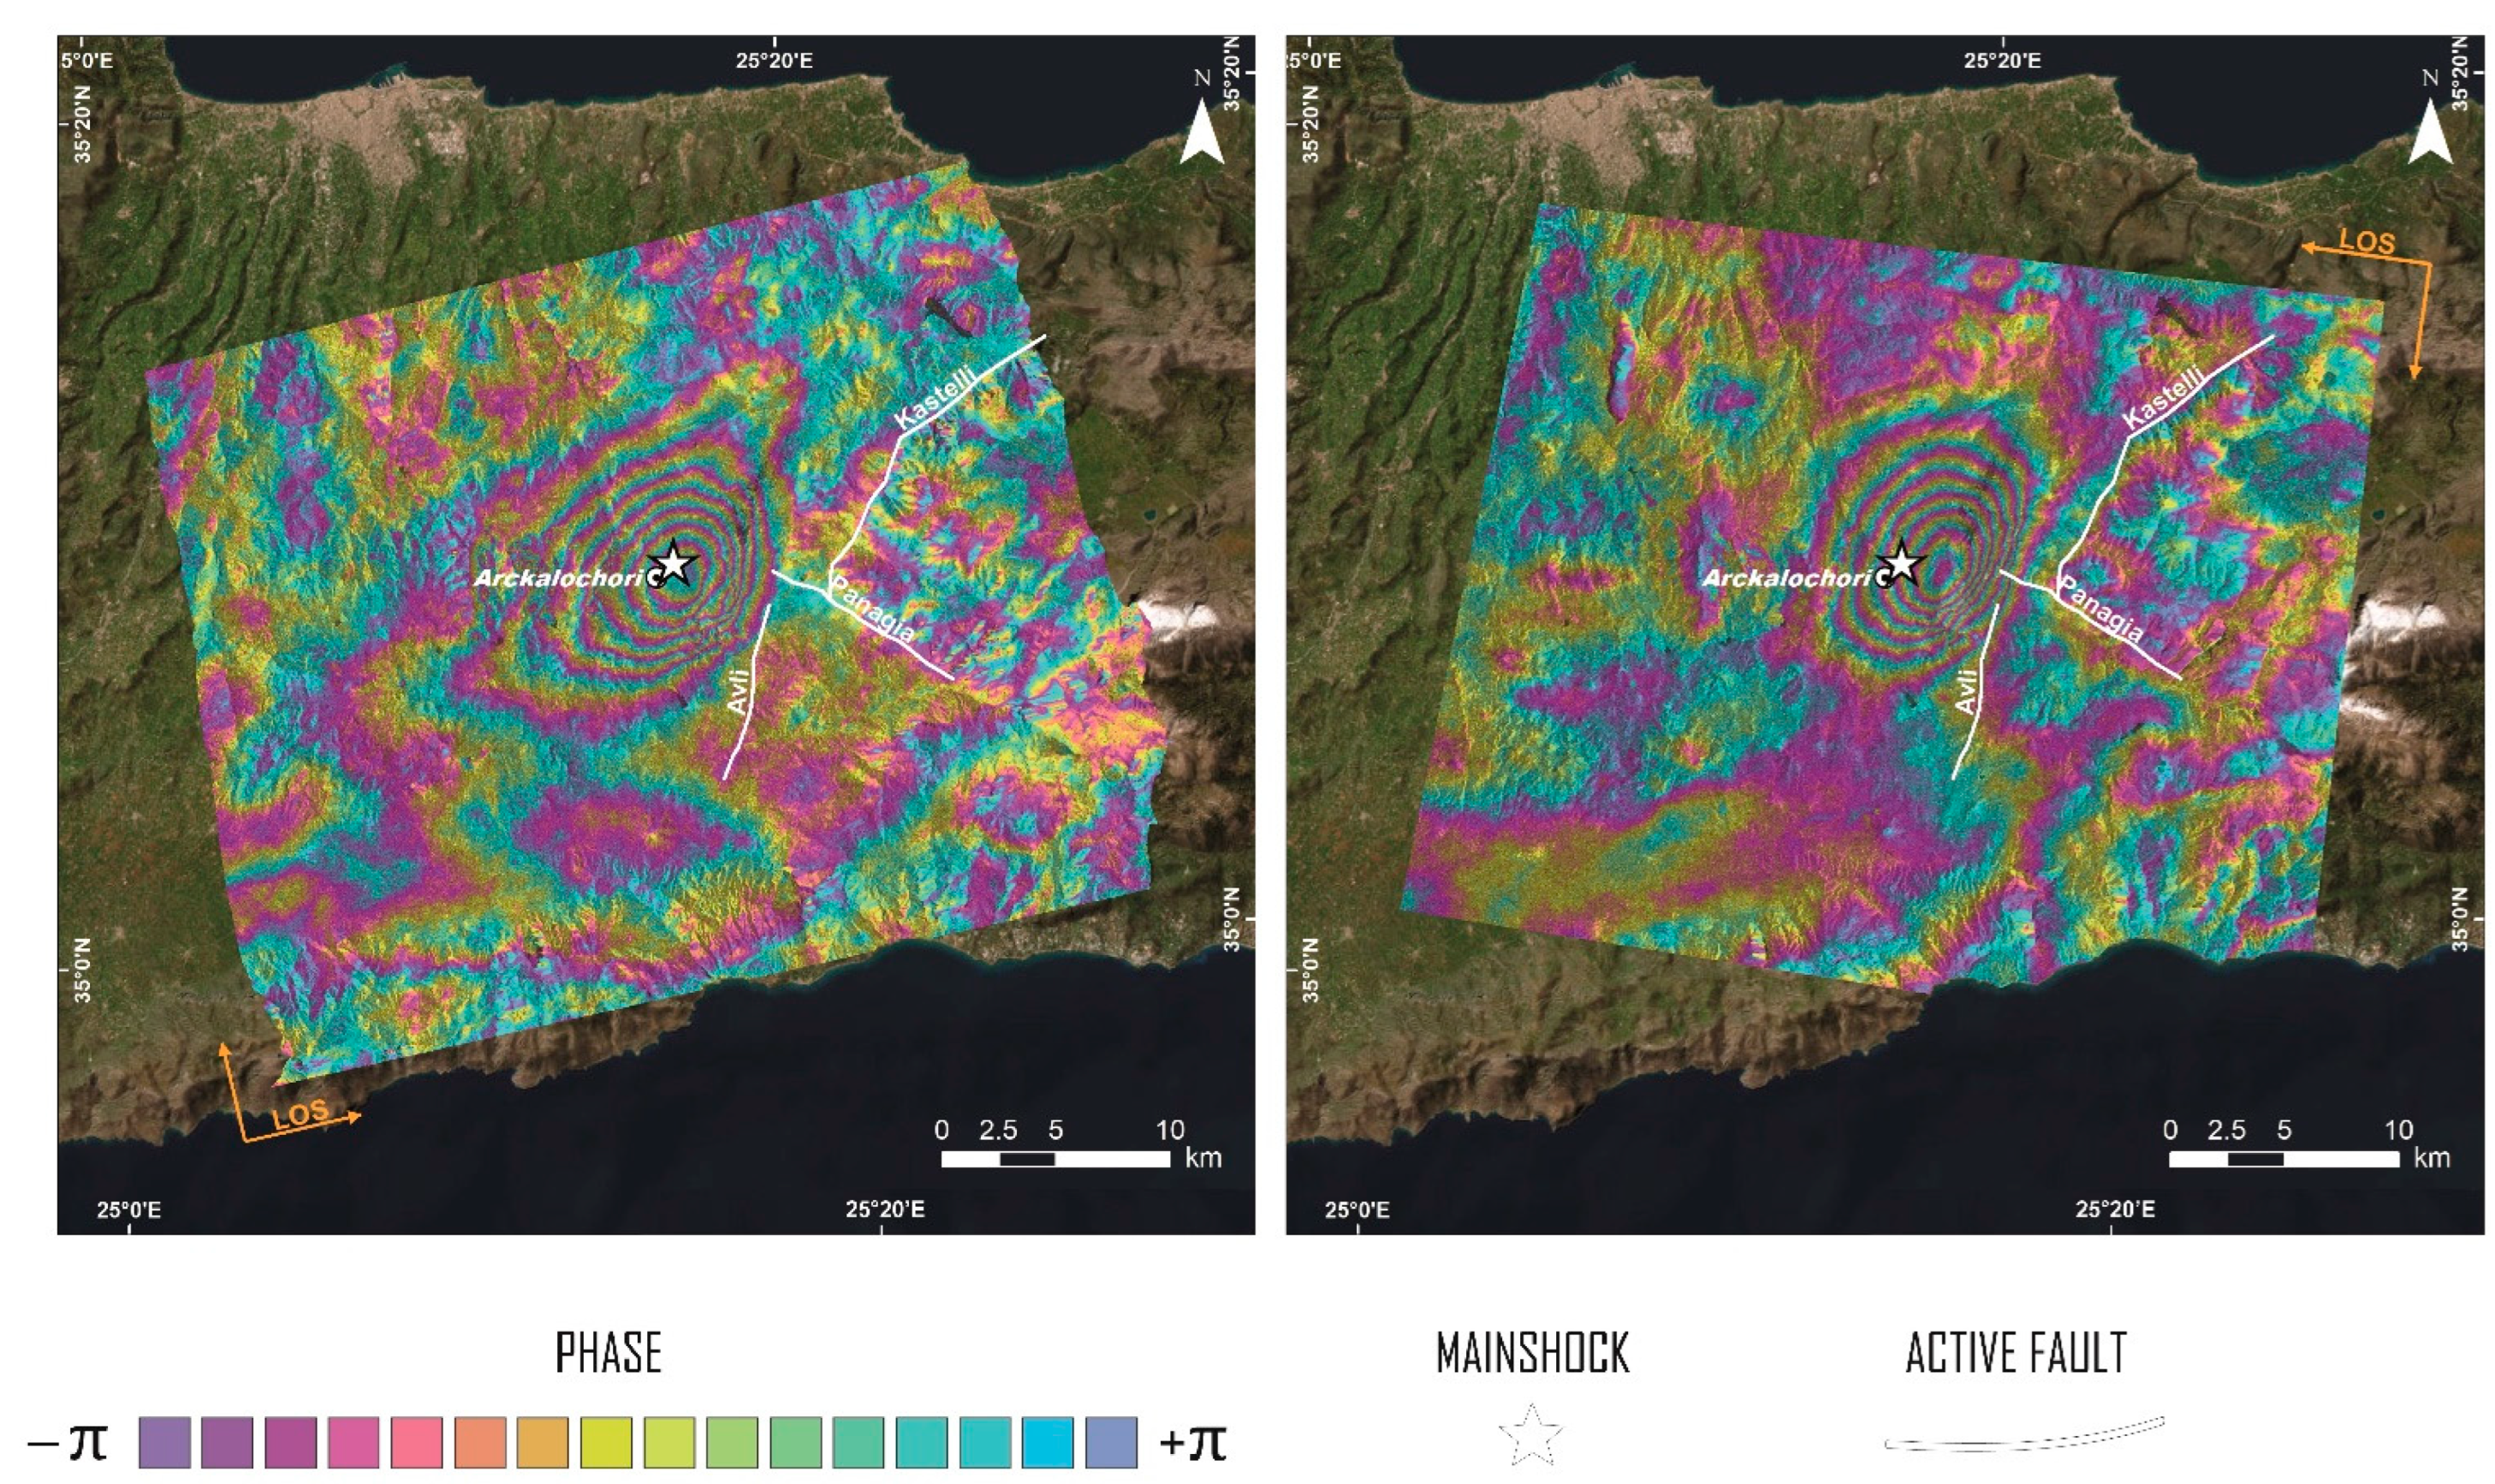
3.1. InSAR Results
3.2. GNSS Results
- ARKL-HERA; with ARKL acting as rover and HERA being the base;
- ARKL_MOI1; with ARKL also being the rover and MOI1 set as base.
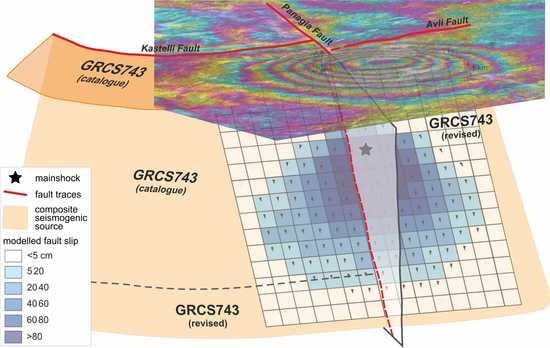
3.3. Source Modelling Results
4. Conclusions
Author Contributions
Funding
Data Availability Statement
Acknowledgments
Conflicts of Interest
References
- Caputo, M.; Panza, G.F.; Postpischl, D. Deep Structure of the Mediterranean Basin. J. Geophys. Res. 1970, 75, 4919–4923. [Google Scholar] [CrossRef]
- Pichon, X.L.; Angelier, J. The Hellenic Arc and Trench System: A Key to the Neotectonic Evolution of the Eastern Mediterranean Area. Tectonophysics 1979, 60, 1–42. [Google Scholar] [CrossRef]
- McKenzie, D. Active Tectonics of the Mediterranean Region. Geophys. J. Int. 1972, 30, 109–185. [Google Scholar] [CrossRef] [Green Version]
- Finetti, I. Mediterranean Ridge: A Young Submerged Chain Associated with the Hellenic Arc. Boll. Geofis. Teor. Appl. 1976, 19, 31–65. [Google Scholar]
- Huguen, C.; Chamot-Rooke, N.; Loubrieu, B.; Mascle, J. Morphology of a Pre-Collisional, Salt-Bearing, Accretionary Complex: The Mediterranean Ridge (Eastern Mediterranean). Mar. Geophys. Res. 2006, 27, 61–75. [Google Scholar] [CrossRef]
- Reilinger, R.; McClusky, S.; Paradissis, D.; Ergintav, S.; Vernant, P. Geodetic Constraints on the Tectonic Evolution of the Aegean Region and Strain Accumulation along the Hellenic Subduction Zone. Tectonophysics 2010, 488, 22–30. [Google Scholar] [CrossRef]
- Bocchini, G.M.; Brüstle, A.; Becker, D.; Meier, T.; van Keken, P.E.; Ruscic, M.; Papadopoulos, G.A.; Rische, M.; Friederich, W. Tearing, Segmentation, and Backstepping of Subduction in the Aegean: New Insights from Seismicity. Tectonophysics 2018, 734–735, 96–118. [Google Scholar] [CrossRef]
- Halpaap, F.; Rondenay, S.; Perrin, A.; Goes, S.; Ottemöller, L.; Austrheim, H.; Shaw, R.; Eeken, T. Earthquakes Track Subduction Fluids from Slab Source to Mantle Wedge Sink. Sci. Adv. 2022, 5, eaav7369. [Google Scholar] [CrossRef] [Green Version]
- Robertson, J.; Meschis, M.; Roberts, G.P.; Ganas, A.; Gheorghiu, D.M. Temporally Constant Quaternary Uplift Rates and Their Relationship With Extensional Upper-Plate Faults in South Crete (Greece), Constrained With 36Cl Cosmogenic Exposure Dating. Tectonics 2019, 38, 1189–1222. [Google Scholar] [CrossRef] [Green Version]
- Angelier, J. Néotectonique de l’Arc Égéen. Soc. Géol. Nord Spéc. Publ. 1979, 3, 417–418. [Google Scholar]
- Caputo, R.; Monaco, C.; Tortorici, L. Multiseismic Cycle Deformation Rates from Holocene Normal Fault Scarps on Crete (Greece). Terra Nova 2006, 18, 181–190. [Google Scholar] [CrossRef]
- Caputo, R.; Pavlides, S. The Greek Database of Seismogenic Sources (GreDaSS), Version 2.0.0: A Compilation of Potential Seismogenic Sources (Mw > 5.5) in the Aegean Region; University of Ferrara: Ferrara, Italy, 2013. [Google Scholar]
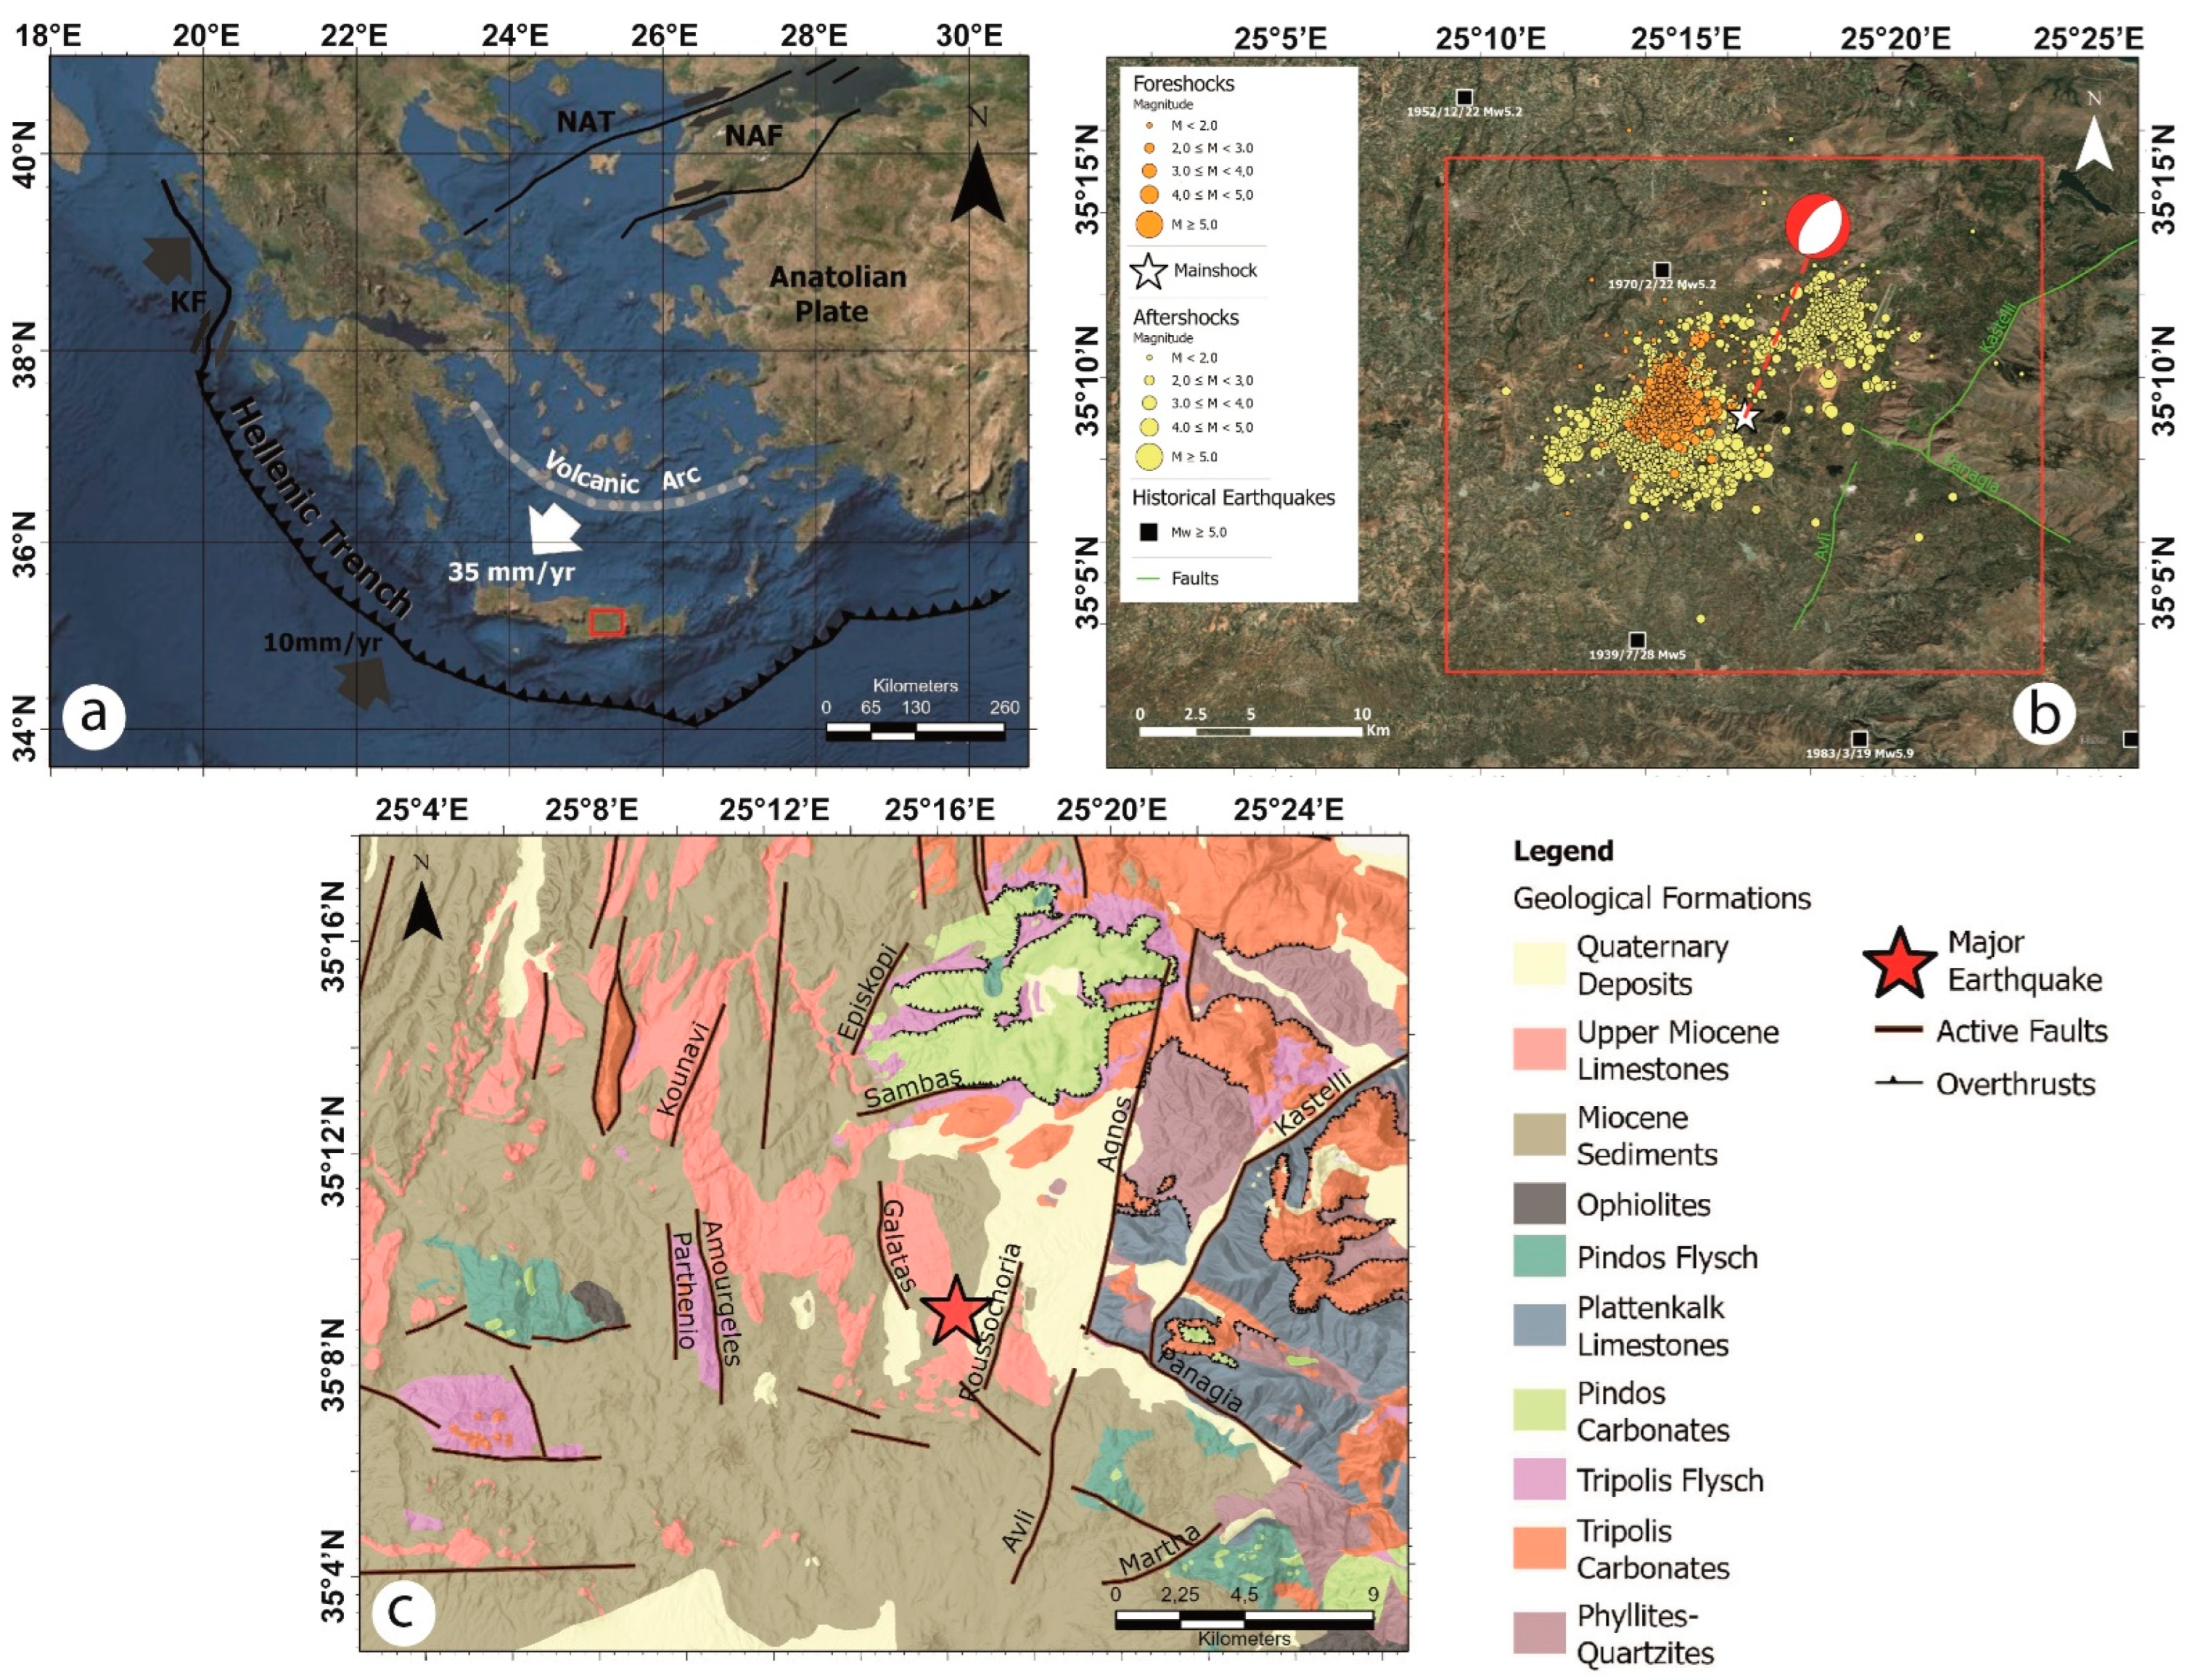
- Vassilakis, E.; Kaviris, G.; Kapetanidis, V.; Papageorgiou, E.; Foumelis, M.; Konsolaki, A.; Petrakis, S.; Evangelidis, C.P.; Alexopoulos, J.; Karastathis, V.; et al. The 27 September 2021 Earthquake in Central Crete (Greece)—Detailed Analysis of the Earthquake Sequence and Indications for Contemporary Arc-Parallel Extension to the Hellenic Arc. Appl. Sci. 2022, 12, 2815. [Google Scholar] [CrossRef]
- Ganas, A.; Fassoulas, C.; Moshou, A.; Bozionelos, G.; Papathanassiou, G.; Tsimi, C.; Valkaniotis, S. Geological and Seismological Evidence for NW-SE Crustal Extension at the Southern Margin of Heraklion Basin, Crete. Bull. Geol. Soc. Greece 2017, 51, 52. [Google Scholar] [CrossRef] [Green Version]
- Ganas, A.; Hamiel, Y.; Serpetsidaki, A.; Briole, P.; Valkaniotis, S.; Fassoulas, C.; Piatibratova, O.; Kranis, H.; Tsironi, V.; Karamitros, I.; et al. The Arkalochori Mw = 5.9 Earthquake of 27 September 2021 Inside the Heraklion Basin: A Shallow, Blind Rupture Event Highlighting the Orthogonal Extension of Central Crete. Geosciences 2022, 12, 220. [Google Scholar] [CrossRef]
- Caputo, R.; Catalano, S.; Monaco, C.; Romagnoli, G.; Tortorici, G.; Tortorici, L. Active Faulting on the Island of Crete (Greece). Geophys. J. Int. 2010, 183, 111–126. [Google Scholar] [CrossRef]
- Fassoulas, C. The Tectonic Development of a Neogene Basin at the Leading Edge of the Active European Margin: The Heraklion Basin, Crete, Greece. J. Geodyn. 2001, 31, 49–70. [Google Scholar] [CrossRef]
- Delibasis, N.; Ziazia, M.; Voulgaris, N.; Papadopoulos, T.; Stavrakakis, G.; Papanastassiou, D.; Drakatos, G. Microseismic Activity and Seismotectonics of Heraklion Area (Central Crete Island, Greece). Tectonophysics 1999, 308, 237–248. [Google Scholar] [CrossRef] [Green Version]
- Vallianatos, F.; Karakonstantis, A.; Michas, G.; Pavlou, K.; Kouli, M.; Sakkas, V. On the Patterns and Scaling Properties of the 2021–2022 Arkalochori Earthquake Sequence (Central Crete, Greece) Based on Seismological, Geophysical and Satellite Observations. Appl. Sci. 2022, 12, 7716. [Google Scholar] [CrossRef]
- Kokkalas, S.; Doutsos, T. Strain-Dependent Stress Field and Plate Motions in the South-East Aegean Region. J. Geodyn. 2001, 32, 311–332. [Google Scholar] [CrossRef]
- IGME-Institute of Geology and Mineral Exploration. Geological Map of Greece—Mochos Sheet (Scale 1:50.000); IGME-Institute of Geology and Mineral Exploration: Athens, Greece, 1989. [Google Scholar]
- Ganas, A.; Oikonomou, A.; Tsimi, C. NOAFAULTS: A Digital Database for Active Faults in Greece, Bulletin of the Geological Society of Greece. In Proceedings of the 13th International Congress, Chania, Greece, 5–8 September 2013; Volume 47, pp. 518–530. [Google Scholar]
- Massonnet, D.; Feigl, K.L. Radar Interferometry and Its Application to Changes in the Earth’s Surface. Rev. Geophys. 1998, 36, 441–500. [Google Scholar] [CrossRef] [Green Version]
- Alac, R.; Trinder, J.; Rizos, C. Analysing Post-Seismic Deformation of Izmit Earthquake with Insar, Gnss and Coulomb Stress Modelling. ISPRS-Int. Arch. Photogramm. Remote Sens. Spat. Inf. Sci. 2016, XLI-B1, 417–421. [Google Scholar] [CrossRef] [Green Version]
- Goldstein, R.M.; Werner, C.L. Radar Interferogram Filtering for Geophysical Applications. Geophys. Res. Lett. 1998, 25, 4035–4038. [Google Scholar] [CrossRef]
- Vallianatos, F.; Michas, G.; Hloupis, G.; Chatzopoulos, G. The Evolution of Preseismic Patterns Related to the Central Crete (Mw6.0) Strong Earthquake on 27 September 2021 Revealed by Multiresolution Wavelets and Natural Time Analysis. Geosciences 2022, 12, 33. [Google Scholar] [CrossRef]
- Costantini, M. A Novel Phase Unwrapping Method Based on Network Programming. IEEE Trans. Geosci. Remote Sens. 1998, 36, 813–821. [Google Scholar] [CrossRef]
- Floyd, M.; Funning, G.; Fialko, Y.; Terry, R.; Herring, T. Survey and Continuous GNSS in the Vicinity of the July 2019 Ridgecrest Earthquakes. Seismol. Res. Lett. 2020, 91, 2047–2054. [Google Scholar] [CrossRef]
- Kuzin, S. The Key Role of GNSS for Monitoring Geodetic Parameters of the Earth. INASAN Sci. Rep. 2021, 6, 10–15. [Google Scholar] [CrossRef]
- Jaduszliwer, B.; Camparo, J. Past, Present and Future of Atomic Clocks for GNSS. GPS Solut. 2021, 25, 27. [Google Scholar] [CrossRef]
- Oktar, O.; Erdoğan, H.; Poyraz, F.; Tiryakioğlu, İ. Investigation of Deformations with the GNSS and PSInSAR Methods. Arab. J. Geosci. 2021, 14, 2586. [Google Scholar] [CrossRef]
- Redhwan, A.; Erdoğan, H. Monitoring of Continuous GNSS Stations at Central Anatolia Region. Turk. J. Geosci. 2021, 2, 21–29. [Google Scholar] [CrossRef]
- Sakkas, V. Ground Deformation Modelling of the 2020 Mw6.9 Samos Earthquake (Greece) Based on InSAR and GNSS Data. Remote Sens. 2021, 13, 1665. [Google Scholar] [CrossRef]
- Tiryakioğlu, İ.; Aktuğ, B.; Yiğit, C.Ö.; Yavaşoğlu, H.H.; Sözbilir, H.; Özkaymak, Ç.; Poyraz, F.; Taneli, E.; Bulut, F.; Doğru, A.; et al. Slip Distribution and Source Parameters of the 20 July 2017 Bodrum-Kos Earthquake (Mw6.6) from GPS Observations. Geodin. Acta 2018, 30, 1–14. [Google Scholar] [CrossRef] [Green Version]
- Takasu, T.; Yasuda, A. Development of the Low-Cost RTK-GPS Receiver with an Open Source Program Package RTKLIB. In Proceedings of the International Symposium on GPS/GNSS, Jeju, Republic of Korea, 4–6 November 2009. [Google Scholar]
- Rizos, C. Principles and Practice of GPS Surveying; School of Geomatic Engineering, University of New South Wales: Kensington, NSW, Australia, 1997; ISBN 085839071X. [Google Scholar]
- Šugar, D.; Bačić, Ž. Kinematic Effects of M5.5 Zagreb Earthquake Assessed by GNSS Method Supported by Galileo Satellite System. In Proceedings of the 1st Croatian Conference on Earthquake Engineering–1CroCEE, Zagreb, Croatia, 22–24 March 2021; pp. 385–395. [Google Scholar] [CrossRef]
- Okada, Y. Surface Deformation Due to Shear and Tensile Faults in a Half-Space. Bull. Seismol. Soc. Am. 1985, 75, 1135–1154. [Google Scholar] [CrossRef]
- Williams, C.A.; Wadge, G. The Effects of Topography on Magma Chamber Deformation Models: Application to Mt. Etna and Radar Interferometry. Geophys. Res. Lett. 1998, 25, 1549–1552. [Google Scholar] [CrossRef]
- Menke, W. Solution of the Linear, Gaussian Inverse Problem, Viewpoint 1: The Length Method. In International Geophysics; Menke, W., Ed.; Academic Press: Boston, MA, USA, 1989; Volume 45, pp. 35–60. ISBN 978-0-12-397160-9. [Google Scholar]
- Funning, G.J.; Parsons, B.; Wright, T.J.; Jackson, J.A.; Fielding, E.J. Surface Displacements and Source Parameters of the 2003 Bam (Iran) Earthquake from Envisat Advanced Synthetic Aperture Radar Imagery. J. Geophys. Res. Solid Earth 2005, 110. [Google Scholar] [CrossRef] [Green Version]
- Wright, T.J.; Lu, Z.; Wicks, C. Source Model for the Mw 6.7, 23 October 2002, Nenana Mountain Earthquake (Alaska) from InSAR. Geophys. Res. Lett. 2003, 30. [Google Scholar] [CrossRef]
- Golshadi, Z.; Famiglietti, N.A.; Atzori, S.; Vicari, A. Surface Displacement and Source Parameters of the 2021 Bandar-e Genaveh, Iran, Earthquake Determined from InSAR Observations. Appl. Sci. 2022, 12, 4223. [Google Scholar] [CrossRef]
- Atzori, S.; Manunta, M.; Fornaro, G.; Ganas, A.; Salvi, S. Postseismic Displacement of the 1999 Athens Earthquake Retrieved by the Differential Interferometry by Synthetic Aperture Radar Time Series. J. Geophys. Res. Solid Earth 2008, 113. [Google Scholar] [CrossRef]
- Atzori, S.; Hunstad, I.; Chini, M.; Salvi, S.; Tolomei, C.; Bignami, C.; Stramondo, S.; Trasatti, E.; Antonioli, A.; Boschi, E. Finite Fault Inversion of DInSAR Coseismic Displacement of the 2009 L’Aquila Earthquake (Central Italy). Geophys. Res. Lett. 2009, 36. [Google Scholar] [CrossRef]
- Marquardt, D.W. An Algorithm for Least-Squares Estimation of Nonlinear Parameters. J. Soc. Ind. Appl. Math. 1963, 11, 431–441. [Google Scholar] [CrossRef]
- Zebker, H.A.; Pepin, K. Maximum Temporal Baseline for InSAR Time Series. In Proceedings of the 2021 IEEE International Geoscience and Remote Sensing Symposium IGARSS, Honolulu, HI, USA, 25–30 July 2010; pp. 2652–2654. [Google Scholar]
- Hanssen, R. Radar Interferometry Data Interpretation and Error Analysis; Springer Science & Business Media: Berlin, Germany, 2001; Volume 2, ISBN 978-0-7923-6945-5. [Google Scholar]
- Dai, K.; Liu, G.; Li, Z.; Li, T.; Yu, B.; Wang, X.; Singleton, A. Extracting Vertical Displacement Rates in Shanghai (China) with Multi-Platform SAR Images. Remote Sens. 2015, 7, 9542–9562. [Google Scholar] [CrossRef] [Green Version]
- Pepe, A.; Calò, F. A Review of Interferometric Synthetic Aperture RADAR (InSAR) Multi-Track Approaches for the Retrieval of Earth’s Surface Displacements. Appl. Sci. 2017, 7, 1264. [Google Scholar] [CrossRef]
- Tolomei, C.; Caputo, R.; Polcari, M.; Famiglietti, N.A.; Maggini, M.; Stramondo, S. The Use of Interferometric Synthetic Aperture Radar for Isolating the Contribution of Major Shocks: The Case of the March 2021 Thessaly, Greece, Seismic Sequence. Geosciences 2021, 11, 191. [Google Scholar] [CrossRef]
- Beutler, G.; Rothacher, M.; Schaer, S.; Springer, T.A.; Kouba, J.; Neilan, R.E. The International GPS Service (IGS): An Interdisciplinary Service in Support of Earth Sciences. Adv. Space Res. 1999, 23, 631–653. [Google Scholar] [CrossRef]
- Erol, S.; Alkan, R.M.; Ozulu, İ.M.; İlçi, V. Performance Analysis of Real-Time and Post-Mission Kinematic Precise Point Positioning in Marine Environments. Geod. Geodyn. 2020, 11, 401–410. [Google Scholar] [CrossRef]
- Vincenty, T. Direct and inverse solutions of geodesics on the ellipsoid with application of nested equations. Surv. Rev. 1975, 23, 88–93. [Google Scholar] [CrossRef]
- Vincenty, T. Formula for Distance between Two Latitude/Longitude Points. Available online: http://www.movabletype.co.uk/scripts/latlong-vincenty.html (accessed on 23 September 2022).
- Cheloni, D.; de Novellis, V.; Albano, M.; Antonioli, A.; Anzidei, M.; Atzori, S.; Avallone, A.; Bignami, C.; Bonano, M.; Calcaterra, S.; et al. Geodetic Model of the 2016 Central Italy Earthquake Sequence Inferred from InSAR and GPS Data. Geophys. Res. Lett. 2017, 44, 6778–6787. [Google Scholar] [CrossRef]
- Atzori, S.; Antonioli, A.; Tolomei, C.; de Novellis, V.; de Luca, C.; Monterroso, F. InSAR Full-Resolution Analysis of the 2017–2018 M>6 Earthquakes in Mexico. Remote Sens. Environ. 2019, 234, 111461. [Google Scholar] [CrossRef]
- Triantafyllou, I.; Karavias, A.; Koukouvelas, I.; Papadopoulos, G.A.; Parcharidis, I. The Crete Isl. (Greece) Mw6.0 Earthquake of 27 September 2021: Expecting the Unexpected. GeoHazards 2022, 3, 106–124. [Google Scholar] [CrossRef]
- Caputo, R.; Catalano, S.; Monaco, C.; Romagnoli, G.; Tortorici, G.; Tortorici, L. Middle-Late Quaternary Geodynamics of Crete, Southern Aegean, and Seismotectonic Implications. In Proceedings of the EGU General Assembly Conference Abstracts, Vienna, Austria, 1 May 2010; p. 379. [Google Scholar]
- Caputo, R. Ground Effects of Large Morphogenic Earthquakes. J. Geodyn. 2005, 40, 113–118. [Google Scholar] [CrossRef]
- Pavlides, S.; Caputo, R. Magnitude versus Faults’ Surface Parameters: Quantitative Relationships from the Aegean Region. Tectonophysics 2004, 380, 159–188. [Google Scholar] [CrossRef]


| Magnitude (ML) & Focal Mechanisms (NOA) | Date & Time (UTC) | Location | Latitude (°N) | Longitude (°E) | Depth (km) |
|---|---|---|---|---|---|
5.8 (main) | 2021/09/27 06:17:21 | 23.3 km SE of Heraklion | 35.1512 | 25.2736 | 10 |
4.5 | 2021/09/27 07:30:45 | 23.7 km SSE of Heraklion | 35.1334 | 25.2457 | 14 |
4.7 | 2021/09/27 11:02:25 | 19.5 km SE of Heraklion | 35.1805 | 25.2525 | 13 |
5.2 | 2021/09/28 04:48:09 | 20.8 km SSE of Heraklion | 35.1540 | 25.2232 | 11 |
4.6 | 2021/09/28 15:13:15 | 23.4 km SSE of Heraklion | 35.1466 | 25.2663 | 14 |
4.6 | 2021/09/29 11:54:49 | 21.3 km SSE of Heraklion | 25.2058 | 25.1561 | 16 |
| Event | Interferogram Number | Pre-Event Date | Post-Event Date | Orbit | Incidence Angle | Track |
|---|---|---|---|---|---|---|
| ML 5.8–23.3 km SE of Heraklion 2021-09-27 06:17:21 (UTC) | 1 | 18/09/2021 | 30/09/2021 | ascending | 3,555,742 | 29 |
| 2 | 18/09/2021 | 30/09/2021 | descending | 38,352,143 | 109 |
| Stations | Time | Latitude | Longitude | Height |
|---|---|---|---|---|
| ARKL-HERA | Pre Mainschok | 35.1339798770 | 25.2689468500 | 472.48980 |
| Post Mainschok | 35.1339806210 | 25.2689472780 | 472.33980 | |
| Δ (cm) | 8.25 | 3.90 | −15 | |
| Δ (cm) projected on LOS (Asc): −17.81 | ||||
| Δ (cm) projected on LOS (Desc): −12.80 | ||||
| ARKL-MOI1 | Pre Mainschok | 35.1339786970 | 25.2689412250 | 472.59870 |
| Post Mainschok | 35.1339793550 | 25.2689417170 | 472.41760 | |
| Δ (cm) | 7.30 | 4.48 | −18.11 | |
| Δ (cm) projected on LOS (Asc): −20.82 | ||||
| Δ (cm) projected on LOS (Desc): −12.06 | ||||
| Stations (Rover-Base) | Ascending Observed | Ascending Modeled | Descending Observed | Descending Modeled |
|---|---|---|---|---|
| ARKL-HERA | −17.81 | −17.56 | −12.80 | −11.68 |
| ARKL-MOI1 | −20.82 | −20.03 | −12.06 | −10.36 |
Publisher’s Note: MDPI stays neutral with regard to jurisdictional claims in published maps and institutional affiliations. |
© 2022 by the authors. Licensee MDPI, Basel, Switzerland. This article is an open access article distributed under the terms and conditions of the Creative Commons Attribution (CC BY) license (https://creativecommons.org/licenses/by/4.0/).
Share and Cite
Famiglietti, N.A.; Golshadi, Z.; Vallianatos, F.; Caputo, R.; Kouli, M.; Sakkas, V.; Atzori, S.; Moschillo, R.; Cecere, G.; D’Ambrosio, C.; et al. The 2021 Greece Central Crete ML 5.8 Earthquake: An Example of Coalescent Fault Segments Reconstructed from InSAR and GNSS Data. Remote Sens. 2022, 14, 5783. https://0-doi-org.brum.beds.ac.uk/10.3390/rs14225783
Famiglietti NA, Golshadi Z, Vallianatos F, Caputo R, Kouli M, Sakkas V, Atzori S, Moschillo R, Cecere G, D’Ambrosio C, et al. The 2021 Greece Central Crete ML 5.8 Earthquake: An Example of Coalescent Fault Segments Reconstructed from InSAR and GNSS Data. Remote Sensing. 2022; 14(22):5783. https://0-doi-org.brum.beds.ac.uk/10.3390/rs14225783
Chicago/Turabian StyleFamiglietti, Nicola Angelo, Zeinab Golshadi, Filippos Vallianatos, Riccardo Caputo, Maria Kouli, Vassilis Sakkas, Simone Atzori, Raffaele Moschillo, Gianpaolo Cecere, Ciriaco D’Ambrosio, and et al. 2022. "The 2021 Greece Central Crete ML 5.8 Earthquake: An Example of Coalescent Fault Segments Reconstructed from InSAR and GNSS Data" Remote Sensing 14, no. 22: 5783. https://0-doi-org.brum.beds.ac.uk/10.3390/rs14225783