Article

Spatiotemporal Variation Characteristics and Dynamic Persistence Analysis of Carbon Sources/Sinks in the Yellow River Basin

1
School of Geography, Geomatics, and Planning, Jiangsu Normal University, Xuzhou 221116, China
2
State Key Laboratory of Remote Sensing Science, Aerospace Information Research Institute, Chinese Academy of Sciences, Beijing 100049, China
3
Precision Forestry Key Laboratory of Beijing, Beijing Forestry University, Beijing 100083, China
*
Author to whom correspondence should be addressed.
Submission received: 25 October 2022 / Revised: 25 December 2022 / Accepted: 3 January 2023 / Published: 5 January 2023
(This article belongs to the Special Issue Remote Sensing in Applied Ecology)

Abstract

:
Net ecosystem productivity (NEP) is an important indicator for estimating regional carbon sources/sinks. The study focuses on a comprehensive computational simulation and spatiotemporal variation study of the NEP in the Yellow River basin from 2000 to 2020 using NPP data products from MODIS combined with a quantitative NEP estimation model followed by a comprehensive analysis of the spatiotemporal variation characteristics and dynamic procession persistence analysis based on meteorological data and land use data. The results show that: (1) The total NEP in the Yellow River basin had an overall increasing trend from 2000 to 2020, with a Theil–Sen trend from −23.37 to 43.66 gCm−2a−1 and a mean increase of 4.64 gCm−2a−1 (p < 0.01, 2-tailed). (2) Most areas of the Yellow River basin are carbon sink areas, and the annual average NEP per unit area was 208.56 gCm−2a−1 from 2000 to 2020. There were, however, substantial spatial and temporal variations in the NEP. Most of the carbon source area was located in the Kubuqi Desert and its surroundings. (3) Changes in land use patterns were the main cause of changes in regional NEP. During the 2000–2020 period, 1154.24 t of NEP were added, mainly due to changes in land use, e.g., the conversion of farmland to forests and grasslands. (4) The future development in 83.43% of the area is uncertain according to the Hurst index dynamic persistence analysis. In conclusion, although the carbon−sink capacity of the terrestrial ecosystem in the Yellow River basin is increasing and the regional carbon sink potential is increasing in the future, the future development of new energy resources has regional uncertainties, and the stability of the basin ecosystem needs to be enhanced.

Graphical Abstract

1. Introduction

The carbon cycle in terrestrial ecosystems is a complex environmental process and one of the core elements of global change research, and there have been many studies on quantifying it and the influencing factors of terrestrial ecosystems. The analysis of carbon-cycling processes in terrestrial ecosystems and their response to the climate and other factors is focused mostly on the study of net primary productivity (NPP) [1,2,3]. Research on the terrestrial carbon cycle has started to shift to research on net ecosystem productivity (NEP). The size of the NEP is more representative of long-term carbon storage across the ecosystem than plant biomass itself. Therefore, NEP is a better indicator of an ecosystem’s ability to reduce anthropogenic carbon emissions [4].
NEP represents the net accumulation of carbon in ecosystems, that is, the difference between carbon fixed by photosynthesis and carbon lost to respiration in ecosystems. It is an indicator that can be used for quantifying the carbon sequestration capacity and carbon source/sink intensity of ecosystems through experimental observations and model estimations. Experimental observation methods include methods such as the ecological inventory method [5], assimilation box measurement method [6], and eddy covariance method [7]. The ecological inventory method quantifies ecosystem carbon pools through long-term location observations, soil censuses and forestry resource inventories. The advantages are clarity, directness, and technical simplicity, but the accuracy depends on accurate measurements of soil and vegetation carbon contents. The box method uses different boxes to seal soil and vegetation to obtain a measure of gas exchange by measuring changes in gas concentration in the box over time. This method enables the measurement of autotrophic respiration, heterotrophic respiration, and total primary productivity, thus simulating the carbon exchange flux between land and atmosphere. The eddy covariance method is a micrometeorological observation technique used to calculate carbon sequestration in ecosystems by measuring the eddy transfer rate of carbon dioxide above the vegetation canopy.
Ecological process models [8] are based on physiological ecological processes and simulate energy flow to obtain the NEP. At present, ecological process models are widely used to simulate NEP. For example, the Biome-BGC model [9] has advantages in realizing vegetation responses to climate change, and the SIPNET [10] model estimates the responses of NEP in the context of regional climate change. In contrast, remote sensing technology is used to form a carbon-cycle model based on spatial information by coupling the information of various parameters (e.g., NDVI (Normalized Difference Vegetation Index), FPAR (Fraction of absorbed Photosynthetically Active Radiation), and APAR (Absorbed Photosynthetically Active Radiation)) obtained from satellite images with traditional ecological carbon models. Fang et al. [11] used multisource remote sensing data to simulate the annual average carbon uptake in Chinese ecosystems, and the results showed that the annual average uptake in Chinese ecosystems from 1981 to 2000 was from 0.096 to 0.106 PgCa−1. Much of the research on factors influencing NEP in terrestrial ecosystems has focused on temperature [12], precipitation [13], soil moisture [14,15], and vegetation type [16,17,18], and most studies have found that precipitation correlates with NEP in terrestrial ecosystems to a greater degree than temperature [13,19,20,21,22].
As a major energy supply base and core economic area in China, the Yellow River basin plays a significant role in promoting environmental protection and high-quality development in the Yellow River basin as well as achieving the ‘dual carbon goals’ (China’s national strategy of achieving a carbon peak (2030) and carbon neutrality (2060)) [23]. Most of the upper and middle reaches of the Yellow River basin are located in arid and semiarid areas of China [24], and the ecological environment is very sensitive and fragile [25]. In the context of long-term interference from climate change and high-intensity, large-scale human development and construction activities [26], the overall and systematic ecological degradation of the basin is prominent [25]; examples include the decline of natural grassland and wetland functions in the upper reaches [27], the severe soil erosion in the middle reaches [28], the numerous legacy problems in the downstream beaches, and the severe shrinkage of wetland areas in the estuarine delta [29,30]. The carbon balance of the Yellow River basin has a direct bearing on the realization of the “dual carbon” goals in China and has been the focus of much scholarly attention. Zhao et al. [31] applied a machine learning prediction model to predict these emissions and analyzed the influencing factors of carbon emissions in the Yellow River basin from the perspective of regional differences. Tian et al. [32] analyzed the temporal and spatial change processes of NPP in the Yellow River basin from 1981 to 2020 and its response to meteorological factors. These studies were limited to small areas of the Yellow River basin [29,33] or were focused on vegetation cover, NPP, NDVI, EVI (Enhanced Vegetation Index), etc. [34]. Carbon consumption by soil heterotrophic respiration has not been considered, and there has been less research on basin-scale NEP.
The aim of this research is to further clarify the spatial and temporal processes of the carbon budget at the basin scale and to explore the evolutionary mechanisms. This paper used remote sensing data to estimate the NEP due to the advantages of remote sensing technology, which has a macro-level range of detection and is less restricted by ground conditions. The main objectives and innovations of this study are as follows: (1) to analyze the spatiotemporal variation characteristics of NEP; (2) to identify the trends and dynamic procession persistence of NEP; and (3) to analyze the relationship of NEP variations with air temperature, precipitation, and land cover/use change—all in the Yellow River basin during the 2000–2020 period. The results are intended to provide data and technical support for the scientific assessment of the carbon sequestration capacity of Yellow River basin ecosystems and the development of policies/measures to address climate change.

2. Study Area and Data

2.1. Study Area

The Yellow River basin is located between 96–119°E and 32–42°N, is approximately 1900 km long from east to the west, and is approximately 1100 km wide from north to south, with a watershed area of approximately 79.5 × 10⁴ km2 (Figure 1). The Yellow River basin is vast, and the terrain is high in the west and low in the east. The upper reaches are in the high mountain range area, and they are mostly high-altitude woodland; the middle reaches include the Loess Plateau and Inner Mongolian Plateau, where the terrain is gentler with woodland and grassland; the lower reaches are plains landscape, and there are aboveground hanging rivers and a large proportion of arable land. The Yellow River basin is located in the midlatitude region, with a temperate monsoon climate, interannual precipitation variation, and spatial differences. The average annual precipitation is 400–600 mm, the average annual temperature is approximately 10 °C, the region is an important ecological barrier in northern China, and the basin serves as the main ecological corridor connecting the Qinghai–Tibet Plateau, Loess Plateau, and North China Plain. Thus, the ecological status of the basin is extremely important.

2.2. Data

The NPP data came from the MOD17A3HGF.006 dataset (annual NPP dataset) which was included in the Google Earth Engine (GEE) [35] platform database, with a resolution of 500 m for 2000–2020 (https://0-doi-org.brum.beds.ac.uk/10.5067/MODIS/MOD17A3HGF.006, accessed on 1 December 2021); image-related preprocessing was performed on GEE. Preprocessing included calling the NPP dataset, converting units for NPP bands, clipping the image, and downloading to local storage. The purpose of using the NPP dataset is to calculate NEP.
Please refer to the code for the specific preprocessing process (https://code.earthengine.google.com/c9ea4ebf6adcec964ac9e3a50004d3c1, accessed on 1 December 2021).
Meteorological data (air temperature data and precipitation data) were obtained from the National Earth System Science Data Center, National Science & Technology Infrastructure of China (http://www.geodata.cn/, accessed on 1 April 2022). The 1 km monthly mean air temperature dataset and monthly precipitation dataset for China from 1901 to 2020 were published in Earth System Science Data by Associate Researcher Shouzhang Peng [36]. These data have been updated to 2020. Both temperature and precipitation data are in raster format and were clipped and resampled to 500 m spatial resolution (consistent with NPP data) using ArcGIS Desktop. These data were used to calculate heterotrophic respiration and to conduct partial correlation analysis with NEP.
The land use data used were the “30 m annual land cover and its dynamics in China from 1990 to 2019 data” published in Earth System Science Data by Prof. Jie Yang and Xin Huang of Wuhan University [37]. These data have been updated to 2020 and made fully public (https://zenodo.org/record/5210928#.YcZ_nWBByUk, accessed on 1 June 2022).

3. Methodology

The overall technical process is shown in Figure 2. First, the heterotrophic respiration RH was calculated using the regression equation of soil microbial respiration carbon emissions from Pei et al. [38] and combining the total annual precipitation with the average annual temperature. On this basis, the NPP data of MODIS were captured and processed using the GEE platform [35], and the NEP was calculated and mapped year by year in combination with the NEP estimation model. Theil–Sen trend analysis [39,40] and the Mann–Kendall test [41] were used to analyze the spatial and temporal dynamics of the NEP and the trend degree [42]. We also used land use data and climate data to explore the driving mechanism of NEP and used the Hurst index [43,44] and Theil–Sen trend degree results to analyze the future development of NEP and complete the assessment of the future carbon sink potential of the Yellow River basin.

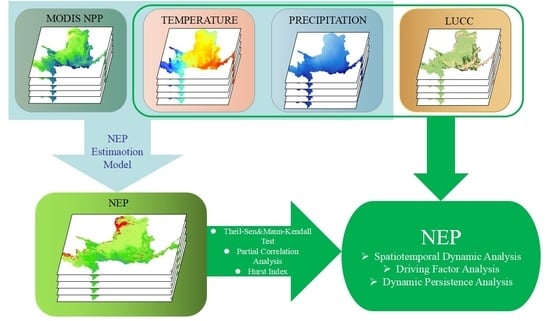
3.1. NEP Estimation Model

NEP was first proposed by Woodwell [45] as NPP minus the photosynthetic products consumed by heterotrophic respiration (soil respiration):
NEP = NPP − RH
where NPP is net primary productivity and RH is heterotrophic respiration.
NEP represents the net storage of carbon on a larger scale and can have positive or negative values. When NEP is greater than 0, it indicates that the ecosystem is a carbon sink, while values lower than 0 indicate that the ecosystem is a carbon source [46].
Soil microbial respiration carbon emissions were calculated from the regression equation of temperature, precipitation, and carbon emissions proposed by Pei et al. [38] with the following equation:
RH = 0.22 × (exp (0.0913T) + ln (0.3145R+ 1)) × 30 × 46.5%
where T denotes air temperature, R precipitation, 30 indicates the number of days because monthly meteorological data are used, and 46.5% is the fraction of soil carbon emissions released by microbial respiration [38]. At present, the estimation of heterotrophic respiration (RH) based on the model established by Pei et al. [38] has been applied and verified in different ecosystems in northeast and northwest China [47,48,49,50].

3.2. Theil–Sen Median Trend Analysis and Mann–Kendall Test

The spatial distribution of the NEP increase and decrease was obtained by combining the results of Theil–Sen trend analysis and the Mann–Kendall test [42]. The Theil–Sen median trend analysis method and Mann–Kendall test [34] were used to explain significant trends in the interannual variation in the NEP. The Theil–Sen trend analysis method is a nonparametric trend calculation method [39,40], and the Mann–Kendall test can remove outliers and is suitable for non-normally distributed sample data [41]. The combination of the Theil–Sen and Mann–Kendall methods for bilateral tests has become an important method for determining trends in long time-series data.
The Theil–Sen trend degree (β) is calculated as follows:
β = m e d i a n x j x i j i         1 < i < j < n
where n represents the span of the time series. In this study, we define n = 21; β is the slope of the similar element NEP regression equation, and xi and xj are the NEP time series. When β > 0, NEP has an increasing trend over time, and when β < 0, NEP has a decreasing trend over time. The results are tested for significance by the Mann–Kendall method.
The Mann–Kendall test is given as follows:
S = i = 1 n 1 j = n + 1 n s i g n ( x j x i )
where S is the test statistic and sign () is the sign function. The formula is calculated as follows:
s i g n ( x j x i ) = { 1                     ( x j x i > 0 ) 0                     ( x j x i = 0 ) 1             ( x j x i < 0 )
The trend test was performed using the test statistic Z, calculated as follows:
Z = { S 1 V a r ( S )               ( S > 0 )               0                       ( S = 0 ) S + 1 V a r ( S )                 ( S < 0 )
V a r ( S ) = n ( n 1 ) ( 2 n 5 ) 18
where xi and xj are the NEP time series and n is the number of samples. Z1−α/2 is found in the normal distribution table as the corresponding value at the confidence level α. The standardized Z value is a standard normal distribution, and the trend is considered significant if |Z|>Z1−α/2.
In this study, α = 0.05, i.e., |Z| > 1.96 indicates that the trend passed the significance-level test with a confidence level of 95% (p < 0.05). |Z| was used together with the Theil–Sen trend value to classify the spatial changes in NEP into four categories: significant decrease, slight decrease, slight increase, and significant increase. MATLAB software programming was used to implement the analysis of the interannual variation trend of NEP in the study area from 2001 to 2020.

3.3. Hurst Index

To analyze the persistence of NEP in the study area, the Hurst index based on the rescaled range analysis method (R/S) [43] was used in this study.
The Hurst index (H) is a valid indicator of the persistence of time series data [44], and it takes a value in the range of 0 < H < 1. Based on H, we can determine whether the time series data are completely random or have some persistence. When H = 0.5, the NEP time series data are not persistent, that is, they are not dependent on the past; when 0 < H < 0.5, the NEP time series data have inverse persistence, which means that the future changes are negatively correlated with the past; and when 0.5 < H < 1, the NEP time series data have persistence, which means that the future changes are consistent with the past. The closer the value of H is to 1, the stronger the persistence is; in contrast, the closer it is to 0, the stronger the inverse persistence is.
We use ArcMap Desktop 10.8 to couple the Hurst index calculation results with the Theil–Sen trend through the Mann–Kendall test to complete the dynamic process persistence analysis of NEP. The main tools we use include ‘Reclassify’ and ‘Raster Calculator’ in ‘Spatial Analyst Tools’.

4. Results

4.1. NEP Remote Sensing Mapping and Time Course in the Yellow River Basin

The dynamic map of the spatial distribution of NEP in the Yellow River basin from 2000 to 2020 is shown in Figure 3. The total NEP showed an overall fluctuating upward trend (Figure 4), with an annual average of 6.72 × 10⁻⁴ TgC and a growth rate of 1.51 × 10⁻⁴ TgCa−1. The variation range of the NEP was 4.24 × 10⁻⁴ to 8.51 × 10⁻⁴ TgC. The total NEP in 2017 was the highest at 8.51 × 10⁻⁴ TgC, which was 1.79 × 10⁻⁴ TgC above average, and it was the lowest in 2000 at 4.24 × 10⁻⁴ TgC, which was 2.48 × 10⁻⁴ TgC below average. As seen from the fluctuating increasing trend of the NEP in the Yellow River basin, the capacity of the Yellow River to sequester carbon increased during the 2000–2020 period.
The distribution of the annual average NEP unit area in the Yellow River basin varied significantly from 2000 to 2020 (Figure 3f). The annual mean NEP per unit area was 208.56 gCm−2a−1, and the area with a positive NEP accounted for 94.92%. Most of the Yellow River basin was a carbon sink area, in which the distribution area with an NEP per unit area of 200–300 gCm−2a−1 was the largest, accounting for approximately 25.25%. The areas with a higher NEP per unit area were mainly distributed in south-central Shaanxi Province (Baoji city, Xianyang city, Tongchuan city), east-central Gansu Province (Dingxi city, Tianshui city, Pingliang city), and central Henan Province (Sanmenxia city), which had values of approximately 300 gCm−2a−1 or more. The carbon source areas were mainly located in and around the Kubuqi Desert in the Inner Mongolia Autonomous Region. In addition, lake areas and major urban built-up areas (Xi’an urban area, Luoyang urban area, Zhengzhou urban area, etc.) in the basin were carbon source areas, which accounted for 5.08% of the total study area.

4.2. Spatial Variation Characteristics of NEP in the Yellow River Basin

Based on the Theil–Sen trend and the Mann–Kendall test, the spatial trends of NEP in the Yellow River basin from 2000 to 2020 and its change process were revealed by the meta-scale image (Figure 5). The results showed that the interannual variation trend of NEP per unit area in the Yellow River basin had obvious spatial variability with an increasing trend (increasing regional area > decreasing regional area). The Theil–Sen trend value for the NEP ranged from −23.37 to 43.66 gCm−2a−1, with 92.98% of values being positive and an average growth rate of 4.64 gCm−2a−1. In fact, 73.63% of areas had a significant increase in NEP, 19.57% had a slight increase, 5.96% had a slight decrease, and 0.84% had a significant decrease.
The area with a significant increase in NEP (Table 1) was mainly concentrated in the Loess Plateau area in the central part of the basin and downstream (Shandong section), where the comprehensive management of water and soil conservation in the Loess Plateau and the protection and restoration of wetlands in the Yellow River Delta have led to an increase in vegetation cover in the area. The areas that slightly increased were mainly concentrated in the border areas of Sichuan, Qinghai, and Gansu Provinces and the northwestern part of the Loess Plateau. The areas that significantly decreased accounted for the smallest proportion and were mainly distributed in the areas around the provincial capitals and at the mouth of the sea in the basin. The areas that slightly decreased were mainly concentrated in the Kubuqi Desert and the surrounding areas in the north of the basin, lakes, areas around the municipal districts of major cities in the basin (Xi’an and Zhengzhou), and near the mouths of rivers into the sea. The reasons for the significant decrease in urban NEP were mainly related to the increase in the level of urbanization and the expansion of built-up areas. The decrease in NEP at river inlets was mainly due to the destruction of vegetation around the inlets and the conversion of areas with large vegetation cover into offshore fishing grounds. In general, the carbon-sink capacity of the terrestrial ecosystem in the Yellow River basin increased from 2000 to 2020.

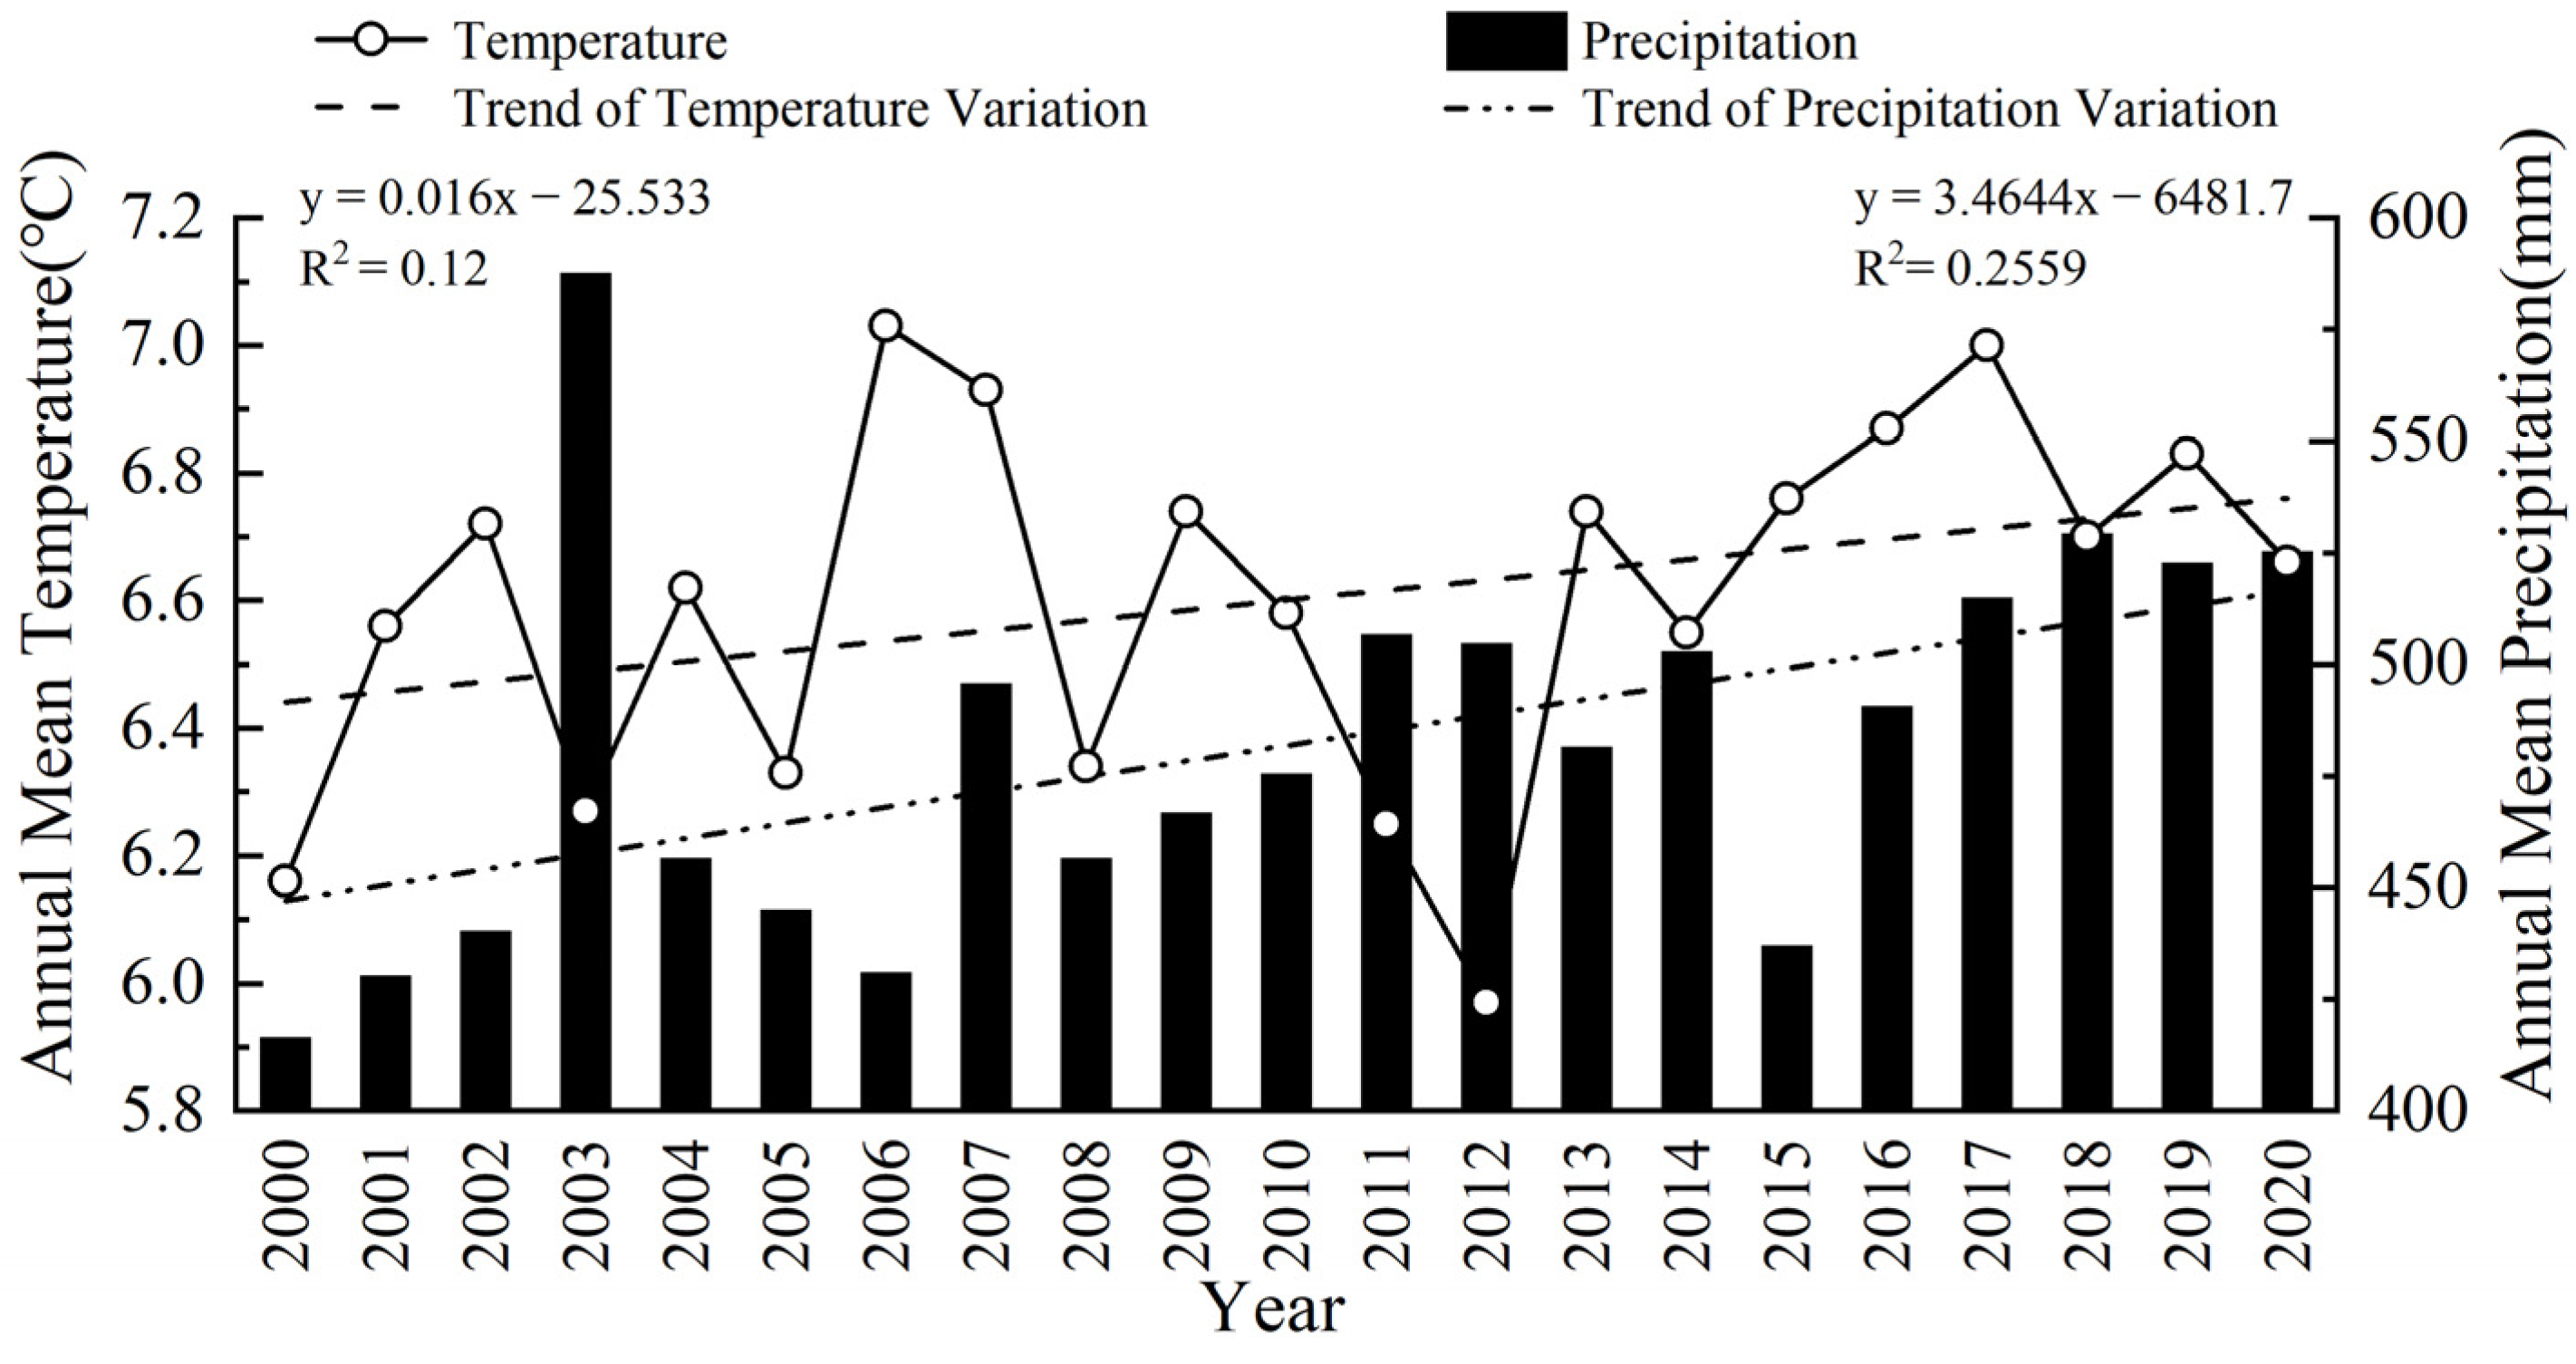
4.3. Relationship between NEP and Meteorological Factors in the Yellow River Basin

The annual precipitation and average annual temperature were selected as the meteorological factors used to explore the correlation between the NEP and meteorological factors in the Yellow River basin, and the variation characteristics of the meteorological factors are shown in Figure 6. The annual average temperature of the Yellow River basin from 2000 to 2020 ranged between 5.97 and 7.03 °C, with an average value of 6.60 °C, of which the average temperature in 2006 was the highest and the average temperature in 2012 was the lowest. The annual average temperature of the Yellow River basin during the 2000–2020 period showed a fluctuating upward trend, and the rate of increase was 0.16 °C/10 years. The average annual precipitation ranged from 416.52 mm to 587.70 mm, with an average value of 481.80 mm, where the highest average annual precipitation was in 2003 and the lowest value was in 2000; moreover, the average annual precipitation in the Yellow River basin showed a fluctuating upward trend during the 2000–2020 period, with a rate of increase of 34.644 mm/10 years.
The partial correlation between the NEP and annual mean temperature in the Yellow River basin for 2000–2020 was calculated at the pixel scale by fixing the effect of annual precipitation, and the results were tested for significance, as shown in Figure 7. The calculated results showed that the partial correlation coefficient of the NEP to temperature in the basin during the 2000–2020 period ranged from −1.00 to 0.93, with a mean value of 0.15. The mean value showed that there was a positive correlation between the NEP and annual mean temperature, indicating that the NEP in the Yellow River basin was higher in areas with higher temperatures. Among them, 77.31% of areas were positively correlated regions and 22.69% were negatively correlated regions. Among the positively correlated regions, those passing the significance level of the 0.05 test accounted for 11.96% and were mainly distributed downstream of the Yellow River in Shandong Province and upstream of the Yellow River in Gansu Province, in addition to sporadic distributions of areas in the northeastern and western parts of the study area. Among the negatively correlated regions, 12.84% passed the significance level of 0.05, mainly in the Kubuqi Desert and its surrounding areas in the northern part of the Yellow River basin.
The partial correlation between the NEP and annual precipitation in the Yellow River basin from 2000 to 2020 was calculated at the pixel scale by fixing the effect of mean annual temperature, and the results were tested for significance. The results show (Figure 8) that the partial correlation coefficient of NEP to annual precipitation ranged from −1.00 to 0.89, with a mean value of 0.27. Again, there was a positive correlation between the NEP and annual precipitation, and it was higher than the partial correlation coefficient of NEP to annual mean temperature. The percentage of positively correlated regions was 88.09%, and the percentage of negatively correlated regions was 11.91%. Among the positively correlated regions, 34.12% passed the significance level test of 0.05 and were distributed in most areas, such as the border of Shaanxi and Shanxi Provinces, the source area in the upper part of the basin, and the territories of Gansu and Ningxia in the middle stream. In addition, 35.82% of the negatively correlated areas passed the significance level of 0.05, similar to the annual average temperature, and these areas were also mainly located in the Kubuqi Desert and its surrounding areas in the northern part of the basin. In addition, there was a patchy distribution in the wetlands of lakes and major urban built-up areas in the watershed. The NEP in the Yellow River basin was positively correlated with mean annual temperature and annual precipitation, but the effect of annual precipitation on NEP in the basin was greater than that of mean annual temperature.

4.4. Relationship between NEP and LUCC in the Yellow River Basin

Land use is a manifestation of human activities, and land use/cover change (LUCC) is the main way in which human activities affect regional NEP; thus, the NEP capacity of different land use types varies significantly. Based on the land use data products with a spatial resolution of 30 m, the LUCC data of the study area from 2000 to 2020 were spatially overlaid to obtain the LUCC map of the Yellow River basin (Figure 9)—in which there were 39 types of LUCC units—and the areas where the percentage of change area was greater than 1% (accounting for 95.39% of the total change area) were extracted for a total of 10 change units (Table 2). Based on these 10 change units, the spatial variation in the NEP change in the watershed was studied.
We counted quantitative statistics on the conversion coefficients between each LUCC (Table 2), and a total of 118,253.49 km2 of land in the Yellow River basin changed in use from 2000 to 2020; in addition, the NEP in this part of the region increased by 1154.24 t. The conversion between the three land uses of grassland, forestland, and cropland accounted for 68.51%. The change from cropland to grassland was the largest unit of LUCC in the Yellow River basin during the 2000–2020 period—totaling 35,725.77 km2, accounting for 30.21% of the total area of change—and it was associated with an NEP increase of 413.31 t. Land use change from grassland to cropland accounted for 22.94% of the changed area, and the NEP increased by 320.60 t during the 2000–2020 period. There was 1397.77 km2 of forestland cleared to cropland, accounting for 1.18% of the changed area, and the total regional NEP increased by 20.91 t. In addition, 1871.11 km2 of forestland was converted to grassland, resulting in an NEP increase of 15.98 t.
Grassland reclamation exposes soil organic matter to air and promotes soil respiration, thus leading to an increase in soil carbon emissions. The restoration of forest ecosystems leads to an increase in aboveground biomass and an increase in soil organic carbon content, which is a carbon sink process, while deforestation is a carbon emission process. Returning farmland to forest and grassland is an important process to enhance the carbon-sink capacity, and the effect of returning farmland to forest is greater than that of returning farmland to grassland. During the 2000–2020 period, the area converted from cropland to forestland was 11,184.77 km2, the NEP increase was 180.70 t, and the increase in the unit area was 16,850.27 gckm−2. The area converted from cropland to grassland was 35,725.77 km2, the NEP increase was 413.31 t, and the increase in the unit area was 11,569.06 gCkm−2. In addition, the change from vegetation-covered areas—such as arable land, forestland, and grassland—to urban construction land and the changes brought about by the abandonment of cropland have caused the loss of regional NEP.

4.5. Analysis of Future Trends

The Hurst index is an important indicator that characterizes the strength of the dependence of future trends in time series data on past changes. The range of the NEP Hurst index in the Yellow River basin was 0.12–0.98 (Figure 10), with a mean value of 0.42. The proportion of NEP persistent sequences was only 17.46%, and the proportion of anti-persistent sequences was 82.54%. The normal distribution of the Hurst index of the Yellow River NEP (Figure 11) showed that the area shares of strong persistent, weak anti-persistent, weak persistent, and strong persistent were 0.96%, 81.58%, 17.36%, and 0.1%, respectively. The persistent trend of the multiyear NEP in the Yellow River basin was significantly smaller than the anti-persistent trend (the peak of the normal distribution was smaller than the mean and had a left-skewed trend); that is, the overall trend of the NEP in the Yellow River basin was unstable, and the area with persistent change was smaller. As shown in Figure 10, the persistent distribution area of the NEP in the Yellow River basin was mainly concentrated in the central part of the basin and most of the Henan section, while the rest was sporadically distributed in the downstream inlet and Qinling.
The NEP Hurst index of the Yellow River basin was coupled with the trend of Theil–Sen changes by the Mann–Kendall test to further explore the future development trend and persistent characteristics (persistent increase or decrease) of NEP in the Yellow River basin. According to the experimental results (Figure 12 and Table 3), the percentage of regions with persistence-increasing characteristics of NEP in the Yellow River basin was 15.76%, higher than the percentage of regions with persistence-decreasing characteristics (significant decrease and slight decrease), which was only 0.81%, and the rest of the regions were indeterminate (83.43%). The regions with persistent future NEP increases in the Yellow River basin were significantly higher than those with persistent decreases. Among the regions with persistent increases in NEP, “weak persistent-significant increases” (13.45%) were dominant, mainly in central and northern Shaanxi Province, Ningxia Hui Autonomous Region, southeastern Gansu Province and around Hohhot, followed by upstream and inlet delta areas. The “weak persistent-slight increase” area was dominated by the lower Henan section of the Yellow River, followed by a sporadic distribution on the Loess Plateau. Among the regions with a persistent decrease in NEP, a weak persistent decrease (0.78%) was dominant, mainly in the major cities and their surrounding areas downstream of the basin such as Zhengzhou city and Luoyang city, followed by the trend of a persistent decrease in NEP in the vicinity of Dongping Lake downstream. The majority of the Yellow River basin (83.43%) has uncertain NEP development in the future, which indicates that the stability of the Yellow River basin ecosystem still needs to be improved. The NEP in the areas of sustainable development is dominated by weak sustainability, which indicates that the carbon-sink capacity of some areas in the Yellow River basin will have a more stable trend to improve in the future.
In summary, the carbon-sink capacity of the terrestrial ecosystem in the Yellow River basin was generally enhanced during the 2000–2020 period, and the future development of the regional carbon sink persistence is large, while the future development of the NEP has regional uncertainty, and the stability of the basin ecosystem needs to be improved.

5. Discussion

5.1. Reliability of the NEP and Uncertainty Analysis

We used the NPP data product of MODIS as the basis for calculating NEP. The data set has been widely used in the research of carbon sink calculation [51,52] and ecological environment monitoring [53,54,55], and an R2 = 0.75 (p < 0.01) was found in previous studies in China area when comparing with ground observations [54]. The calculation of soil heterotrophic respiration (RH) uses the empirical model of Pei et al. [38], which is a regression equation of temperature, precipitation, and carbon emissions. The empirical model has also been widely used in the arid regions of northwest China [52,56] and even in Central Asia, and the results of heterotrophic respiration calculations have also been verified [21]. The precipitation and temperature data we used are published in the Earth System Science Data. The author used 496 independent meteorological observation points for verification, and the verification results are reliable [36]. Considering that the models and data were both widely used and verified, we did not set up a separate validation experiment to verify the accuracy of the calculated NEP. We believe that the calculated NEP results are reliable.
Uncertainty of the results mainly comes from the following aspects. (1) Spatial resolution factor: The spatial resolution of the MODIS NPP data we used is 500 m, while the spatial resolution of the temperature and precipitation data used to calculate RH is 1 km. Therefore, to unify the spatial resolution of NPP and RH, we resampled the temperature and precipitation data to a resolution of 500 m before calculating RH, which may cause a certain error between the calculated RH and the real situation. (2) Uncertainty of MODIS NPP: In areas with low productivity, the artificially high value of MODIS FPAR makes the value of MODIS products slightly higher. In high-productivity locations, MODIS products are often underestimated, which is mainly due to the low value for vegetation light-use efficiency in the MODIS GPP (Gross Primary Production) algorithm [57]. For this reason, there may be differences in NPP values in some regions, resulting in errors in NEP results. (3) Mixed-pixel problem. Although the land use data we used reached a spatial resolution of 30 m, the problem of mixed pixels cannot be avoided. For example, there is no obvious boundary between grassland and forestland, which will lead to errors when studying NEP changes caused by LUCC. Additionally, an increase or decrease in NEP does not usually cover the entire range of the grid cell.

5.2. Analysis of Influence Mechanism

By using partial correlation analysis, the results show that the partial correlation coefficient (mean 0.15, Figure 7) of NEP and temperature in the Yellow River basin is lower than that of NEP and precipitation (mean 0.27, Figure 8) (Table 4). This is consistent with the current research: the increase in temperature and precipitation will affect soil moisture and temperature, thus affecting the carbon flux of the ecosystem (precipitation plays a leading role in regulating the carbon flux of the ecosystem) [21,22].
On the one hand, the increase in temperature will promote the growth of plants and the life activities of soil microorganisms, thus increasing the photosynthesis and respiration intensity of the terrestrial ecosystem. At the same time, when the water required for plant physiological activities and soil respiration is insufficient due to the increase in ambient temperature, carbon emission and absorption in some terrestrial ecosystems will also be reduced [58].
On the other hand, the increase in precipitation will effectively improve the soil moisture content [59]. When soil moisture increases, the positive correlation between GPP and soil temperature increases. Therefore, under the same temperature conditions, the increase in precipitation will increase GPP. GPP provides substrates for plant roots, soil microbial activities, and soil respiration. More GPP will enhance ecosystem respiration. The increase in GPP caused by the increase in precipitation is stronger than the respiration of the ecosystem, which leads to an increase in the carbonsink of the ecosystem [58].
This paper studies the NEP changes affected by LUCC. From 2000 to 2020, a total NEP increase of 1154.24 t was caused by LUCC. LUCC is one of the most influential factors in the carbon cycle of terrestrial ecosystems [60]. In forest ecosystems, felling trees to transform them into farmland or grassland, harvesting wood, and other similar forestry management practices reduce the forest aboveground biomass and, thus, reduce the content of soil organic carbon [61]. Therefore, to increase the carbon-sink of the forest ecosystem, we can promote the restoration of the forest ecosystem by reducing deforestation, returning farmland to forests, and improving forest management [62,63] among other protective measures. In this process, increased vegetation cover can absorb more carbon in the atmosphere [11]. The impact of LUCC on the grassland carbon cycle is mainly reflected in its impact on soil carbon storage. Reclamation is the main way that human activities affect grassland carbon storage. Grassland reclamation makes the organic matter in the soil fully exposed to the air, promotes soil respiration, accelerates the decomposition of soil organic matter, and then releases the carbon stored in the soil, reducing the soil carbon storage [64,65]. When the forest is transformed into permanent farmland, the carbon storage of the soil surface will be reduced by approximately 30% [66]. The conversion of cultivated land to urban construction land is also a key process of LUCC’s impact on carbon emissions within agricultural ecosystems: the surface vegetation is uprooted, the soil is turned over and backfilled, and the original plant types are replaced by land impervious to water and land for greening, which reduces the carbon absorption capacity and affects the carbon fixation capacity [63].

5.3. Further Research Strategies and Improvement Suggestions

Through the analysis and discussion of the above results, we believe that improving the spatial and temporal scale of NPP data will play a decisive role in more accurate measurement of NEP. NPP estimation models include the statistical model Miami [67], process model BIOME-BGG [68], parameter model CASA (Carnegie–Ames–Stanford Approach) [21], etc. Among them, CASA is a light-use-efficiency method that takes remote sensing data as input parameters and considers the influence of internal and external dual factors. It is applicable to the dynamic monitoring of vegetation NPP on a macro spatial scale and long time-series. We considered using CASA in combination with Landsat, Sentinel, and other high-resolution remote sensing images to improve the spatial resolution of NPP data, and perform monthly and seasonal synthesis of NPP data. At the same time, the separation of crop-type vegetation from non-crop vegetation, and accurate compute the NPP of different vegetation types, was considered.
In terms of driving mechanisms, this study will not be limited to exploring the response of NEP changes to precipitation and temperature. We will add soil evapotranspiration [69], topographic, and other natural factors [70] to further explore the deep mechanisms of NEP change. Therefore, further research should widely collect actual monitoring data to estimate the NEP of the Yellow River basin more accurately. At the same time, we will also consider the impact of seasonal change factors [71], as well as human activities, meteorological, and topographic factors on NEP fluctuations. Therefore, we aimed to better understand the source and contribution mechanisms of the carbon cycle in the Yellow River basin.

6. Conclusions

Quantitative accounting of the spatial and temporal dynamics and uncertainties of the NEP in the Yellow River basin is of great practical significance and provides guidance for the high-quality development of the basin and the achievement of the dual carbon goals. The article adopted a quantitative NEP estimation model to realize a comprehensive calculation simulation of annual NEP in the Yellow River basin from 2000 to 2020 and conduct a mapping analysis of spatial and temporal change processes. On this basis, the coupling relationship between spatial and temporal changes in NEP and climate change and human activities was analyzed using bicorrelation techniques, and the uncertainty of spatial and temporal changes in NEP and future carbon-sink potential was explained. The following conclusions were obtained from the study:
(1) The total NEP in the Yellow River basin showed an overall upward increasing trend from 2000 to 2020, with an annual average value of 6.72 × 10⁻⁴ TgC. The Theil–Sen trend degree ranged from −23.37 to 43.66 gCm−2a−1, with an average growth rate of 4.64 gCm−2a−1 (p < 0.01, 2-tailed).
(2) The spatial distribution of the annual average NEP in the Yellow River basin varied significantly from 2000 to 2020. The annual average NEP per unit area was 208.56 gCm−2a−1. Most of the Yellow River basin (94.92%) was a carbon sink area, and the carbon source area was mainly distributed in the Kubuqi Desert and its surrounding areas. Some areas in Qinghai Province and the middle and lower reaches of the Yellow River were also carbon source areas, accounting for 5.08% of the total study area.
(3) The change in land use type was the main reason for the change in regional NEP, and climate change had an important impact on the watershed NEP. During the 2000–2020 period, a total of 118,253.49 km2 of land use types in the watershed changed, and the regional NEP increased by 1154.24 t. The restoration of forest ecosystems, returning cropland to forest, and returning cropland to grassland were the main land use change units that increased the NEP in the study area.
(4) There are uncertainties in the future development of NEP. Although the future carbon-sink capacity of some areas in the Yellow River basin will have a stable trend of improvement, simulation by Hurst index future persistence analysis showed that the regional anti-sustainability sequence accounted for a relatively large proportion of the area with uncertain change (83.43%).

Author Contributions

Conceptualization, K.Z. and C.Z.; methodology, K.Z., C.Z. and X.Z.; validation, K.Z., D.Y. and Y.S.; formal analysis, K.Z., X.M. and Y.S.; investigation, X.Z. and D.Y.; writing—original draft preparation, K.Z.; writing—review and editing, C.Z. All authors have read and agreed to the published version of the manuscript.

Funding

This research was funded by the Key Special Project of China’s National Key R&D Program (Grant No. 2021YFB3901301) and the Postgraduate Research and Practice Innovation Program of Jiangsu Normal University (Grant No. 2022XKT0072).

Data Availability Statement

Not applicable.

Acknowledgments

The authors would like to thank the anonymous reviewers for their valuable comments on the manuscript, which helped improve the quality of the paper.

Conflicts of Interest

The authors declare no conflict of interest. The funders had no role in the design of the study; in the collection, analyses, or interpretation of data; in the writing of the manuscript; or in the decision to publish the results.

References

  1. Yu, D.Y.; Shi, P.J.; Shao, H.B.; Zhu, W.Q.; Pan, Y.H. Modelling net primary productivity of terrestrial ecosystems in East Asia based on an improved CASA ecosystem model. Int. J. Remote Sens. 2009, 30, 4851–4866. [Google Scholar] [CrossRef]
  2. Wieder, W.R.; Cleveland, C.C.; Smith, W.K.; Todd-Brown, K. Future productivity and carbon storage limited by terrestrial nutrient availability. Nat. Geosci. 2015, 8, 441–444. [Google Scholar] [CrossRef]
  3. Ge, W.Y.; Deng, L.Q.; Wang, F.; Han, J.Q. Quantifying the contributions of human activities and climate change to vegetation net primary productivity dynamics in China from 2001 to 2016. Sci. Total Environ. 2021, 773, 145648. [Google Scholar] [CrossRef] [PubMed]
  4. Catovsky, S.; Bradford, M.A.; Hector, A. Biodiversity and ecosystem productivity: Implications for carbon storage. Oikos 2002, 97, 443–448. [Google Scholar] [CrossRef]
  5. Ehman, J.L.; Schmid, H.P.; Grimmond, C.; Randolph, J.C.; Hanson, P.J.; Wayson, C.A.; Cropley, F.D. An initial intercomparison of micrometeorological and ecological inventory estimates of carbon exchange in a mid-latitude deciduous forest. Glob. Chang. Biol. 2002, 8, 575–589. [Google Scholar] [CrossRef]
  6. Russon, T.; Paillard, D.; Elliot, M. Potential origins of 400–500 kyr periodicities in the ocean carbon cycle: A box model approach. Glob. Biogeochem. Cycles 2010, 24, GB2013. [Google Scholar] [CrossRef] [Green Version]
  7. Huotari, J.; Ojala, A.; Peltomaa, E.; Nordbo, A.; Launiainen, S.; Pumpanen, J.; Rasilo, T.; Hari, P.; Vesala, T. Long-term direct CO2 flux measurements over a boreal lake: Five years of eddy covariance data. Geophys. Res. Lett. 2011, 38, L18401. [Google Scholar] [CrossRef]
  8. Li, Y.; Xiong, L.; Zhu, W. A Carbon Cycle Model for the Social-Ecological Process in Coastal Wetland: A Case Study on Gouqi Island, East China. Scientifica 2017, 2017, 5194970. [Google Scholar] [CrossRef] [Green Version]
  9. Han, Q.F.; Luo, G.P.; Li, C.F.; Xu, W.Q. Modeling the grazing effect on dry grassland carbon cycling with Biome-BGC model. Ecol. Complex. 2014, 17, 149–157. [Google Scholar] [CrossRef]
  10. Dokoohaki, H.; Morrison, B.D.; Raiho, A.; Serbin, S.P.; Zarada, K.; Dramko, L.; Dietze, M. Development of an open-source regional data assimilation system in PEcAn v. 1.7.2: Application to carbon cycle reanalysis across the contiguous US using SIPNET. Geosci. Model Dev. 2022, 15, 3233–3252. [Google Scholar] [CrossRef]
  11. Fang, J.Y.; Guo, Z.D.; Piao, S.L.; Chen, A.P. Terrestrial vegetation carbon sinks in China, 1981–2000. Sci. China Ser. D-Earth Sci. 2007, 50, 1341–1350. [Google Scholar] [CrossRef]
  12. Grant, R.F.; Baldocchi, D.D.; Ma, S. Ecological controls on net ecosystem productivity of a seasonally dry annual grassland under current and future climates: Modelling with ecosys. Agr. For. Meteorol. 2012, 152, 189–200. [Google Scholar] [CrossRef]
  13. Zhang, L.; Ren, X.L.; Wang, J.B.; He, H.L.; Wang, S.Q.; Wang, M.M.; Piao, S.L.; Yan, H.; Ju, W.M.; Gu, F.X.; et al. Interannual variability of terrestrial net ecosystem productivity over China: Regional contributions and climate attribution. Environ. Res. Lett. 2019, 14, 014003. [Google Scholar] [CrossRef]
  14. Dimitrov, D.D.; Grant, R.F.; Lafleur, P.M.; Humphreys, E.R. Modeling the effects of hydrology on gross primary productivity and net ecosystem productivity at Mer Bleue bog. J. Geophys. Res.-Biogeosci. 2011, 116, G04010. [Google Scholar] [CrossRef] [Green Version]
  15. Thomas, C.K.; Law, B.E.; Irvine, J.; Martin, J.G.; Pettijohn, J.C.; Davis, K.J. Seasonal hydrology explains interannual and seasonal variation in carbon and water exchange in a semiarid mature ponderosa pine forest in central Oregon. J. Geophys. Res.-Biogeosci. 2009, 114, G04006. [Google Scholar] [CrossRef] [Green Version]
  16. Lin, M.Y.; Hsieh, I.F.; Lin, P.H.; Laplace, S.; Ohashi, M.; Chen, T.H.; Kume, T. Moso bamboo (Phyllostachys pubescens) forests as a significant carbon sink? A case study based on 4-year measurements in central Taiwan. Ecol. Res. 2017, 32, 845–857. [Google Scholar] [CrossRef]
  17. Elbers, J.A.; Jacobs, C.; Kruijt, B.; Jans, W.; Moors, E.J. Assessing the uncertainty of estimated annual totals of net ecosystem productivity: A practical approach applied to a mid latitude temperate pine forest. Agric. Forest Meteorol. 2011, 151, 1823–1830. [Google Scholar] [CrossRef]
  18. Mekonnen, Z.A.; Grant, R.F.; Schwalm, C. Sensitivity of modeled NEP to climate forcing and soil at site and regional scales: Implications for upscaling ecosystem models. Ecol. Model. 2016, 320, 241–257. [Google Scholar] [CrossRef] [Green Version]
  19. Piao, S.L.; Tan, K.; Nan, H.J.; Ciais, P.; Fang, J.Y.; Wang, T.; Vuichard, N.; Zhu, B.A. Impacts of climate and CO2 changes on the vegetation growth and carbon balance of Qinghai-Tibetan grasslands over the past five decades. Glob. Planet. Chang. 2012, 98–99, 73–80. [Google Scholar] [CrossRef]
  20. Lu, X.L.; Zhuang, Q.L. Evaluating climate impacts on carbon balance of the terrestrial ecosystems in the Midwest of the United States with a process-based ecosystem model. Mitig. Adapt. Strateg. Glob. Chang. 2010, 15, 467–487. [Google Scholar] [CrossRef]
  21. Zhang, J.; Hao, X.; Hao, H.; Fan, X.; Li, Y. Climate Change Decreased Net Ecosystem Productivity in the Arid Region of Central Asia. Remote Sens. 2021, 13, 4449. [Google Scholar] [CrossRef]
  22. Li, G.; Han, H.; Du, Y.; Hui, D.; Xia, J.; Niu, S.; Li, X.; Wan, S. Effects of warming and increased precipitation on net ecosystem productivity: A long-term manipulative experiment in a semiarid grassland. Agric. For. Meteorol. 2017, 232, 359–366. [Google Scholar] [CrossRef]
  23. Hao, J.H.; Gao, F.; Fang, X.Y.; Nong, X.L.; Zhang, Y.X.; Hong, F. Multi-factor decomposition and multi-scenario prediction decoupling analysis of China’s carbon emission under dual carbon goal. Sci. Total Environ. 2022, 841, 156788. [Google Scholar] [CrossRef] [PubMed]
  24. Zhao, X.Y.; Xia, H.M.; Pan, L.; Song, H.Q.; Niu, W.H.; Wang, R.M.; Li, R.M.; Bian, X.Q.; Guo, Y.; Qin, Y.C. Drought Monitoring over Yellow River Basin from 2003-2019 Using Reconstructed MODIS Land Surface Temperature in Google Earth Engine. Remote Sens. 2021, 13, 3748. [Google Scholar] [CrossRef]
  25. Li, T.T.; Zhang, Q.; Singh, V.P.; Zhao, J.Q.; Song, J.B.; Sun, S.; Wang, G.; Shen, Z.X.; Wu, W.H. Identification of Degradation Areas of Ecological Environment and Degradation Intensity Assessment in the Yellow River Basin. Front. Earth Sci. 2022, 10, 1220. [Google Scholar] [CrossRef]
  26. Fan, Y.S.; Chen, S.L.; Zhao, B.; Yu, S.B.; Ji, H.Y.; Jiang, C. Monitoring tidal flat dynamics affected by human activities along an eroded coast in the Yellow River Delta, China. Environ. Monit. Assess. 2018, 190, 396. [Google Scholar] [CrossRef]
  27. Jin, X.Y.; Jin, H.J.; Luo, D.L.; Sheng, Y.; Wu, Q.B.; Wu, J.C.; Wang, W.H.; Huang, S.; Li, X.Y.; Liang, S.H.; et al. Impacts of Permafrost Degradation on Hydrology and Vegetation in the Source Area of the Yellow River on Northeastern Qinghai-Tibet Plateau, Southwest China. Front. Earth Sci. 2022, 10, 845824. [Google Scholar] [CrossRef]
  28. Yin, Z.T.; Chang, J.; Huang, Y. Multiscale Spatiotemporal Characteristics of Soil Erosion and Its Influencing Factors in the Yellow River Basin. Water 2022, 14, 2658. [Google Scholar] [CrossRef]
  29. Li, Y.Q.; Li, J.R.; Jiao, S.Y.; Li, Y.; Xu, Z.Y.; Kong, B.H. Ecosystem-scale carbon allocation among different land uses: Implications for carbon stocks in the Yellow River Delta. Ecosphere 2020, 11, e03125. [Google Scholar] [CrossRef]
  30. Zhu, C.M.; Zhang, X.; Huang, Q.H. Four Decades of Estuarine Wetland Changes in the Yellow River Delta Based on Landsat Observations Between 1973 and 2013. Water 2018, 10, 933. [Google Scholar] [CrossRef]
  31. Zhao, J.J.; Kou, L.; Wang, H.T.; He, X.Y.; Xiong, Z.H.; Liu, C.Q.; Cui, H. Carbon Emission Prediction Model and Analysis in the Yellow River Basin Based on a Machine Learning Method. Sustainability 2022, 14, 6153. [Google Scholar] [CrossRef]
  32. Tian, H.W.; Ji, X.J.; Zhang, F.M. Spatiotemporal Variations of Vegetation Net Primary Productivity and Its Response to Meteorological Factors Across the Yellow River Basin During the Period 1981–2020. Front. Environ. Sci. 2022, 10, 1981–2020. [Google Scholar] [CrossRef]
  33. Bu, X.Y.; Cui, D.; Dong, S.C.; Mi, W.B.; Li, Y.; Li, Z.G.; Feng, Y.L. Effects of Wetland Restoration and Conservation Projects on Soil Carbon Sequestration in the Ningxia Basin of the Yellow River in China from 2000 to 2015. Sustainability 2020, 12, 10284. [Google Scholar] [CrossRef]
  34. Jiang, W.G.; Yuan, L.H.; Wang, W.J.; Cao, R.; Zhang, Y.F.; Shen, W.M. Spatio-temporal analysis of vegetation variation in the Yellow River Basin. Ecol. Indic. 2015, 51, 117–126. [Google Scholar] [CrossRef]
  35. Gorelick, N.; Hancher, M.; Dixon, M.; Ilyushchenko, S.; Thau, D.; Moore, R. Google Earth Engine: Planetary-scale geospatial analysis for everyone. Remote Sens. Environ. 2017, 202, 18–27. [Google Scholar] [CrossRef]
  36. Peng, S.Z.; Ding, Y.X.; Liu, W.Z.; Li, Z. 1 km monthly temperature and precipitation dataset for China from 1901 to 2017. Earth Syst. Sci. Data 2019, 11, 1931–1946. [Google Scholar] [CrossRef] [Green Version]
  37. Yang, J.; Huang, X. The 30 m annual land cover dataset and its dynamics in China from 1990 to 2019. Earth Syst. Sci. Data 2021, 13, 3907–3925. [Google Scholar] [CrossRef]
  38. Pei, Z.Y.; Ouyang, H.; Zhou, C.P.; Xu, X.L. Carbon Balance in an Alpine Steppe in the Qinghai-Tibet Plateau. J. Integr. Plant Biol. 2009, 51, 521–526. [Google Scholar] [CrossRef]
  39. Theil, H. A rank-invariant method of linear and polynomial regression analysis. Indag. Math. 1950, 12, 173. [Google Scholar]
  40. Sen, P.K. Estimates of the regression coefficient based on Kendall’s tau. J. Am. Stat. Assoc. 1968, 63, 1379–1389. [Google Scholar] [CrossRef]
  41. Tošić, I. Spatial and temporal variability of winter and summer precipitation over Serbia and Montenegro. Theor. Appl. Climatol. 2004, 77, 47–56. [Google Scholar] [CrossRef]
  42. Cai, B.F.; Yu, R. Advance and evaluation in the long time series vegetation trends research based on remote sensing. J. Remote Sens. 2009, 13, 1170–1186. [Google Scholar]
  43. Black, R.P.; Simaika, Y.M.; Hurst, H.E. Long-Term Storage, an Experimental Study; Constable: London, UK, 1965. [Google Scholar]
  44. Huo, Y.; Wang, L.C.; Chen, X.L.; Meng, H.H. Long-term trend and persistence of precipitation over Lake Poyang basin since 1950s. J. Lake Sci. 2011, 23, 454–462. [Google Scholar]
  45. Woodwell, G.M.; Whittaker, R.H.; Reiners, W.A.; Likens, G.E.; Delwiche, C.C.; Botkin, D.B. The biota and the world carbon budget. Science 1978, 199, 141–146. [Google Scholar] [CrossRef] [PubMed]
  46. Tian, H.Q.; Melillo, J.; Lu, C.Q.; Kicklighter, D.; Liu, M.L.; Ren, W.; Xu, X.F.; Chen, G.S.; Zhang, C.; Pan, S.F.; et al. China’s terrestrial carbon balance: Contributions from multiple global change factors. Glob. Biogeochem. Cycles 2011, 25, GB1007. [Google Scholar] [CrossRef] [Green Version]
  47. Gong, J.; Zhang, Y.; Qian, C.Y. Temporal and spatial distribution of net ecosystem productivity in the Bailongjiang Watershed of Gansu Province. Acta Ecolofica Sin. 2017, 15, 5121–5128. [Google Scholar]
  48. Tang, J.; Jiang, Y.; Li, Z.Y.; Zhang, N.; Hu, M. Estimation of vegetation net primary productivity and carbon sink in western Jilin province based on CASA model. J. Arid. Land Resour. Environ. 2013, 27, 1–7. [Google Scholar]
  49. Zhang, L.; Wang, J.; Shi, R.H. Temporal-spatial variations of carbon sink/source in Northeast China from 2000 to 2020. J. East China Norm. Univ. 2015, 04, 164–173. [Google Scholar]
  50. Pan, J.H.; Wen, Y. Estimation and spatial-temporal characteristics of carbon sink in the arid region of northwest China. Acta Ecol. Sin. 2015, 35, 7718–7728. [Google Scholar]
  51. Zhang, J.; Liu, C.; Hao, H.; Sun, L.; Qiao, Q.; Wang, H.; Ning, Y. Spatial-temporal change of carbon storage and carbon sink of grassland ecosystem in the Three-River Headwaters Region based on MODIS GPP/NPP data. Ecol. Environ. Sci. 2015, 24, 8–13. [Google Scholar]
  52. Wang, C.; Zhao, W.; Zhang, Y. The Change in Net Ecosystem Productivity and its Driving Mechanism in a Mountain Ecosystem of Arid Regions, Northwest China. Remote Sens. 2022, 14, 4046. [Google Scholar] [CrossRef]
  53. Peng, Q.; Wang, R.; Jiang, Y.; Li, C. Contributions of climate change and human activities to vegetation dynamics in Qilian Mountain National Park, northwest China. Glob. Ecol. Conserv. 2021, 32, e01947. [Google Scholar] [CrossRef]
  54. Liu, G.; Shao, Q.; Fan, J.; Ning, J.; Rong, K.; Huang, H.; Liu, S.C.; Zhang, X.Y.; Niu, L.; Liu, J. Change Trend and Restoration Potential of Vegetation Net Primary Productivity in China over the Past 20 Years. Remote Sens. 2022, 14, 1634. [Google Scholar] [CrossRef]
  55. Zhang, Y.; Xu, M.; Chen, H.; Adams, J. Global pattern of NPP to GPP ratio derived from MODIS data: Effects of ecosystem type, geographical location and climate. Glob. Ecol. Biogeogr. 2009, 18, 280–290. [Google Scholar] [CrossRef]
  56. Li, X.; Lin, G.; Jiang, D.; Fu, J.; Wang, Y. Spatiotemporal Evolution Characteristics and the Climatic Response of Carbon Sources and Sinks in the Chinese Grassland Ecosystem from 2010 to 2020. Sustainability 2022, 14, 8461. [Google Scholar] [CrossRef]
  57. Turner, D.P.; Ritts, W.D.; Cohen, W.B.; Gower, S.T.; Running, S.W.; Zhao, M.; Costa, M.H.; Krischbaum, A.A.; Ham, J.M.; Saleska, S.R.; et al. Evaluation of MODIS NPP and GPP products across multiple biomes. Remote Sens. Environ. 2006, 102, 282–292. [Google Scholar] [CrossRef]
  58. Niu, S.; Wu, M.; Han, Y.; Xia, J.; Li, L.; Wan, S. Water-mediated responses of ecosystem carbon fluxes to climatic change in a temperate steppe. New Phytol. 2008, 177, 209–219. [Google Scholar] [CrossRef]
  59. Parton, W.; Morgan, J.; Smith, D.; Del Grosso, S.; Prihodko, L.; LeCain, D.; Kelly, R.; Lutz, S. Impact of precipitation dynamics on net ecosystem productivity. Glob. Chang. Biol. 2012, 18, 915–927. [Google Scholar] [CrossRef]
  60. Watson, R.T.; Noble, I.R.; Bolin, B.; Ravindranath, N.H.; Verardo, D.J.; Dokken, D.J. Land Use, Land-Use Change and Forestry: A Special Report of the Intergovernmental Panel on Climate Change; Cambridge University Press: Cambridge, UK, 2000. [Google Scholar]
  61. Houghton, R.A. Carbon emissions and the drivers of deforestation and forest degradation in the tropics. Curr. Opin. Environ. Sustain. 2012, 4, 597–603. [Google Scholar] [CrossRef]
  62. Cantarello, E.; Newton, A.C.; Hill, R.A. Potential effects of future land-use change on regional carbon stocks in the UK. Environ. Sci. Policy 2011, 14, 40–52. [Google Scholar] [CrossRef]
  63. Mitchard, E.T. The tropical forest carbon cycle and climate change. Nature 2018, 559, 527–534. [Google Scholar] [CrossRef] [PubMed] [Green Version]
  64. Guo, L.B.; Gifford, R.M. Soil carbon stocks and land use change: A meta analysis. Glob. Chang. Biol. 2002, 8, 345–360. [Google Scholar] [CrossRef]
  65. Paustian, K.; Killian, K.; Cipra, J.; Elliott, E.T.; Bluhm, G.; Smith, J.L. Modeling and regional assessment of soil carbon: A case study of the Conservation Reserve Program. SSSA Spec. Publ. 2001, 57, 207–226. [Google Scholar]
  66. Ostle, N.J.; Levy, P.E.; Evans, C.D.; Smith, P. UK land use and soil carbon sequestration. Land Use Policy 2009, 26, S274–S283. [Google Scholar] [CrossRef]
  67. Lieth, H.; Whittaker, R.H. (Eds.) Primary Productivity of the Biosphere; Springer Science & Business Media: Berlin/Heidelberg, Germany, 2012. [Google Scholar]
  68. Running, S.W.; Hunt, E.R., Jr. Generalization of a forest ecosystem process model for other biomes, BIOME−BCG, and an application for global-scale models. In Scaling Physiological Processes: Leaf to Globe; Academic Press: Cambridge, MA, USA, 1993. [Google Scholar]
  69. Domec, J.C.; King, J.S.; Noormets, A.; Treasure, E.; Gavazzi, M.J.; Sun, G.; McNulty, S.G. Hydraulic redistribution of soil water by roots affects whole-stand evapotranspiration and net ecosystem carbon exchange. New Phytol. 2010, 187, 171–183. [Google Scholar] [CrossRef]
  70. Yimer, F.; Ledin, S.; Abdelkadir, A. Soil organic carbon and total nitrogen stocks as affected by topographic aspect and vegetation in the Bale Mountains, Ethiopia. Geoderma 2006, 135, 335–344. [Google Scholar] [CrossRef]
  71. Piao, S.; Ciais, P.; Friedlingstein, P.; Peylin, P.; Reichstein, M.; Luyssaert, S.; Margolis, H.; Fang, J.Y.; Barr, A.; Chen, A.; et al. Net carbon dioxide losses of northern ecosystems in response to autumn warming. Nature 2008, 451, 49–52. [Google Scholar] [CrossRef]
Figure 1. Location of the Yellow River basin (including digital elevation information of the Yellow River basin and provincial capital cities in the basin).
Remotesensing 15 00323 g001
Figure 2. Research framework of spatiotemporal variation in carbon sources/sinks.
Remotesensing 15 00323 g002
Figure 3. Spatial distribution and annual average NEP values ((ae) respectively represent the spatial distribution of NEP values in 2000/2005/2010/2015/2020. The NEP values are classified by 100 intervals, and (f) is the mean value).
Remotesensing 15 00323 g003
Figure 4. Temporal rate of variation in the total NEP in the Yellow River basin, 2000–2020 (Scatter plot of NEP total amount year by year, including linear fitting trend and 95% confidence interval).
Remotesensing 15 00323 g004
Figure 5. Trend and significance test of NEP ((a) shows Theil–Sen trend chart of NEP, and (b) shows Theil–Sen trend results through MK test).
Remotesensing 15 00323 g005
Figure 6. The trends of annual precipitation and average annual temperature.
Remotesensing 15 00323 g006
Figure 7. Partial correlation coefficient and significance test results of NEP and temperature. (a) The partial correlation coefficient between NEP and temperature divided into 10 categories according to equal intervals. (b) The grading results passing the significance (95%) test.
Remotesensing 15 00323 g007
Figure 8. Partial correlation coefficient and significance test results of NEP and precipitation. (a) The partial correlation coefficient between NEP and precipitation, divided into 10 categories according to equal intervals. (b) The grading results passing the significance (95%) test.
Remotesensing 15 00323 g008
Figure 9. LUCC of the Yellow River basin from 2000 to 2020. We choose the Sankey picture as the visualization of LUCC. The Sankey picture represents a visual result of energy flow. Here, the total area of the study area is taken as an energy flow, and its value does not change between 2000 and 2020. Different land cover types changed during this period. The curve from left to right represents the flow direction of land use type, from type A to type B. The width of the curve represents the area of LUCC.
Remotesensing 15 00323 g009
Figure 10. NEP Hurst index and persistence characteristics distribution. (a) Calculation results of the Hurst index of NEP, displayed in 10 levels. (b) Hurst index results through the significance test and the hierarchical display. We call it ‘Persistence of NEP’.
Remotesensing 15 00323 g010
Figure 11. Normal distribution chart of the NEP Hurst index. According to the definition of the Hurst index; we take 0.5 as the dividing line. Parts larger than 0.5 are called ‘Persistent Series’, and parts smaller than 0.5 are called ‘Anti-Persistent Series’; at the same time, we have further classified them. In the ‘Persistent Series’, 0.5~0.75 parts are defined as ‘Weak Persistent’, and 0.75~1.00 parts are defined as ‘Strong Persistent’; In the ‘Anti-Persistent Series’, the 0.25~0.5 parts are defined as ‘Weak anti-Persistent’, and the 0.00~0.25 parts are defined as ‘Strong anti-Persistent’.
Remotesensing 15 00323 g011
Figure 12. Distribution of future persistent changes in NEP.
Remotesensing 15 00323 g012
Table 1. The variation trend of NEP in the Yellow River basin.
The Variation Trend of NEPTypeArea/km2Percent/%
Theil–Sen TrendZ Value
Theil–Sen trend > 0|Z| > 1.96Significant Increase594,071.7573.63
Theil–Sen trend ≥ 0|Z| ≤ 1.96Slight Increase157,913.7519.57
Theil–Sen trend < 0|Z| > 1.96Significant Decrease67560.84
Theil–Sen trend < 0|Z| ≤ 1.96Slight Decrease48,065.255.96
Table 2. LUCC and its impact on NEP in the Yellow River basin from 2000 to 2020.
LUCC (2000–2020)Area/km2RatioCumulative PercentageNEP Variable Quantity/t
Cropland–Grassland35,725.7730.21%30.21%413.31
Grassland–Cropland27,125.9422.94%53.15%320.60
Barren–Grassland14,389.3612.17%65.32%57.52
Grassland–Forest11,184.779.46%74.78%180.70
Cropland–Impervious8787.547.43%82.21%50.76
Grassland–Barren6918.055.85%88.06%10.35
Cropland–Forest3714.223.14%91.20%62.59
Forest–Grassland1871.111.58%92.78%15.98
Grassland–Impervious1688.481.43%94.21%8.70
Forest–Cropland1397.771.18%95.39%20.91
Table 3. Statistical results of NEP trends and the Hurst index.
The Trend of NEPZ valueHurst ValueTypeArea/km2Percent/%
Theil–Sen trend < 0|Z| > 1.96>0.75Strong Persistent–Significant decrease1300.02%
Theil–Sen trend < 0|Z| ≤ 1.96>0.75Strong Persistent–Slight decrease1130.01%
Theil–Sen trend < 0|Z| ≤ 1.960.5 < H < 0.75Weak Persistent–Slight decrease4157.250.52%
Theil–Sen trend < 0|Z| > 1.960.5 < H < 0.75Weak Persistent–Significant decrease2079.750.26%
Theil–Sen trend > 0|Z| > 1.96>0.75Strong Persistent–Significant increase235.50.03%
Theil–Sen trend > 0|Z| ≤ 1.96>0.75Strong Persistent–Slight increase900.01%
Theil–Sen trend > 0|Z| ≤ 1.960.5 < H < 0.75Weak Persistent–Slight increase18,4732.29%
Theil–Sen trend > 0|Z| > 1.960.5 < H < 0.75Weak Persistent–Significant increase108,28613.43%
————<0.5Uncertain Future Changes672,98683.43%
Table 4. Area statistics of correlation between meteorological factors and NEP.
Meteorological FactorCorrelation with NEPAreas
temperaturepositive correlation632,494.75 km2 (74,617.5 km2 pass the significance test)
negative correlation174,311.75 km2 (23,498 km2 pass the significance test)
precipitationpositive correlation714,109 km2 (242,501.25 km2 pass the significance test)
negative correlation92,697.5 km2 (34,406.25 km2 pass the significance test)
Disclaimer/Publisher’s Note: The statements, opinions and data contained in all publications are solely those of the individual author(s) and contributor(s) and not of MDPI and/or the editor(s). MDPI and/or the editor(s) disclaim responsibility for any injury to people or property resulting from any ideas, methods, instructions or products referred to in the content.

