

UAV Thermal Imaging for Unexploded Ordnance Detection by Using Deep Learning

1
Department of IT and Computer Sciences, Zagreb University of Applied Sciences, 10000 Zagreb, Croatia
2
Institute of Computer Science, Faculty of Electrical Engineering and Computer Science, University of Maribor, 2000 Maribor, Slovenia
*
Author to whom correspondence should be addressed.
Remote Sens. 2023, 15(4), 967; https://0-doi-org.brum.beds.ac.uk/10.3390/rs15040967
Submission received: 21 December 2022
/
Revised: 19 January 2023
/
Accepted: 6 February 2023
/
Published: 9 February 2023
(This article belongs to the Special Issue Single and Multi-UAS-Based Remote Sensing and Data Fusion)
Abstract
:A few promising solutions for thermal imaging Unexploded Ordnance (UXO) detection were proposed after the start of the military conflict in Ukraine in 2014. At the same time, most of the landmine clearance protocols and practices are based on old, 20th-century technologies. More than 60 countries worldwide are still affected by explosive remnants of war, and new areas are contaminated almost every day. To date, no automated solutions exist for surface UXO detection by using thermal imaging. One of the reasons is also that there are no publicly available data. This research bridges both gaps by introducing an automated UXO detection method, and by publishing thermal imaging data. During a project in Bosnia and Herzegovina in 2019, an organisation, Norwegian People’s Aid, collected data about unexploded ordnances and made them available for this research. Thermal images with a size of 720 × 480 pixels were collected by using an Unmanned Aerial Vehicle at a height of 3 m, thus achieving a very small Ground Sampling Distance (GSD). One of the goals of our research was also to verify if the explosive war remnants’ detection accuracy could be improved further by using Convolutional Neural Networks (CNN). We have experimented with various existing modern CNN architectures for object identification, whereat the YOLOv5 model was selected as the most promising for retraining. An eleven-class object detection problem was solved primarily in this study. Our data were annotated semi-manually. Five versions of the YOLOv5 model, fine-tuned with a grid-search, were trained end-to-end on randomly selected 640 training and 80 validation images from our dataset. The trained models were verified on the remaining 88 images from our dataset. Objects from each of the eleven classes were identified with more than 90% probability, whereat the Mean Average Precision (mAP) at a 0.5 threshold was 99.5%, and the mAP at thresholds from 0.5 to 0.95 was 87.0% up to 90.5%, depending on the model’s complexity. Our results are comparable to the state-of-the-art, whereat these object detection methods have been tested on other similar small datasets with thermal images. Our study is one of the few in the field of Automated UXO detection by using thermal images, and the first that solves the problem of identifying more than one class of objects. On the other hand, publicly available thermal images with a relatively small GSD will enable and stimulate the development of new detection algorithms, where our method and results can serve as a baseline. Only really accurate automatic UXO detection solutions will help to solve one of the least explored worldwide life-threatening problems.
1. Introduction
Thermal imaging is a non-contact method in which the radiation pattern of an object is converted into a visible image called a thermal image or thermogram. All objects at a temperature above absolute zero (−273 °C) emit infrared radiation. The infrared band, with a wavelength from 3 to 14 μm, is called the thermal infrared region. This is analysed in imaging applications that use heat signatures. Thermal imaging maps the surface temperature of any object with high thermal and spatial resolutions [1].
Since the introduction of affordable dual sensors cameras, i.e., Thermal Infrared (TIR) and visible (RGB), mounted on Unmanned Aerial Vehicles (UAVs), many research results were published in various application domains, such as regional security, the monitoring of structures and infrastructures, the monitoring of archaeological sites, environmental monitoring, application in the agriculture field, etc. [2]. However, this trend is just a consequence of many years of pioneering in placing thermal imaging devices on satellites, airplanes, helicopters, and do-it-yourself UAVs in the beginning for military purposes [3] but later for other application fields [2].
All currently operating air and space-borne TIR remote sensors detect the energy emitted by the object itself [4]. These systems do not require an external source of infrared radiation for retrieval of emissivity spectra, because radiation is measured by comparing the object’s response and the modelled black body. As this approach does not rely upon keeping samples and black bodies at a fixed temperature, it is also appropriate for field use [4]. The emissivity of the material is maximal when the imaging device observes it perpendicular to its surface [1]. However, most of the time this is not guaranteed, and data should be corrected geometrically. As detailed in Ref. [4], rocks, soils, and vegetation have been researched much more than man-made materials. Specifically, materials are not in pristine condition, as their variability is influenced by many factors, and, for such reason, it is suitable to develop a spectral index of weathering, one that relates material change over time with laboratory measures on new materials.
Explosive remnants of war are part of everyday life all the way from World War I. The neutralisation of devices 50 or more years old is reported almost daily across Europe. It is noted in [5] that 64 countries are contaminated by land mines. Although both World Wars are far back in history, regional conflicts are constant. For some countries in armed conflicts, there exists a database of the most frequently used explosive devices with their characteristics, grouped by type [6]. Other countries still need to develop such documents, in order to understand the level of risk for humanitarian mine clearance better. There are military systems that can scatter more than 1000 mines per minute easily [5]. It is estimated, that for each mine placed, it takes 100 times more time to be cleared [5]. In 2019 there were 30 accidental explosions of ammunition stockpiles, each of them generating large dispersion of unexploded ordnances [7]. Most of the explosive war remnants are well known, at least by their physical dimensions, the weight of the explosives, the type of fuse, and the material of the cover. Unlike landmines, such ordnances lie mostly uncovered on the surface and unaffected by weather or vegetation. During a project in Bosnia and Herzegovina in 2019, a humanitarian organisation, Norwegian People’s Aid (NPA), collected imaging data about unexploded ordnances [8]. As part of its project, the NPA organisation tested new technologies for the purpose of surveying suspected hazardous areas. Thermal imaging has been identified as a promising technology for several reasons, namely, due to its easy implementation in practice, the relatively low cost and availability of sensors compared to hyperspectral cameras (which are, on average, about 12 times more expensive), and the easy determination of criteria for the separation of targets (e.g., UXOs) from the terrain. Therefore, thermal imaging and LiDAR sensors were utilised and mounted on UAVs. We experimented with these thermal images in this research.
Object detection by using thermal images is a broad research field [9,10,11], however, detecting UXOs is not researched that much. That is why publications on this topic are rare. In 2018 the authors in [12] developed a prototype application that utilised thermal imaging for detecting PFM-1 ‘Butterfly Mines’. The mines were deployed aerially, so there was no map of their positions. The thermal information was complemented by RGB images of the same area. Mines were detected with a precision of around 78%, while the metal components of the casing were detected with 100% accuracy. It was emphasised that an environment (e.g., sand, grass, or cobble-shaped) can affect detection precision. The best detection precision was noticed around 30 to 120 min after sunrise or sunset. Buried or covered mines were hard to detect, as their thermal properties were masked by the cover. The work in [13] was focused on the detection of land mines with respect to thermal changes in the environment. If the land mine was buried, then the thermal change was too small to be able to detect and identify UXO accurately. Nevertheless, the authors rated the results qualitatively as promising if the depth was shallow. Research in a similar direction was conducted in [14], where buried land mines were being detected. Time series of thermal images were captured, and afterwards, the differences in the temperature were inspected between regions with buried land mines and a regular environment with no land mines. The authors claimed that better detection could be achieved at a 10 min delay after the heating was stopped, and at the condition that the land mines were buried no deeper than 35 mm. It was a laboratory experiment, where heating and cooling could be started/stopped arbitrarily. Methods based on Deep Learning are more a rarity than the rule in the field of Detecting UXO devices. It is worth mentioning the work of the research group from Binghamton University, which expanded their research from 2018 [12] by utilising Deep Learning for automated detection and mapping of PFM-1 mines [15].
In our opinion, the gap between large quantities of imaging data, usually gathered in reconnaissance missions, and reliability, needed when working in an environment contaminated by explosive ordnances, could be bridged by Convolutional Neural Networks (CNN). Important research was carried out in [16] by colleagues from our partner institution the University of Rijeka. On a problem of automated person detection in thermal images, the authors experimented with various state-of-the-art CNN-based object detectors, namely, with Faster R-CNN, SSD, Cascade R-CNN, and YOLOv3, whereat all models were retrained on their dataset of thermal images. They demonstrated that the last version of YOLO [17] (version 3 at that time) should be utilised for retraining, as it was significantly faster than other detectors with similar state-of-the-art effectiveness. Many versions of YOLO and its combinations have been introduced to date (e.g., YOLO-G [18] for military target detection, YOLO-FIRI [19]), but one of the most important is certainly its latest stable and well-verified version YOLOv5 architecture [20], which is important due to the high processing speed and higher precision. (The latest version is, otherwise, YOLOv7.)
To the best of our knowledge, no automated solution exists for surface UXO detection by using thermal imaging data that tackles the problem of identifying more than one class of objects. In this study, we will adapt and retrain the state-of-the-art YOLO architecture in order to detect UXOs from 11 different classes on highly variable thermal images. On the other hand, we identified that there are no publicly available thermal imaging data about land mines and other UXOs. The second aim of this study is, therefore, to publish thermal imaging data with a very small Ground Sampling Distance. The selected YOLO architecture was, therefore, redesigned to our UXO detection problem, fine-tuned by using a grid-search approach, and, finally, trained end-to-end on thermal images. The effectiveness of our adapted and retrained CNN architecture was confirmed experimentally by detecting UXOs from 11 different classes on our challenging database of 808 thermal images.
The contribution of this research work is summarised in:
- The introduction of a sophisticated Unexploded Ordnance detection algorithm by using thermal imaging data, where this algorithm is a minor modification of the state-of-the-art YOLO neural network;
- The first study that assesses the effectiveness of the state-of-the-art CNN-based object detectors on an eleven class Unexploded Ordnance detection problem by using thermal images;
- The development and publishing of the UXOTi_NPA public database of annotated thermal images of Unexploded Ordnance;
- Baseline results of object detection for the UXOTi_NPA dataset.
This article is structured as follows. Section 2.1 introduces the UXOTi_NPA evaluation dataset with annotated thermal images. A short overview of the state-of-the-art YOLO object detector is given in Section 2.2, followed by a detailed description of a novel Unexploded Ordnance detection algorithm based on the YOLOv5 model in Section 2.3. Section 3 presents some of the results obtained on the UXOTi_NPA public dataset, followed by Section 4, which emphasises certain aspects of our detection method, and concludes this paper briefly with some hints about future work.
2. Materials and Methods
2.1. Evaluation Dataset UXOTi_NPA
The evaluation dataset UXOTi_NPA [21]–the abbreviation stands for UneXploded Ordnance Thermal images provided by Norwegian People’s Aid–for this research was constructed as follows. The raw data were provided by the humanitarian organisation Norwegian People’s Aid, which collected videos about unexploded ordnances during a project in Bosnia and Herzegovina in 2019 [8]. In this initial project phase, the NPA organisation tested the applicability of new technologies for terrain demining. For this reason, explosive ordnances were placed on the surface (they could be partially covered), but not buried in the ground. A thermal imaging sensor was mounted on a UAV that surveyed the area at a height of 3 metres. A very small Ground Sampling Distance (GSD) was achieved with such a configuration. These videos were acquired by the thermal imager Zenmuse XT [22], with a dimension of 720 × 480 pixels at a 30 Hz frame rate. The pixel pitch was 17 μm, sensitivity (NEdT) < 50 mK at the focal length f/1.0, and the field of view was 69° × 56°. The videos were stored in mp4 format.
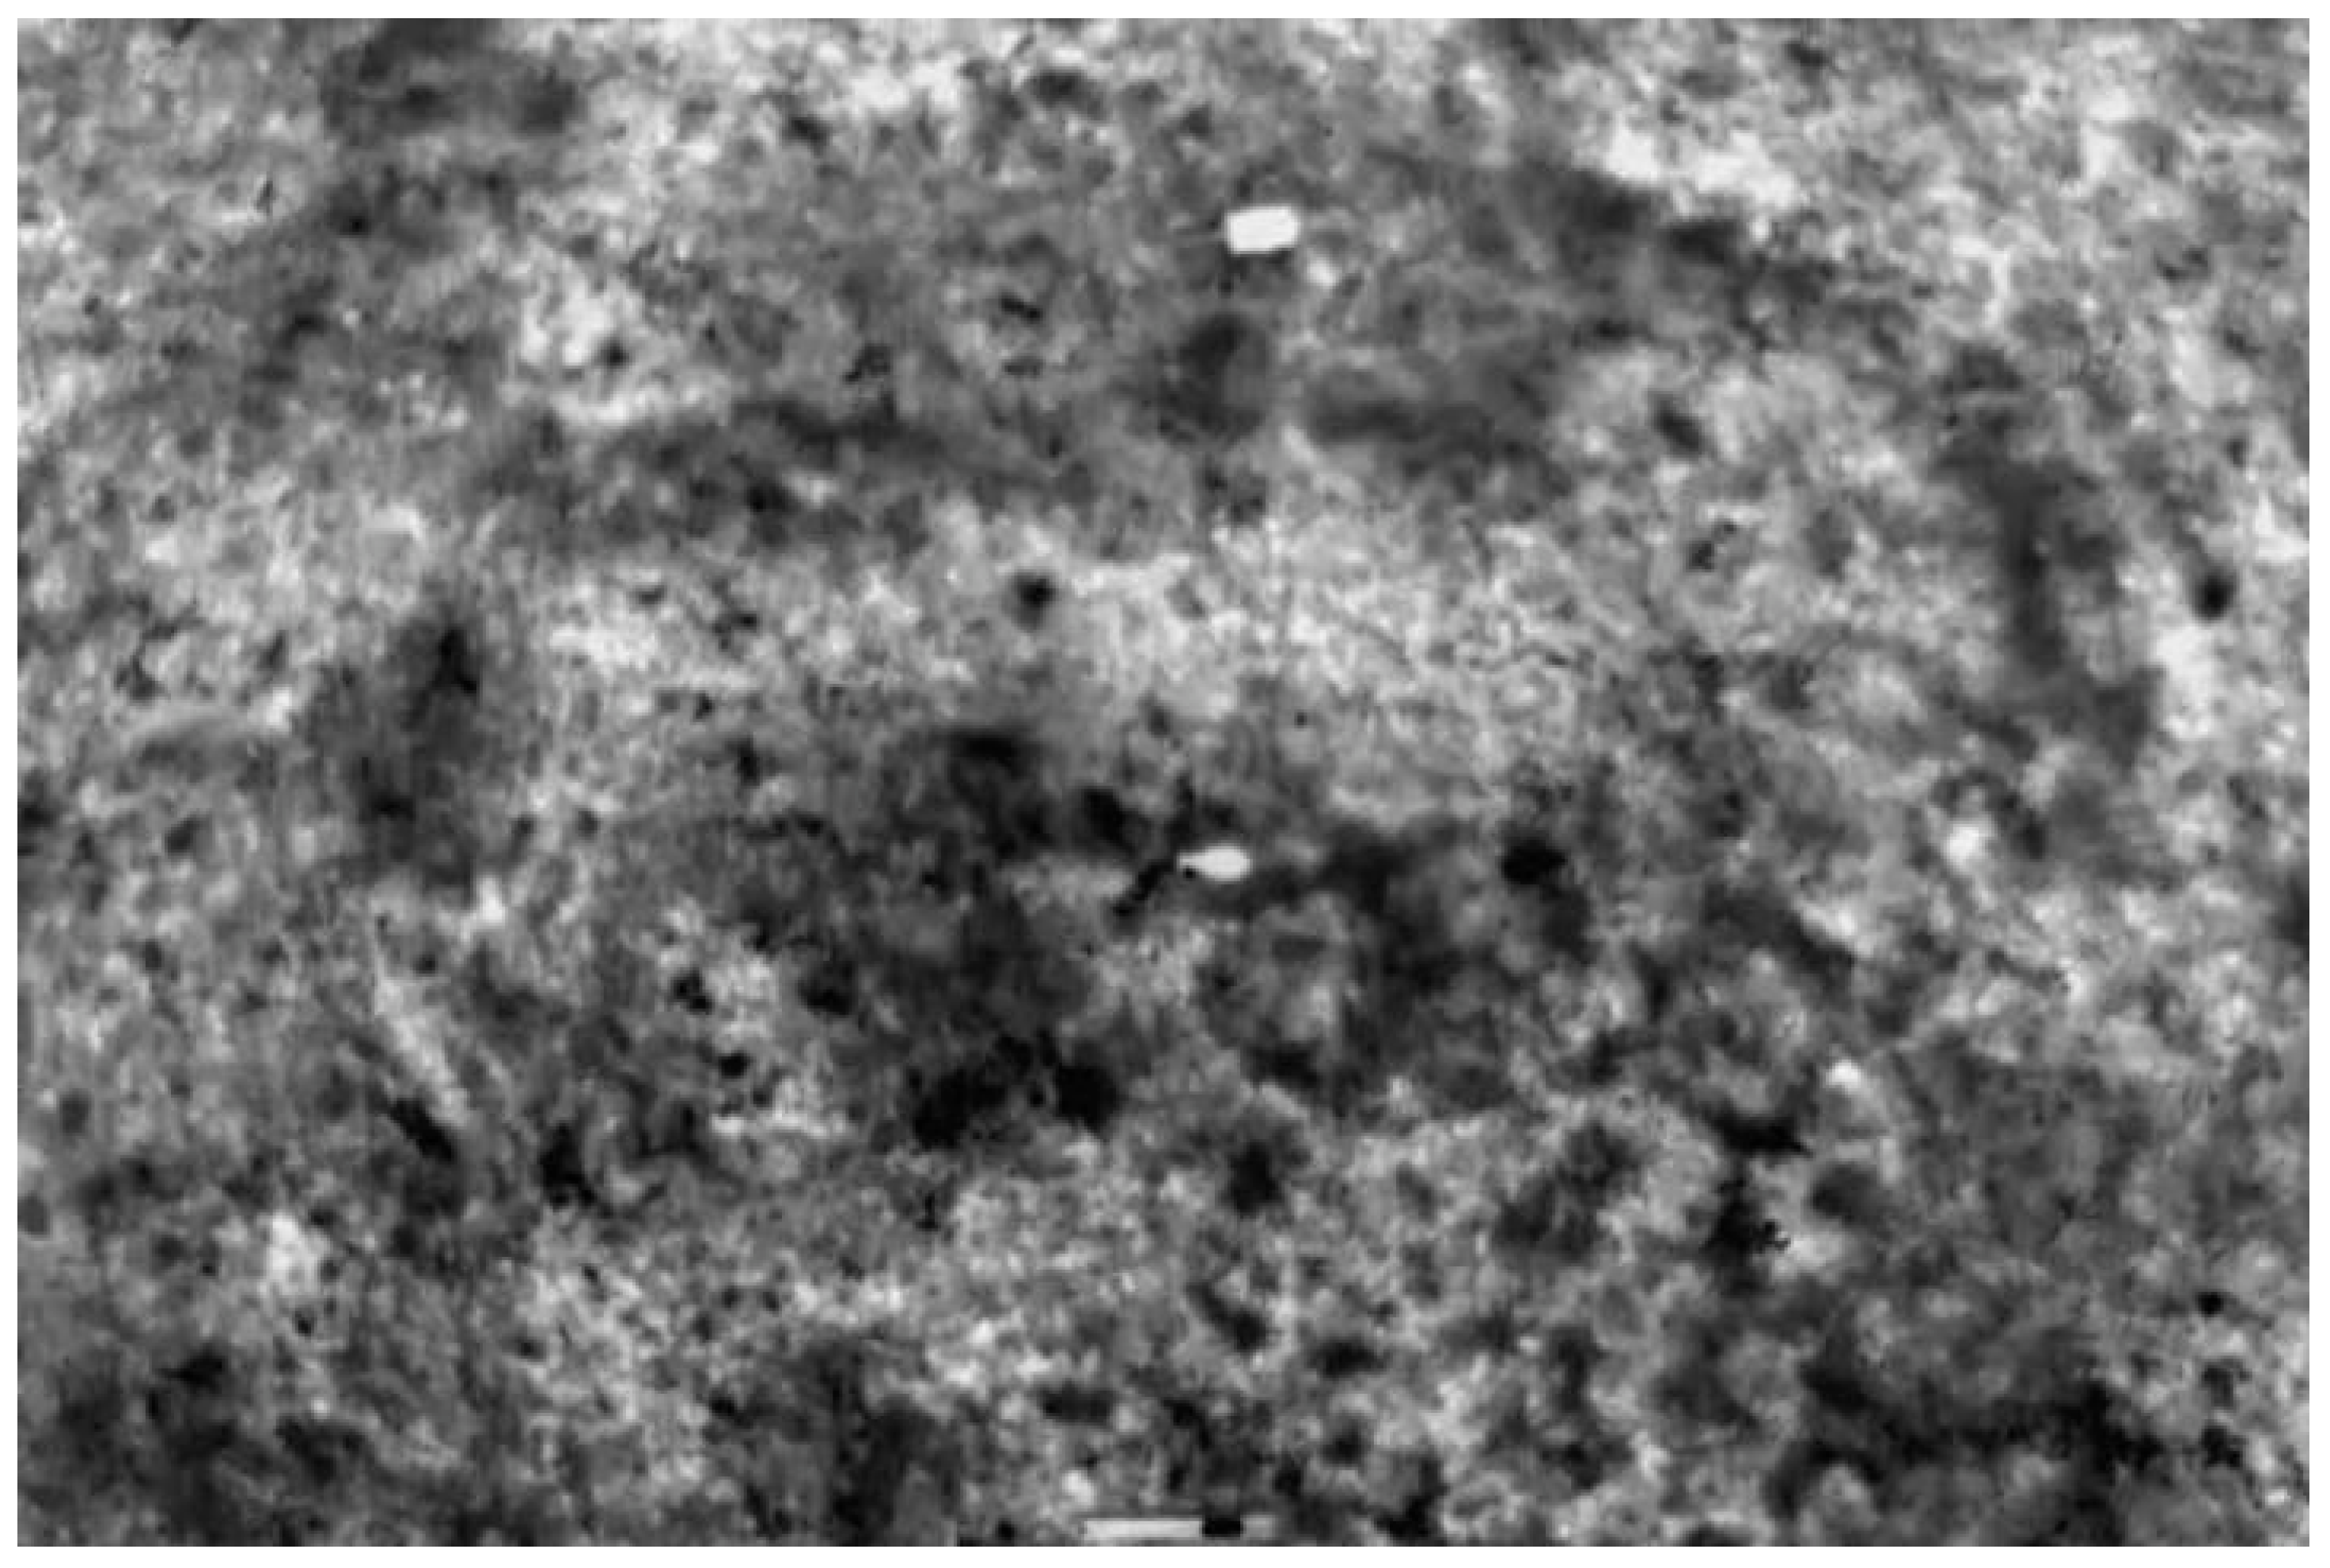
Image sequences were grabbed from the full videos by using the VirtualDub software. These clips were about 25 s long and show the UAV’s flight over the targets. We annotated videos semi-automatically by using the Computer Vision Annotation Tool (CVAT) [23]. The positions of objects’ annotations were corrected manually after every 5 to 6 frames. Our evaluation dataset consists of 808 thermal images of the dimension of 720 × 480 pixels extracted from the above-described video clips, whenever at least one target (UXO) was present in the image. The number of objects per image varied between one to three. Figure 1 depicts a sample thermal image from our dataset.
Our UXOTi_NPA evaluation dataset, therefore, contains altogether 808 thermal images with annotations. Each image contains up to three objects (i.e., UXOs) belonging to one of the eleven classes (also to different classes in one image). Table 1 depicts sample UXO objects for each of the eleven classes, with some additional information. Such objects appear in the images from our evaluation database.
Primarily, the eleven-class object detection problem was being solved in our study. We also investigated the problem of UXO detection, whereat all annotated objects were treated as instances of the same class (i.e., a single-class detection problem).
The evaluation data were then split randomly into a training set, a validation set, and a testing set. The training set, thus, contained 640 images, the validation set 80 and the testing set 88 images. These thermal imaging data (UXOTi_NPA evaluation dataset) were made publicly available through this study. They are accessible at the web address https://github.com/MilanBajicjr/UXOTi_NPA (accessed on 15 December 2022) [21].
2.2. YOLO Architecture
The You Only Look Once (YOLO) Deep Neural Network is one of the state-of-the-art object detectors [17]. It was designed with speed of detection as the main priority. This model divides the image into grid cells and considers each cell as a proposal to detect the object [24]. Several YOLO variants have been created over the years. FastYOLO, YOLO-tiny, YOLO-lite, and one of the last, YOLOv5n, are only a few from the list (e.g., [18,24,25]). It was demonstrated that YOLOv5n can match the effectiveness of the more complicated R-CNN or Faster R-CNN object detectors [25].
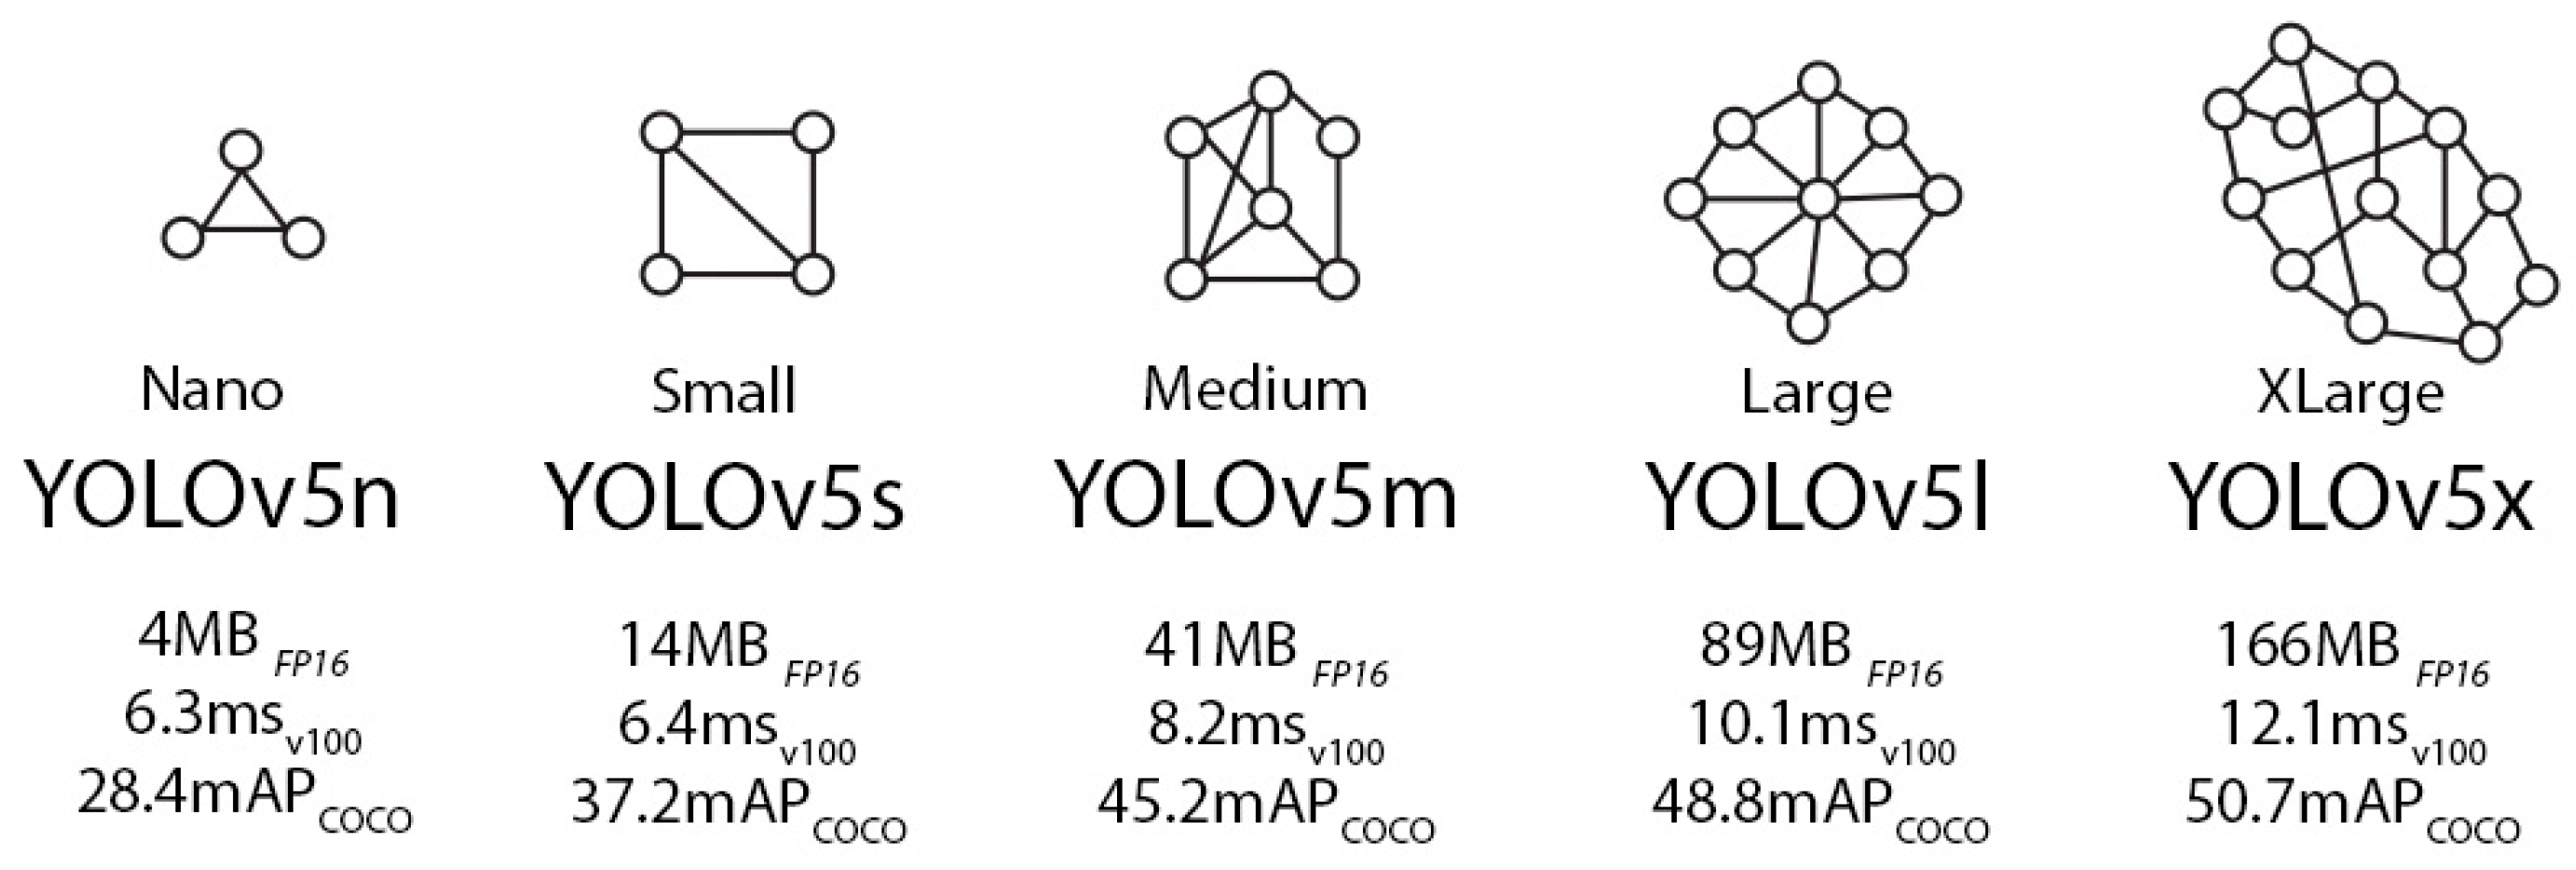
YOLOv7 is, therefore, the most recent YOLO version. YOLOv7 definitely outperforms the YOLOv5 in terms of accuracy, but, at the same time, the YOLOv7 training speed is slow on custom data, because it uses more floating-point operations compared to YOLOv5. It also proved to be slower than YOLOv5 on commonly available GPU systems (it is faster on high-end GPUs!). A compromise between accuracy and processing speed is of high importance in our study, so we chose the latest stable and verified version of the YOLO model as a starting point, i.e., the YOLOv5 version [20]. There are 5 models of version 5 of the YOLO architecture, as depicted in Figure 2. Each particular model is characterised by the model size, given in the form of FP16 precision (half floating-point precision), by V100 value (i.e., time of inference on the NVIDIA V100 GPU), and by mAPCOCO (Mean Average Precision on the COCO dataset [26]).
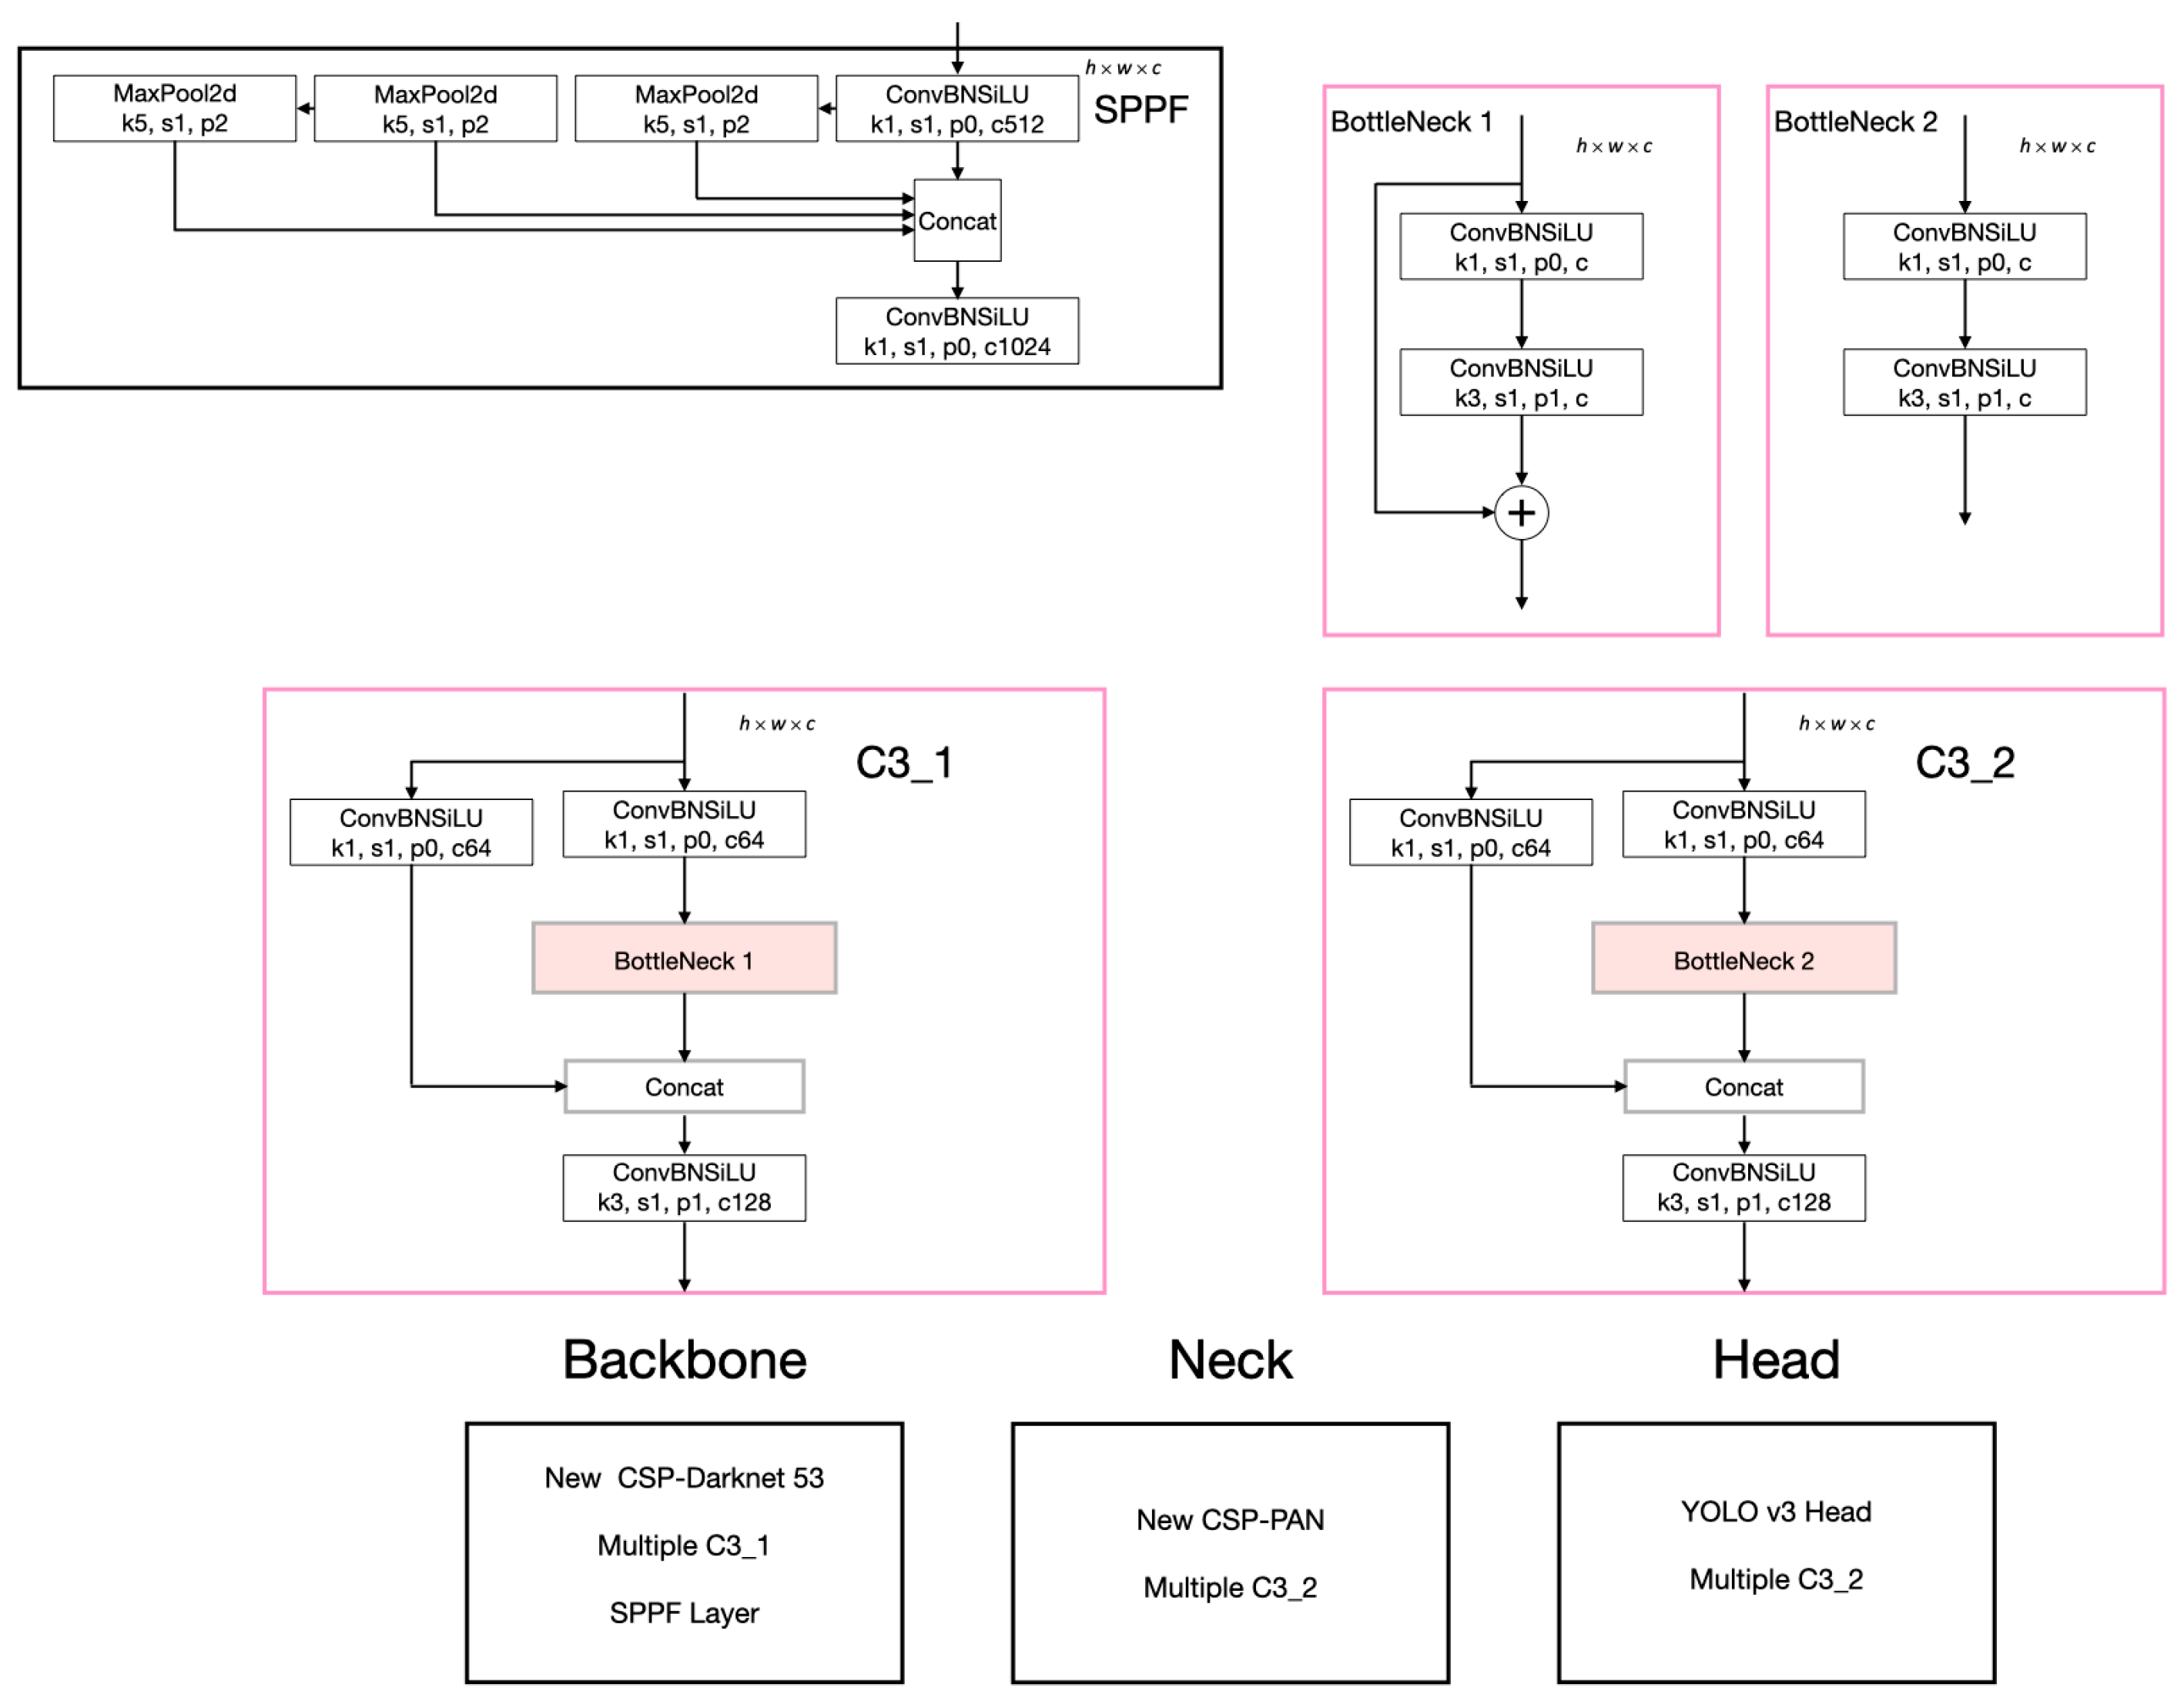
The YOLOv5 model consists of a few basic building blocks, as depicted in Figure 3 (a detailed architecture can be found in [27]). The most basic building block is ConvBNSiLU, which combines sequentially a convolutional layer, followed by a batch normalisation layer, and, finally, a sigmoid linear unit as an activation layer. Parameter k denotes the kernel size, parameter s denotes stride, parameter p denotes zero padding, and parameter c denotes the number of channels. ConvBNSiLU blocks are used to construct BottleNeck 1 and BottleNeck 2 blocks, as depicted in Figure 3. The performance improvement over previous YOLO versions was gained by the replacement of the Spatial Pyramid Pooling (SPP) structure with an SPPF structure, where F means fast. The SPPF structure is two times faster compared to the SPP. There are three main interconnected parts of the YOLOv5 model, namely backbone, neck, and head. CSP Darknet 53, or CSPNet53, found in the backbone, is a combination of the CSPNet (Cross Stage Partial Network), introduced in 2020 [28], and Darknet 53, created as a part of the YOLOv3 improvement [29]. CSPNet strengthens the learning ability of the CNN, removes computational bottlenecks, and reduces memory costs [28]. On the other hand, Darknet 53 is more efficient at feature extraction than its 19-layer predecessor Darknet 19 and other competitors. CSP-PAN, found in the neck, stands for a combination of the CSP and PANet (Path Aggregation Network) [30] with the goal to boost information flow in the instance segmentation flow.
The YOLOv5 neural network decreases the number of free parameters and FLOPS, thus reducing the model size and simultaneously increasing the processing speed at practically unchanged accuracy [31]. The output layers of YOLOv5 (i.e., the head) return feature maps in 3 different sizes, thus enabling the model to detect small, medium, and big objects.
The performance and complexity of five mainstream YOLOv5 models are presented in Table 2. The results were taken from [27]. Values mAPs are reported at threshold 0.5 and overall mAPs (threshold ranging from 0.5 to 0.95 with step 0.05). The metrics of the mAP were calculated using the COCO dataset, while the model complexity is given by the number of free parameters.
2.3. Computational Methods
YOLOv5 looked to be the most promising Deep Learning based object detector for our UXO detection problem according to the literature survey and according to the intended use on an embedded device mounted on the UAV. Therefore, the YOLOv5 version was employed in this study. It was shown in [30] that higher effectiveness could be attained if a pretrained model was retrained on a custom dataset compared to the CNN model trained from scratch on a custom dataset. Consequently, our starting point represented the YOLOv5 architecture, pretrained on the COCO database [26]. It must be emphasised that, in our research, we did not perform classical transfer learning, but the CNN was initialised with already learned weights (on the COCO dataset), and the training was conducted from scratch on our new data from the UXOTi_NPA dataset (i.e., all CNN layers were trainable).
We employed the implementation of the YOLOv5 model provided by the company Ultralytics [25] in this research. The following modifications were introduced to the YOLOv5′s original architecture. At the input, the thermal images were scaled appropriately to a size of 640 × 640 pixels. On the other hand, the output of the original YOLOv5, designed for eighty COCO classes, was adapted accordingly for the detection of UXOs from the eleven different classes (or two classes if a binary detection problem was being solved).
We experimented with all five versions of the YOLOv5 model in this study. The hyperparameters for our CNNs were determined by a grid-search approach. The settings for all hyperparameters, found in the Ultralytics code, are gathered in Table 3.
The models’ training was conducted on the Google Colaboratory platform by using Tesla T4 GPUs. All programming code was stored in notebooks created by Ultralytics [25] on their Github page [27]. The models were implemented in Pytorch using the Python 3.7.15 version and some additional libraries. The time of training depended on the available Colaboratory resources, which is why it was not considered or reported in this study.
3. Results
The results of our experiments are presented in this sequel. First, we solved the problem of classification and detection of UXOs from 11 different classes (i.e., an eleven UXO class detection problem). All five versions of the YOLOv5 model, presented in the previous section, were trained separately on the training set of the UXOTi_NPA database. Trainings were conducted for 300 epochs, with the same hyperparameters (see Table 3). Sample graphs, captured during the training of the YOLOv5n version, are presented in Appendix A. A trend of changing three different loss functions with respect to the training epoch can be observed (see Figure A1, Figure A2 and Figure A3). We noticed a similar trend by also training our other CNNs. The trained Neural Networks were then evaluated on the testing set of the UXOTi_NPA database. The classification and detection effectiveness were assessed by using classic metrics, such as Precision, Recall, Mean Average Precision (mAP) at a 0.5 threshold, and the average mAP at thresholds ranging from 0.5 to 0.95 with a step 0.05. The results of this first experiment are gathered in Table 4. Furthermore, the number of free parameters (in Million) is given in this Table for each retrained YOLOv5 version.
UXOs from all 11 classes were merged into one common class in the next experiment. Therefore, we were solving the detection problem: Are there any UXOs in the thermal image (regardless of which type), and if so, where? This experiment was denoted as a ‘single UXO class detection problem’. With it, we wanted to simulate a real-world scenario, where UXO removers are interested primarily in whether a UXO is present in an observed area at all and are only later interested in what type it is. We utilised the same versions of the YOLOv5 model (only the output layer was modified appropriately). The training and other settings remained the same as in the first experiment. Sample graphs, captured during the training of the YOLOv5x version for a single UXO class detection problem, are depicted in Appendix A (see Figure A4, Figure A5 and Figure A6). Similar trends were noticed by other YOLOv5 versions. The trained Neural Networks were then evaluated on the testing set of the UXOTi_NPA database, whereat UXOs from all 11 classes were merged into one common testing class. The obtained results are gathered in Table 5, where the highest metrics are marked in bold.
More detailed results are gathered in Table 6 for the smallest version YOLOv5n, with metrics calculated for each of the eleven UXO classes. A new Results Table was obtained for every pair of confidence and IoU thresholds. The confidence threshold was set to 0.001 and the IoU threshold to 0.5 for Table 6. The confusion matrix has only ones along a diagonal using such a setting, which is why it is not shown. The abovementioned metrics and the number of all instances (UXOs) for each class in all 88 testing images are presented in Table 6. Similar results were also obtained for the other YOLOv5 versions. It should be noted that the detection effectiveness decreases with higher confidence and IoU thresholds.
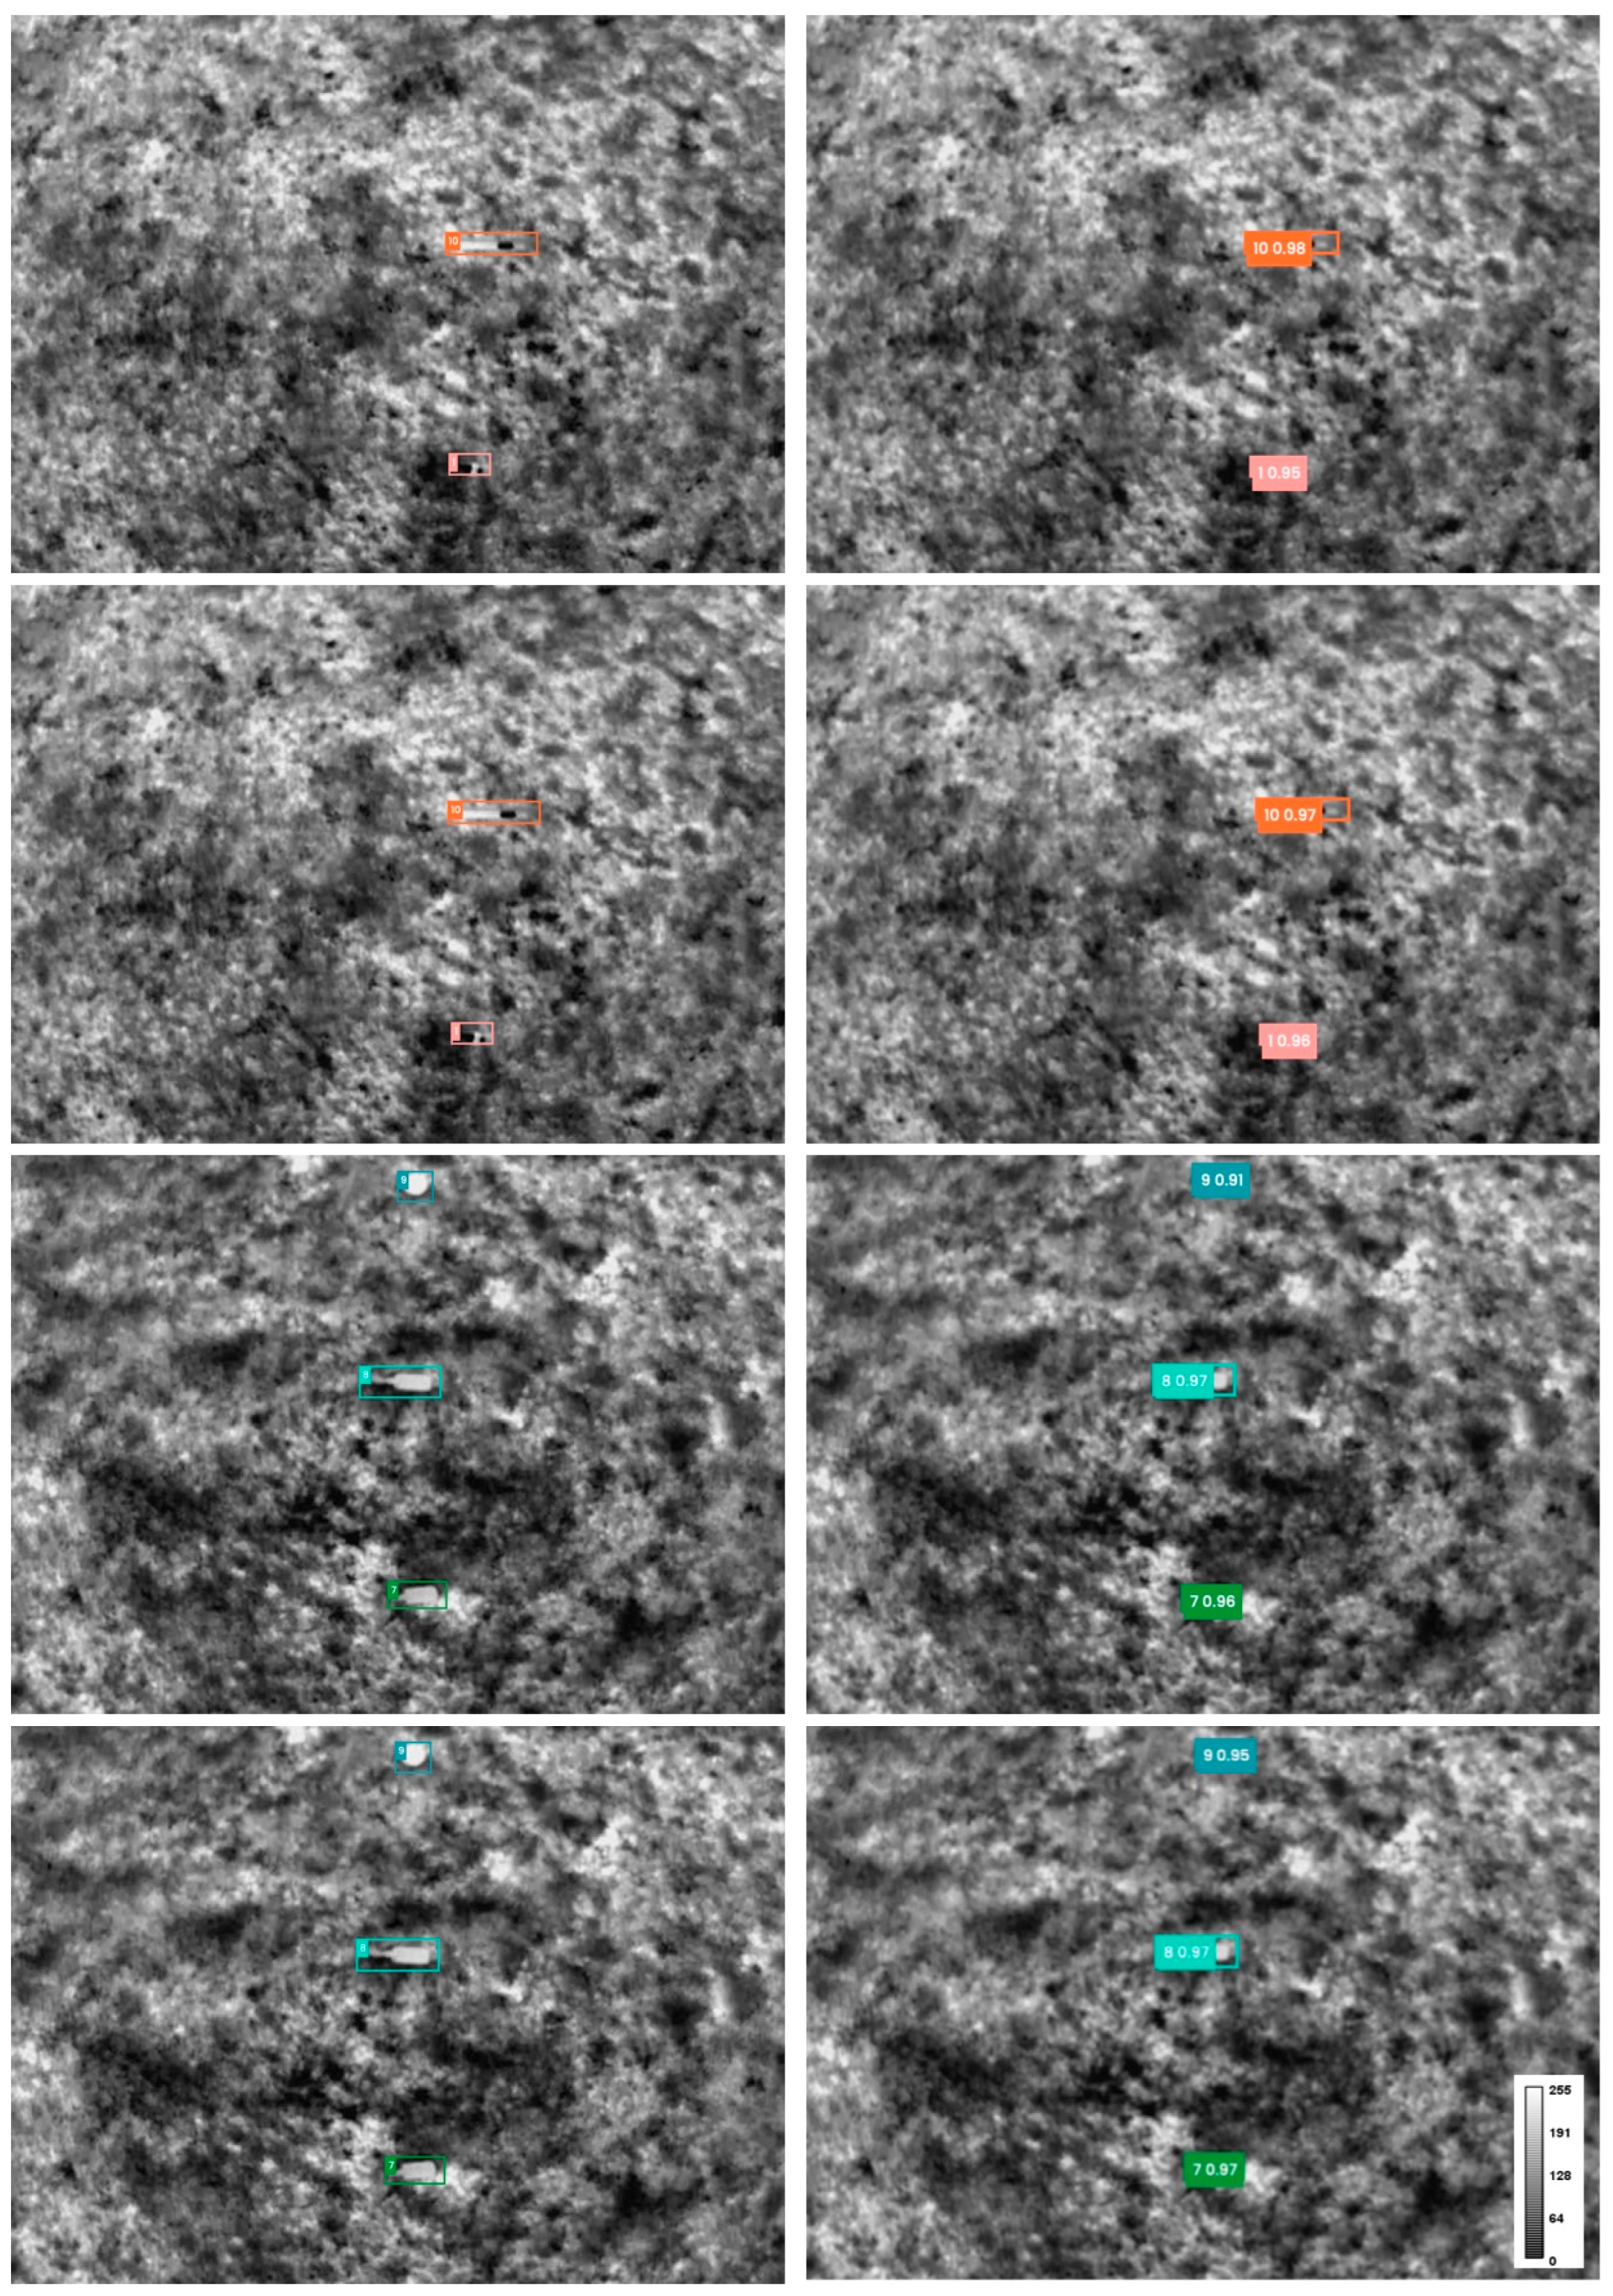
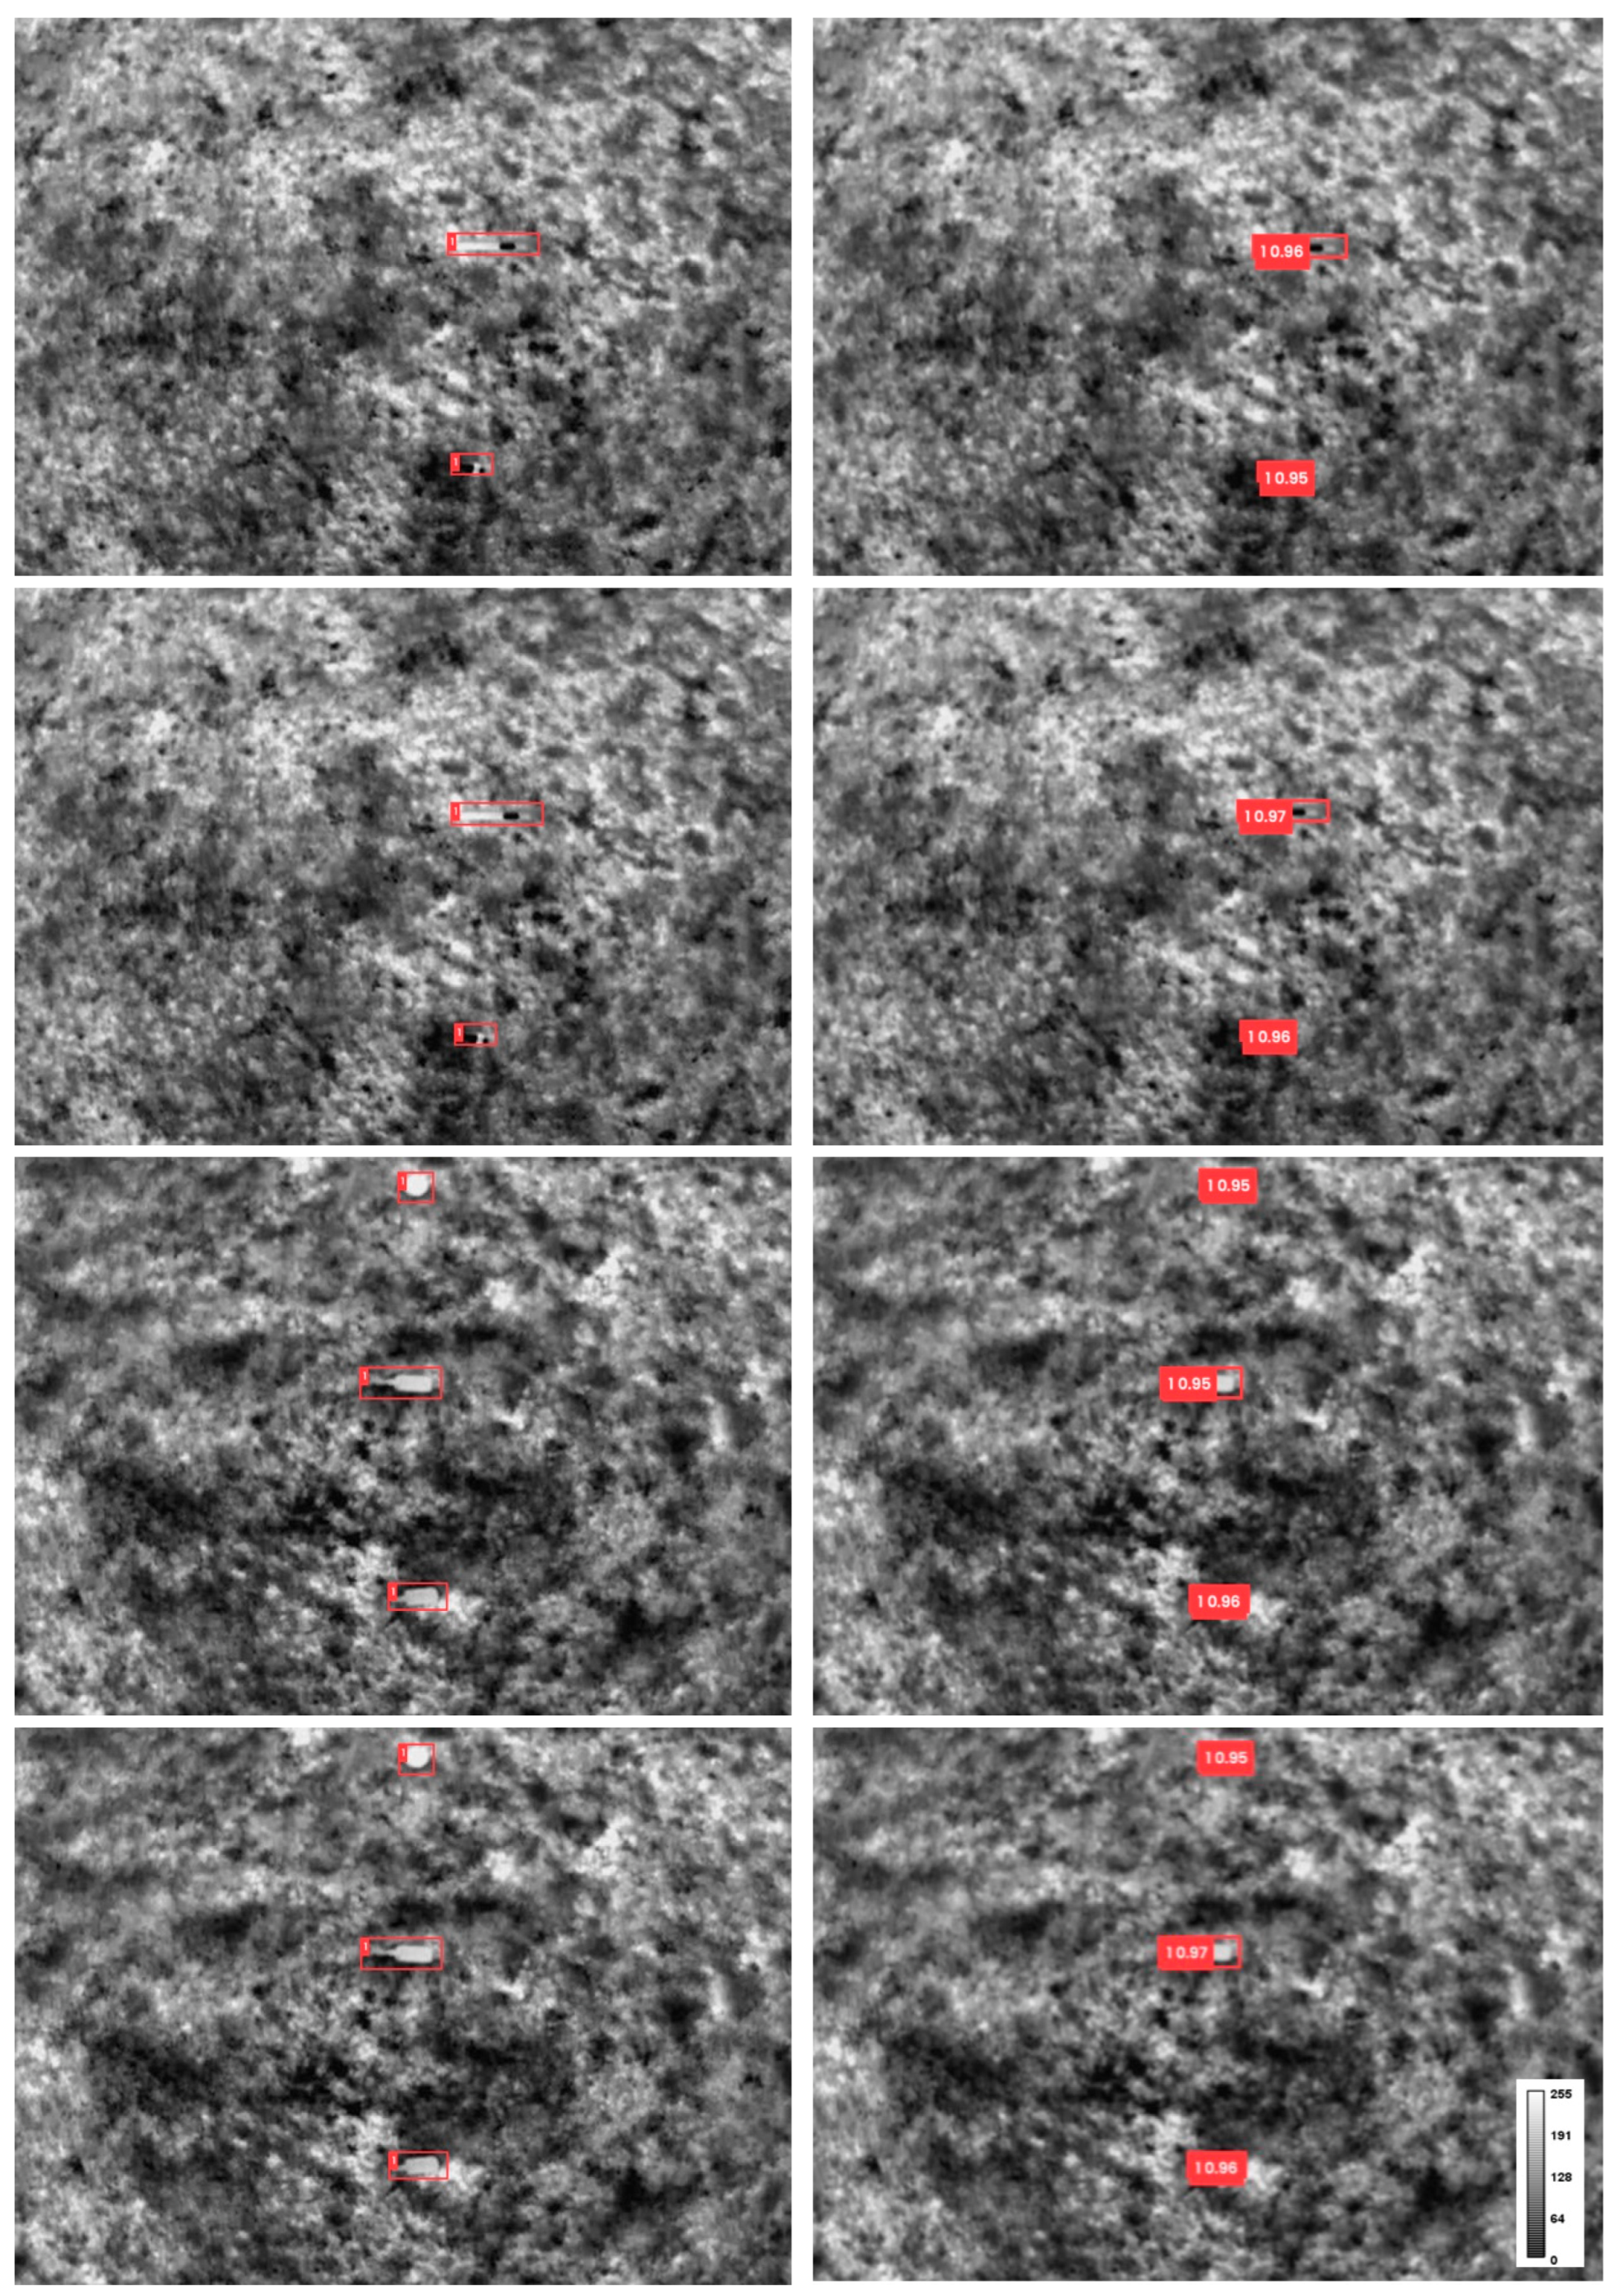
Some qualitative results are shown for the eleven UXO class detection problem in Figure 4 and for the single UXO class detection problem in Figure 5. In both cases the left column contains the original thermal images from the testing set of the UXOTi_NPA database, with expert annotations (i.e., bounding boxes) overlaid to each image. The colour and index next to the bounding box indicate the UXO class (see also the class indexes in Table 1). All UXOs are grouped into one common class (index equal to 1) in the case of a binary detection problem (see Figure 5). On the other hand, the right column shows the detection and classification results obtained by using our retrained YOLOv5 model versions. Bounding boxes with a detected UXO in the appropriate colour are depicted, supplemented by information about the detected class index and detection probability. The results in rows one and three were obtained with the retrained YOLOv5n, while the results in rows two and four were obtained with the retrained YOLOv5x version.
4. Discussion
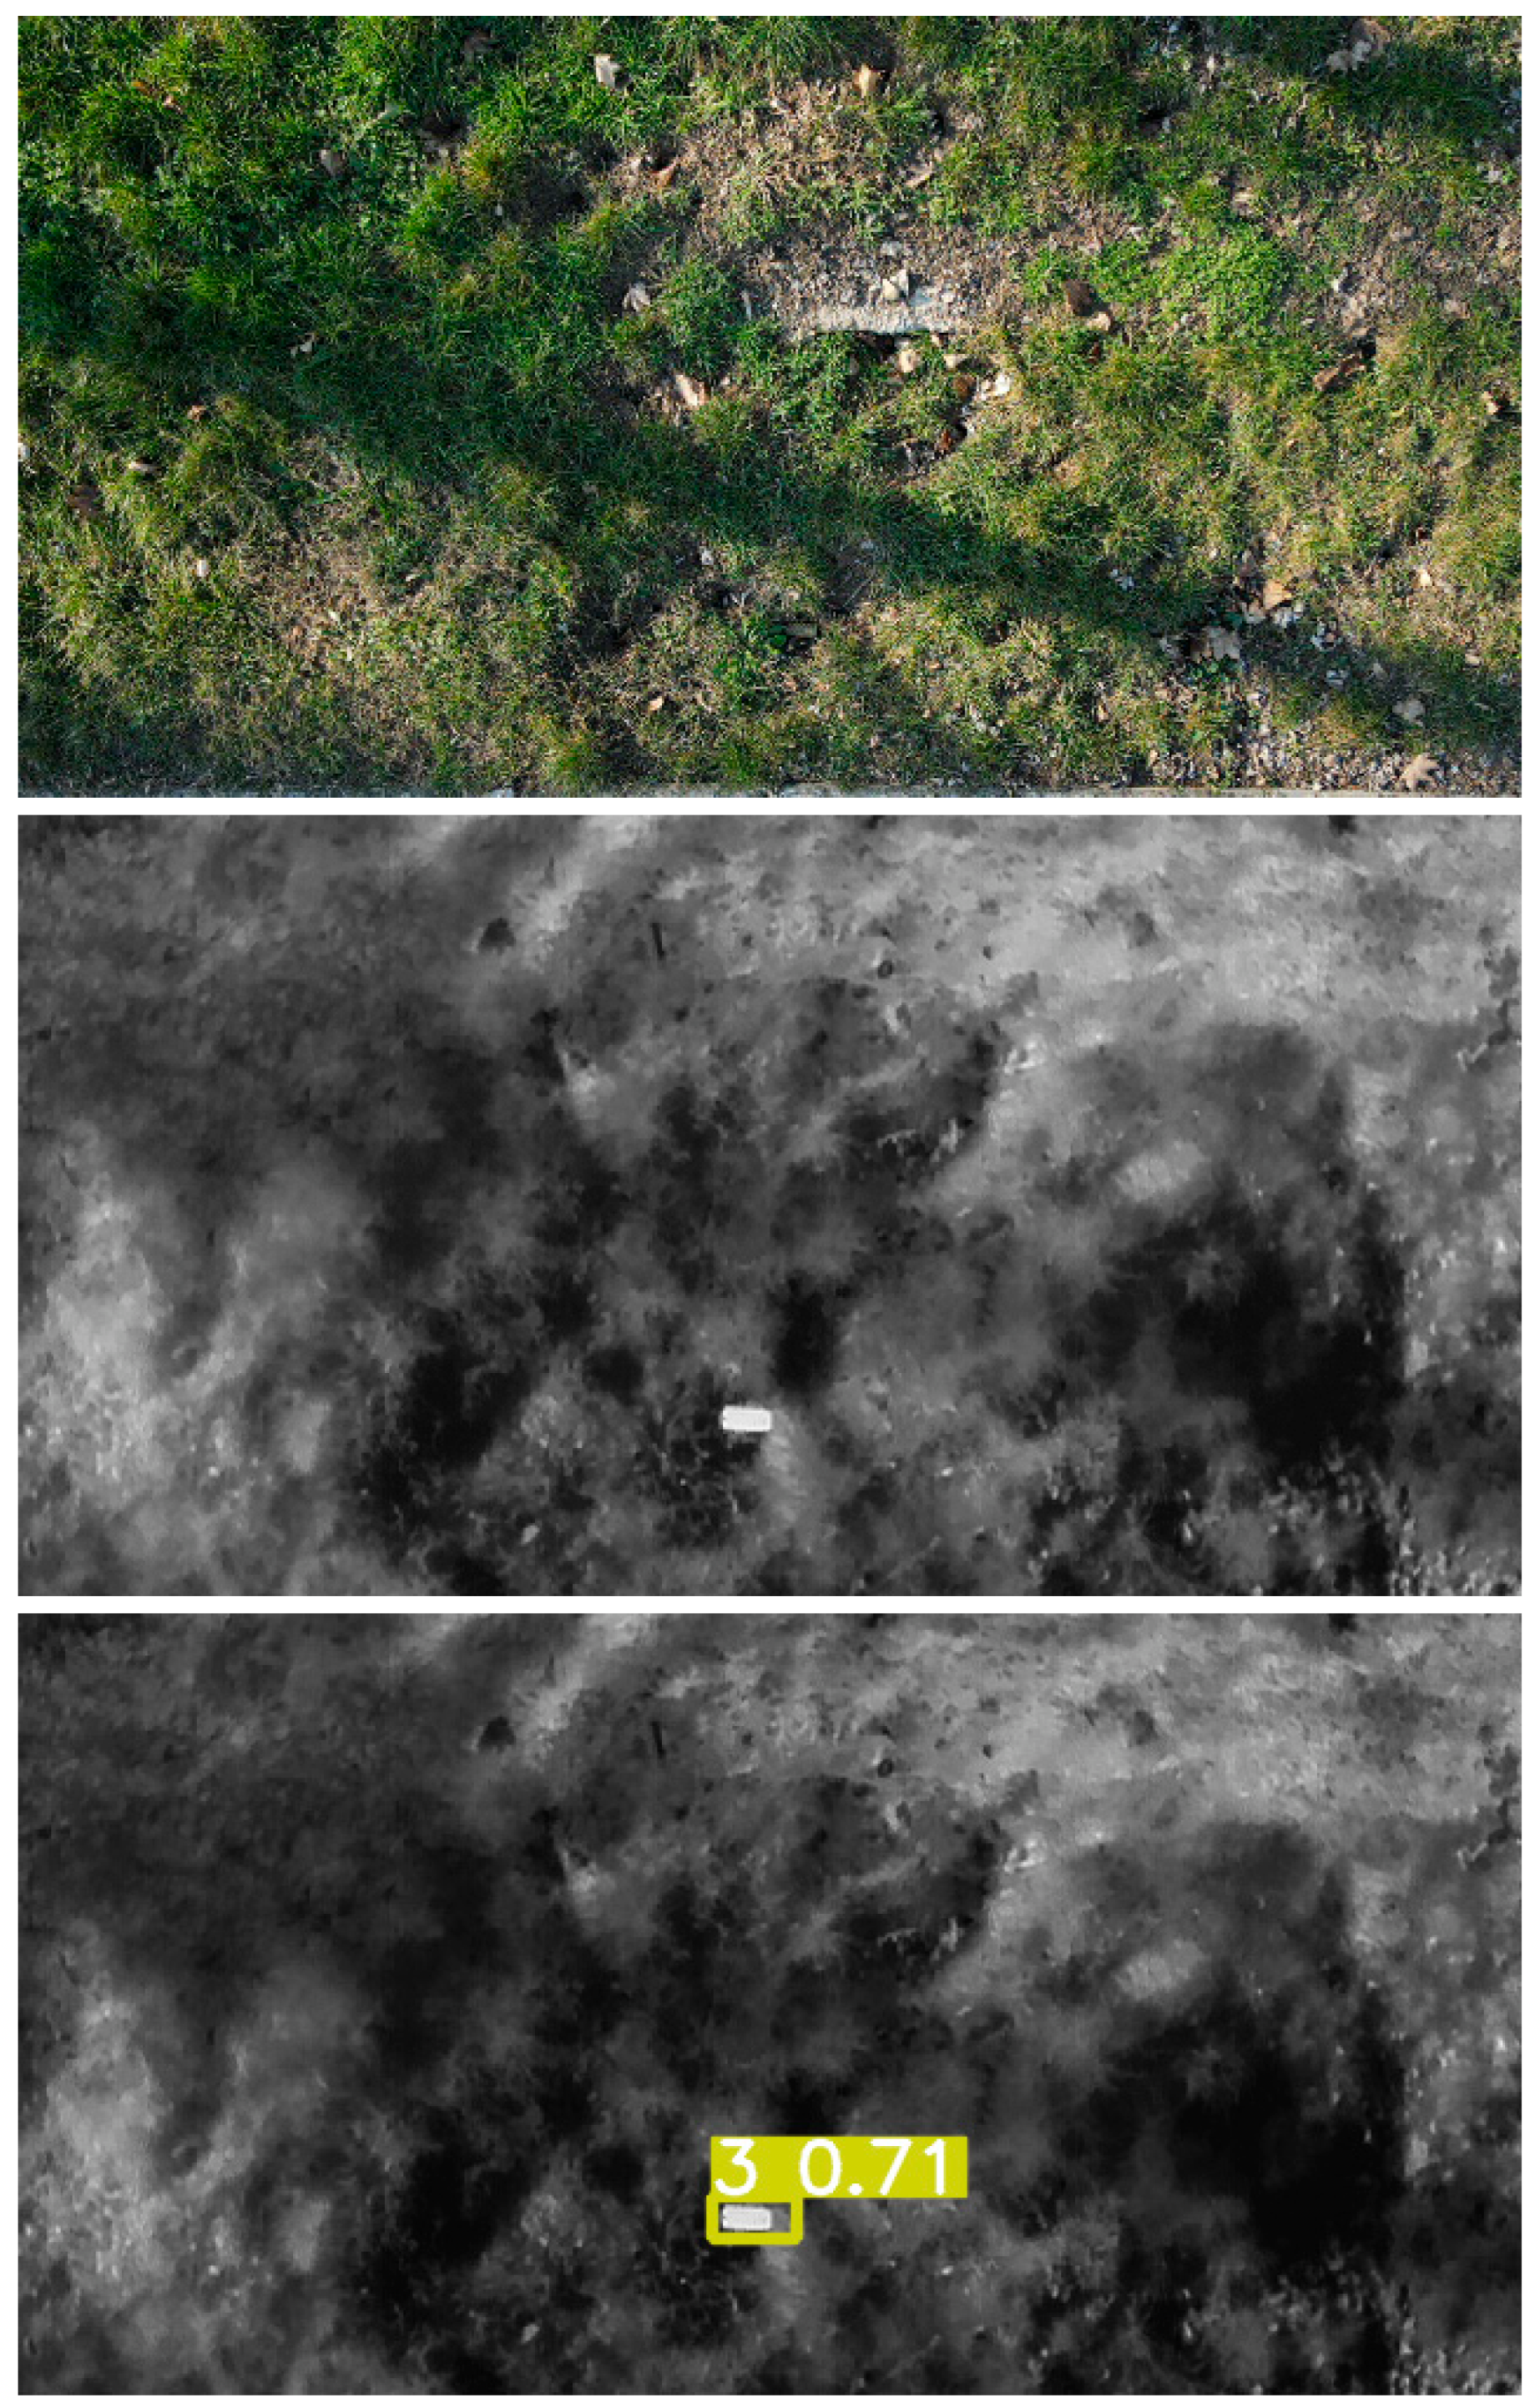
In this research, we developed and verified thoroughly a computational method based on Deep Learning and Convolutional Neural Networks aimed at detecting Unexploded Ordnances from imaging material. It is an important support activity that contributes to the neutralisation of explosive war remnants. A selected terrain can be inspected from the air (e.g., by using Unmanned Aerial Vehicles) and potentially dangerous areas can be located in advance by using our automated solution. One of the novelties of our study is that thermal images were utilised to detect UXOs. Thermal imaging is an important source of information about the environment and its changes, especially if this information is not perceivable in the visible spectrum. Various materials, including UXOs, leave their own thermal signatures in the image, based on which they can be identified very reliably in the scene. We took advantage of this fact in our solution. A detailed list of the advantages of using the thermal (infrared) spectrum over the visible spectrum by the terrain demining is gathered in a report [8]. Figure 6 depicts an example of a land mine with a green metal casing placed on green grass, which is indistinguishable in the visible spectrum (see the top image) but easily separable in the thermal spectrum (see the middle and bottom images).
During the development, we encountered the problem that there is no publicly available dataset of Unexploded Ordnance thermal images. The next contribution of our research is, therefore, that we have published the UXOTi_NPA public dataset with such annotated thermal images. This dataset, consisting of 808 thermal images with UXOs from 11 different classes, is slightly unbalanced, since UXOs from the smallest class are present in 79 images, and from the largest class in 161 images. Most often, UXOs from three different classes appear in a single image from the UXOTi_NPA dataset. Our public dataset could be considered very small compared to the COCO dataset with 328,000 images, or to ImageNet with more than 1,280,000 images. Naturally, the smaller dataset requires special approaches by computational methods’ training.
Our computational model was based on the latest stable and well-verified model of the well-recognised object detector YOLO (i.e., model v5). It should be stressed that the YOLOv7 is the latest YOLO version. Our choice was further substantiated by related research using thermal imaging data. The YOLOv5 model appears in five versions, that differ from each other in the number of free parameters. We experimented with all of them in this study. Our smallest CNN architecture had 1.8M free parameters, and YOLOv5x, as the largest architecture, had more than 48 times bigger capacity (i.e., 86.6M free parameters). Analysing the efficiency of architectures with different capacities has an important applicative value. A version of YOLOv5n could, for instance, be installed on an embedded device (e.g., as part of a UAV), where it would perform quasi-real-time detection of UXOs. On the other hand, the remaining YOLOv5 architectures are too complex, and are, therefore, more suitable for non-real-time processing, the largest architectures even for detecting very small objects in vast areas (e.g., for thermal images captured with large GSD).
The obtained results for the ‘eleven UXO class detection problem’ pointed out that the Precision was higher than 98% (with the lowest value of 98.3% and the highest value of 98.8% by YOLOv5n and YOLOv5s, respectively), and the Recall was equal to 100% for all five YOLOv5 versions. Such a Recall value suggests that our computational method has always detected all UXOs in the scene. The metric mAP at threshold 0.5 was equal to 99.5% for all architectures, while the mAP at thresholds between 0.5 and 0.95 (step size 0.05) varied between 87.0% (YOLOv5n) and 90.5% (YOLOv5l). We can summarise that YOLOv5l proved to have the highest detection accuracy, and YOLOv5s demonstrated the lowest number of False Positives.
It can be seen from the results (see Table 4) that increasing the capacity of our Convolutional Neural Network did not improve the effectiveness significantly. Quite similar effectiveness was, thus, gained with smaller and larger architectures (even with 48 times larger), which is an important insight, especially if our solution would be integrated into devices with limited computing power. The opposite was noticed when applying the YOLOv5 model on the COCO dataset (see Table 2), where significantly better results were obtained with larger models.
The effectiveness of the YOLOv5 model on the UXOTi_NPA dataset was higher by almost half than on the COCO dataset. Undoubtedly, one reason is that the UXOTi_NPA is smaller and has fewer classes than the COCO dataset. At the same time, the searched objects in UXOTi_NPA had a greater visual similarity (e.g., textures) than the more diverse objects in the COCO dataset. We presume that low-dimensional feature vectors are sufficient to describe UXOs in thermal images, which is why the YOLOv5 architectures performed well, even with a small capacity.
Let us analyse the training of YOLOv5 on the UXOTi_NPA dataset. Our dataset is relatively small, so overfitting is an imminent threat. We mitigated this problem by initialising the weights of our architectures with the weights of the YOLOv5 model pre-trained on the COCO dataset. It should be emphasised that no transfer learning was performed, as we trained our initialised architectures from scratch (no layers were frozen!). Naturally, the initialisation of synaptic weights with a pre-trained model has a beneficial influence on training. The training time is reduced, and, at the same time, the training is less dependent on the correct setting of the learning rate (this rate can be lower and also partly inaccurate). A lower learning rate means smaller adaptations of synaptic weights, resulting in solutions that are located in the vicinity of the solutions of the pre-trained model. This limits the risk of overfitting greatly. Additionally, an augmentation was employed during the training of our CNNs (see Table 3). The training was performed for 300 epochs. We took the model after the last epoch as a final result. For demonstration purposes, we have shown in the Appendix A the trend of changing loss functions with respect to the epoch for our smallest YOLOv5n architecture (see Figure A1, Figure A2 and Figure A3). Similar behaviour was noticed by other, larger architectures and by solving the single UXO class detection problem (see Figure A4, Figure A5 and Figure A6). We noticed that graphs became almost flat around the 60th epoch. The latter suggests that the training time can be shortened by around 5 times.
We also studied the effectiveness of our computational method by solving the single UXO class detection problem in this research. This means that the samples from all 11 classes of the UXOTi_NPA dataset were treated as one single class during training and evaluation. In this case, the Precision metric increased as expected for all architectures (up to 99.4% by YOLOv5l) compared to the same metric calculated by the eleven UXO class detection problem. The same applies to the average mAP at thresholds from 0.5 to 0.95 (increased up to 91.5%). On the other hand, the Recall and mAP at threshold 0.5 remained unchanged with respect to the results of the eleven class problem. For security and military applications, it is of course a more advantageous solution where we are able to distinguish between different UXOs (e.g., mine clearance). The ‘single UXO class’ solution comes into play in cases where the user needs to be warned (alerted) about areas with impending danger.
Detection accuracy on the UXOTi_NPA dataset by using our approach is relatively high already (see Table 4, Table 5 and Table 6). However, the average mAP metrics at thresholds ranging from 0.5 to 0.95 ([email protected]:0.95) indicate that there is still enough room for improvements in follow-up studies (i.e., at higher IoU thresholds).
5. Conclusions
In this paper, we have shown that the combination of deep Convolutional Neural Networks and thermal imaging can be used advantageously to detect UXOs in a real environment. The state-of-the-art object detector YOLOv5 was adapted successfully to recognise and localise UXOs in thermal images captured by UAVs. Our solution uses Deep Learning to detect and recognise UXOs, similar to [15]. However, there are important differences between the two approaches. Our algorithm uses thermal images and a YOLO model, while [15] performs detection using Faster R-CNN in the visible spectrum. The biggest difference is that our algorithm is adapted for the eleven UXO class detection, while the solution in [15] only detects PFM-1 land mines (i.e., a single UXO class).
The public UXOTi_NPA dataset with thermal images of UXOs from eleven classes was published as part of this study. Our computational method was verified comprehensively on this dataset. The obtained metrics can also be considered as baseline results for the UXOTi_NPA dataset. We believe that this evaluation dataset will encourage future research in this area, because, to the best of our knowledge, there are no publicly available datasets with annotated thermal images of land mines and other UXOs. When developing our detection algorithm, we did not integrate the knowledge about UXOs and the thermal spectrum explicitly, but this knowledge was provided implicitly through the training set. From this point of view, our approach is general and applicable to any problem of object detection from (thermal) images.
Further research that introduces multimodality into the UXO detection process is planned; namely, we want to merge data from RGB visual sensors and thermal cameras. At the same time, we want to analyse the importance of the RGB and thermal spectrum statistically. An experiment with thermal imaging material that would be captured at higher altitudes is also foreseen. The UXOTi_NPA database size is rather limited in its first version, and we plan to expand this database with new thermal images with UXOs, preferably from different geographical areas. We also want to upgrade the verification protocol by introducing K-fold validation, where K will be set to 3 or 4.
Author Contributions
Conceptualization, M.B.J.; methodology, M.B.J. and B.P.; validation, M.B.J. and B.P.; data curation, M.B.J.; writing—original draft preparation, M.B.J. and B.P.; writing—review and editing, M.B.J. and B.P.; visualization, M.B.J.; supervision, B.P.; funding acquisition, B.P. All authors have read and agreed to the published version of the manuscript.
Funding
This study was supported by the Slovenian Research Agency (Contract P2-0041).
Institutional Review Board Statement
Not applicable.
Informed Consent Statement
Not applicable.
Data Availability Statement
Publicly available datasets were analyzed in this study. This data can be found at: https://github.com/MilanBajicjr/UXOTi_NPA (accessed on 21 December 2022).
Acknowledgments
The authors would like to express gratitude to Norwegian People’s Aid (NPA) for their work on land mines and UXO detection and for providing us with raw thermal video data. Special thanks to Darvin Lisica from NPA.
Conflicts of Interest
The authors declare no conflict of interest. The funders had no role in the design of the study; in the collection, analyses, or interpretation of data; in the writing of the manuscript, or in the decision to publish the results.
Appendix A
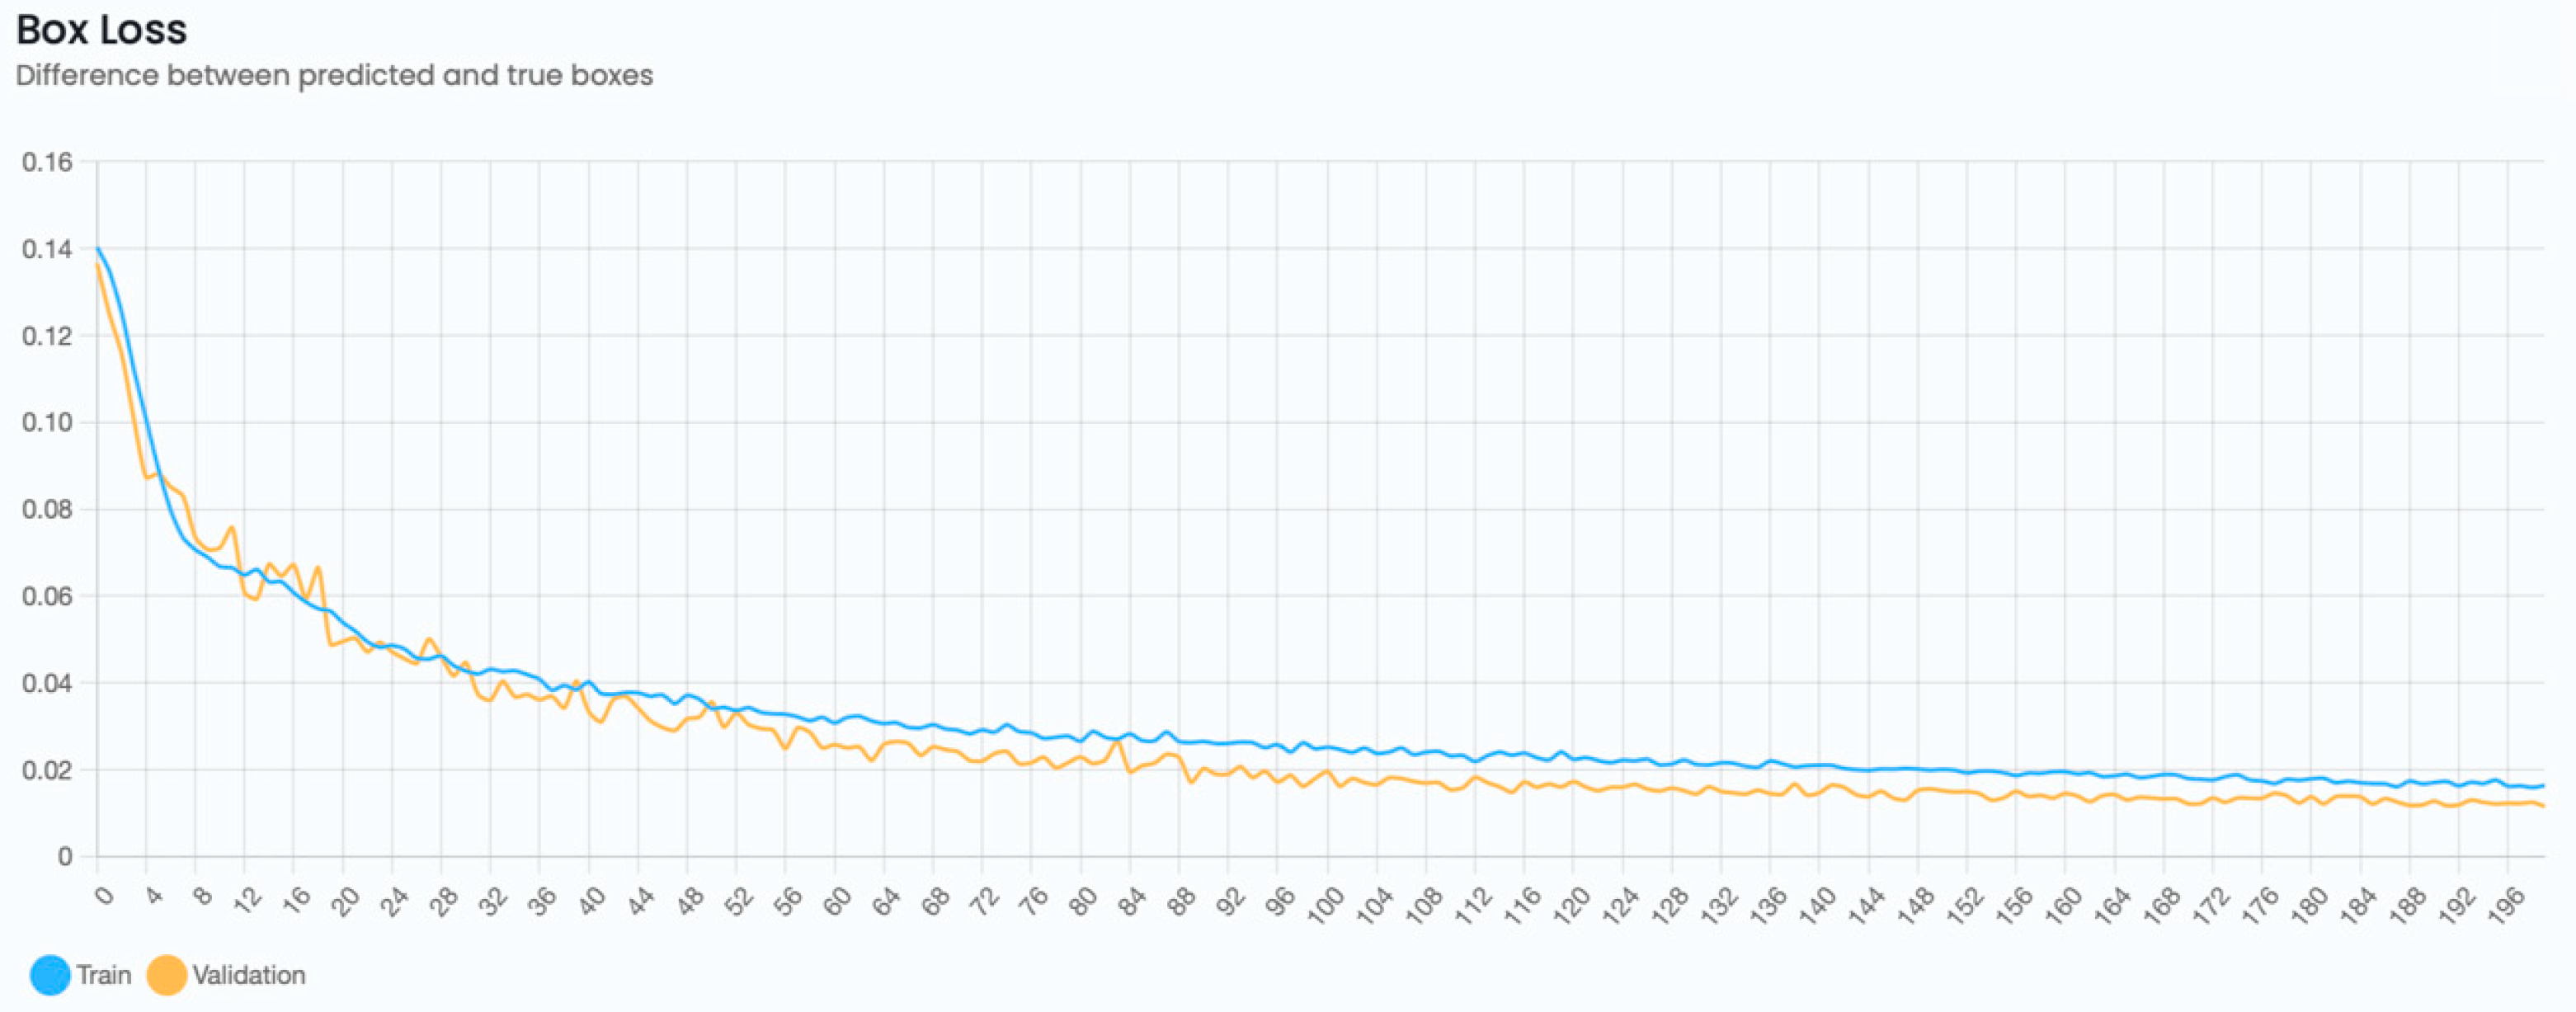
Figure A1.
Training of the YOLOv5n version on the UXOTi_NPA dataset (an eleven UXO class detection problem): Box loss with respect to the epoch for training (blue) and validation (orange) sets.
Figure A1.
Training of the YOLOv5n version on the UXOTi_NPA dataset (an eleven UXO class detection problem): Box loss with respect to the epoch for training (blue) and validation (orange) sets.

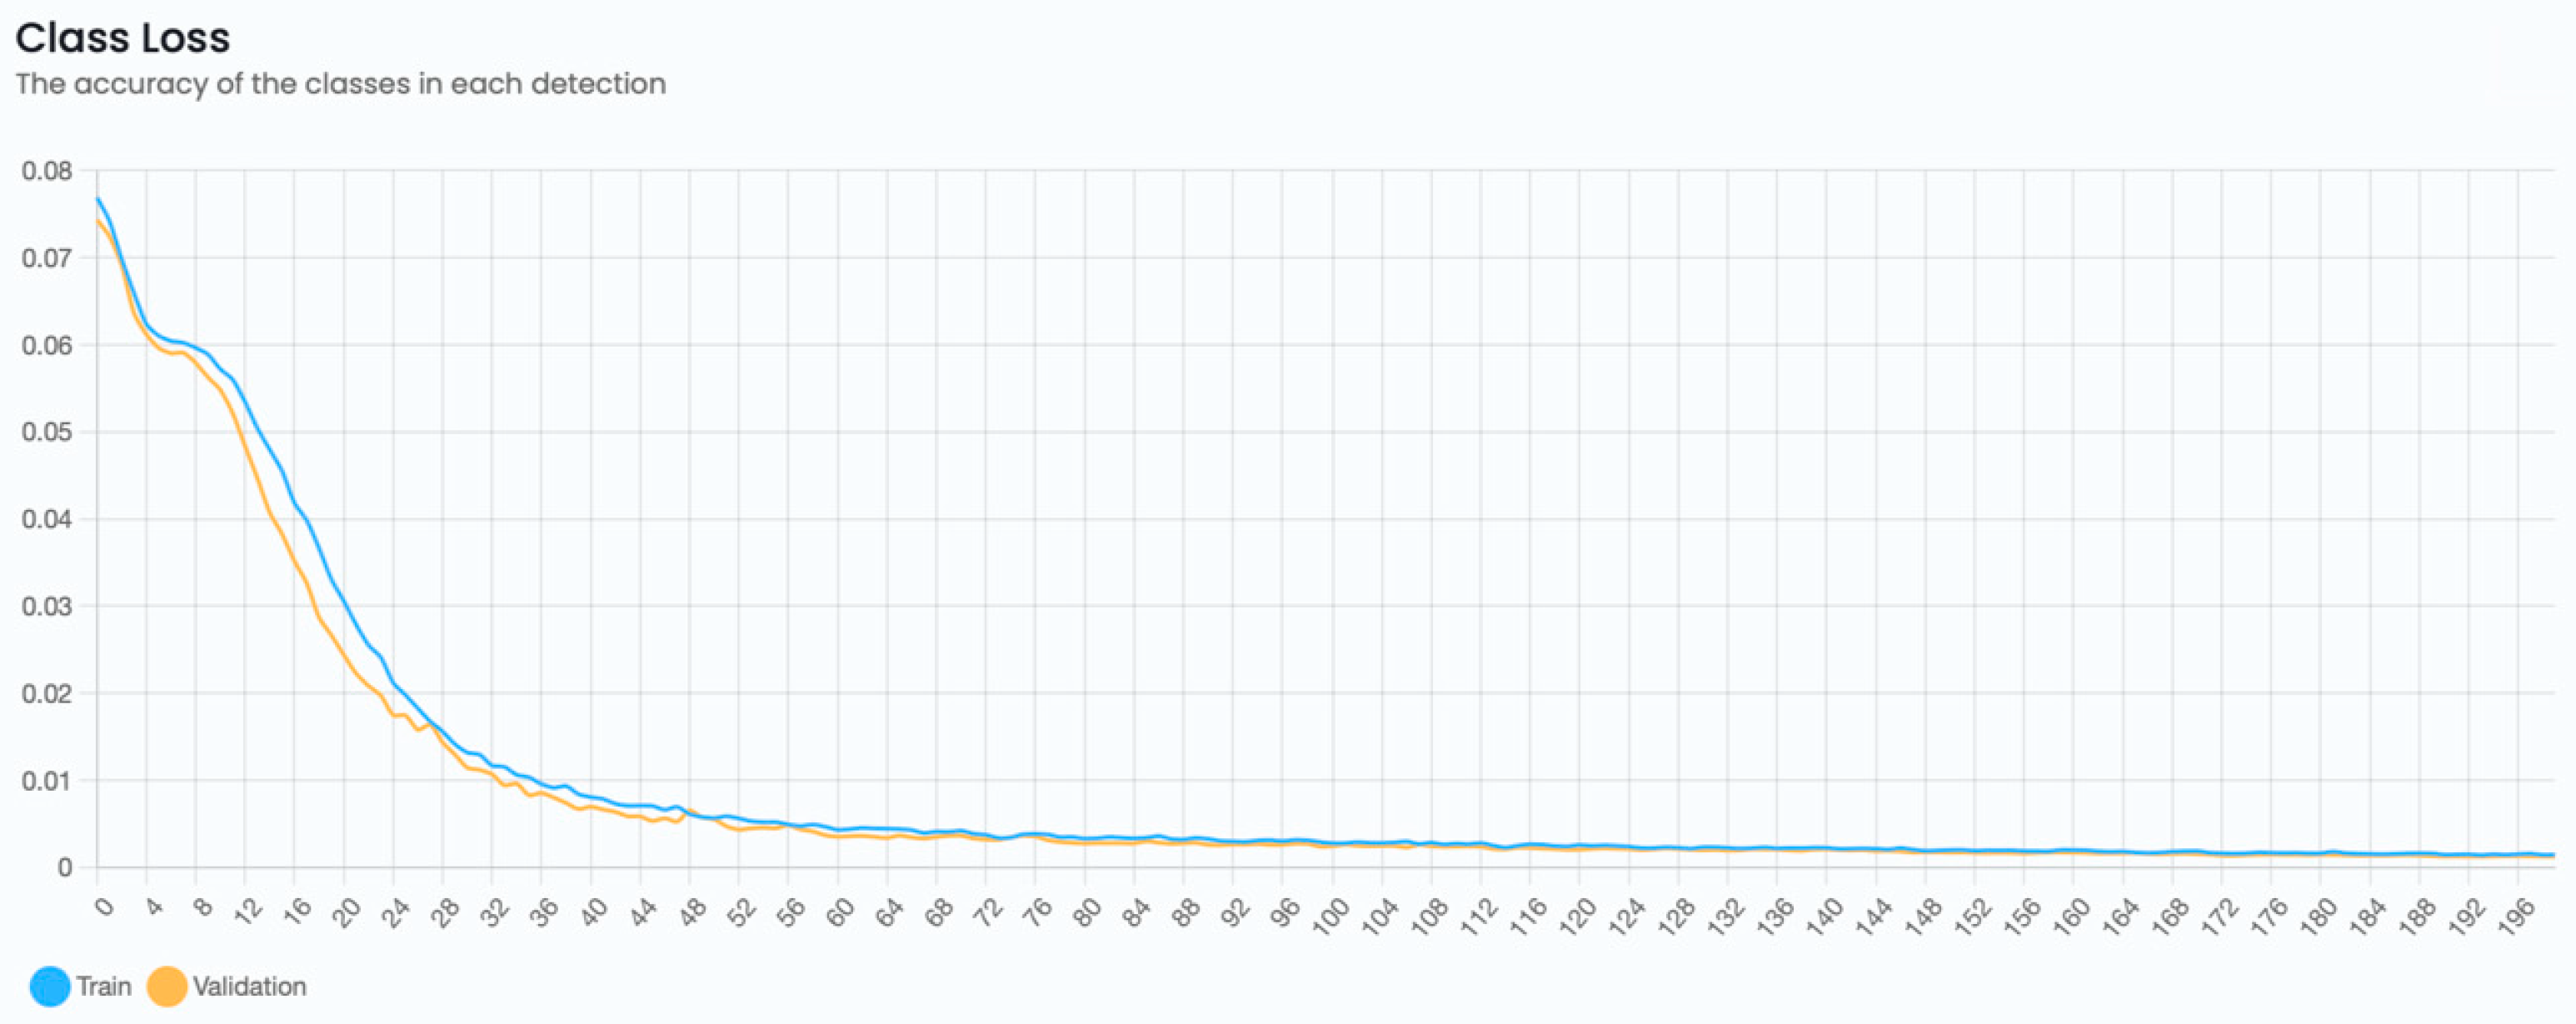
Figure A2.
Training of the YOLOv5n version on the UXOTi_NPA dataset (an eleven UXO class detection problem): Class loss with respect to the epoch for training (blue) and validation (orange) sets.
Figure A2.
Training of the YOLOv5n version on the UXOTi_NPA dataset (an eleven UXO class detection problem): Class loss with respect to the epoch for training (blue) and validation (orange) sets.

Figure A3.
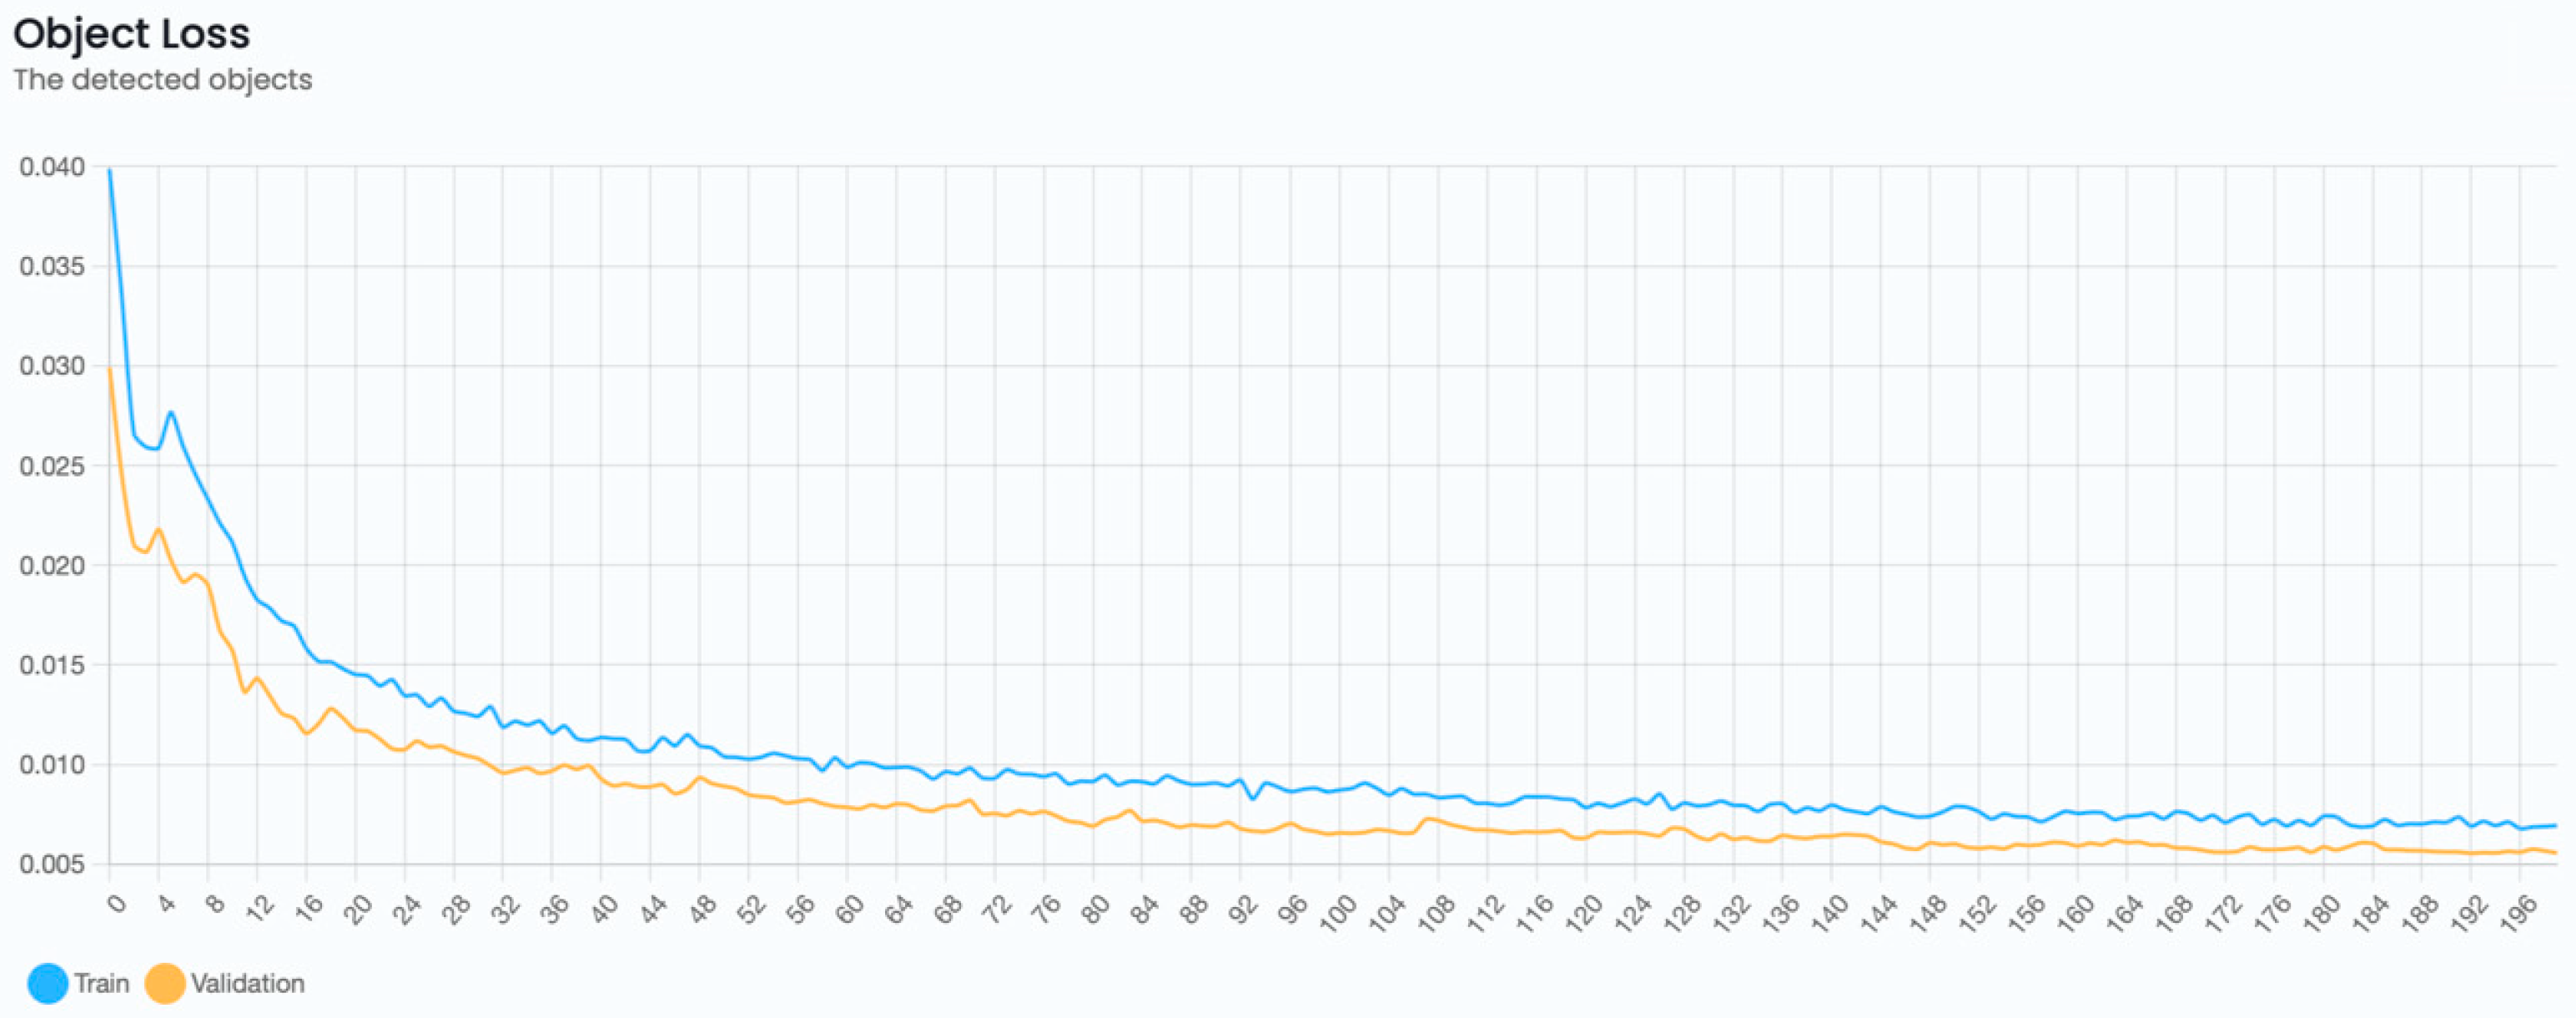
Training of the YOLOv5n version on the UXOTi_NPA dataset (an eleven UXO class detection problem): Object loss with respect to the epoch for training (blue) and validation (orange) sets.
Figure A3.
Training of the YOLOv5n version on the UXOTi_NPA dataset (an eleven UXO class detection problem): Object loss with respect to the epoch for training (blue) and validation (orange) sets.

Figure A4.
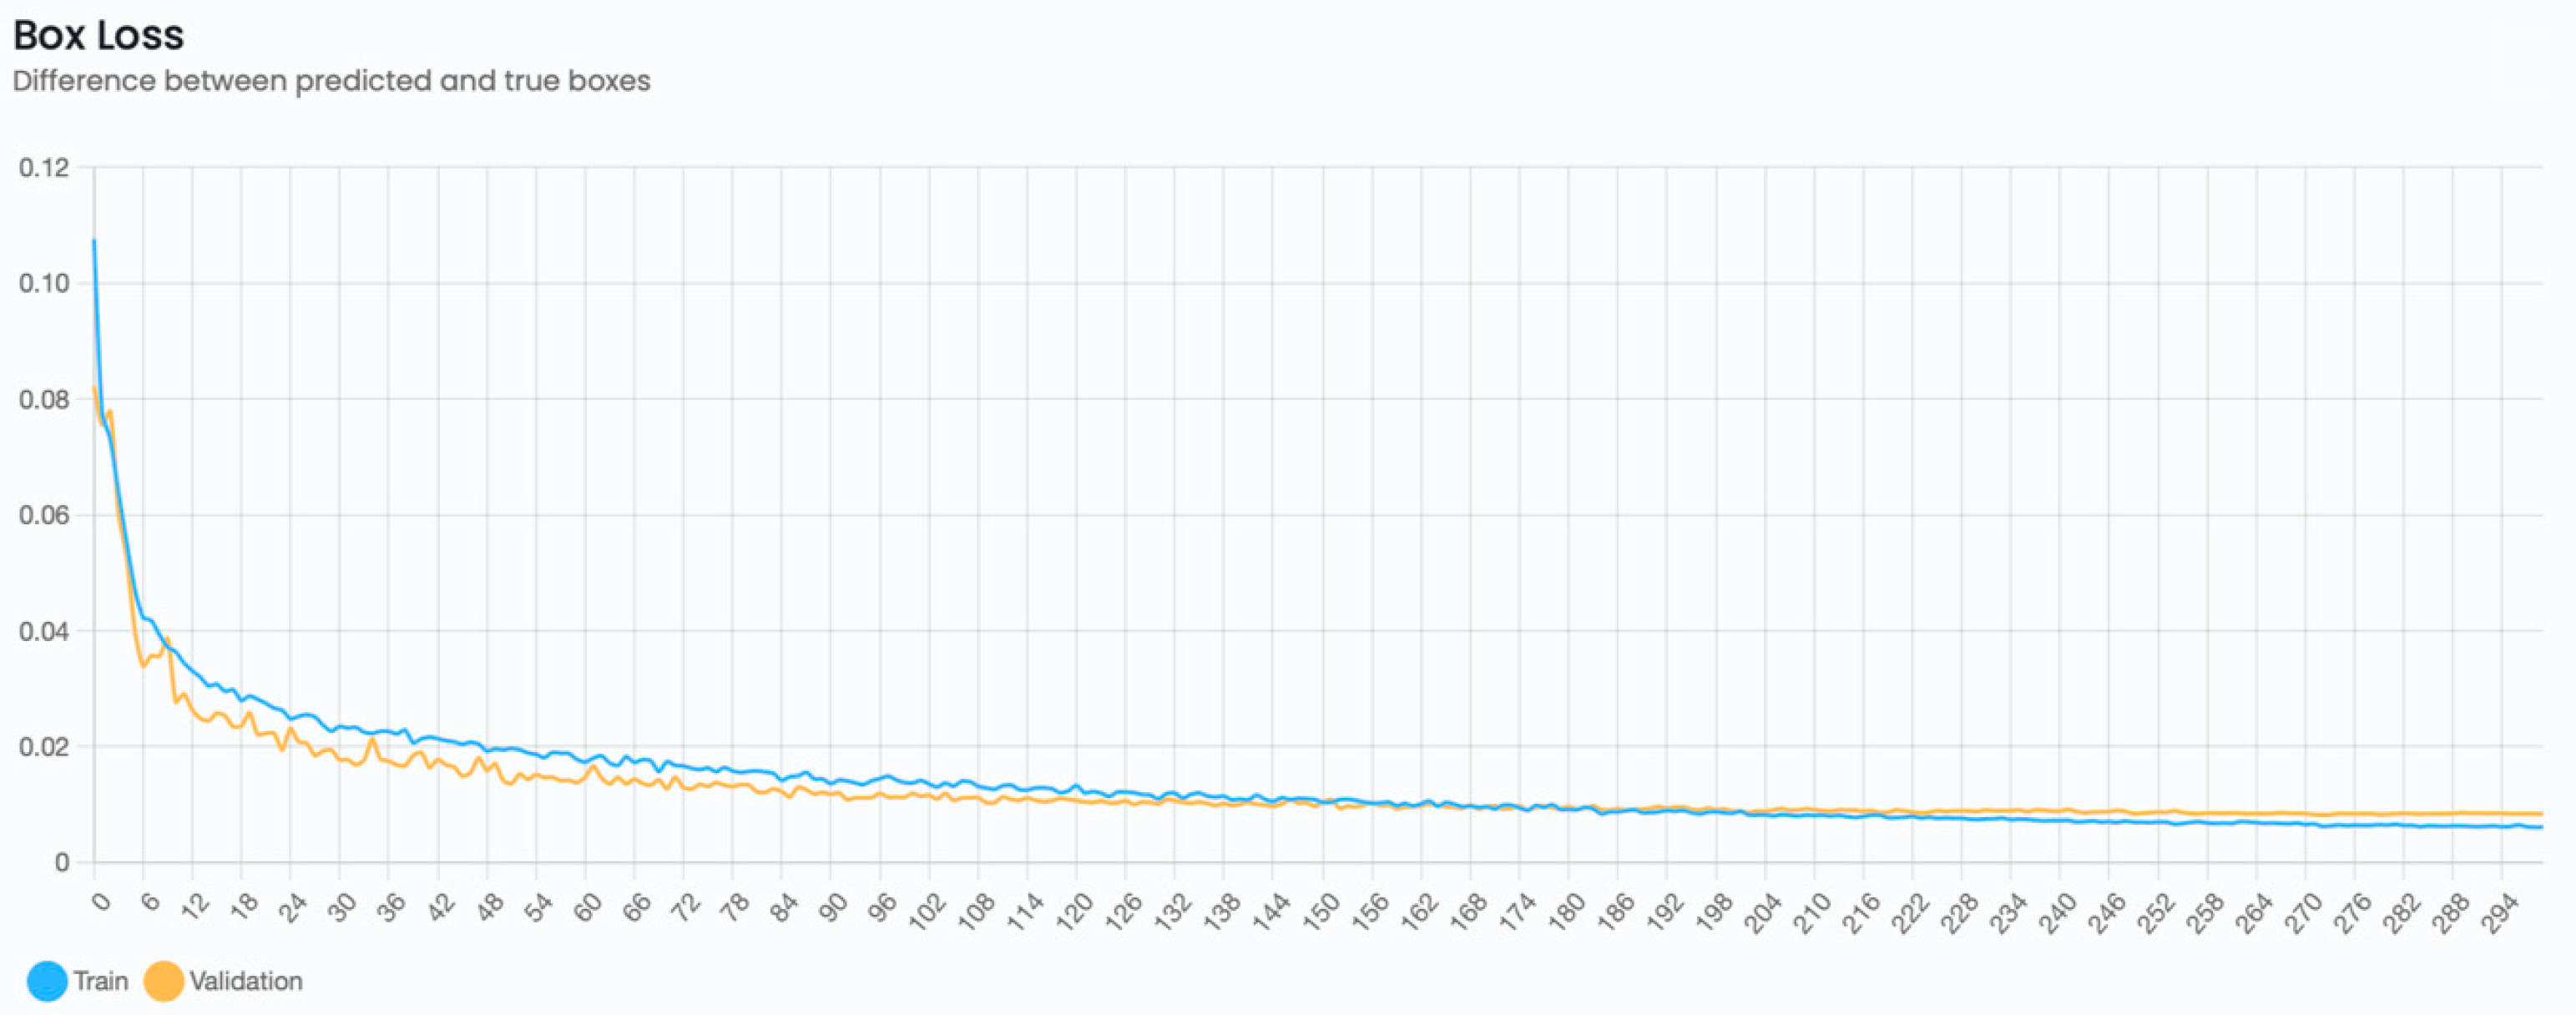
Training of the YOLOv5x version on the UXOTi_NPA dataset (a single UXO class detection problem): Box loss with respect to the epoch for training (blue) and validation (orange) sets.
Figure A4.
Training of the YOLOv5x version on the UXOTi_NPA dataset (a single UXO class detection problem): Box loss with respect to the epoch for training (blue) and validation (orange) sets.

Figure A5.
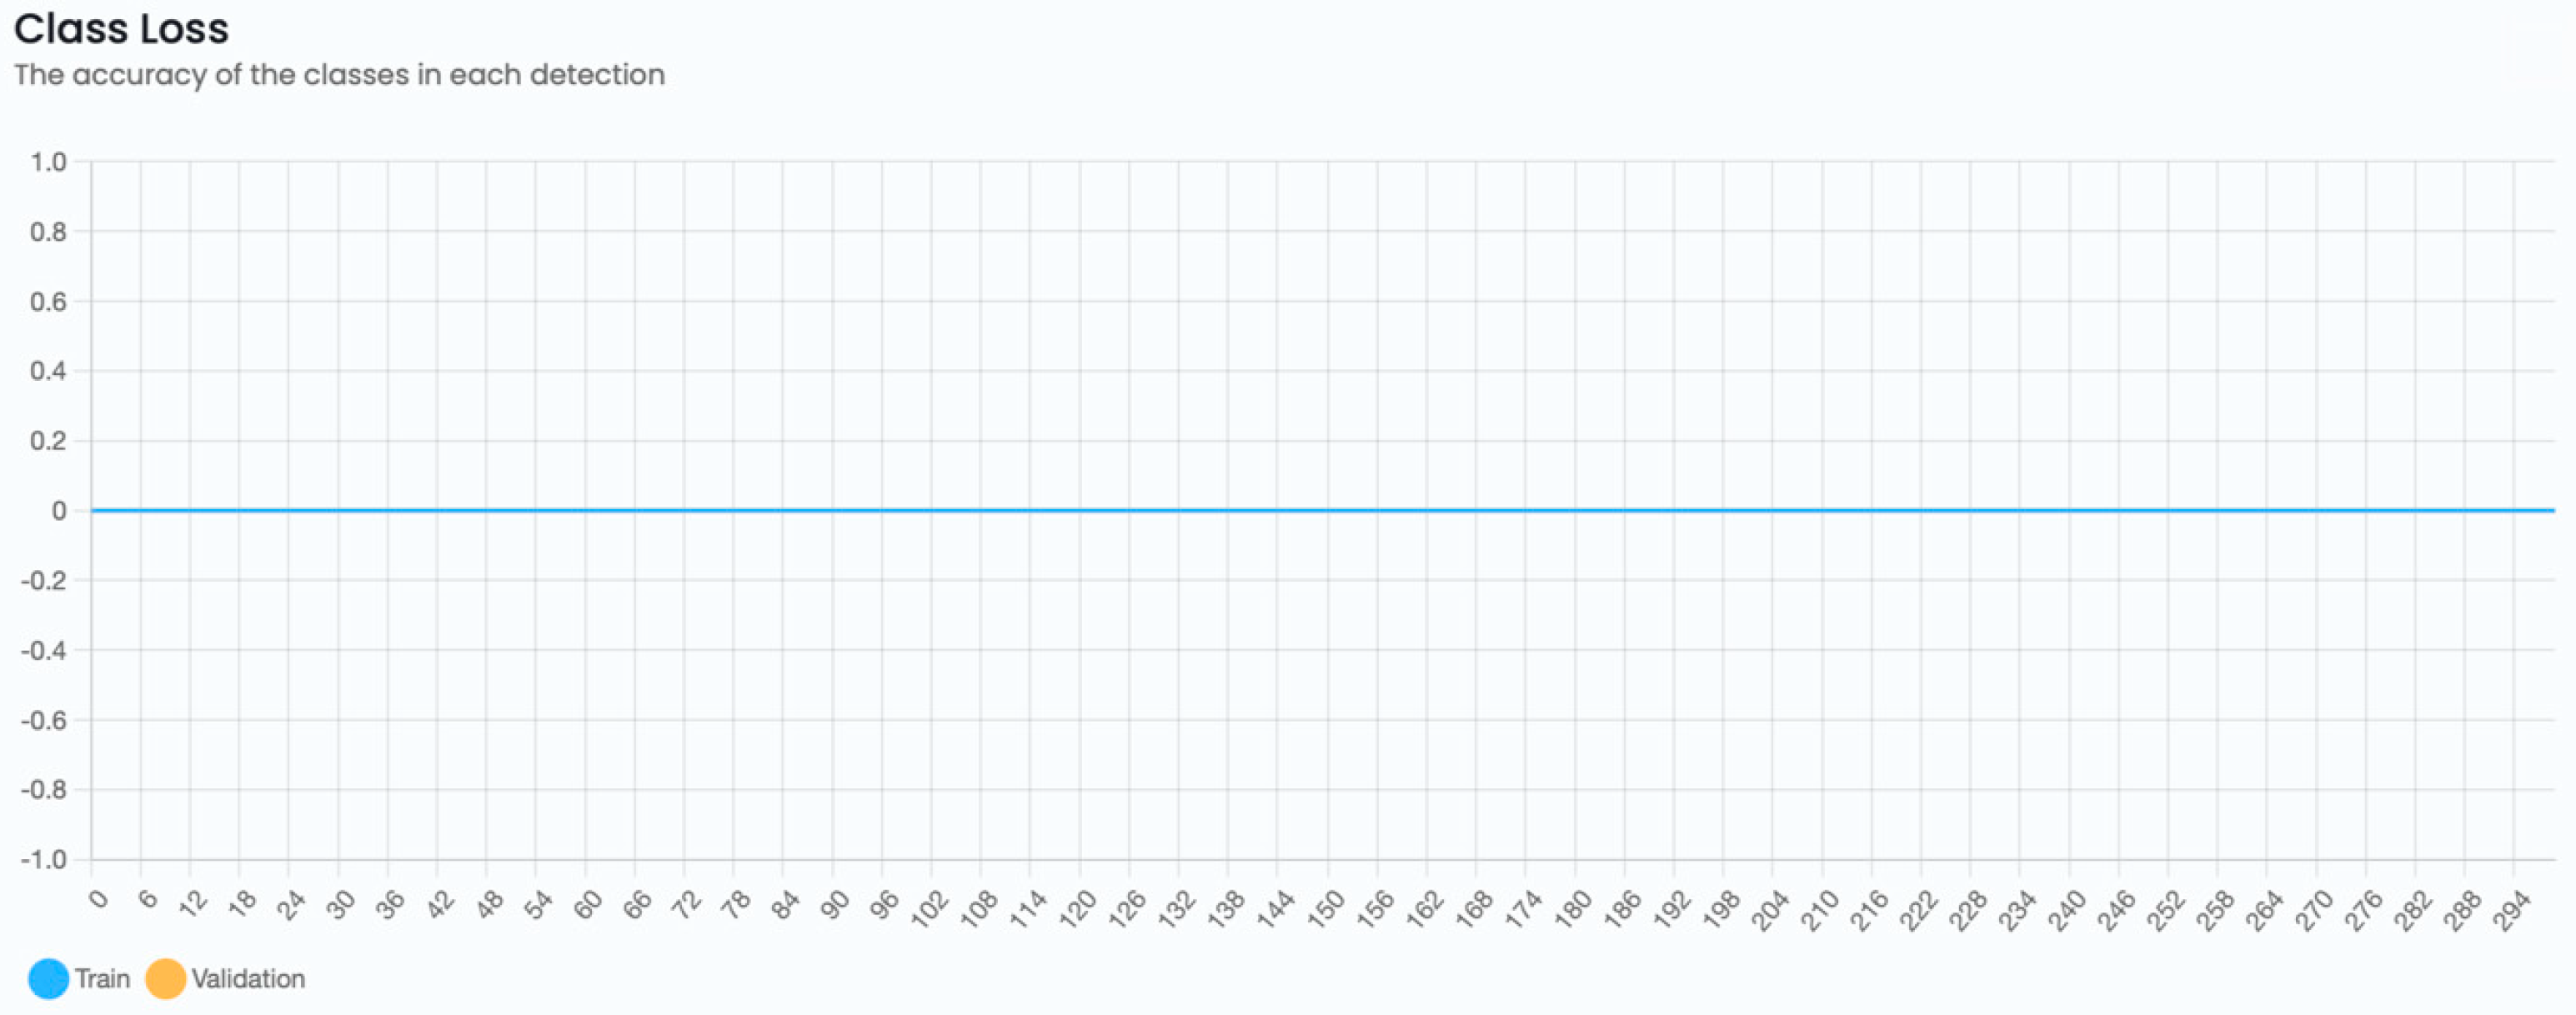
Training of the YOLOv5x version on the UXOTi_NPA dataset (a single UXO class detection problem): Class loss with respect to the epoch for training (blue) and validation (orange) sets.
Figure A5.
Training of the YOLOv5x version on the UXOTi_NPA dataset (a single UXO class detection problem): Class loss with respect to the epoch for training (blue) and validation (orange) sets.

Figure A6.
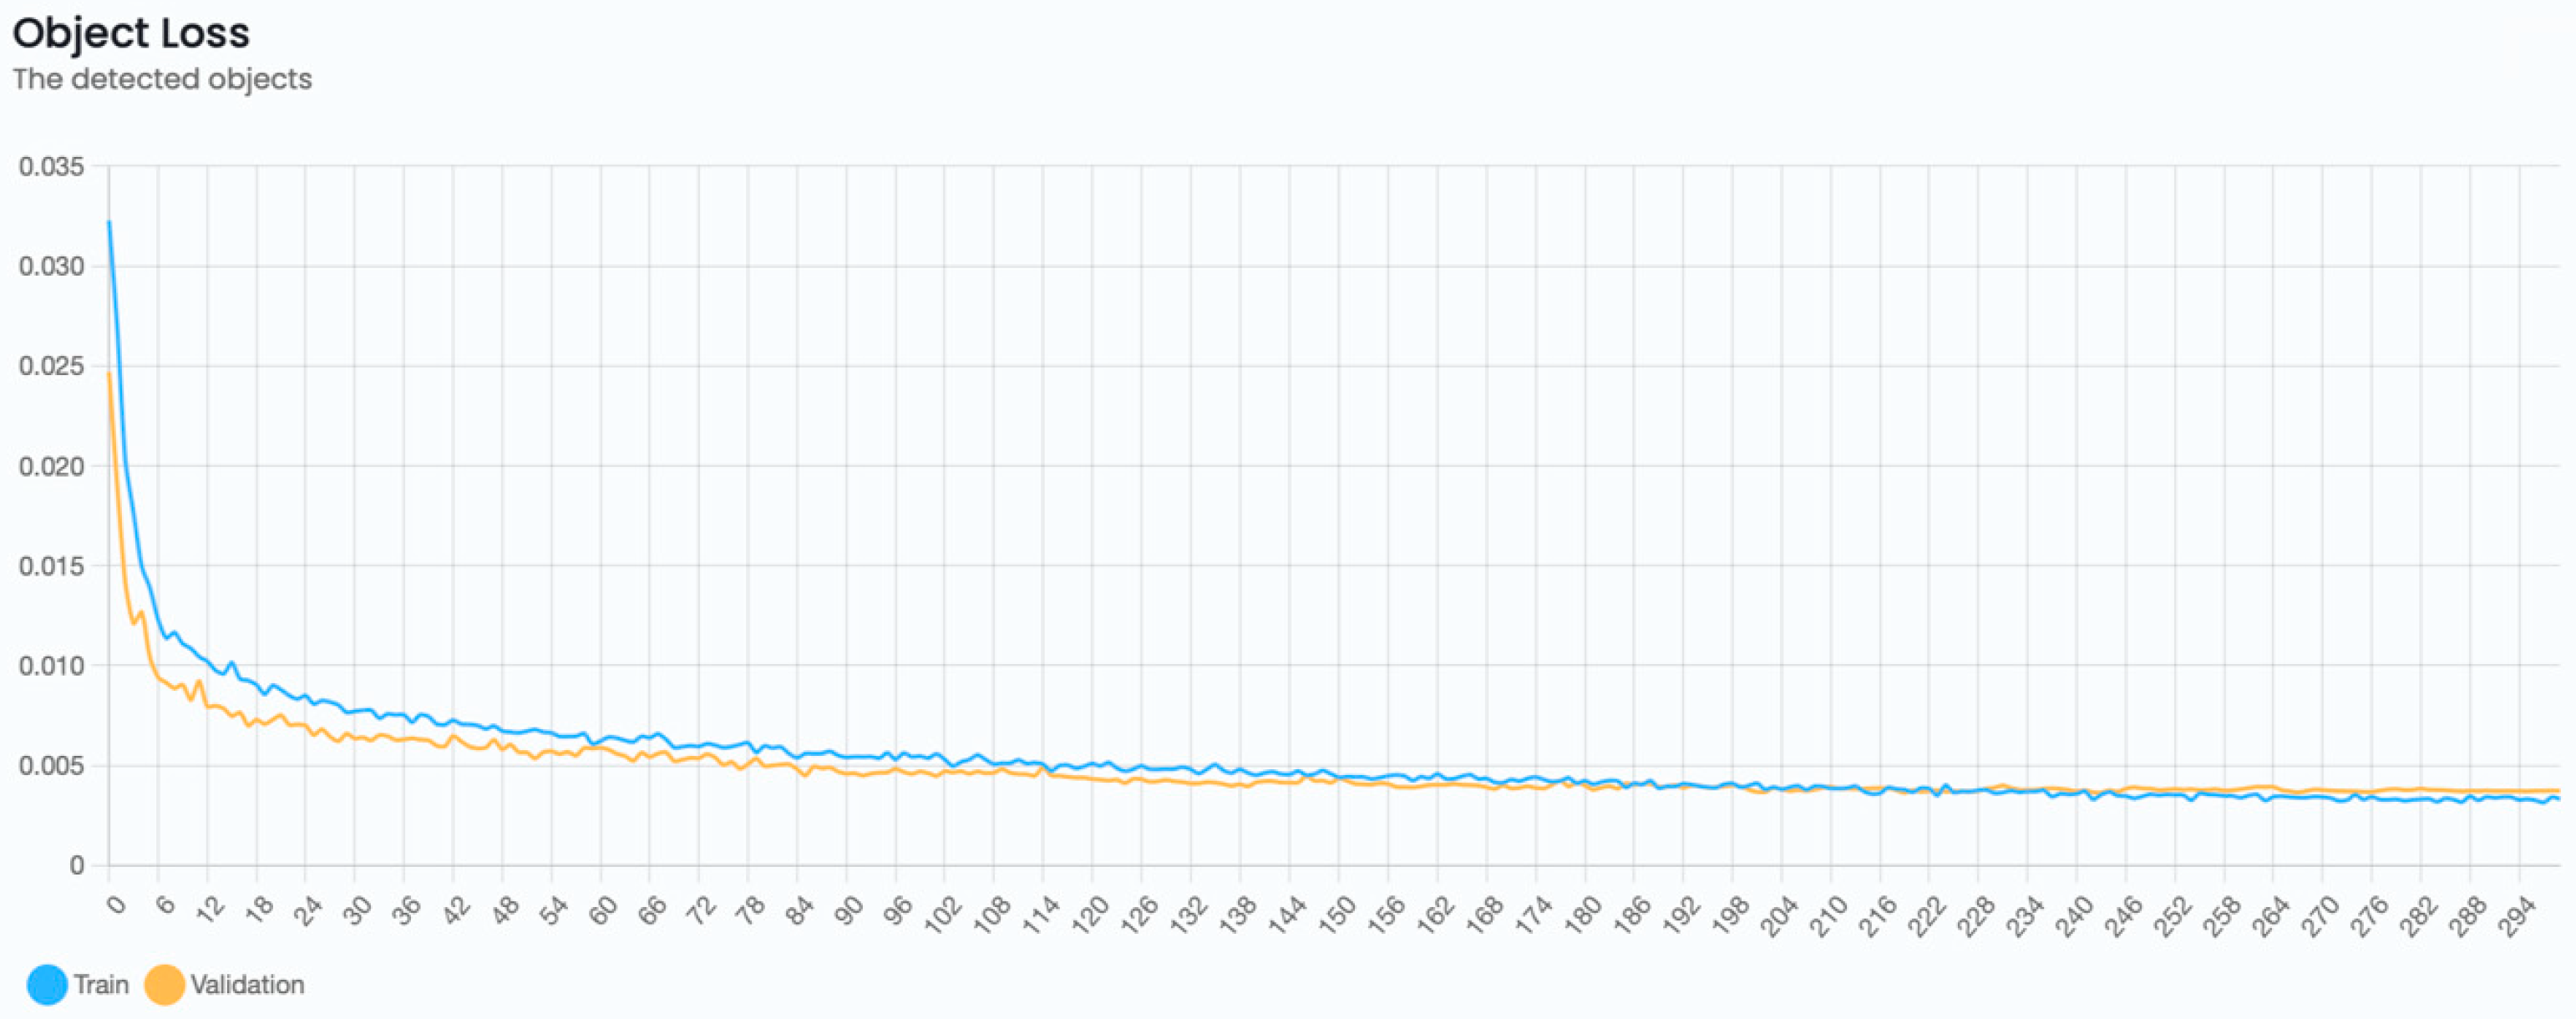
Training of the YOLOv5x version on the UXOTi_NPA dataset (a single UXO class detection problem): Object loss with respect to the epoch for training (blue) and validation (orange) sets.
Figure A6.
Training of the YOLOv5x version on the UXOTi_NPA dataset (a single UXO class detection problem): Object loss with respect to the epoch for training (blue) and validation (orange) sets.

References
- Teena, M.; Manickavasagan, A. Thermal Infrared Imaging. In Imaging with Electromagnetic Spectrum; Manickavasagan, A., Jayasuriya, H., Eds.; Springer: Berlin/Heidelberg, Germany, 2014; pp. 147–173. ISBN 978-3-642-54887-1. [Google Scholar]
- Messina, G.; Modica, G. Applications of UAV Thermal Imagery in Precision Agriculture: State of the Art and Future Research Outlook. Remote Sens. 2020, 12, 1491. [Google Scholar] [CrossRef]
- Harrison, P. Thermal Imaging and its Military Applications. RUSI J. 1977, 122, 68–74. [Google Scholar] [CrossRef]
- Kuenzer, C.; Dech, S. (Eds.) Thermal Infrared Remote Sensing: Sensors, Methods, Applications. In Remote Sensing and Digital Image Processing; Springer: Dordrecht, The Netherlands, 2013; ISBN 978-94-007-6639-6. [Google Scholar]
- Roberts, S.; Williams, J. After the Guns Fall Silent: The Enduring Legacy of Landmines; Oxfam: Oxford, UK, 1995; ISBN 0-85598-337-X. [Google Scholar]
- GICHD. Explosive Ordnance Guide for Ukraine—Second Edition. Available online: https://www.gichd.org/fileadmin/GICHD-resources/rec-documents/GICHD_Ukraine_Guide_2022_Second_Edition_web.pdf (accessed on 15 December 2022).
- Types of Explosive Ordances. Available online: https://www.gichd.org/en/explosive-ordnance/ (accessed on 15 December 2022).
- Bajic, M. Testing of Remotely Piloted Aircraft Systems with a Thermal Infrared Camera to Detect Explosive Devices at Con-Taminated Areas and Validation of Developed Standard Operational Procedures; Norwegian Peoples Aid: Oslo, Norway, 2020. [Google Scholar]
- Leira, F.S.; Helgesen, H.H.; Johansen, T.A.; Fossen, T.I. Object detection, recognition, and tracking from UAVs using a thermal camera. J. Field Robot. 2021, 38, 242–267. [Google Scholar] [CrossRef]
- Dai, X.; Yuan, X.; Wei, X. TIRNet: Object detection in thermal infrared images for autonomous driving. Appl. Intell. 2020, 51, 1244–1261. [Google Scholar] [CrossRef]
- Banuls, A.; Mandow, A.; Vazquez-Martin, R.; Morales, J.; Garcia-Cerezo, A. Object Detection from Thermal Infrared and Visible Light Cameras in Search and Rescue Scenes. In Proceedings of the 2020 IEEE International Symposium on Safety, Security, and Rescue Robotics (SSRR), Abu Dhabi, United Arab Emirates, 4 November 2020; pp. 380–386. [Google Scholar]
- Nikulin, A.; De Smet, T.S.; Baur, J.; Frazer, W.D.; Abramowitz, J.C. Detection and Identification of Remnant PFM-1 ‘Butterfly Mines’ with a UAV-Based Thermal-Imaging Protocol. Remote Sens. 2018, 10, 1672. [Google Scholar] [CrossRef]
- Krause, P.; Salahat, E.; Franklin, E. Diurnal Thermal Dormant Landmine Detection Using Unmanned Aerial Vehicles. In Proceedings of the IECON 2018—44th Annual Conference of the IEEE Industrial Electronics Society, Washington, DC, USA, 21-23 October 2018; pp. 2299–2304. [Google Scholar]
- Yao, Y.; Wen, M.; Wang, Y. Multi-Temporal IR Thermography For Mine Detection. In Proceedings of the 2019 10th Interna-tional Workshop on the Analysis of Multitemporal Remote Sensing Images (MultiTemp), Shanghai, China, 5–7 August 2019; pp. 1–4. [Google Scholar]
- Baur, J.; Steinberg, G.; Nikulin, A.; Chiu, K.; de Smet, T.S. Applying Deep Learning to Automate UAV-Based Detection of Scatterable Landmines. Remote Sens. 2020, 12, 859. [Google Scholar] [CrossRef]
- Kristo, M.; Ivasic-Kos, M.; Pobar, M. Thermal Object Detection in Difficult Weather Conditions Using YOLO. IEEE Access 2020, 8, 125459–125476. [Google Scholar] [CrossRef]
- Redmon, J.; Divvala, S.; Girshick, R.; Farhadi, A. You Only Look Once: Unified, Real-Time Object Detection. In Proceedings of the 2016 IEEE Conference on Computer Vision and Pattern Recognition (CVPR), Las Vegas, NV, USA, 27–30 June 2016; pp. 779–788. [Google Scholar]
- Kong, L.; Wang, J.; Zhao, P. YOLO-G: A Lightweight Network Model for Improving the Performance of Military Targets Detection. IEEE Access 2022, 10, 55546–55564. [Google Scholar] [CrossRef]
- Li, S.; Li, Y.; Li, Y.; Li, M.; Xu, X. YOLO-FIRI: Improved YOLOv5 for Infrared Image Object Detection. IEEE Access 2021, 9, 141861–141875. [Google Scholar] [CrossRef]
- Wang, Y.; Bashir, S.M.A.; Khan, M.; Ullah, Q.; Wang, R.; Song, Y.; Guo, Z.; Niu, Y. Remote sensing image super-resolution and object detection: Benchmark and state of the art. Expert Syst. Appl. 2022, 197, 116793. [Google Scholar] [CrossRef]
- Bajić, M., Jr.; Potočnik, B. UXOTi_NPA 11 class UXO thermal images dataset. 2022. Available online: https://github.com/MilanBajicjr/UXOTi_NPA (accessed on 15 December 2022).
- Zenmuse XT. Available online: https://www.dji.com/hr/Zenmuse-Xt (accessed on 15 December 2022).
- CVAT. Available online: https://www.Cvat.Ai (accessed on 15 December 2022).
- Guan, L.; Jia, L.; Xie, Z.; Yin, C. A Lightweight Framework for Obstacle Detection in the Railway Image Based on Fast Region Proposal and Improved YOLO-Tiny Network. IEEE Trans. Instrum. Meas. 2022, 71, 1–16. [Google Scholar] [CrossRef]
- Ultralytics. Available online: https://Ultralytics.com (accessed on 15 December 2022).
- Lin, T.-Y.; Maire, M.; Belongie, S.; Hays, J.; Perona, P.; Ramanan, D.; Dollár, P.; Zitnick, C.L. Microsoft Coco: Common Objects in Context. In Proceedings of the European Conference on Computer Vision, Zurich, Switzerland, 6–12 September 2014; Springer: Berlin/Heidelberg, Germany, 2014; pp. 740–755. [Google Scholar]
- YOLOv5 Models. Available online: https://Github.com/Ultralytics/Yolov5 (accessed on 15 December 2022).
- Wang, C.-Y.; Mark Liao, H.-Y.; Wu, Y.-H.; Chen, P.-Y.; Hsieh, J.-W.; Yeh, I.-H. CSPNet: A New Backbone That Can Enhance Learning Capability of CNN. In Proceedings of the 2020 IEEE/CVF Conference on Computer Vision and Pattern Recognition Workshops (CVPRW), Seattle, WA, USA, 14–19 June 2020; pp. 1571–1580. [Google Scholar]
- Redmon, J.; Farhadi, A. YOLOv3: An Incremental Improvement. arXiv 2018, arXiv:1804.02767. [Google Scholar]
- Liu, S.; Qi, L.; Qin, H.; Shi, J.; Jia, J. Path Aggregation Network for Instance Segmentation. In Proceedings of the 2018 IEEE/CVF Conference on Computer Vision and Pattern Recognition, Salt Lake City, UT, USA, 18–23 June 2018; pp. 8759–8768. [Google Scholar]
- Xu, R.; Lin, H.; Lu, K.; Cao, L.; Liu, Y. A Forest Fire Detection System Based on Ensemble Learning. Forests 2021, 12, 217. [Google Scholar] [CrossRef]
Figure 1.
Sample thermal image from the UXOTi_NPA dataset.

Figure 2.
Comparison of five YOLOv5 models, trained on the COCO dataset.

Figure 3.
Architecture of the YOLOv5 model represented by basic building blocks.

Figure 4.
Qualitative results for the eleven UXO class detection problem: Expert annotations are overlaid on the thermal images (left column) and bounding boxes with UXOs, detected by using the retrained YOLOv5n (rows 1 and 3, right column), or YOLOv5x (rows 2 and 4, right column). The class index and detection probability are written next to the bounding box (right column).

Figure 5.
Qualitative results for the single UXO class detection problem: Expert annotations are overlaid on the thermal images (left column) and bounding boxes with UXOs, detected by using the retrained YOLOv5n (rows 1 and 3, right column) or YOLOv5x (rows 2 and 4, right column). A single class index 1 and detection probability are written next to the bounding box (right column).

Figure 6.
A land mine with a green metal casing placed on green grass: An image in the visible spectrum (top), the same terrain in the thermal spectrum (middle), and the result of our eleven UXO class detection algorithm (bottom). Note: This example is from our private database and is not part of the UXOTi_NPA dataset.


Table 1.
UXO objects from each of the eleven classes. Such objects appear in images from our evaluation dataset.
Table 1.
UXO objects from each of the eleven classes. Such objects appear in images from our evaluation dataset.
| Class | Name and Type | Dimensions (mm) | Number of Occurrences in Dataset | RGB Image | Thermal Image |
|---|---|---|---|---|---|
| 0 | Mortar mine M: 60 mm | 300 × 60 | 139 |  |  |
| 1 | Fuse M: 125 mm | 106 × 40 | 161 |  |  |
| 2 | Hand grenade | 89 × 57 | 121 |  |  |
| 3 | AP land mine PMR čapljinka | 192 × 78 | 104 |  |  |
| 4 | Bullet 30.2 mm | 330 × 30.2 | 116 |  |  |
| 5 | Land mine PMR 2A | 192 × 66 | 136 |  |  |
| 6 | Mortar mine M: 82 mm | 375 × 82 | 149 |  |  |
| 7 | Land mine PMR 3 | 192 × 77 | 150 |  |  |
| 8 | Land mine PROM 1 | 260 × 75 | 139 |  |  |
| 9 | Land mine PMA 3 | 111 × 111 | 79 |  |  |
| 10 | Tromblon mine TTM RP | 307 × 30 | 161 |  |  |
Table 2.
Comparison of five mainstream YOLOv5 detection models, trained and evaluated on the COCO dataset. The results were taken from [27].
Table 2.
Comparison of five mainstream YOLOv5 detection models, trained and evaluated on the COCO dataset. The results were taken from [27].
| Model | [email protected] | [email protected]:0.95 | Parameters (in Million) |
|---|---|---|---|
| YOLOv5n | 45.7% | 28.0% | 1.9 |
| YOLOv5s | 56.8% | 37.4% | 7.2 |
| YOLOv5m | 64.1% | 45.4% | 21.2 |
| YOLOv5l | 67.3% | 49.0% | 46.5 |
| YOLOv5x | 68.9% | 50.7% | 86.7 |
Table 3.
Hyperparameters utilised in this study for all five versions of the YOLOv5 model.
| Hyperparameter | Value |
|---|---|
| lr0—Initial learning rate | 0.01 |
| lrf—Final OneCycleLR learning rate | 0.01 |
| momentum—SGD momentum/Adam beta1 | 0.937 |
| weight_decay—Optimizer weight decay | 0.0005 |
| warmpup_epochs—Warmup epochs | 3.0 |
| warmup_momentum—Warmup initial momentum | 0.8 |
| warmup_bias_lr—Warmup initial bias lr | 0.1 |
| box—Box loss gain | 0.05 |
| cls—cls loss gain | 0.5 |
| cls_pw—cls BCELoss positive_weight | 1.0 |
| obj—Object loss gain | 1.0 |
| obj_pw—Object BCELoss positive_weight | 1.0 |
| iou_t—IoU training threshold | 0.20 |
| anchor_t—Anchor-multiple threshold | 4.0 |
| fl_gamma—Focal loss gamma | 0.0 |
| hsv_h—Image HSV-Hue augmentation | 0.015 |
| hsv_s—Image HSV-Saturation augmentation | 0.7 |
| hsv_v—Image HSV-Value augmentation | 0.4 |
| degrees—Image rotation | 0.0 |
| translate—Image translation | 0.1 |
| scale—Image scale | 0.5 |
| shear—Image shear | 0.0 |
| perspective—Image perspective | 0.0 |
| flipud—Image flip up-down (probability) | 0.0 |
| fliplr—Image flip left-right (probability) | 0.5 |
| mosaic—Image mosaic (probability) | 1.0 |
| mixup—Image mixup (probability) | 0.0 |
| copy_paste—Segment copy-paste (probability) | 0.0 |
Table 4.
Effectiveness of five versions of the YOLOv5 model, retrained on the UXOTi_NPA dataset: an eleven UXO class detection problem. The best results are bolded. The column ‘Parameters’ presents the number of CNN-free parameters.
Table 4.
Effectiveness of five versions of the YOLOv5 model, retrained on the UXOTi_NPA dataset: an eleven UXO class detection problem. The best results are bolded. The column ‘Parameters’ presents the number of CNN-free parameters.
| Version of YOLOv5 | Precision | Recall | [email protected] | [email protected]:0.95 | Parameters |
|---|---|---|---|---|---|
| YOLOv5n | 98.3% | 100% | 99.5% | 87.0% | 1.8 M |
| YOLOv5s | 98.8% | 100% | 99.5% | 88.5% | 7.1 M |
| YOLOv5m | 98.5% | 100% | 99.5% | 89.9% | 21.1 M |
| YOLOv5l | 98.4% | 100% | 99.5% | 90.5% | 46.4 M |
| YOLOv5x | 98.6% | 100% | 99.5% | 89.7% | 86.6 M |
Table 5.
Effectiveness of five versions of the YOLOv5 model, retrained on the UXOTi_NPA dataset: a single UXO class detection problem. The best results are bolded. The column ‘Parameters’ presents the number of CNN-free parameters.
Table 5.
Effectiveness of five versions of the YOLOv5 model, retrained on the UXOTi_NPA dataset: a single UXO class detection problem. The best results are bolded. The column ‘Parameters’ presents the number of CNN-free parameters.
| Version of YOLOv5 | Precision | Recall | [email protected] | [email protected]:0.95 | Parameters |
|---|---|---|---|---|---|
| YOLOv5n | 99.0% | 100% | 99.5% | 87.9% | 1.8 M |
| YOLOv5s | 99.4% | 100% | 99.5% | 90.5% | 7.1 M |
| YOLOv5m | 98.9% | 100% | 99.4% | 90.6% | 21.1 M |
| YOLOv5l | 99.4% | 100% | 99.5% | 91.1% | 46.4 M |
| YOLOv5x | 99.3% | 100% | 99.5% | 91.5% | 86.6 M |
Table 6.
Class-wise effectiveness for the YOLOv5n model, retrained on the UXOTi_NPA dataset: an eleven UXO class detection problem. The best results are bolded. The column ‘Instances’ presents the number of UXOs in a class. The Confidence threshold is 0.001, and IoU threshold is 0.5.
Table 6.
Class-wise effectiveness for the YOLOv5n model, retrained on the UXOTi_NPA dataset: an eleven UXO class detection problem. The best results are bolded. The column ‘Instances’ presents the number of UXOs in a class. The Confidence threshold is 0.001, and IoU threshold is 0.5.
| Class | Instances | Precision | Recall | [email protected] | [email protected]:0.95 |
|---|---|---|---|---|---|
| 0 | 12 | 91.5% | 100% | 99.5% | 86.1% |
| 1 | 11 | 98.9% | 100% | 99.5% | 93.2% |
| 2 | 14 | 99.7% | 100% | 99.5% | 68.0% |
| 3 | 15 | 99.5% | 100% | 99.5% | 88.8% |
| 4 | 16 | 99.2% | 100% | 99.5% | 92.5% |
| 5 | 31 | 100% | 96.7% | 99.5% | 79.5% |
| 6 | 40 | 99.6% | 100% | 99.5% | 89.7% |
| 7 | 27 | 100% | 96.2% | 99.5% | 82.9% |
| 8 | 13 | 92.8% | 100% | 99.5% | 92.6% |
| 9 | 8 | 98.9% | 100% | 99.5% | 91.5% |
| 10 | 10 | 98.7% | 100% | 99.5% | 90.0% |
Disclaimer/Publisher’s Note: The statements, opinions and data contained in all publications are solely those of the individual author(s) and contributor(s) and not of MDPI and/or the editor(s). MDPI and/or the editor(s) disclaim responsibility for any injury to people or property resulting from any ideas, methods, instructions or products referred to in the content. |
© 2023 by the authors. Licensee MDPI, Basel, Switzerland. This article is an open access article distributed under the terms and conditions of the Creative Commons Attribution (CC BY) license (https://creativecommons.org/licenses/by/4.0/).
Share and Cite
MDPI and ACS Style
Bajić, M., Jr.; Potočnik, B. UAV Thermal Imaging for Unexploded Ordnance Detection by Using Deep Learning. Remote Sens. 2023, 15, 967. https://0-doi-org.brum.beds.ac.uk/10.3390/rs15040967
AMA Style
Bajić M Jr., Potočnik B. UAV Thermal Imaging for Unexploded Ordnance Detection by Using Deep Learning. Remote Sensing. 2023; 15(4):967. https://0-doi-org.brum.beds.ac.uk/10.3390/rs15040967
Chicago/Turabian StyleBajić, Milan, Jr., and Božidar Potočnik. 2023. "UAV Thermal Imaging for Unexploded Ordnance Detection by Using Deep Learning" Remote Sensing 15, no. 4: 967. https://0-doi-org.brum.beds.ac.uk/10.3390/rs15040967
Note that from the first issue of 2016, this journal uses article numbers instead of page numbers. See further details here.