Article

Spatio-Temporal Variations in Soil pH and Aluminum Toxicity in Sub-Saharan African Croplands (1980–2050)

by
Yves Uwiragiye
1,2,3,
Qahtan Abdul Wahid Khalaf
4,
Hayssam M. Ali
5,
Mbezele Junior Yannick Ngaba
1,3,
Mingxia Yang
1,3,
Ahmed S. Elrys
6,7,8,
Zhujun Chen
1,3 and
Jianbin Zhou
1,3,*
1
College of Natural Resources and Environment, Northwest A&F University, Yangling 712100, China
2
Department of Agriculture, Faculty of Agriculture, Environmental Management and Renewable Energy, University of Technology and Arts of Byumba, Byumba P.O. Box 25, Rwanda
3
Key Laboratory of Plant Nutrition and the Agri-Environment in Northwest China, Ministry of Agriculture, Yangling 712100, China
4
Department of Medical Laboratory Techniques, College of Medical Technology, Al-Kitab University, Kirkuk 36001, Iraq
5
Department of Botany and Microbiology, College of Science, King Saud University, Riyadh 11451, Saudi Arabia
6
Soil Science Department, Faculty of Agriculture, Zagazig University, Zagazig 44511, Egypt
7
College of Tropical Crops, Hainan University, Haikou 570228, China
8
Liebig Centre for Agroecology and Climate Impact Research, Justus Liebig University, 35390 Giessen, Germany
*
Author to whom correspondence should be addressed.
Submission received: 16 December 2022 / Revised: 18 February 2023 / Accepted: 21 February 2023 / Published: 27 February 2023

Abstract

:
Soil acidity threatens food production in the tropics. The effect of increasing ammonium-based fertilizer (INF) on soil pH was assessed in sub-Saharan Africa (SSA). A total of 9043 soil data from Africa soil information services, past INF use, and two future scenarios of INF use (business as usual (BAU) and equitable diet (EqD)) were used to determine soil pH variations from 1980 to 2022 and to predict soil PH variations from 2022 to 2050. Random forest and extreme gradient boosting algorithms and soil-forming factor covariates were used for the spatio-temporal soil pH predictions. Topsoil acidification was shown to be significant, with mean annual decrements of 0.014, 0.024, and 0.048 from 1980 to 2022, 2022 to 2050 (BAU), and 2022 to 2050 (EqD), respectively. Over the past 42 years, croplands with soil pH < 6.5 have declined significantly, and soil acidification is predicted to become severe by 2050 in the BAU and EqD scenarios. This was indicated by a predicted 3% increase in croplands at risk of aluminum toxicity (soil pH < 5.5) from 66 × 106 ha in 2022 to 78.5 × 10⁶ ha in 2050. The drivers of the spatial variations in the soil pH between 1980 and 2050 were the MAP, basic cation, clay content, SOC, and nitrogen fertilizers. The evaluation metrics of the 10-fold cross-validation showed that the root mean squared errors (RMSEs) of the soil pH from 1980 to 2022, as well as the predicted soil PH from 2022 to 2050 (BAU) and 2022 to 2050 (EqD), were 0.53 pH units, 0.54 pH units, and 0.56 pH units, respectively, with coefficients of determination (R2) of 0.63, 0.64, and 0.66. The findings of this study can be used for the establishment of management strategies for increasing INF use in acidic soils.

Graphical Abstract

1. Introduction

Soil acidification is a main factor in the soil degradation of cropland worldwide [1] and it reduces food production and agricultural sustainability [2,3]. Soil acidification is characterized by the reduced availability of base cations (calcium (Ca2+), magnesium (Mg2+), and potassium (K+), low soil fertility, and low potential crop production [2,4]. At low soil pH (<5.5), aluminum (Al3+) and manganese (Mn2+) are released into the soil solution, causing root damage and yield losses [5]. Soil acidity is caused by the presence of hydrogen (H+) ions, which can be generated either naturally by soil formation processes or by anthropogenic activities [6]. The main processes of soil acidification are CO2 hydrolysis, atmospheric deposition, soil organic matter decomposition, nitrification, basic and anion uptake, Al3+ formation, Al3+ hydrolysis, nitrate leaching and basic cation leaching, root respiration, and the application of ammonium-based fertilizers [7,8] (Table S1). The root absorption of basic cations in excess anions and the long-term application of ammonium-based fertilizers is called second soil acidification [9,10]. For example, red-yellow Podzols experienced a decrease of 1.4 pH units after a two-year application of 360 kg N ha−1 yr−1 in Puerto Rico [11], whereas a five-year maize and cowpea rotation resulted in a reduction of 0.84 pH units in Nigeria [12], and three tropical soils (Luvisols, Acrisols, and Ferralsols) in southwest Nigeria showed a reduction of 1.7 pH units when 80–120 kg N ha−1 yr−1 was applied [13]. The effect of excessive N fertilizer on soil pH was observed in SSA cropland and long-term nitrogen (N) fertilizer application in industrialized and emerging countries (e.g., the United Kingdom and China) acidified croplands, resulting in a series of ecological and environmental problems [3,14,15]. Nitrogen is a critical component of food crop production and the application of N fertilizer has made a great contribution to feeding the world’s populations [16,17,18]. However, minimizing soil acidification induced by N fertilizer application is a big challenge.
Sub-Saharan Africa (SSA) has a population that is growing at a rate of 2% per year and is projected to reach 1.5 billion by the year 2050 [19]. However, 30% of the population of SSA was malnourished in 2010, largely due to low crop yields [20]. Low crop yields are associated with low soil fertility, low external agricultural inputs, and soil degradation. For example, in Africa, 65% of cropland (2.30 billion hectares) is degraded as a result of ineffective soil fertility management, erosion, and soil acidity [21,22]. More than a third of SSA cropland is covered in acidic soils, where the output is insufficient and rapidly diminishes due to low soil fertility, Al toxicity, and unstable structures [23,24]. Maize yield is less than 2.0 Mg (1 Mg = 106 g) ha−1 on average in SSA compared to 5.5 Mg ha−1 in Asia and 8.0 Mg ha−1 in America [25]. Thus, nitrogen fertilizers should be increased in SSA countries to increase crop productivity because N is needed for plant growth; however, excessive application may aggravate soil acidity and reduce agricultural output [26,27]. Some studies have predicted the N needed in Africa over the next 30 years [28,29,30]. However, there are some flaws in these studies because they came up with different solutions for increasing crop production while cutting down on the amount of N released into the environment; however, they did not take into account the effect of N fertilizer and nutrient uptake by crops on the soil acidity of SSA croplands. We know that croplands in arid and semiarid regions usually have high soil pH and high soil-buffering systems as they are rich in carbonates [10,31]; however, most SSA soils are formed from old and stable parent material that has been weathered for many years with a low soil-buffering capacity and high leaching of basic cations due to the high precipitation in the humid and sub-humid regions of east and central Africa [32]. Therefore, there is an urgent need to understand the potential effects of increasing agricultural production and ammonium-based fertilizers on the rate of soil pH decline in SSA.
To the best of our knowledge, this is the first study to examine the drivers of soil acidification and the spatial and temporal changes in soil pH in SSA croplands from 1980 to 2050. We hypothesize that an increase in the use of N fertilizers in SSA croplands increases both soil acidity and the cropland areas affected by Al toxicity. Furthermore, we predict that the net H+ addition in cropland (from both nitrification and basic cation uptake), climate parameters (e.g., mean annual precipitation (MAP)), and soil parameters (cation exchange capacity, exchangeable acidity, soil organic carbon, and clay content) will be the main drivers of soil acidification in SSA croplands in 2050. Therefore, our study aimed to (1) investigate the H+ production trends in SSA croplands from 1980 to 2050, (2) estimate the soil pH decline and soil pH change and determine the spatial drivers of soil pH decline in different scenarios from 1980 to 2050, and (3) determine the spatial and temporal variations in the soil pH decline, soil pH change, and Al toxicity in SSA croplands for the period 1980–2022 and then predict these variations for the period 2022–2050.

2. Materials and Methods

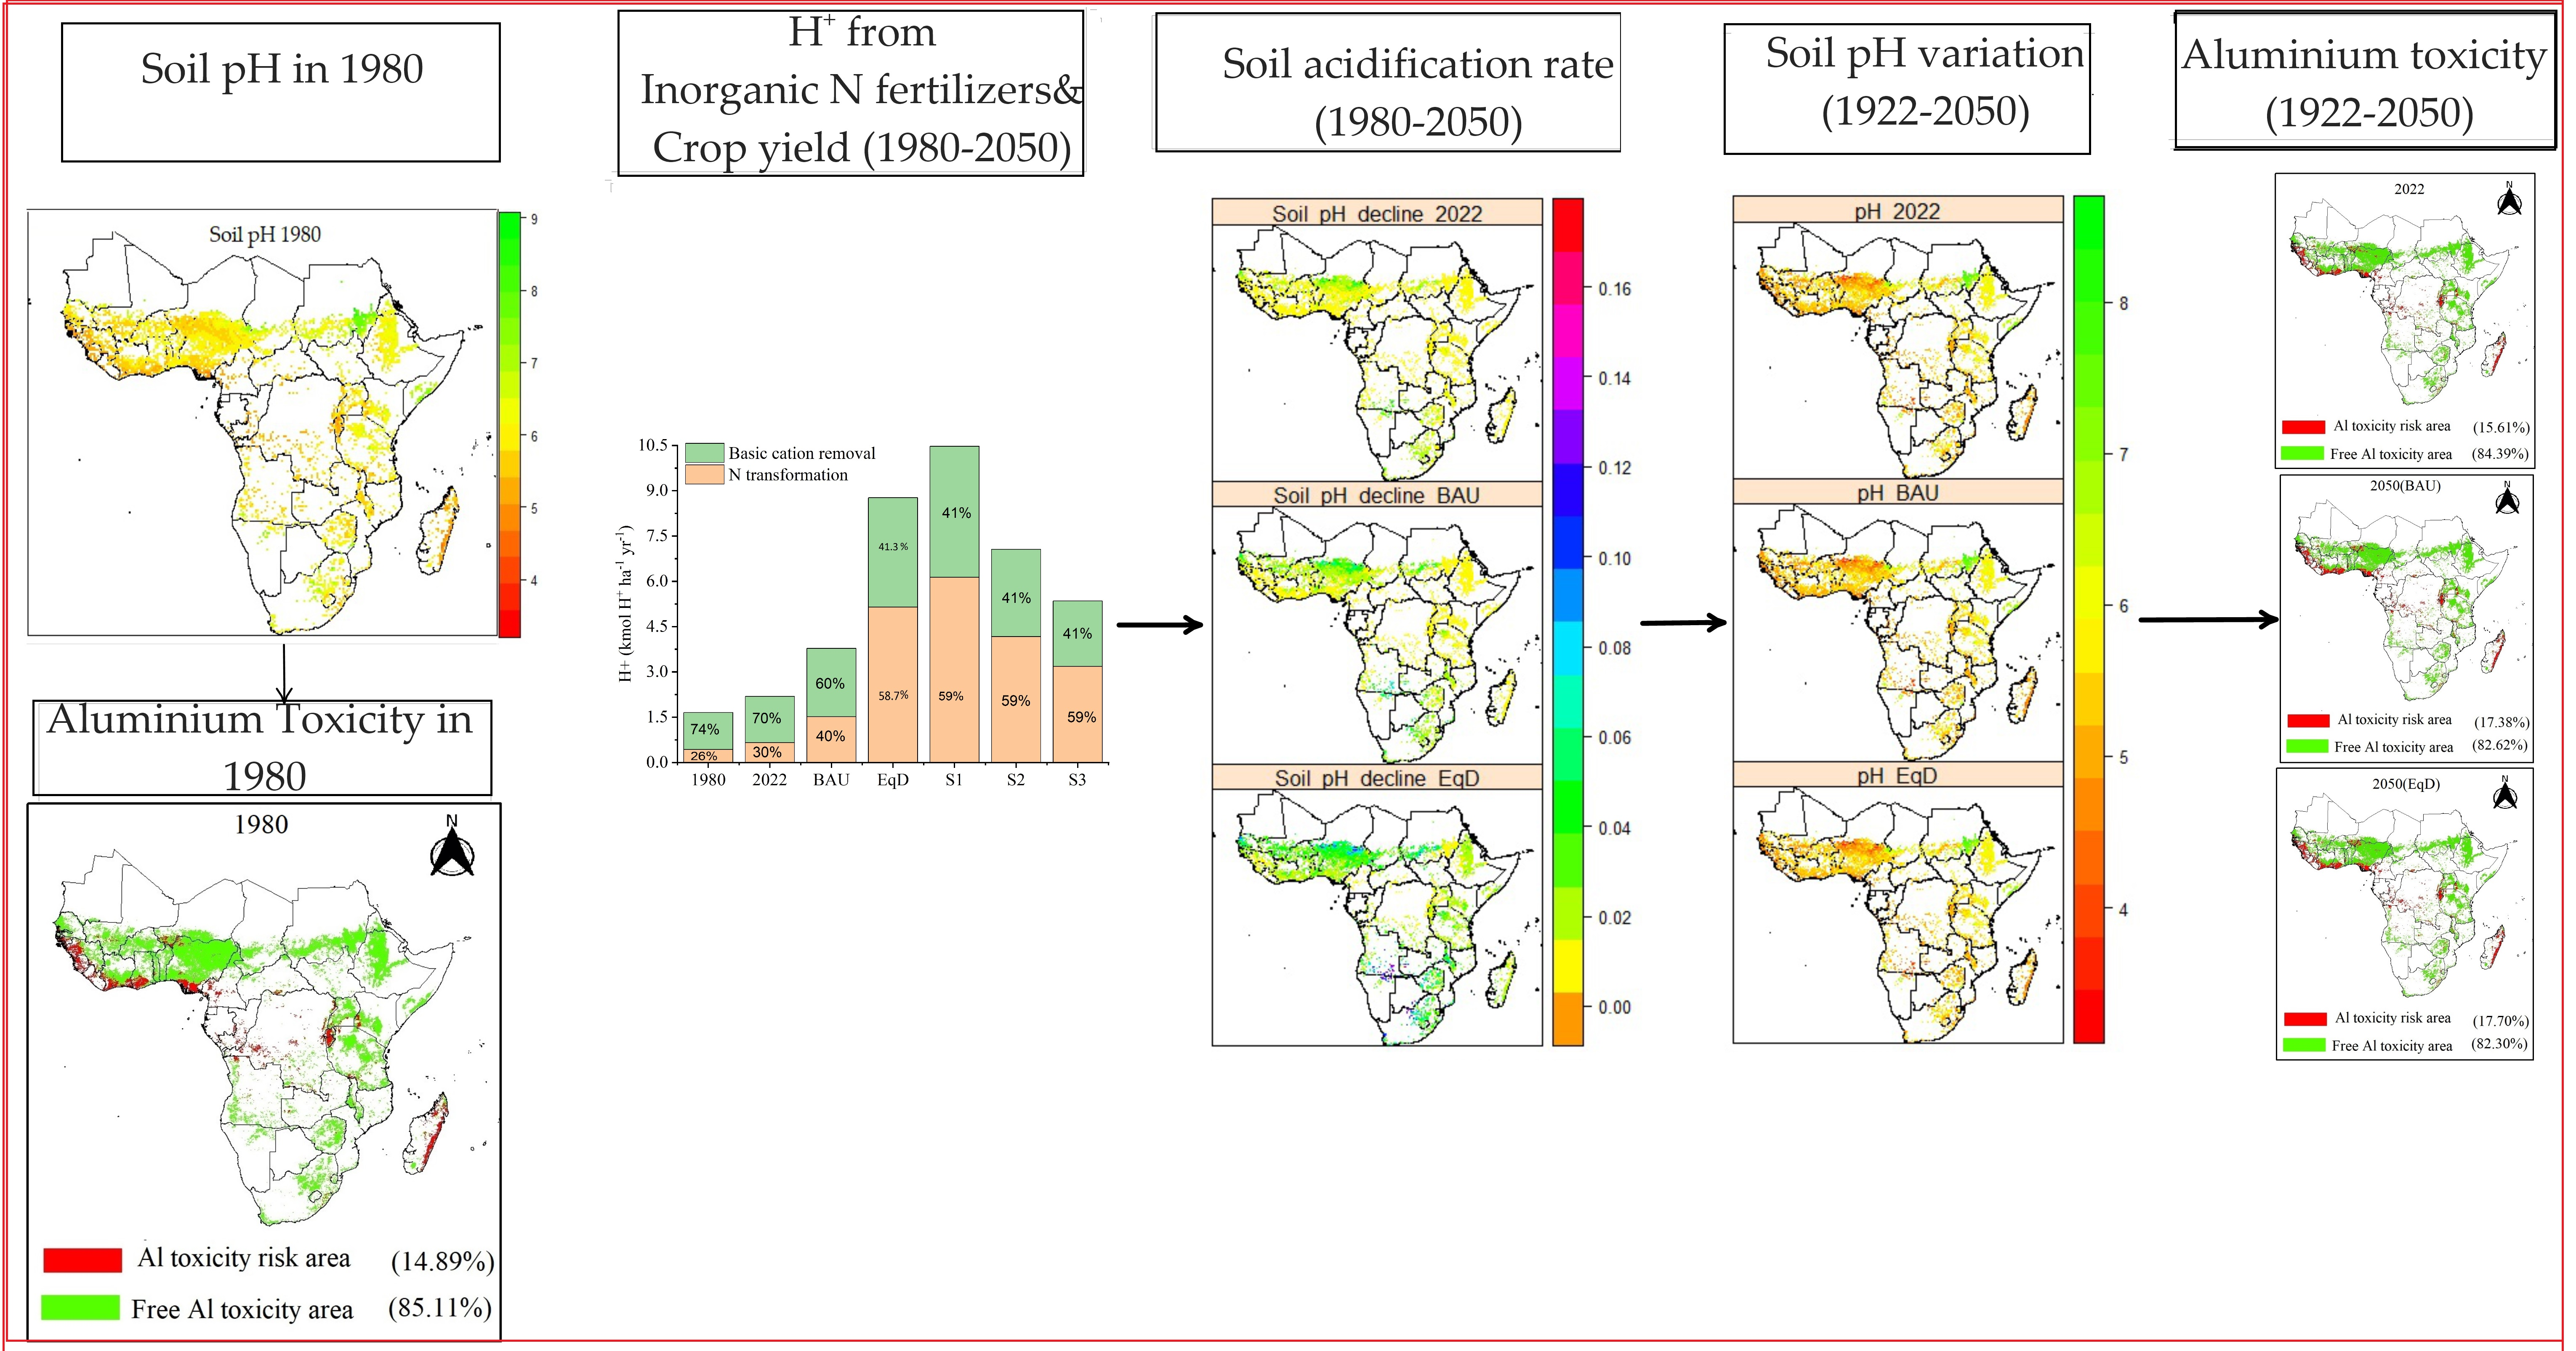
2.1. Site Description

SSA includes 50 countries plus the southern part of Mauritania. Sub-Saharan Africa is a huge 24.6 million km2 territory with a broad range of soil and land management types, with the most prevalent soils being Arenosols (21.5%), Cambisols (10.8%), Ferralsols (10.4%), and Leptosols (17.5%) [33]. There are three major types of climate in our case study including climates A, B, and C. Climate A represents the tropical climate that covers 11.8% of the land (MAP > 1500 mm), climate B represents the arid climate that covers 57.2% of the land (MAP < 250 mm yr−1), and climate C represents the temperate climate that covers 31% of the land (MAP ranges from 500 to 1500 mm yr−1) [33]. The soil acidity rate and pH variation in the croplands of SSA from 1980 to 2050 were determined using the available soil data, fertilizer use data, and crop-yield data from SSA countries. Soil profile data were collected from African soil information services (http://africasoils.net, accessed on 21 August 2022). We restricted our analysis to data from 1980 onwards because most SSA soil surveys began in 1980 [31,34]. We retained 9043 soil profiles of SSA croplands, which have physical and chemical soil properties (Table S2), after excluding soil profiles that were not of croplands (Figure 1). SSA cropland data were extracted from global land use and land cover datasets from the European Space Agency (ESA) WorldCover 10 m 2020 product [35]. Data on the inorganic fertilizer use and crop productivity of each SSA country were collected from the FAOSTAT database [25]. This study focused on the top cultivated horizon (Ap horizon) because more than 95% of N fertilization, soil nitrification, and N uptake by roots occur in the upper 40 cm [36,37].

2.2. Evaluation of Nitrogen Inputs and Outputs in SSA Croplands (1980–2050)

Five scenarios were developed in this study to determine the amount of N required by each SSA country to feed itself and to assess the environmental impact of N on agriculture based on the paths developed by Elrys et al. [30], Lassaletta et al. [29], and Alexandratos and Bruinsma [28]. These paths were (1) the business-as-usual (BAU) approach, and (2) the equitable diet approach (EqD; self-sufficiency). In the BAU scenario, the production trends continue as they have for the past four decades (unhealthy human diet), whereas in the equitable diet (EqD) scenario, the targets meet the animal and plant protein demands of a healthy diet. Using these two approaches, five different scenarios for the SSA agro-food system were developed to evaluate the impact of increased inorganic N fertilizers (INF) on soil acidity in SSA. These scenarios were the BAU, EqD, an IFN input 20% higher than the EqD (S1), an IFN input 20% lower than the EqD (S2), and an IFN input 40% lower than the EqD (S3) (Table S3). These scenarios were applied to the N fertilizer inputs and harvest products of all cereals, pulses, tubers, and vegetables from the FAOSTAT database from 1980 to 2022 [25] (Figure S1).

2.3. Calculation of Incoming Protons (H+) in SSA Croplands

The main processes of soil acidification in tropical soils are primary soil acidity and second soil acidification [6], which are summarized in Table S1. We focused only on second soil acidification, which refers to the consequence of agronomic practices, including the long-term application of ammonium-based fertilizers and the root absorption of excess basic cations compared to anions in croplands [9]. We calculated the contribution of the nitrification process of ammonium fertilizers (urea, ammonium sulfate, and diammonium phosphate) on second soil acidity. The urea, ammonium sulfate, and diammonium phosphate processes are described by Equations (1)–(3), respectively.
CO ( NH 2 ) 2 + 2 H 2 O ( NH 4 ) 2 CO + 4 O 2 2 H + + 2 NO 3 + CO 2 + H 2 O
( NH 4 ) 2 SO 4 + 4 O 2 4 H + + 2 NO 3 + SO 4 2 + H 2 O
( NH 4 ) 2 HPO 4 + O 2 3 H + + 2 NO 3 + H 2 PO 4 + H 2 O
In this study, ammonium-based fertilizer is treated the same as urea, as is commonly done, and we assume that urea hydrolysis is completed [38]. The contribution of the alkalinity (excess cations) concentration in plants to H+ production was calculated by the following equation:
H U P = C a t u p t a k e A n u p t a k e
where HUP is the H+ produced by the basic cation and anion uptakes, Catuptake is the H+ produced by the basic cation uptake (K+, Ca2+, sodium (Na+), Mg2+), and Anuptake is the plant uptake of anions (sulfate (SO42−) and dihydrogen phosphate (H2PO4)). The basic and anion content of the grain and crop residues are detailed and explained in Table S4.

2.4. Soil pH Variations and Aluminum Toxicity Risk from 1980 to 2050

The term soil pH buffering capacity (pHBC) refers to the number of exchangeable base cations or H+ that leads to a change of one pH unit [39]. The pHBC can be estimated by the soil pH, cation exchange capacity (CEC), and exchangeable Al data [40] or by using the soil type, texture, and organic matter [41]. We used the regression equation developed by Helyar et al. [41] to estimate the soil-buffering capacity of acidic soils (pHBC), as described in the following equation:
p H B C kmol   + ha 1 pH 1 = 4.2 × O M % + 2 × C l a y %
where pHBC (kmol(+)ha−1pH−1) is the soil-buffering capacity and OM is the organic matter (%) and clay content (%).
The mean annual pH decline was calculated using the pHBC values estimated in Equation (5) and the H+ calculated in Section 2.3, assuming that 28% of the incoming H+ was absorbed by the soil surface [41]. The mean annual soil pH decline was estimated by Equation (6), which is suitable for acidic soils with soil pH < 7, developed by Helyar et al. [41].
p H d e c l i n e   r a t e = H + kmol + ha 1 yr 1 × 28 % p H B C kmol + ha 1 pH 1
where the pH decline rate in pH units is the mean annual soil pH decline rate, H+(kmol(+)ha−1yr−1 is the total H+ produced by ammonium-based fertilizer transformation (nitrification and urea hydrolysis) plus the H+ produced by the excess basic cation uptake by crops than anion uptake, 28% is the proportion of H+ absorbed by the soil surface, and pHBC is the soil-buffering capacity calculated in Equation (5).
The soil pH trend in SSA croplands was estimated by taking the soil pH of 9043 observations as the benchmark of the soil pH in 1980 minus the soil pH decline from 1980 to 2020. The predicted soil pH in 2050 was calculated by taking the estimated soil pH in 2022 minus the soil pH decline estimated based on the soil BAU, EqD, S1, S2, and S3. The equation used to estimate the soil pH from 1980 to 2022 and predict the soil ppH in 2050 is described by Equation (7):
p H f i n a l = p H i n i t i a l p H d e c l i n e   r a t e p H   u n i t   y r 1
where pHfinal is the soil pH of the targeted year, pHinitial is the soil pH at the starting time (soil pH in 1980), and pHdecline rate is the mean annual soil pH decline. We used the spatial analysis tools in ArcMap 10.8 to examine the variations in the croplands with a soil pH of less than 5.5 from 1980 to 2050. These areas were considered croplands that are at risk of aluminum toxicity, as Sánchez [6] described that tropical soils with soil pH less than 5.5 are at risk of Al toxicity and croplands with soil pH greater than 5.5 are free of Al toxicity.

2.5. Spatial and Temporal Modeling of Soil pH Variations

The spatio-temporal modeling for the soil pH decline and soil pH change followed the developed workflow (Figure 1). In this study, 32 environmental covariates were chosen because they all have a relationship with soil pH variations and represent 5 soil-forming factors (climate, topography, organisms, parent material, other soil properties, and time) [42]. Climatic data with a resolution of 1 km was obtained from the WorldClim 2 dataset using the getdata function from the raster package [43]. The topographic features were represented by the digital elevation model (DEM) and its derivatives. In this study, the slope, curvature, and topographic wetness indexes were used. The DEM was downloaded from the USGS website https://earthexplorer.usgs.gov, accessed on 21 August 2022. Organisms’ activities were represented by human activities (mineral fertilizer application, crop yield, and crop water requirement), and the parent material was represented by lithology data extracted from the world lithology dataset [44]. Soil property data were represented by soil texture (clay, silt, and sand), cation exchange capacity (CEC), soil bulk density, basic cations, and soil organic carbon. Soil properties with a 250 m resolution were downloaded from the Africa Soil Information Service (http://africasoils.net, accessed on 21 August 2022) [34]. Detailed information related to the environmental covariates used is described in Table S5. All the covariates’ raster files were up-scaled to a 1 km resolution at the equator to minimize the computation time (Figure S3). We developed a workflow of the steps used to estimate the mean annual soil pH decline and soil pH variations for the period from 1980 to 2050 (Figure 2).

2.5.1. Environmental Covariate Selection and Relative Importance

Recursive feature elimination analysis (RFE) was used to select the covariates used in the spatial prediction for the mean annual soil pH decline and soil pH variations (1980–2050) in sub-Saharan African croplands. RFE is similar to backward regression. It starts with the greatest number of covariates and removes the least significant one until it reaches a predetermined number of covariates [45,46]. Ranking the relative importance of the potential environmental voariaetes allowed us to determine the most important environmental covariates that drive the spatial variations in the soil pH decline and the soil pH variations over time. The importance is measured by the percentage increase in the mean squared error, and the covariate with the highest percentage increase in the mean squared error is the most important [47].

2.5.2. Model Fitting and Evaluation

We used the “caretEnsemble” package to predict the pH variation in the soil. In the “caretEnsemble” package, multiple base models are combined to build a single best prediction model using R software and machine learning [48,49]. A single best prediction model was built using two base models, random forest (“RF”) and extreme gradient boosting (“xgbDART”). “RF” is a machine learning algorithm for regression and classification. It trains many decision trees and then aggregates each prediction into a single dataset. The predicted value is the average of the regression tree outputs [50]. For making predictions, gradient boosting is unique and uses consecutive boosting rather than parallelizing the tree-building process; each decision tree in gradient boosting predicts the error of the previous one [51]. The optimization and fine-tuning of the machine learning algorithm were computationally time-consuming, but they improved the overall accuracy by 5–15% over the use of a single model [52,53]. A spatial resolution of 1 km was used to reduce the computational load and ensure that the average resolution of all covariates was equal.
The performance of the final models was evaluated using 10-fold cross-validation. The dataset was divided into ten equally sized folds at random, nine of which were used to calibrate the selected base models and predict the soil acidification rate; the soil pH variation for the remaining fold was used for validation. This method was repeated ten times, with a different fold reserved each time. The coefficient of determination (R2), mean absolute error (MAE), and root mean square error (RMSE) for the soil pH decline and soil pH change were used for the model evaluation. The uncertainties of the produced maps were assessed using a standard deviation map, as suggested by Poggio et al. [54]. The spatio-temporal trends were divided into two time intervals. The first period was the 42 years from 1980 to 2022 and the second period was the next 28 years from 2022 to 2050. The modeling for the soil pH decline and soil pH variation were performed using the R programming language (https://www.r-project.org/, accessed on 20 January 2020). The aluminum toxicity was assessed by comparing the predicted soil pH maps using the spatial analysis tools in ArcMap 10.7.

3. Results

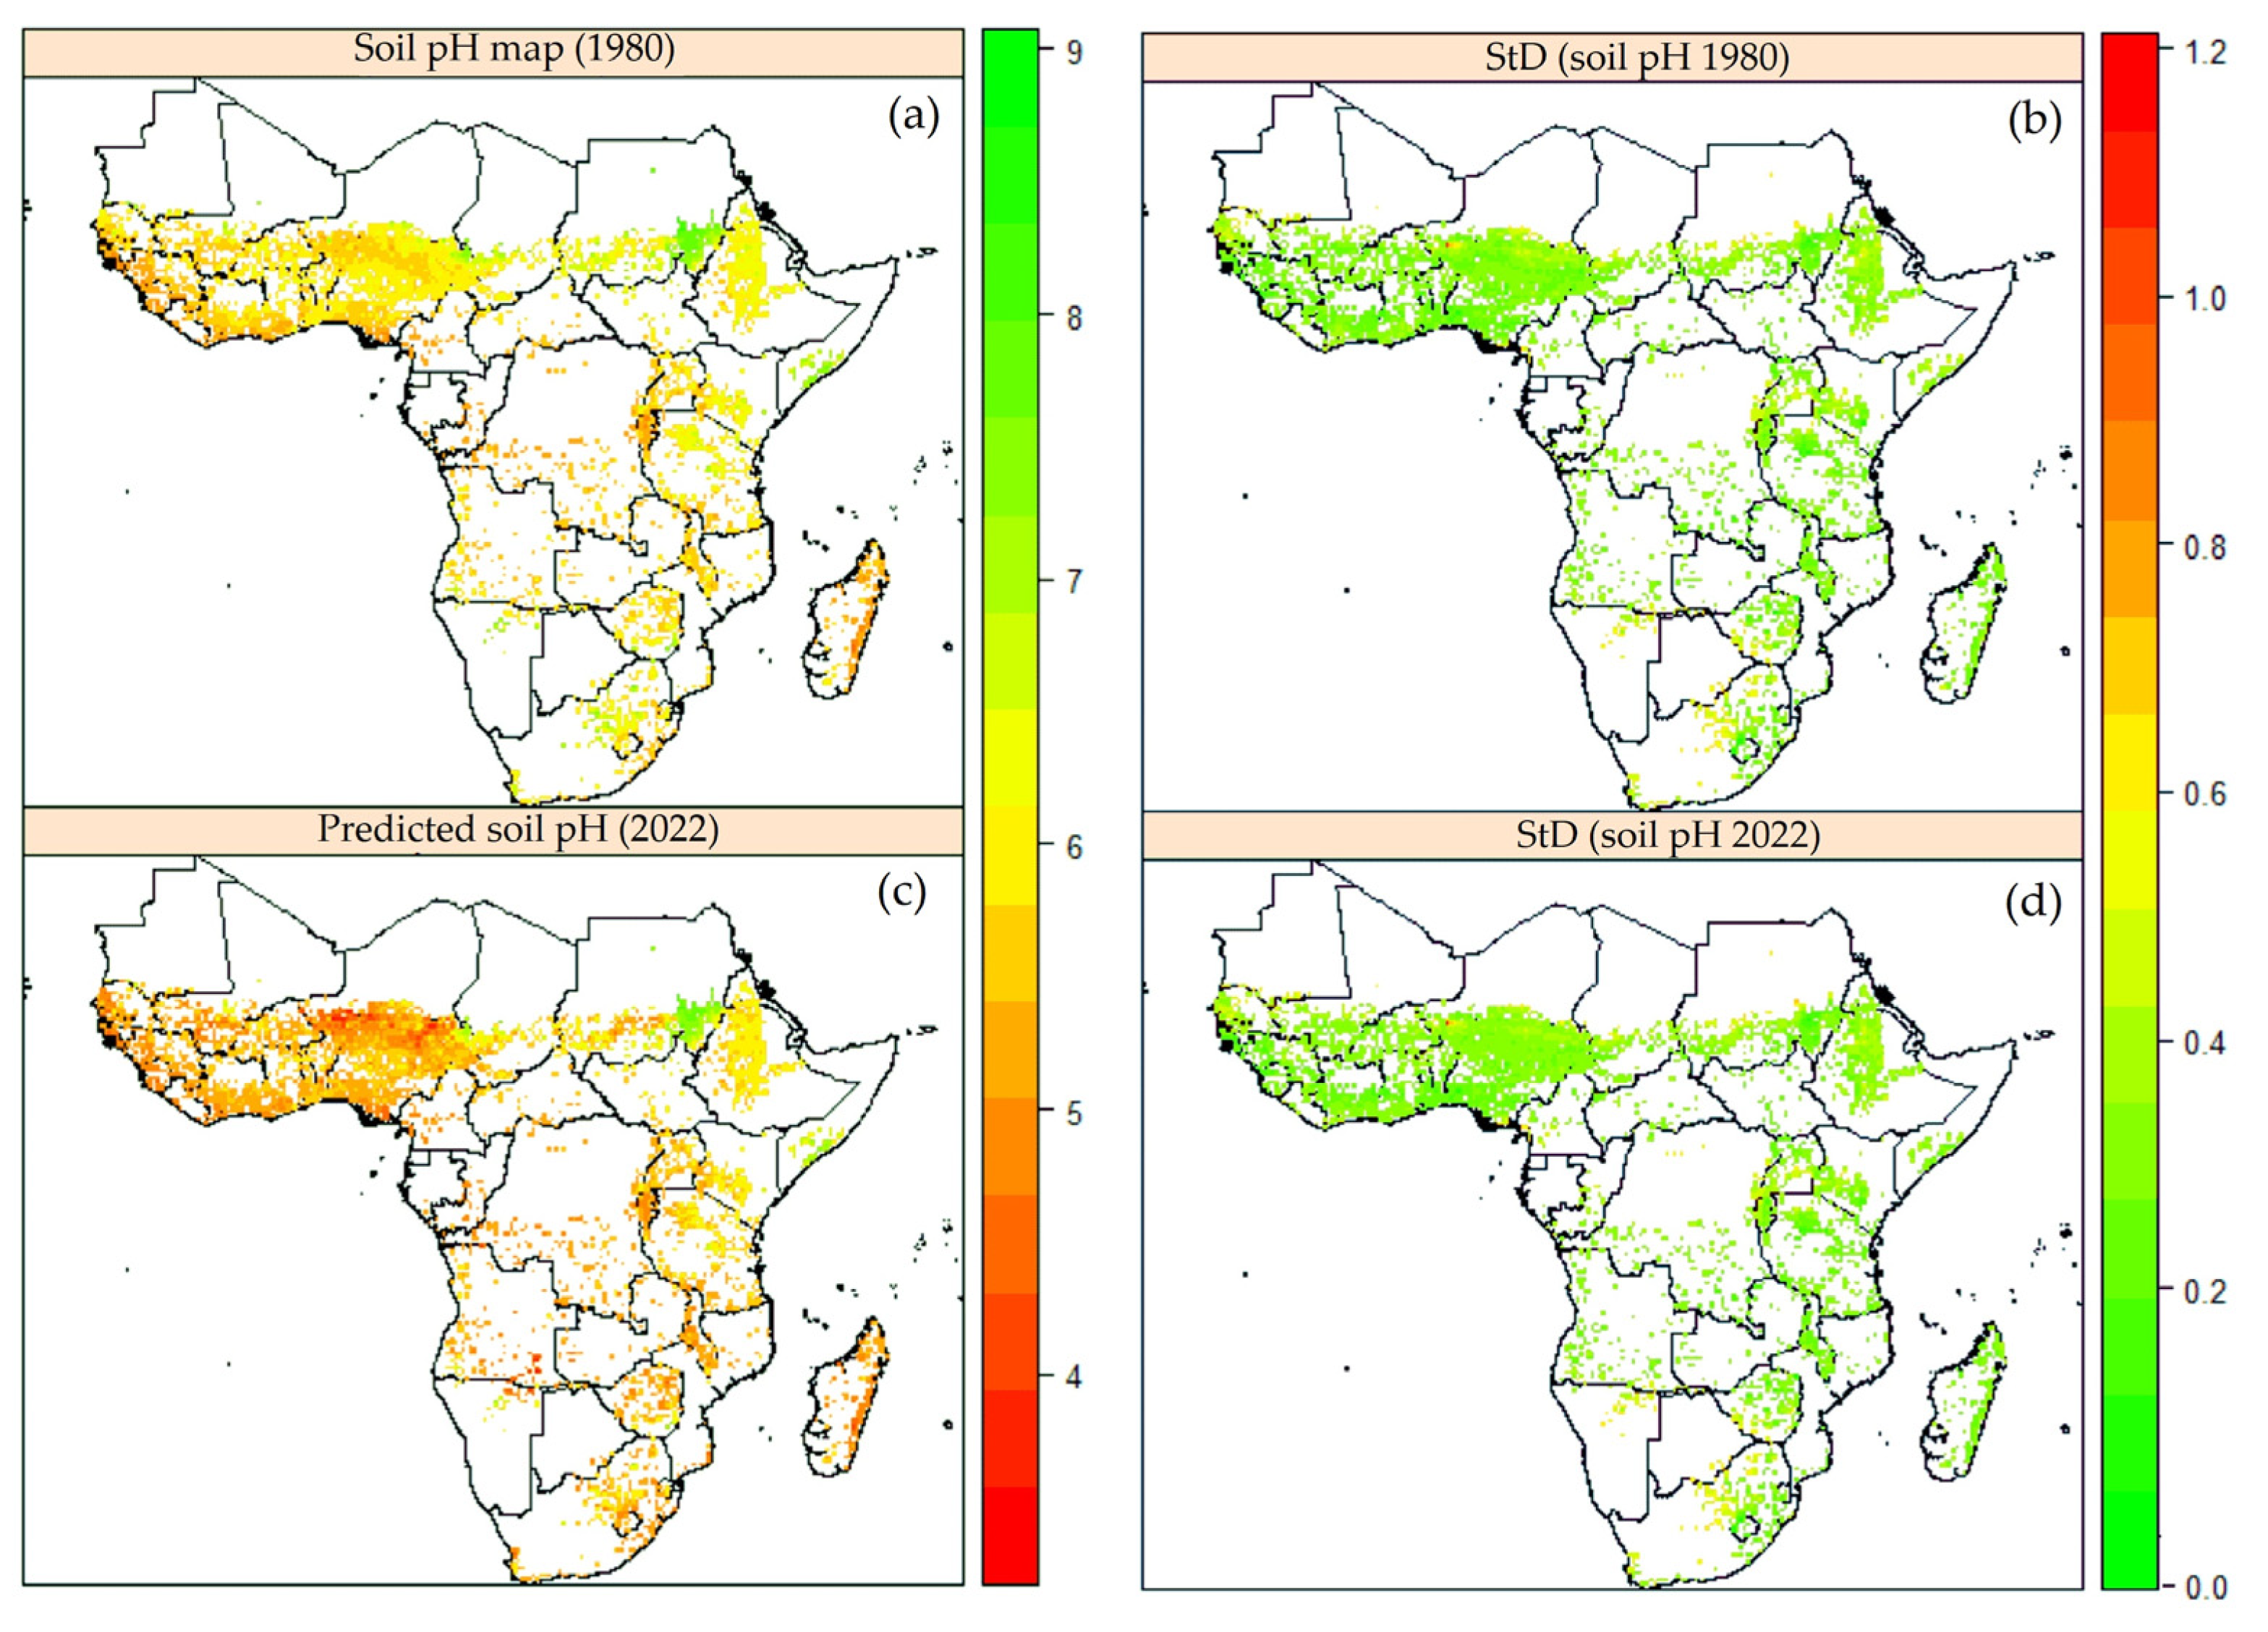
3.1. Descriptive Statistics of Estimated Protons Produced (H+), Soil pH Decline, and Soil pH Change in SSA in Different Scenarios (1980–2050)

From 1980 to 2022, the mean total H+ production in SSA croplands increased from 1.5 to 2.7 kmol H+ ha−1 yr−1. SSA croplands are expected to experience a significant increase in the total H+ produced from 2.7 to 3.7 and 8.7 kmol H+ ha−1 yr−1 following the BAU and EqD scenarios, respectively. In S1, S2, and S3, the croplands are expected to produce 10.4, 7.0, and 5.0 kmol H+ ha−1 yr−1, respectively (Figure 3). In the last four decades, the H+ from basic cation removal was higher than the H+ from N nitrification, and this trend is expected to continue in the future according to the BAU scenario. However, the H+ from N transformation is expected to be higher than the H+ from basic cation removal according to the EqD, S1, S2, and S3 scenarios. The share of H+ from basic cation uptake from 1980 to 2022 was 70% and it is expected to be 60% according to the BAU scenario. According to the EqD and S1 scenarios, the H+ from N nitrification is expected to be greater than that of the basic cation uptake and 59% of the H+ is expected to be produced by N nitrification processes (Figure 3).
The mean annual soil pH decline in SSA croplands in the last 42 years was 0.014 soil pH units (Table 1). In 2050, the mean annual soil acidity rate according to the different scenarios is estimated to be 0.024 pH units (BAU), 0.048 pH units (EqD), 0.057 pH units (S1), 0.0.04 pH units (S2), and 0.032 pH units (S3) (Table 1).
In 1980, the highest soil pH was 9.8, whereas the minimum was 3.7 and the mean soil pH in sub-Saharan Africa was 6.09. The soil pH in sub-Saharan Africa had high variability, which was shown by the high standard deviation of almost 1 pH unit (0.9). This high standard deviation was observed in the different scenarios and ranged from 0.89 to 0.904 pH units (Table 2).

3.2. Potential Environmental Covariates and Their Relative Importance

The recursive feature elimination (RFE) results showed that among the 32 environmental covariates proposed, only 10 were important for soil pH decline modeling and 22 were important for soil pH prediction (Figure 4a). The RFE results revealed that after the selected covariates (22 for soil pH and 10 for soil pH decline), there were no further decreases in the RMSEs (0.0065 for soil pH decline and 0.40 for soil pH). Ensemble machine learning ranked these selected environmental covariates based on their relative importance (Figure 4b,c). The five most important environmental covariates for the soil pH prediction were the basic cations (BC), topographic wetness index (TWI), mean annual precipitation (MAP), exchangeable acidity (ExA), and clay content (clay) (Figure 4b), whereas the five most important environmental covariates for the soil pH decline prediction were the clay content, soil organic carbon, N fertilizer, crop evapotranspiration (ETo), and ClimBio12 (mean annual precipitation) (Figure 4c).

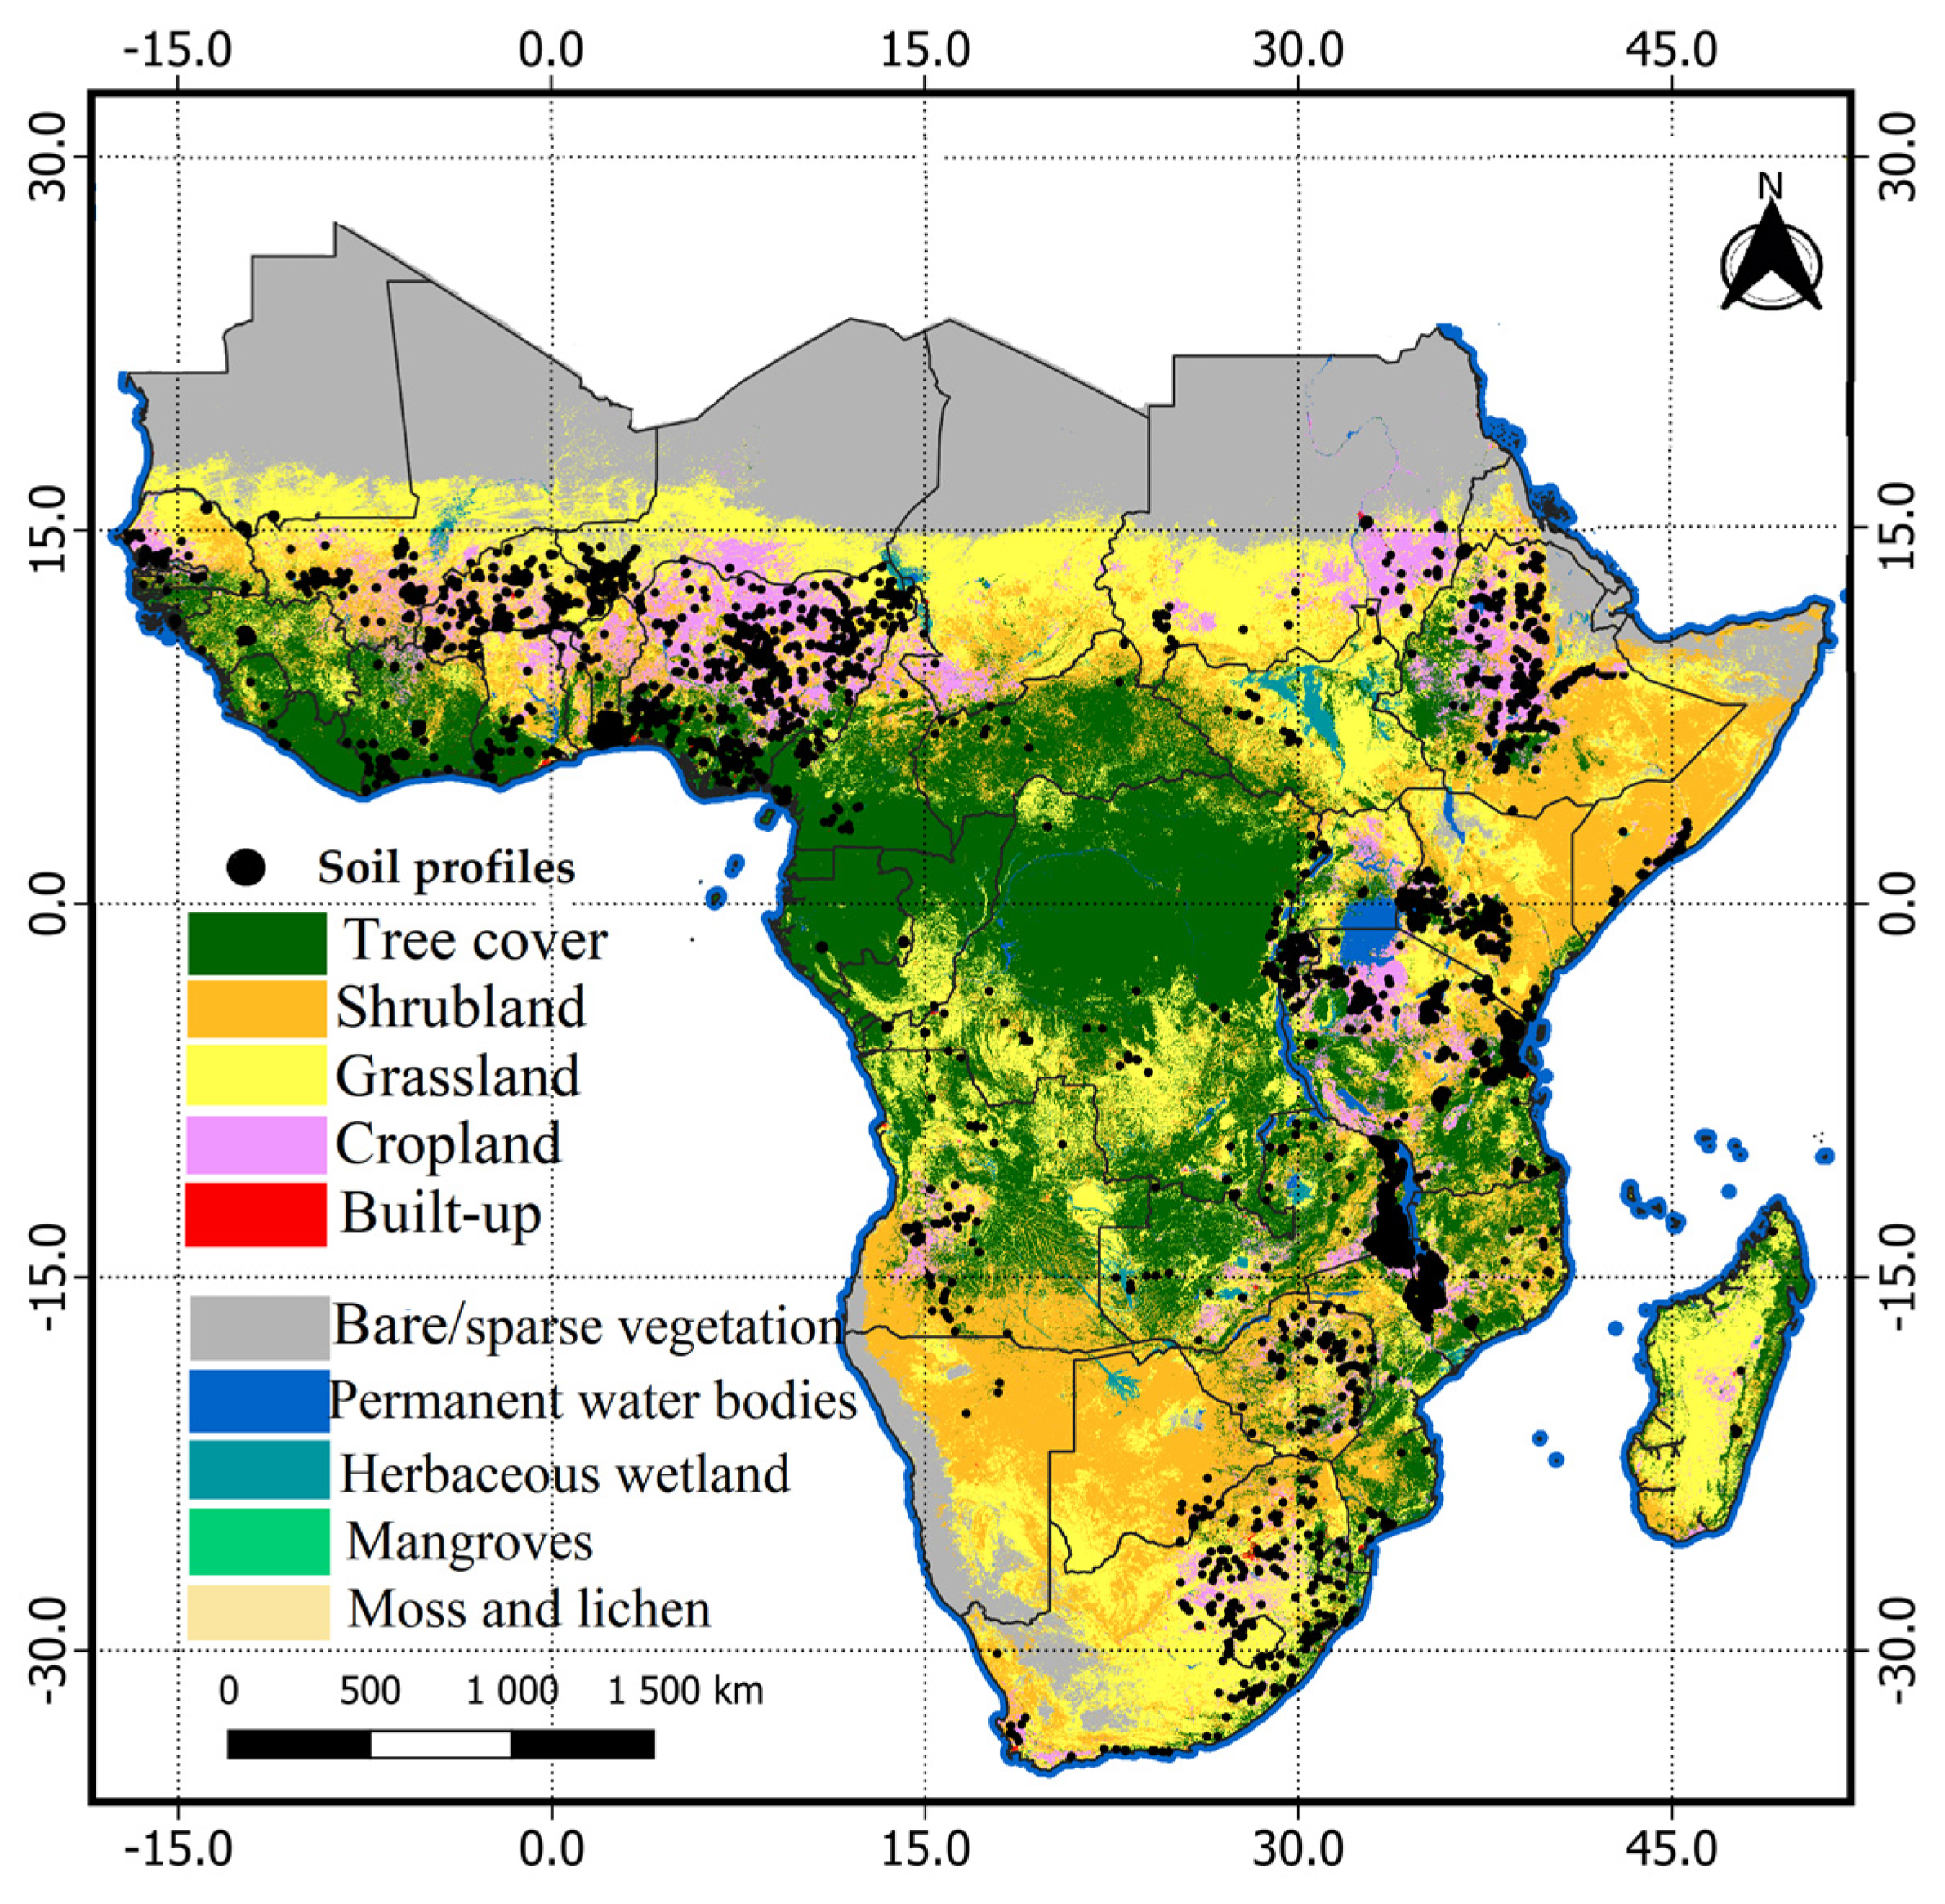
3.3. Spatio-Temporal Prediction Maps of Soil Acidity Rate, Soil pH, and Potential Areas Affected by Aluminum Toxicity and Their Uncertainties

The prediction maps of the mean annual soil pH decline (Figure 5) from 1980 to 2050 in the different scenarios varied across the SSA regions. The spatial predictions showed that the mean annual soil pH decline was less than 0.1 pH unit from 1980 to 2022. In the next 28 years, the soil pH decline is expected to increase with different spatial patterns, ranging from 0.003 to 0.2 pH units based on the tested scenarios. A high mean annual pH decline (>0.1 pH unit) was observed in the southern part of SSA, including Angola, Botswana, Namibia, and South Africa, and also in the northwest of SSA in Nigeria and Niger. This pattern is expected to continue in the future as ammonium-based fertilizers and crop yields increase (Figure 5).
Figure 5b,d,f show that the produced maps had low errors that ranged from 0 to 0.028 for the mean annual pH decline in SSA in all scenarios. The standard deviation map of the mean annual decline in the last 42 years was lower (ranging between 0.0 and 0.005). The southern and northern parts of SSA had higher errors (0.01–0.015 pH units). These areas also had higher standard deviations in the BAU scenario (0.005–0.01 pH units).
Figure 6 shows the change in the soil pH in SSA croplands for the last 42 years and their associated uncertainties expressed as standard deviations. The spatial patterns show that in 1980, some of the croplands in Sudan, Somalia, Niger, Mali, South Africa, the southern part of Angola, and the northern part of Botswana had higher soil pH values (7.5–8) (Figure 6a). The associated errors of the soil pH map in 1980 ranged from 0 to 1.2 but most of the cropland areas had standard deviations that ranged from 0 to 0.6 (Figure 6b). The southern part of SSA had higher errors (0.6 pH units), and the same standard deviation pattern was observed in parts of Ethiopia, Niger, Chad, Somalia, and Mali (Figure 6b). In 1980, almost all the SSA croplands had a soil pH that ranged from 5 to 6.5, and the lowest soil pH was observed in the central part of SSA (Figure 6a).
The map of the current soil pH (Figure 6c) followed the same pattern as the soil map of 1980. The soil pH ranged from 4.5 to 8.6 and parts of Sudan, Niger, and South Africa were among the top countries with cropland areas with a high soil pH (above 8). Additionally, the soil pH in these areas did not change in the 42 years from 1980 to 2022 (Figure 6a,c). The croplands with a soil pH ranging from 6 to 6.5 in 1980 experienced significant changes but the soil pH in these areas did not drop much in 42 years because in the 2022 soil pH map, the pH in these areas ranged from 5.5 to 6 (Figure 6c). The central and western parts of SSA plus Madagascar had low soil pH (6–4.5). The current spatial variation is expected to change with future increases in the use of ammonium-based fertilizers and other soil acidification factors. The uncertainty map showed that the soil pH in 2022 was accurate, with a low standard deviation ranging from 0 to 1.2. However, almost all of the SSA standard deviation maps showed the soil pH ranging from 0 to 0.8 for both the past and current maps (Figure 6a,c).
Figure 7 shows the predictions of the soil pH in the different scenarios. We compared the current spatial variation in the soil pH and its associated errors (Figure 7a,b) with the predicted soil pH maps in the BAU and EqD scenarios. The spatial variation in the soil pH in the BAU and EqD scenarios had the same spatial patterns as the past and current soil pH patterns but with different intensities. The predicted spatial variation in the soil pH is expected to be in the same range (8.6–3.9) as the current variation, and only the soil pH ranging from 6.5 to 5 is expected to change, especially in the central and eastern parts of SSA (Figure 7c). The standard deviation map of the soil pH in the BAU scenario ranged from 0.2 to 0.4 (Figure 7d). The map of the soil pH variation in the EqD scenario showed the same pattern as the map of the soil pH in the BAU scenario, with few differences, especially in the areas with a soil pH of less than 6.5; however, the areas with a high soil pH (>7.5) showed the same pattern and intensity as the soil map in 1980 (Figure 7e). The uncertainties of the soil pH in the EqD scenario showed that the soil pH map of South Africa, Angola, Botswana, Western Uganda, Niger, and Chad were uncertain with 0.6 pH units (Figure 7f).
Ensemble machine learning (RF and xgbDART) increased model performance by reducing model errors (RMSE and MAE) and increasing the R2 for the soil pH decline model. The density scatter plots of the predicted against the observed soil pH decline showed that the observed and predicted points were concentrated along the 1:1 line and that the prediction errors were low (Figure 8a–c). The errors (RMSEs) of the soil pH decline prediction ranged from 0.02 to 0.07 pH units (1980–2050) and the R2 ranged from 0.88 to 0.91.
Figure 9 shows the results of 10 cross-validations for the soil pH change over time (1980–2050). It shows the model errors (RMSE and MAE) and R2 for the soil pH model. Most of the predicted and observed values were concentrated on the 1:1 line, whereas others were not close to the 1:1 line, resulting in high RMSEs for all the predicted pH values. The RMSEs ranged from 0.53 to 0.56 and the MAEs ranged from 0.37 to 0.40 (Figure 9a–c). The R2 ranged from 0.63 to 0.64 (Figure 9a–d).
The assessment of croplands at risk of aluminum toxicity in the different scenarios revealed that there is expected to be an increase in cropland areas affected by aluminum toxicity. The estimated total cropland area in sub-Saharan Africa is 444 × 106 ha. In S1, the cropland area affected by aluminum toxicity is expected to increase by 2.09% from 2022 to 2050 and 17.8% of croplands are expected to be affected by aluminum toxicity compared to 15.61% in 2022 (Figure 10 and Figure S6). The top five countries expected to be affected by aluminum toxicity were shown to be Liberia, Sierra Leone, Guinea, Rwanda, and the Republic of Congo (Figure S6).
The results of the one-way ANOVA showed that the mean annual soil pH decline in the last 42 years was very low (less than 0.05 pH units) (Figure 11a). According to the different scenarios, the mean annual soil pH decline is expected to be lower than 0.05 pH units. However, there was a statistical significance when we compared the mean soil pH decline in all scenarios tested (Figure 11b). The mean soil pH in sub-Saharan Africa from 1980 to 2050 ranged from 5.7 to 6 (Figure 11c) and the comparison of the means showed that there were no statistically significant differences in the soil pH between the S1 and EqD, S3 and S2, S2 and S1, EqD and BAU, and BUA and 2022 scenarios, whereas there were statistically significant differences between the past and current soil pH (2022 and 1980) and the current and predicted soil pH in the EqD scenario (Figure 11d).

4. Discussion

The increased H+ in response to the N application rates and crop yields increased the rate of soil pH decline significantly, as well as the cropland areas at risk of aluminum toxicity from 1980 to 2022 and this is projected to continue until 2050. From 1980 to 2022, proton production was driven by basic cation loss rather than the H+ from the N transformation. However, it is expected to be the opposite between 2022 and 2050 because the effect of nitrification (H+ produced from estimated N fertilizer) use in SSA in the different scenarios (EqD, S1, S2, and S3) is expected to contribute 52% of the total H+ production in SSA (Figure 3). Thus, understanding the variation in soil acidity in the expected intensified cropping systems in the future is an urgent matter.

4.1. Potential Soil Acidification in SSA Croplands

The results of this study show that there is expected to be a strong effect of nitrification from ammonium-based fertilizer applications. This has also been mentioned in other studies, which confirmed that the increase in the use of N fertilizers in acidic soils enhanced by nitrification leads to nitrate leaching and contributes to the increase in H+ production [15,55,56,57], which is in contrast with other studies that reported that nitrification is inhibited in acidic soils [58,59].
There was an imbalance in the cation and anion uptake in all four cropping systems, which led to a net H+ release in the soil. This means that there was a net loss of base cations in SSA croplands due to basic cation uptake by plants. This observation can be explained by the fact that the removal of base cation uptake by plants accelerates soil acidification by decreasing soil exchangeable base cations [60]. It is not surprising that in the S1 scenario (172 kg N ha−1yr−1), the effect on the soil pH decline was statistically significant in SSA because this N application rate increased the residual N in croplands and decreased the soil pH. This phenomenon was also shown in SSA, where an N application of 80–120 kg N ha−1 yr−1 in three tropical soils (Luvisols, Acrisols, and Ferralsols) in southwest Nigeria showed a reduction of 1.7 pH units [13]. In addition, it was also suggested that N applications above 90 kg N ha−1 yr−1 did not contribute to maize yield increases in field trials in 13 SSA countries but contributed to N residuals in croplands, which may have contributed to soil acidification [61]. In the SSA croplands, the current total H+ production rate is lower than that in developed countries [3]. This could be explained by the low mean N fertilizer use (20 kg N ha−1 yr−1) from 1980 to 2022 and the low crop production in SSA croplands [10]. Thus, the increase in the use of N fertilizers in SSA croplands should be included with other soil management strategies to mitigate the effect of N applications on soil acidification in SSA croplands.

4.2. Soil Acidity Neutralization Potential in SSA

From 1980 to 2022, the most important contributor to the soil-buffering capacity in most soil reference groups in SSA croplands was silicate clay and soil organic matter except in arid and semi-arid areas, where the soil-buffering capacity was driven by calcium carbonates. This can be explained by the fact that in all scenarios, the soil pH values in Sudan and Somalia were not affected by the increase in ammonium-based fertilizers because our analysis showed that areas with a high soil pH (>7.5) in 1980 are expected to have the same soil pH (>7.5) in 2050 in all scenarios. This was not the same for the soils in other SSA croplands because their soil-buffering capacity is driven by soil organic matter, clay, and basic cations for soils with montmolinite and smectite silicate clays, whereas other soils with kaolinite, iron (Fe) and Al oxides, and low basic cations are buffered by Fe and Al oxides [62,63]. This observation was also supported by the relative importance analysis, which showed that the soil pH decline was driven by the clay content and SOC (Figure 4c). In addition, in non-calcareous soils, the difference between pH 7.0 and pH 4.5 can be explained by the initial amount of exchangeable base cations. When the Al oxides and/or hydroxides increase, the pH decreases even further close to 3.0 [64]. Furthermore, these soils with a low pH (<5.5) have a poor buffering capacity, which is insufficient to neutralize the H+ input due to the minerals dominated by kaolinite and Fe and Al oxides [65]. In this condition, the neutralization process relies on the decomplexation of Al3+ in soil organic matter and the weathering of Al oxides [66,67] aluminum and Fe buffering reactions explain the low soil pH decline rate in the central and western parts of SSA in all scenarios (Figure 5).

4.3. Model Performance and Uncertainty Assessment

The main advantage of our soil pH maps was that we predicted the soil pH based on the expected increase in the use of N fertilizers in order to feed SSA populations, which are expected to double by 2050. We did not estimate the area of applicability for machine learning [68]. However, our uncertainty assessment using standard deviation maps clearly showed the areas where the models under- or overpredicted (Figure 5, Figure 6 and Figure 7). Based on our analysis, the produced maps had low uncertainties because all their produced standard deviation maps had lower standard deviations compared to the standard deviation of the descriptive statistics of the training data (Table 1 and Table 2). Based on our predicted maps, there were under- or overestimations in areas with missing training data, which is a common error in digital models [31].
A comparison of our results with those of previous works that predicted the soil pH in Africa showed that our soil maps had the same patterns as previous soil pH prediction maps of Africa. There were a few differences between the model accuracy of this study and that of recent soil pH predictions for Africa by Hengl et al. [31]. This could be the result of the fine resolution (30 m) used, the covariates used, or the distribution of the training data. However, there were no significant differences between the errors of this study and those of previous studies on Africa. A low RMSE (0.53) was observed for this study, whereas the soil pH maps of Africa predicted by a previous work had a higher RMSE (0.67), as well as a higher R2 (0.66) than our R2 (0.64) [31]. We also compared our results to the recent Global Soil Grids version 2.0 by Poggio et al. [54]. We found that ensemble machine learning (RF and xdbDART) performed better than QRF. The RMSEs of the predicted soil pH ranged from 0.53 to 0.56, whereas the RMSEs for the recent global soil grids were higher than those of our study and ranged from 0.7 to 0.74 [54]. This was expected because it has been shown that ensemble machine learning can increase accuracy by up to 15% over a single algorithm but requires higher computations [52,53].

4.4. Implications and Practical Recommendations

To feed a rapidly growing population, SSA needs to increase the fertilizer application rates. Our study indicates that soil acidification could be a big challenge for most SSA countries. Reasonable N management practices should concentrate on ways of increasing N use efficiency while decreasing N losses. First, applying a 4R strategy would be the best solution to the problem of increasing H+ production in SSA croplands. This type of strategy focuses on adding the right type of fertilizer in the right place (deep placement) at the right time (higher splitting frequency) and in the right amounts (lower basal N fertilizer and optimal N rate based on a soil N test) [69]. It has also been shown that introducing essential N utilization genes into agricultural cultivars has the potential to boost N uptake [70]. Second, the fertilization structure should be adjusted by reducing chemical fertilizers and increasing organic fertilizers because organic fertilizers can increase the gross NH4+ immobilization rates, resulting in strong competition with nitrification [71], and increasing the soil-buffering capacity [41]. Third, soil amendments (e.g., lime, crop residues, and biochar) should be extensively applied to solve the problem of Al toxicity and increase the soil pH in areas that are at high risk of Al toxicity (Figure 10) by increasing the SOC, soil-base saturation, and soil-buffering capacity [72].

5. Conclusions

This is the first study to evaluate the effects of the increase in the use of N fertilizers on the soil acidification rate and soil pH change over the last four decades, as well as predict the effects on SSA cropland over the next three decades. We tested five scenarios of increasing N fertilizers in SSA in order to achieve an equitable diet by 2050. We found that the mean annual soil pH decline was 0.014 pH units during 1980–2022, and from 2022 to 2050, it is estimated to be 0.024 pH units (BAU), 0.048 pH units (EqD), 0.057 pH units (S1), 0.04 pH units (S2), and 0.034 pH units (S3). The mean annual soil acidity rate is driven by protons (H+) produced by nitrification and basic cation loss. CEC and soil-buffering capacity control the soil acidity rate and the central and western parts of SSA are at risk of Al toxicity in all the scenarios tested. We conclude that to achieve self-sufficiency in Africa by 2050, it is important to increase the level of N input in croplands (143.4 kg N ha−1 yr−1). However, we need to develop strategies to minimize the effect of N fertilizers on the soil pH decline in the future in SSA soils, including the use of less acidifying fertilizers, the selection of plant species that do not accumulate cation excesses, a reduction in carbon and N losses, liming, and the use of biochar in SSA croplands.

Supplementary Materials

The following supporting information can be downloaded at https://0-www-mdpi-com.brum.beds.ac.uk/article/10.3390/rs15051338/s1. Table S1: Soil acidification processes; Table S2: Descriptive statistics of soil properties; Table S3: Description of used scenarios; Table S4: Element concentrations in crop harvests, crop residues, and the related parameters in the crop-removal calculation; Table S5: Cross-validation for single predictive model (RF and xgbDART) and ensemble model for both soil pH decline and soil pH. Figure S1. Urea fertilizer use in SSA in different scenarios (1980–2050); Figure S2: Spatial and temporal variations in crop production of different cropping systems; Figure S3: Contribution of yield and crop residues on proton production in different scenarios; Figure S4: All predicted maps of soil pH decline and their uncertainties; Figure S5: Predicted change in soil pH (all scenarios) and their uncertainties; Figure S6: Spatio-temporal change in aluminum toxicity in different scenarios (1980–2050); Figure S7: Relationship between soil pH decline and soil properties.

Author Contributions

Y.U.: conceptualization, methodology, visualization, data curation, investigation, data analysis, writing—original draft preparation, writing—review and editing. Q.A.W.K.: visualization, data curation, investigation, writing—review and editing, funding acquisition. H.M.A.: visualization, data curation, investigation, writing—review and editing, funding acquisition. M.J.Y.N.: visualization, data curation, investigation, writing—review and editing. M.Y.: visualization, data curation, investigation, writing—review and editing, A.S.E.: conceptualization, visualization, data curation, investigation, writing—review and editing. Z.C.: funding acquisition, conceptualization, writing—review and editing, supervision. J.Z.: funding acquisition, conceptualization, writing—review and editing, supervision. All authors have read and agreed to the published version of the manuscript.

Funding

This work was funded by the Researchers Supporting Project number (RSP2023R123), King Saud University, Riyadh, Saudi Arabia, the National Natural Science Foundation of China: No 42277343, the National Key R. & D Program of China (no. 2017YFD0200106), and the 111 Project: No B12007.

Data Availability Statement

Not applicable.

Acknowledgments

The authors would like to extend their sincere appreciation to the Researchers Supporting Project number (RSP2023R123), King Saud University, Riyadh, Saudi Arabia.

Conflicts of Interest

The authors declare no conflict of interest.

References

  1. Tian, D.; Niu, S. A Global Analysis of Soil Acidification Caused by Nitrogen Addition. Environ. Res. Lett. 2015, 10, 024019. [Google Scholar] [CrossRef]
  2. Von Uexküll, H.R.; Mutert, E. Global Extent, Development and Economic Impact of Acid Soils. Plant Soil 2004, 171, 1–15. [Google Scholar] [CrossRef]
  3. Xu, D.; Carswell, A.; Zhu, Q.; Zhang, F.; de Vries, W. Modelling Long-Term Impacts of Fertilization and Liming on Soil Acidification at Rothamsted Experimental Station. Sci. Total Environ. 2019, 713, 136249. [Google Scholar] [CrossRef] [PubMed]
  4. Zhang, Y.; He, X.; Liang, H.; Zhao, J.; Zhang, Y.; Xu, C.; Shi, X. Long-Term Tobacco Plantation Induces Soil Acidification and Soil Base Cation Loss. Environ. Sci. Pollut. Res. 2015, 23, 5442–5450. [Google Scholar] [CrossRef]
  5. Hue, N.V.; Vega, S.; Silva, J.A. Manganese Toxicity in a Hawaiian Oxisol Affected by Soil PH and Organic Amendments. Soil Sci. Soc. Am. J. 2001, 65, 153–160. [Google Scholar] [CrossRef] [Green Version]
  6. Sánchez, P.A. Soils of the Tropics. Prop. Manag. Soils Trop. 2019, 82–119. [Google Scholar] [CrossRef]
  7. Thomas, G.W.; Hargrove, W.L. The Chemistry of Soil Acidity. In Soil Acidity and Liming; John Wiley & Sons, Ltd.: Hoboken, NJ, USA, 1984; pp. 3–56. ISBN 9780891182078. [Google Scholar]
  8. Richter, D.D. Sources of Acidity in Some Forested Udults. Soil Sci. Soc. Am. J. 1986, 50, 1584–1589. [Google Scholar] [CrossRef]
  9. Munns, D.N.; Sánchez, P.A. Properties and Management of Soils in the Tropics. Bioscience 1977, 124, 187. [Google Scholar] [CrossRef]
  10. Agegnehu, G.; Amede, T.; Erkossa, T.; Yirga, C.; Henry, C.J.; Tyler, R.T.; Nosworthy, M.G.; Beyene, S.; Sileshi, G.W. Extent and Management of Acid Soils for Sustainable Crop Production System in the Tropical Agroecosystems: A Review. Acta Agric. Scand. Sect. B Soil Plant Sci. 2021, 71, 852–869. [Google Scholar] [CrossRef]
  11. Abruna, F.; Pearson, R.W.; Elkins, C.B.; Abruña, F.; Pearson, R.W.; Elkins, C.B.; Abruna, F.; Pearson, R.W.; Elkins, C.B. Quantitative Evaluation of Soil Reaction and Base Status Changes Resulting from Field Application of Residually Acid-Forming Nitrogen Fertilizers. Soil Sci. Soc. Am. J. 1958, 22, 539–542. [Google Scholar] [CrossRef]
  12. Juo, A.S.R.; Dabiri, A.; Franzluebbers, K. Acidification of a Kaolinitic Alfisol under Continuous Cropping with Nitrogen Fertilization in West Africa. Plant Soil 1995, 171, 245–253. [Google Scholar] [CrossRef]
  13. Stumpe, J.M.; Vlek, P.L.G.G. Acidification Induced by Different Nitrogen Sources in Columns of Selected Tropical Soils. Soil Sci. Soc. Am. J. 1991, 55, 145–151. [Google Scholar] [CrossRef]
  14. Guo, J.H.; Liu, X.J.; Zhang, Y.; Shen, J.L.; Han, W.X.; Zhang, W.F.; Christie, P.; Goulding, K.W.T.; Vitousek, P.M.; Zhang, F.S. Significant Acidification in Major Chinese Croplands. Science 2010, 327, 1008–1010. [Google Scholar] [CrossRef] [Green Version]
  15. Dong, Y.; Yang, J.; Zhao, X.; Yang, S.-H.; Zhang, G. Contribution of Different Proton Sources to the Acidification of Red Soil with Maize Cropping in Subtropical China. Geoderma 2021, 392, 114995. [Google Scholar] [CrossRef]
  16. Vanlauwe, B.; Kihara, J.; Chivenge, P.; Pypers, P.; Coe, R.; Six, J. Agronomic Use Efficiency of N Fertilizer in Maize-Based Systems in Sub-Saharan Africa within the Context of Integrated Soil Fertility Management. Plant Soil 2011, 339, 35–50. [Google Scholar] [CrossRef]
  17. Kaizzi, K.C.; Byalebeka, J.; Semalulu, O.; Alou, I.; Zimwanguyizza, W.; Nansamba, A.; Musinguzi, P.; Ebanyat, P.; Hyuha, T.; Wortmann, C.S. Maize Response to Fertilizer and Nitrogen Use Efficiency in Uganda. Agron. J. 2012, 104, 73–82. [Google Scholar] [CrossRef]
  18. Tadele, Z. Raising Crop Productivity in Africa through Intensification. Agronomy 2017, 7, 22. [Google Scholar] [CrossRef]
  19. Pande, V.S.; Kumburu, N.P. An Overview of Population Growth and Sustainable Development in Sub-Saharan Africa. In Handbook of Research on Sustainable Development and Governance Strategies for Economic Growth in Africa; Alemu, K.T., Alebachew, M.A., Eds.; IGI Global: Hershey, PA, USA, 2018; pp. 480–499. [Google Scholar]
  20. FAO. The State of Food Security and Nutrition in the World 2021: Transforming Food Systems for Food Security, Improved Nutrition and Affordable Healthy Diets for All; FAO: Rome, Italy, 2021; ISBN 9789251343258. [Google Scholar]
  21. Sánchez, P.A. Soil Fertility and Hunger in Africa. Science 2002, 295, 2019–2020. [Google Scholar] [CrossRef] [Green Version]
  22. Shamie, Z.; Mutegi, J.K.; Agesa, B.; Tamene, L.; Kihara, J.; Zingore, S.; Mutegi, J.K.; Agesa, B.; Tamene, L.; Kihara, J.; et al. Soil Degradation in Sub-Saharan Africa and Crop Production Options for Soil Rehabilitation. Better Crop Plant Food 2015, 99, 24–26. [Google Scholar]
  23. De Pauw, E.F.D.E. The Management of Acid Soils in Africa. Outlook Agric. 1994, 23, 11–16. [Google Scholar] [CrossRef]
  24. Sánchez, P.A.; Logan, T.J. Myths and Science about the Chemistry and Fertility of Soils in the Tropics. Myth. Sci. Soils Trop. 1992, 3, 35–46. [Google Scholar]
  25. FAO. World Food and Agriculture—Statistical Pocketbook 2019; Food and Agriculture Organization (FAO): Rome, Italy, 2019. [Google Scholar]
  26. Kimaru, G.; Jama, B. Improving Land Management in Eastern and Southern Africa: A Review of Practices and Policies; World Agroforestry Centre: Nairobi, Kenya, 2006. [Google Scholar]
  27. Mokwunye, A.U.; Vlek, P.L.G. Management of Nitrogen and Phosphorus Fertilizers in Sub-Saharan Africa. In Proceedings of the Developments in Plant and Soil Sciences, Icarda, Syria, 14–17 April 1986; p. 56. [Google Scholar]
  28. Alexandratos, N.; Bruinsma, J. World Agriculture towards 2030/2050 the 2012 Revision; ESA Working paper No. 12-03; FAO: Rome, Italy, 2012. [Google Scholar]
  29. Lassaletta, L.; Billen, G.; Garnier, J.; Bouwman, L.; Velázquez, E.; Mueller, N.D.; Gerber, J.S. Nitrogen Use in the Global Food System: Past Trends and Future Trajectories of Agronomic Performance, Pollution, Trade, and Dietary Demand. Environ. Res. Lett. 2016, 11, 95007. [Google Scholar] [CrossRef]
  30. Elrys, A.S.; Metwally, M.S.; Raza, S.; Alnaimy, M.A.; Shaheen, S.M.; Chen, Z.; Zhou, J. How Much Nitrogen Does Africa Need to Feed Itself by 2050? J. Environ. Manag. 2020, 268, 110488. [Google Scholar] [CrossRef]
  31. Hengl, T.; Miller, M.A.E.; Križan, J.; Shepherd, K.D.; Sila, A.; Kilibarda, M.; Antonijević, O.; Glušica, L.; Dobermann, A.; Haefele, S.M.; et al. African Soil Properties and Nutrients Mapped at 30 m Spatial Resolution Using Two-Scale Ensemble Machine Learning. Sci. Rep. 2021, 11, 6130. [Google Scholar] [CrossRef] [PubMed]
  32. Vlek, P.L.G.; Le, Q.B.; Tamene, L. Land Decline in Land-Rich Africa a Creeping Disaster in the Making; CGIAR Science Council Secretariat: Rome, Italy, 2008; p. 259. [Google Scholar]
  33. Peel, M.C.; Finlayson, B.L.; McMahon, T.A. Updated World Map of the Köppen-Geiger Climate Classification. Hydrol. Earth Syst. Sci. 2007, 11, 1633–1644. [Google Scholar] [CrossRef] [Green Version]
  34. Hengl, T.; Heuvelink, G.B.M.; Kempen, B.; Leenaars, J.G.B.; Walsh, M.G.; Shepherd, K.D.; Sila, A.; MacMillan, R.A.; De Jesus, J.M.; Tamene, L.; et al. Mapping Soil Properties of Africa at 250 m Resolution: Random Forests Significantly Improve Current Predictions. PLoS ONE 2015, 10, e0125814. [Google Scholar] [CrossRef]
  35. Zanaga, D.; van de Kerchove, R.; de Keersmaecker, W.; Souverijns, N.; Brockmann, C.; Quast, R.; Wevers, J.; Grosu, A.C.; Paccini, A.; Vergnaud, S.; et al. ESA WorldCover 10 m 2020 V100. 2021. Available online: https://worldcover2021.esa.int/download (accessed on 20 February 2023).
  36. Ghimire, R.; Machado, S.; Bista, P. Soil PH, Soil Organic Matter, and Crop Yields in Winter Wheat Summer Fallow Systems. Agron. J. 2017, 109, 706–717. [Google Scholar] [CrossRef] [Green Version]
  37. Raza, S.; Miao, N.; Wang, P.; Ju, X.; Chen, Z.; Zhou, J.; Kuzyakov, Y. Dramatic Loss of Inorganic Carbon by Nitrogen-Induced Soil Acidification in Chinese Croplands. Glob. Chang. Biol. 2020, 26, 3738–3751. [Google Scholar] [CrossRef]
  38. Zamanian, K.; Zarebanadkouki, M.; Kuzyakov, Y. Nitrogen Fertilization Raises CO2 Efflux from Inorganic Carbon: A Global Assessment. Glob. Chang. Biol. 2018, 24, 2810–2817. [Google Scholar] [CrossRef]
  39. Nelson, P.N.; Su, N. Soil PH Buffering Capacity: A Descriptive Function and Its Application to Some Acidic Tropical Soils. Soil Res. 2010, 48, 201–207. [Google Scholar] [CrossRef]
  40. Hochman, Z.; Godyn, D.L.; Scott, B.; Robson, A. The Integration of Data on Lime Use by Modelling. In Soil Acidity and Plant Growth; Elsevier: Amsterdam, The Netherlands, 1989; pp. 265–301. [Google Scholar]
  41. Helyar, K.R.; Cregan, P.D.; Godyn, D.L. Soil Acidity in New South Wales—Current Ph Values and Estimates of Acidification Rates. Aust. J. Soil Res. 1990, 28, 523–537. [Google Scholar] [CrossRef]
  42. McBratney, A.; Santos, M.L.M.; Minasny, B. On Digital Soil Mapping. Geoderma 2003, 117, 3–52. [Google Scholar] [CrossRef]
  43. Fick, S.E.; Hijmans, R.J. WorldClim 2: New 1-km Spatial Resolution Climate Surfaces for Global Land Areas. Int. J. Climatol. 2017, 37, 4302–4315. [Google Scholar] [CrossRef]
  44. Hartmann, J.; Moosdorf, N. Global Lithological Map Database v1.0 (Gridded to 0.5° Spatial Resolution); PANGAEA: Bremerhaven, Germany, 2012; Volume 13. [Google Scholar] [CrossRef]
  45. Meyer, H.; Reudenbach, C.; Hengl, T.; Katurji, M.; Nauss, T. Improving Performance of Spatio-Temporal Machine Learning Models Using Forward Feature Selection and Target-Oriented Validation. Environ. Model. Softw. 2018, 101, 1–9. [Google Scholar] [CrossRef]
  46. Zeraatpisheh, M.; Garosi, Y.; Owliaie, H.R.; Ayoubi, S.; Taghizadeh-Mehrjardi, R.; Scholten, T.; Xu, M. Improving the Spatial Prediction of Soil Organic Carbon Using Environmental Covariates Selection: A Comparison of a Group of Environmental Covariates. Catena 2021, 208, 105723. [Google Scholar] [CrossRef]
  47. Heuvelink, G.; Angelini, M.; Poggio, L.; Bai, Z.; Batjes, N.; Bosch, R.V.D.; Bossio, D.; Estella, S.; Lehmann, J.; Olmedo, G.; et al. Machine Learning in Space and Time for Modelling Soil Organic Carbon Change. Eur. J. Soil Sci. 2020, 72, 1607–1623. [Google Scholar] [CrossRef]
  48. Deane-Mayer, Z.A.; Knowles, J. Ensembles of Caret Models [R Package CaretEnsemble Version 2.0.1]. 2019. Available online: https://cran.r-project.org/web/packages/caretEnsemble/index.html (accessed on 18 January 2020).
  49. Tajik, S.; Ayoubi, S.; Zeraatpisheh, M. Digital Mapping of Soil Organic Carbon Using Ensemble Learning Model in Mollisols of Hyrcanian Forests, Northern Iran. Geoderma Reg. 2020, 20, e00256. [Google Scholar] [CrossRef]
  50. Malone, B.; Minasny, B.; McBratney, A. Using R for Digital Soil Mapping; Springer: Cham, Switzerland, 2016. [Google Scholar] [CrossRef]
  51. Ayyadevara, V.K. Gradient Boosting Machine. In Pro Machine Learning Algorithms.; Academic Press: Berkeley, CA, USA, 2018. [Google Scholar]
  52. Hengl, T.; Leenaars, J.G.B.B.; Shepherd, K.D.; Walsh, M.G.; Heuvelink, G.B.M.M.; Mamo, T.; Tilahun, H.; Berkhout, E.; Cooper, M.; Fegraus, E.; et al. Soil Nutrient Maps of Sub-Saharan Africa: Assessment of Soil Nutrient Content at 250 m Spatial Resolution Using Machine Learning. Nutr. Cycl. Agroecosystems 2017, 109, 77–102. [Google Scholar] [CrossRef] [Green Version]
  53. Uwiragiye, Y.; Ngaba, M.J.Y.; Zhao, M.; Elrys, A.S.; Heuvelink, G.B.M.; Zhou, J. Modelling and Mapping Soil Nutrient Depletion in Humid Highlands of East Africa Using Ensemble Machine Learning: A Case Study from Rwanda. Catena 2022, 217, 106499. [Google Scholar] [CrossRef]
  54. Poggio, L.; de Sousa, L.M.; Batjes, N.H.; Heuvelink, G.B.M.; Kempen, B.; Ribeiro, E.D.C.; Rossiter, D.G. SoilGrids 2.0: Producing Soil Information for the Globe with Quantified Spatial Uncertainty. Soil 2021, 7, 217–240. [Google Scholar] [CrossRef]
  55. Cai, Z.; Wang, B.; Xu, M.; Zhang, H.; He, X.; Zhang, L.; Gao, S. Intensified Soil Acidification from Chemical N Fertilization and Prevention by Manure in an 18-Year Field Experiment in the Red Soil of Southern China. J. Soils Sediments 2014, 15, 260–270. [Google Scholar] [CrossRef]
  56. Cameron, K.C.; Di, H.J.; Moir, J.L. Nitrogen Losses from the Soil/Plant System: A Review. Ann. Appl. Biol. 2013, 162, 145–173. [Google Scholar] [CrossRef]
  57. Zhou, J.W.; Xia, F.; Liu, X.; He, Y.; Xu, J.; Brookes, P.C. Effects of Nitrogen Fertilizer on the Acidification of Two Typical Acid Soils in South China. J. Soils Sediments 2013, 14, 415–422. [Google Scholar] [CrossRef]
  58. Kemmitt, S.J.; Wright, D.L.; Jones, D.L. Soil Acidification Used as a Management Strategy to Reduce Nitrate Losses from Agricultural Land. Soil Biol. Biochem. 2005, 37, 867–875. [Google Scholar] [CrossRef]
  59. Kyveryga, P.; Blackmer, A.M.; Ellsworth, J.W.M.; Isla, R. Soil PH Effects on Nitrification of Fall-Applied Anhydrous Ammonia. Soil Sci. Soc. Am. J. 2004, 68, 545–551. [Google Scholar] [CrossRef] [Green Version]
  60. De Vries, W.; Breeuwsma, A.J. Relative Importance of Natural and Anthropogenic Proton Sources in Soils in The Netherlands. Water Air Soil Pollut. 1986, 28, 173–184. [Google Scholar] [CrossRef]
  61. Wortmann, C.S.; Milner, M.; Kaizzi, K.C.; Nouri, M.; Cyamweshi, A.R.; Dicko, M.K.; Kibunja, C.N.; Macharia, M.; Maria, R.; Nalivata, P.C.; et al. Maize-Nutrient Response Information Applied across Sub-Saharan Africa. Nutr. Cycl. Agroecosystems 2017, 107, 175–186. [Google Scholar] [CrossRef]
  62. Singh, B.; Odeh, I.O.A.; McBratney, A.B. Acid Buffering Capacity and Potential Acidification of Cotton Soils in Northern New South Wales. Aust. J. Soil Res. 2003, 41, 875–888. [Google Scholar] [CrossRef]
  63. Yang, Y.; Wang, Y.; Peng, Y.; Cheng, P.; Li, F.; Liu, T. Acid-Base Buffering Characteristics of Non-Calcareous Soils: Correlation with Physicochemical Properties and Surface Complexation Constants. Geoderma 2020, 360, 114005. [Google Scholar] [CrossRef]
  64. De Vries, W.; Posch, M.; Kämäri, J. Simulation of the Long-Term Soil Response to Acid Deposition in Various Buffer Ranges. Water Air Soil Pollut. 1989, 48, 349–390. [Google Scholar] [CrossRef]
  65. Lu, X.; Mao, Q.; Mo, J.; Gilliam, F.S.; Zhou, G.; Luo, Y.; Zhang, W.; Huang, J. Divergent Responses of Soil Buffering Capacity to Long-Term N Deposition in Three Typical Tropical Forests with Different Land-Use History. Environ. Sci. Technol. 2015, 49, 4072–4080. [Google Scholar] [CrossRef]
  66. Dong, Y.; Yang, J.; Zhao, X.; Yang, S.; Mulder, J.; Dörsch, P.; Peng, X.; Zhang, G. Soil Acidification and Loss of Base Cations in a Subtropical Agricultural Watershed. Sci. Total Environ. 2022, 827, 154338. [Google Scholar] [CrossRef]
  67. Mulder, J.; van Breemen, N.; Eijck, H.C. Depletion of Soil Aluminium by Acid Deposition and Implications for Acid Neutralization. Nature 1989, 337, 247–249. [Google Scholar] [CrossRef]
  68. Meyer, H.; Pebesma, E. Predicting into Unknown Space? Estimating the Area of Applicability of Spatial Prediction Models. Methods Ecol. Evol. 2021, 12, 1620–1633. [Google Scholar] [CrossRef]
  69. Johnston, A.M.; Bruulsema, T.W. 4R Nutrient Stewardship for Improved Nutrient Use Efficiency. Procedia Eng. 2014, 83, 365–370. [Google Scholar] [CrossRef] [Green Version]
  70. Yadav, M.R.; Kumar, R.; Parihar, C.M.; Yadav, R.K.; Jat, S.; Ram, H.; Meena, R.K.; Singh, M.; Verma, A.P.; Ghoshand, A.; et al. Strategies for Improving Nitrogen Use Efficiency: A Review. Agric. Rev. 2017, 38, 29–40. [Google Scholar] [CrossRef] [Green Version]
  71. Elrys, A.S.; Chen, Z.; Wang, J.; Uwiragiye, Y.; Helmy, A.M.; Desoky, E.-S.M.; Cheng, Y.; Zhang, J.; Cai, Z.C.; Müller, C. Global Patterns of Soil Gross Immobilization of Ammonium and Nitrate in Terrestrial Ecosystems. Glob. Chang. Biol. 2022, 28, 4472–4488. [Google Scholar] [CrossRef]
  72. Vanlauwe, B.; Bationo, A.; Chianu, J.; Giller, K.E.; Merckx, R.; Mokwunye, U.; Ohiokpehai, O.; Pypers, P.; Tabo, R.; Shepherd, K.D.; et al. Integrated Soil Fertility Management: Operational Definition and Consequences for Implementation and Dissemination. Outlook Agric. 2010, 39, 17–24. [Google Scholar] [CrossRef] [Green Version]
Figure 1. Distribution of soil profiles used in the evaluation and prediction of the soil acidity of SSA croplands. Soil profile data of SSA croplands were extracted from Soil Africa information services [34] and land use and cover data of sub-Saharan Africa were extracted from The European Space Agency (ESA) WorldCover 10 m 2020 product [35]. AfSIS refers to the Africa Soil Information Service.
Remotesensing 15 01338 g001
Figure 2. Spatial prediction workflow.
Remotesensing 15 01338 g002
Figure 3. Variation in mean H+ production from N nitrification and (a) mean total H+ from basic cation removal (b) from all cropping systems; mean total H+ production for all SSA croplands (c) and temporal share of H+ production from N nitrification and basic cation removal of all cropping systems in SSA from 1980 to 2050 (d). Details of H+ from different cropping systems (cereals, tubers, vegetables, and pulses (Figure S3).
Remotesensing 15 01338 g003
Figure 4. Covariates selected by recursive feature elimination (a), relative importance results for soil pH prediction (b), and relative importance results for soil pH decline prediction (c). Blue and green in (a) show the optimum number of covariates selected for modeling the soil pH decline and soil pH variation used in the spatial predictions.
Remotesensing 15 01338 g004
Figure 5. Spatial and temporal variations in soil pH decline in the last 42 years and prediction of soil pH decline in SSA croplands. (a) Mean annual pH decline map for 1980–2022, and (b) its standard deviation map. (c) Predicted soil pH decline map in the BAU scenario, and (d) its standard deviation map. (e) Predicted soil pH decline map in the EqD scenario, and (f) its standard deviation map. See Figure S4 for all scenario maps for soil pH decline.
Remotesensing 15 01338 g005
Figure 6. Spatial and temporal variations in soil pH in the last 42 years in SSA croplands. (a) Map of spatial patterns of soil pH in 1980, and (b) its uncertainties as a standard deviation map (pH units). (c,d) Map of current soil pH and its standard deviation map (pH units), respectively.
Remotesensing 15 01338 g006
Figure 7. Current and predicted soil pH variations in the different scenarios and their uncertainties. (a) Current soil pH map for 2022, and (b) its uncertainties as a standard deviation map (pH units). (c) Predicted soil pH map for 2050 in the BAU scenario, and (c) its uncertainties as a standard deviation map. (d) Predicted soil pH map for 2050 in the EqD scenario, (e) Predicted soil pH map in the EqD scenario and (f) its uncertainties as a standard deviation map. See Figure S5 for all scenario maps for soil pH.
Remotesensing 15 01338 g007
Figure 8. Density scatters plots of predicted against observed soil pH decline using ensemble machine learning: cross-validation results for mean annual pH decline for (a) 1980–2022, (b) 2022–2050 in the BAU scenario, and (c) 2022–2050 in the EqD scenario. The black line is the 1:1 line. MAE: mean absolute error; RMSE: root mean square error; R2: coefficient of determination for 1980 to 2050. For S1, S2, and S3, see the cross-validation results in Table S5.
Remotesensing 15 01338 g008
Figure 9. Density scatter plots of predicted against observed soil pH using ensemble machine learning: cross-validation results for soil pH in (a) 1980, (b) 2022, (c) 2050 in the BAU scenario, and (d), 2050 in the EqD scenario. The black line is the 1:1 line. MAE: mean absolute error; RMSE: root mean square error; R2: coefficient of determination. For S1, S2, and S3, see the cross-validation results in Table S5.
Remotesensing 15 01338 g009
Figure 10. Temporal variation in mean soil pH of SSA croplands (a) and variation in croplands affected by aluminum toxicity in the different scenarios (b). BAU: business-as-usual scenario (ammonium-based fertilizer and crop production for 2022 to 2050) followed the same trends as those of the last 42 years); EqD: equitable diet scenario (self-sufficiency); S1: increase of 20% in use of N fertilizers in the EqD scenario; S2: decrease of 20% in use of N fertilizers in the EqD scenario; and S3: decrease of 40% in use of N fertilizers in the EqD scenario. See Figure S7 for spatial and temporal changes in the estimated area affected by aluminum toxicity in SSA croplands.
Remotesensing 15 01338 g010
Figure 11. Comparison of past and predicted soil pH decline (a,b) and past and predicted soil pH (c,d). BAU: business-as-usual scenario (ammonium-based fertilizer and crop production for 2022 to 2050) followed the same trends as those of the last 42 years; EqD: equitable diet scenario (self-sufficiency); S1: increase of 20% in use of N fertilizers in the EqD scenario; S2: decrease of 20% in use of N fertilizers in the EqD scenario; S3: decrease of 40% in use of N fertilizers in the EqD scenario. Green (S) in figure (b) indicates statistical significance at a 95% confidence level, whereas black (NS) and red (S) indicate non-statistical significance (NS) and statistical significance (S), respectively, at a 95% confidence level.
Remotesensing 15 01338 g011
Table 1. Descriptive statistics of estimated soil pH decline in SSA.
Descriptive Statistics of Mean Annual Soil pH Decline (pH Unit)
Soil pH Decline
(N = 9043)
MeanStd. DMinMax
1980–2022)0.010.010.000.06
2022–2050 (BAU)0.020.020.000.11
2022–2050 (EqD)0.050.040.000.26
2022–2050 (S1)0.060.050.000.31
2022–2050 (S2)0.040.030.000.22
2022–2050 (S3)0.030.020.000.17
N: number of soil profiles in SSA croplands; BAU: business-as-usual scenario; EqD: equitable diet scenario; S1, S2, and S3: scenarios 1, 2, and 3; Min: minimum; Max: maximum; StD: standard deviation.
Table 2. Descriptive statistics of soil pH variation in different scenarios (1980–2022).
Descriptive Statistics of Soil pH (1980–2050)
Soil pH
(N = 9043)
MeanStd. DMinMax
19806.090.903.729.8
20226.080.903.709.79
2050 BAU6.070.903.689.78
2050 EqD6.050.893.559.78
2050 S16.040.893.509.77
2050 S26.050.893.589.78
2050 S36.060.903.669.78
N: number of soil profiles in SSA cropland; BAU: business-as-usual scenario; EqD: equitable diet scenario; S1, S2, and S3: scenarios 1, 2, and 3; Min: minimum; Max: maximum; StD: standard deviation.
Disclaimer/Publisher’s Note: The statements, opinions and data contained in all publications are solely those of the individual author(s) and contributor(s) and not of MDPI and/or the editor(s). MDPI and/or the editor(s) disclaim responsibility for any injury to people or property resulting from any ideas, methods, instructions or products referred to in the content.

