Communication

A Record-Setting 2021 Heat Wave in Western Canada Had a Significant Temporary Impact on Greenness of the World’s Largest Protected Temperate Rainforest

1
Department of Computer Science, University of Toronto, 40 St George St, Toronto, ON M5S 2E4, Canada
2
Department of Renewable Resources, University of Alberta, 751 General Services Building, Edmonton, AB T6G 2H1, Canada
*
Author to whom correspondence should be addressed.
Submission received: 22 February 2023 / Revised: 12 April 2023 / Accepted: 14 April 2023 / Published: 19 April 2023

Abstract

:
Extreme climate anomalies are expected to become more frequent under climate change, and rare extreme events, such as the 2021 western North American heat wave, provide an opportunity for comparative empirical analysis of ecosystem resilience. This study evaluates anomalies in a remotely sensed enhanced vegetation index (EVI) in the aftermath of the record-setting western North American heat wave in 2021, with temperatures approaching 50 °C in coastal and interior regions of the Pacific Northwest. The results show that the forest ecosystems most affected were not necessarily those that experienced the highest absolute temperature values. Instead, the greatest reductions in greenness were observed across northern coastal temperate rainforests. Most affected were the cooler, very wet, hyper-maritime ecosystems that are normally buffered from large temperature fluctuation by a strong oceanic influence. In contrast, moisture-limited forests of the interior plateau of British Columbia, where most of the all-time record temperatures occurred, generally showed normal or even increased productivity during and after the heat wave. A putative explanation for this heat resistance of interior forests was normal or above average precipitation leading up to the heat event, allowing for transpirational cooling. Nevertheless, the data suggest that the largest protected coastal temperate rainforest in the world, with 6.4 million hectares, is comparatively more vulnerable to extreme heat waves, which are expected to become more frequent under climate warming, than other ecosystems of the Pacific Northwest.

1. Introduction

In June 2021 a record-breaking heat wave event occurred in the Pacific Northwest of North America, with temperatures approaching 50 °C in western Canada and Washington State in the United States. The heat wave was the result of high-pressure systems that trapped warm air over the area, also referred to as a heat dome, involving subsidence/adiabatic heating and solar radiation [1], amplified by land–atmosphere feedbacks [2]. The high pressure ridge was intensified by an atmospheric river that moved into Alaska a week before, releasing heat as water vapor condensed. An additional factor was adiabatic warming that occurred as air traveled from higher interior elevations towards the lower-elevation coastal regions [3]. This configuration has been assessed as a four- or five-sigma heat anomaly, with only five other heat waves in the global historical record evaluated as more extreme [4].
Under the observed and projected climate change, the frequency and intensity of heat waves is expected to substantially increase across the mid-latitudes [5,6,7]. This is because even moderate shifts in the distributions of normal interannual climate variability can make extreme events dramatically more likely [7] (Fig. SPM.6). In the case of the 2021 western North American heat wave, the event has been assessed as being 150× less likely without the already observed anthropogenic climate change in the region [8].
The 2021 western North American heat wave caused hundreds of human deaths in the United States [9] and Canada [10] and coincided with forest fires in British Columbia at locations where the all-time record temperatures approaching 50 °C occurred [11]. Foliar damage and tree mortality as direct heat impacts were reported in Oregon [12], and heat wave impacts were also documented for a variety of conifers species from across the world at a botanical garden [13]. The 2021 heat wave event is, however, still too recent for systematic and large-scale research results of the impacts on natural systems to have emerged in the literature.
The impacts of prior heat waves on forest ecosystems have, however, been well-documented elsewhere. An example of the direct impacts of a short-duration heat wave in eastern Canada include abscission of leaves and associated reduction in productivity due to a heat wave in spring of 2013 [14,15,16]. Another well-documented example for the impacts of a long-duration heat wave is for an event that occurred across Europe in 2003 over the course of several weeks. High-pressure systems trapped warm air over the continent, leading to mean monthly temperature records exceeding 40 °C in southern Europe and monthly anomalies ranging from +10 to +20 °C [17]. The heat wave had severe impacts on forest ecosystems, inferred from remote sensing analysis [18] and from plot-based research. A reduction of approximately 30% in gross primary productivity or growth of forest trees occurred across large areas of Europe [19,20]. The event was associated with increased tree mortality [21], as well as subsequent pest and disease outbreaks [22].
In general, short- and medium-term effects of heat waves on forest trees are related to changes in enzyme activity, reduced photosynthesis, and dehydration, as exemplified in [23,24]. To mitigate the effects of heat damage, trees may respond by increasing transpiration for its cooling effect if water availability is not a limiting factor. Alternatively or additionally, trees can adjust thermal tolerance by increasing their production of protective chemicals [25]. Beyond these adaptive responses, shedding leaves or needles can protect against negative water potential causing long-term damage though xylem cavitation, as shown in [23,26]. Despite these coping mechanisms, heat damage can still have significant impacts on the health and productivity of trees [27]. In the longer term or under repeated heat waves, stressed trees can be more vulnerable to pests and diseases [22], permanent xylem damage [13], and dieback and mortality [28]. This can lead to permanent ecosystem changes, sometimes brought into focus through large-scale natural disturbances caused by unprecedented damage wind caused by weakened trees or catastrophic pest and disease outbreaks [29].
For the conservation and management of forest ecosystems, it is therefore important to assess the potential impacts of heat waves on ecosystems. Understanding the vulnerability of forests to climate change is important for developing effective adaptation and monitoring strategies. Here, we conduct a remote sensing analysis of the 2021 heat wave in western Canada using the enhanced vegetation index (EVI) as a proxy for photosynthetic activity and potential impacts on forest productivity. The EVI is designed to be sensitive to absorption of photosynthetically active radiation, and it has been shown to be correlated with measures of forest productivity [30,31,32]. The objective of this study is to investigate putative physiological responses of forest trees to the 2021 heatwave. Specifically, we: (1) assess potential short- and medium-term impact of the 2021 heat wave on western Canadian forests; (2) identify factors that influence the vulnerability of different forest ecosystems to heat waves; and (3) if applicable, provide specific recommendations for ground-based in situ validation, or for experimental research to confirm the inferred ecosystem vulnerabilities.

2. Materials and Methods

2.1. Climate Data

Daily temperature and precipitation data were obtained from the European Centre for Medium-Range Weather Forecasts (ECMWF) ERA5 reanalysis dataset for the period of 1950–2021. The ERA5 dataset provides a 0.25° resolution record of atmospheric and land surface variables, including temperature, precipitation, and various meteorological indices. To obtain daily temperature and precipitation data, we used the ECMWF’s Web API service (accessed from https://www.ecmwf.int/en/computing/software/ecmwf-web-api (accessed on 10 October 2022) and subsequently used the xarray library for Python and to process the data [33]. To identify the severity and geographic range of the heat dome event, climate anomalies during the 2021 heat dome event were computed by subtracting 2021 daily temperature records from the averaged daily values of a 40-year reference period, 1951–1990, for the extent of the western North American study area. Considering potential influences related to the moisture conditions, precipitation anomalies were also generated. Because of the intermittent nature of precipitation events, an 11-day moving average was applied to both the 2021 records and the 1951–1990 baseline. A gridded and a tabular database of daily temperature records for the year 2021 as well as the reference period are available as supplement at https://0-doi-org.brum.beds.ac.uk/10.6084/m9.figshare.22122332 (accessed on 21 February 2023), and the computed daily 11-day moving average for 2021 and the reference period used in this study are available as supplement at https://0-doi-org.brum.beds.ac.uk/10.6084/m9.figshare.22122335 (accessed on 21 February 2023).
For the characterization of long-term climate conditions across different ecosystems throughout the study area, we used another data source for convenience, the software ClimateNA v7.01 [34]. The software estimates a range of bioclimatic variables for a climatic normal period of interest, and for any specified spatial extent and grid resolution. Here, we estimated eight bioclimatic variables based on a 1 km resolution digital elevation model for the 1961–1990 climate normal period. The selected variables included: mean annual temperature (MAT), mean warmest month temperature (MWMT), mean coldest month temperature (MCMT), continentality described as the temperature difference (TD) between MWMT and MCMT, mean annual precipitation (MAP), May-to-September precipitation (MSP), as well as an annual and summer heat-moisture index (AHM and SHM, respectively). These data were used to analyze differences of heat wave impacts on ecosystems in the context of general regional climate conditions. This dataset for the study area is available as supplement at https://0-doi-org.brum.beds.ac.uk/10.6084/m9.figshare.22122338 (accessed on 21 February 2023).

2.2. Remote Sensing Data

As a proxy for forests’ health and productivity, the enhanced vegetation index (EVI) was chosen because it is less sensitive to noise from soil and atmospheric conditions and is less saturated in high-biomass areas than the normalized difference vegetation index (NDVI) [35]. The EVI is widely used to derive metrics related to primary productivity and to reflect vegetation responses to drought [30,31,32]. A high-quality EVI product is also available for long time series, allowing for reliable base-line data to calculate anomalies. Here, we used 21 years (2001 to 2021) of 16-day 500 m EVI records from the Moderate Resolution Imaging Spectroradiometer (MODIS) dataset MOD13A1, Collection 6, as described by Huete et al. [35] and Didan et al. [36]. This 16-day EVI product has a low percentage of missing values or low data quality flags and is useful for monitoring and tracking the changes of vegetation growth, vegetation stress, and vegetation coverage on regional and global scales.
The dataset was obtained through NASA Land Processes Distributed Active Archive Centre, U.S. Geological Survey/Earth Resources Observation and Science Centre from https://lpdaac.usgs.gov (accessed on 10 October 2022). We removed records flagged as poor quality (classified as ‘Lowest quality’, ‘Quality so low that it is not useful’, ‘L1B data faulty’, ‘Not useful for any other reason/not processed’). This analysis focuses on forested land cover, and non-forested areas as classified by the MCD12Q1 land cover product of the International Geosphere-Biosphere Programme (IGBP) [37] were also excluded. Thus, the analysis includes needle leaf, broadleaf and mixed forests with tree cover above 60%, as defined in classes 1 through 9 by Sulla-Menashe and Friedl [37]. After filtering out low-quality observations and non-forested land cover, we calculated normal levels of greenness and 2021 EVI deviations as follows: The original MOD13A1 product comprises 23 sequential 16-day EVI summaries for each year. We averaged each set of sequential grids across the period of data availability (2001–2020) to obtain a new set of 23 sequential grids that represent normal EVI reference values throughout the year. To quantify the impacts of the heat dome event on forest greenness, we computed the EVI deviations of the 23 sequential grids for 2021 from the historical 2001–2020 average. Reprocessed EVI data for the study area as described above are available as supplement at https://0-doi-org.brum.beds.ac.uk/10.6084/m9.figshare.22122341 (accessed on 21 February 2023).

2.3. Ecosystem-Based Analysis

In addition to mapping the 2021 EVI anomalies at moderate resolution, we also generated numerical summaries of EVI values according to ecosystem delineations and analyzed average ecosystem 2021 EVI anomalies as a function of various ecosystem attributes. For this purpose, we used the Biogeoclimatic Ecosystem Classification (BEC) system version 6 for British Columbia, originally developed by Pojar et al. [38], and the Level-IV Ecoregion delineation for the US, originally developed by Bailey et al. [39]. In addition to the ecosystem-based analysis, we also worked with four larger-scale regional summaries that reflect distinct patterns of EVI response. For the higher-level summary into four regions, we aggregated the 36 Canadian and US ecosystem variants. The region “Southern BC coast” consists of eleven variants of the Coastal Western Hemlock (CWH) zone, “Northern BC coast” summarizes four variants of the CWH and two equivalent Alaska ecosystem variants, and the “Alaska coast” region comprises four CWH-equivalent variants. For the “BC interior” region, we restrict our summary to the commercially important Sub-Boreal Spruce (SBS) zone, comprising 14 variants. The selected ecosystems in four regions cover a forested area of 207,000 km2. A detailed breakdown of EVI response summaries and ecosystem variant characteristics is available as supplement at https://0-doi-org.brum.beds.ac.uk/10.6084/m9.figshare.22122344 (accessed on 21 February 2023).
Additional attributes for the 36 ecosystem variants were extracted from various databases, using a systematic sample at 4 km intervals, restricted to forested areas with tree cover above 60%, to characterize average forest ecosystem attributes. The variables included were: elevation (ELEV), percent relative radiation (PRR), and a topographic convergent index (CTI), derived from a 250 m digital elevation model (for details see [40]). Percent deciduous forest (PER_DEC) was derived from a 500 m resolution landcover aggregate of a 30 m Landsat product [41]. Additional soil variables that may putatively contribute to ecosystem vulnerabilities to heat wave impacts include soil bulk density (BULKDENS), field capacity (FIELDCAP), plant available water capacity (PAWC), soil thermal capacity (THERMCAP), and soil wilting point (WILTPOINT) obtained from the FAO Harmonized World Soil Database [42]. Soil and other variables listed above were extracted to a 1 km resolution grid for the study area and then averaged according to ecosystem and region delineations. Database extractions of additional attributes for the study area as described above are also available as supplement at https://0-doi-org.brum.beds.ac.uk/10.6084/m9.figshare.22122344 (accessed on 21 February 2023).
Principal component analysis (PCA) implemented with the princomp function and the vector fit vf function of the ecodist package [43] for the R programming environment [44] was used to ordinate multivariate ecosystem attributes of climate, soil and topography, and to visualize associations of those variables with EVI anomalies during the 2021 heat wave.

3. Results

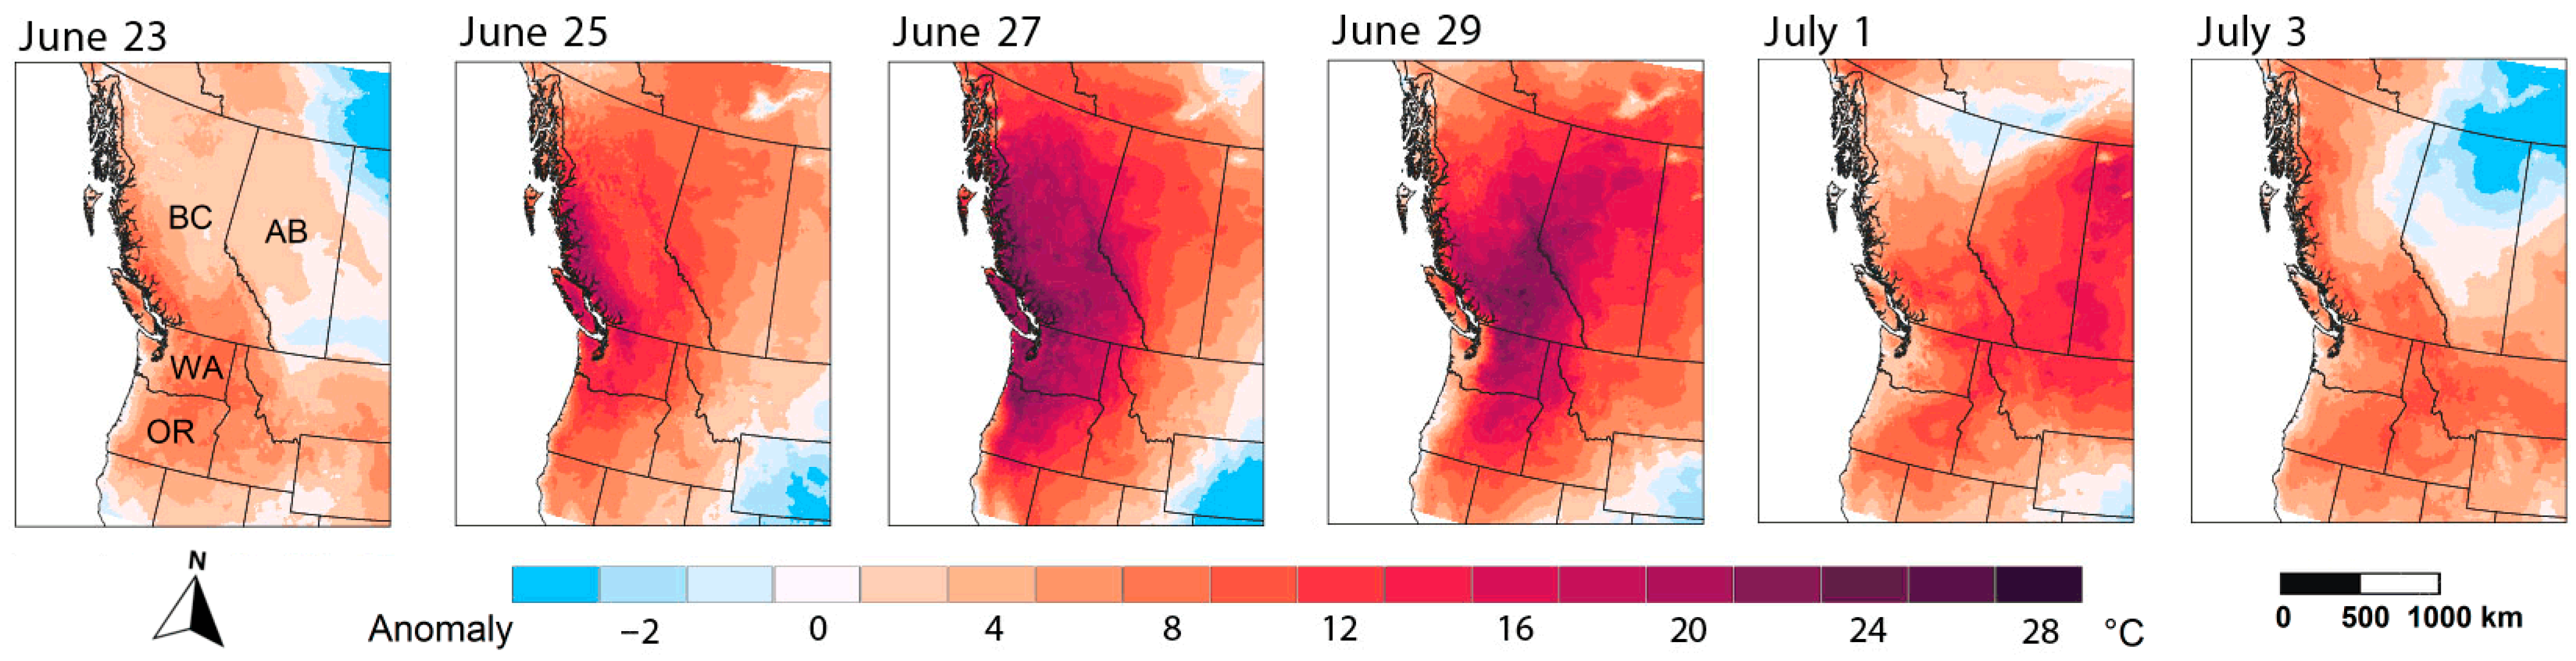
3.1. Heat Wave Extent and Duration

The 2021 western North American heat wave had a duration of approximately 10 days and peaked at the end of June, spanning a large area comprising northern Oregon, Washington State in the western US, and British Columbia and Alberta in Canada (Figure 1). Subsequently the heat dome moved east into Saskatchewan and Manitoba, also causing record-breaking weather conditions further east. Overall, the heat dome affected a total area of approximately 3 million km2 of western North America. The study area is characterized by very diverse baseline climate conditions, ranging from cool, wet, hyper-maritime ecosystems at the coast of British Columbia, to alpine areas of the Coastal Cordillera and Rocky Mountains, desert ecosystems in the rain shadows of the coast Mountains of Southern British Columbia, Oregon and Washington and extensive dry interior plateaus with Prairie grasslands. While Figure 1 only shows relative difference of temperature to these baseline climates, the absolute temperature records approaching 50 °C primarily occurred in the valleys of the coast mountains of British Columbia.

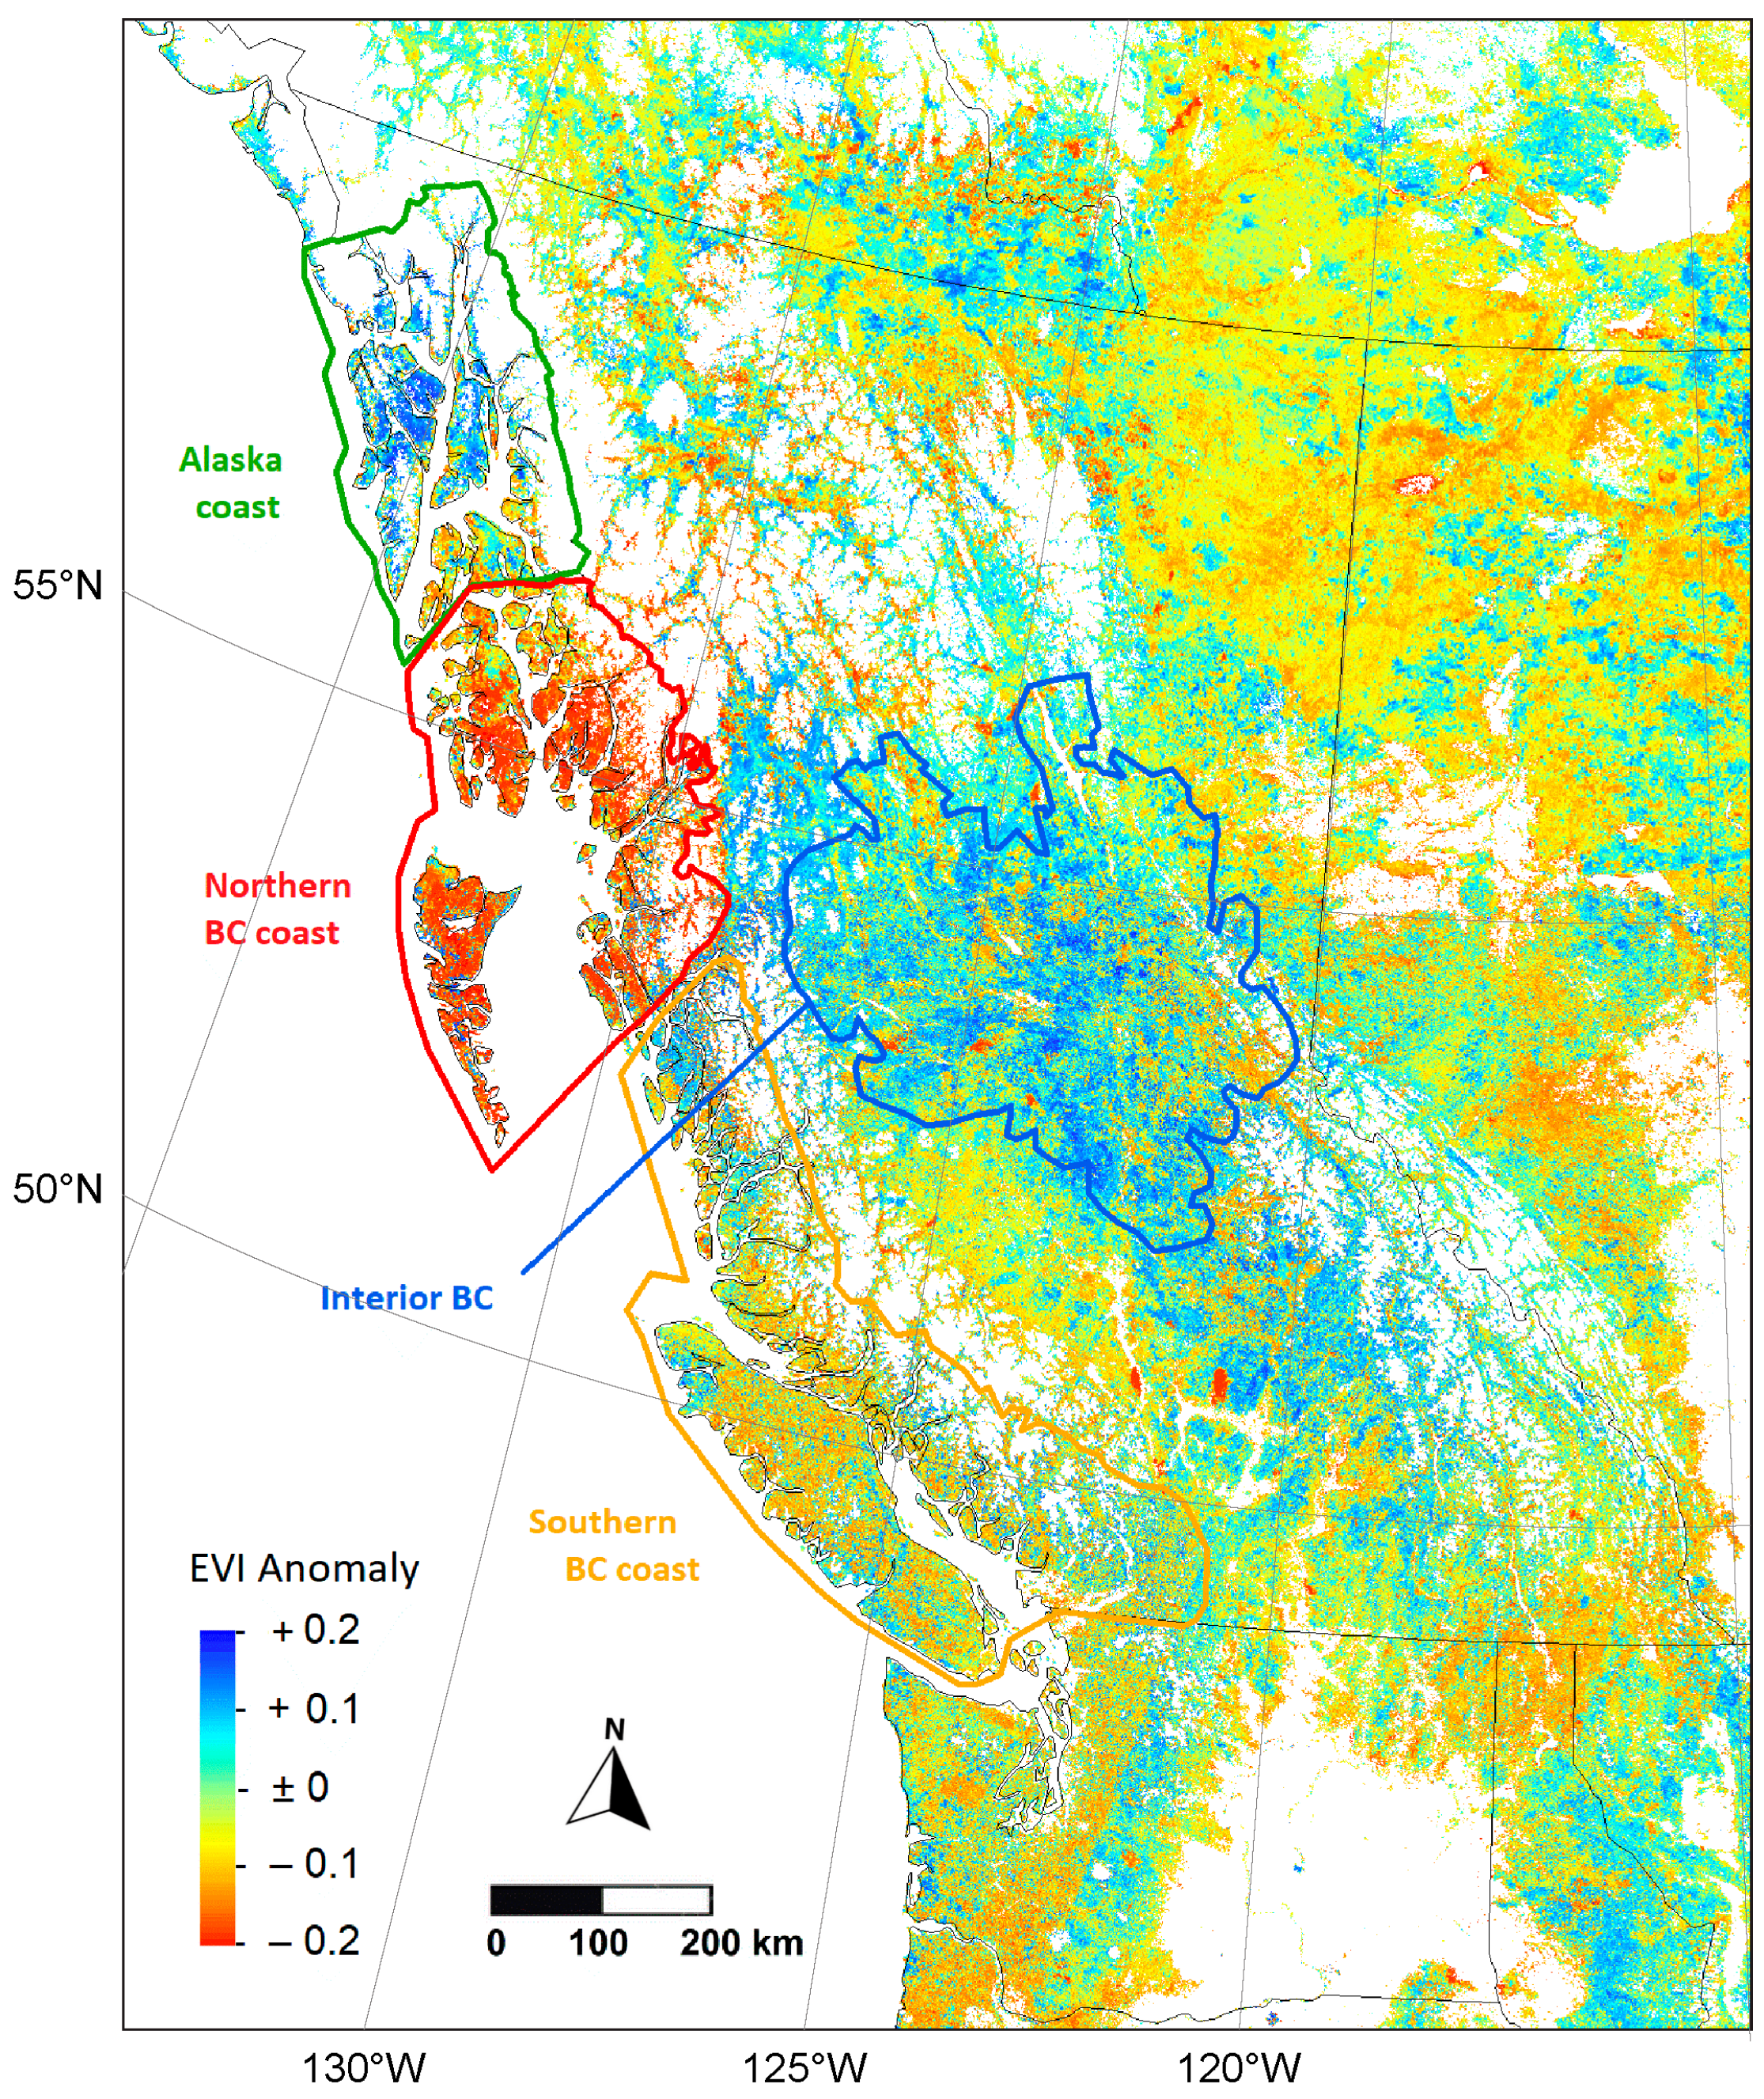
3.2. Short-Term Response in Vegetation Greenness

To visualize the vegetation response to the heat wave, we mapped the EVI anomaly values for the 16-day period immediately following the heat wave (Figure 2). The EVI 2021 anomaly values, calculated as the difference compared to the historical 2001–2020 average, suggest that 40% of the study area experienced a decline in vegetation greenness. There was a substantial spatial variability vegetation response, ranging from a decrease of 58% at the 5th percentile to an increase of 43% at the 95th percentile of grid cells. Grid cells with near 100% declines in vegetation greenness, visible as compact red patches in the south of British Columbia (Figure 2), were the result of forest fires. The map also reveals strong regional patterns of heat wave impacts. Inferred forest productivity was most strongly impacted for coastal ecosystems of northern British Columbia (Figure 2, region delineated in red). Even further north, along the Alaska coast, which was largely bypassed by the heat wave, EVI anomalies were positive (green delineation). In addition, many of the interior ecosystems of British Columbia showed increased inferred productivity (blue delineation). Other areas, including the southern coastal forests of British Columbia (yellow delineations), as well as montane and interior ecosystems of northeast British Columbia and Alberta, showed intermediate or slightly negative responses in EVI values.

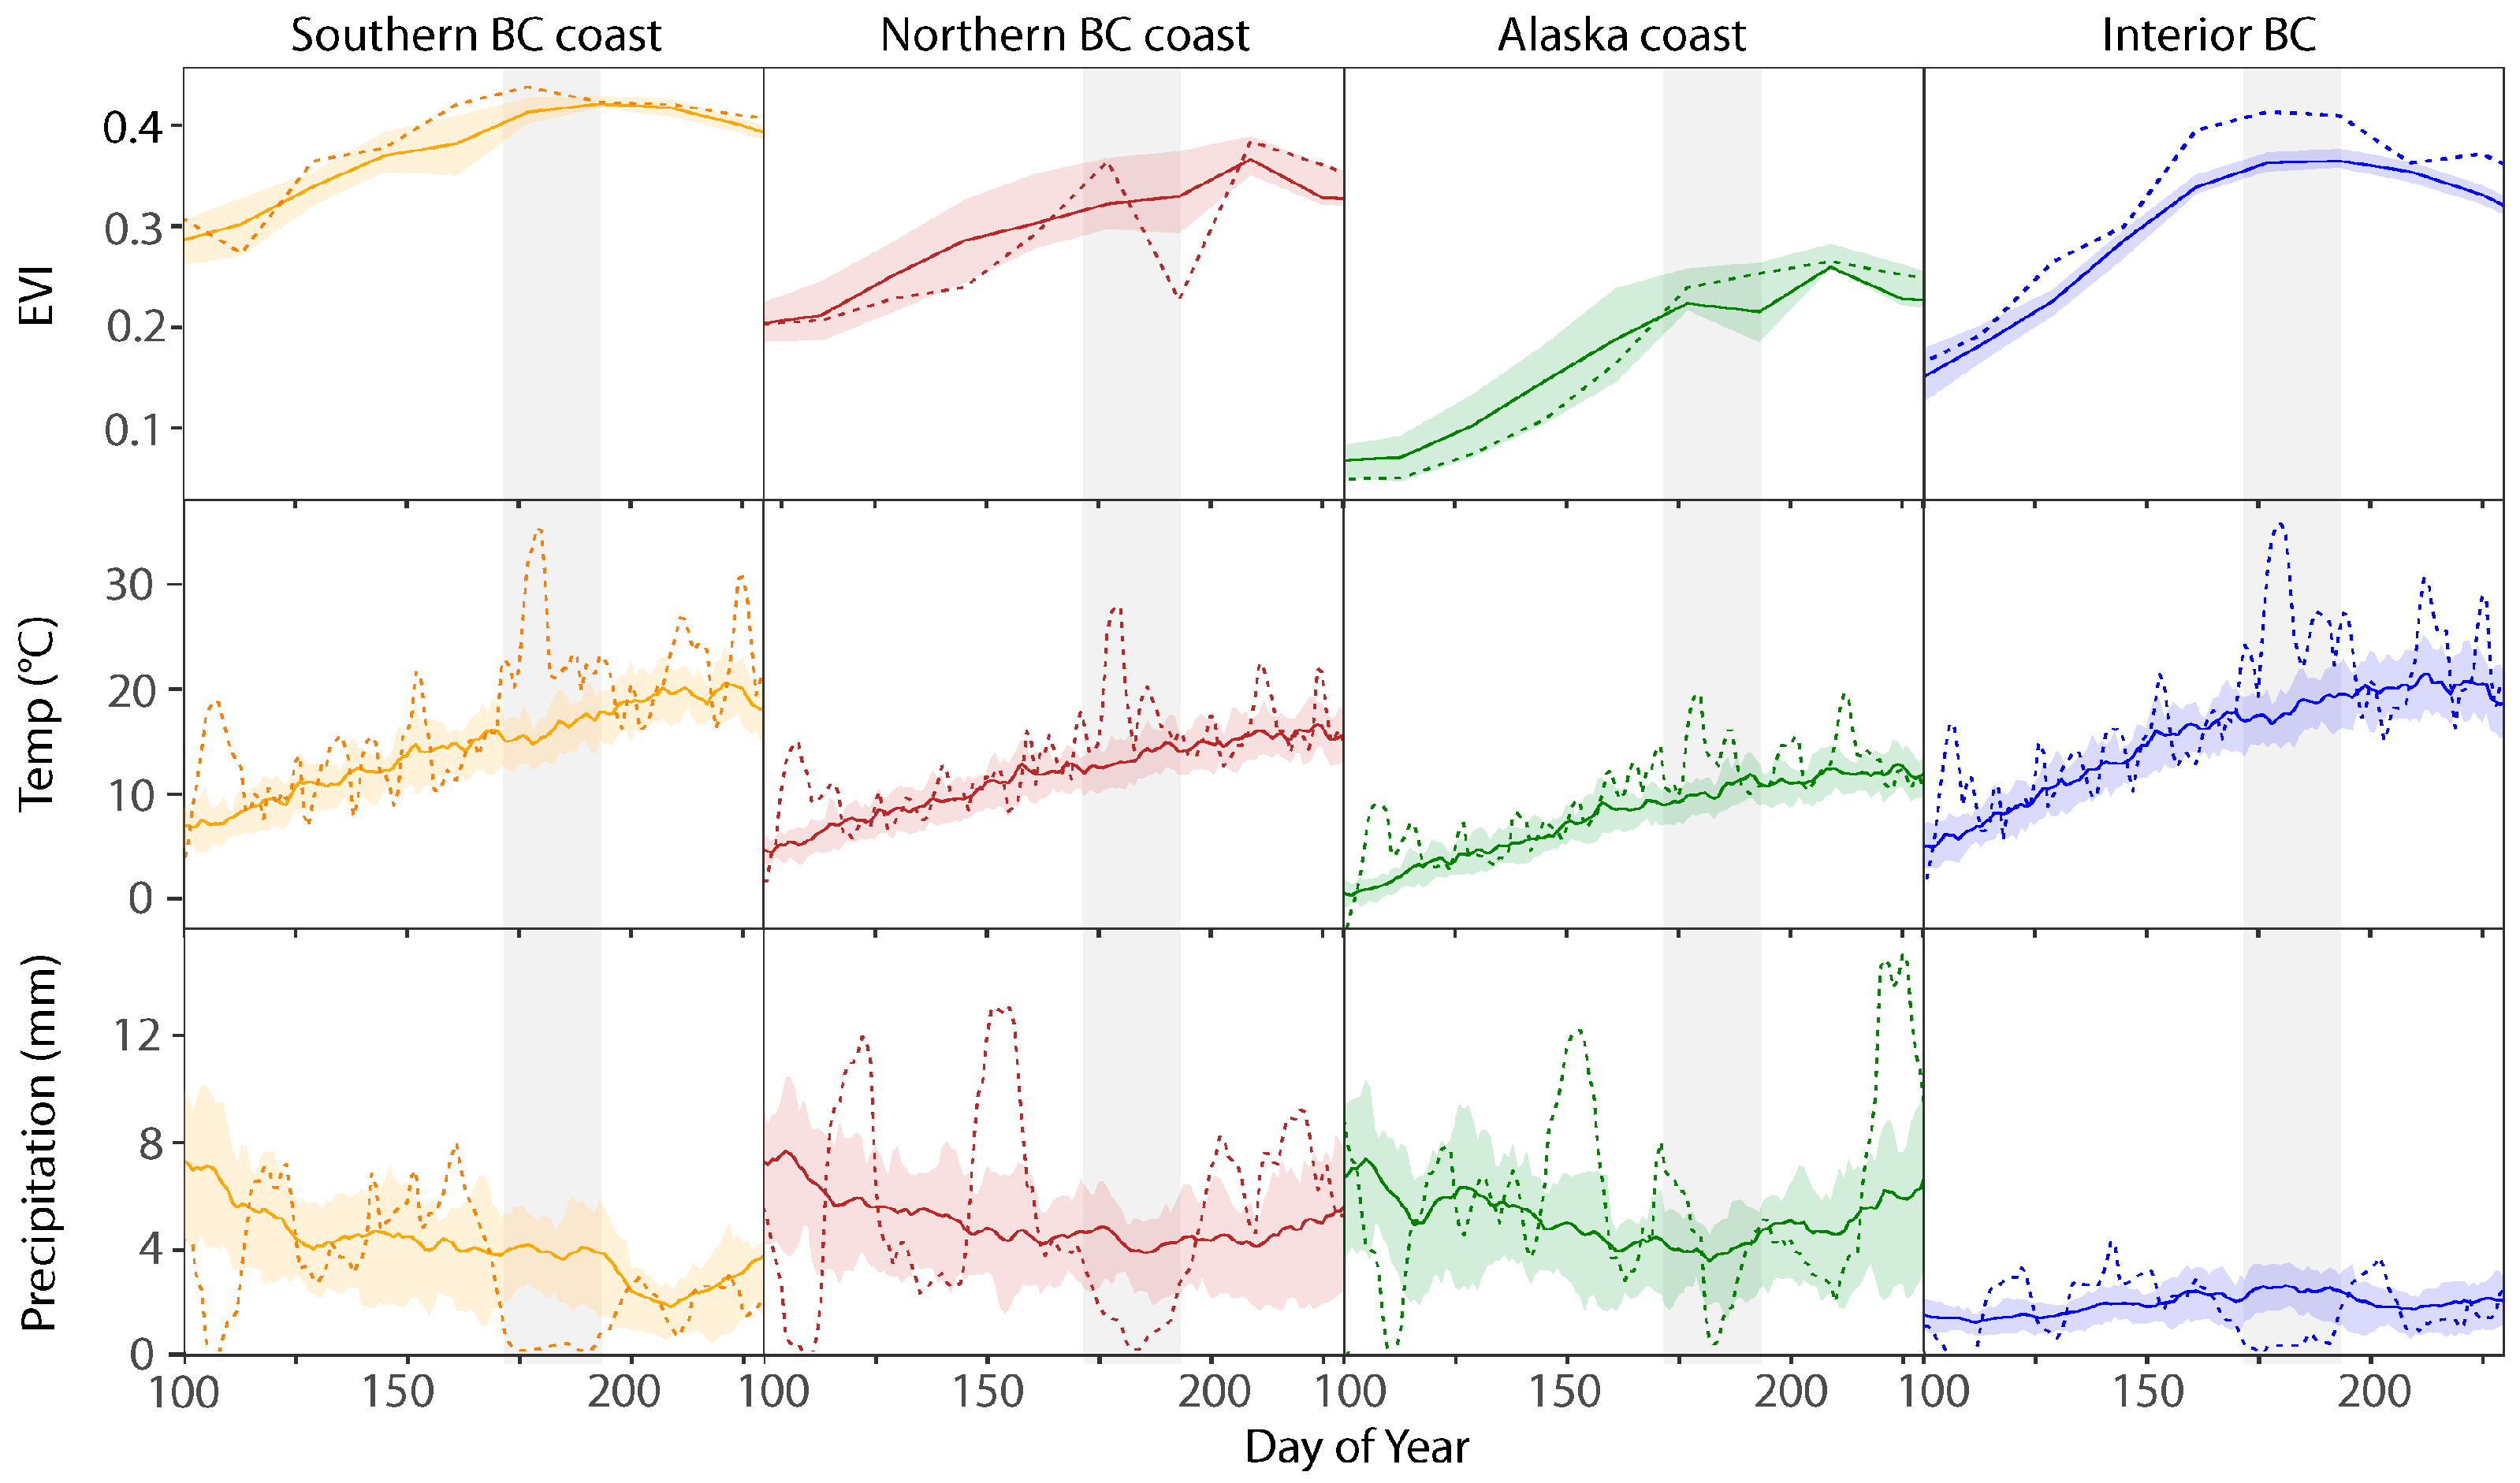
3.3. Lead-Up and Medium-Term Response

In order to visualize climates leading up to and following the heat wave event, as well as the EVI response, we use time series for summaries regional using the delineations shown in Figure 1. For comparison of 2021 growing season data with normal conditions, we use the 2001–2020 historical average as reference values (Figure 3). This analysis suggests that climate conditions leading up to the heat wave were largely normal or slightly elevated for all regions, also summarized numerically (Table 1). Notably, medium-term drought periods should not have played an important role exacerbating heat wave impacts. In fact, the highest precipitation anomaly observed for the first three month of 2021 (+42%), occurred for the Northern BC Coast region, that was most negatively affected by the heat wave later in the same year (Table 1). During the heat wave itself, there was little precipitation (Figure 2, bottom row) for most of the regions. Only the Alaska coast region experienced precipitation during the heat wave period.
Time series of regional EVI averages suggest largely average productivity, with a notable short-term decline after the heat wave for the Northern BC coast region (Figure 2 top row, with the negative spike corresponding to Figure 2). EVI values for the interior of BC were notably above the historical long-term average for the 2021 growing season, and this implied above average productivity was not affected by the heat wave and was associated with only slightly elevated precipitation prior to the heatwave (Figure 3, right column and Table 1).

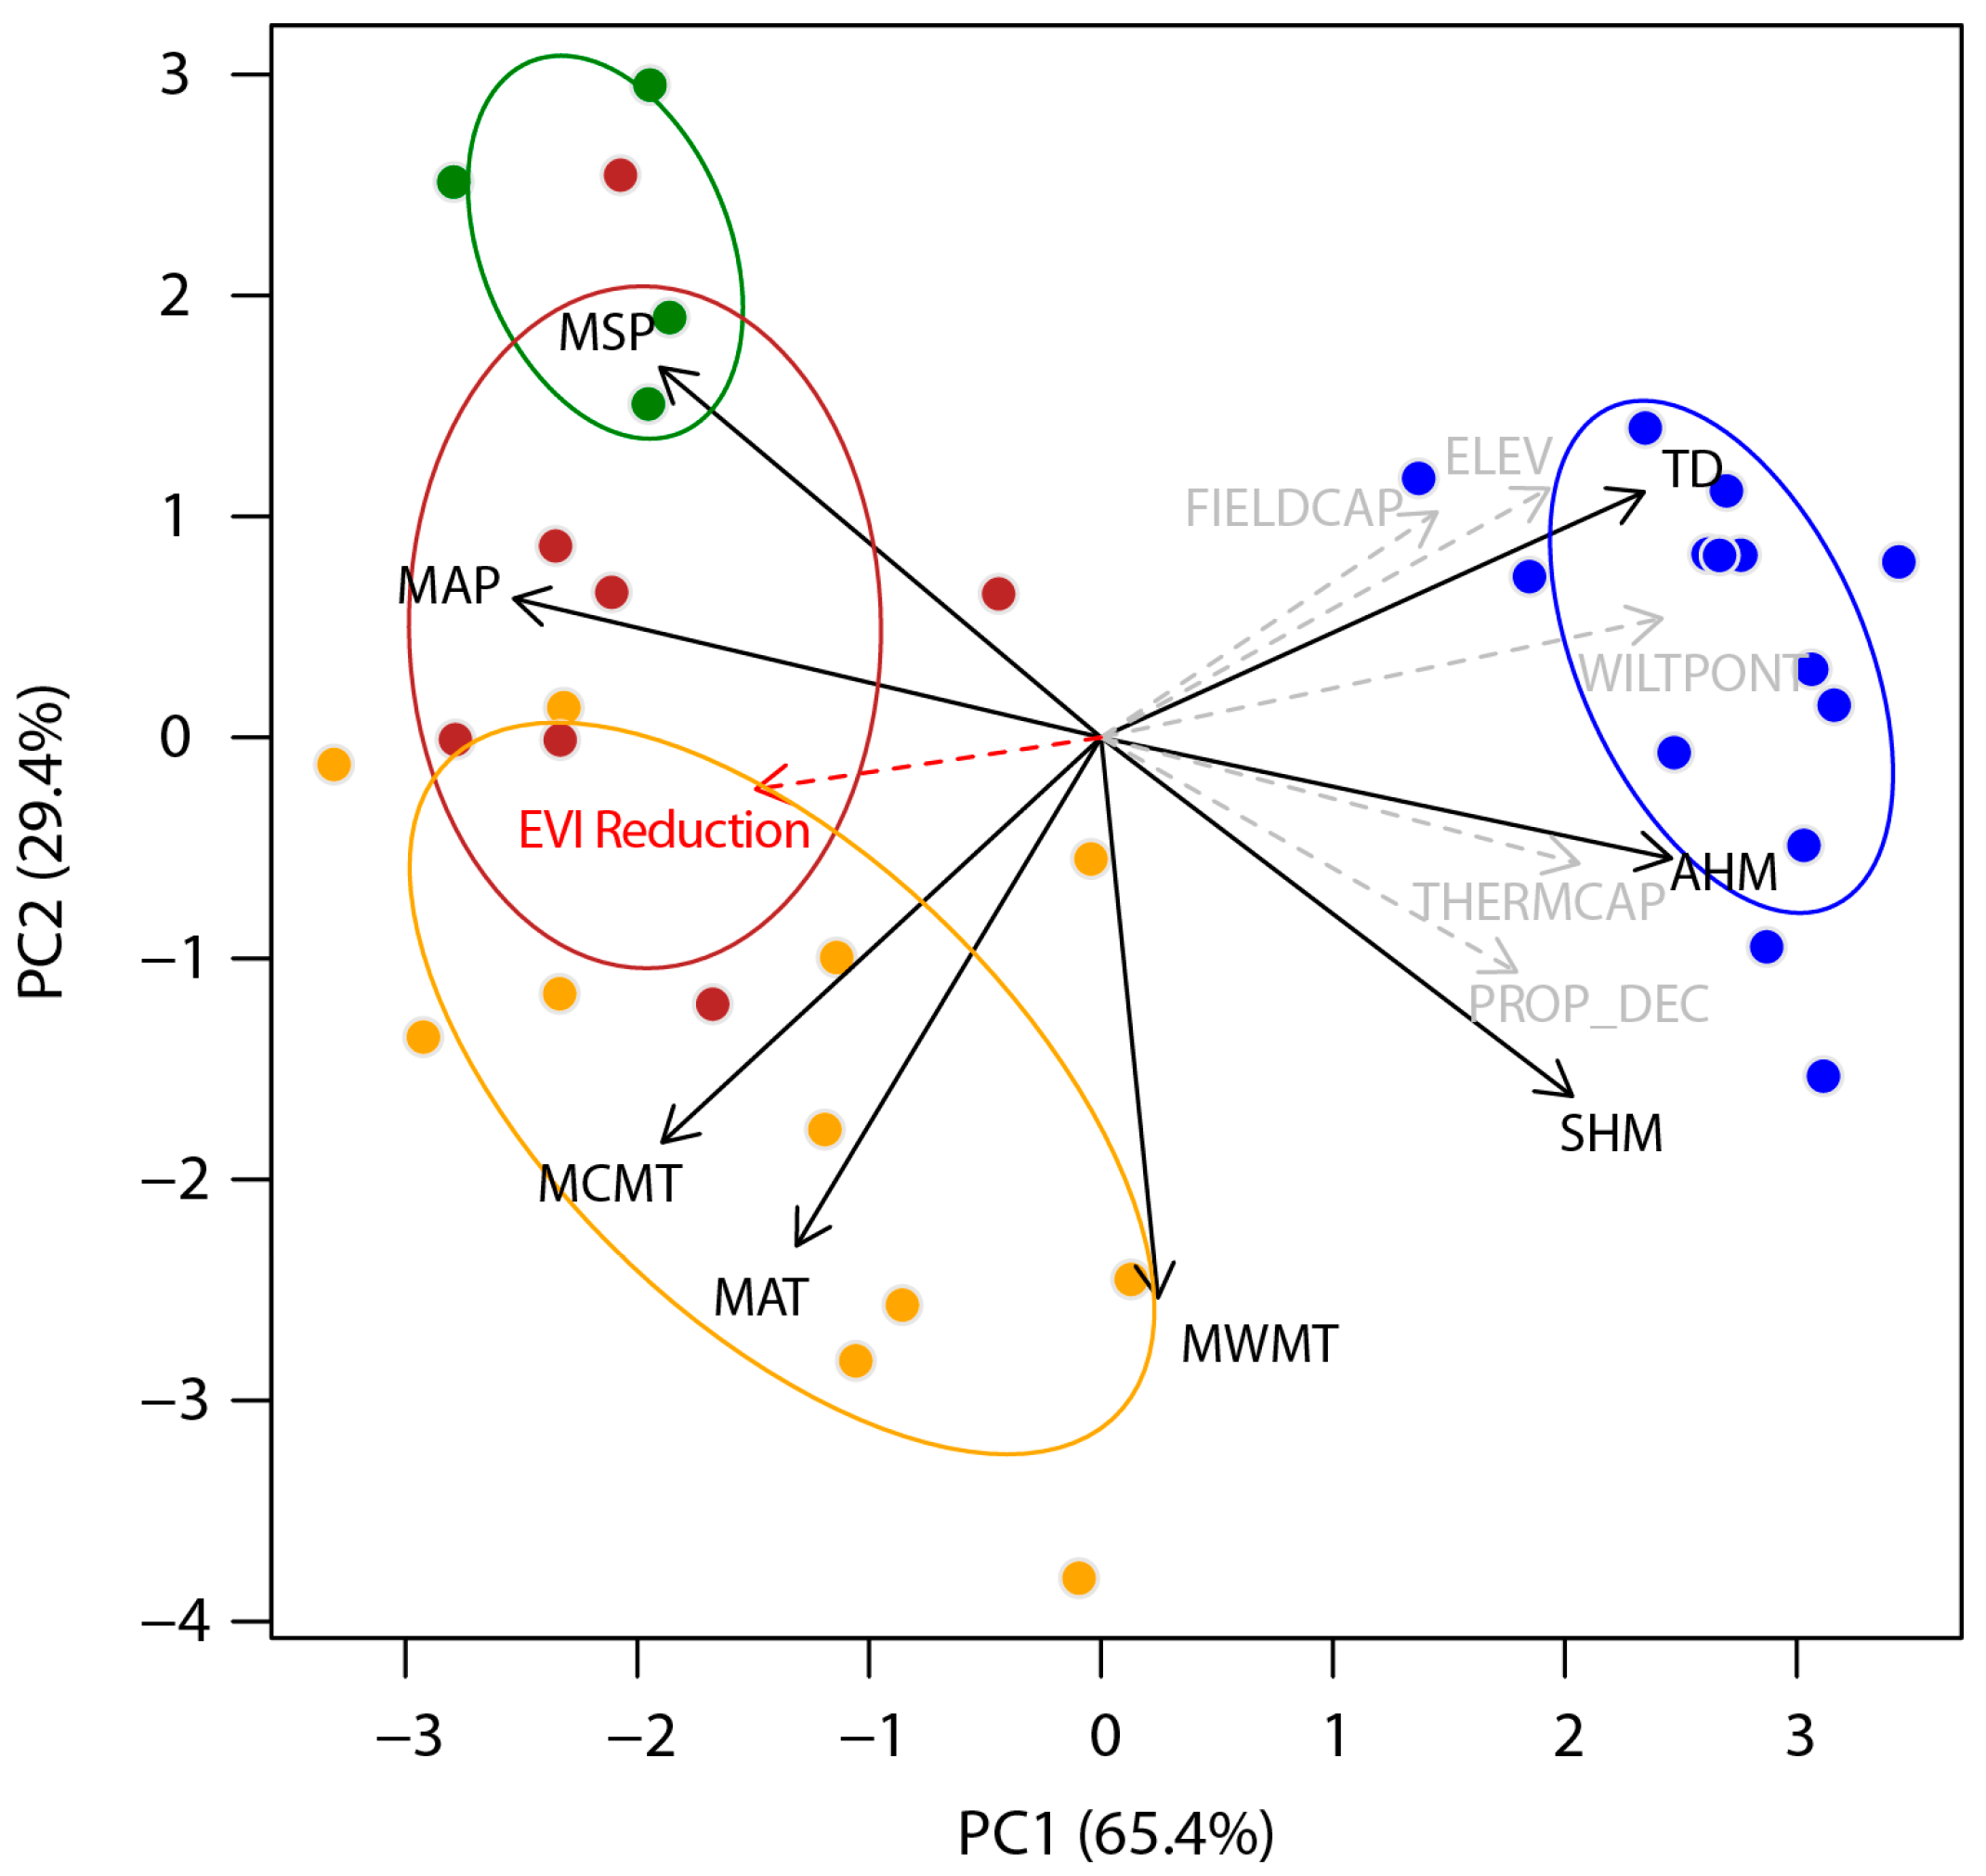
3.4. Ecosystem Attributes and Heat Wave Impacts

To further analyze how multiple ecosystem attributes may be associated with vegetation response to the 2021 western North American heat wave, we use principal component analysis and an indirect gradient analysis to associate putative predictor and response variables. Only two principal components could explain 94.7% of the total variance in the dataset (Figure 4), with corresponding regional summary statistics shown in Table 2. The first principal component (PC1) represents climate variables related to precipitation (TD, MAP, AHM, and SHM), indicated with vectors positioned parallel to the PC1 axis. Additionally, primarily associated with the PC1 axis are soil conditions associated with water-holding capacity (FIELDCAP, WILTPOINT, THERMCAP). Interior ecosystems, separated by the first principal component, also have a somewhat higher proportion of deciduous trees (PROP_DEC). The second principal component, explaining 29.4% of the total variance in the dataset, represents a latitudinal gradient of ecosystem attributes for the coastal ecosystems, with the most northern ecosystems being characterized by the highest growing season precipitation (MSP), and the southern coastal ecosystems having the warmest climate conditions (MAT, MCMT, MWMT). The highest impact of the heat wave (Figure 2, red vector) was associated with the Northern BC coast region (Figure 2, red dots and ellipses), and negatively associated with soil conditions favorable to water-holding capacity (Figure 2, opposite grey vectors).

4. Discussion

Although temperatures such as those observed during the 2021 western North American heat wave are expected to lead to a loss of photosynthesis in boreal and sub-boreal forest tree species, as shown in [45], this was notably not observed in this study. Despite record-setting temperatures of an exceedingly rare heat event, we observed no short-term or medium-term impacts on vegetation greenness of the Sub-Boreal Spruce (SBS) ecological zone in the BC interior, a region of economic importance for the forestry sector of British Columbia. Our putative explanation for this phenomenon is that tree species occurring across the interior plateaus of western Canada are generally well-adapted with respect to heat tolerances, and that transpirational cooling was possible due to the high water-holding capacity of soils and slightly above average precipitation in the months leading up to the heat wave event. A very similar observation and interpretation has also been made for drought- and heat-adapted Eucalyptus trees during a heat wave in Australia [25].
Our data indicate that a relatively short-term heat event alone does not appear to have a long-lasting impact, provided that prior precipitation and soil water-holding capacity allow for transpirational cooling. In contrast, heat waves combined with general drought conditions strongly affect medium- and long-term ecosystem health and productivity, as has been documented for European forests [46]. That said, our study did reveal a pronounced transitory impact of reduced photosynthetic activity for northern BC coast forests. The impacted area, also known as the Great Bear Rainforest, is of particular conservation concern. With 6.4 million hectares, it is the largest protected temperate rainforest in the world, equivalent in size to Ireland. The area consists predominantly of old growth forests and is protected under the 2016 Great Bear Rainforest Land Use Order and Great Bear Rainforest Forest Management Act [47].
Our results suggest that tree species of this wet, hyper-maritime climate region are generally more vulnerable to heat anomalies. They have no evolutionary adaptations to such rare extreme events and could be vulnerable to increasing heat and drought events expected under global climate change. Although we did not observe the same negative transitory impacts on EVI values for coastal ecosystems further north on the Alaska coast (Figure 2 and Figure 3), we expect that the same vulnerabilities apply to these even cooler, wetter hyper-maritime ecosystems with similar species composition. Our interpretation of the coastal Alaska data is that potential impacts were mitigated by the heat wave just bypassing this region (Figure 1), and additional precipitation received at the time of the heat wave (Figure 3).
Northern coastal forest ecosystems are generally cold-limited in terms of productivity [48]. Therefore, generally, they should not be threatened by climate warming if there are no moisture limitations. Future climate change predictions according to both CMIP5 [49] and CMIP6 [50] multi-model projections for the Pacific Northwest indicate that temperature and precipitation are expected to only moderately increase for the Pacific Northwest coastal regions with regard to long-term normal conditions. However, our study shows that extreme heat events, which are expected to increase in likelihood even under moderate average warming scenarios, could be potentially damaging. Should future heat events be associated with drought conditions (unlike in 2021), it could potentially lead to more severe impacts than those observed in this study.
While remote-sensing based research and empirical studies in general can often be useful to build hypotheses and formulate expectations of ecosystem response, additional ground-based or experimental research is generally needed to verify our putative explanations. It has also been pointed out by others that most thermal tolerance research focuses on cold tolerances and that heat-tolerance is generally not well-quantified [51]. Experimental research on comparative heat tolerances could complement our empirical data, which suggest that northern coastal species and their populations may be disproportionately vulnerable to extreme heat events. This working hypothesis could be addressed by using ecophysiological growth chamber experiments, as in [52], or by relying on plant material harvested from long-term provenance trials and other genetic field experiments where genotypes from different origins are planted in a common garden, e.g., [53]. This would allow one to directly compare heat tolerance traits of species, and of populations within species, that originate from different environments within the study area.

5. Conclusions

In summary, this study is primarily an example of the high resilience of forest ecosystems to heat waves, if heat waves do not coincide with drought conditions, and of how transpirational cooling is therefore an available mechanism to prevent or mitigate heat damage. Secondly, the highest absolute temperature values or even the highest temperature anomalies are not necessarily associated with the highest damage in a complex landscape with a wide range of climates and a high diversity of ecosystems. In this study, the most affected ecosystems were the cooler, very wet, hyper-maritime ecosystems that are normally buffered from large temperature fluctuation by a strong oceanic influence, and whose local species and their populations may therefore not have developed genetic adaptations that allow them to cope with heat anomalies that were moderate in the context of anomalies observed throughout the entire study area. Our data suggest that the northern section of the coastal temperate rainforest is potentially more vulnerable to extreme heat waves, which are expected to become more frequent under climate warming, than generally expected. The impacted area is also known as the Great Bear Rainforest, and, with 6.4 million ha, it is the largest protected temperate rainforest in the world. Because of its significant conservation value, our inferences should be further examined through additional in situ or experimental research, e.g., comparative heat tolerance experiments or physiological assessments making use of long-term common garden trials for the region.

Author Contributions

Conceptualization, Z.S. and A.H.; data curation, analysis and visualization, Z.S.; writing—original draft preparation, review and editing, Z.S. and A.H. All authors have read and agreed to the published version of the manuscript.

Funding

Funding for this study was provided by the NSERC Discovery Grant RGPIN-330527-20.

Data Availability Statement

All data needed to evaluate the conclusions in the paper are open-access and available from third parties as cited. All reprocessed data used for analysis in this study are available as supplements in a figshare data repository: https://figshare.com/projects/2021_heat_dome_impacts_to_Western_Canadian_forest/159911 (accessed on 21 February 2023).

Acknowledgments

We gratefully acknowledge the provision of cloud computing services and data through the Power Analytics and Visualization for Climate Science (PAVICS) platform, Ouranos and CRIM, 2018–2023, https://pavics.ouranos.ca (accessed on 10 October 2022). PAVICS is funded through Ouranos, the Computer Research Institute of Montreal (CRIM), Environment and Climate Change Canada (ECCC), CANARIE, the Fonds Vert and the Fonds d’électrification et de changements climatiques, the Canadian Foundation for Innovation (CFI), and the Fonds de Recherche du Québec (FRQ).

Conflicts of Interest

The authors declare that they have no competing interest. The funders had no role in the design of the study; in the collection, analyses, or interpretation of data; in the writing of the manuscript, or in the decision to publish the results.

References

  1. Overland, J.E. Causes of the record-breaking Pacific Northwest heatwave, late June 2021. Atmosphere 2021, 12, 1434. [Google Scholar] [CrossRef]
  2. Bartusek, S.; Kornhuber, K.; Ting, M.F. 2021 North American heatwave amplified by climate change-driven nonlinear interactions. Nat. Clim. Chang. 2022, 12, 1143–1150. [Google Scholar] [CrossRef]
  3. White, R.H.; Anderson, S.; Booth, J.F.; Braich, G.; Draeger, C.; Fei, C.; Harley, C.D.G.; Henderson, S.B.; Jakob, M.; Lau, C.-A.; et al. The unprecedented Pacific Northwest heatwave of June 2021. Nat. Commun. 2023, 14, 727. [Google Scholar] [CrossRef] [PubMed]
  4. Thompson, V.; Kennedy-Asser, A.T.; Vosper, E.; Lo, Y.T.E.; Huntingford, C.; Andrews, O.; Collins, M.; Hegerl, G.C.; Mitchell, D. The 2021 western North America heat wave among the most extreme events ever recorded globally. Sci. Adv. 2022, 8, 6860. [Google Scholar] [CrossRef]
  5. Perkins, S.E.; Alexander, L.V.; Nairn, J.R. Increasing frequency, intensity and duration of observed global heatwaves and warm spells. Geophys. Res. Lett. 2012, 39, L20714. [Google Scholar] [CrossRef]
  6. Francis, J.A.; Vavrus, S.J. Evidence linking Arctic amplification to extreme weather in mid-latitudes. Geophys. Res. Lett. 2012, 39, L06801. [Google Scholar] [CrossRef]
  7. IPCC. Summary for Policymakers, Climate Change 2021: The Physical Science Basis. Contribution of Working Group I to the Sixth Assessment Report of the Intergovernmental Panel on Climate Change; Masson-Delmotte, V., Zhai, P., Pirani, A., Connors, S.L., Péan, C., Berger, S., Caud, N., Chen, Y., Goldfarb, L., Gomis, M.I., et al., Eds.; Cambridge University Press: Cambridge, UK; New York, NY, USA, 2021. [Google Scholar]
  8. Philip, S.Y.; Kew, S.F.; Van Oldenborgh, G.J.; Anslow, F.S.; Seneviratne, S.I.; Vautard, R.; Coumou, D.; Ebi, K.L.; Arrighi, J.; Singh, R. Rapid attribution analysis of the extraordinary heat wave on the Pacific coast of the US and Canada in June 2021. Earth Syst. Dyn. 2022, 13, 1689–1713. [Google Scholar] [CrossRef]
  9. Silberner, J. Heat wave causes hundreds of deaths and hospitalisations in Pacific north west. BMJ-Brit. Med. J. 2021, 374, N1696. [Google Scholar] [CrossRef]
  10. Henderson, S.B.; McLean, K.E.; Lee, M.J.; Kosatsky, T. Analysis of community deaths during the catastrophic 2021 heat dome: Early evidence to inform the public health response during subsequent events in greater Vancouver, Canada. Environ. Epidemiol. 2022, 6, e189. [Google Scholar] [CrossRef]
  11. Natural Resources Canada. Canadian National Fire Database (CNFDB). Available online: https://cwfis.cfs.nrcan.gc.ca/ha/nfdb (accessed on 10 January 2022).
  12. Still, C.; Sibley, A.; Depinte, D.; Busby, P.; Harrington, C.; Schulze, M.; Shaw, D.; Woodruff, D.; Rupp, D.; Daly, C. Causes of Widespread Foliar Damage from the June 2021 Pacific Northwest Heat Dome: More Heat than Drought. Tree Physiol. 2023, 43, 203–209. [Google Scholar] [CrossRef]
  13. Klein, T.; Torres-Ruiz, J.M.; Albers, J.J. Conifer desiccation in the 2021 NW heatwave confirms the role of hydraulic damage. Tree Physiol. 2022, 42, 722–726. [Google Scholar] [CrossRef] [PubMed]
  14. Geddes, J.A.; Murphy, J.G.; Schurman, J.; Petroff, A.; Thomas, S.C. Net ecosystem exchange of an uneven-aged managed forest in central Ontario, and the impact of a spring heat wave event. Agric. For. Meteorol. 2014, 198, 105–115. [Google Scholar] [CrossRef]
  15. Filewod, B.; Thomas, S.C. Impacts of a spring heat wave on canopy processes in a northern hardwood forest. Glob. Chang. Biol. 2014, 20, 360–371. [Google Scholar] [CrossRef] [PubMed]
  16. Stangler, D.F.; Hamann, A.; Kahle, H.P.; Spiecker, H. A heat wave during leaf expansion severely reduces productivity and modifies seasonal growth patterns in a northern hardwood forest. Tree Physiol. 2017, 37, 47–59. [Google Scholar] [CrossRef] [PubMed]
  17. Rebetez, M.; Mayer, H.; Dupont, O.; Schindler, D.; Gartner, K.; Kropp, J.P.; Menzel, A. Heat and drought 2003 in Europe: A climate synthesis. Ann. For. Sci. 2006, 63, 569–577. [Google Scholar] [CrossRef]
  18. Buras, A.; Rammig, A.; Zang, C.S. Quantifying impacts of the 2018 drought on European ecosystems in comparison to 2003. Biogeosciences 2020, 17, 1655–1672. [Google Scholar] [CrossRef]
  19. Ciais, P.; Reichstein, M.; Viovy, N.; Granier, A.; Ogee, J.; Allard, V.; Aubinet, M.; Buchmann, N.; Bernhofer, C.; Carrara, A.; et al. Europe-wide reduction in primary productivity caused by the heat and drought in 2003. Nature 2005, 437, 529–533. [Google Scholar] [CrossRef]
  20. Pichler, P.; Oberhuber, W. Radial growth response of coniferous forest trees in an inner Alpine environment to heat-wave in 2003. Forest Ecol. Manag. 2007, 242, 688–699. [Google Scholar] [CrossRef]
  21. Muthers, S.; Laschewski, G.; Matzarakis, A. The Summers 2003 and 2015 in South-West Germany: Heat Waves and Heat-Related Mortality in the Context of Climate Change. Atmosphere 2017, 8, 224. [Google Scholar] [CrossRef]
  22. Rouault, G.; Candau, J.N.; Lieutier, F.; Nageleisen, L.M.; Martin, J.C.; Warzee, N. Effects of drought and heat on forest insect populations in relation to the 2003 drought in Western Europe. Ann. For. Sci. 2006, 63, 613–624. [Google Scholar] [CrossRef]
  23. Teskey, R.; Wertin, T.; Bauweraerts, I.; Ameye, M.; McGuire, M.A.; Steppe, K. Responses of tree species to heat waves and extreme heat events. Plant Cell Environ. 2015, 38, 1699–1712. [Google Scholar] [CrossRef] [PubMed]
  24. Lancaster, L.T.; Humphreys, A.M. Global variation in the thermal tolerances of plants. Proc. Natl. Acad. Sci. USA 2020, 117, 13580–13587. [Google Scholar] [CrossRef] [PubMed]
  25. Drake, J.E.; Tjoelker, M.G.; Varhammar, A.; Medlyn, B.E.; Reich, P.B.; Leigh, A.; Pfautsch, S.; Blackman, C.J.; Lopez, R.; Aspinwall, M.J.; et al. Trees tolerate an extreme heatwave via sustained transpirational cooling and increased leaf thermal tolerance. Global Chang. Biol. 2018, 24, 2390–2402. [Google Scholar] [CrossRef] [PubMed]
  26. Wahid, A.; Gelani, S.; Ashraf, M.; Foolad, M.R. Heat tolerance in plants: An overview. Environ. Exp. Bot. 2007, 61, 199–223. [Google Scholar] [CrossRef]
  27. Frank, D.; Reichstein, M.; Bahn, M.; Thonicke, K.; Frank, D.; Mahecha, M.D.; Smith, P.; Van der Velde, M.; Vicca, S.; Babst, F.; et al. Effects of climate extremes on the terrestrial carbon cycle: Concepts, processes and potential future impacts. Glob. Chang. Biol. 2015, 21, 2861–2880. [Google Scholar] [CrossRef]
  28. Allen, C.D.; Breshears, D.D.; McDowell, N.G. On underestimation of global vulnerability to tree mortality and forest die-off from hotter drought in the Anthropocene. Ecosphere 2015, 6, 129. [Google Scholar] [CrossRef]
  29. Pollastrini, M.; Puletti, N.; Selvi, F.; Iacopetti, G.; Bussotti, F. Widespread crown defoliation after a drought and heat wave in the forests of Tuscany (central Italy) and their recovery—A case study from summer 2017. Front. For. Glob. Chang. 2019, 2, 74. [Google Scholar] [CrossRef]
  30. Vicca, S.; Balzarolo, M.; Filella, I.; Granier, A.; Herbst, M.; Knohl, A.; Longdoz, B.; Mund, M.; Nagy, Z.; Pintér, K. Remotely-sensed detection of effects of extreme droughts on gross primary production. Sci. Rep. 2016, 6, 28269. [Google Scholar] [CrossRef]
  31. Seddon, A.W.R.; Macias-Fauria, M.; Long, P.R.; Benz, D.; Willis, K.J. Sensitivity of global terrestrial ecosystems to climate variability. Nature 2016, 531, 229–232. [Google Scholar] [CrossRef]
  32. Anderson, L.O.; Malhi, Y.; Aragao, L.E.O.C.; Ladle, R.; Arai, E.; Barbier, N.; Phillips, O. Remote sensing detection of droughts in Amazonian forest canopies. New Phytol. 2010, 187, 733–750. [Google Scholar] [CrossRef]
  33. Hoyer, S.; Hamman, J. xarray: ND labeled arrays and datasets in Python. J. Open Res. Softw. 2017, 5, 10. [Google Scholar] [CrossRef]
  34. Wang, T.L.; Hamann, A.; Spittlehouse, D.; Carroll, C. Locally Downscaled and Spatially Customizable Climate Data for Historical and Future Periods for North America. PLoS ONE 2016, 11, e0156720. [Google Scholar] [CrossRef]
  35. Huete, A.; Didan, K.; Miura, T.; Rodriguez, E.P.; Gao, X.; Ferreira, L.G. Overview of the radiometric and biophysical performance of the MODIS vegetation indices. Remote Sens. Environ. 2002, 83, 195–213. [Google Scholar] [CrossRef]
  36. Didan, K.; Munoz, A.B.; Solano, R.; Huete, A. MODIS Vegetation Index User’s Guide (MOD13 Series); University of Arizona: Tucson, AZ, USA, 2015. [Google Scholar]
  37. Sulla-Menashe, D.; Friedl, M.A. User Guide to Collection 6 MODIS Land Cover (MCD12Q1 and MCD12C1) Product; USGS: Reston, VA, USA, 2018; pp. 1–18.
  38. Pojar, J.; Klinka, K.; Meidinger, D.V. Biogeoclimatic Ecosystem Classification in British-Columbia. For. Ecol. Manag. 1987, 22, 119–154. [Google Scholar] [CrossRef]
  39. Bailey, R.G. Delineation of Ecosystem Regions. Environ. Manag. 1983, 7, 365–373. [Google Scholar] [CrossRef]
  40. Schroeder, T.A.; Hamann, A.; Wang, T.L.; Coops, N.C. Occurrence and dominance of six Pacific Northwest conifer species. J. Veg. Sci. 2010, 21, 586–596. [Google Scholar] [CrossRef]
  41. Latifovic, R.; Pouliot, D.; Olthof, I. Circa 2010 Land Cover of Canada: Local Optimization Methodology and Product Development. Remote Sens. 2017, 9, 1098. [Google Scholar] [CrossRef]
  42. Nachtergaele, F.; Verelst, L.; Wiberg, D.; Batjes, N.; Dijkshoorn, J.; Fischer, G.; Jones, A.; Montanarella, L.; Petri, M.; Prieler, S. Harmonized World Soil Database Version 1.2. Available online: http://webarchive.iiasa.ac.at/Research/LUC/External-World-soil-database/HTML/HWSD_Data.html?sb=4 (accessed on 12 January 2023).
  43. Goslee, S.C.; Urban, D.L. The ecodist package for dissimilarity-based analysis of ecological data. J. Stat. Softw. 2007, 22, 1–19. [Google Scholar] [CrossRef]
  44. R Core Team. R: A Language and Environment for Statistical Computing; R Foundation for Statistical Computing: Vienna, Austria; Available online: https://www.R-project.org/ (accessed on 5 June 2022).
  45. Bigras, F.J. Selection of white spruce families in the context of climate change: Heat tolerance. Tree Physiol. 2000, 20, 1227–1234. [Google Scholar] [CrossRef] [PubMed]
  46. Rita, A.; Camarero, J.J.; Nole, A.; Borghetti, M.; Brunetti, M.; Pergola, N.; Serio, C.; Vicente-Serrano, S.M.; Tramutoli, V.; Ripullone, F. The impact of drought spells on forests depends on site conditions: The case of 2017 summer heat wave in southern Europe. Global Chang. Biol. 2020, 26, 851–863. [Google Scholar] [CrossRef]
  47. Government of BC. Great Bear Rainforest Legal Direction & Agreements. Government of British Columbia. Available online: https://www2.gov.bc.ca/gov/content/industry/crown-land-water/land-use-planning/regions/west-coast/great-bear-rainforest/great-bear-rainforest-legal-direction-agreements (accessed on 20 March 2023).
  48. Mercer, C.; Comeau, V.M.; Daniels, L.D.; Carrer, M. Contrasting impacts of climate warming on coastal old-growth tree species reveal an early warning of forest decline. Front. For. Glob. Chang. 2022, 4, 775301. [Google Scholar] [CrossRef]
  49. Shanley, C.S.; Pyare, S.; Goldstein, M.I.; Alaback, P.B.; Albert, D.M.; Beier, C.M.; Brinkman, T.J.; Edwards, R.T.; Hood, E.; MacKinnon, A.; et al. Climate change implications in the northern coastal temperate rainforest of North America. Clim. Chang. 2015, 130, 155–170. [Google Scholar] [CrossRef]
  50. Mahony, C.R.; Wang, T.; Hamann, A.; Cannon, A.J. A global climate model ensemble for downscaled monthly climate normals over North America. Int. J. Climatol. 2022, 42, 5871–5891. [Google Scholar] [CrossRef]
  51. Geange, S.R.; Arnold, P.A.; Catling, A.A.; Coast, O.; Cook, A.M.; Gowland, K.M.; Leigh, A.; Notarnicola, R.F.; Posch, B.C.; Venn, S.E.; et al. The thermal tolerance of photosynthetic tissues: A global systematic review and agenda for future research. New Phytol. 2021, 229, 2497–2513. [Google Scholar] [CrossRef]
  52. Liepe, K.J.; Hamann, A.; Smets, P.; Fitzpatrick, C.R.; Aitken, S.N. Adaptation of lodgepole pine and interior spruce to climate: Implications for reforestation in a warming world. Evol. Appl. 2016, 9, 409–419. [Google Scholar] [CrossRef]
  53. Schreiber, S.G.; Hamann, A.; Hacke, U.G.; Thomas, B.R. Sixteen years of winter stress: An assessment of cold hardiness, growth performance and survival of hybrid poplar clones at a boreal planting site. Plant Cell Environ. 2013, 36, 419–428. [Google Scholar] [CrossRef]
Figure 1. Western Canadian heat wave of June/July 2021, with deviations from climate normal conditions in excess of +25 °C, and record-setting absolute temperatures above 45 °C in British Columbia (BC), Alberta (AB), Washington (WA) and Oregon (OR). The maps represent daily anomalies for the year 2021, relative to 40 years of available gridded 5th generation ERA5 data (1951–1990).
Remotesensing 15 02162 g001
Figure 2. EVI anomalies for forested landcover in the 16-day time interval following the heat wave. Regions of similar vegetation response, subsequently used for numerical analysis, are highlighted with colored polygons, manually delineated based on regional response patterns for time series analysis of coastal and interior ecosystems (Figure 3).
Remotesensing 15 02162 g002
Figure 3. Regional response of vegetation greenness to climate conditions during the year 2021 (dotted lines) compared to historical averages for the 2001–2020 period (solid lines with the ribbon indicating the 25th to 75th quartiles of interannual variation). The 2021 heat wave is indicated with a gray bar. Vegetation greenness is represented by a 16-day enhanced vegetation index (EVI). Temperature time series are based on mean daily records, and precipitation is represented by a 15-day moving average. Regions in columns represent forested landcover as shown in Figure 2.
Remotesensing 15 02162 g003
Figure 4. Principal component analysis of ecosystem attributes, and indirect gradient analysis associating the EVI decline during the heat wave (red vector). Climate variables are represented by black vectors and other ecosystem attributes by gray vectors. For abbreviation of variables, see Table 2. Ecosystem averages are represented by points, and ellipses delineate the 80th percentile of grid cells corresponding to the four regions shown in Figure 2.
Remotesensing 15 02162 g004
Table 1. Three months average temperature and precipitation anomalies, representing longer-term climatic conditions leading up to the heat wave event.
Time Period:January–Febuary–MarchApril–May–June
TempPrecTempPrec
Southern BC+0.9 °C+7%+1.5 °C−11%
Northern BC+1.4 °C+42%+1.1 °C+5%
Alaska coast+1.2 °C+24%+1.2 °C+8%
Interior BC+2.0 °C+7%+1.2 °C+7%
Table 2. Correlations among EVI reduction (ΔEVI), following the 2021 heat wave, and variables that may putatively contribute to ecosystem vulnerabilities, as well as variable averages by region, corresponding to the principal component analysis in Figure 4.
Region: Correlation with ΔEVI Alaska
Coast
Northern
BC Coast
Southern
BC Coast
Interior
BC
Vegetation response
EVI deviation in 16 days following the heat wave (%) 18 −31 0 13
Ecosystem attributes
Elevation (m)ELEV −0.49 328 303 456 927
Field Capacity (cm3 cm−3)FIELDCAP −0.40 350 347 323 372
Thermal Capacity (m2 s−1)THERMCAP −0.33 81 95 99 115
Soil Wilting Point (cm3 cm−3)WILTPOINT −0.57 106 104 101 164
Proportion of Deciduous Trees PROP_DEC −0.29 7 9 9 17
Climate normal variables
Mean Annual Temperature (°C)MAT 0.40 3.5 5.3 6.8 2.0
Mean Warmest month Temperature (°C)MWMT −0.05 11.8 13.3 14.8 13.4
Mean Coldest month Temperature (°C)MCMT 0.51 −4.8 −2.3 −0.3 −10.9
Continentality (°C)TD −0.56 16.7 15.6 15.1 24.3
Mean Annual Precipitation (mm)MAP 0.53 3067 3196 2945 689
Mean Summer Precipitation (mm)MSP 0.36 1008 869 622 272
Annual heat-moisture index (°C/mm)AHM −0.55 5 5 7 19
Summer heat-moisture index (°C/mm)SHM −0.48 15 18 30 51
Disclaimer/Publisher’s Note: The statements, opinions and data contained in all publications are solely those of the individual author(s) and contributor(s) and not of MDPI and/or the editor(s). MDPI and/or the editor(s) disclaim responsibility for any injury to people or property resulting from any ideas, methods, instructions or products referred to in the content.

