
Seismic Sequence Analysis of the Arraiolos Zone, South Portugal, and Its Seismotectonic Implications: A Detailed Analysis of the Period 15 January–30 June 2018

Abstract
:1. Introduction
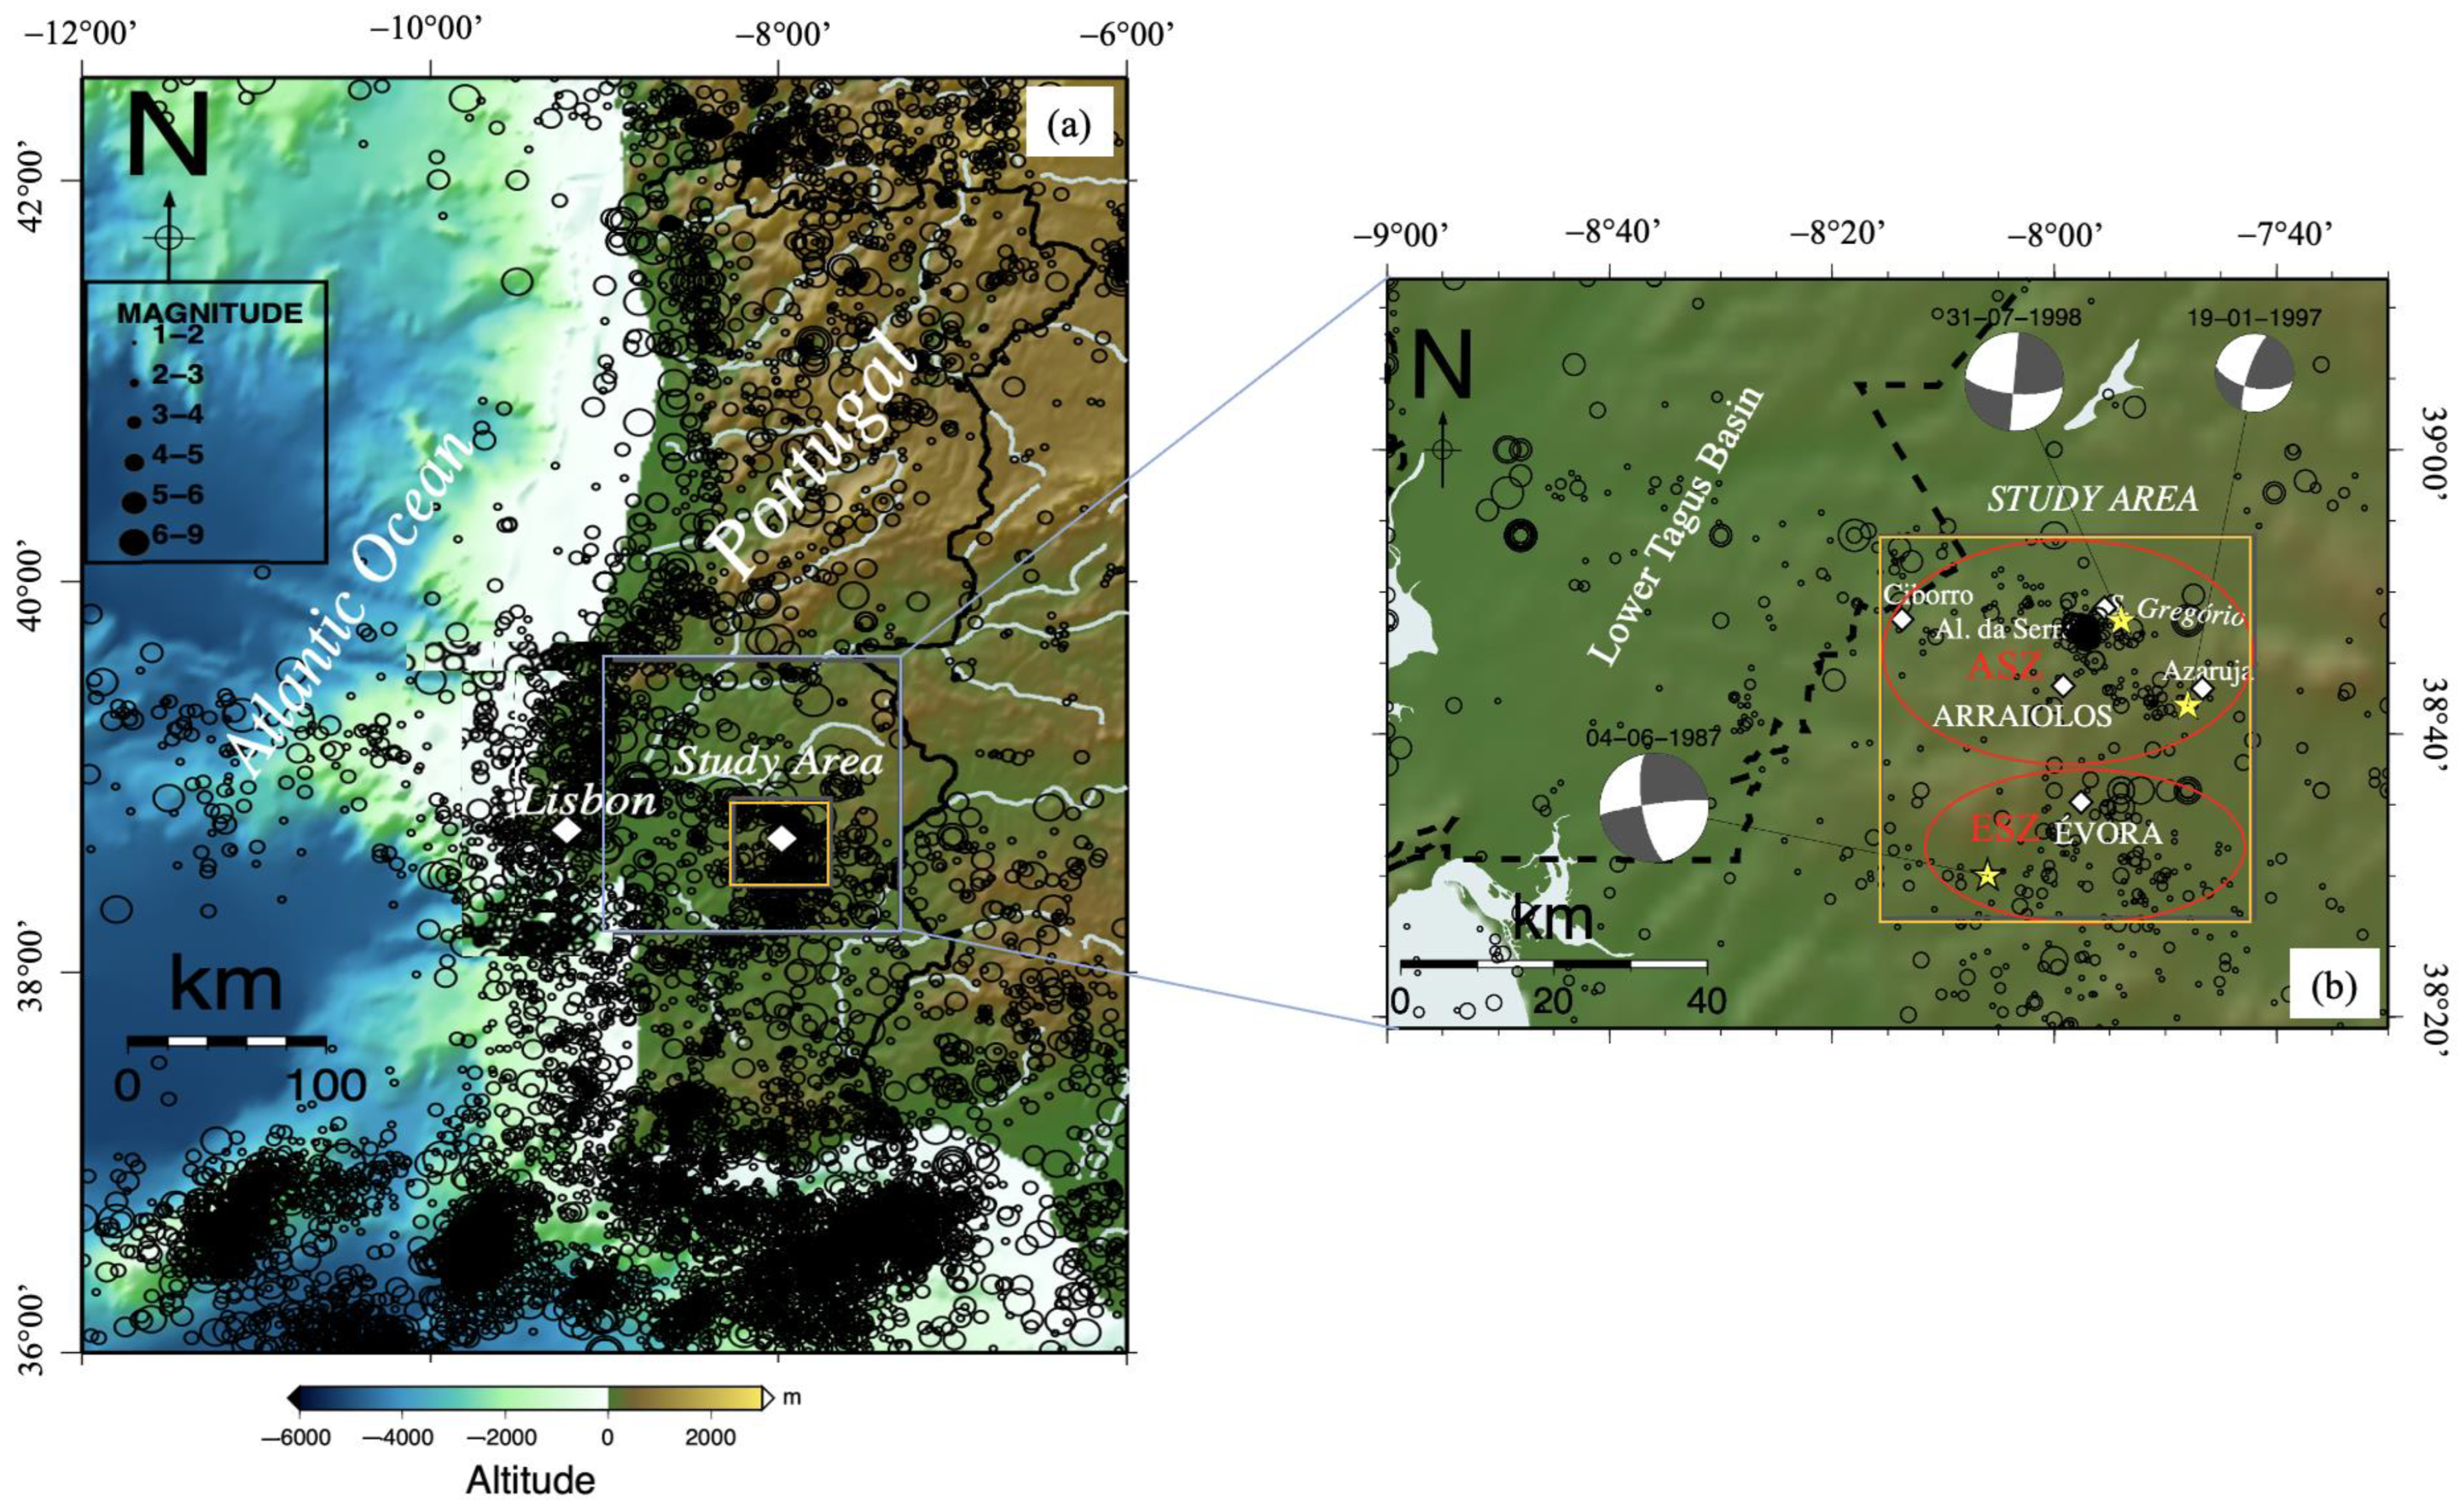
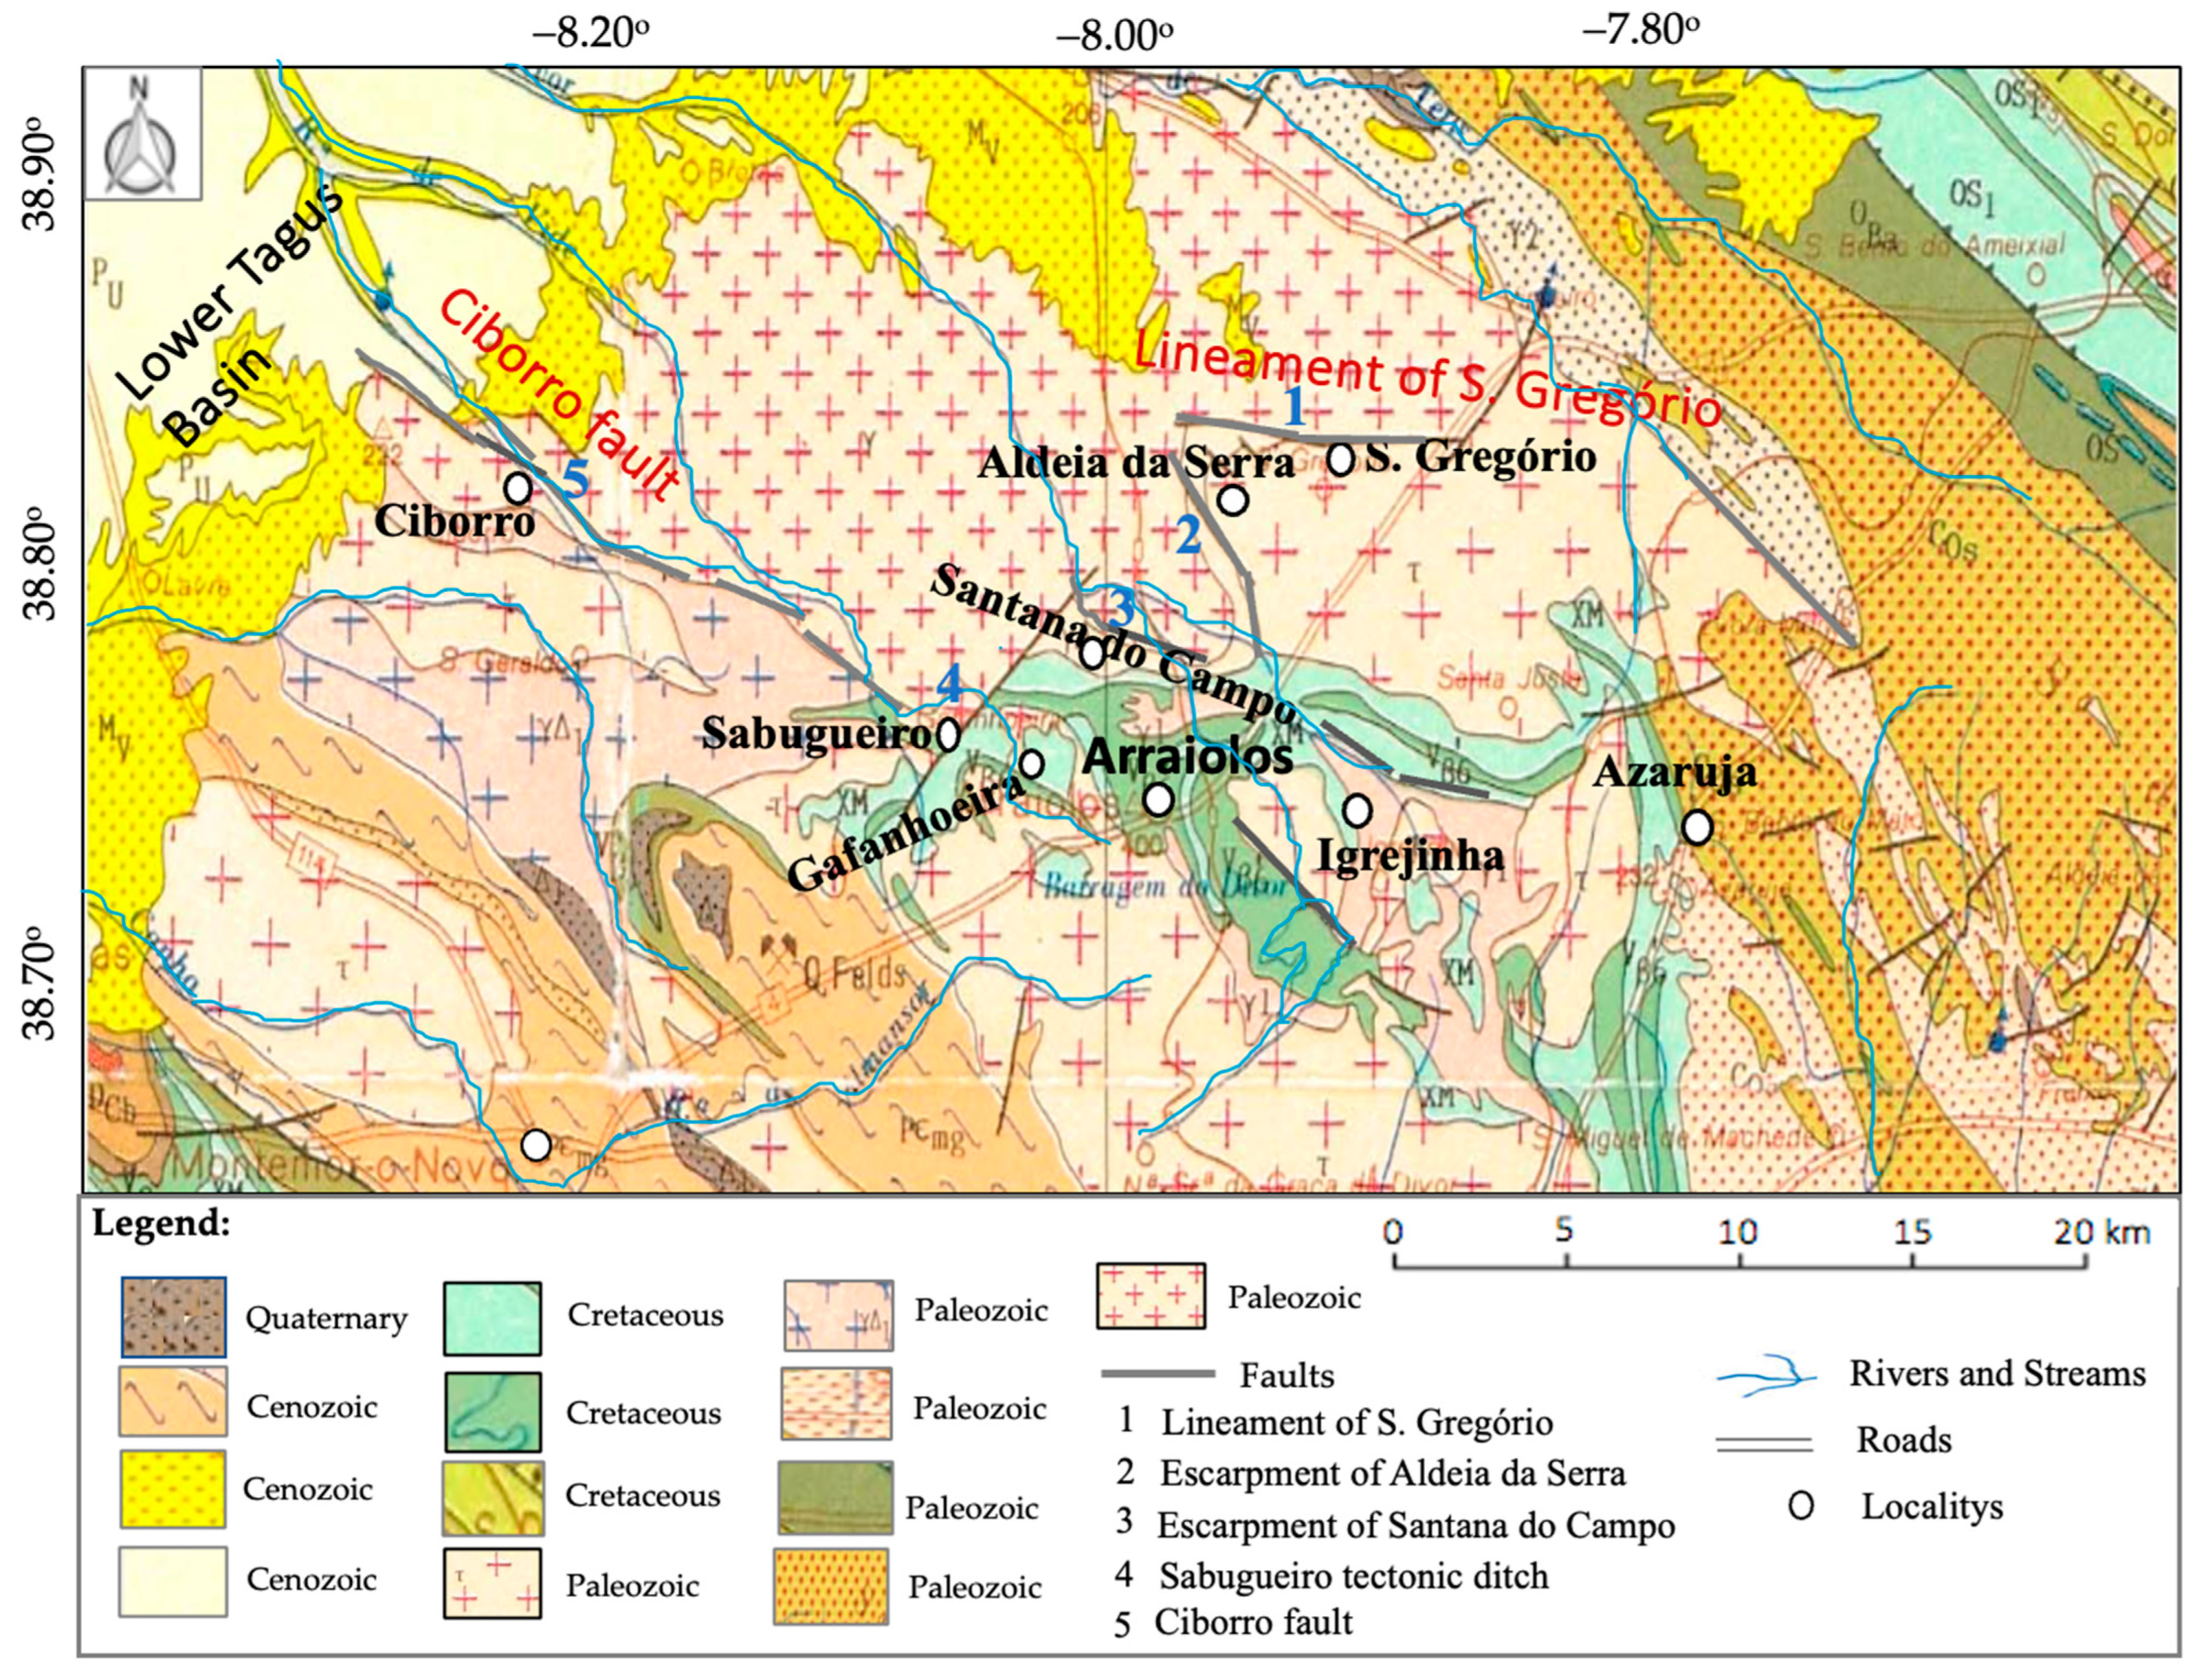
2. Geological and Seismotectonic Framework
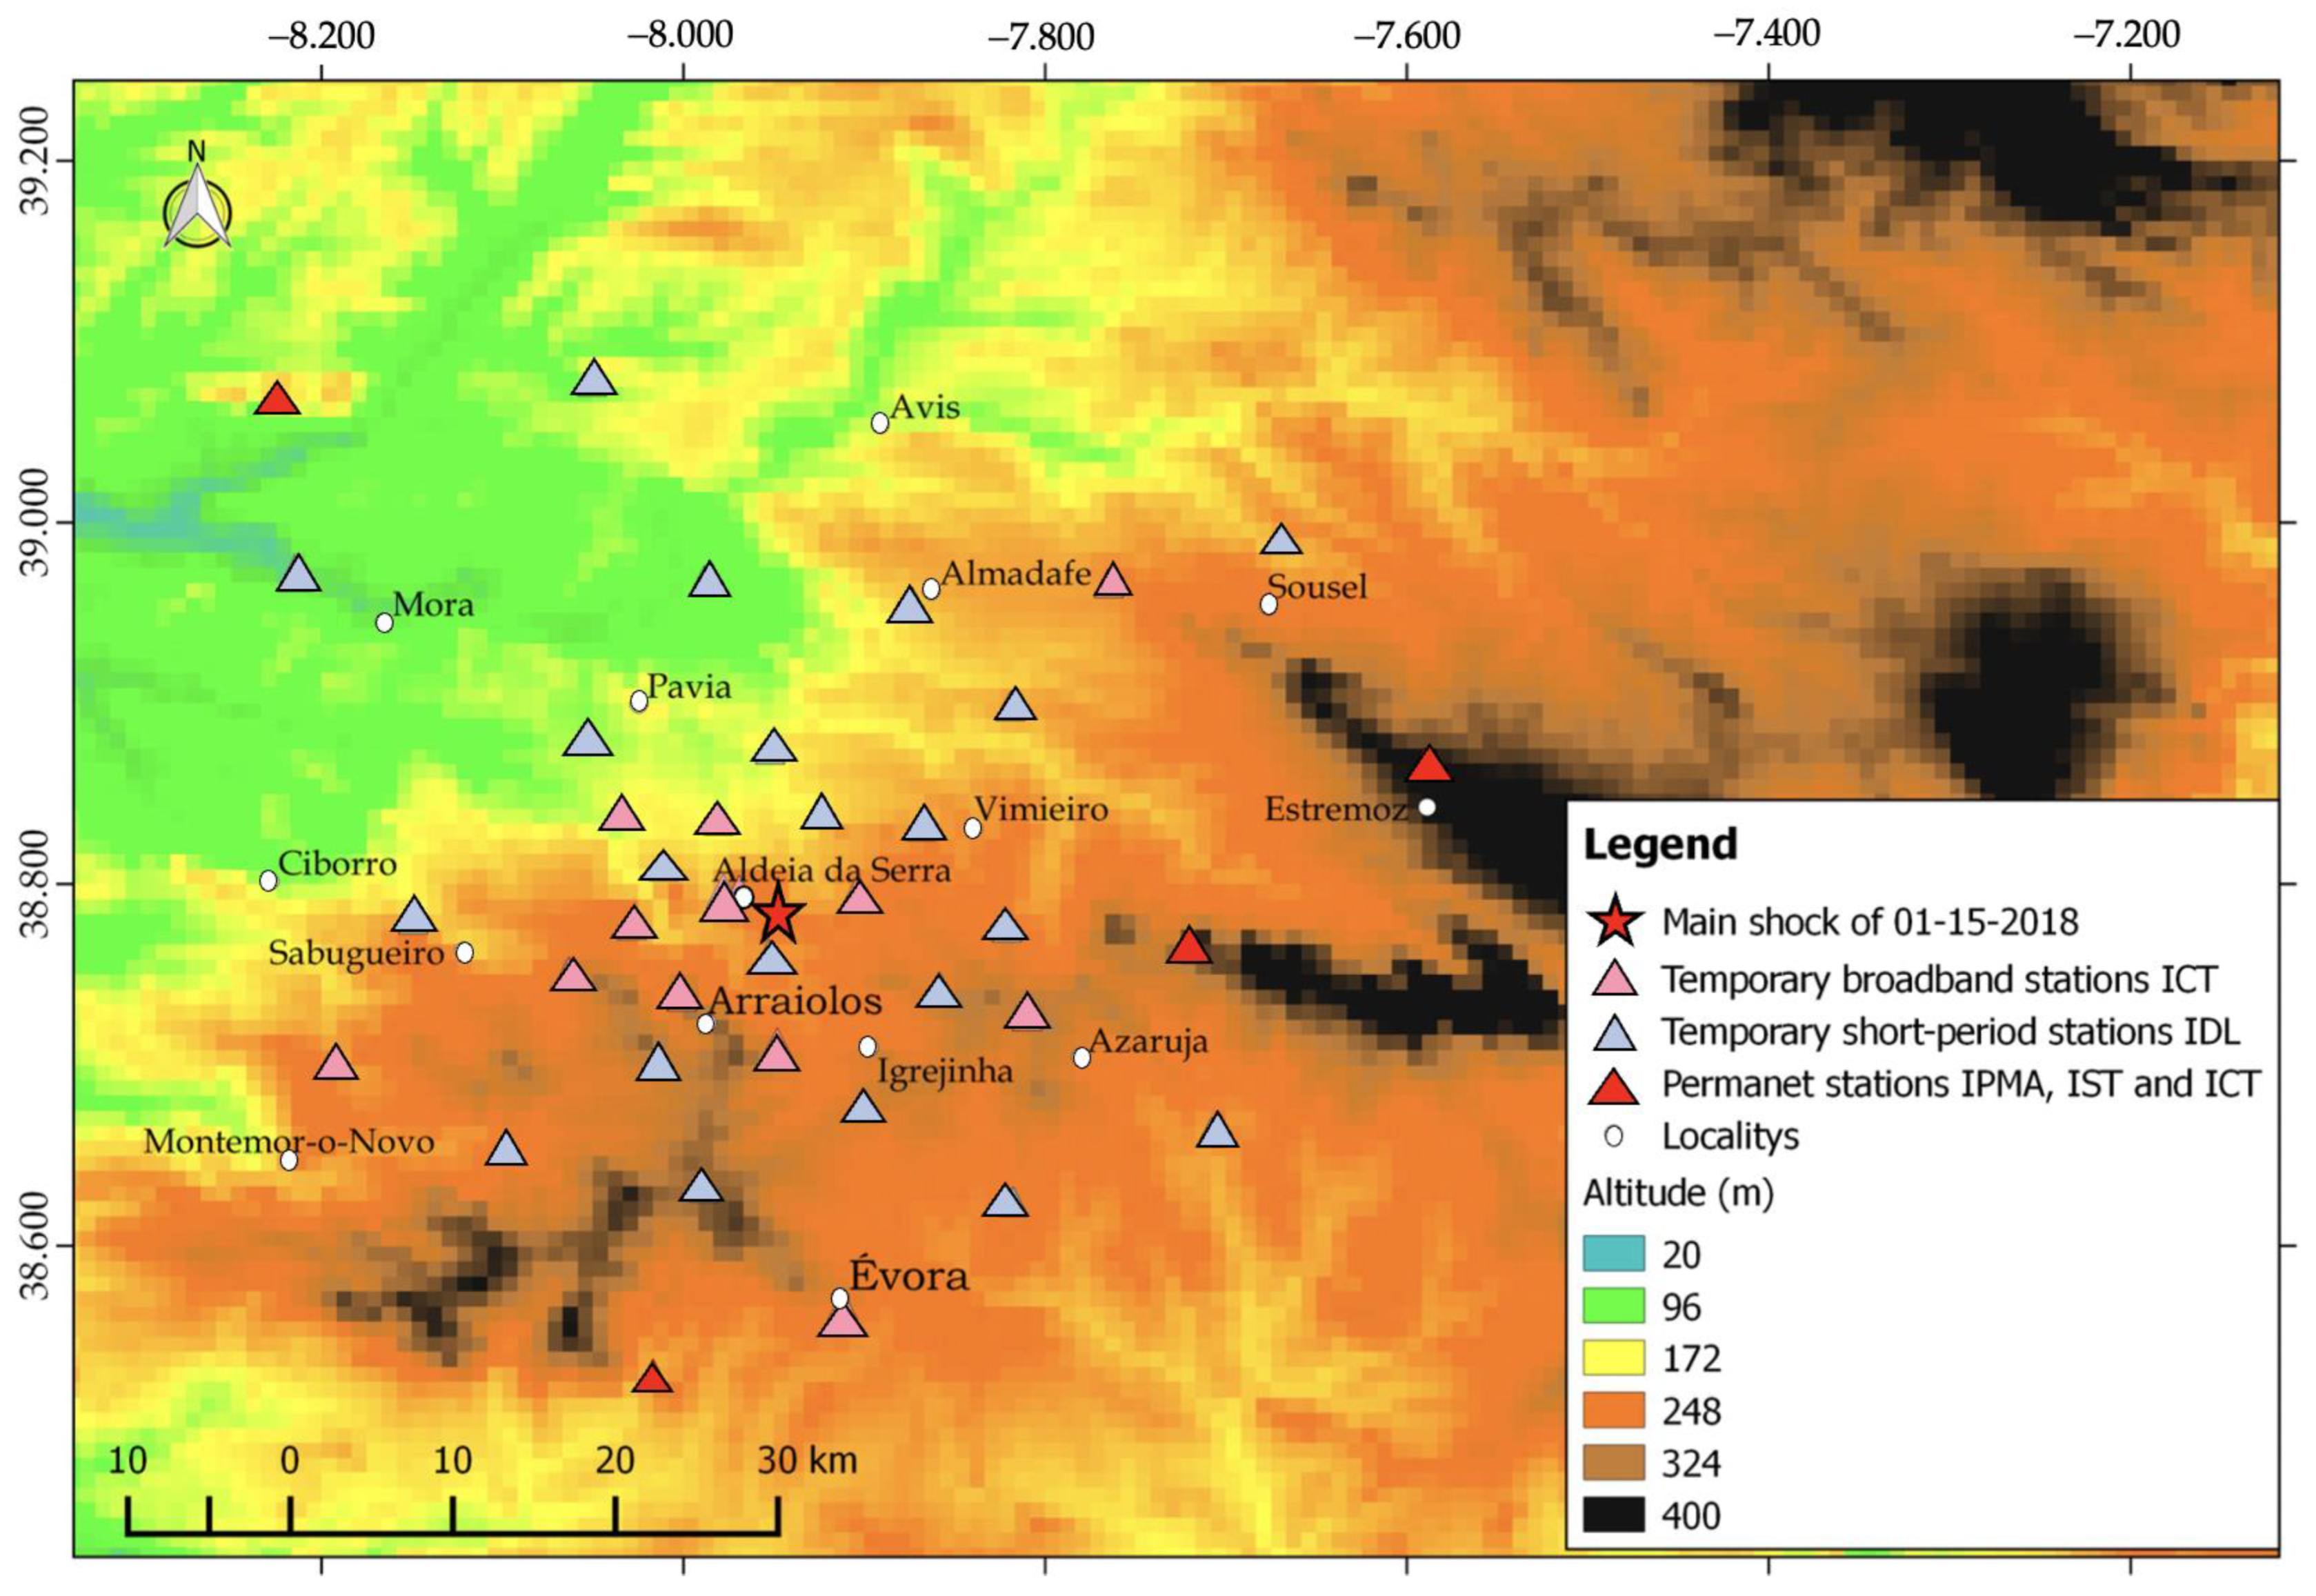
3. Temporary Seismic Network and Data
4. Spatial and Temporal Character of the 15 January 2018 Earthquake Sequence
4.1. Spatial-Temporal Distribution of Aftershocks
5. Focal Mechanism Determination
5.1. Method
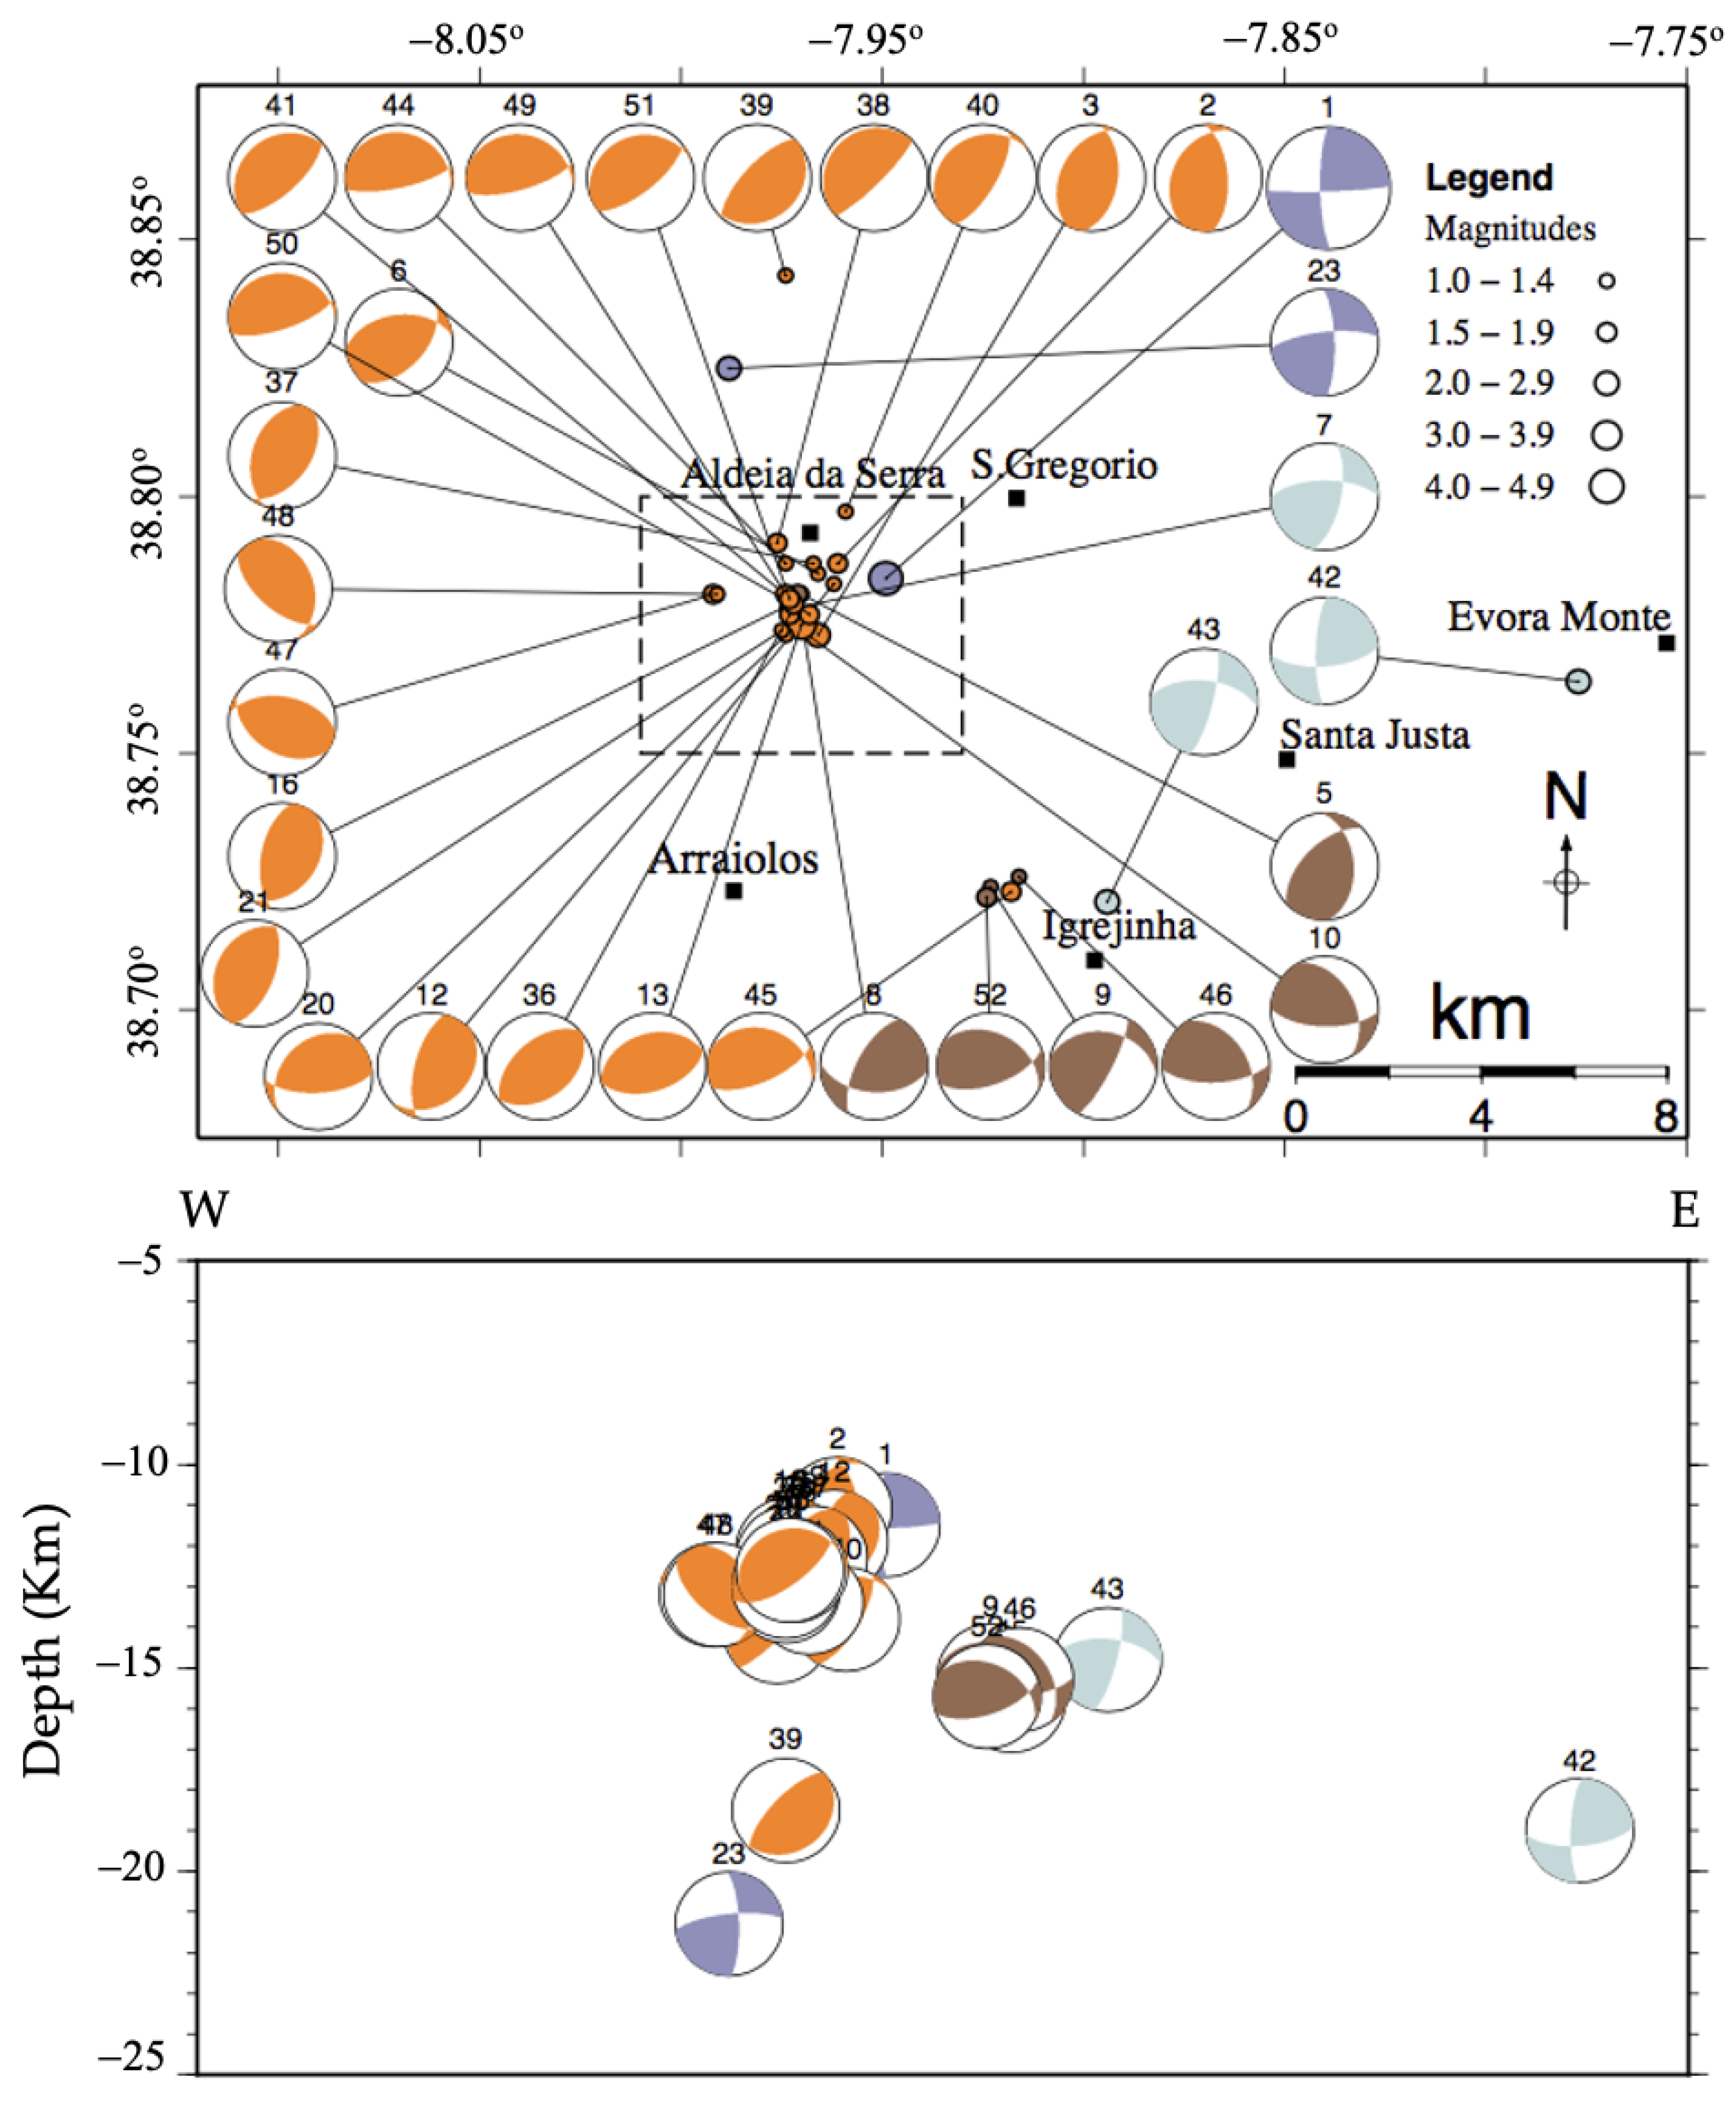
5.2. Results
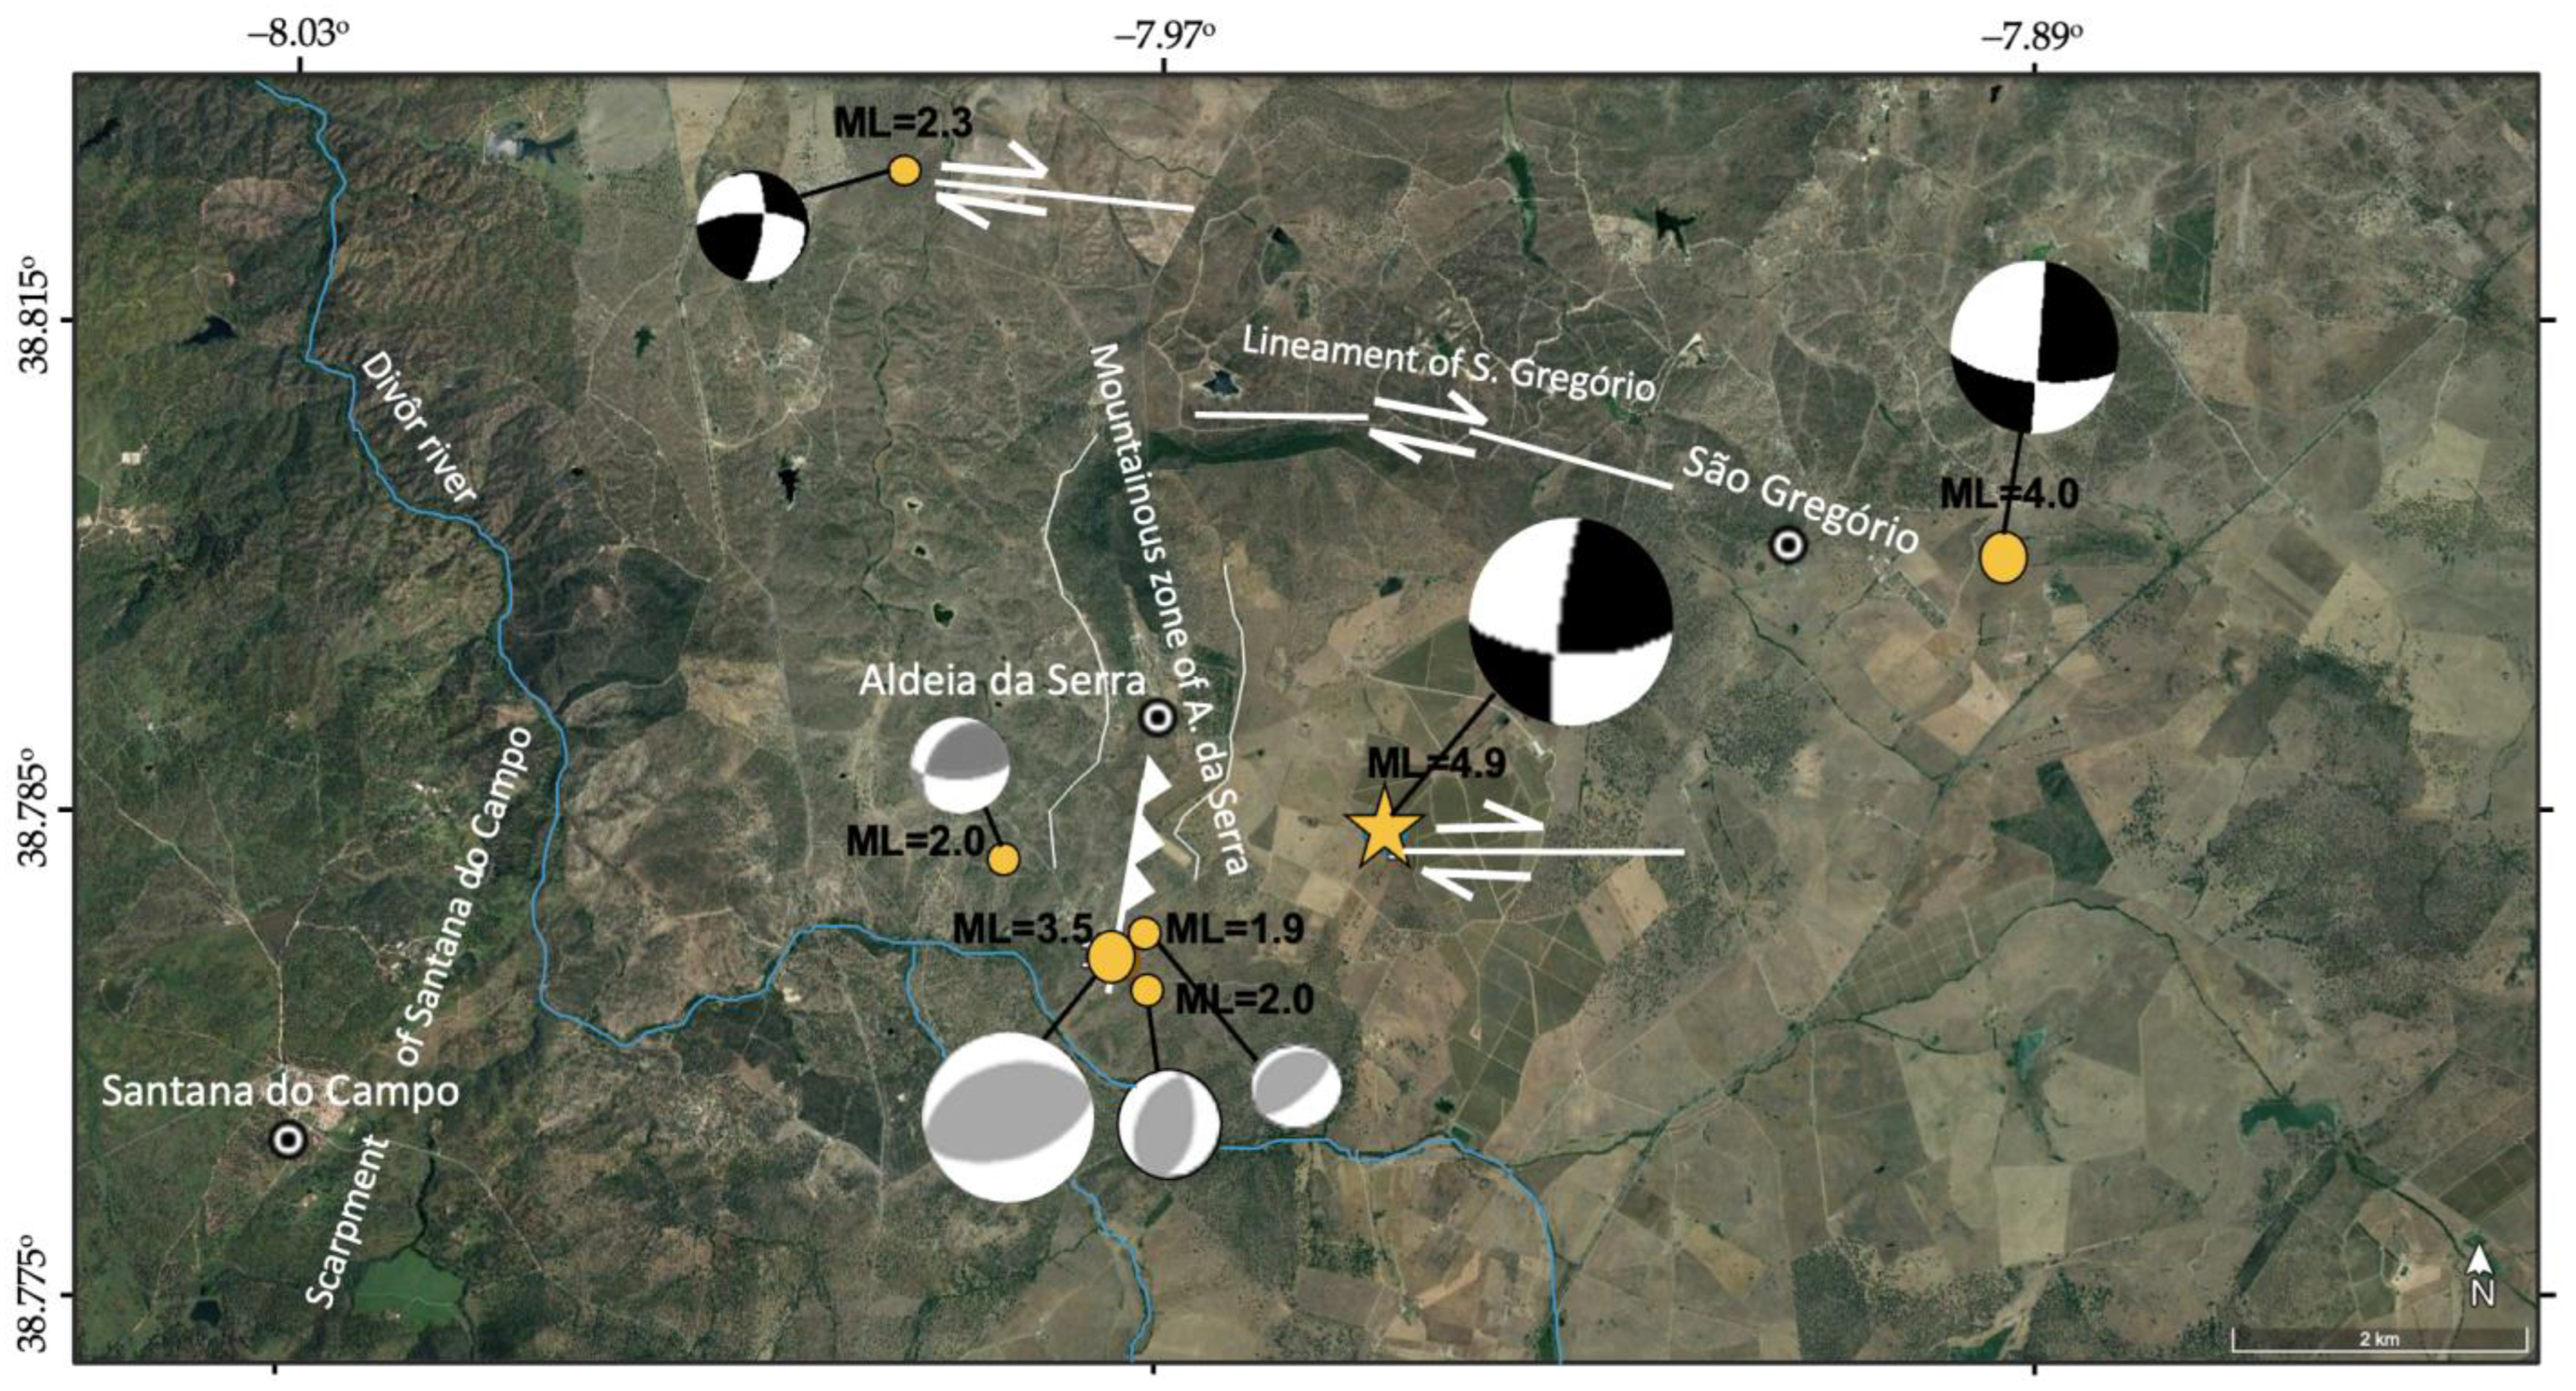
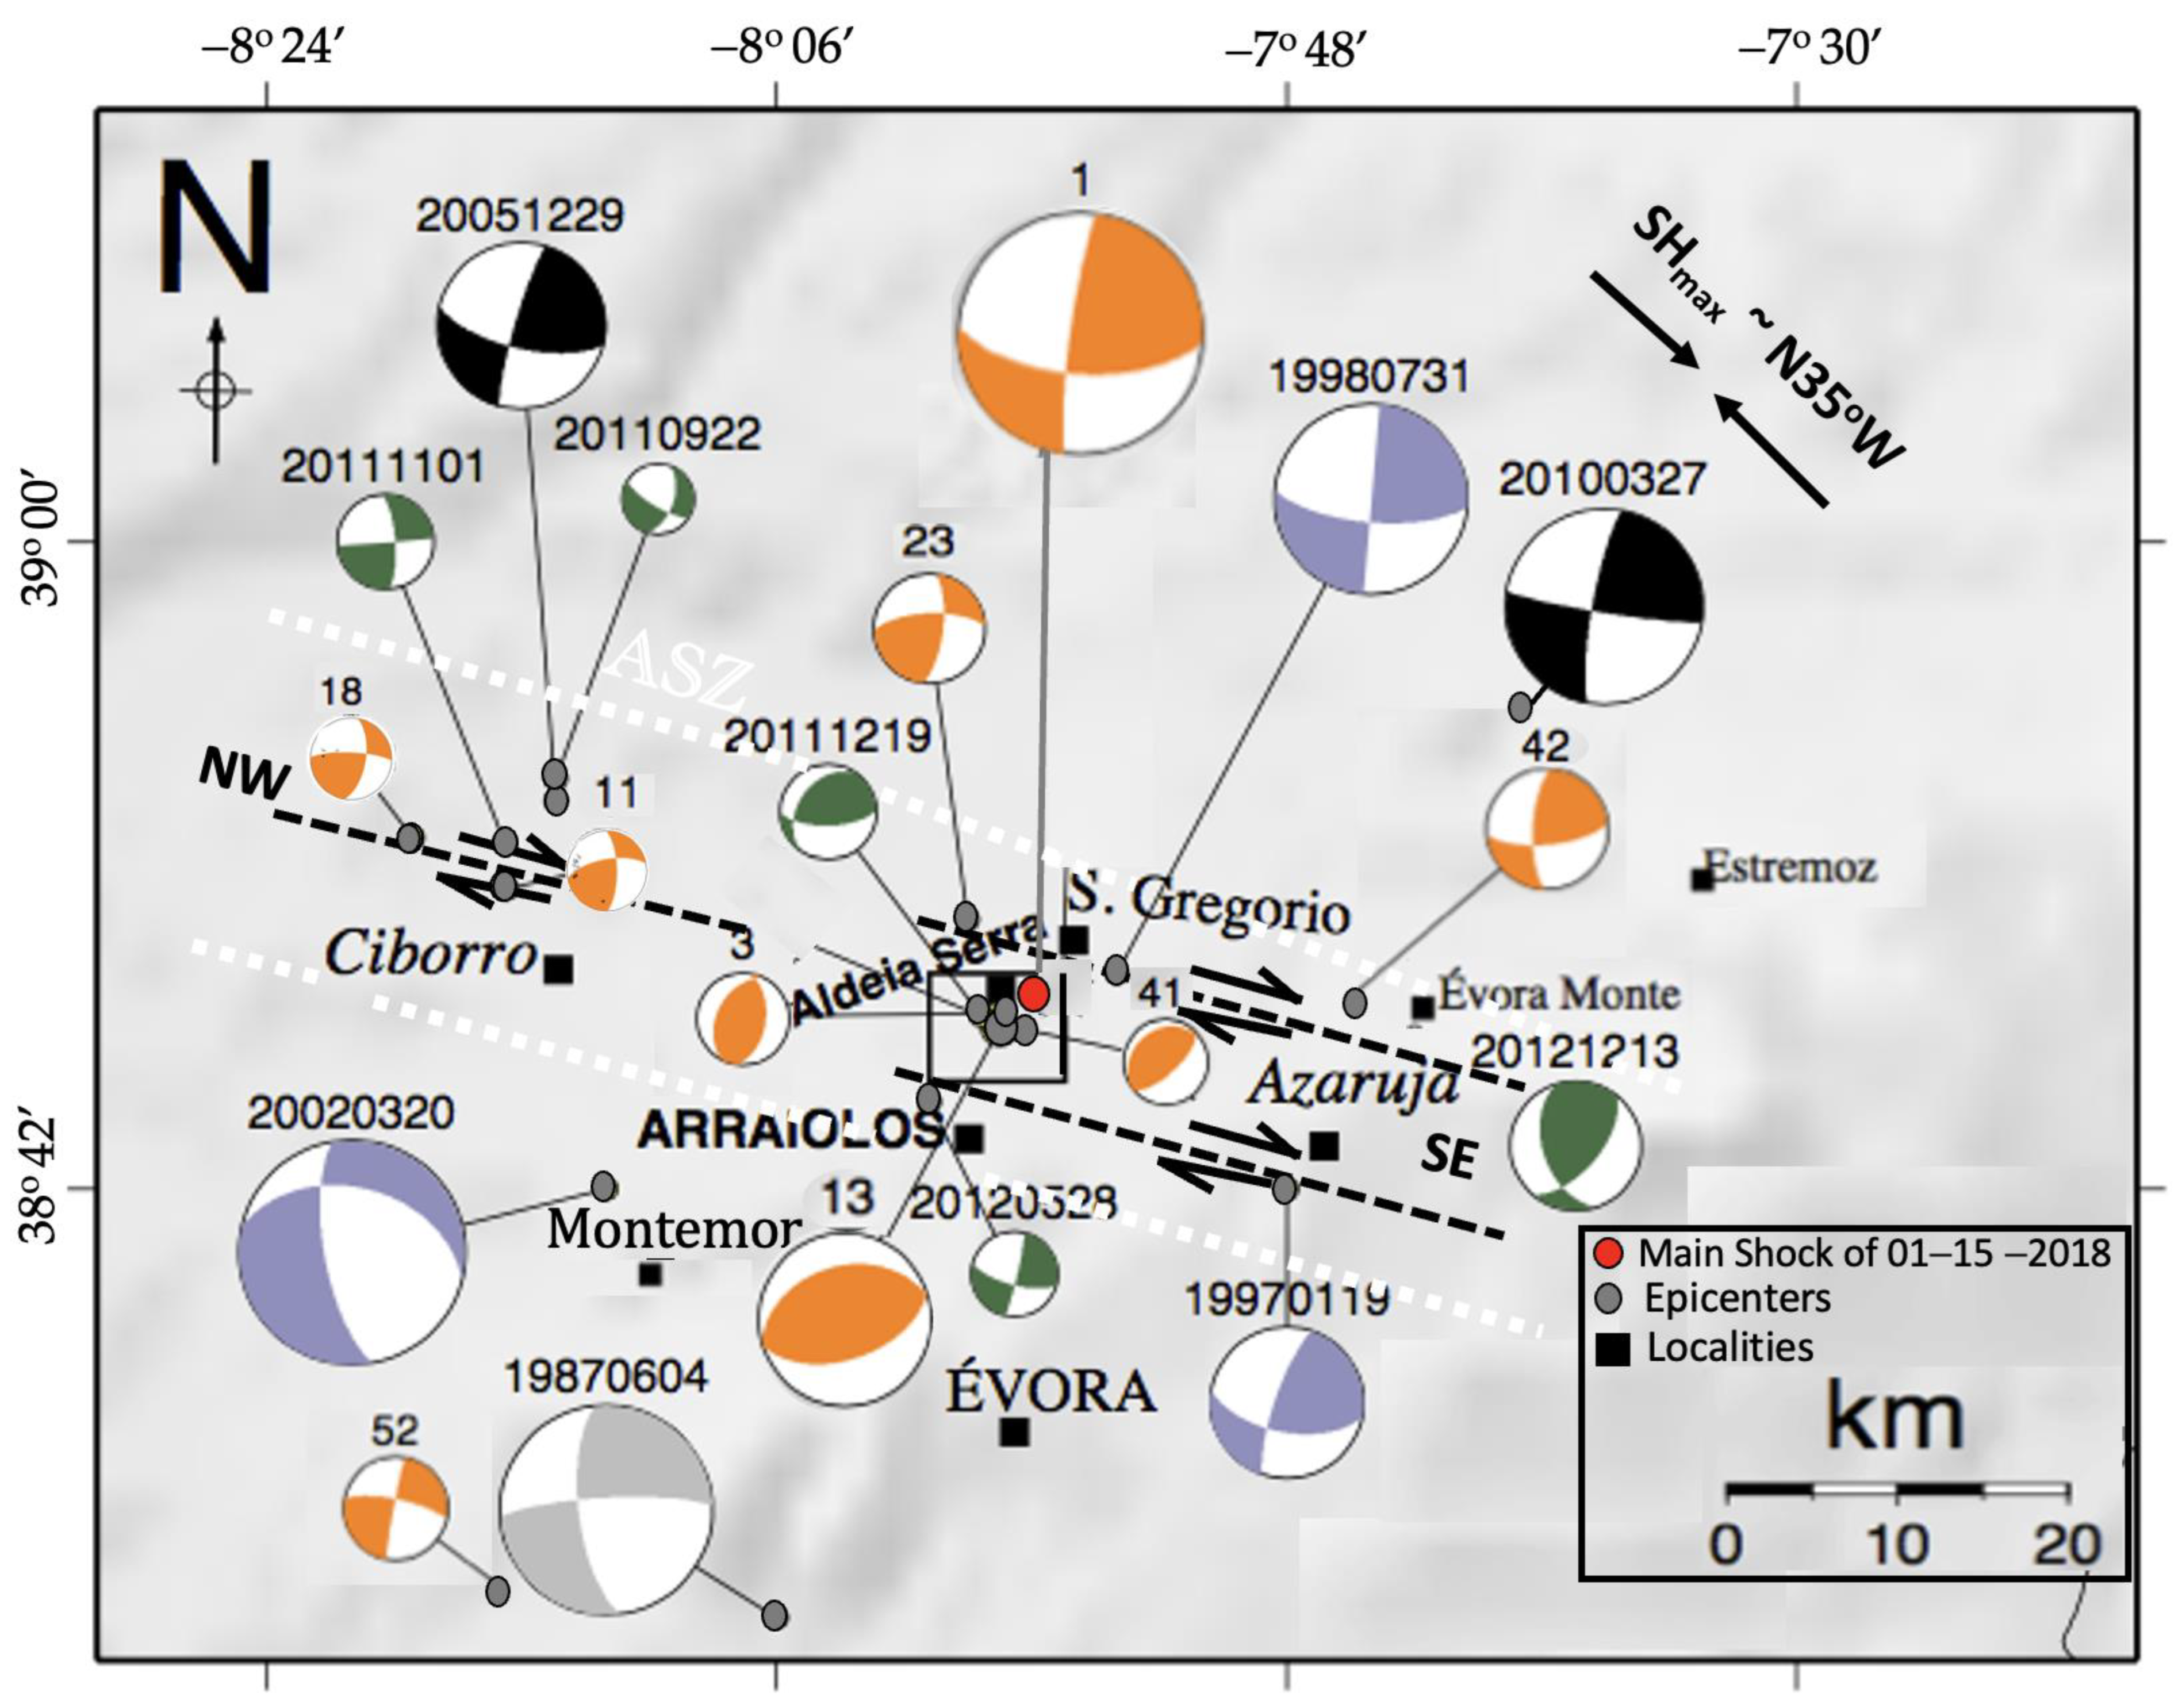
6. Seismotectonic Implications
7. Conclusions
Author Contributions
Funding
Data Availability Statement
Acknowledgments
Conflicts of Interest
Appendix A

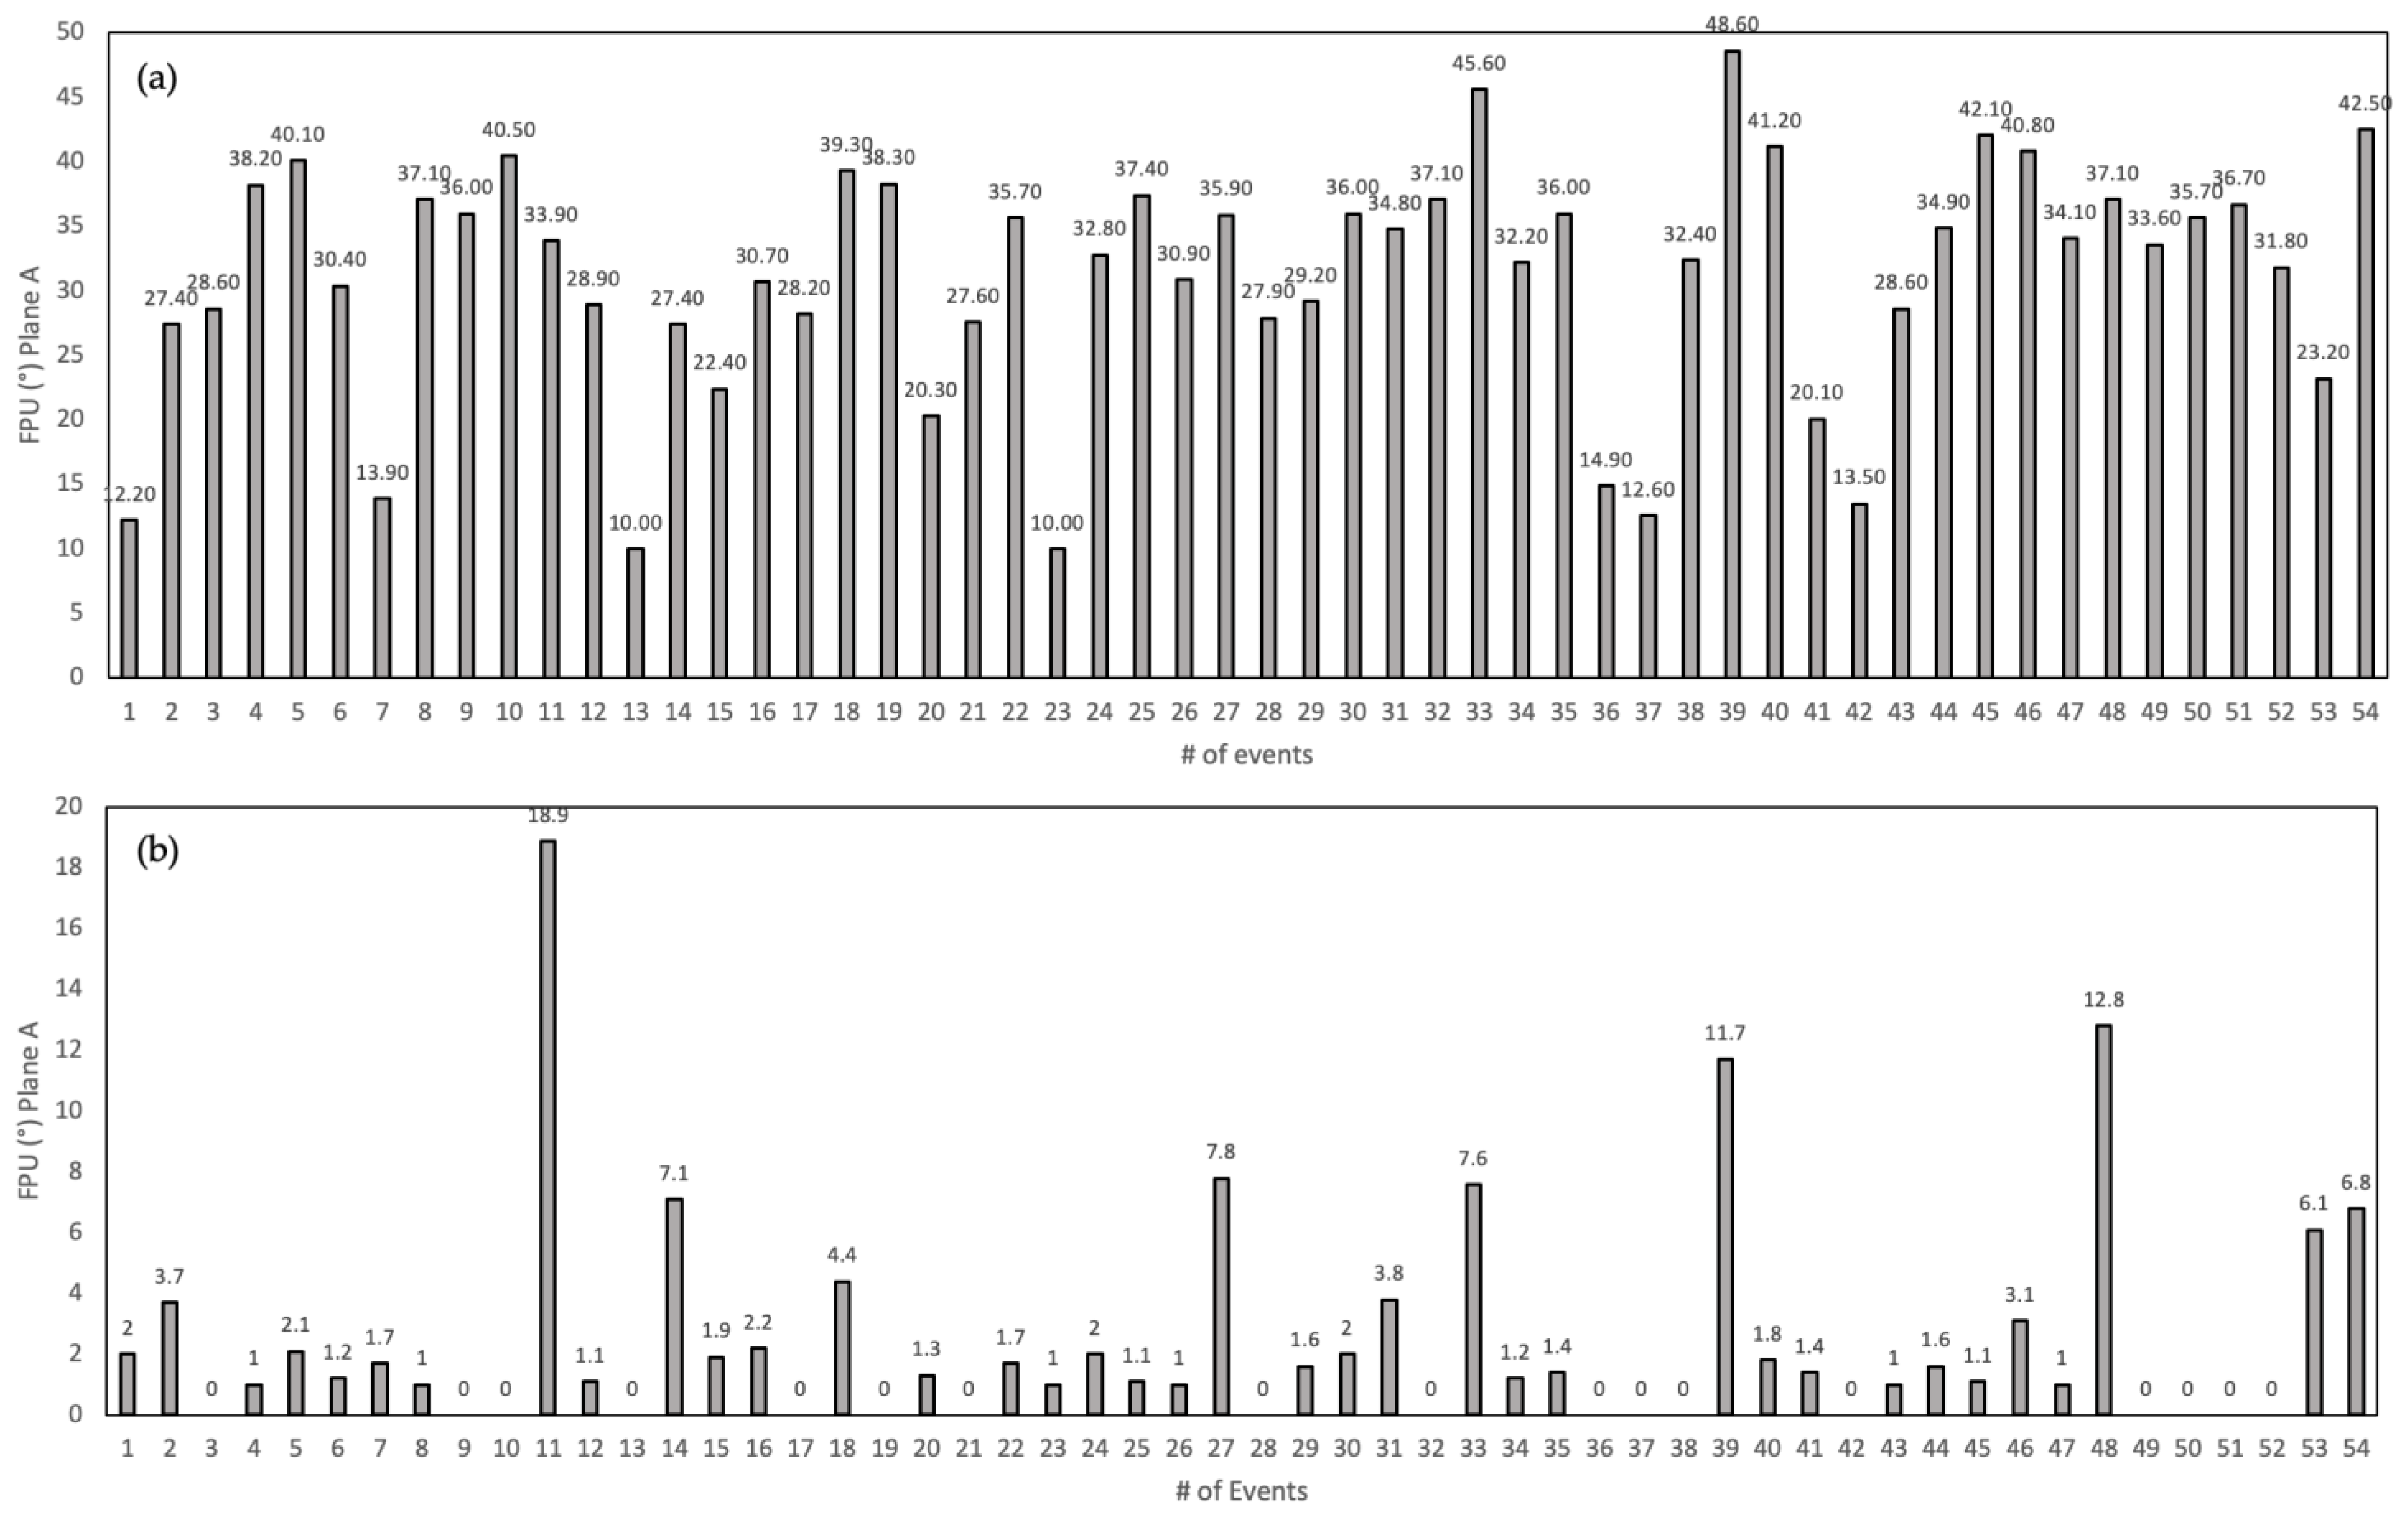
| N° | Date (yy/mm/dd) | Hour (hh:mm:ss) | Long. (°W) | Lat. (°N) | Depth (km) | Mag. (ML) | Strike (∅°) | Dip (δ°) | Rake (λ°) | FPU (°) | N pobs/pok | N SH/P | F (σ) | STDR | Er. SH/P | Qs | |
|---|---|---|---|---|---|---|---|---|---|---|---|---|---|---|---|---|---|
| Plane A | Plane B | ||||||||||||||||
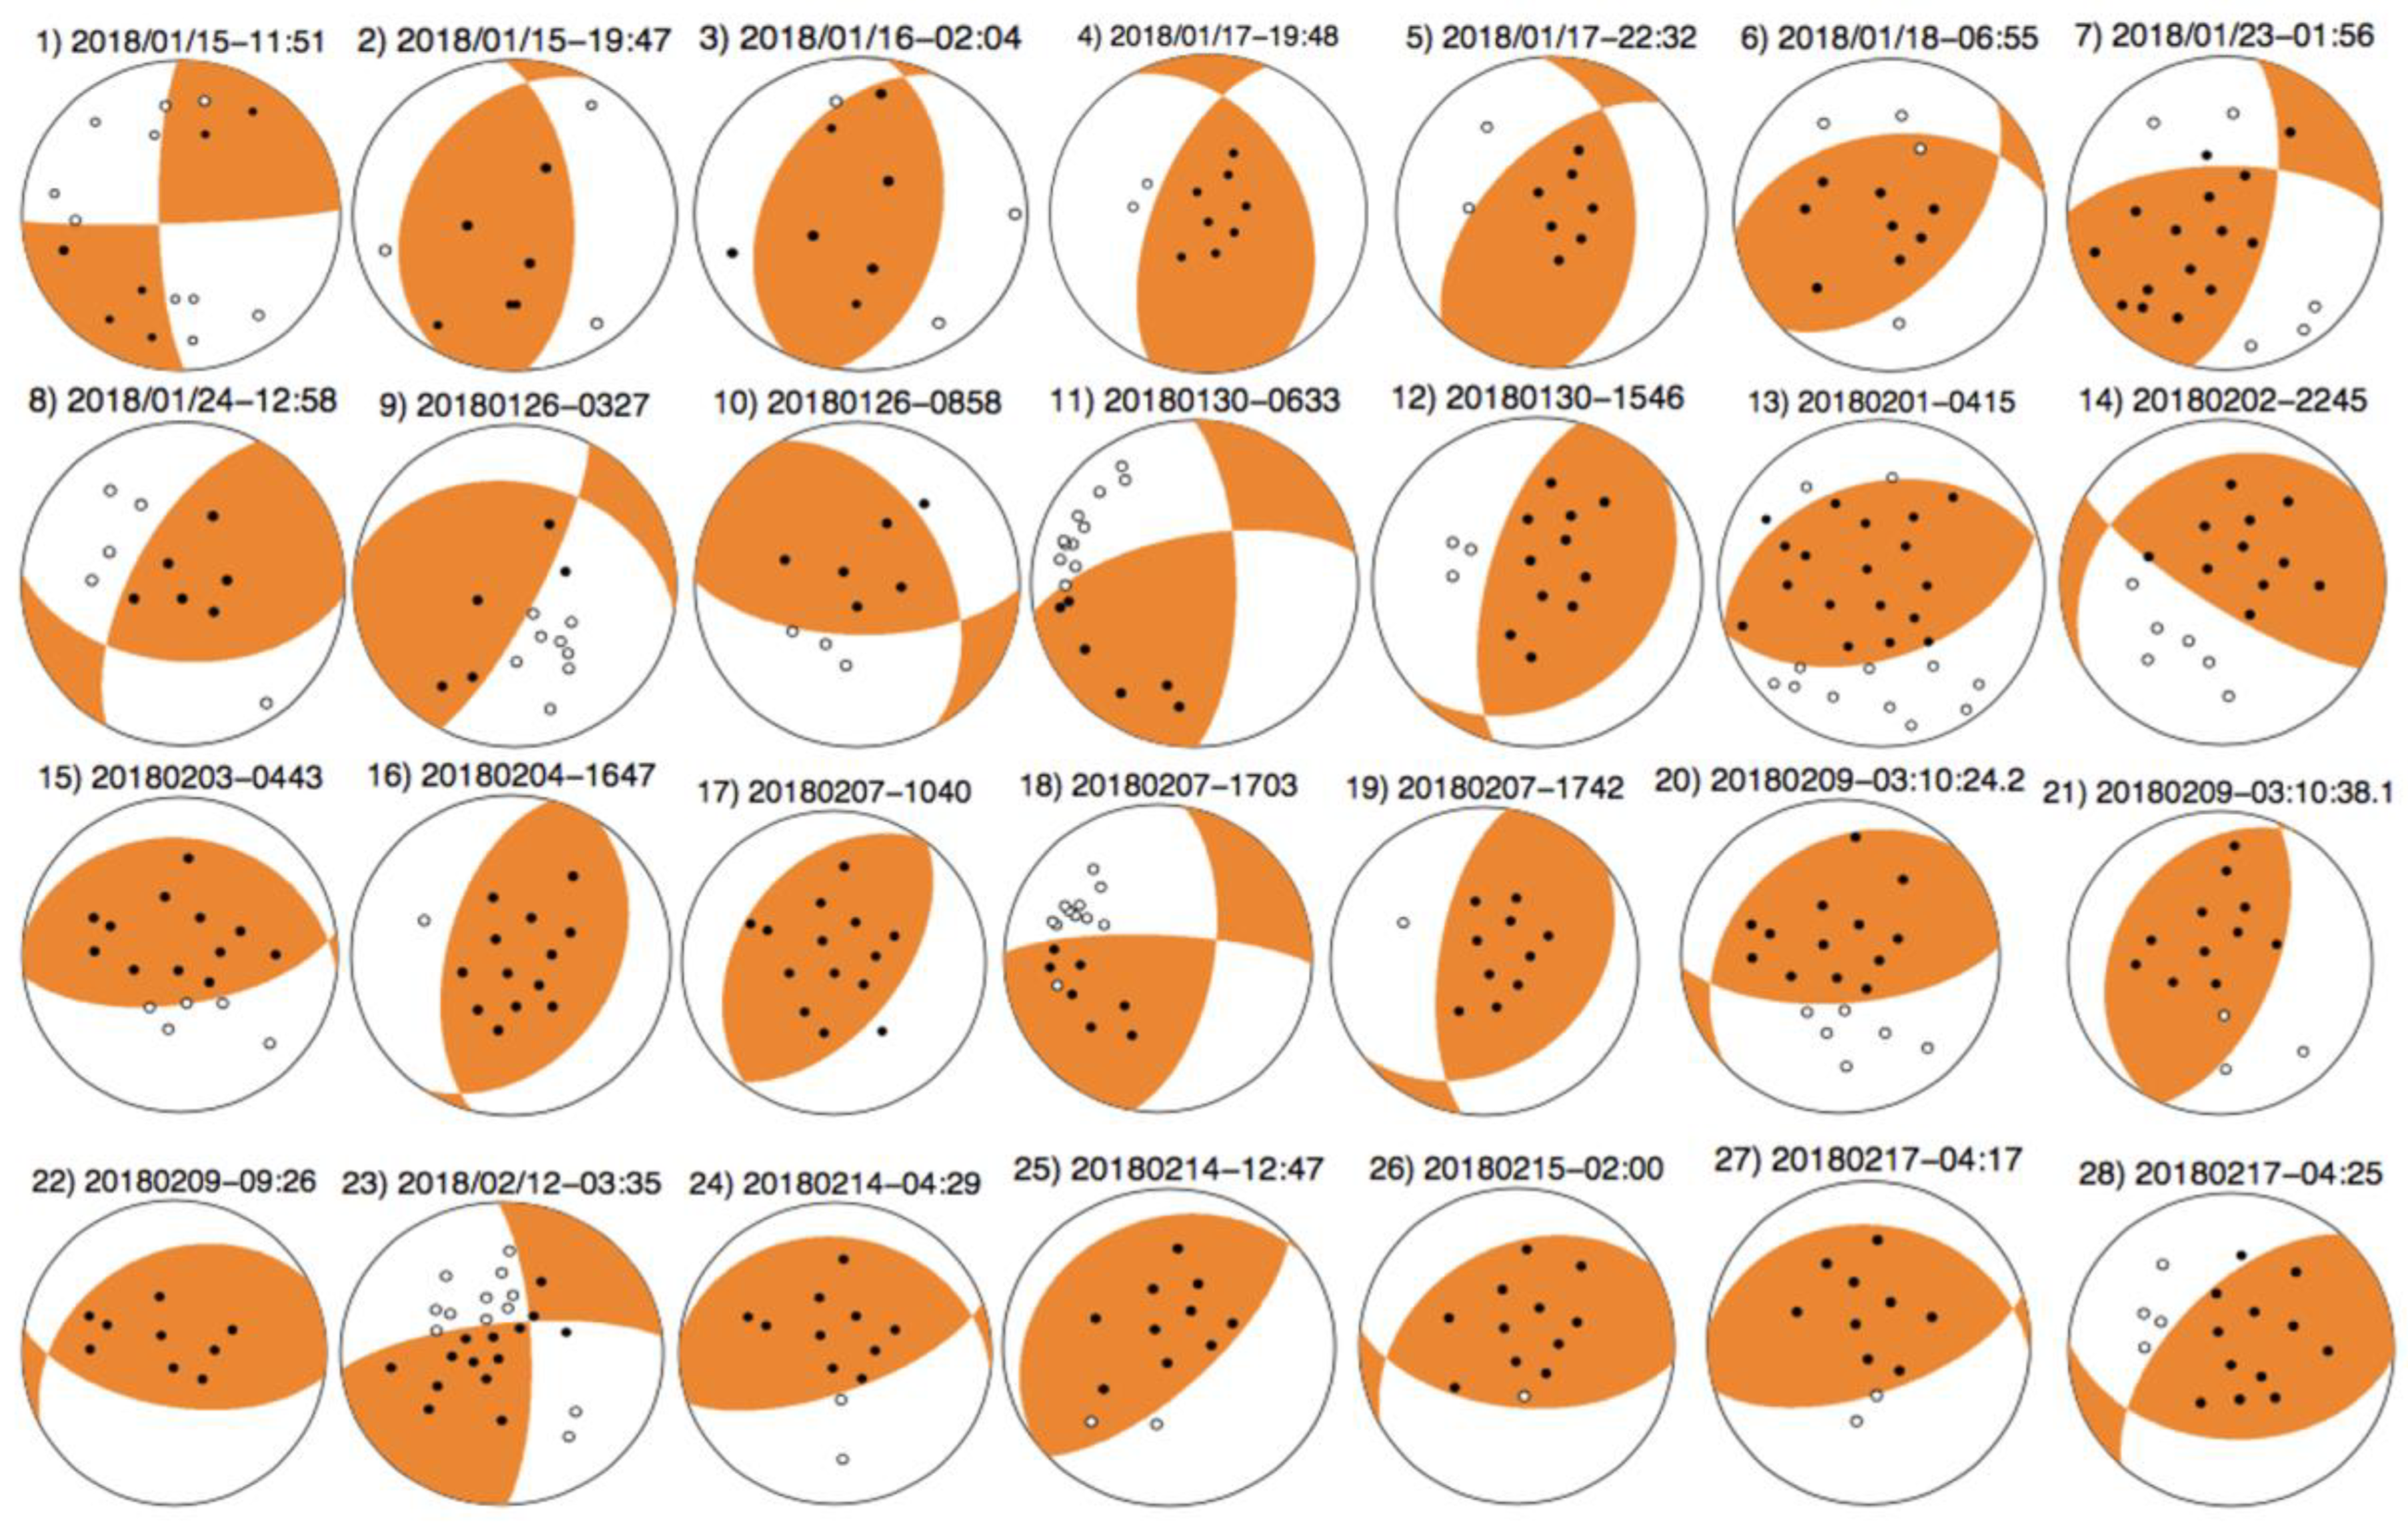
| 1 | 2018/01/15 | 11:51:40.0 | −7.949 | 38.783 | 11.8 | 4.9 | 88.0 | 85.8 | 168.5 | 2.0 | 2.7 | 16/15 | 3 | 0.07 | 0.70 | 0.34 | A |
| 2 | 2018/01/15 | 19:47:52.3 | −7.961 | 38.787 | 11.1 | 1.6 | 208.7 | 34.4 | 118.0 | 3.7 | 15.8 | 9/9 | 4 | 0.00 | 0.71 | 0.87 | A |
| 3 | 2018/01/16 | 02:04:59.2 | −7.966 | 38.773 | 12.0 | 2.0 | 207.0 | 42.0 | 104.0 | 0.0 | 7.5 | 10/9 | 7 | 0.06 | 0.68 | 0.90 | A |
| 4 | 2018/01/17 | 19:48:40.3 | −7.969 | 38.786 | 12.4 | 0.9 | 202.1 | 62.0 | 120.0 | 1.0 | 16.7 | 10/10 | 10 | 0.00 | 0.66 | 0.77 | A |
| 5 | 2018/01/17 | 22:32:56.2 | −7.970 | 38.781 | 12.1 | 1.0 | 225.3 | 57.0 | 122.7 | 2.1 | 18.5 | 9/9 | 9 | 0.00 | 0.63 | 0.87 | A |
| 6 | 2018/01/18 | 06:55:30.9 | −7.966 | 38.785 | 12.8 | 1.2 | 263.2 | 47.3 | 120.0 | 1.2 | 16.8 | 12/11 | 12 | 0.12 | 0.68 | 0.69 | A |
| 7 | 2018/01/23 | 01:56:47.7 | −7.973 | 38.778 | 12.3 | 1.5 | 269.9 | 65.5 | 152.9 | 1.7 | 4.8 | 20/19 | 19 | 0.07 | 0.69 | 0.74 | A |
| 8 | 2018/01/24 | 12:58:51.0 | −7.971 | 38.781 | 12.3 | 1.6 | 93.9 | 50.0 | 145.0 | 1.0 | 12.7 | 11/11 | 10 | 0.00 | 0.59 | 0.79 | A |
| 9 | 2018/01/26 | 03:27:27.7 | −7.923 | 38.724 | 15.2 | 1.1 | 280.2 | 36.0 | 159.0 | 0.0 | 4.6 | 13/12 | 13 | 0.05 | 0.78 | 0.53 | A |
| 10 | 2018/01/26 | 08:58:32.9 | −7.970 | 38.774 | 12.2 | 1.0 | 331.9 | 44.0 | 142.0 | 0.0 | 12.1 | 9/8 | 9 | 0.13 | 0.69 | 0.84 | A |
| 11 | 2018/01/30 | 06:33:53.2 | −8.259 | 38.839 | 9.8 | 1.5 | 259.6 | 66.1 | 157.3 | 18.9 | 32.6 | 17/17 | 17 | 0.00 | 0.48 | 0.84 | B |
| 12 | 2018/01/30 | 15:46:46.1 | −7.962 | 38.783 | 11.9 | 1.2 | 48.9 | 29.1 | 120.5 | 1.1 | 16.0 | 14/14 | 14 | 0.00 | 0.72 | 0.61 | A |
| 13 | 2018/02/01 | 04:15:42.1 | −7.970 | 38.775 | 12.4 | 3.5 | 255.4 | 38.0 | 93.0 | 0.0 | 1.0 | 30/29 | 29 | 0.03 | 0.70 | 0.64 | A |
| 14 | 2018/02/02 | 22:45:20.6 | −7.973 | 38.775 | 12.3 | 1.0 | 122.1 | 77.7 | 113.8 | 7.1 | 13.4 | 17/17 | 16 | 0.00 | 0.68 | 0.61 | A |
| 15 | 2018/02/03 | 04:43:8.2 | −7.971 | 38.780 | 12.6 | 1.0 | 277.3 | 26.8 | 104.0 | 1.9 | 6.9 | 17/17 | 16 | 0.00 | 0.65 | 0.75 | A |
| 16 | 2018/02/04 | 16:47:49.8 | −7.973 | 38.779 | 12.1 | 1.3 | 37.1 | 35.1 | 111.6 | 2.2 | 12.1 | 14/14 | 12 | 0.00 | 0.69 | 0.76 | A |
| 17 | 2018/02/07 | 10:40:31.6 | −7.969 | 38.785 | 12.3 | 1.0 | 38.2 | 54.0 | 92.0 | 0.0 | 0.0 | 14/13 | 14 | 0.09 | 0.71 | 0.78 | A |
| 18 | 2018/02/07 | 17:03:49.2 | −8.314 | 38.863 | 24.6 | 1.7 | 272.2 | 77.7 | 149.6 | 4.4 | 32.2 | 18/17 | 18 | 0.05 | 0.63 | 0.52 | A |
| 19 | 2018/02/07 | 17:42:23.7 | −7.963 | 38.783 | 11.8 | 0.6 | 52.1 | 32.0 | 129.0 | 0.0 | 21.9 | 11/11 | 10 | 0.00 | 0.71 | 0.68 | A |
| 20 | 2018/02/09 | 03:10:24.2 | −7.974 | 38.773 | 12.7 | 1.1 | 86.4 | 65.3 | 109.4 | 1.3 | 10.6 | 19/18 | 19 | 0.06 | 0.68 | 0.68 | A |
| 21 | 2018/02/09 | 03:10:38.1 | −7.975 | 38.774 | 12.7 | 1.2 | 210.0 | 30.0 | 97.0 | 0.0 | 3.4 | 14/13 | 14 | 0.09 | 0.70 | 0.70 | A |
| 22 | 2018/02/09 | 09:26:38.7 | −7.971 | 38.780 | 12.3 | 0.5 | 99.2 | 61.0 | 110.3 | 1.7 | 11.1 | 9/9 | 9 | 0.00 | 0.55 | 0.80 | A |
| 23 | 2018/02/12 | 03:35:39.3 | −7.988 | 38.825 | 21.3 | 2.3 | 263.9 | 74.0 | 164.6 | 1.0 | 2.2 | 26/25 | 13 | 0.03 | 0.71 | 0.30 | A |
| 24 | 2018/02/14 | 04:29:52.1 | −7.972 | 38.780 | 12.5 | 0.5 | 277.8 | 23.9 | 115.2 | 2.0 | 14.2 | 12/12 | 12 | 0.00 | 0.69 | 0.70 | A |
| 25 | 2018/02/14 | 12:47:37.5 | −7.971 | 38.779 | 12.5 | 0.6 | 47.5 | 53.0 | 109.5 | 1.1 | 10.7 | 11/10 | 10 | 0.13 | 0.71 | 0.73 | A |
| 26 | 2018/02/15 | 02:00:2.8 | −7.970 | 38.779 | 12.6 | 0.5 | 95.9 | 58.0 | 111.0 | 1.0 | 11.6 | 12/11 | 6 | 0.11 | 0.68 | 0.74 | A |
| 27 | 2018/02/17 | 04:17:28.1 | −7.971 | 38.780 | 12.4 | 0.1 | 274.8 | 28.0 | 110.0 | 7.8 | 19.0 | 11/11 | 5 | 0.00 | 0.77 | 0.53 | A |
| 28 | 2018/02/17 | 04:25:2.1 | −7.970 | 38.779 | 12.1 | 0.4 | 93.0 | 42.0 | 132.0 | 0.0 | 5.2 | 16/15 | 7 | 0.09 | 0.71 | 0.67 | A |
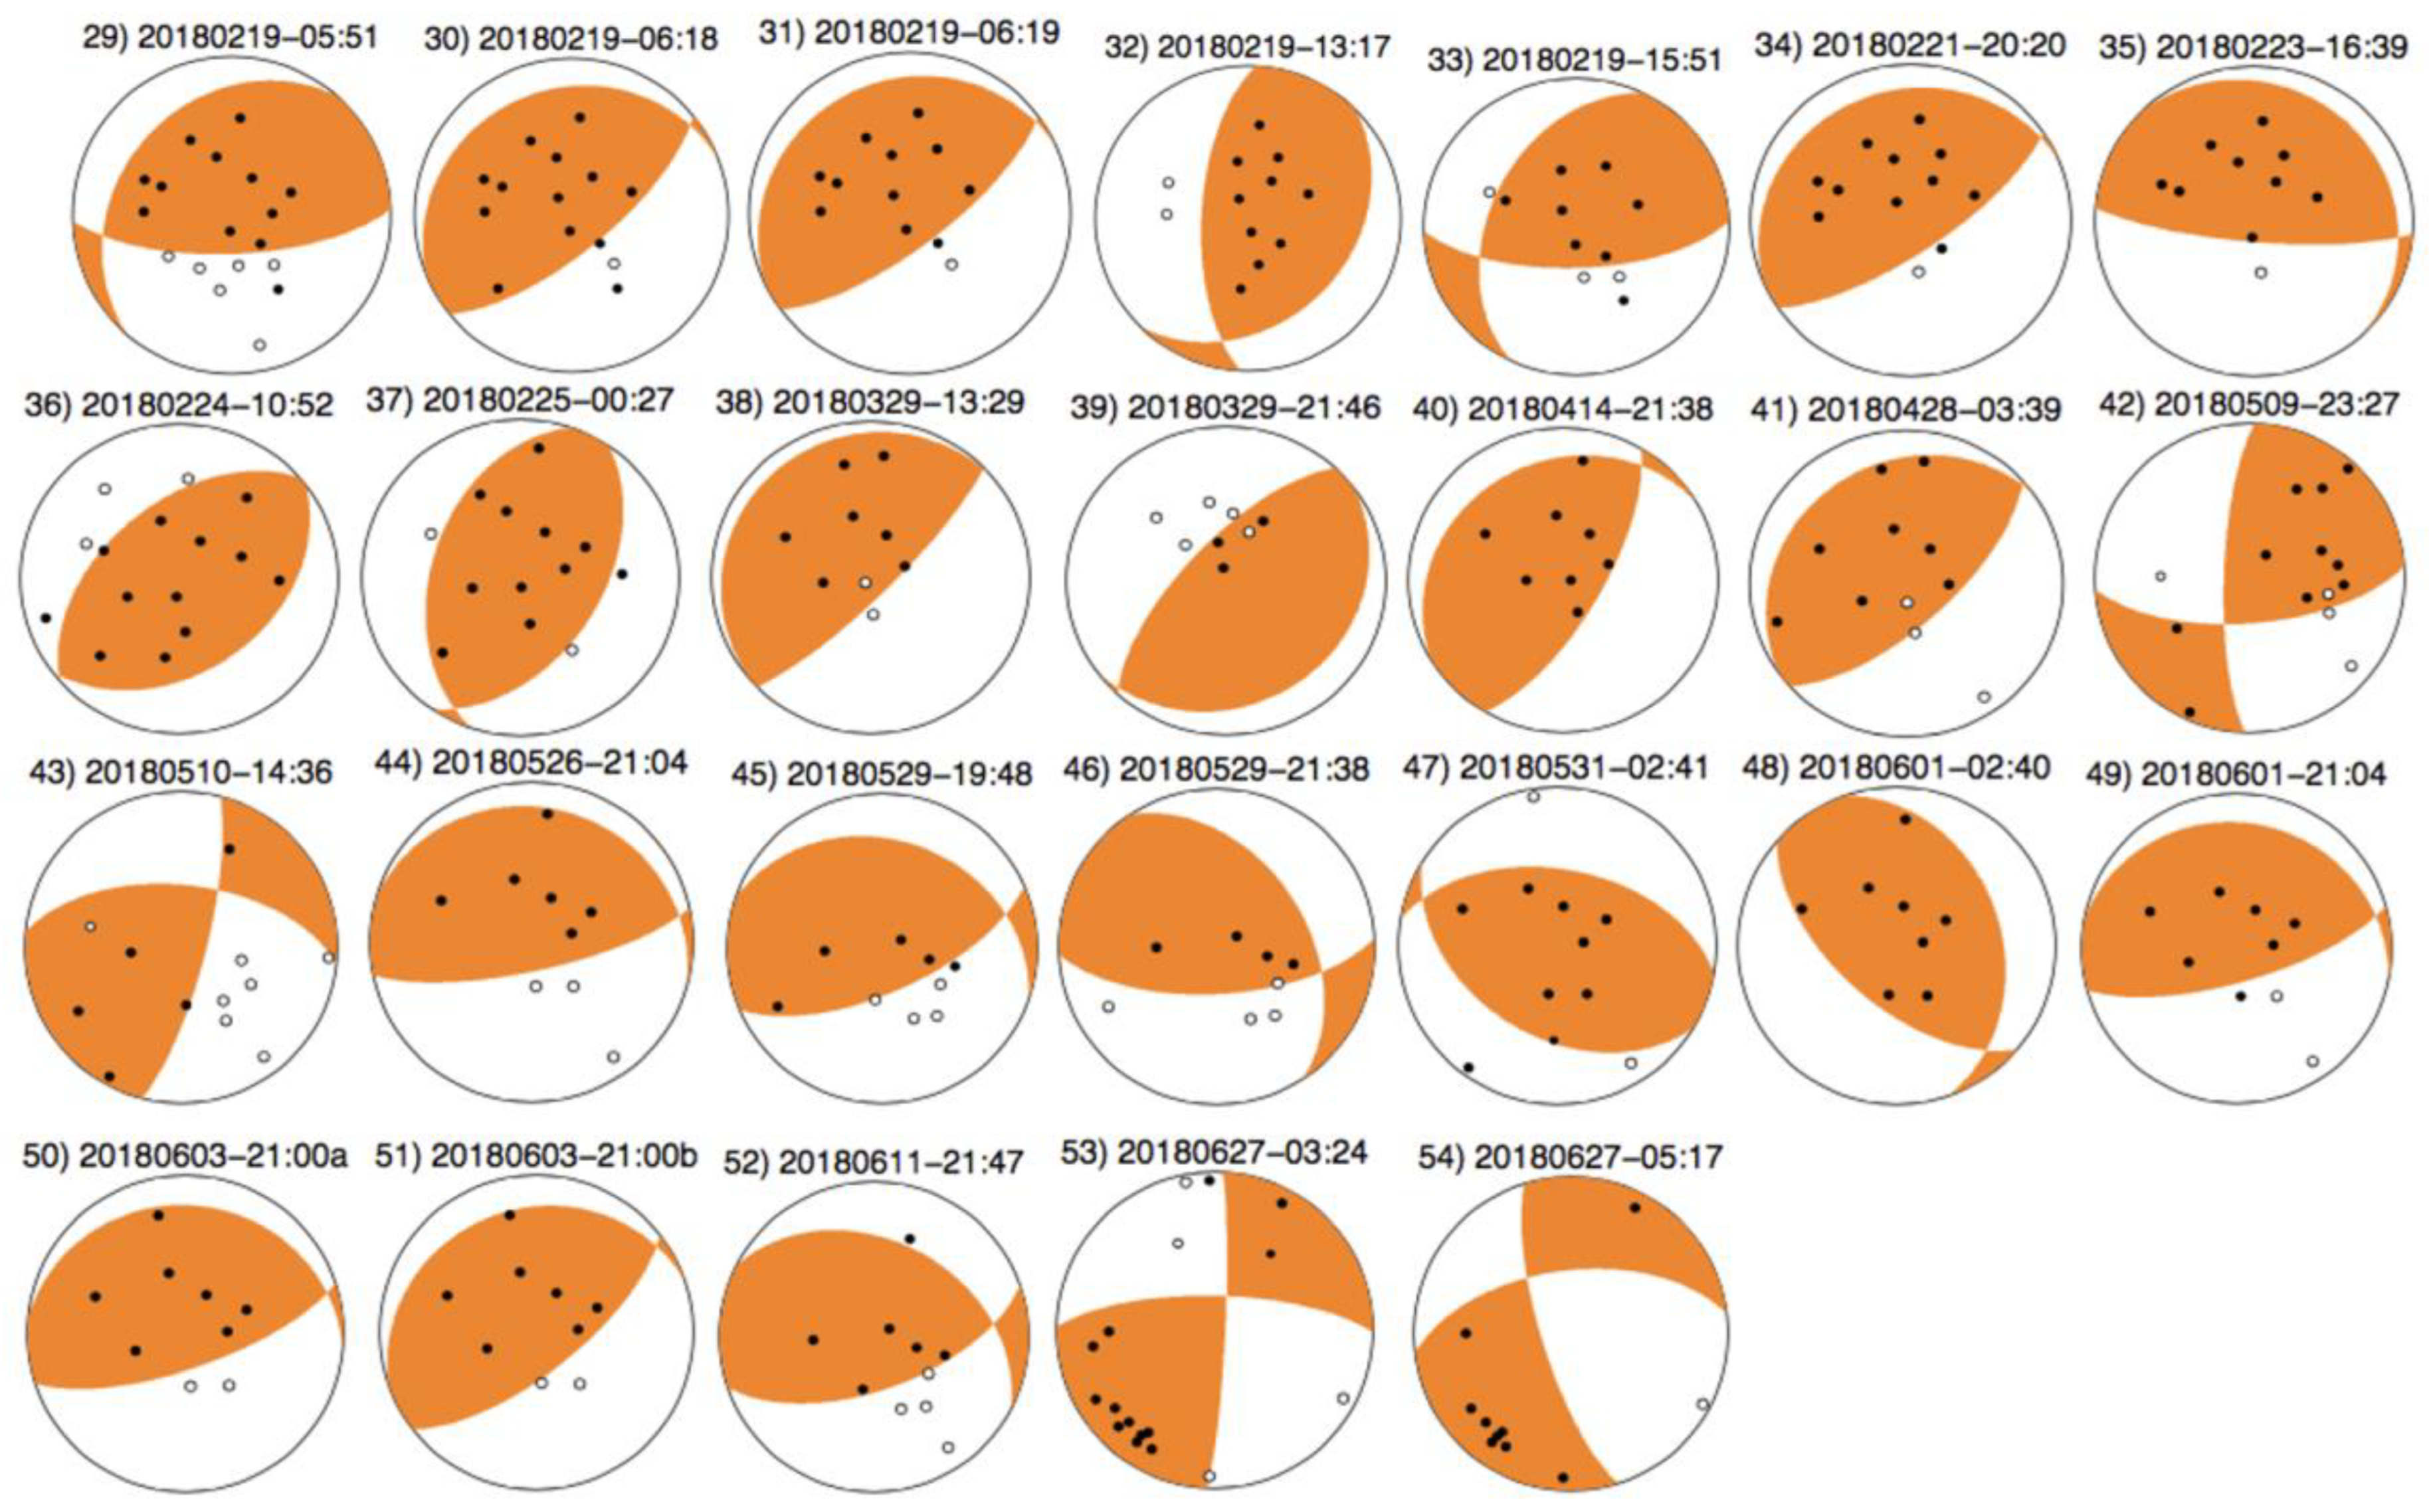
| 29 | 2018/02/19 | 05:51:46.5 | −7.972 | 38.779 | 12.5 | 0.6 | 87.9 | 70.0 | 110.0 | 1.6 | 11.0 | 18/17 | 18 | 0.07 | 0.72 | 0.65 | A |
| 30 | 2018/02/19 | 0618 53.7 | −7.971 | 38.780 | 12.4 | 0.1 | 249.0 | 20.1 | 107.2 | 2.0 | 5.3 | 14/12 | 14 | 0.16 | 0.70 | 0.62 | A |
| 31 | 2018/02/19 | 06:19:24.7 | −7.973 | 38.779 | 12.4 | 0.1 | 245.6 | 17.7 | 102.0 | 3.8 | 12.3 | 12/11 | 12 | 0.08 | 0.69 | 0.55 | A |
| 32 | 2018/02/19 | 13:17:30.2 | −7.965 | 38.782 | 12.0 | 0.2 | 44.5 | 32.0 | 127.0 | 0.0 | 20.8 | 12/12 | 11 | 0.00 | 0.73 | 0.59 | A |
| 33 | 2018/02/19 | 15:51:24.2 | −7.971 | 38.778 | 12.3 | 0.2 | 88.2 | 67.2 | 126.8 | 7.6 | 11.8 | 11/10 | 11 | 0.11 | 0.75 | 0.52 | A |
| 34 | 2018/02/21 | 20:20:40.4 | −7.971 | 38.780 | 12.3 | 0.2 | 248.0 | 17.4 | 101.7 | 1.2 | 6.5 | 12/11 | 12 | 0.08 | 0.72 | 0.59 | A |
| 35 | 2018/02/23 | 16:39:42.1 | −7.971 | 38.779 | 12.2 | 0.1 | 316.9 | 14.6 | 131.1 | 1.4 | 18.9 | 10/10 | 10 | 0.00 | 0.78 | 0.54 | A |
| 36 | 2018/02/24 | 10:52:9.6 | −7.973 | 38.777 | 12.3 | 1.7 | 52.8 | 40.0 | 93.0 | 0.0 | 1.0 | 15/14 | 14 | 0.03 | 0.70 | 0.56 | A |
| 37 | 2018/02/25 | 00:27:45.6 | −7.967 | 38.787 | 12.3 | 1.0 | 36.3 | 48.0 | 102.0 | 0.0 | 4.0 | 13/12 | 10 | 0.02 | 0.65 | 0.82 | A |
| 38 | 2018/03/29 | 13:29:14.1 | −7.976 | 38.791 | 14.1 | 1.8 | 229.4 | 10.0 | 94.0 | 0.0 | 1.6 | 9/8 | 8 | 0.05 | 0.66 | 0.63 | A |
| 39 | 2018/03/29 | 21:46:1.5 | −7.974 | 38.843 | 18.5 | 1.4 | 52.9 | 20.9 | 99.3 | 11.7 | 7.9 | 8/7 | 7 | 0.13 | 0.82 | 0.23 | A |
| 40 | 2018/04/14 | 21:38:51.2 | −7.959 | 38.797 | 13.8 | 1.0 | 239.4 | 23.0 | 117.3 | 1.8 | 15.2 | 8/8 | 6 | 0.00 | 0.60 | 0.98 | A |
| 41 | 2018/04/28 | 03:39:21.9 | −7.968 | 38.777 | 13.4 | 1.9 | 234.6 | 22.4 | 96.2 | 1.4 | 4.4 | 11/10 | 8 | 0.08 | 0.65 | 0.63 | A |
| 42 | 2018/05/09 | 23:27:12.2 | −7.777 | 38.764 | 19.0 | 2.8 | 85.6 | 66.0 | 165.0 | 0.0 | 15.0 | 14/14 | 8 | 0.07 | 0.52 | 0.59 | A |
| 43 | 2018/05/10 | 14:36:13.1 | −7.894 | 38.721 | 14.8 | 2.1 | 275.9 | 57.1 | 164.6 | 1.0 | 2.1 | 12/11 | 6 | 0.06 | 0.61 | 0.64 | A |
| 44 | 2018/05/26 | 21:04:29.7 | −7.974 | 38.787 | 13.1 | 1.2 | 287.2 | 16.9 | 118.3 | 1.6 | 16.2 | 9/9 | 7 | 0.00 | 0.72 | 0.61 | A |
| 45 | 2018/05/29 | 19:48:56.6 | −7.918 | 38.723 | 15.8 | 1.5 | 289.1 | 30.6 | 128.5 | 1.1 | 7.2 | 9/8 | 5 | 0.08 | 0.59 | 1.08 | A |
| 46 | 2018/05/29 | 21:38:29.7 | −7.916 | 38.726 | 15.3 | 1.1 | 326.9 | 42.5 | 141.9 | 3.1 | 10.5 | 8/7 | 7 | 0.15 | 0.56 | 0.58 | A |
| 47 | 2018/05/31 | 02:41:37.2 | −7.992 | 38.781 | 13.2 | 1.6 | 121.5 | 42.0 | 106.5 | 1.0 | 9.0 | 11/10 | 7 | 0.03 | 0.66 | 0.54 | A |
| 48 | 2018/06/01 | 02:40:32.9 | −7.991 | 38.781 | 13.2 | 1.4 | 341.3 | 34.5 | 115.8 | 12.8 | 17.9 | 8/8 | 7 | 0.00 | 0.71 | 0.59 | A |
| 49 | 2018/06/01 | 21:04:33.7 | −7.974 | 38.781 | 13.0 | 1.5 | 281.6 | 20.0 | 116.0 | 0.0 | 14.4 | 9/8 | 8 | 0.15 | 0.68 | 0.73 | A |
| 50 | 2018/06/03 | 21:00:18.7 | −7.972 | 38.779 | 12.6 | 1.8 | 275.8 | 20.0 | 113.0 | 0.0 | 12.7 | 9/9 | 8 | 0.00 | 0.69 | 0.78 | A |
| 51 | 2018/06/03 | 21:00:50.9 | −7.973 | 38.780 | 12.6 | 1.8 | 251.2 | 22.0 | 108.0 | 0.0 | 9.8 | 9/9 | 8 | 0.00 | 0.70 | 0.77 | A |
| 52 | 2018/06/11 | 21:47:11.2 | −7.924 | 38.722 | 15.7 | 1.9 | 297.6 | 38.0 | 130.0 | 0.0 | 1.6 | 10/9 | 5 | 0.14 | 0.62 | 0.88 | A |
| 53 | 2018/06/27 | 03:24:22.5 | −8.248 | 38.530 | 14.4 | 2.4 | 271.1 | 72.5 | 174.4 | 6.1 | 17.3 | 17/16 | 8 | 0.04 | 0.57 | 0.86 | A |
| 54 | 2018/06/27 | 05:17:28.1 | −8.258 | 38.533 | 15.0 | 1.3 | 263.0 | 57.0 | −161.6 | 6.8 | 34.6 | 10/10 | 4 | 0.00 | 0.63 | 0.79 | B |
References
- Borges, J.F.; Fitas, A.J.; Bezzeghoud, M.; Teves-Costa, P. Seismotectonics of Portugal and its adjacent Atlantic area. Tectonophysics 2001, 331, 373–387. [Google Scholar] [CrossRef]
- Bezzeghoud, M.; Borges, J.F.; Caldeira, B. Fontes sísmicas ao longo da fronteira de placas tectónicas entre os Açores e a Argélia: Um modelo sismotectónico. In Geologia de Portugal, Volume II—Geologia Meso-Cenozóica de Portugal; Escolar Editora: Forte da Casa, Portugal, 2013. [Google Scholar]
- Bezzeghoud, M.; Buforn, E. Source parameters of the 1992 Melilla (Spain, MW = 4.8), 1994 Alhoceima (Morocco, MW = 5.8), and 1994 Mascara (Algeria, MW = 5.7) earthquakes and seismotectonic implications. Bull. Seismol. Soc. Am. 1999, 89, 359–372. [Google Scholar] [CrossRef]
- Kilb, D.; Gomberg, J.; Bodin, P. Triggering of earthquake aftershocks by dynamic stresses. Nature 2000, 408, 570–574. [Google Scholar] [CrossRef] [PubMed]
- Buforn, E.; Udías, A. Sismicidad y mecanismo focal de los terremotos de la región Cabo de San Vicente-Argelia. Rev. Soc. Geológica España 2007, 20, 301–310. [Google Scholar]
- Toda, S.; Enescu, B. Rate/state Coulomb stress transfer model for the CSEP Japan seismicity forecast. Earth Planets Space 2011, 63, 171–185. [Google Scholar] [CrossRef]
- Lentas, K. Towards routine determination of focal mechanisms obtained from first motion P-wave arrivals. Geophys. J. Int. 2018, 212, 1665–1686. [Google Scholar] [CrossRef]
- Araújo, A.; Matos, C.; Martins, A. A elevação de Aldeia da Serra (Arraiolo s): Um “push up” activo associado à Falha de Ciborro e ao lineamento de S. Gregório? e-Terra: Revista Electrónica de Ciências da Terra. In VIII Congresso Nacional de Geologia; E-Terra: Braga, Portugal, 2010; Volume 11, ISSN 1645-0388. [Google Scholar]
- Wachilala, P.E. Sismotectónica da Região de Ciborro-Arraiolos e Sua Relação com a Geomorfologia Local. Master’s Thesis, Universidade de Évora, Évora, Portugal, 2015. (In Portuguese). [Google Scholar]
- Matos, C.; Custódio, S.; Batlló, J.; Zahradník, J.; Arroucau, P.; Silveira, G.; Heimann, S. An active seismic zone in intraplate west Iberia inferred from high resolution geophysical data. J. Geophys. Res. 2018, 123, 2885–2907. [Google Scholar] [CrossRef]
- Matias, L.; Rio, I.; Wachilala, P.; Vales, D.; Borges, J.; Dias, N.; Carrilho, F.; Caldeira, B.; Custodio, S.; Fontiela, J.; et al. The seismic sequence of Arraiolos, Portugal, in January 2018. In Proceedings of the 21st EGU General Assembly, EGU2019, Vienna, Austria, 7–12 April 2019; Volume 21. [Google Scholar]
- Wachilala, P.; Borges, J.F.; Caldeira, B.; Matias, L.; Rio, I.; Bezzeghoud, M. Seismotectonic characterization of the region of Arraiolos, South Portugal: Period of January–May, 2018. In Proceedings of the 27th IUGG General Assembly, Montréal, QC, Canada, 8–18 July 2019; p. S01p-371. [Google Scholar]
- Hamak, I.; Wachilala, P.; Borges, J.; Dias, N.; Rio, I.; Bezzeghoud, M. Improved three-dimensional image of the tomographic inversion of the Arraiolos aftershock sequence. In Proceedings of the EGU General Assembly 2021, Online, 19–30 April 2021; p. EGU21-8079. [Google Scholar]
- Barfal, S.S.; Das, M.M.; Joshi, M.; Joshi, R.; Kumar, K.; Kumar, D.; Rai, Y.K. Response of water springs towards an earthquake: A case study from Sikkim Himalaya. J. Appl. Geophys. 2022, 206, 104792. [Google Scholar] [CrossRef]
- Tajima, F.; Kanamori, H. Global survey of aftershock area expansion patterns. Phys. Earth Planet. Inter. 1985, 40, 77–134. [Google Scholar] [CrossRef]
- Kilb, D.; Rubin, A.M. Implications of diverse fault orientations imaged in relocated aftershocks of the Mount Lewis, ML5.7, California, earthquake. J. Geophys. Res. Atmos. 2002, 107, 2294. [Google Scholar] [CrossRef]
- Yang, H.; Zhu, L.; Chu, R. Fault-Plane Determination of the 18 April 2008 Mount Carmel, Illinois, Earthquake by Detecting and Relocating Aftershocks. Bull. Seismol. Soc. Am. 2009, 99, 3413–3420. [Google Scholar] [CrossRef]
- Freed, A.M. Earthquake triggering by static, dynamic, and postseismic stress transfer. Annu. Rev. Earth Planet. Sci. 2005, 33, 335–367. [Google Scholar] [CrossRef]
- Tang, C.-C.; Lin, C.-H.; Peng, Z. Spatial-temporal evolution of early aftershocks following the 2010 ML 6.4 Jiashian earthquake in southern Taiwan. Geophys. J. Int. 2014, 199, 1772–1783. [Google Scholar] [CrossRef]
- Lin, G.; Okubo, P.G. A large refined catalog of earthquake relocations and focal mechanisms for the Island of Hawai’i and its seismotectonic implications. J. Geophys. Res. Solid Earth 2016, 121, 5031–5048. [Google Scholar] [CrossRef]
- Hardebeck, J.L.; Shearer, P.M. A new method for determining first-motion focal mechanisms. Bull. Seismol. Soc. Am. 2002, 92, 2264–2276. [Google Scholar] [CrossRef]
- Kilb, D.; Hardebeck, J.L. Fault Parameter Constraints Using Relocated Earthquakes: Validation of First Motion Focal Mechanism Data. Bull. Seismol. Soc. Am. 2006, 96, 1140–1158. [Google Scholar] [CrossRef]
- Hardebeck, J.L.; Shearer, P.M. Using S/P Amplitude Ratios to Constrain the Focal Mechanisms of Small Earthquakes. Bull. Seismol. Soc. Am. 2003, 93, 2434–2444. [Google Scholar] [CrossRef]
- Ribeiro, A.; Quesada, C.; Dallmeyer, R.D. Geodynamic evolution of the Iberian Massif. In Pre-Mesozoic Geology of Iberia; Dallmeyer, R.D., Martínez-García, E., Eds.; Springer: Berlin/Heidelberg, Germany, 1990; pp. 397–410. [Google Scholar]
- Matte, P. The Variscan collage and orogeny (480–290 Ma) and the tectonic definition of the Armorica microplate: A review. Terra Nova 2001, 13, 122–128. [Google Scholar] [CrossRef]
- Pous, J.; Poyatos, D.M.; Heise, W.; Santos, F.M.; Galindo-Zaldívar, J.; Ibarra, P.; Pedrera, A.; Ruiz-Constán, A.; Anahnah, F.; Gonçalves, R.; et al. Constraints on the crustal structure of the internal Variscan Belt in SW Europe: A magnetotelluric transect along the eastern part of Central Iberian Zone, Iberian Massif. J. Geophys. Res. Atmos. 2011, 116, B02103. [Google Scholar] [CrossRef]
- Pérez-Estaún, A.; Bea, F.; Bastida, F.; Marcos, A.; Martínez, C.J.R.; Martínez, P.D.; Arenas, R.; Díaz, G.F.; Azor, A.; Simancas, J.F.; et al. La cordllera varisca europea: El Macizo Ibérico. In Geología de España. Society Geology; Vera, J.A., Ed.; IGME: Madrid, Spain, 2004; pp. 21–25. [Google Scholar]
- Pereira, M.F.; Chichorro, M.; Moita, P.; Santos, J.F.; Solá, A.M.R.; Williams, I.S.; Silva, J.B.; Armstrong, R.A. The multistage crystallization of zircon in calc-alkaline granitoids: U–Pb age constraints on the timing of Variscan tectonic activity in SW Iberia. Int. J. Earth Sci. 2015, 104, 1167–1183. [Google Scholar] [CrossRef]
- Simancas, J.F.; Carbonell, R.; González Lodeiro, F.; Pérez Estaún, A.; Juhlin, C.; Ayarza, P.; Kashubin, A.; Azor, A.; Martínez Poyatos, D.; Almodovar, G.R.; et al. Crustal structure of the transpressional Variscan orogen of SW Iberia: SW Iberia deep seismic reflection profile (IBERSEIS). Tectonics 2003, 22, 1062. [Google Scholar] [CrossRef]
- Carbonell, R.; Simancas, F.; Juhlin, C.; Pous, J.; Pérez-Estaún, A.; Gonzalez-Lodeiro, F.; Muñoz, G.; Heise, W.; Ayarza, P. Geophysical evidence of a mantle derived intrusion in SW Iberia. Geophys. Res. Lett. 2004, 31, L11601. [Google Scholar] [CrossRef]
- Palomeras, I.; Carbonell, R.; Ayarza, P.; Fernàndez, M.; Simancas, J.; Poyatos, D.M.; Lodeiro, F.G.; Pérez-Estaún, A. Geophysical model of the lithosphere across the Variscan Belt of SW-Iberia: Multidisciplinary assessment. Tectonophysics 2011, 508, 42–51. [Google Scholar] [CrossRef]
- Brown, D.; Zhang, X.; Palomeras, I.; Simancas, F.; Carbonell, R.; Juhlin, C.; Salisbury, M. Petrophysical analysis of a mid-crustal reflector in the IBERSEIS profile, SW Spain. Tectonophysics 2012, 550–553, 35–46. [Google Scholar] [CrossRef]
- Argus, D.F.; Gordon, R.G.; DeMets, C.; Stein, S. Closure of the Africa-Eurasia-North America Plate motion circuit and tectonics of the Gloria Fault. J. Geophys. Res. Atmos. 1989, 94, 5585–5602. [Google Scholar] [CrossRef]
- DeMets, C.; Gordon, R.G.; Argus, D.F.; Stein, S. Effect of recent revisions to the geo- magnetic reversal time scale on estimates of current plate motions. Geophys. Res. Lett. 1994, 21, 2191–2194. [Google Scholar] [CrossRef]
- DeMets, C.; Gordon, R.G.; Argus, D.F. Geologically current plate motions. Geophys. J. Int. 2010, 181, 1–80. [Google Scholar] [CrossRef]
- Nocquet, J.-M. Present-day kinematics of the Mediterranean: A comprehensive overview of GPS results. Tectonophysics 2012, 579, 220–242. [Google Scholar] [CrossRef]
- Attanayake, J.; Ferreira, A.M.; Berbellini, A.; Morelli, A. Crustal structure beneath Portugal from teleseismic Rayleigh Wave Ellipticity. Tectonophysics 2017, 712–713, 344–361. [Google Scholar] [CrossRef]
- Moreira, V.S. Historical seismicity and seismotectonics of the area situated between the Iberian Peninsula, Marrocco, Selvagens and Azores Islands. In Seismicity, Seismotectonic and Seismic Risk of the Ibero-Magrebian Region; IGN: Urbana, IL, USA, 1991; Volume 8, pp. 213–225. [Google Scholar]
- Zbyszewski, G.; Barros, A.; Da Veiga Ferreira, O. Carta Geológica de Portugal na Escala 1/50 000, folha 36-A (Pavia) e Respectiva Notícia Explicativa; Direcção Geral de Geologia e Minas, Serviços Geológicos de Portugal: Lisboa, Portugal, 1980. [Google Scholar]
- Moita, P. Granitóides no SW da Zona de Ossa-Morena (Montemor o Novo–Évora): Petrogénese e Processos Geodinâmicos. Ph.D. Thesis, Universidade de Évora, Évora, Portugal, 2007; p. 351. [Google Scholar]
- Oliveira, J.T.; Pereira, E.; Ramalho, M.; Antunes, M.T.; Monteiro, J.H. (Eds.) Carta Geológica de Portugal à escala 1/500.000, 5th ed.; Serviços Geológicos de Portugal: Lisboa, Portugal, 1992. [Google Scholar]
- Feio, M.; Martins, A. O Relevo do Alto Alentejo, (Traços Essenciais); Finisterra: Lisboa, Portugal, 1993; Volume XXVIII, pp. 149–199. [Google Scholar]
- Duarte, I.M.R. Solos Residuais de Rochas Granitóides a Sul do Tejo. Características Geológicas e Geotécnicas. Ph.D. Thesis, Universidade de évora, Évora, Portugal, 2002; 76p. (In Portuguese). [Google Scholar]
- Carvalhosa, A.B. Carta Geológica de Portugal à escala de 1/50,000. Notícia explicativa da folha 36-C, Arraiolos; Serviços Geológicos de Portugal: Lisboa, Portugal, 1999; 52p. [Google Scholar]
- Ottemöller, L.; Voss, P.; Havskov, J. SEISAN Earthquake Analysis Software for Windows, Solaris, Linux and MacOSX, Version 10.3; University of Bergen: Bergen, Norway, 2014.
- Lienert, B.R.; Berg, E.; Frazer, L.N. HYPOCENTER: An earthquake location method using centered, scaled, and adaptively damped least squares. Bull. Seismol. Soc. Am. 1986, 76, 771–783. [Google Scholar] [CrossRef]
- Lienert, B.R.E. Report on Modifications made to Hypocenter; Technical report; Institute of Solid Earth Physics, University of Bergen: Bergen, Norway, 1991. [Google Scholar]
- Lienert, B.R.; Havskov, J. A Computer Program for Locating Earthquakes Both Locally and Globally. Seismol. Res. Lett. 1995, 66, 26–36. [Google Scholar] [CrossRef]
- Kissling, E. Program VELEST USER’S GUIDE—Short Introduction; Technical report; Institute of Geophysics, ETH Zurich: Zurich, Switzerland, 1995. [Google Scholar]
- Dias, N.A. Estudo da Sequência Sísmica Gerada Pelo Sismo do Faial de 9 de Julho de 1998: Anisotropia Crustal, Inversão Tomográfica e Caracterização Sismo-Tectónica. Ph.D. Thesis, Universidade de Lisboa, Lisboa, Portugal, 2005. (In Portuguese). [Google Scholar]
- Veludo, I.; Dias, N.A.; Fonseca, P.E.; Matias, L.; Carrilho, F.; Haberland, C.; Villaseñor, A. Crustal seismic structure beneath Portugal and southern Galicia (Western Iberia) and the role of Variscan inheritance. Tectonophysics 2017, 717, 645–664. [Google Scholar] [CrossRef]
- Mogi, K. Some discussions on aftershocks, foreshocks and earthquake swarms: The fracture of a semi-infinite body caused by an inner stress origin and its relation to the earthquake phenomena (third paper). Bull. Earthquake Res. Inst. 1963, 41, 615–658. [Google Scholar]
- Utsu, T.; Ogata, Y.; Matsu’ura, R.S. The centenary of the Omori formula for a decay law of after- shock activity. J. Phys. Earth. 1995, 43, 1–33. [Google Scholar] [CrossRef]
- Gutenberg, B.; Richter, C.F. Frequency of earthquakes in California. Bull. Seismol. Soc. Am. 1944, 34, 185–188. [Google Scholar] [CrossRef]
- Mogi, K. Magnitude-Frequency Relation for Elastic Shocks Accompanying Fractures of Various Materials and some Related Problems in Earthquakes. Bull. Earthq. Res. Inst. 1962, 40, 831–853. [Google Scholar]
- Scholz, C.H. The Frequency-Magnitude Relation of Microfracturing in Rock and its Relation to Earth- quakes. Bull. Seismol. Soc. Am. 1968, 58, 399–415. [Google Scholar] [CrossRef]
- Warren, N.W.; Latham, G.V. An experimental study of thermally induced microfracturing and its relation to volcanic seismicity. J. Geophys. Res. Atmos. 1970, 75, 4455–4464. [Google Scholar] [CrossRef]
- El-Isa, Z.H.; Eaton, D.W. Spatiotemporal variations in the b-value of earthquake magnitude–frequency distributions: Classification and causes. Tectonophysics 2014, 615, 1–11. [Google Scholar] [CrossRef]
- Kagan, Y. Universality of the seismic moment-frequency relation. In Seismicity Patterns, Their Statistical Significance and Physical Meaning; Pageoph Topical; Springer: Basel, Switzerland, 1999; pp. 537–573. [Google Scholar]
- Okal, E.A.; Sweet, J.R. Frequency-Size Distributions for Intraplate Earthquakes; Geological Society of America: Boulder, CO, USA, 2007; Volume 425, pp. 59–71. [Google Scholar]
- Bachmann, C.E.; Wiemer, S.; Goertz-Allmann, B.P.; Woessner, J. Influence of pore-pressure on the event-size distribution of induced earthquakes. Geophys. Res. Lett. 2012, 39, L09302. [Google Scholar] [CrossRef]
- Wiemer, S.; McNutt, S.R. Variations in the frequency-magnitude distribution with depth in two volcanic areas: Mount St. Helens, Washington, and Mt. Spurr, Alaska. Geophys. Res. Lett. 1997, 24, 189–192. [Google Scholar] [CrossRef]
- Nakajima, J.; Matsuzawa, T.; Hasegawa, A.; Zhao, D. Three dimensional structures of Vp, Vs, and Vp/Vs beneath the northeastern Japan arc: Implications for arc magmatism and fluids. J. Geophys. Res. 2011, 106, 21843–21857. [Google Scholar] [CrossRef]
- Wiemer, S.; Benoit, J.P. Mapping the B-value anomaly at 100 km depth in the Alaska and New Zealand Subduction Zones. Geophys. Res. Lett. 1996, 23, 1557–1560. [Google Scholar] [CrossRef]
- Wyss, M.; Hasegawa, A.; Nakajima, J. Source and path of magma for volcanoes in the subduction zone of northeastern Japan. Geophys. Res. Lett. 2001, 28, 1819–1822. [Google Scholar] [CrossRef]
- Reasenberg, P.; Oppenheimer, D. FPFIT, FPPLOT, and FPPAGE: FORTRAN Computer Programs for Calculating and Displaying Earthquake Fault-Plane Solutions; USGS: Lawrence, KS, USA, 1985; pp. 85–739. [CrossRef]
- Nakamura, M. Determination of focal mechanism solution using initial motion polarity of P and S waves. Phys. Earth Planet. Inter. 2002, 130, 17–29. [Google Scholar] [CrossRef]
- Lund, B.; Boovarsson, R. Correlation of microearthquake body-wave spectral amplitudes. Bull. Seismol. Soc. Am. 2002, 92, 2419–2433. [Google Scholar] [CrossRef]
- Kisslinger, C. Evaluation of S to P amplitude ratios for determining focal mechanisms from regional network observations. Bull. Seismol. Soc. Am. 1980, 70, 999–1014. [Google Scholar] [CrossRef]
- Julian, B.R.; Foulger, G.R. Earthquake mechanisms from linear-programming inversion of seismic-wave amplitude ratios. Bull. Seismol. Soc. Am. 1996, 86, 972–980. [Google Scholar] [CrossRef]
- Dreger, D.; Helmberger, D. Determination of source parameters at regional distances with three-component sparse network data. J. Geophys. Res. 1993, 98, 8107–8125. [Google Scholar] [CrossRef]
- Fukuyama, E.; Ellsworth, W.; Waldhauser, F.; Kubo, A. Detailed fault structure of the 2000 western Tottori, Japan, earthquake sequence. Bull. Seismol. Soc. Am. 2003, 93, 1468–1478. [Google Scholar] [CrossRef]
- Presti, D.; Billi, A.; Orecchio, B.; Totaro, C.; Faccenna, C.; Neri, G. Earthquake focal mechanisms, seismogenic stress, and seismotectonics of the Calabrian Arc, Italy. Tectonophysics 2013, 602, 153–175. [Google Scholar] [CrossRef]
- Shearer, P.M.; Hardebeck, J.L.; Astiz, L.; Richards-Dinger, K.B. Analysis of similar event clusters in aftershocks of the 1994 Northridge, California, earthquake. J. Geophys. Res. Atmos. 2003, 108, B1. [Google Scholar] [CrossRef]
- Heidbach, O.; Rajabi, M.; Reiter, K.; Ziegler, M. World Stress Map 2016; GFZ Data Service: Potsdam, Germany, 2016. [Google Scholar]
- Álvarez-Gómez, J.A. FMC: A one-liner Python program to manage, classify and plot focal mechanisms data. Geophy. Res. Abst. 2014, 16, EGU2014-10887. [Google Scholar]
- Custódio, S.; Dias, N.; Carrilho, F.; Góngora, E.; Rio, I.; Marreiros, C.; Morais, I.; Alves, P.; Matias, L. Earthquakes in western Iberia: Improving the understanding of lithospheric deformation in a slowly deforming region. Geophys. J. Int. 2015, 203, 127–145. [Google Scholar] [CrossRef]


| Date (yy/mm/dd) | Hour (hh:mm) | Long. (°W) | Lat. (°N) | Depth (km) | Res. (s) | Mag. (ML) | Strike | Dip | Rake |
|---|---|---|---|---|---|---|---|---|---|
| 2018/01/15 | 11:51:40.20 | −7.932 | 38.792 | 11.0 | 0.43 | 4.9 | 96.0 | 85.0 | −178.0 |
| Quality (Q_HASH) | Average Misfit | RMS Fault Plane Uncertainty (°) | Station Distribution Ratio | Mechanism Probability (Percent) | N° of Events | % |
|---|---|---|---|---|---|---|
| A | ≤0.15 | ≤25 | ≥0.5 | ≥80 | 51 | 94.44 |
| B | ≤0.20 | ≤35 | ≥0.4 | ≥60 | 3 | 5.56 |
| C | ≤0.30 | ≤45 | ≥0.3 | ≥50 | - | - |
| D | All the rest | |||||
| Total | 54 | 100 | ||||
| N° | Date (yy/mm/dd) | Hour (hh:mm:ss) | Long. (°W) | Lat. (°N) | Depth (km) | Mag. (ML) | Strike (°) | Dip (°) | Rake (°) | Ref. |
|---|---|---|---|---|---|---|---|---|---|---|
| 1 | 1987/06/04 | - | −8.1 | 38.5 | 0 | 4.4 | 262 | 84 | −162 | MOR |
| 2 | 1997/01/19 | - | −7.8 | 38.7 | 13 | 3.2 | 100.7 | 58.8 | 165.2 | BOR |
| 3 | 1998/07/31 | - | −7.9 | 38.8 | 5 | 4.0 | 95 | 70 | 180 | BOR |
| 4 | 2002/03/20 | - | −8.2 | 38.7 | 12.5 | 3.7 | 284 | 41 | −149 | BOR |
| 5 | 2005/12/29 | 04:25 | −8.230 | 38.880 | 10.0 | 3.5 | 196 | 83 | 22 | CUS |
| 6 | 2010/03/27 | 13:37 | −7.613 | 38.970 | 14.0 | 4.1 | 190 | 80 | 5 | CUS |
| 7 | 2012/12/13 | 13:54:08.54 | −7.63 | 38.72 | 15.2 | 2.7 | 162 | 48 | 43 | MAT |
| 8 | 2011/11/01 | 18:23:41.48 | −8.26 | 38.86 | 8.8 | 2.0 | 86 | 90 | −164 | MAT |
| 9 | 2011/12/19 | 16:45:20.28 | −7.98 | 38.78 | 12.8 | 2.0 | 89 | 66 | 120 | MAT |
| 10 | 2012/05/28 | 14:37:14.84 | −8.01 | 38.74 | 19.8 | 1.8 | 13 | 85 | −20 | MAT |
| 11 | 2011/09/22 | 17:42:30.45 | −8.23 | 38.89 | 23.3 | 1.5 | 19 | 54 | −21 | MAT |
Disclaimer/Publisher’s Note: The statements, opinions and data contained in all publications are solely those of the individual author(s) and contributor(s) and not of MDPI and/or the editor(s). MDPI and/or the editor(s) disclaim responsibility for any injury to people or property resulting from any ideas, methods, instructions or products referred to in the content. |
© 2023 by the authors. Licensee MDPI, Basel, Switzerland. This article is an open access article distributed under the terms and conditions of the Creative Commons Attribution (CC BY) license (https://creativecommons.org/licenses/by/4.0/).
Share and Cite
Wachilala, P.; Borges, J.; Caldeira, B.; Bezzeghoud, M. Seismic Sequence Analysis of the Arraiolos Zone, South Portugal, and Its Seismotectonic Implications: A Detailed Analysis of the Period 15 January–30 June 2018. Remote Sens. 2023, 15, 4494. https://0-doi-org.brum.beds.ac.uk/10.3390/rs15184494
Wachilala P, Borges J, Caldeira B, Bezzeghoud M. Seismic Sequence Analysis of the Arraiolos Zone, South Portugal, and Its Seismotectonic Implications: A Detailed Analysis of the Period 15 January–30 June 2018. Remote Sensing. 2023; 15(18):4494. https://0-doi-org.brum.beds.ac.uk/10.3390/rs15184494
Chicago/Turabian StyleWachilala, Piedade, José Borges, Bento Caldeira, and Mourad Bezzeghoud. 2023. "Seismic Sequence Analysis of the Arraiolos Zone, South Portugal, and Its Seismotectonic Implications: A Detailed Analysis of the Period 15 January–30 June 2018" Remote Sensing 15, no. 18: 4494. https://0-doi-org.brum.beds.ac.uk/10.3390/rs15184494