

Source Parameter Inversion and Century-Scale Stress Triggering Analysis of the 2021 Maduo MW7.4 Earthquake Using GNSS and InSAR Displacement Fields
Abstract
:1. Introduction
2. Materials and Methods
2.1. Co-Seismic Slip Parameters of Historically Strong Earthquakes
2.2. Fault Parameter
2.3. Inversion Data
2.4. Crustal Structure Model
2.5. Method of Co-Seismic Slip Distribution Inversion
2.6. Method of Stress Calculation
3. Results
3.1. Co-Seismic Slip Distribution Inversion Calculation
3.2. Stress Calculation
3.2.1. Co-Seismic Coulomb Stress
3.2.2. Post-Seismic Coulomb Stress
3.2.3. Inter-Seismic Coulomb Stress
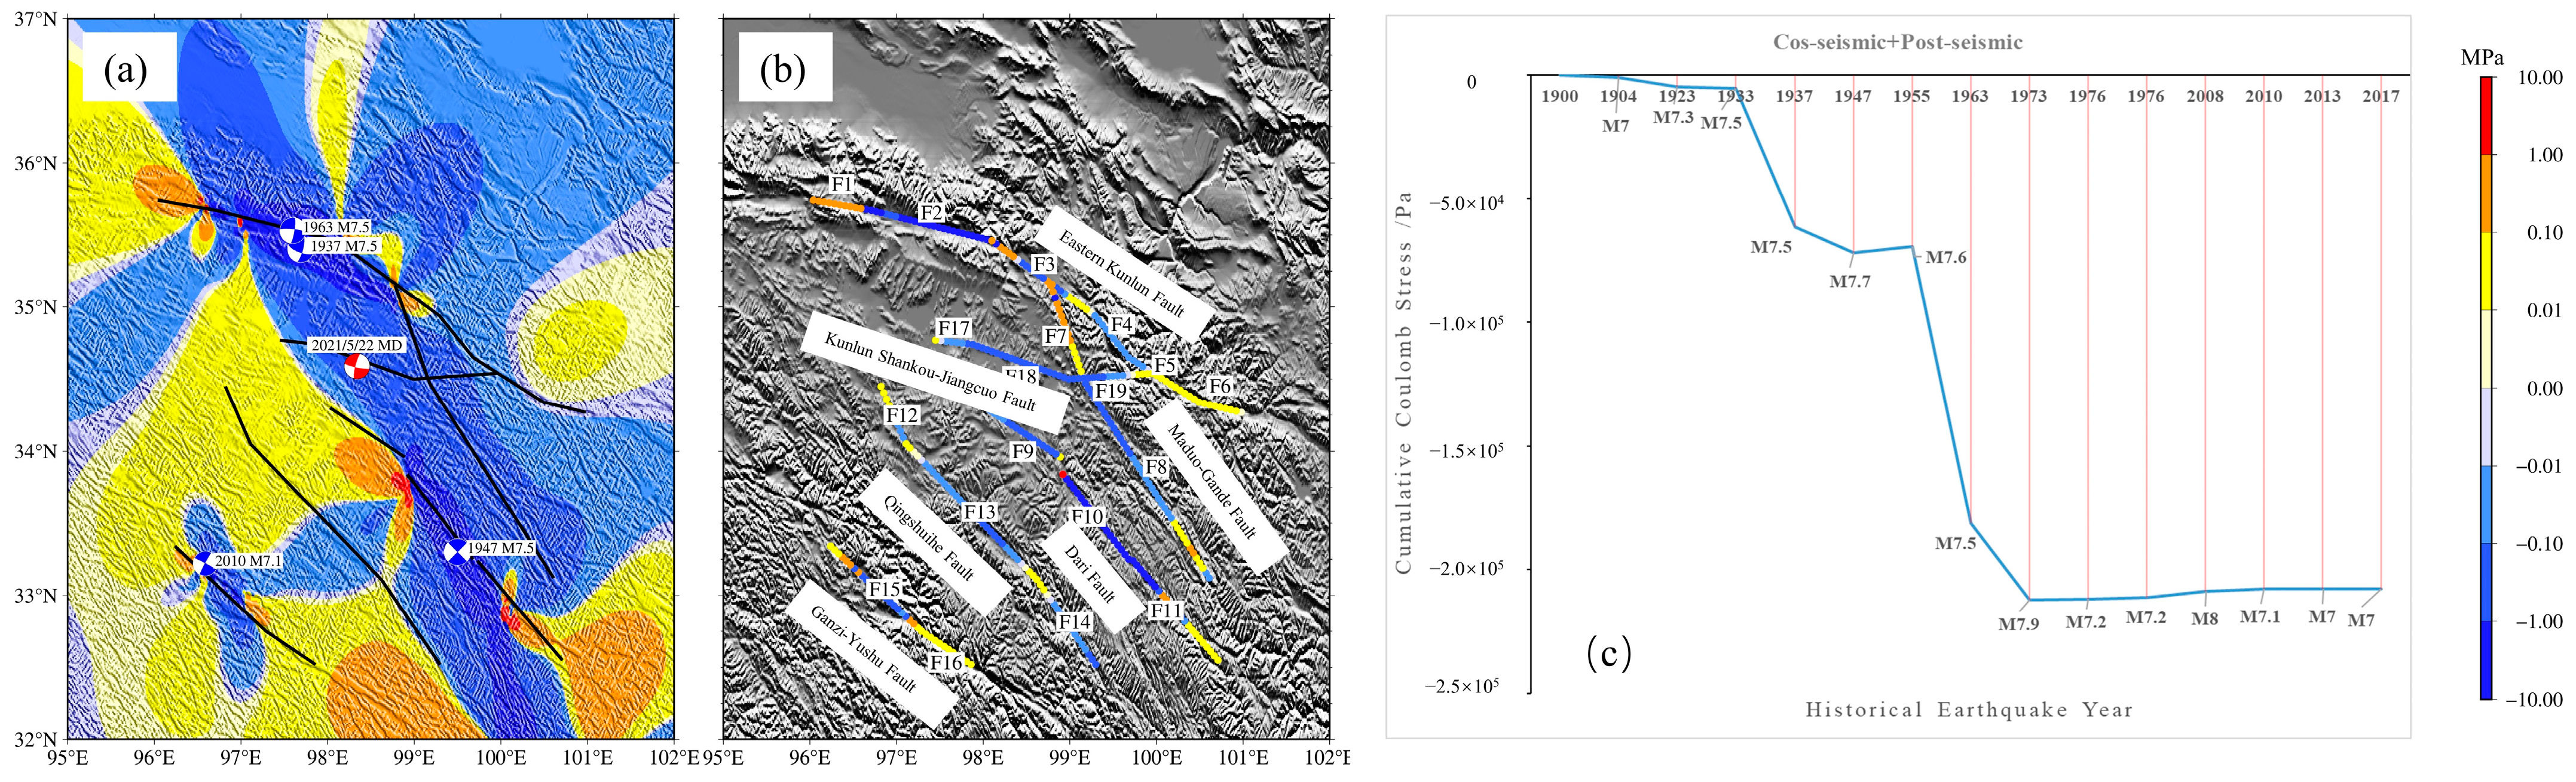
3.2.4. Change of Cumulative Coulomb Stress
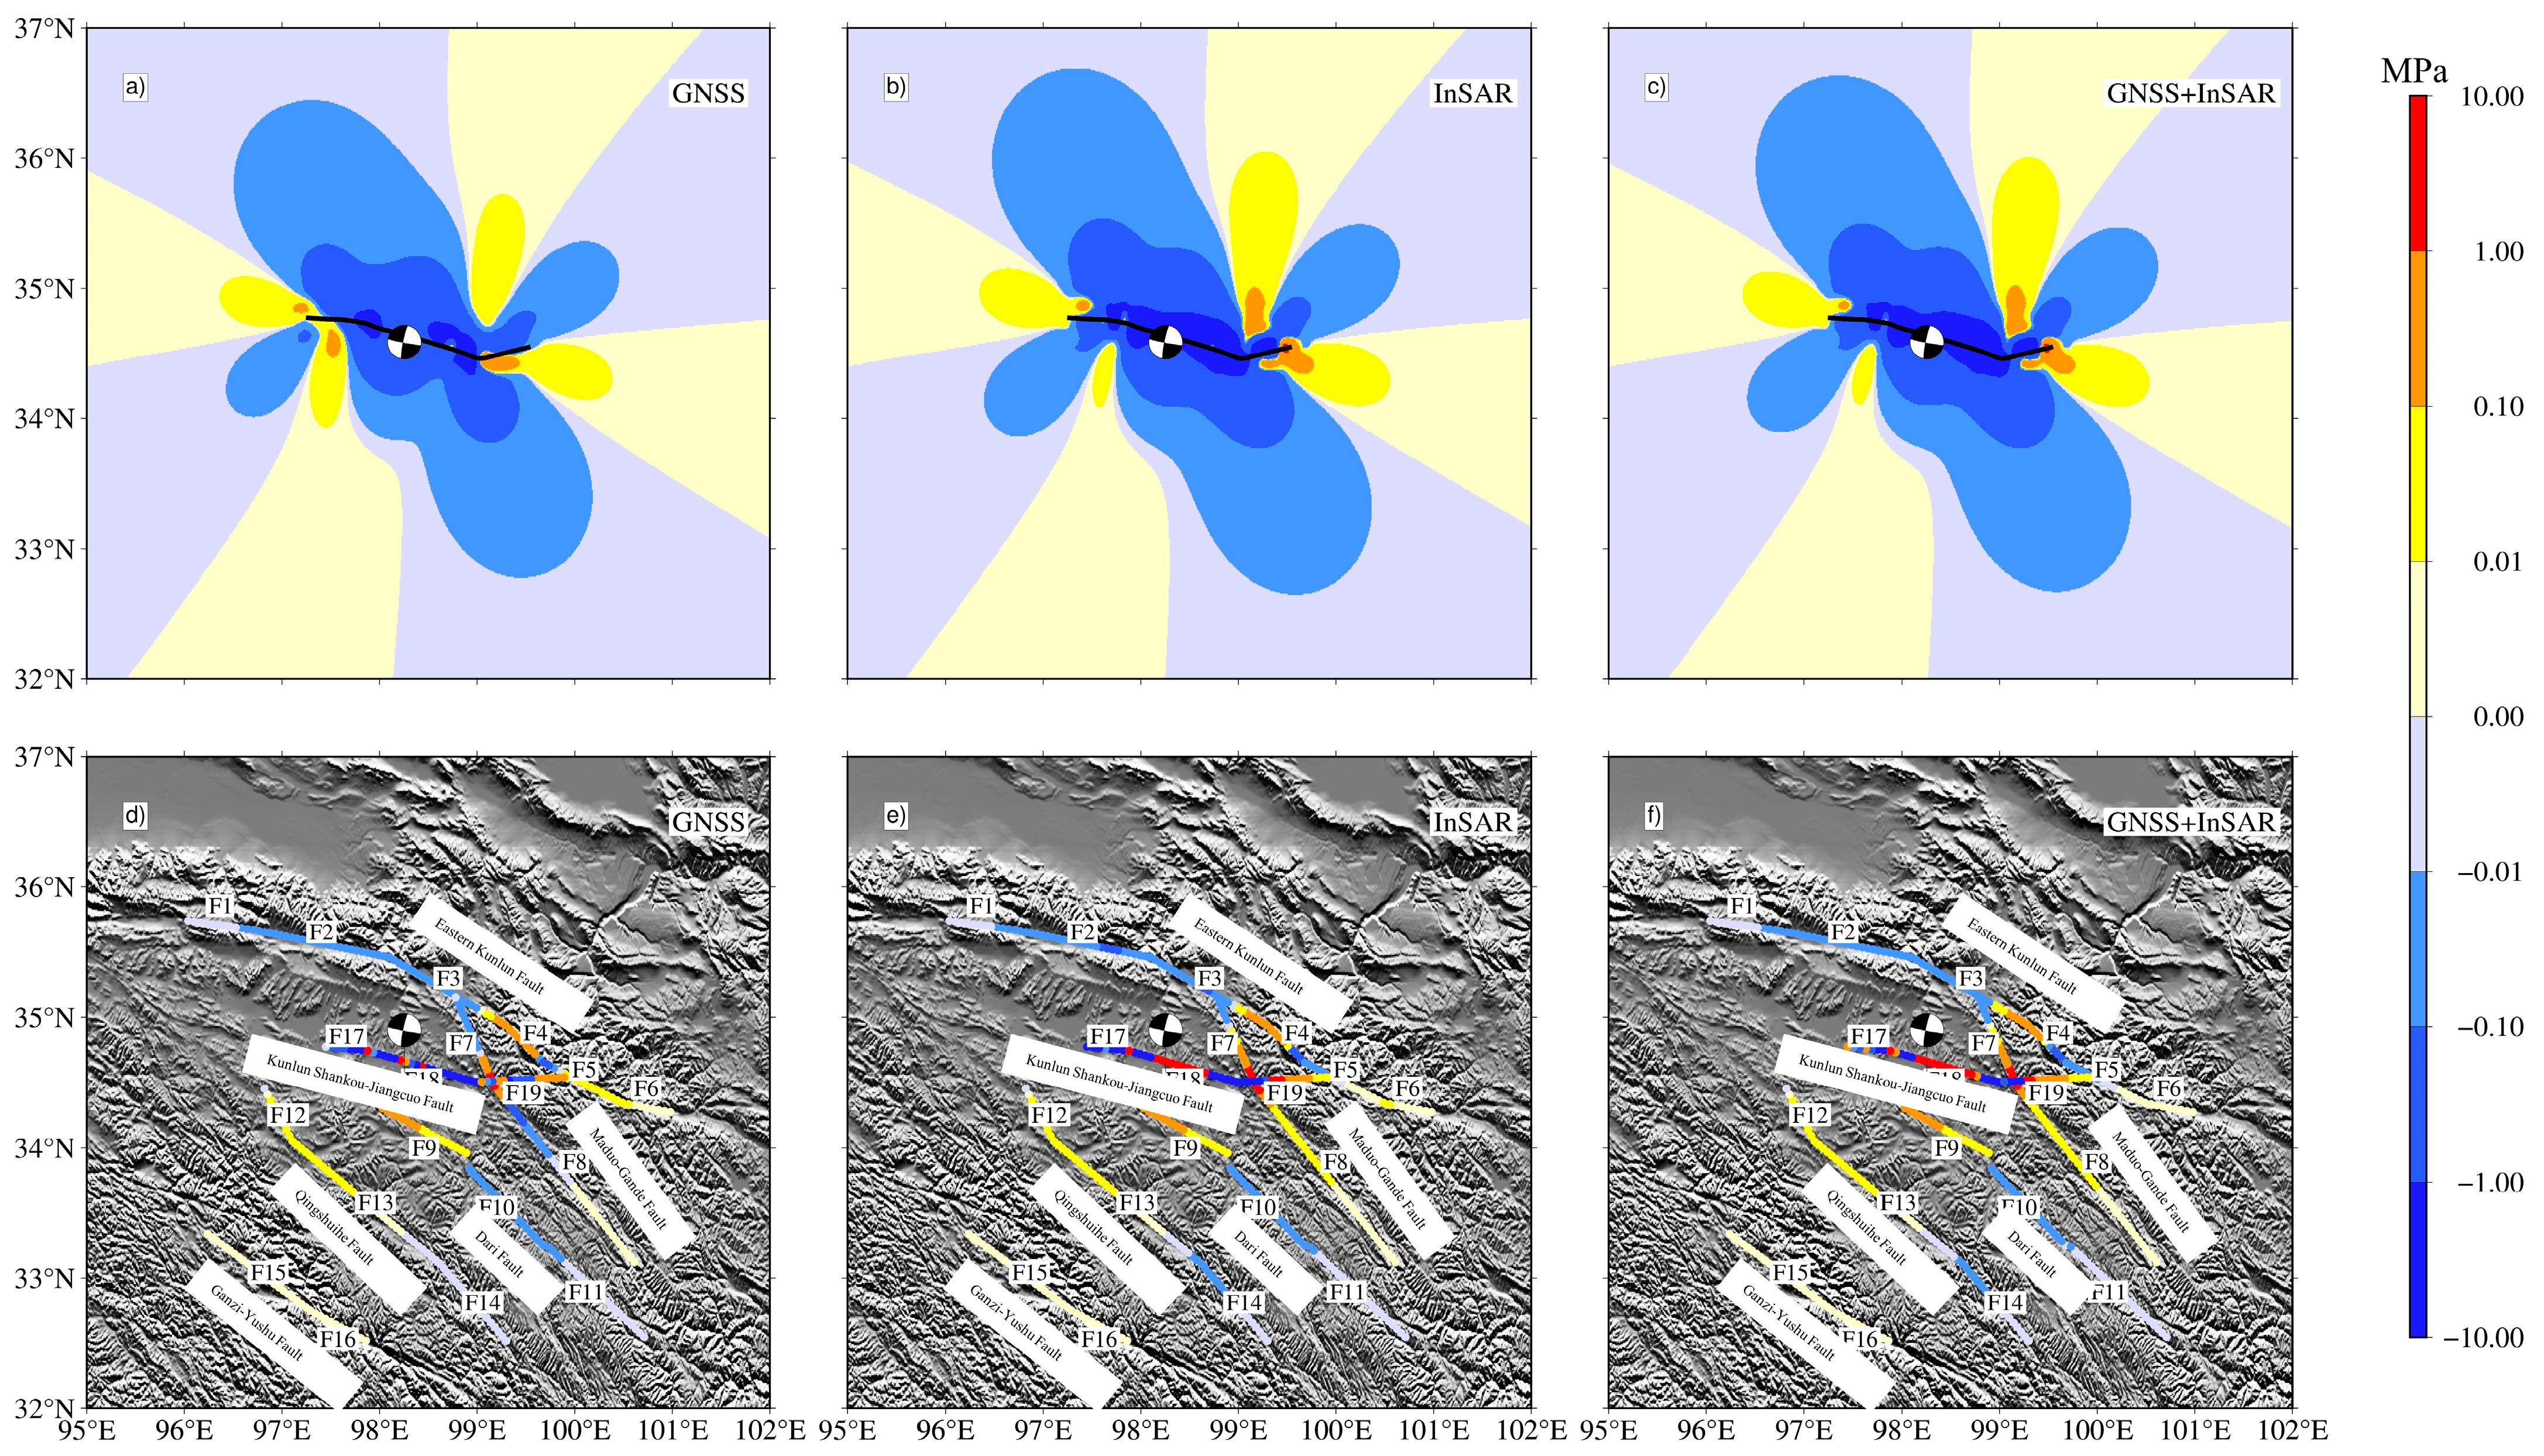
3.2.5. Impact of the 2021 Maduo Earthquake
4. Discussion
5. Conclusions
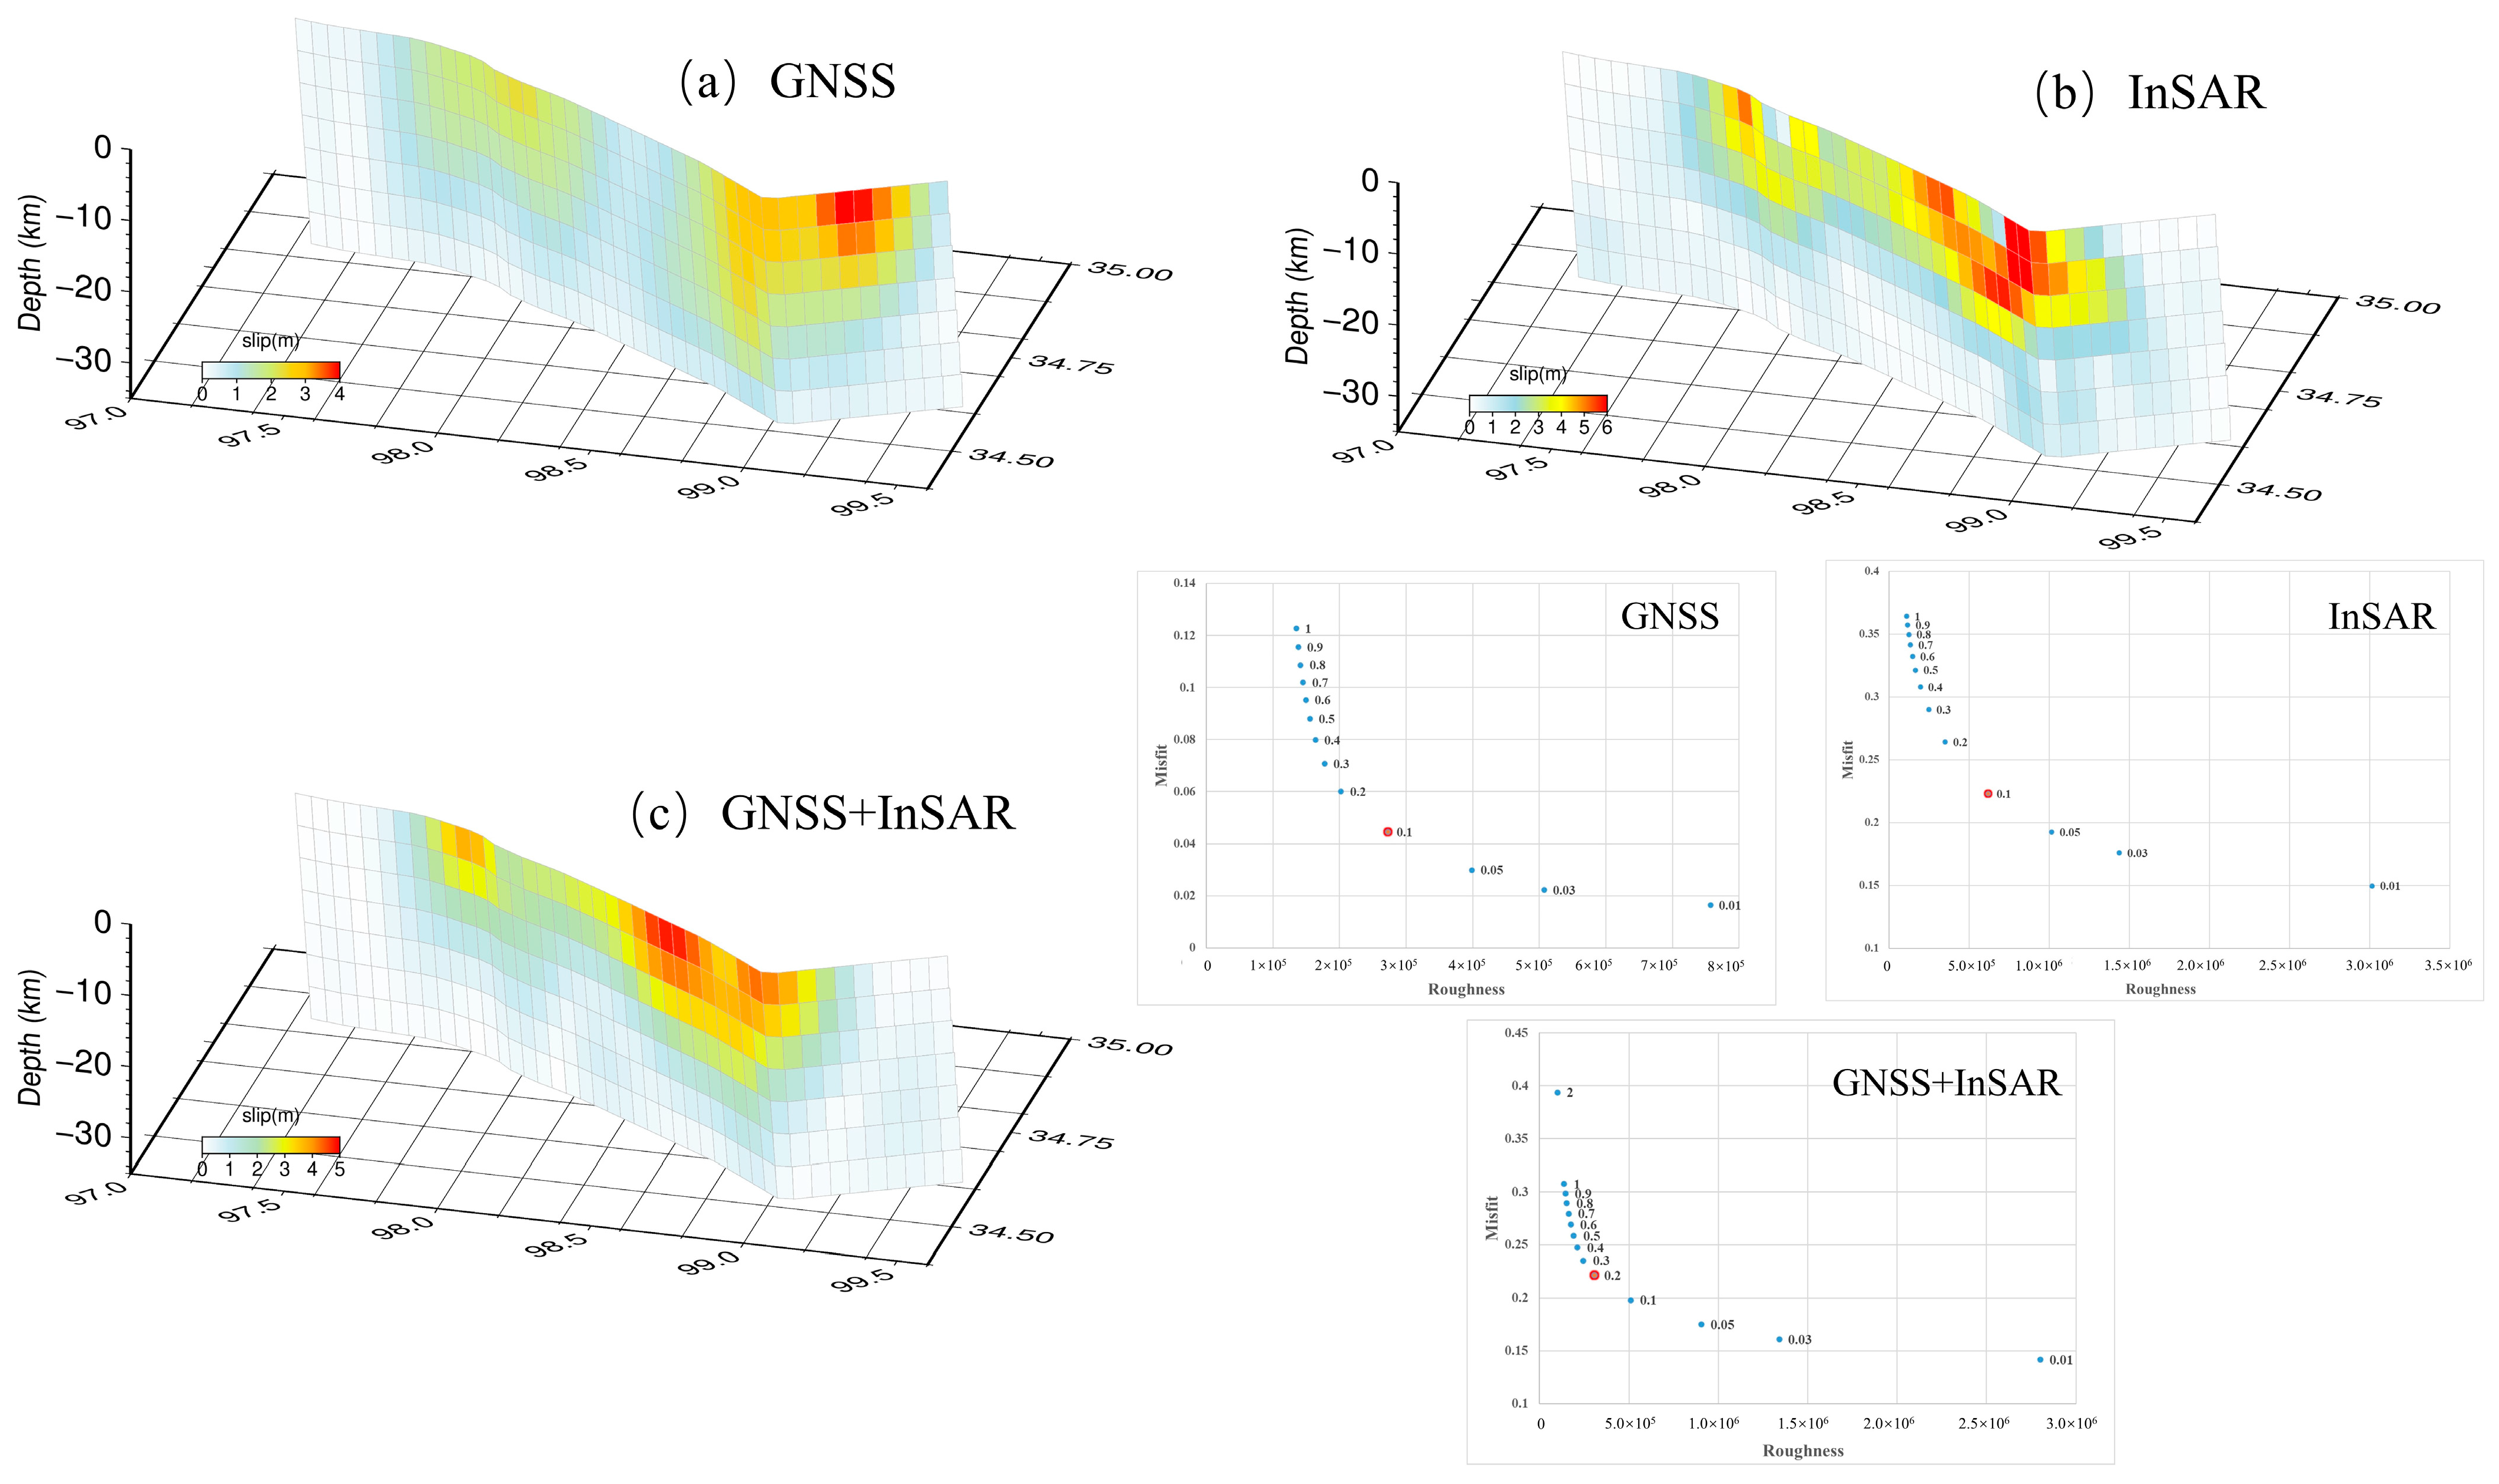
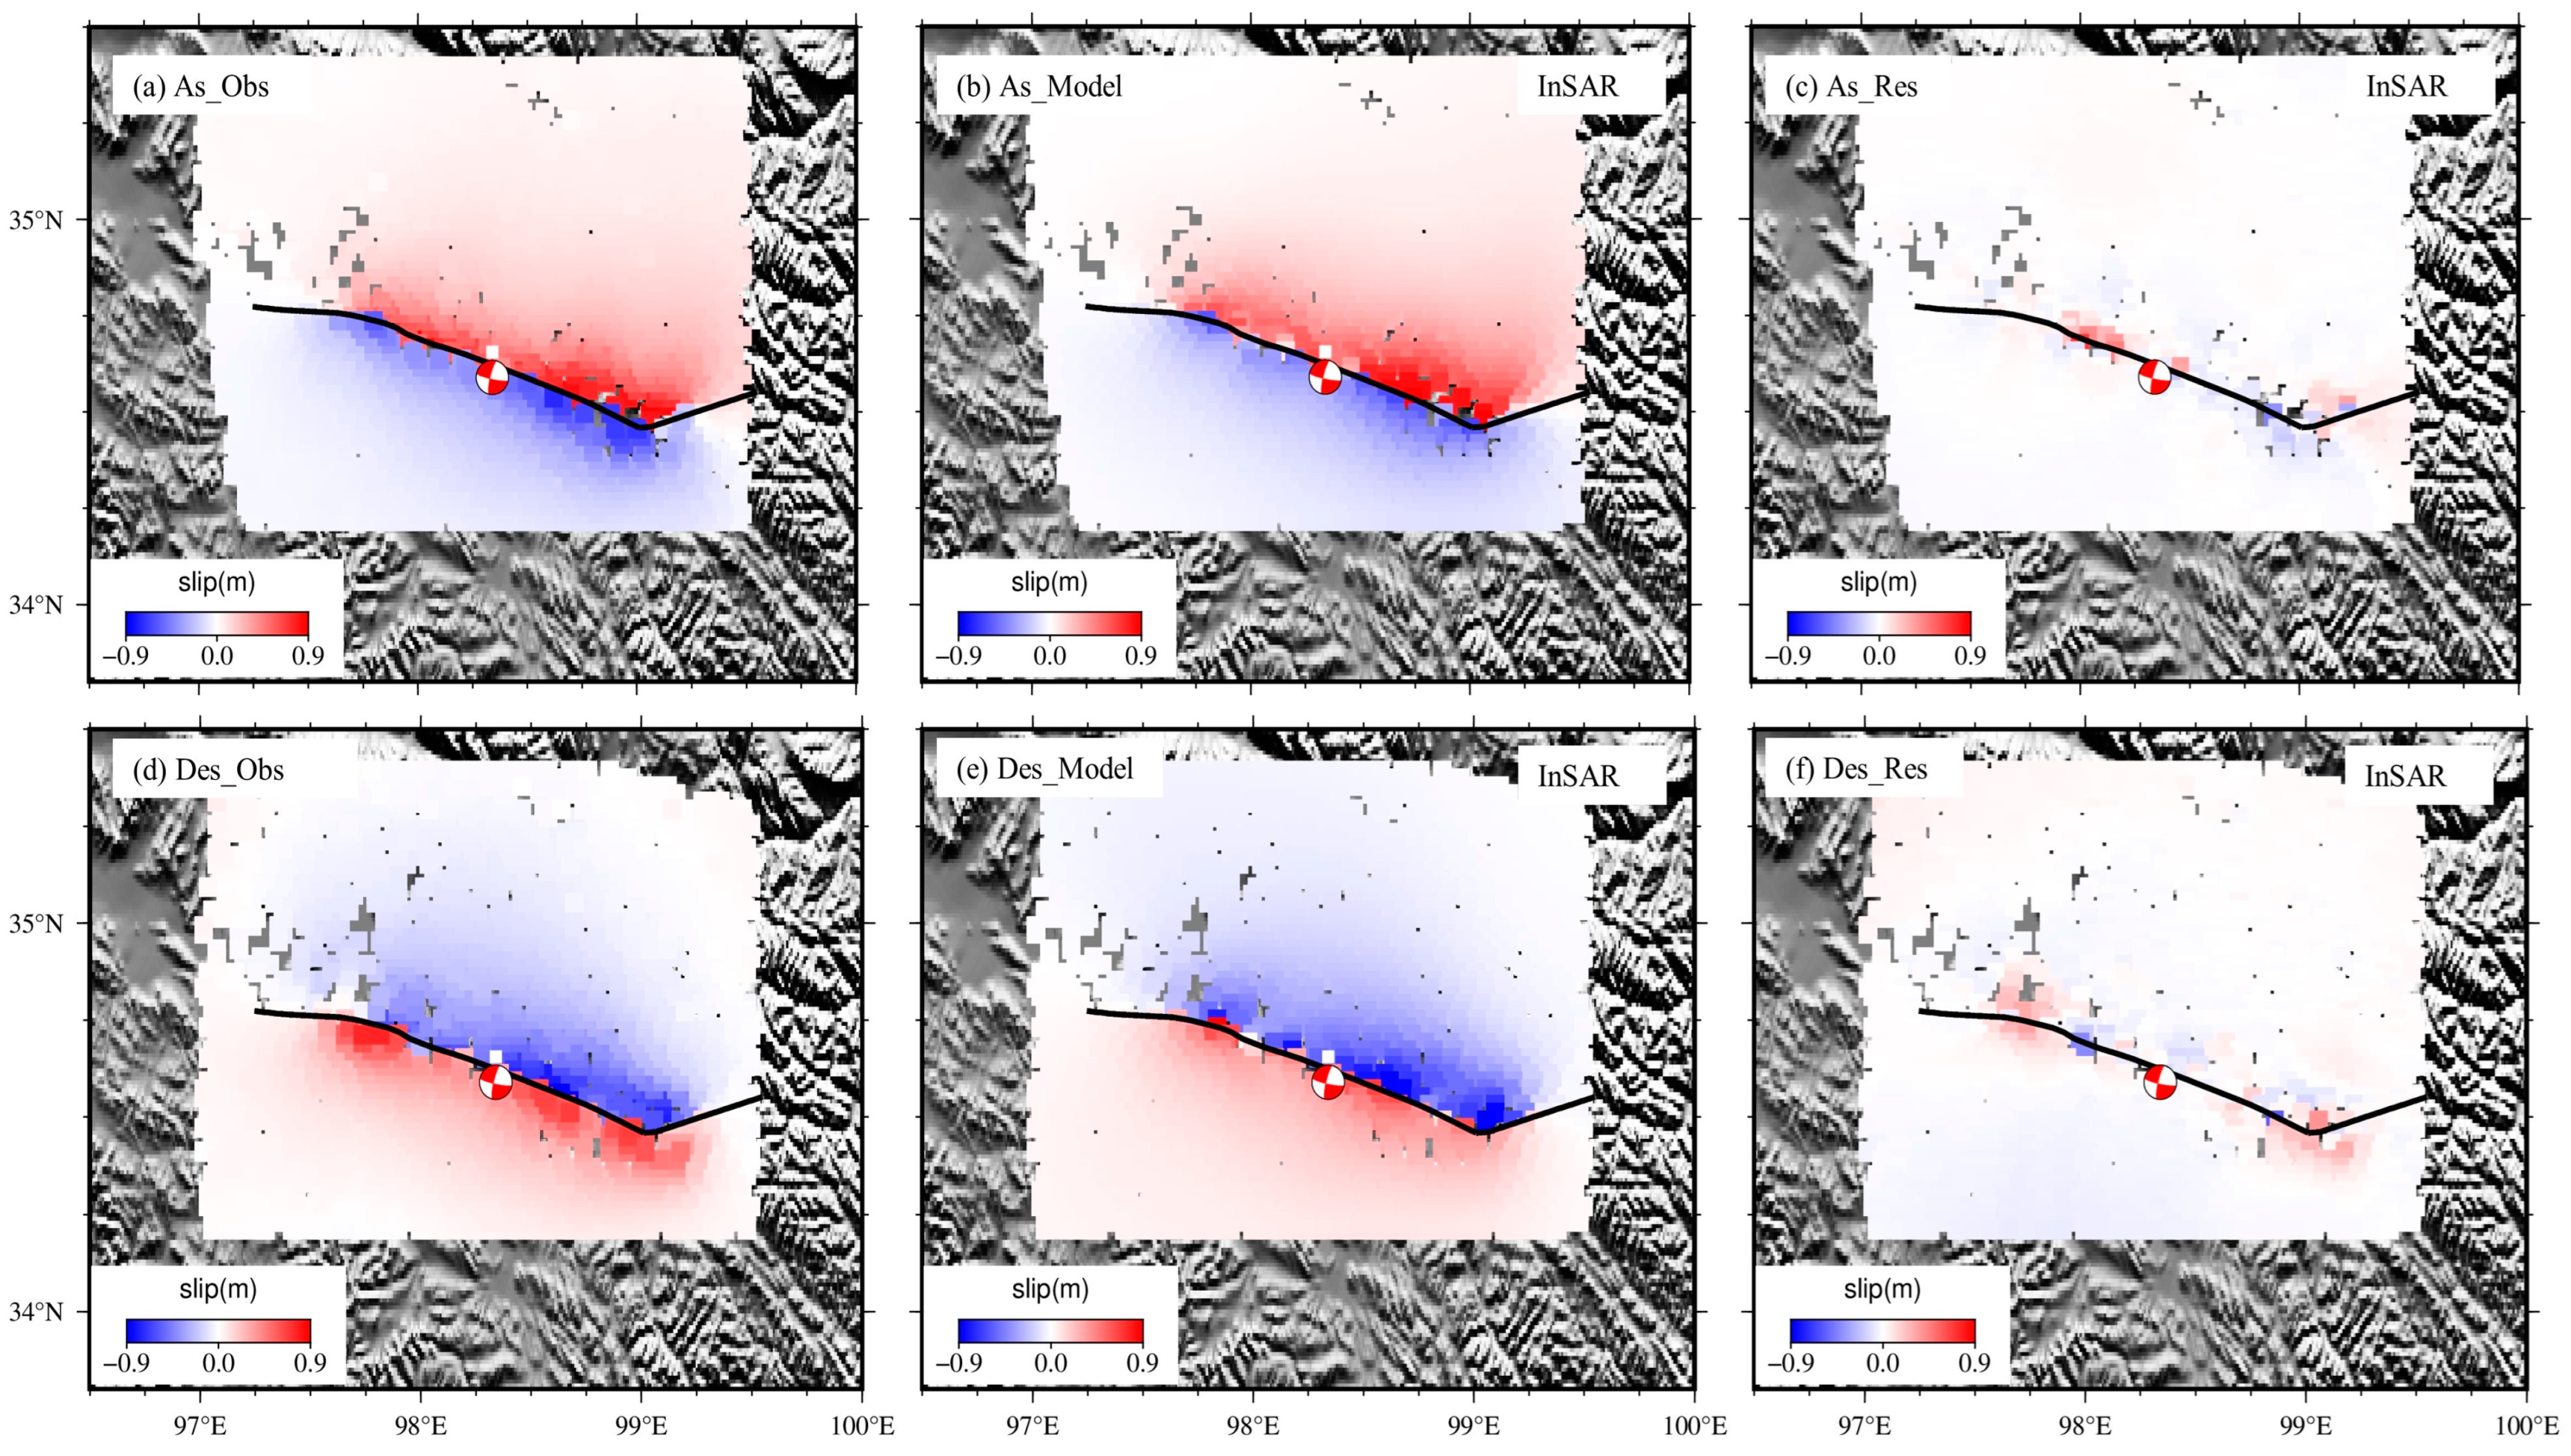
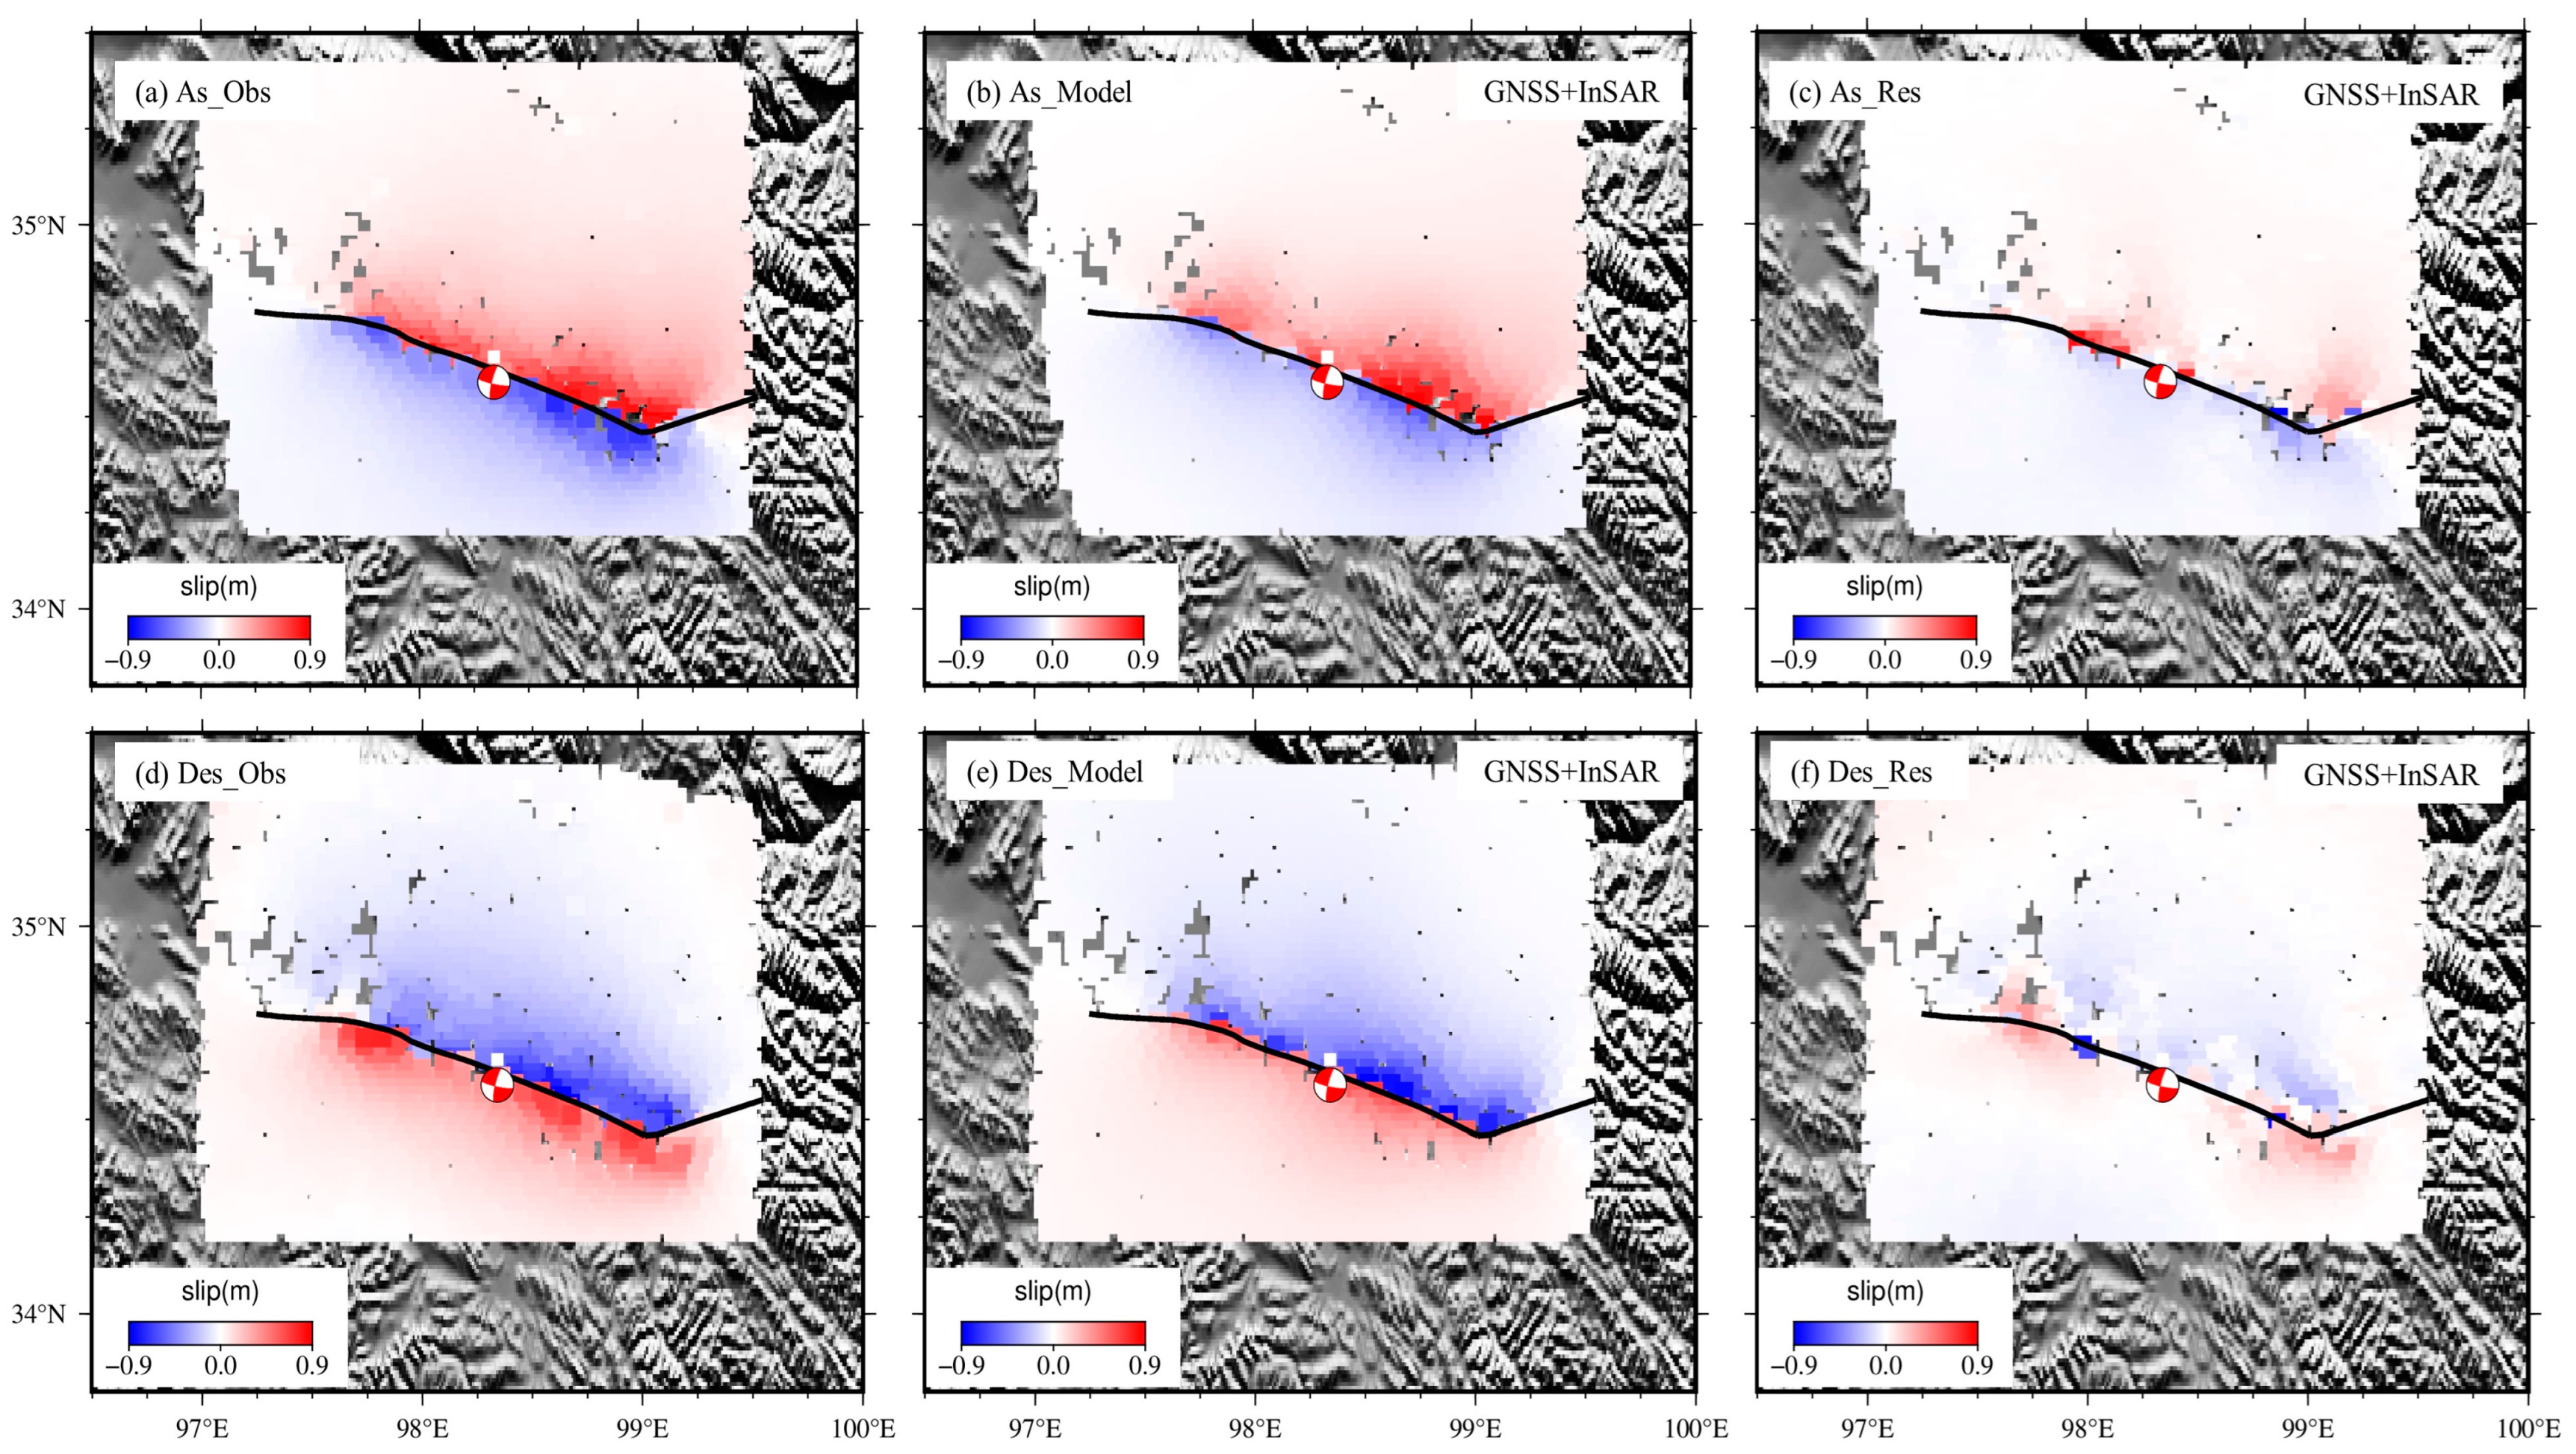
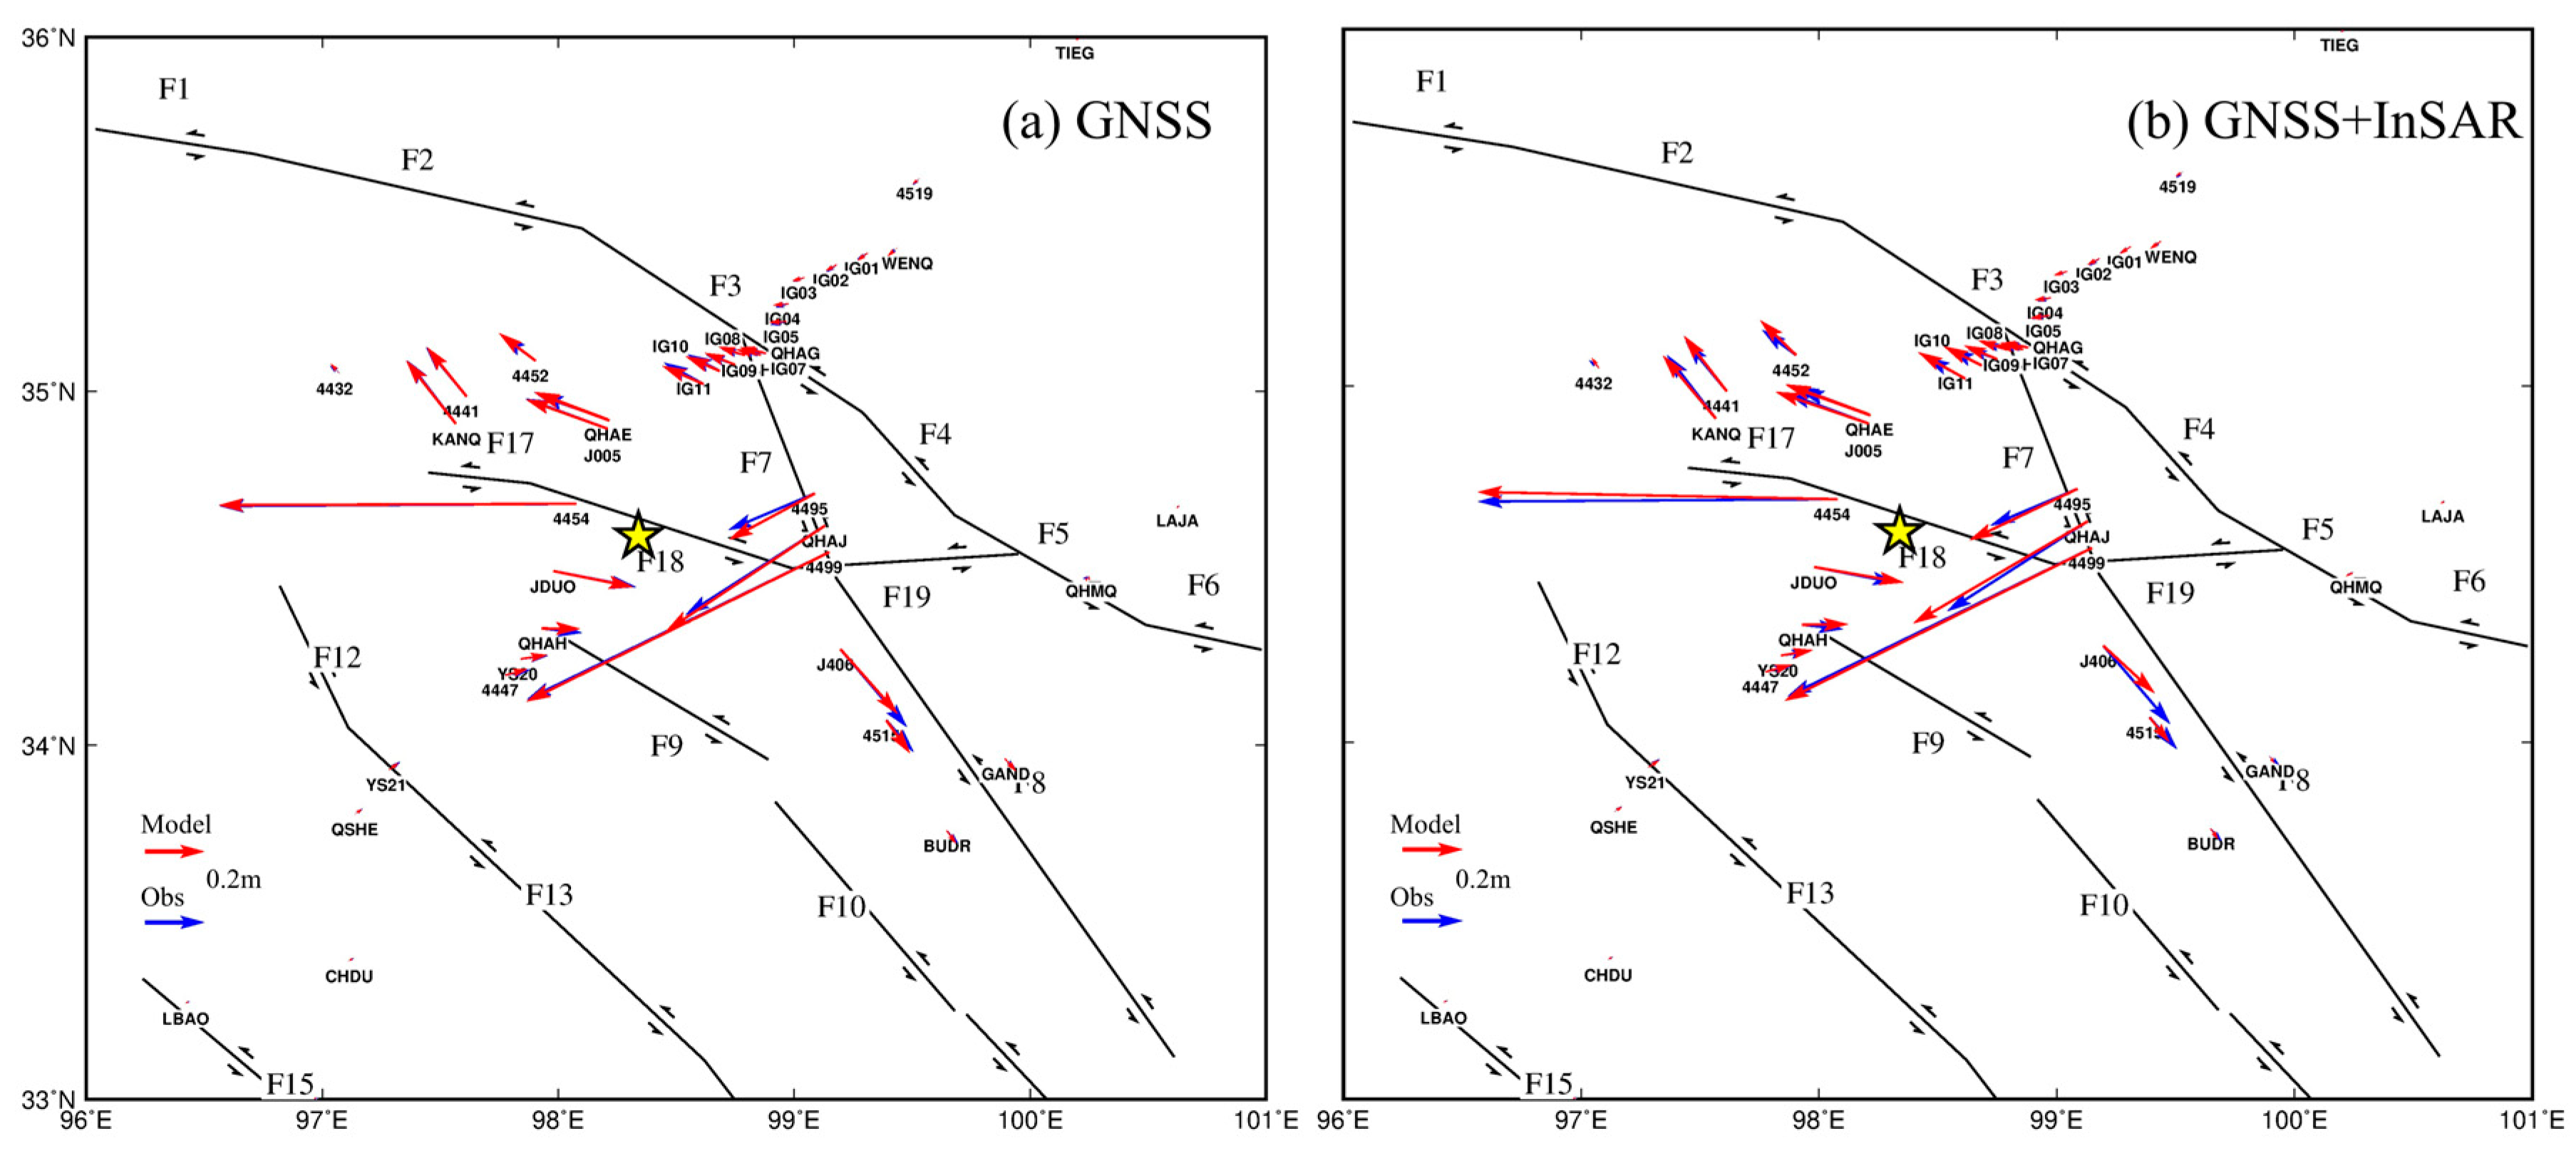
- Based on D-InSAR technology, the InSAR co-seismic deformation field of the Maduo MW7.4 earthquake on 22 May 2021 is obtained using European Space Agency (ESA) ascending and descending SAR data. The maximum LOS deformation is approximately 0.9 m. The maximum slips obtained through independent and joint inversions of GNSS, InSAR, and GNSS + InSAR are measured at 3.98 m, 6.00 m, and 4.79 m, corresponding to inversion moment magnitudes of MW7.47, MW7.54, and MW7.47, respectively. The joint inversion of GNSS and InSAR data results in a slip model with a maximum slip of 4.79 m, mainly concentrated in the Dongcao Along Lake section (~98.6°E). The joint inversion can effectively leverage the advantages of different data sources and accurately reflect the slip characteristics of the Maduo earthquake fault surface [63,64].
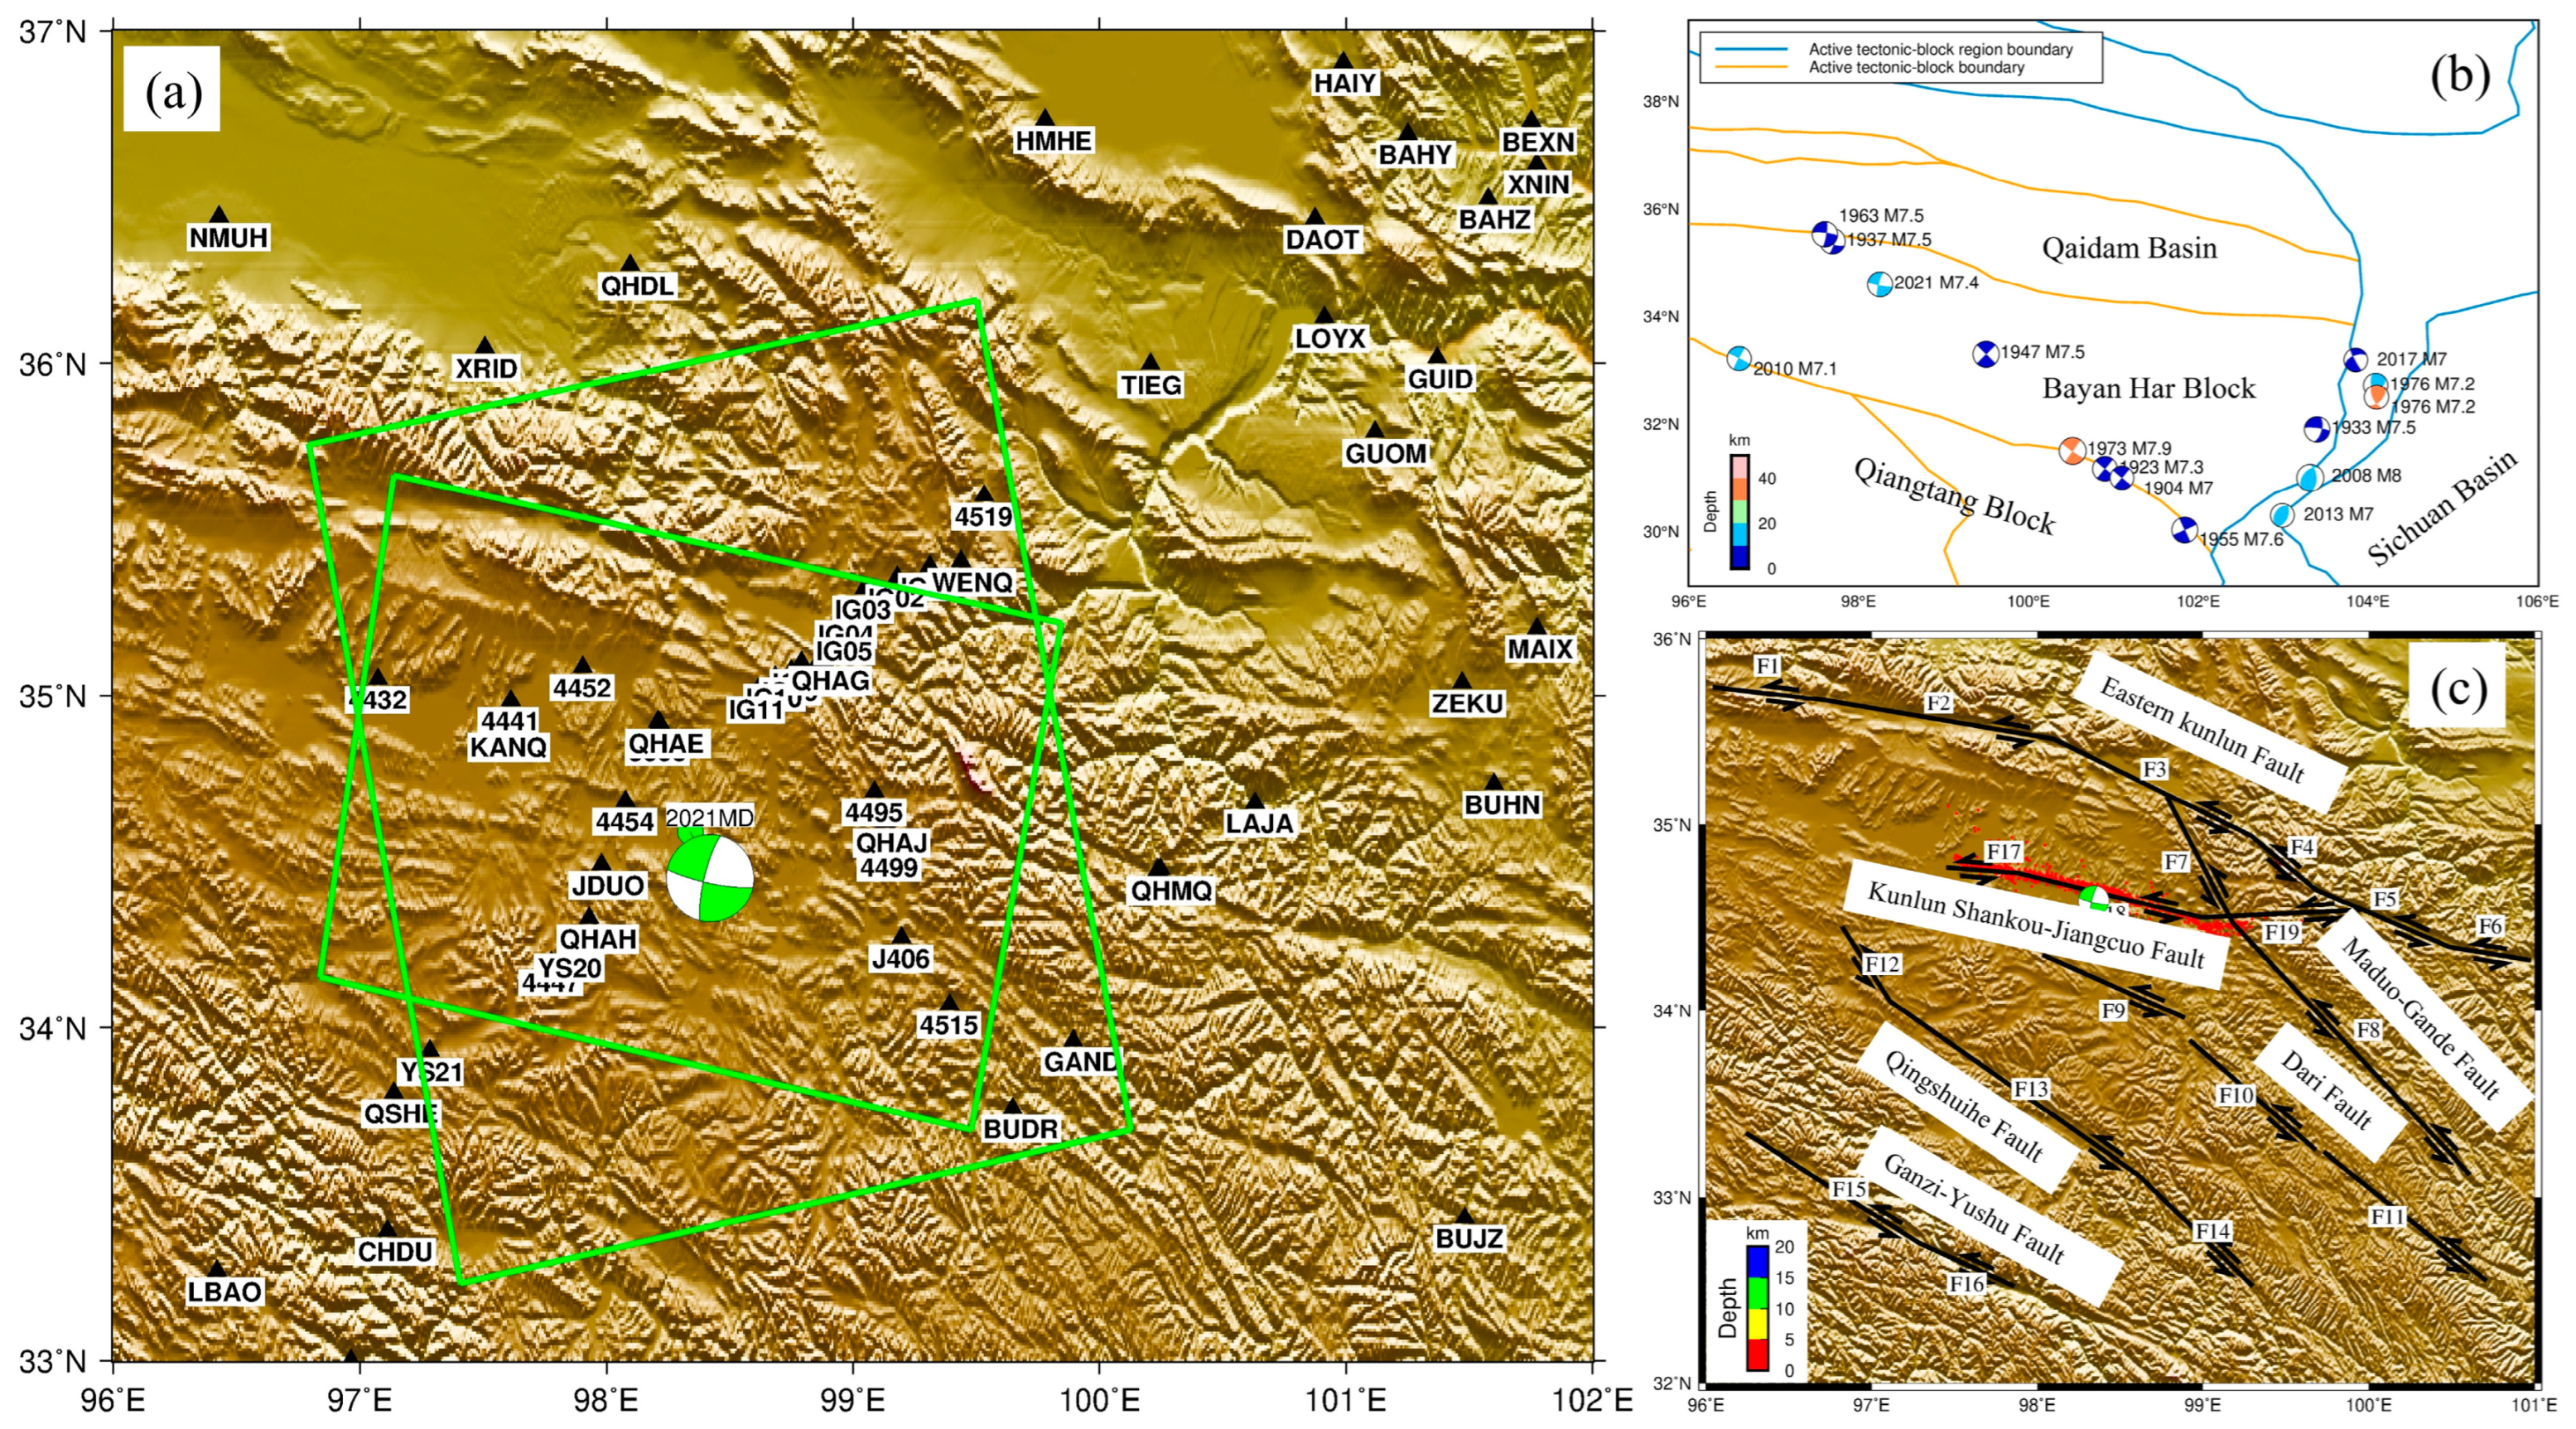
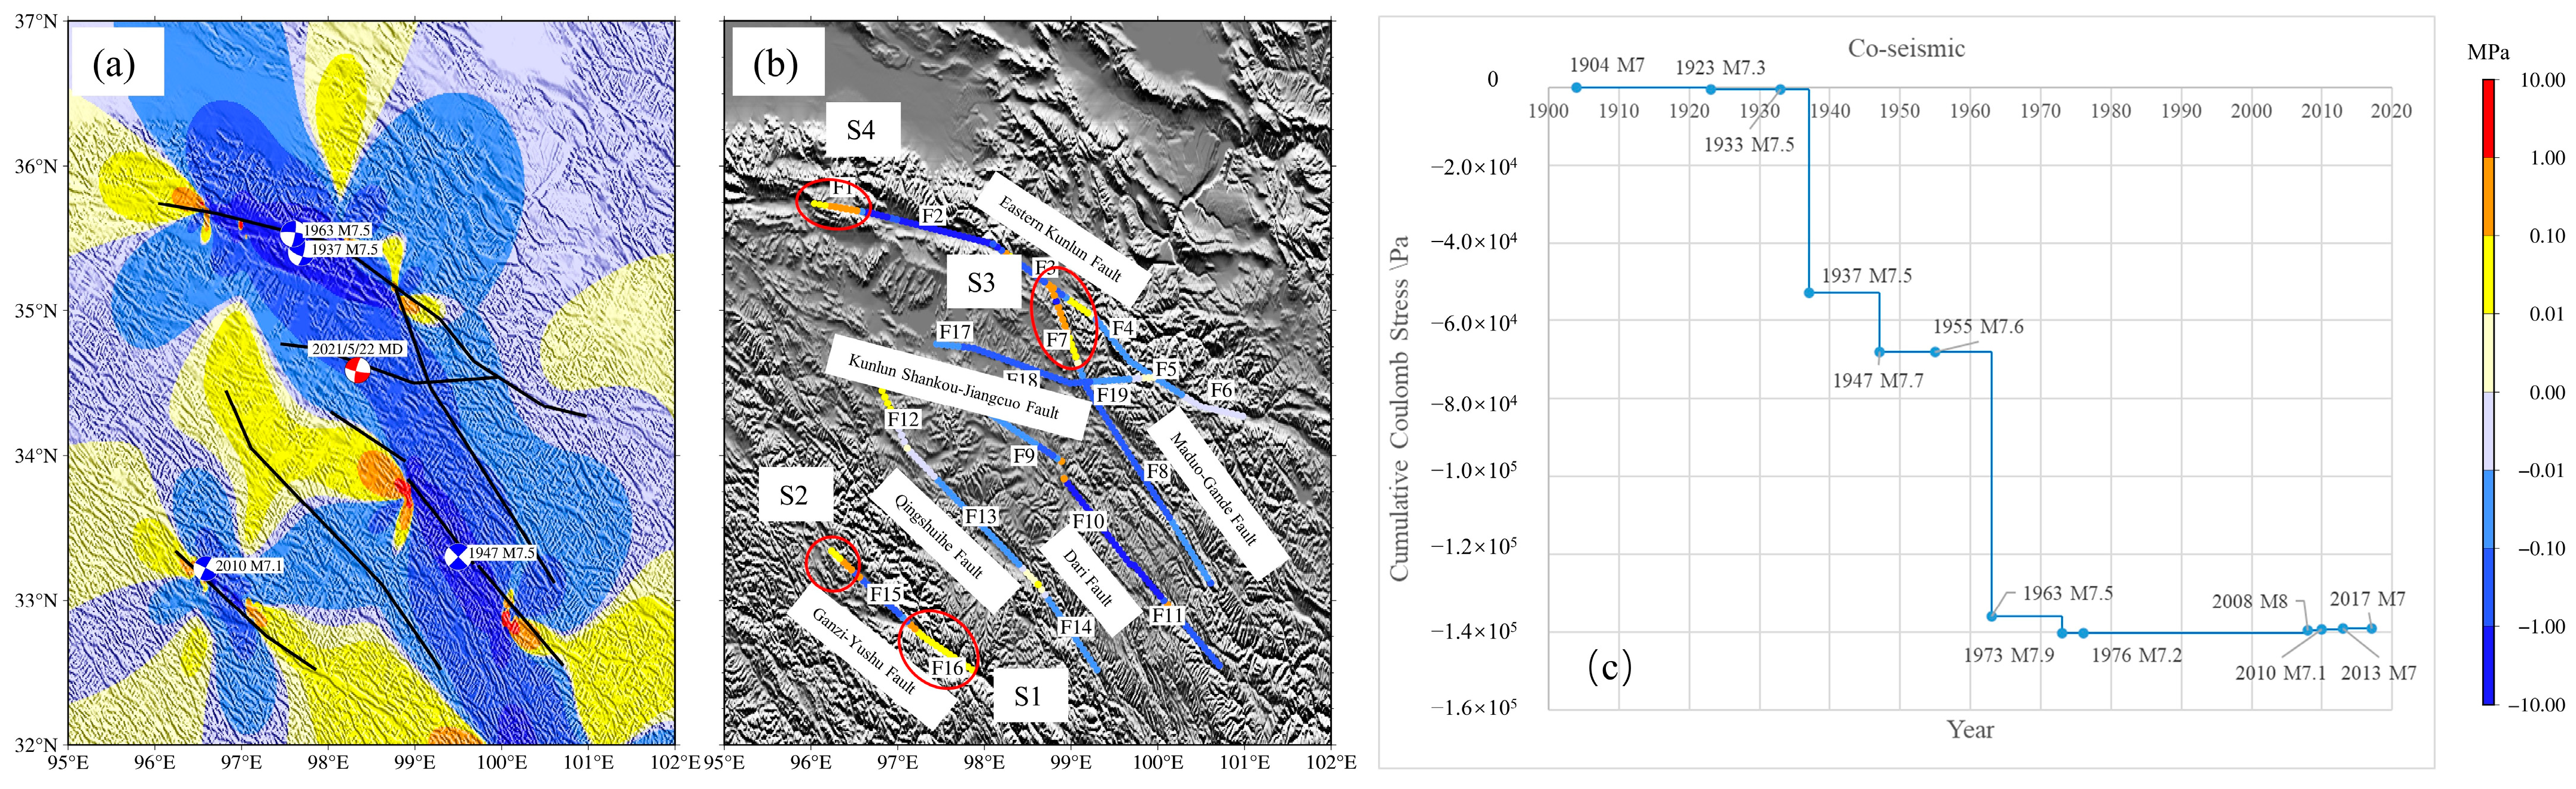
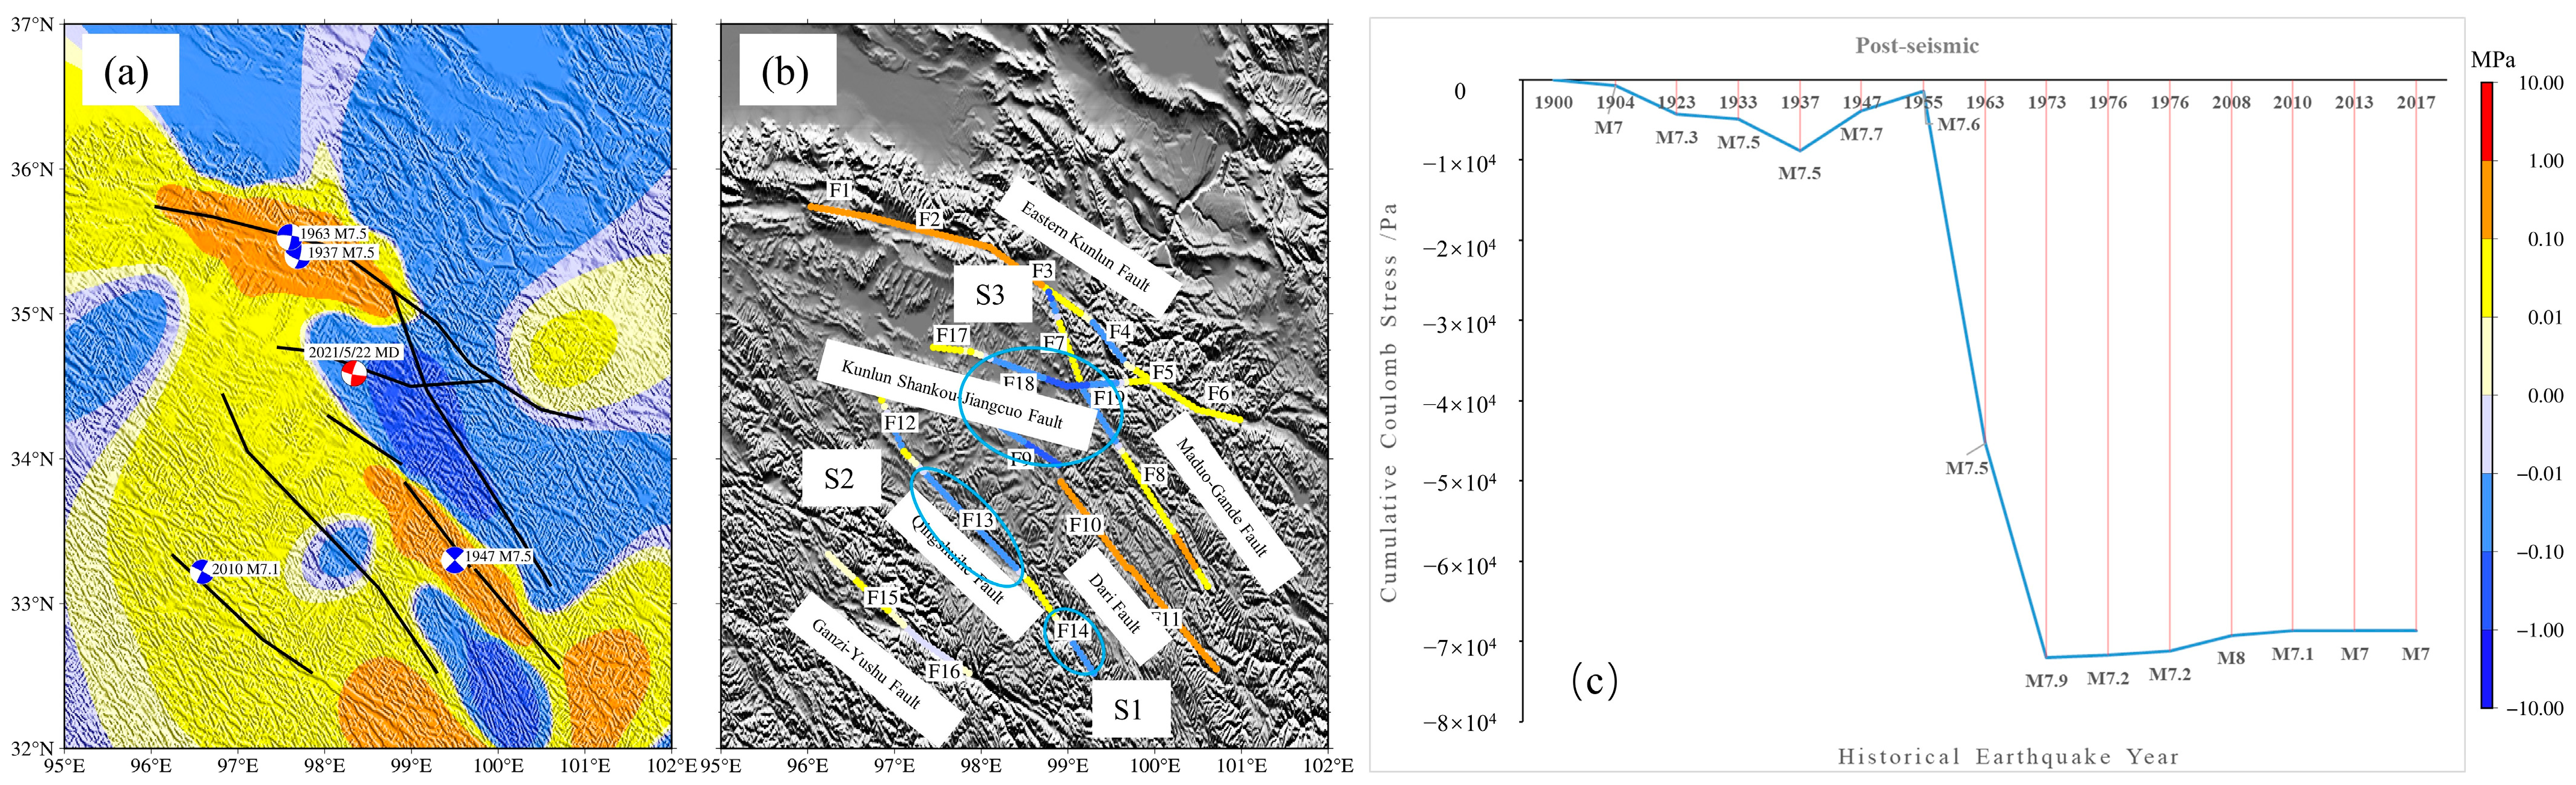
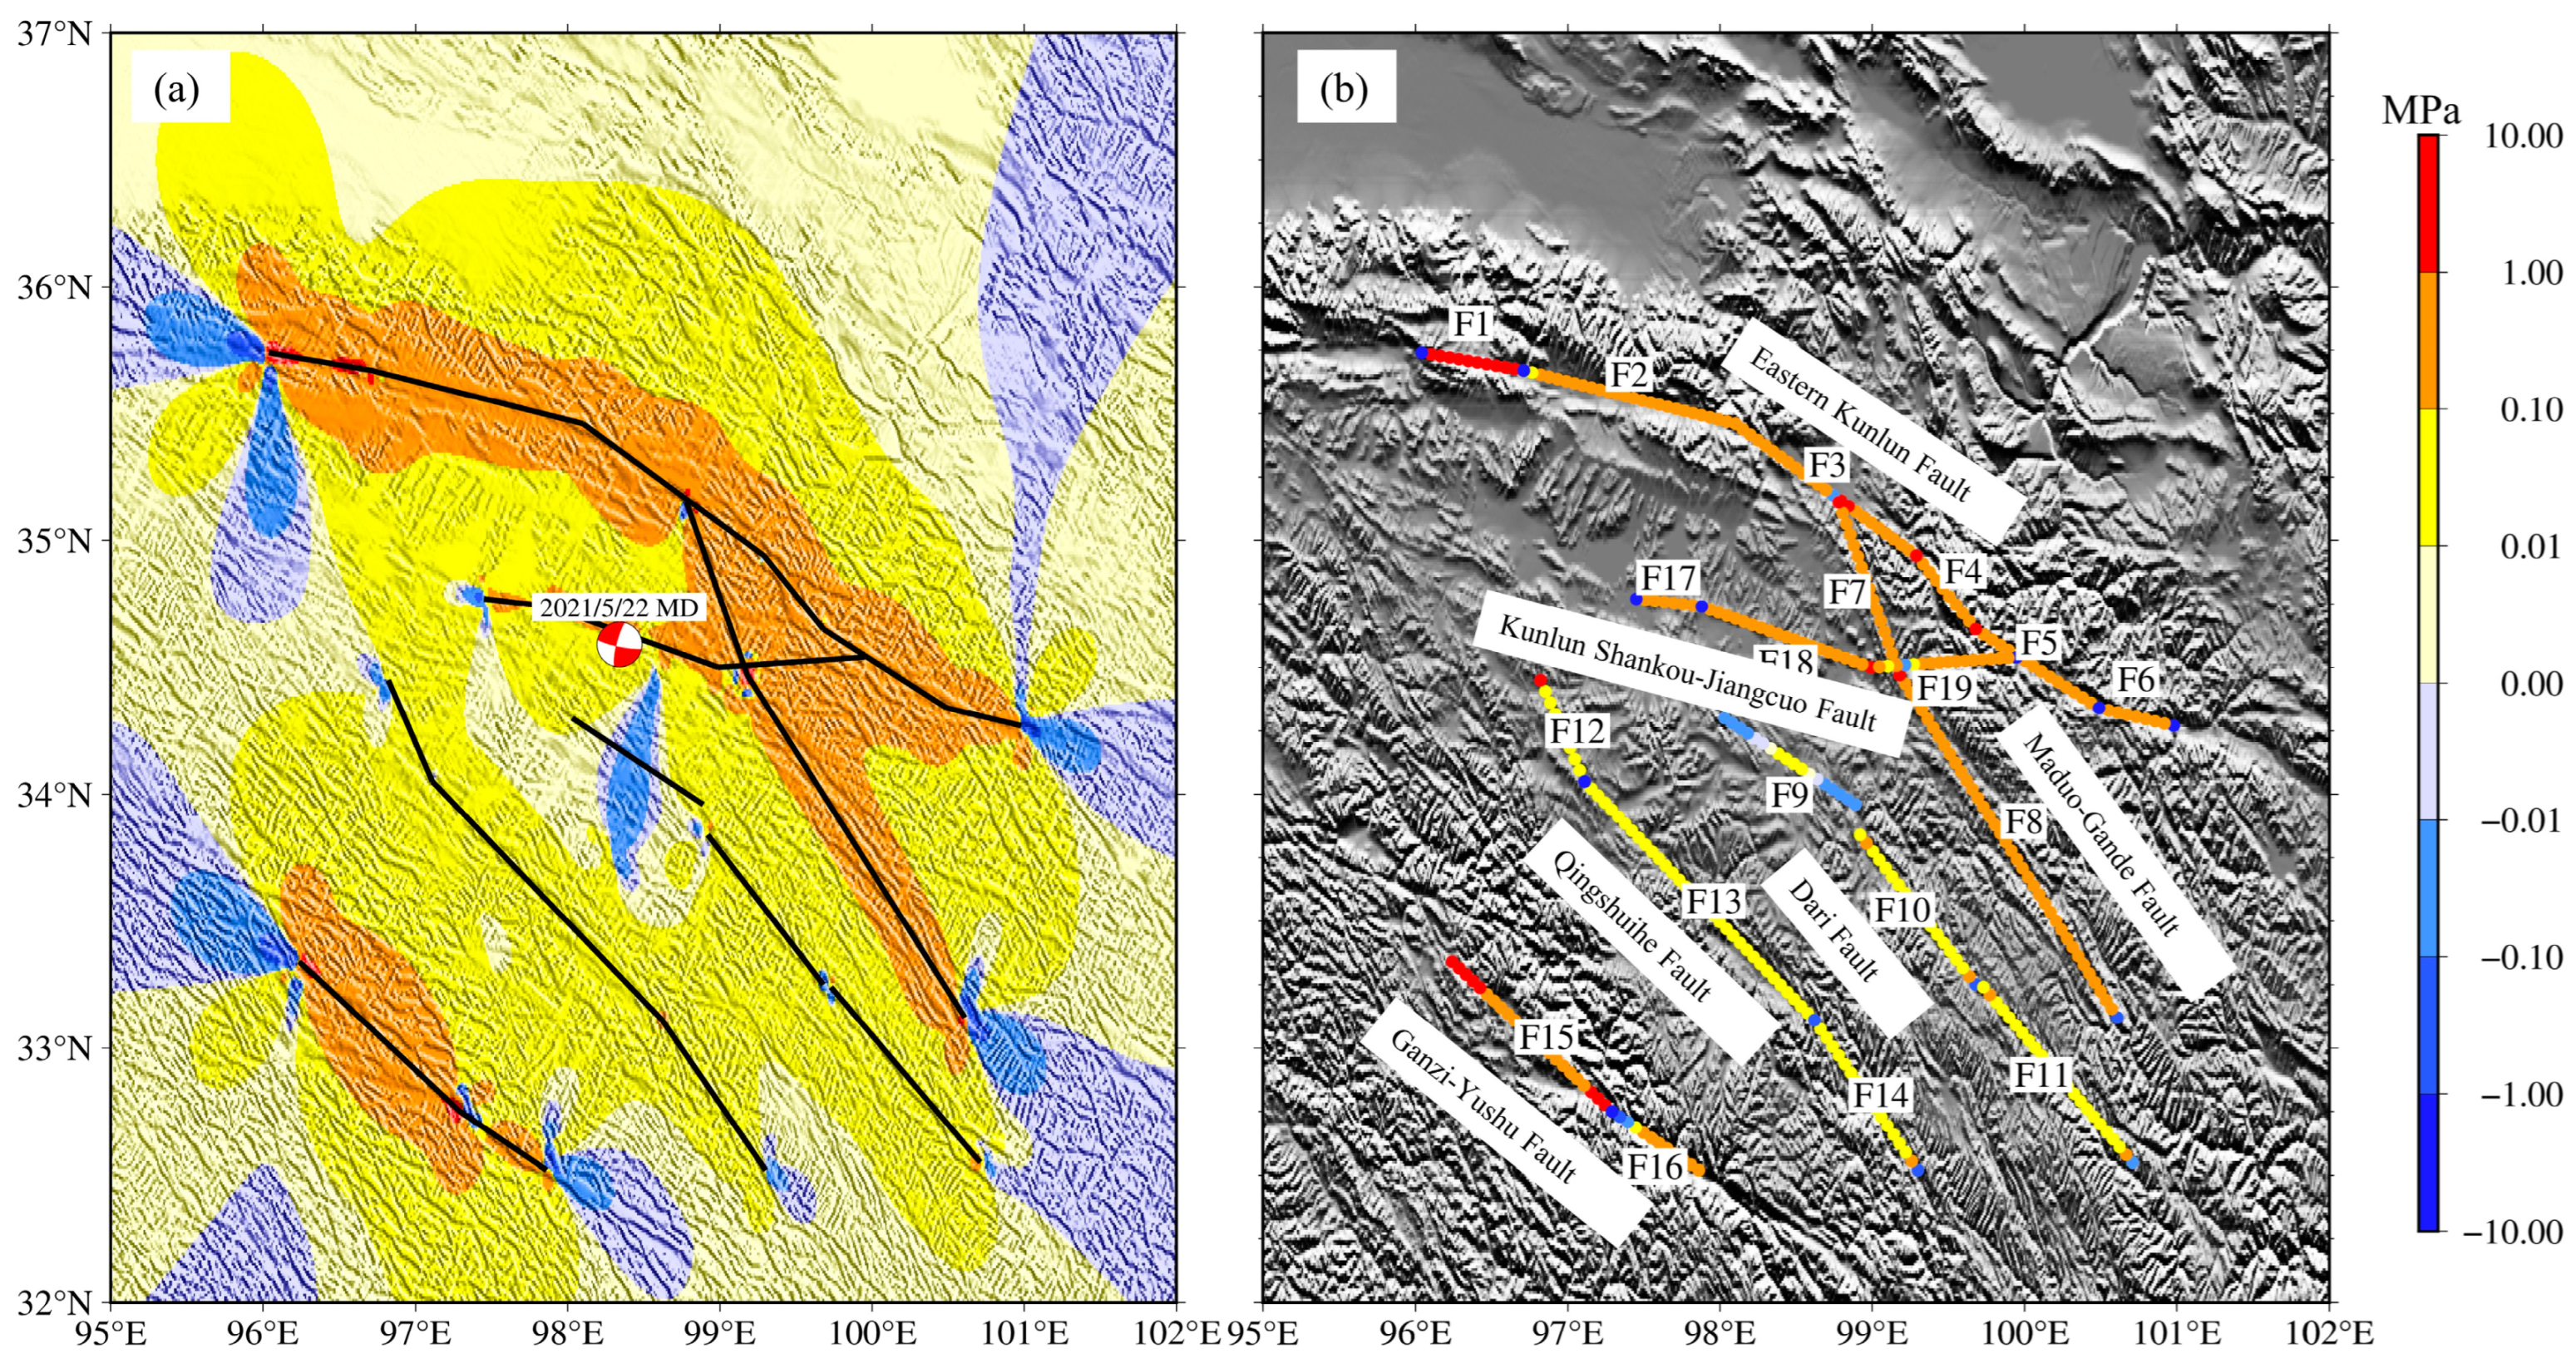
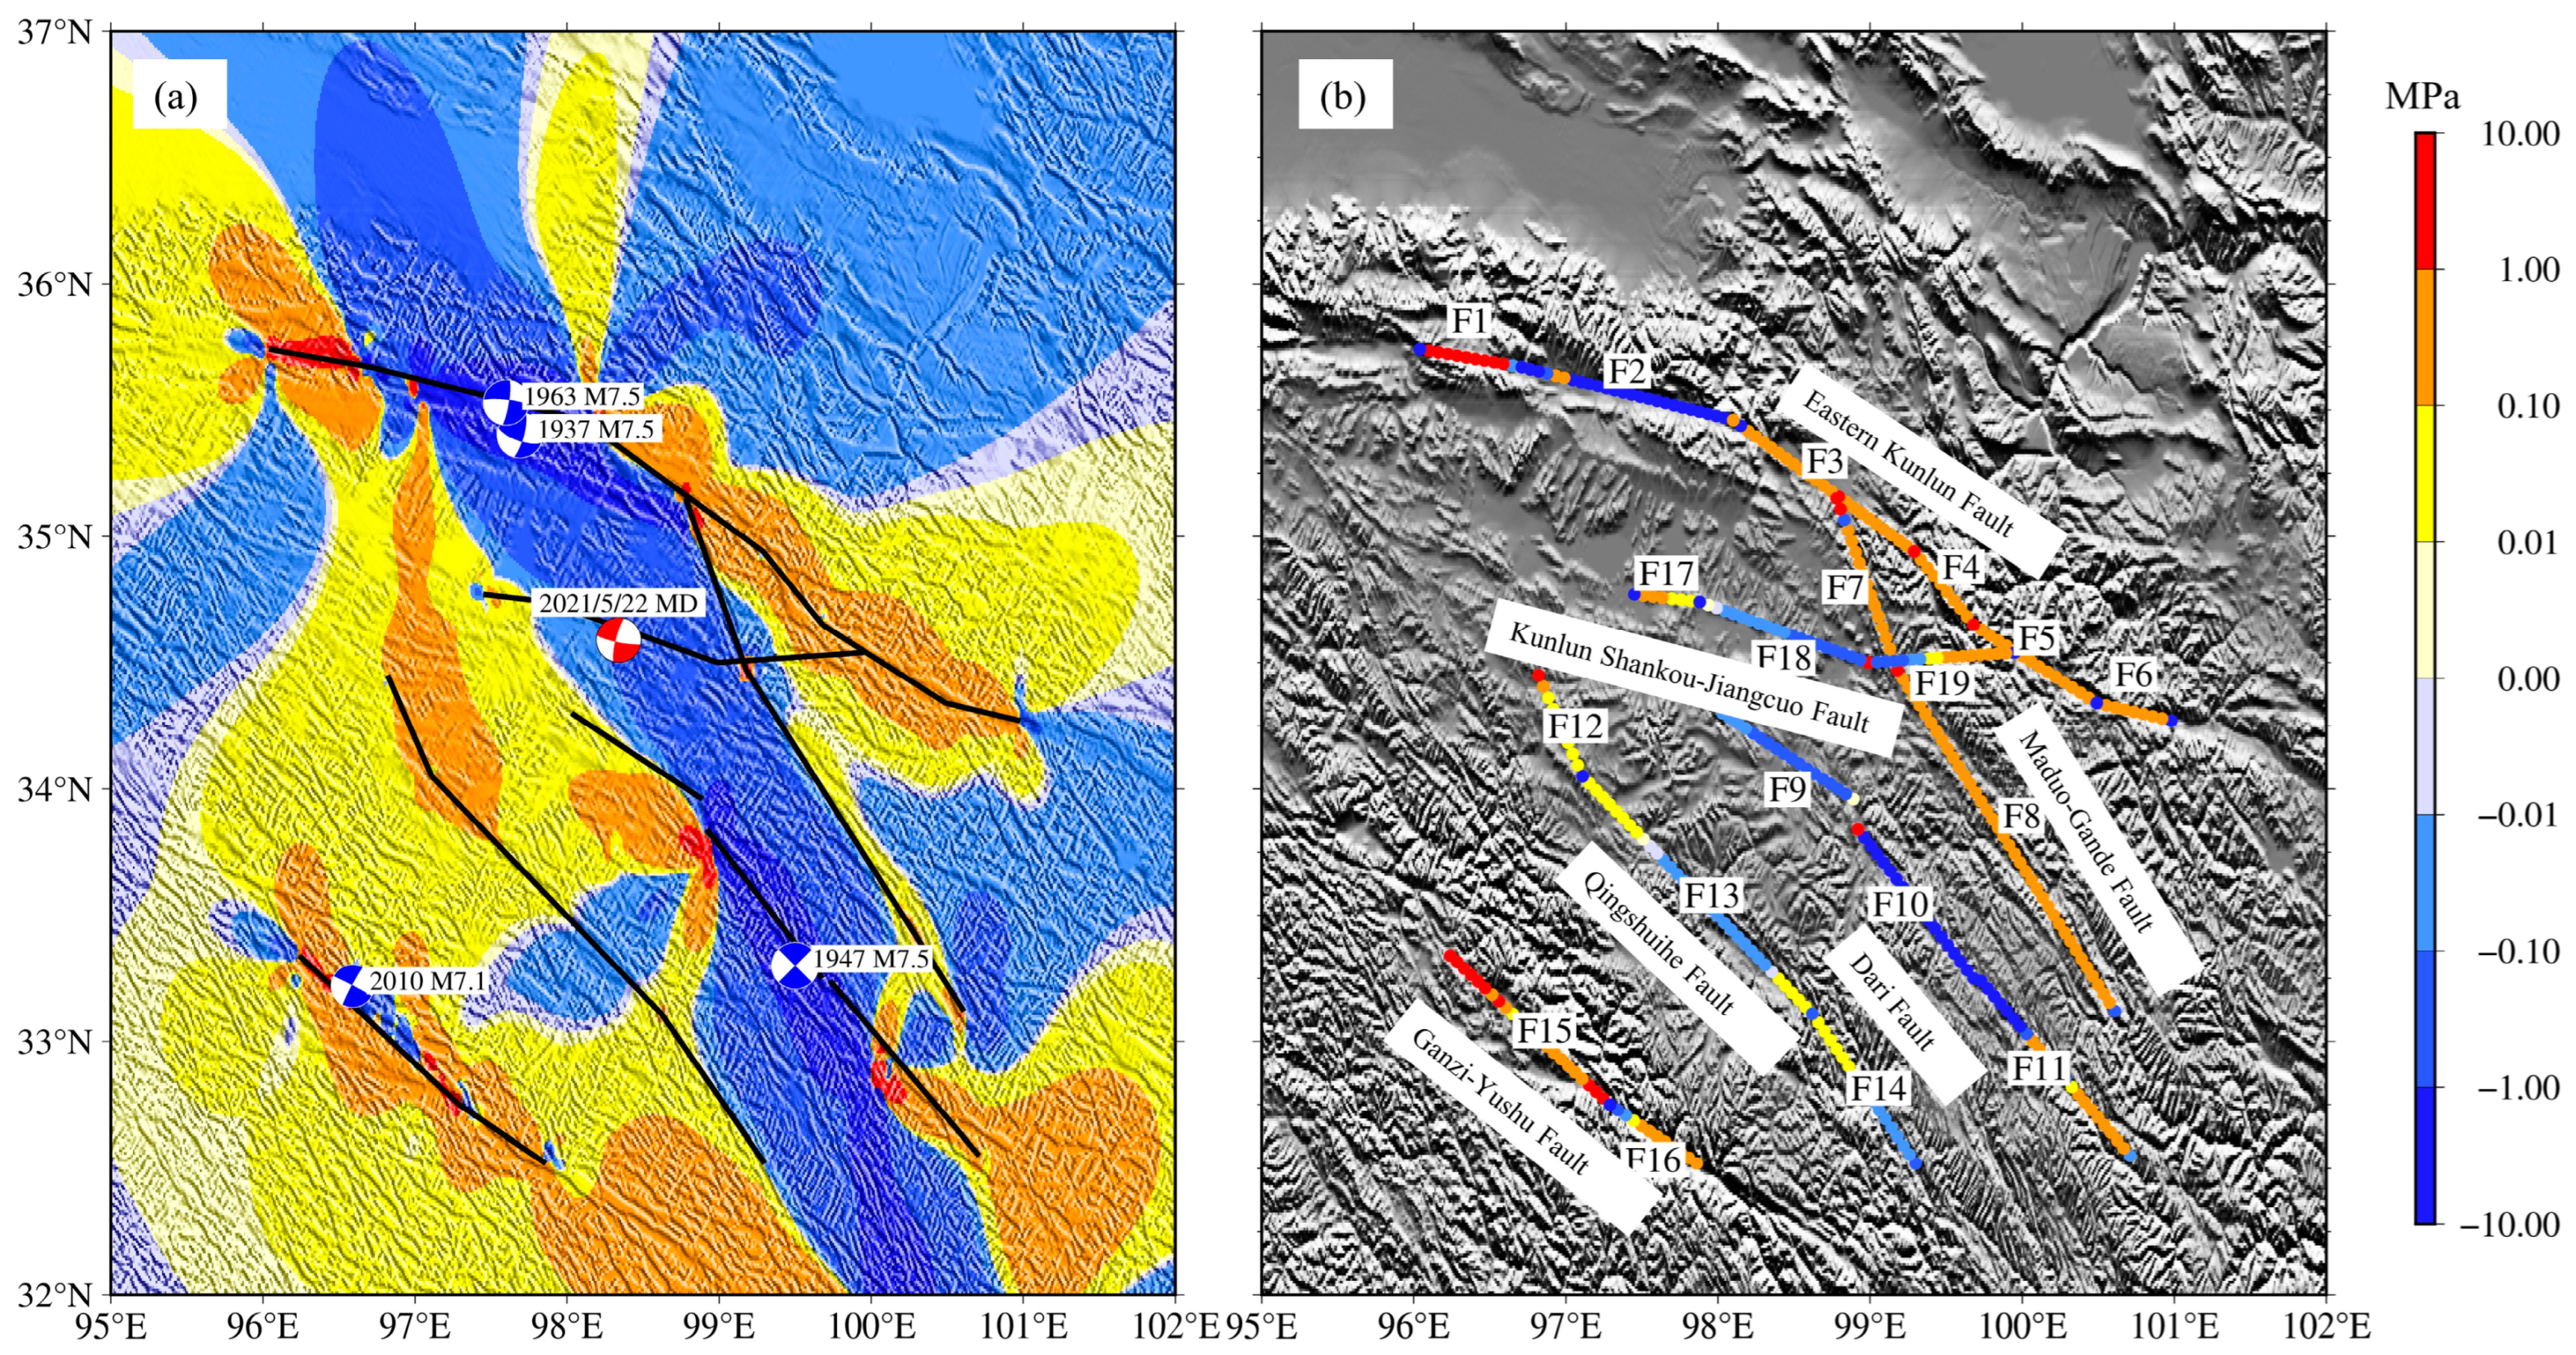
- The cumulative Coulomb stress at the Maduo earthquake’s source location is −0.1333 MPa, while the inter-seismic cumulative stress loading at the same location amounted to 0.0745 MPa. Considering the historically strong earthquakes and long-term inter-seismic tectonic loading, the western section of the East Kunlun Fault (F1), the Middle and Eastern sections of the East Kunlun Fault (F3–F6), the Maduo–Gande Fault (F7, F8), the Ganzi–Yushu Fault (F15, F16), and the Dari Fault C (F11) are under significant stress loading, indicating a noteworthy seismic risk. The middle segment A of the East Kunlun Fault (F2), Dari Fault B (F10), Dari Fault A (F9), Qingshuihe Fault B (F13), Kunlun Shankou–Jiangcuo Fault B (F18) showed a stress unloading state, which slowed down the occurrence of earthquakes. In particular, the middle segment A of East Kunlun Fault (F2) and Dari Fault B (F10) show a strong stress unloading state, which effectively reduces the risk of earthquake.
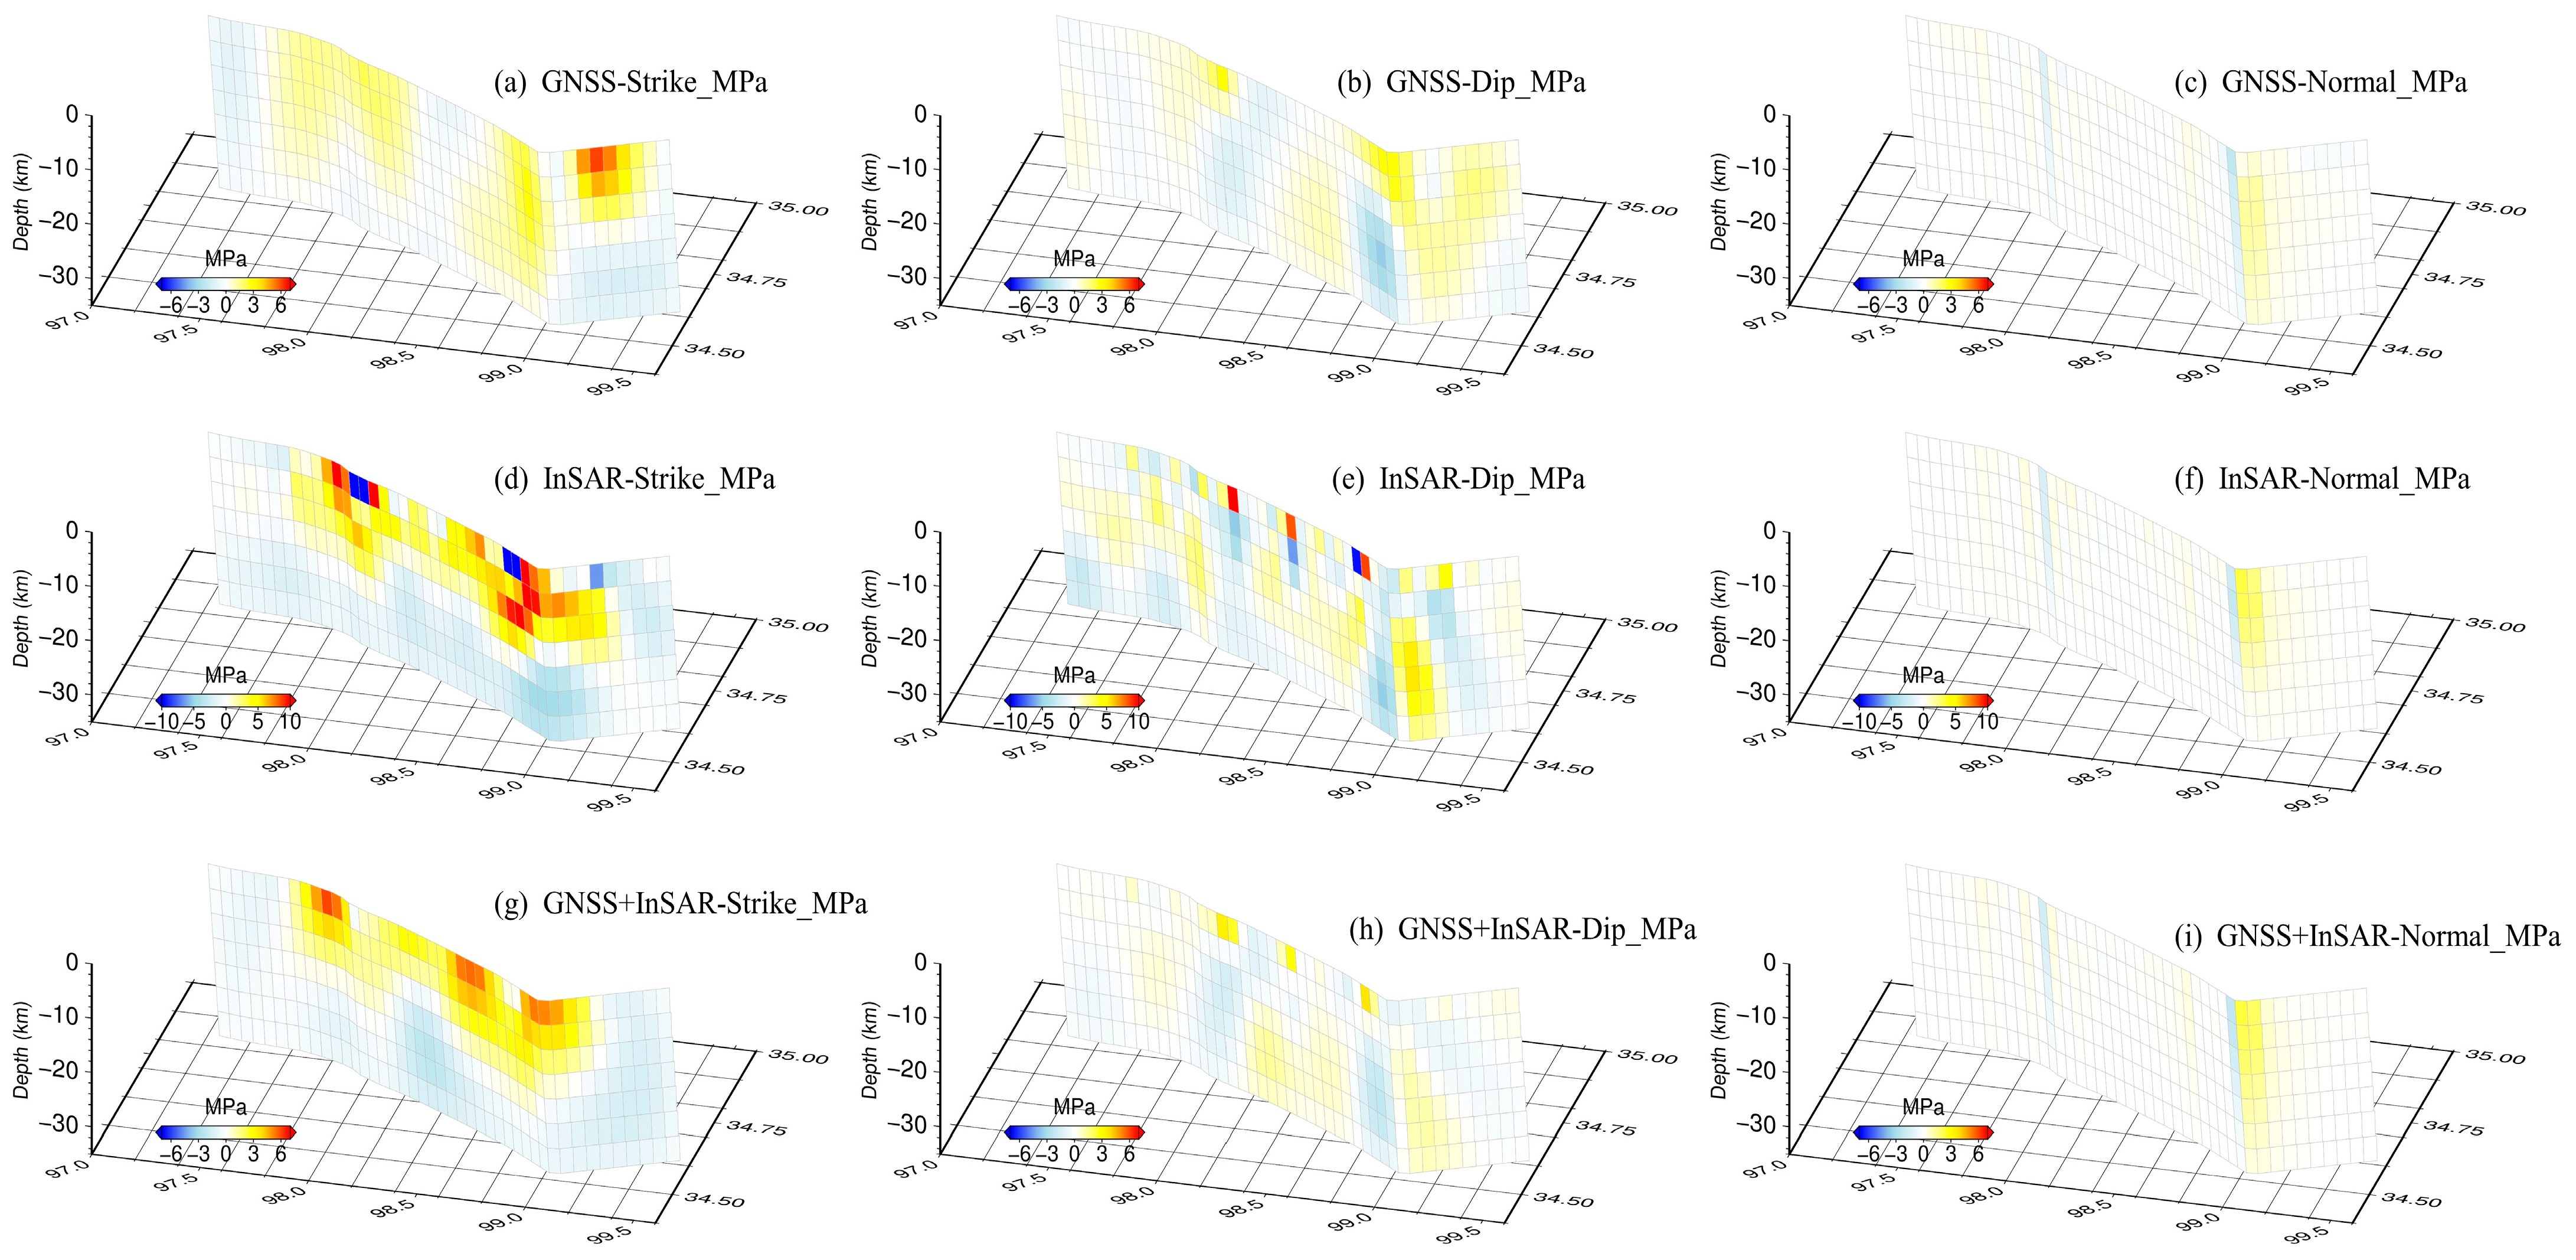
- In the fault section of F18 (Kunlun Shankou–Jiangcuo Fault B), the stress values calculated by the co-seismic slip model inverted by GNSS primarily indicate stress unloading, while the other two models show prominent stress loading. Because the co-seismic slip model of Maduo earthquake based on GNSS data inversion in this paper is compared with the other two models, the maximum slip is more inclined to the eastern fault area, and the maximum slip is smaller, resulting in the stress state of the F18 (Kunlun Shankou–Jiangcuo Fault B) fault section is different from that of the other two models. F19 (Kunlun Shankou–Jiangcuo Fault C), F15 (Ganzi–Yushu Fault A), F16 (Ganzi–Yushu Fault B), F12 (Qingshuihe Fault A), F13 (Qingshuihe Fault B), F9 (Dari Fault A), F8, F7 (Maduo–Gande Fault), F6 (East section B of East Kunlun Fault), and F4 (Middle segment C of East Kunlun Fault) exhibit stress loading in either the entire region or specific parts of the region.
Author Contributions
Funding
Data Availability Statement
Conflicts of Interest
References
- Wang, D.J.; Wang, D.Z.; Zhao, B.; Li, Y.; Zhao, L.J.; Wang, Y.B.; Nie, Z.S.; Qiao, X.J.; Wang, Q. 2021 Qinghai Madoi MW7.4 earthquake coseismic deformation field and fault-slip distribution using GNSS observations. Chin. J. Geophys. 2022, 65, 537–551. (In Chinese) [Google Scholar] [CrossRef]
- Wang, Y.B.; Li, Y.; Cai, Y.; Jiang, L.J.; Shi, H.B.; Jiang, Z.S.; Gan, W.J. Coseismic displacement and slip distribution of the 2021 May 22, MS7.4 Madoi earthquake derived from GNSS observations. Chin. J. Geophys. 2022, 65, 523–536. (In Chinese) [Google Scholar] [CrossRef]
- Hua, J.; Zhao, D.Z.; Shan, X.J.; Qu, C.Y.; Zhang, Y.F.; Gong, W.Y.; Wang, Z.J.; Li, C.L.; Li, Y.C.; Zhao, L.; et al. Coseismic deformation field, slip distribution and Coulomb stress disturbance of the 2021 MW7.3 Maduo earthquake using sentinel-1 InSAR observations. Seismol. Geol. 2021, 43, 677–691. [Google Scholar]
- Yu, P.F.; Xiong, W.; Chen, W.; Qiao, X.J.; Wang, D.J.; Liu, G.; Zhao, B.; Nie, Z.S.; Li, Y.; Zhao, L.J.; et al. Slip model of the 2021 MS7.4 Madoi earthquake constrained by GNSS and InSAR coseismic deformation. Chin. J. Geophys. 2022, 65, 509–522. (In Chinese) [Google Scholar] [CrossRef]
- Wang, S.W.; Ji, L.Y.; Zhu, L.Y.; Liu, C.J. Co-seismic Deformation Field and Fault Slip Distribution of 2021 Maduo MW7.4 Earthquake in Qinghai, China Based on InSAR Technology. J. Earth Sci. Environ. 2022, 44, 1016–1026. [Google Scholar] [CrossRef]
- Shan, X.J.; Qu, C.Y.; Gong, W.Y.; Zhao, D.Z.; Zhang, Y.F.; Zhang, G.H.; Song, X.-G.; Liu, Y.-H.; Zhang, G.-F.; Zhang, G.F. Coseismic deformation field of the Jiuzhaigou MS7.0 earthquake from Sentinel-1A InSAR data and fault slip inversion. Chin. J. Geophys. 2017, 60, 4527–4536. [Google Scholar] [CrossRef]
- Mildon, Z.K.; Toda, S.; Faure Walker, J.P.; Roberts, G.P. Evaluating models of Coulomb stress transfer: Is variable fault geometry important? Geophys. Res. Lett. 2016, 43, 12407–12414. [Google Scholar] [CrossRef]
- Sboras, S.; Lazos, I.; Bitharis, S.; Pikridas, C.; Galanakis, D.; Fotiou, A.; Chatzipetros, A.; Pavlides, S. Source modelling and stress transfer scenarios of the October 30, 2020 Samos earthquake: Seismotectonic implications. Turk. J. Earth Sci. 2021, 30, 699–717. [Google Scholar] [CrossRef]
- Toda, S.; Enescu, B. Rate/state Coulomb stress transfer model for the CSEP Japan seismicity forecast. Earth Planets Space 2011, 63, 171–185. [Google Scholar] [CrossRef]
- Li, Y.J.; Huang, L.Y.; Ding, R.; Yang, S.X.; Liu, L.; Zhang, S.M.; Liu, H.Q. Coulomb stress changes associated with the M7. 3 Maduo earthquake and implications for seismic hazards. Nat. Hazards Res. 2021, 1, 95–101. [Google Scholar] [CrossRef]
- Liu, B.Y.; Xie, M.Y.; Shi, B.P. Effect of Qinghai Madoi MS7.4 earthquake on Coulomb stress and earthquake probability increment of adjacent faults. Chin. J. Geophys. 2022, 65, 563–579. (In Chinese) [Google Scholar] [CrossRef]
- Feng, Y.S.; Xiong, X.; Shan, B.; Liu, C.L. Coulomb stress changes due to the 2021 MS7.4 Maduo Earthquake and expected seismicity rate changes in the surroundings. Sci. China Earth Sci. 2022, 65, 675–686. [Google Scholar] [CrossRef]
- Yue, C.; Qu, C.Y.; Niu, A.F.; Zhao, D.; Zhao, J.; Yu, H.; Wang, Y. Analysis of Stress Influence of Qinghai Maduo MS7. 4 Earthquake on Surrounding Faults. Seismol. Geol. 2021, 43, 1041–1059. [Google Scholar]
- Smith, B.R.; Sandwell, D.T. A model of the earthquake cycle along the San Andreas Fault System for the past 1000 years. J. Geophys. Res. 2006, 111, B01405. [Google Scholar] [CrossRef]
- Freed, A.M.; Ali, S.T.; Bürgmann, R. Evolution of stress in Southern California for the past 200 years from coseismic, postseismic and interseismic stress changes. Geophys. J. Int. 2007, 169, 1164–1179. [Google Scholar] [CrossRef]
- Tabrez, A.S.; Freed, A.M.; Calais, E.; Manaker, D.M.; McCann, W.R. Coulomb stress evolution in Northeastern Caribbean over the past 250 years due to coseismic, postseismic and interseismic deformation. Geophys. J. Int. 2008, 174, 904–918. [Google Scholar] [CrossRef]
- Scholz, C.H. Earthquakes and friction laws. Nature 1998, 391, 37–42. [Google Scholar] [CrossRef]
- Nalbant, S.S.; McCloskey, J.; Steacy, S.; Barka, A.A. Stress accumulation and increased seismic risk in eastern Turkey. Earth Planet. Sci. Lett. 2002, 195, 291–298. [Google Scholar] [CrossRef]
- Xu, J.; Shao, Z.G.; Ma, H.S.; Zhang, L.P. Evolution of Coulomb stress and stress interaction among strong earthquakes along the Xianshuihe fault zone. Chin. J. Geophys. 2013, 56, 1146–1158. (In Chinese) [Google Scholar] [CrossRef]
- Matsu’ura, M.; Jackson, D.D.; Cheng, A. Dislocation model for aseismic crustal deformation at Hollister, California. J. Geophys. Res. Solid Earth 1986, 91, 12661–12674. [Google Scholar] [CrossRef]
- Savage, J.C.; Prescott, W.H. Asthenosphere readjustment and the earthquake cycle. J. Geophys. Res. Solid Earth 1978, 83, 3369–3376. [Google Scholar] [CrossRef]
- Nur, A.; Mavko, G. Postseismic viscoelastic rebound. Science 1974, 183, 204–206. [Google Scholar] [CrossRef]
- Yin, F.L.; Jiang, C.S.; Han, L.B.; Zhang, H.; Zhang, B. Seismic hazard assessment for the Red River fault: Insight from Coulomb stress evolution. Chin. J. Geophys. 2018, 61, 183–198. (In Chinese) [Google Scholar] [CrossRef]
- Zhou, C.J. The Stress Field Changes Near the Boundary Fault Zones in the Bayanhar Block and Their Effect on the Large Earthquake; Chinese Academy of Geological Science: Beijing, China, 2014. [Google Scholar]
- Wen, X.; Ma, S.; Xu, X.; He, Y. Historical pattern and behavior of earthquake ruptures along the eastern boundary of the Sichuan-Yunnan faulted-block, southwestern China. Phys. Earth Planet. Inter. 2008, 168, 16–36. [Google Scholar] [CrossRef]
- Wells, D.L.; Coppersmith, K.J. New empirical relationships among magnitude, rupture length, rupture width, rupture area, and surface displacement. Bull. Seismol. Soc. Am. 1994, 84, 974–1002. [Google Scholar]
- Peter, M.; Deng, Q.D. Faulting associated with large earthquakes and the average rate of deformation in central and eastern Asia. J. Geophys. Res. Solid Earth 1984, 89, 6203–6227. [Google Scholar] [CrossRef]
- Molnar, P.; Chen, W.-P. Focal depths and fault plane solutions of earthquakes under the Tibetan Plateau. J. Geophys. Res. 1983, 88, 1180. [Google Scholar] [CrossRef]
- Fielding, E.J.; Sladen, A.; Li, Z.; Avouac, J.P.; Bürgmann, R.; Ryder, I. Kinematic fault slip evolution source models of the 2008 M7.9 Wenchuan earthquake in China from SAR interferometry, GPS and teleseismic analysis and implications for Longmen Shan tectonics. Geophys. J. Int. 2013, 194, 1138–1166. [Google Scholar] [CrossRef]
- Meng, G.J.; Su, X.N.; Xu, W.Z.; Ren, J.W.; Yang, Y.L.; Shestakov, N.V. Postseismic deformation associated with the 2010 Yushu, Qinghai MS7.1 earthquake by GPS observations. Chin. J. Geophys. 2016, 59, 4570–4583. (In Chinese) [Google Scholar] [CrossRef]
- Jiang, Z.S.; Wang, M.; Wang, Y.Z.; Wu, Y.Q.; Che, S.; Shen, Z.K.; Li, Q. GPS constrained coseismic source and slip distribution of the 2013 Mw6.6 Lushan, China, earthquake and its tectonic implications. Geophys. Res. Lett. 2014, 41, 407–413. [Google Scholar] [CrossRef]
- Xiong, W.; Wang, D.J.; Yu, P.F.; Nie, Z.S.; Liu, G.; Chen, W.; Qiao, X.J.; Tan, K.; Xu, C.J. Coulomb stress impact on 2017 Jiuzhaigou MW6.5 earthquake induced by historical earthquakes and Regional Seismic Hazard. Prog. Geophys. 2019, 34, 19–26. [Google Scholar] [CrossRef]
- Wang, W.L.; Fang, L.H.; Wu, J.P.; Tu, H.W.; Chen, L.Y.; Lai, G.J.; Zhang, L. Aftershock sequence relocation of the 2021 MS7.4 Maduo Earthquake, Qinghai, China. Sci. China Earth Sci. 2021, 64, 1371–1380. [Google Scholar] [CrossRef]
- Li, Z.M.; Li, W.Q.; Li, T.; Xu, Y.R.; Su, P.; Guo, P.; Sun, H.Y.; Ha, G.H.; Chen, G.H.; Yuan, Z.D.; et al. Seismogenic fault and coseismic surface deformation of the Maduo MS7.4 earthquake in Qinghai, China: A quick report. Seismol. Geol. 2021, 43, 722–737. [Google Scholar]
- Pan, J.W.; Bai, M.K.; Li, C.; Liu, F.; Li, H.; Liu, D.; Marie-Luce, C.; Ww, K.G.; Wang, P.; Lu, H.J.; et al. Coseismic surface rupture and seismogenic structure of the 2021-05-22 Maduo (Qinghai) M S 7.4 earthquake. Acta Geol. Sin. 2021, 95, 1655–1670. [Google Scholar]
- Zhu, Y.G.; Diao, F.Q.; Fu, Y.C.; Liu, C.L.; Xiong, X. Slip rate of the seismogenic fault of the 2021 Maduo earthquake in western China inferred from GPS observations. Sci. China Earth Sci. 2021, 64, 1363–1370. [Google Scholar] [CrossRef]
- Diao, F.Q.; Xiong, X.; Wang, R.J.; Walter, T.R.; Wang, Y.B.; Wang, K. Slip rate variation along the Kunlun Fault (Tibet): Results from new GPS observations and a viscoelastic earthquake-cycle deformation model. Geophys. Res. Lett. 2019, 46, 2524–2533. [Google Scholar] [CrossRef]
- Xiong, R.W. Study on the Activity of Maduo-Gande Fault. Institute of Earthquake Forecasting; China Earthquake Administration: Beijing, China, 2010.
- Liang, M.J.; Yang, Y.; Du, F.; Gong, Y.; Sun, W.; Zhao, M.; He, Q. Late quaternary activity of the central segment of the Dari fault and restudy of the surface rupture zone of the 1947 M7 3/4 Dari earthquake, Qinghai province. Seismol. Geol. 2020, 42, 703–714. [Google Scholar]
- Wu, Z.H.; Zhou, C.; Feng, H.; Zhang, K.; Li, J.; Ye, P.S.; Li, Y.H.; Tian, T.T. Active faults and earthquake around Yushu in eastern Tibetan Plateau. Geol. Bull. China 2014, 33, 419–469. [Google Scholar]
- Wu, J.W.; Huang, X.M.; Xie, F.R. Late Quaternary slip rate of the Garzê-Yushu fault zone (Dangjiang Segment). Chin. J. Geophys. 2017, 60, 3872–3888. (In Chinese) [Google Scholar] [CrossRef]
- Xu, K.K.; Gan, W.J.; Wu, J.C.; Hou, Z. A robust method for 3-D surface displacement fields combining GNSS and single-orbit InSAR measurements with directional constraint from elasticity model. GPS Solut. 2022, 26, 46. [Google Scholar] [CrossRef]
- Xu, K.K.; Liu, J.; Liu, X.F.; Liu, J.P.; Zhao, F.L. Multiscale crustal deformation around the southeastern margin of the Tibetan Plateau from GNSS observations. Geophys. J. Int. 2020, 223, 1188–1209. [Google Scholar] [CrossRef]
- Xu, K.K.; Sun, W.W.; Wu, J.C. A New Method for Constructing 3-D Crustal Deformation Field from Single InSAR-LOS Data. IEEE Geosci. Remote Sens. Lett. 2020, 19, 1–5. [Google Scholar] [CrossRef]
- Xu, K.K.; Gan, W.J.; Wu, J.C. Pre-seismic deformation detected from regional GNSS observation network: A case study of the 2013 Lushan, eastern Tibetan Plateau (China), Ms 7.0 earthquake. J. Asian Earth Sci. 2019, 180, 103859. [Google Scholar] [CrossRef]
- Xu, K.K.; He, R.; Li, K.Z.; Ren, A.K.; Shao, Z.H. Secular crustal deformation characteristics prior to the 2011 Tohoku-Oki earthquake detected from GNSS array, 2003–2011. Adv. Space Res. 2022, 69, 1116–1129. [Google Scholar] [CrossRef]
- Werner, C.; Wegmüller, U.; Strozzi, T.; Wiesmann, A. Gamma SAR and interferometric processing software. In Proceedings of the Ers-Envisat Symposium, Gothenburg, Sweden, 16–20 October 2000; Volume 1620, p. 1620. [Google Scholar]
- Xiong, W.; Chen, W.; Wang, D.Z.; Wen, Y.M.; Nie, Z.S.; Liu, G.; Wang, D.; Yu, P.; Qiao, X.; Zhao, B. Coseismic slip and early afterslip of the 2021 Mw 7.4 Maduo, China earthquake constrained by GPS and InSAR data. Tectonophysics 2022, 840, 229558. [Google Scholar] [CrossRef]
- Cheng, J.; Liu, J.; Gan, W.J.; Yu, H.Z. Coulomb stress interaction among strong earthquakes around the Bayan Har block since the Manyi earthquake in 1997. Chin. J. Geophys. 2001, 54, 1997–2010. (In Chinese) [Google Scholar] [CrossRef]
- Zhang, C.J.; Cao, J.L.; Shi, Y.L. Studying the viscosity of lower crust of Qinghai-Tibet Plateau according to post-seismic deformation. Sci. China Ser. D Earth Sci. 2009, 52, 411–419. [Google Scholar] [CrossRef]
- Shi, Y.L.; Cao, J.L. Effective viscosity of China continental lithosphere. Earth Sci. Front. 2008, 15, 82–95. [Google Scholar] [CrossRef]
- Wang, R.J.; Diao, F.Q.; Hoechner, A. SDM-A geodetic inversion code incorporating with layered crust structure and curved fault geometry. EGU Gen. Assem. Conf. Abstr. 2013, 15, 2411. [Google Scholar]
- Wang, L.Y.; Zhao, X. Determination of smoothing factor for the co-seismic slip distribution inversion. Acta Geod. Et Cartogr. Sin. 2018, 47, 1571. [Google Scholar] [CrossRef]
- Wang, X.Y.; Xu, K.K.; Liu, X.Q.; Zhang, M.S.; Wang, S.P. Coseismic deformation and stress triggering of the 2021 MS6. 4 Yangbi earthquake inverted from integrating GNSS and InSAR displacement fields. Adv. Space Res. 2023, 72, 458–470. [Google Scholar] [CrossRef]
- Sun, L.X.; Wang, L.Y.; Xu, G.Y.; Wu, Q.W. A New Method of Variational Bayesian Slip Distribution Inversion. J. Geod. 2023, 97, 10. [Google Scholar] [CrossRef]
- Feng, G.C.; Hetland, E.A.; Ding, X.L.; Li, Z.W.; Zhang, L. Coseismic fault slip of the 2008 Mw 7.9 Wenchuan earthquake estimated from InSAR and GPS measurements. Geophys. Res. Lett. 2010, 37, L01302. [Google Scholar] [CrossRef]
- Shen, W.H.; Li, Y.S.; Jiao, Q.S.; Xie, Q.C.; Zhang, J.F. Joint inversion of strong motion and InSAR/GPS data for fault slip distribution of the Jiuzhaigou 7.0 earthquake and its application in seismology. Chin. J. Geophys. 2019, 62, 115–129. (In Chinese) [Google Scholar] [CrossRef]
- He, P.; Wen, Y.; Li, S.; Ding, K.; Li, Z.; Xu, C. Present-day orogenic processes in the western Kalpin nappe explored by interseismic GNSS measurements and coseismic InSAR observations of the 2020 MW6.1 Kalpin event. Geophys. J. Int. 2021, 226, 928–940. [Google Scholar] [CrossRef]
- Tu, H.W.; Wang, R.J.; Diao, F.Q.; Zhang, Y.; Wan, Y.G.; Jin, M.P. Slip model of the 2001 Kunlun mountain MS8. 1 earthquake by SDM: Joint inversion from GPS and InSAR data. Chin. J. Geophys. 2016, 59, 404–413. [Google Scholar] [CrossRef]
- King, G.C.; Stein, R.S.; Lin, J. Static stress changes and the triggering of earthquakes. Bull. Seismol. Soc. Am. 1994, 84, 935–953. [Google Scholar]
- Wang, R.J.; Lorenzo-Martín, F.; Roth, F. PSGRN/PSCMP—A new code for calculating co- and post-seismic deformation, geoid and gravity changes based on the viscoelastic-gravitational dislocation theory. Comput. Geosci. 2006, 32, 527–541. [Google Scholar] [CrossRef]
- He, K.F.; Wen, Y.M.; Xu, C.J.; Zhao, Y.W. Fault geometry and slip distribution of the 2021 MW 7.4 Maduo, China, earthquake inferred from InSAR measurements and relocated aftershocks. Seismol. Soc. Am. 2022, 93, 8–20. [Google Scholar] [CrossRef]
- Zheng, A.; Yu, X.W.; Qian, J.Q.; Liu, X.G.; Zhang, W.B.; Chen, X.F.; Xu, W.B. Cascading rupture process of the 2021 Maduo, China earthquake revealed by the joint inversion of seismic and geodetic data. Tectonophysics 2023, 849, 229732. [Google Scholar] [CrossRef]
- Jin, Z.Y.; Fialko, Y.; Yang, H.F.; Li, Y. Transient deformation excited by the 2021 M7. 4 Maduo (China) earthquake: Evidence of a deep shear zone. J. Geophys. Res. Solid Earth 2023, 128, e2023JB026643. [Google Scholar] [CrossRef]


| Number | Time | Position | Lon/° | Lat/° | Dep/km | M | L/km | W/km | Strike Slip/Dip Slip (m/m) | Strike/° | Dip/° |
|---|---|---|---|---|---|---|---|---|---|---|---|
| 1 | 30 August 1904 | Daofu | 101.10 | 31.00 | 9.00 | 7.00 | 55 | 13 | 1.86/0.00 | 130 | 90 |
| 2 | 24 March 1923 | Luhuo | 100.90 | 31.17 | 9.00 | 7.30 | 60 | 13 | 6.91/0.00 | 130 | 90 |
| 3 | 25 August 1933 | Diexi | 103.40 | 31.90 | 2.00 | 7.50 | 119 | 20 | −4.43/0.92 | 14 | 60 |
| 4 | 17 January 1937 | Huashixia | 97.69 | 35.40 | 2.00 | 7.50 | 208 | 18 | 1.92/−0.52 | 110 | 70 |
| 5 | 17 March 1947 | Darinan | 99.50 | 33.30 | 3.00 | 7.70 | 141 | 21 | 5.03/0.00 | 135 | 90 |
| 6 | 14 April 1955 | Kangding | 101.84 | 30.03 | 2.00 | 7.60 | 35 | 20 | 15.06/0.00 | 155 | 90 |
| 7 | 19 April 1963 | Doulan | 97.60 | 35.53 | 2.00 | 7.50 | 100 | 18 | 4.09/0.72 | 277 | 80 |
| 8 | 6 February 1973 | Luhuo | 100.52 | 31.50 | 33.00 | 7.90 | 90 | 24 | 13.75/0.00 | 125 | 87 |
| 9 | 16 August 1976 | Songpan | 104.09 | 32.72 | 16.00 | 7.20 | 47 | 22 | 1.96/−1.65 | 165 | 63 |
| 10 | 23 August 1976 | Songpan | 104.10 | 32.50 | 33.00 | 7.20 | 47 | 22 | 1.96/−1.65 | 155 | 65 |
| 11 | 12 May 2008 | Wenchuan | 103.32 | 31.00 | 19.00 | 8.00 | - | - | - | - | - |
| 12 | 14 April 2010 | Yushu | 96.59 | 33.22 | 17.00 | 7.10 | - | - | - | - | - |
| 13 | 20 April 2013 | Lushan | 102.99 | 30.30 | 17.0 | 7.00 | - | - | - | - | - |
| 14 | 8 August 2017 | Jiuzhaigou | 103.86 | 33.19 | 9.00 | 7.00 | - | - | - | - | - |
| 15 | 22 May 2021 | Maduo | 98.34 | 34.59 | 10.00 | 7.40 | - | - | - | - | - |
| Number | Fault Name | Start Lon(°)/Lat(°) | End Lon(°)/Lat(°) | Strike (°) | Dip (°) | Rake (°) | Slip Rate (mm/a) |
|---|---|---|---|---|---|---|---|
| F1 | Western section of East Kunlun Fault | 96.71°E, 35.67°N | 96.04°E, 35.74°N | 278 | 89 | 0 | 10.0 |
| F2 | Middle segment A of East Kunlun Fault | 98.10°E, 35.46°N | 96.71°E, 35.67°N | 281 | 89 | 0 | 5.0 |
| F3 | Middle segment B of East Kunlun Fault | 99.29°E, 34.94°N | 98.10°E, 35.46°N | 298 | 89 | 0 | 5.0 |
| F4 | Middle segment C of East Kunlun Fault | 99.68°E, 34.65°N | 99.29°E, 34.94°N | 312 | 89 | 0 | 5.0 |
| F5 | East section A of East Kunlun Fault | 100.49°E, 34.34°N | 99.68°E, 34.65°N | 295 | 89 | 0 | 4.0 |
| F6 | East section B of East Kunlun Fault | 100.98°E, 34.27°N | 100.49°E, 34.34°N | 280 | 89 | 0 | 3.0 |
| F7 | Maduo–Gande Fault A | 99.18°E, 34.47°N | 98.78°E, 35.15°N | 334 | 80 | 0 | 3.5 |
| F8 | Maduo–Gande Fault B | 100.61°E, 33.12°N | 99.18°E, 34.47°N | 319 | 80 | 0 | 3.5 |
| F9 | Dari Fault A | 98.89°E, 33.96°N | 98.03°E, 34.30°N | 199 | 80 | −12 | 0.4 |
| F10 | Dari Fault B | 99.68°E, 33.25°N | 98.92°E, 33.84°N | 313 | 80 | −12 | 0.4 |
| F11 | Dari Fault C | 100.71°E, 32.55°N | 99.73°E, 33.24°N | 310 | 80 | −12 | 0.4 |
| F12 | Qingshuihe Fault A | 97.11°E, 34.05°N | 96.82°E, 34.45°N | 329 | 89 | 0 | 0.4 |
| F13 | Qingshuihe Fault B | 98.62°E, 33.11°N | 97.11°E, 34.05°N | 307 | 89 | 0 | 0.4 |
| F14 | Qingshuihe Fault C | 99.30°E, 32.52°N | 98.62°E, 33.11°N | 316 | 89 | 0 | 0.4 |
| F15 | Ganzi–Yushu Fault A | 97.29°E, 32.75°N | 96.24°E, 33.34°N | 304 | 88 | 23 | 8.0 |
| F16 | Ganzi–Yushu Fault B | 97.86°E, 32.52°N | 97.29°E, 32.75°N | 290 | 88 | 23 | 2.0 |
| F17 | Kunlun Shankou–Jiangcuo Fault A | 97.88°E, 34.74°N | 97.45°E, 34.77°N | 275 | 80 | −9 | 1.0 |
| F18 | Kunlun Shankou–Jiangcuo Fault B | 98.99°E, 34.50°N | 97.88°E, 34.74°N | 285 | 80 | 2 | 1.0 |
| F19 | Kunlun Shankou–Jiangcuo Fault C | 99.95°E, 34.54°N | 98.99°E, 34.50°N | 267 | 80 | 18 | 1.0 |
| Orbit | Track | Master Image (YYYY-MM-DD) | Slave Image (YYYY-MM-DD) | Vertical Baseline/m | Time Baseline/d |
|---|---|---|---|---|---|
| Ascending | 106 | 2021-05-20 | 2021-05-26 | 52 | 6 |
| Descending | 99 | 2021-05-20 | 2021-05-26 | 117 | 6 |
| Number | Depth/km | VP/km·s−1 | Vs/km·s−1 | ρ/kg·m−3 |
|---|---|---|---|---|
| 1 | 0.0 | 4.50 | 2.60 | 2600.0 |
| 2 | 5.0 | 5.60 | 3.30 | 2600.0 |
| 3 | 5.0 | 5.60 | 3.30 | 2700.0 |
| 4 | 10.0 | 6.05 | 3.55 | 2700.0 |
| 5 | 10.0 | 6.05 | 3.55 | 2850.0 |
| 6 | 15.0 | 6.05 | 3.60 | 2850.0 |
| 7 | 15.0 | 6.05 | 3.60 | 2850.0 |
| 8 | 20.0 | 5.75 | 3.40 | 2850.0 |
| 9 | 20.0 | 5.75 | 3.40 | 2850.0 |
| 10 | 30.0 | 5.75 | 3.40 | 2850.0 |
| 11 | 30.0 | 5.75 | 3.40 | 3000.0 |
| 12 | 40.0 | 6.10 | 3.55 | 3000.0 |
| 13 | 40.0 | 6.10 | 3.55 | 3000.0 |
| 14 | 50.0 | 6.10 | 3.55 | 3000.0 |
| 15 | 50.0 | 6.10 | 3.55 | 3100.0 |
| 16 | 60.0 | 7.10 | 4.05 | 3100.0 |
| 17 | 60.0 | 7.10 | 4.05 | 3100.0 |
| 18 | 80.0 | 8.00 | 4.35 | 3100.0 |
| 19 | 80.0 | 8.00 | 4.35 | 3320.0 |
| 20 | 100.0 | 7.95 | 4.35 | 3320.0 |
| Number | Depth/km | VP/km·s−1 | VS/km·s−1 | ρ/kg·m−3 | η/Pa·s |
|---|---|---|---|---|---|
| 1 | 0–4 | 4.80 | 2.771 | 2600 | |
| 2 | 4–10 | 5.90 | 3.406 | 2700 | |
| 3 | 10–20 | 6.00 | 3.463 | 2850 | |
| 4 | 20–30 | 6.25 | 3.608 | 2850 | 6.3 × 10¹⁹ |
| 5 | 30–50 | 6.70 | 3.806 | 3100 | 6.3 × 10¹⁹ |
| 6 | 50–68 | 6.85 | 3.954 | 3100 | 1.0 × 10¹⁸ |
| 7 | - | 8.20 | 4.734 | 3320 | 1.0 × 10²⁰ |
| Data Source | Smoothing Factor | MW | Data-Model Correlation | Max Slip (m) | Mean Slip (m) | Root Mean Square Error (cm) |
|---|---|---|---|---|---|---|
| GNSS | 0.1 | 7.47 | 98.36% | 3.98 | 1.15 | GPS: 1.23 |
| InSAR | 0.1 | 7.54 | 96.81% | 6.00 | 1.63 | Asc: 4.26 |
| Des: 4.76 | ||||||
| GNSS + InSAR | 0.2 | 7.47 | 96.16% | 4.79 | 1.23 | GPS: 2.44 |
| Asc: 7.68 | ||||||
| Des: 6.60 |
Disclaimer/Publisher’s Note: The statements, opinions and data contained in all publications are solely those of the individual author(s) and contributor(s) and not of MDPI and/or the editor(s). MDPI and/or the editor(s) disclaim responsibility for any injury to people or property resulting from any ideas, methods, instructions or products referred to in the content. |
© 2023 by the authors. Licensee MDPI, Basel, Switzerland. This article is an open access article distributed under the terms and conditions of the Creative Commons Attribution (CC BY) license (https://creativecommons.org/licenses/by/4.0/).
Share and Cite
Xu, K.; Wang, S.; Wan, T. Source Parameter Inversion and Century-Scale Stress Triggering Analysis of the 2021 Maduo MW7.4 Earthquake Using GNSS and InSAR Displacement Fields. Remote Sens. 2023, 15, 5027. https://0-doi-org.brum.beds.ac.uk/10.3390/rs15205027
Xu K, Wang S, Wan T. Source Parameter Inversion and Century-Scale Stress Triggering Analysis of the 2021 Maduo MW7.4 Earthquake Using GNSS and InSAR Displacement Fields. Remote Sensing. 2023; 15(20):5027. https://0-doi-org.brum.beds.ac.uk/10.3390/rs15205027
Chicago/Turabian StyleXu, Keke, Shuaipeng Wang, and Tongtong Wan. 2023. "Source Parameter Inversion and Century-Scale Stress Triggering Analysis of the 2021 Maduo MW7.4 Earthquake Using GNSS and InSAR Displacement Fields" Remote Sensing 15, no. 20: 5027. https://0-doi-org.brum.beds.ac.uk/10.3390/rs15205027