Seven Years of Advanced Synthetic Aperture Radar (ASAR) Global Monitoring (GM) of Surface Soil Moisture over Africa

 and
and
Abstract
: A surface soil moisture (SSM) product at a 1-km spatial resolution derived from the Envisat Advanced Synthetic Aperture Radar (ASAR) Global Monitoring (GM) mode data was evaluated over the entire African continent using coarse spatial resolution SSM acquisitions from the Advanced Microwave Scanning Radiometer for Earth Observing System (AMSR-E) and the Noah land surface model from the Global Land Data Assimilation System (GLDAS-NOAH). The evaluation was performed in terms of relative soil moisture values (%), as well as anomalies from the seasonal cycle. Considering the high radiometric noise of the ASAR GM data, the SSM product exhibits a good ability (Pearson correlation coefficient (R) = ∼0.6 for relative soil moisture values and root mean square difference (RMSD) = 11% when averaged to 5-km resolution) to monitor temporal soil moisture variability in regions with low to medium density vegetation and yearly rainfall >250 mm. The findings agree with previous evaluation studies performed over Australia and further strengthen the understanding of the quality of the ASAR GM SSM product and its potential for data assimilation. Problems identified in the ASAR GM algorithm over arid regions were explained by azimuthal effects. Diverse backscatter behavior over different soil types was identified. The insights gained about the quality of the data were used to establish a reliable masking of the existing ASAR GM SSM product and the identification of areas where further research is needed for the future Sentinel-1-derived SSM products.
1. Introduction
The ability of coarse resolution (∼25–50 km) microwave remote sensing products from both passive and active satellites to capture the variability of soil moisture was demonstrated by numerous studies (e.g., [1–4]). Their benefits in many research fields, such as numerical weather forecasting [5,6], runoff modeling [7,8], agricultural drought monitoring [9], land data assimilation [10] or studies of land atmospheric feedbacks [11], have been demonstrated. Consequently, these products have become commonly accepted in the past few years.
Surface soil moisture (SSM) products with improved spatial resolution are expected to broaden the number of applications and allow the usage of the SSM data in regional higher spatial resolution models. Motivated by the latter, the use of Synthetic Aperture Radar (SAR) ScanSAR data to monitor SSM was suggested by Wagner et al. [12,13].
The Advanced Synthetic Aperture Radar (ASAR) sensor onboard the Envisat satellite was an active microwave system operating at a central frequency of 5.331 GHz (C-band). It offers multiple acquisition modes employing both the conventional stripmap SAR, as well as the ScanSAR technique. The ScanSAR Global Monitoring (GM) mode provided global measurements with a trade-off between spatial (1 km) and temporal resolution (four to seven days, dependent also on the sensor acquisition plan) and, therefore, allows the monitoring of dynamic processes, such as soil moisture, on regional to global scales [13]. The ASAR GM SSM has been derived over Oklahoma and Australia, and the evaluation studies over these regions proved the ability of the product to resolve the spatial details in the soil moisture patterns that were not observable with the coarse resolution scatterometers or radiometers. Nonetheless, spatial averaging to between 3 and 10 km was recommended to reduce the high noise of the ASAR measurements caused by the relatively low radiometric accuracy (∼1.2 dB) [14,15] of the GM mode measurements [16–18].
For small-scale applications, also Wide Swath (WS) mode, Image Mode (IM) or Alternating Polarization (AP) mode are used [19–21]. These modes offer even higher spatial resolution (30 m for AP and IM, 150 m for WS) and radiometric accuracy (∼0.6 dB in the case of WS [22]) with regional spatial coverage and irregular temporal sampling. Gruber et al. [14] and Baup et al. [19] showed that the WS mode offers better performance in terms of radiometric resolution, radiometric stability and speckle reduction than the GM mode. This is, however, at the cost of lower temporal resolution and reduced spatial coverage of WS when compared to the GM mode.
At the time of writing of this publication, the Sentinel-1 SAR sensor is in the commissioning phase. The Sentinel-1 sensor is an active microwave system operating at a central frequency (5.405 GHz) that is very close to that of ASAR (5.331 GHz). The transfer of the SSM retrieval algorithm to Sentinel-1 has therefore been foreseen and has been discussed in a number of publications [14,15,23,24]. Given the significantly improved radiometric resolution of the Sentinel-1 (0.05–0.07 dB) combined with a regular temporal coverage, soil moisture products derived from Sentinel-1 are expected to be of considerably better quality when compared to the ASAR SSM products [14,15].
Within the European Space Agency’s (ESA) Tiger Innovator projects Soil Moisture for Hydrometeorologic Applications (SHARE) and TIGER-NET a 1-km surface soil moisture product was developed and processed over the African continent based on the complete archive of the ASAR GM mode data (December 2004 to April 2012). The production and evaluation of the ASAR GM product over the entire African continent is scientifically valuable given the variability of the climatological, biogeographical, pedological and lithological characteristics over the continent, which is expected to reveal new challenges and opportunities for improvements of the Vienna University of Technology (TU Wien) algorithm [25]. For instance, prior studies using a scatterometer demonstrated some unexpected backscatter behavior and negative correlations between the SSM estimates from active and passive sensors over very dry areas [1]. Similar problems can be expected to occur in the SAR SSM products. However, the higher spatial resolution of SAR data may improve the understanding of the regionalization of such phenomena and link it to other parameters, such as soil types, lithology, vegetation or combinations thereof.
The evaluation step is performed using SSM data from the Advanced Microwave Scanning Radiometer for Earth Observing System (AMSR-E), as well as from the Noah land surface model from the Global Land Data Assimilation System (GLDAS-NOAH). According to the suggestion in [16–18], the 1-km dataset was aggregated to 5-km spatial resolution prior to the evaluation. Due to the scale difference between the aggregated ASAR GM SSM product (5 km) and reference SSM datasets (0.25°), the evaluation cannot take advantage of the high spatial resolution of the ASAR observations. The uncertainties in the reference data together with the spatial sampling error will be included in the bivariate error measures [26]. However, the evaluation against in situ and medium resolution datasets was impossible at the continental scale, due to a lack of such data over the African continent. To assess the role of the improved radiometric resolution, the evaluation includes a comparison between the performance of GM and WS SSM product over the Zambezi catchment.
2. Datasets
2.1. ASAR Surface Soil Moisture
The ASAR SSM dataset was retrieved using a TU Wien change detection algorithm [25] and represents the relative surface soil moisture in the upper soil layer (<3 cm) at 1-km spatial resolution. The algorithm was originally developed for data from European Remote-Sensing Satellite (ERS) and Advanced Scatterometer (ASCAT) scatterometers [25] and subsequently adopted for ASAR GM [17] and WS data, respectively. In the case of high-resolution WS data, averaging was performed within the georeferencing step. The spatial resolution of the georeferenced WS dataset is 1 km, and the radiometric resolution is enhanced from ∼0.6 dB to ∼0.2 dB [14]. The characteristics of the GM and WS mode data are summarized in Table 1.
The change detection algorithm assumes a linear relationship between changes in volumetric soil moisture content and changes of backscatter expressed in decibels. The degree of saturation in the soil pores is estimated by relating each backscatter value to backscatter reference maps representing wet and dry soil conditions. Wet and dry conditions refer to a completely dry soil and saturation of the soil, respectively. For a sufficiently dense multi-year time series of backscatter measurements, the assumption is that measurements for both dry and wet soil conditions are captured, allowing maps of the dry and wet references to be derived from the data. However, over arid and semi-arid areas, a so-called wet correction [27] must be applied to the dataset, as the probability of acquisitions for wet conditions is very low. An empirical correction of biases in the wet reference is applied when the wet reference is below −6 dB and the sensitivity (the difference between wet and dry reference) is less than 10 dB. The wet reference is then increased to a value of maximum −6 dB, under the condition that the sensitivity is not made greater than 10 dB. The unit of the resulting product represents the degree of saturation (%).
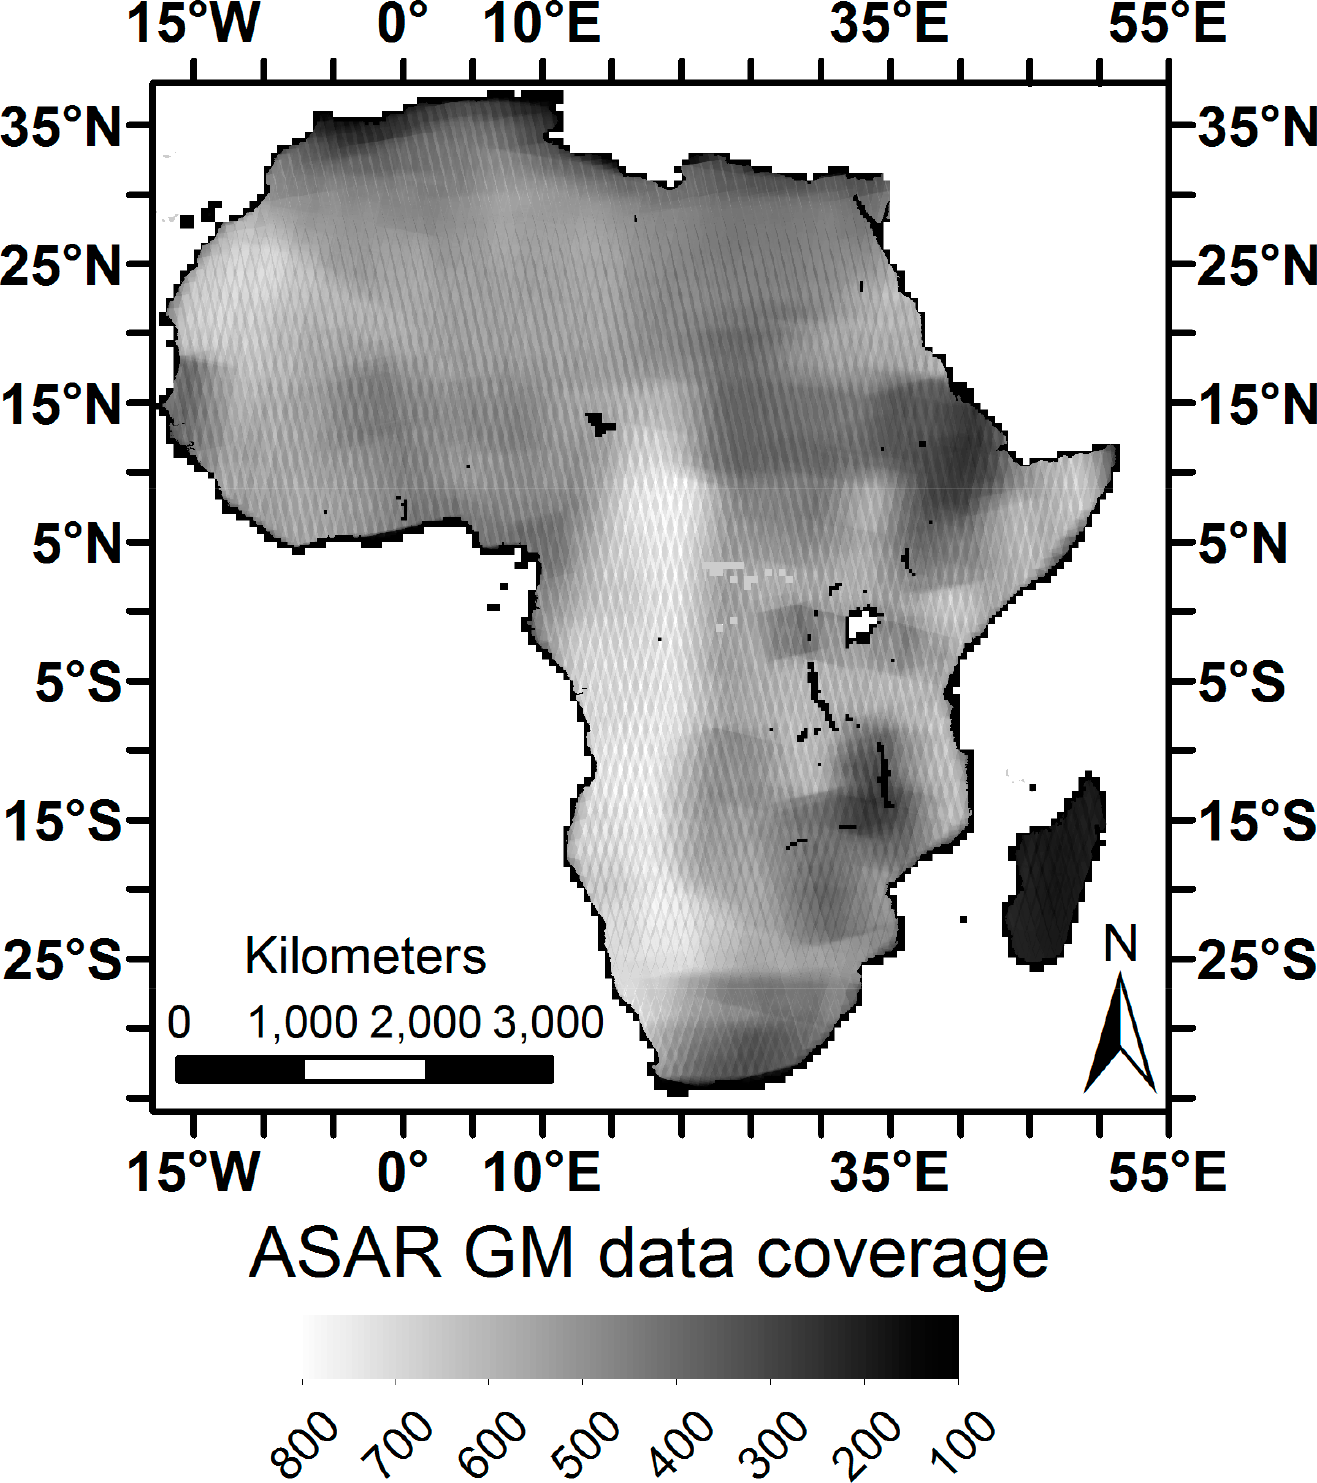
In total, more than 18,000 ASAR GM over the whole continent and 1100 ASAR WS images over Zambezi catchment were processed. For the evaluation of WS data, the Zambezi catchment was chosen due to the high coverage of WS acquisitions in the area. Erroneous datasets (exceptionally high or low backscatter values, strong striping within an image and shifted images) were removed. The resulting ASAR GM SSM data coverage is shown at Figure 1. Limited coverage in some areas is due to conflicting data acquisitions in other modes.
2.2. Reference Datasets
2.2.1. AMSR-E VUA SSM
The AMSR-E SSM is derived from the C-band brightness temperature using Version 3 of the Land Parameter Retrieval Model [28] by Vrije Universiteit Amsterdam (VUA). It represents the volumetric soil moisture (m3/m3) in the near-surface soil layer (<3 cm) at the original spatial resolution of 56 km (resampled to a grid with a sampling distance of 0.25°). Only soil moisture retrievals based on descending (night-time) orbit data were used, as these are expected to be more accurate than day-time acquisitions due to the reduced difference between the surface and canopy temperature at night [2].
2.2.3. GLDAS-NOAH SSM
The GLDAS-NOAH model contains land surface parameters simulated from the Noah model in the Global Land Data Assimilation System [29]. The SSM dataset represents the modelled soil moisture information in the upper soil layer (approximately 0–10 cm) at a spatial resolution of 0.25°.
2.3. Ancillary Datasets
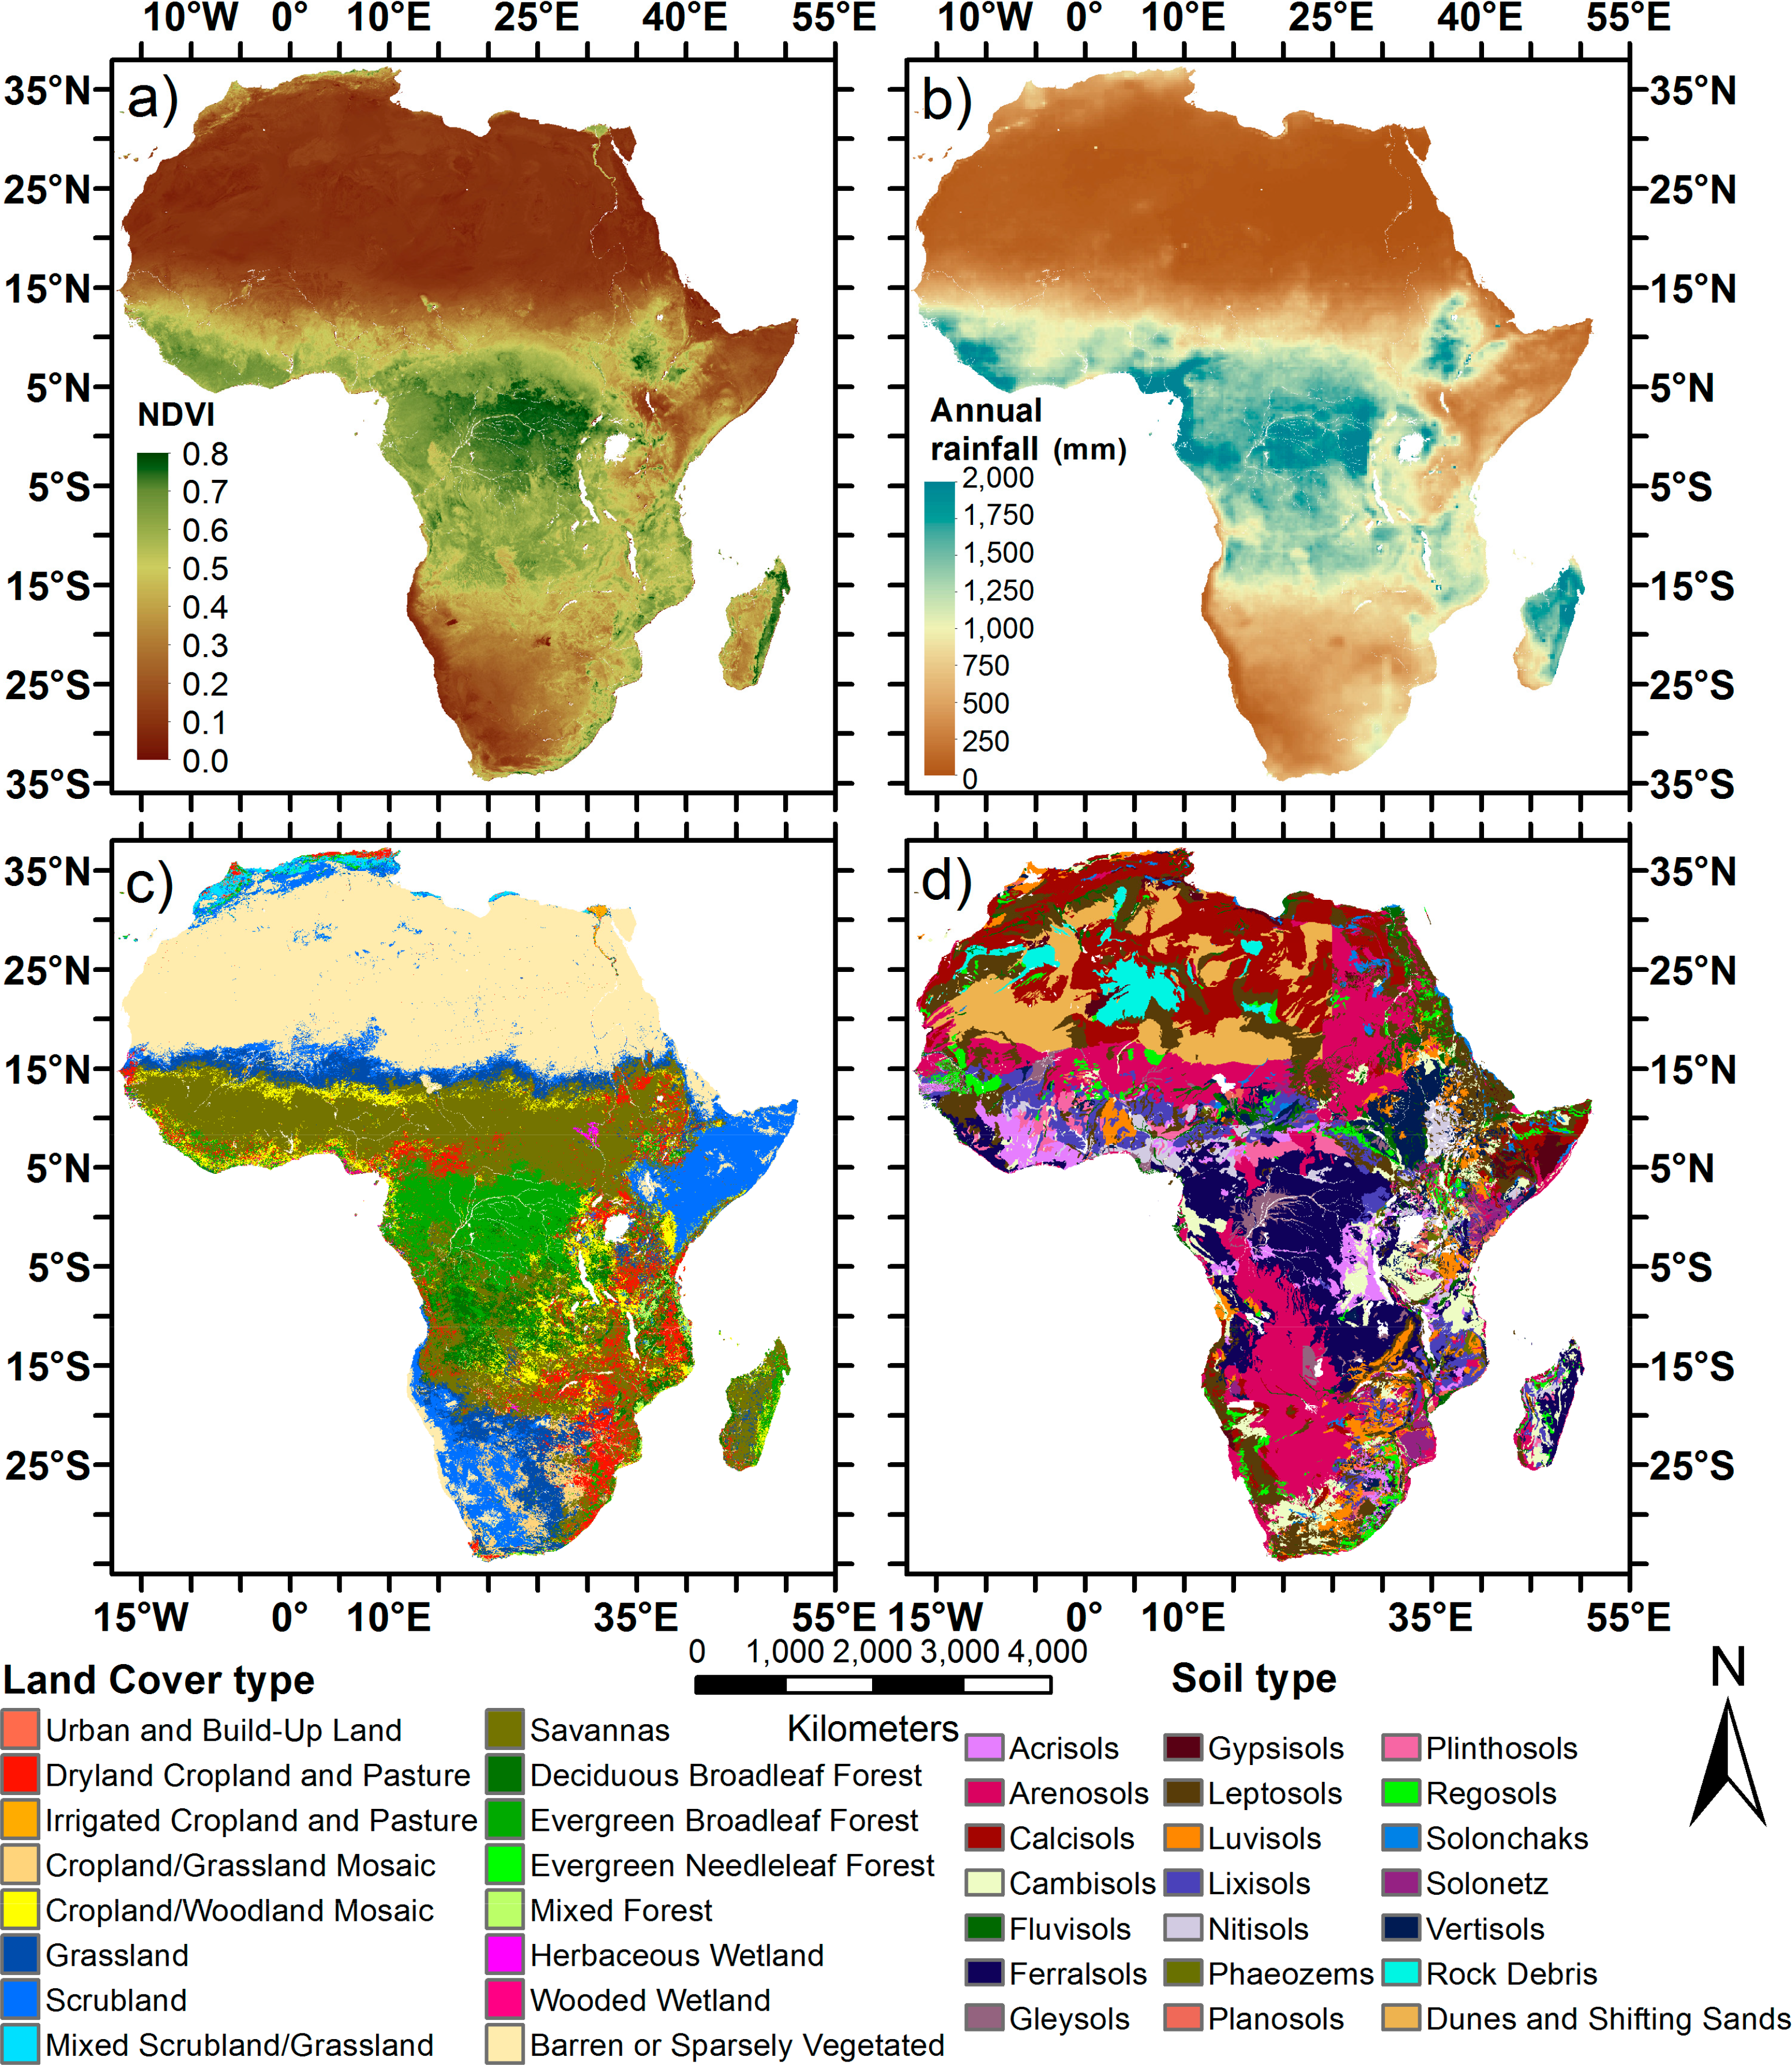
The land cover information is retrieved from the U.S. Geological Survey Global Land Cover Characteristics (USGS GLCC) Land Use/Land Cover System (data available from the U.S. Geological Survey) [30]. For the soil type information, the Harmonized World Soil Database (HWSD) was used (data available from the International Institute for Applied Systems Analysis) [31]. Mean yearly precipitation was computed from the Tropical Rainfall Measuring Mission (TRMM) monthly rainfall data (TRMM 3B42 V7 product available from NASA Goddard Earth Sciences Data and Information Services Center) [32] and the mean Normalized Difference Vegetation Index (NDVI) from Moderate-Resolution Imaging Spectroradiometer (MODIS) NDVI measurements between 2005 and 2011 (the MOD13Q1 product available from NASA Land Processes Distributed Active Archive Center, USGS/Earth Resources Observation and Science Center) [33]. The ancillary datasets are shown in Figure 2.
3. Methods
A variety of statistical metrics exists for quantifying the agreement between datasets. Each metric is robust with respect to some attributes and relatively insensitive or incomplete with respect to others. For example, if there is no variation in the real soil moisture content, there may not be any linear correlation between soil moisture datasets, even though the datasets may be accurate in absolute terms. On the other hand, the retrievals can be biased in their mean and dynamic range, but still well reproduce the temporal variability [34] and can be useful in data assimilation if the biases are corrected and the errors are small relative to the model prediction errors. In this study, two common bivariate error measures were used: the Pearson correlation coefficient (R) as a measure of linear dependency and the root mean square difference (RMSD) as a measure of the closeness of the ASAR SSM dataset to the reference dataset.
In case of a strong seasonality of soil moisture, R results will be dominated by the seasonal variation and will not reflect the ability of the product to detect single events [5]. To avoid this limitation, R is computed for both the original soil moisture values and the SSM anomalies (SSManom). The anomalies are computed following Brocca et al. [2] with a modification of a longer time window:
To reduce the radiometric noise and to provide a better signal-to-noise ratio, the ASAR SSM dataset was spatially averaged to 5-km resolution following the recommendations of preceding studies [17,18]. The R and RMSD were computed between the ASAR 5-km pixel and the nearest acquisition of the AMSR-E and GLDAS-NOAH, respectively. The measures were computed for the entire continent with the exception of land cover classes where the soil moisture retrieval is not possible. These classes were selected using the USGS GLCC Land Use/Land Cover System and include urban areas, water bodies and densely vegetated areas (represented by the class of evergreen broadleaf forest). Temporal matching of the datasets was performed separately for ASAR SSM, GLDAS-NOAH and AMSR-E SSM, respectively. A maximum difference of 12 h between the satellite acquisitions was allowed in the case of ASAR and AMSR-E data. To remove bias and to overcome the problem of different units (%, m3/m3, kg/m3), the linear regression transformation of the reference datasets to the ASAR SSM was applied. The resulting RMSD highlights the random errors between the datasets.
The evaluation metrics were assessed for different land cover classes and soil types. In the case of 1-km resolution ancillary data, the prevailing class within the 5-km resolution evaluation pixel was selected. Based on our results, a new mask was proposed that distinguishes between areas where the TU Wien algorithm is well suited for the soil moisture retrieval from ASAR observations from those where the algorithm fails. Finally, possible causes for algorithm failure were proposed.
In the final section, the possible improvements of the evaluation results are assessed when the ASAR GM algorithm is transferred to data with improved radiometric resolution (i.e., Sentinel-1). The ASAR WS data aggregated to 1-km spatial resolution was used for the evaluation and the results were compared both to the 1-km and aggregated 5-km GM product. Due to the lower temporal resolution of the WS data, the SSM anomalies were not computed, and only GLDAS-NOAH SSM was used as a reference. The above specified spatial and temporal matching of the data, as well as the linear regression transformation applies also for 1-km resolution data.
4. Results and Discussion
4.1. Correlation Results Analysis
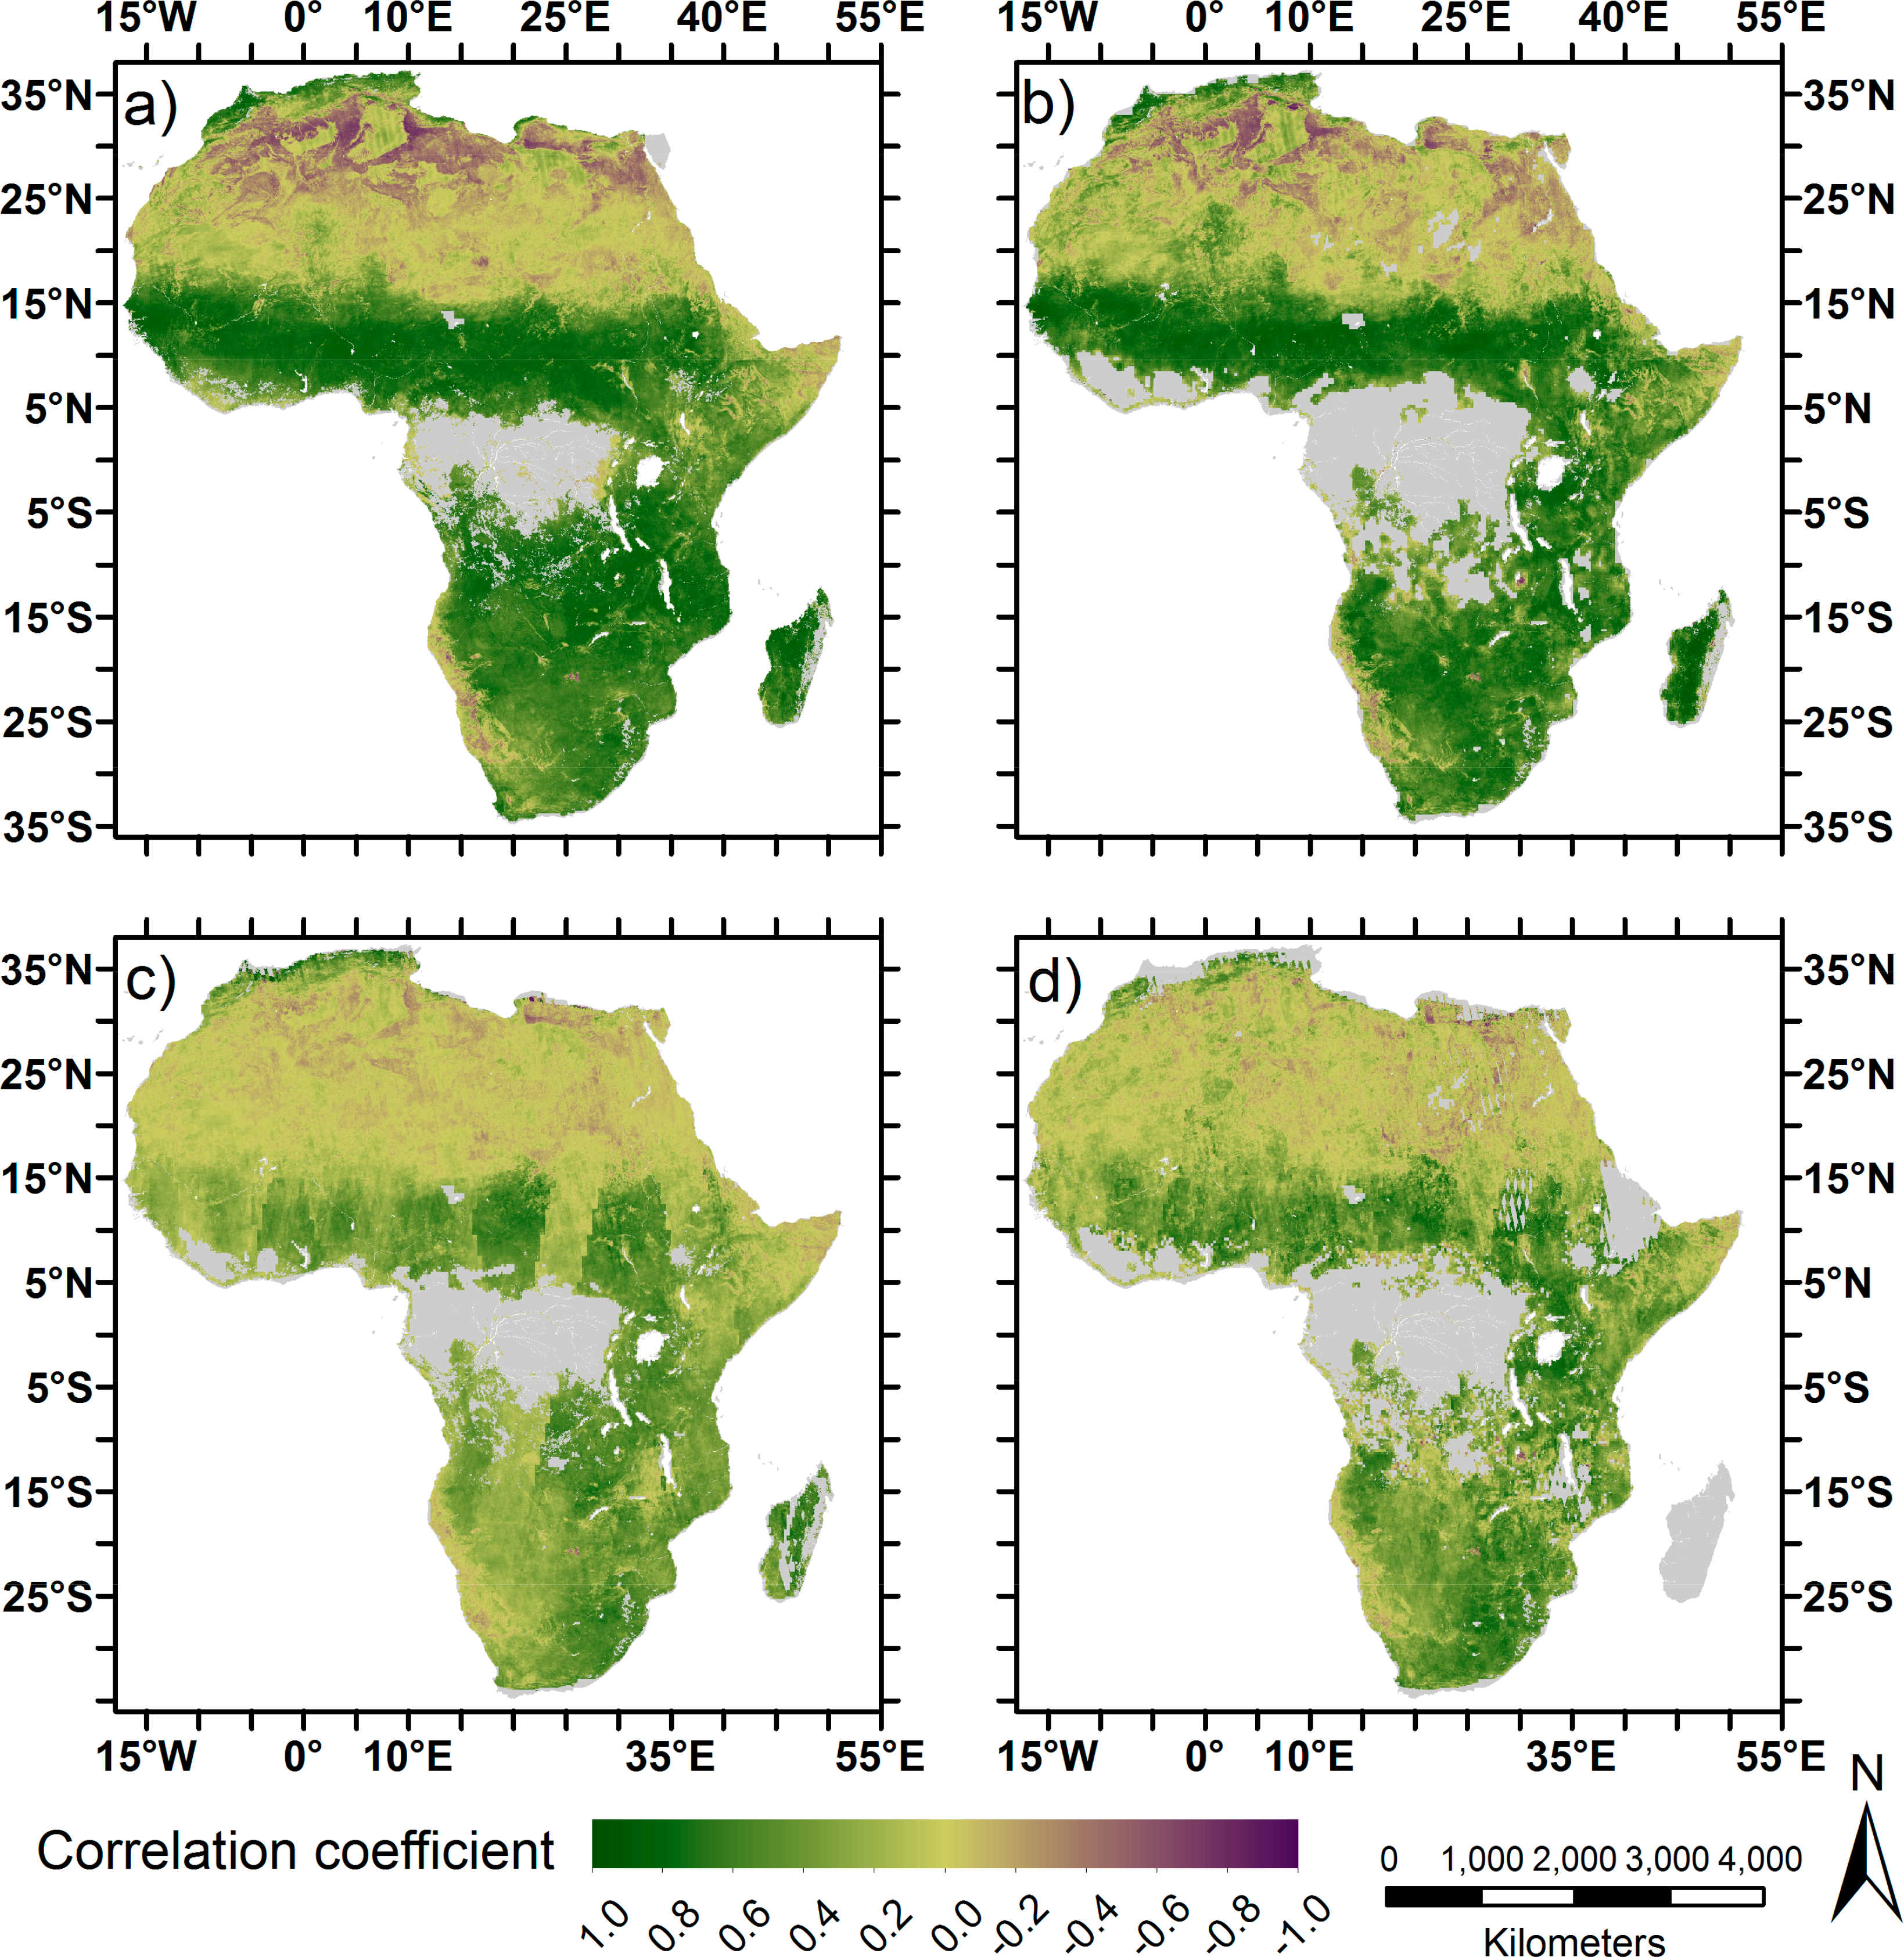
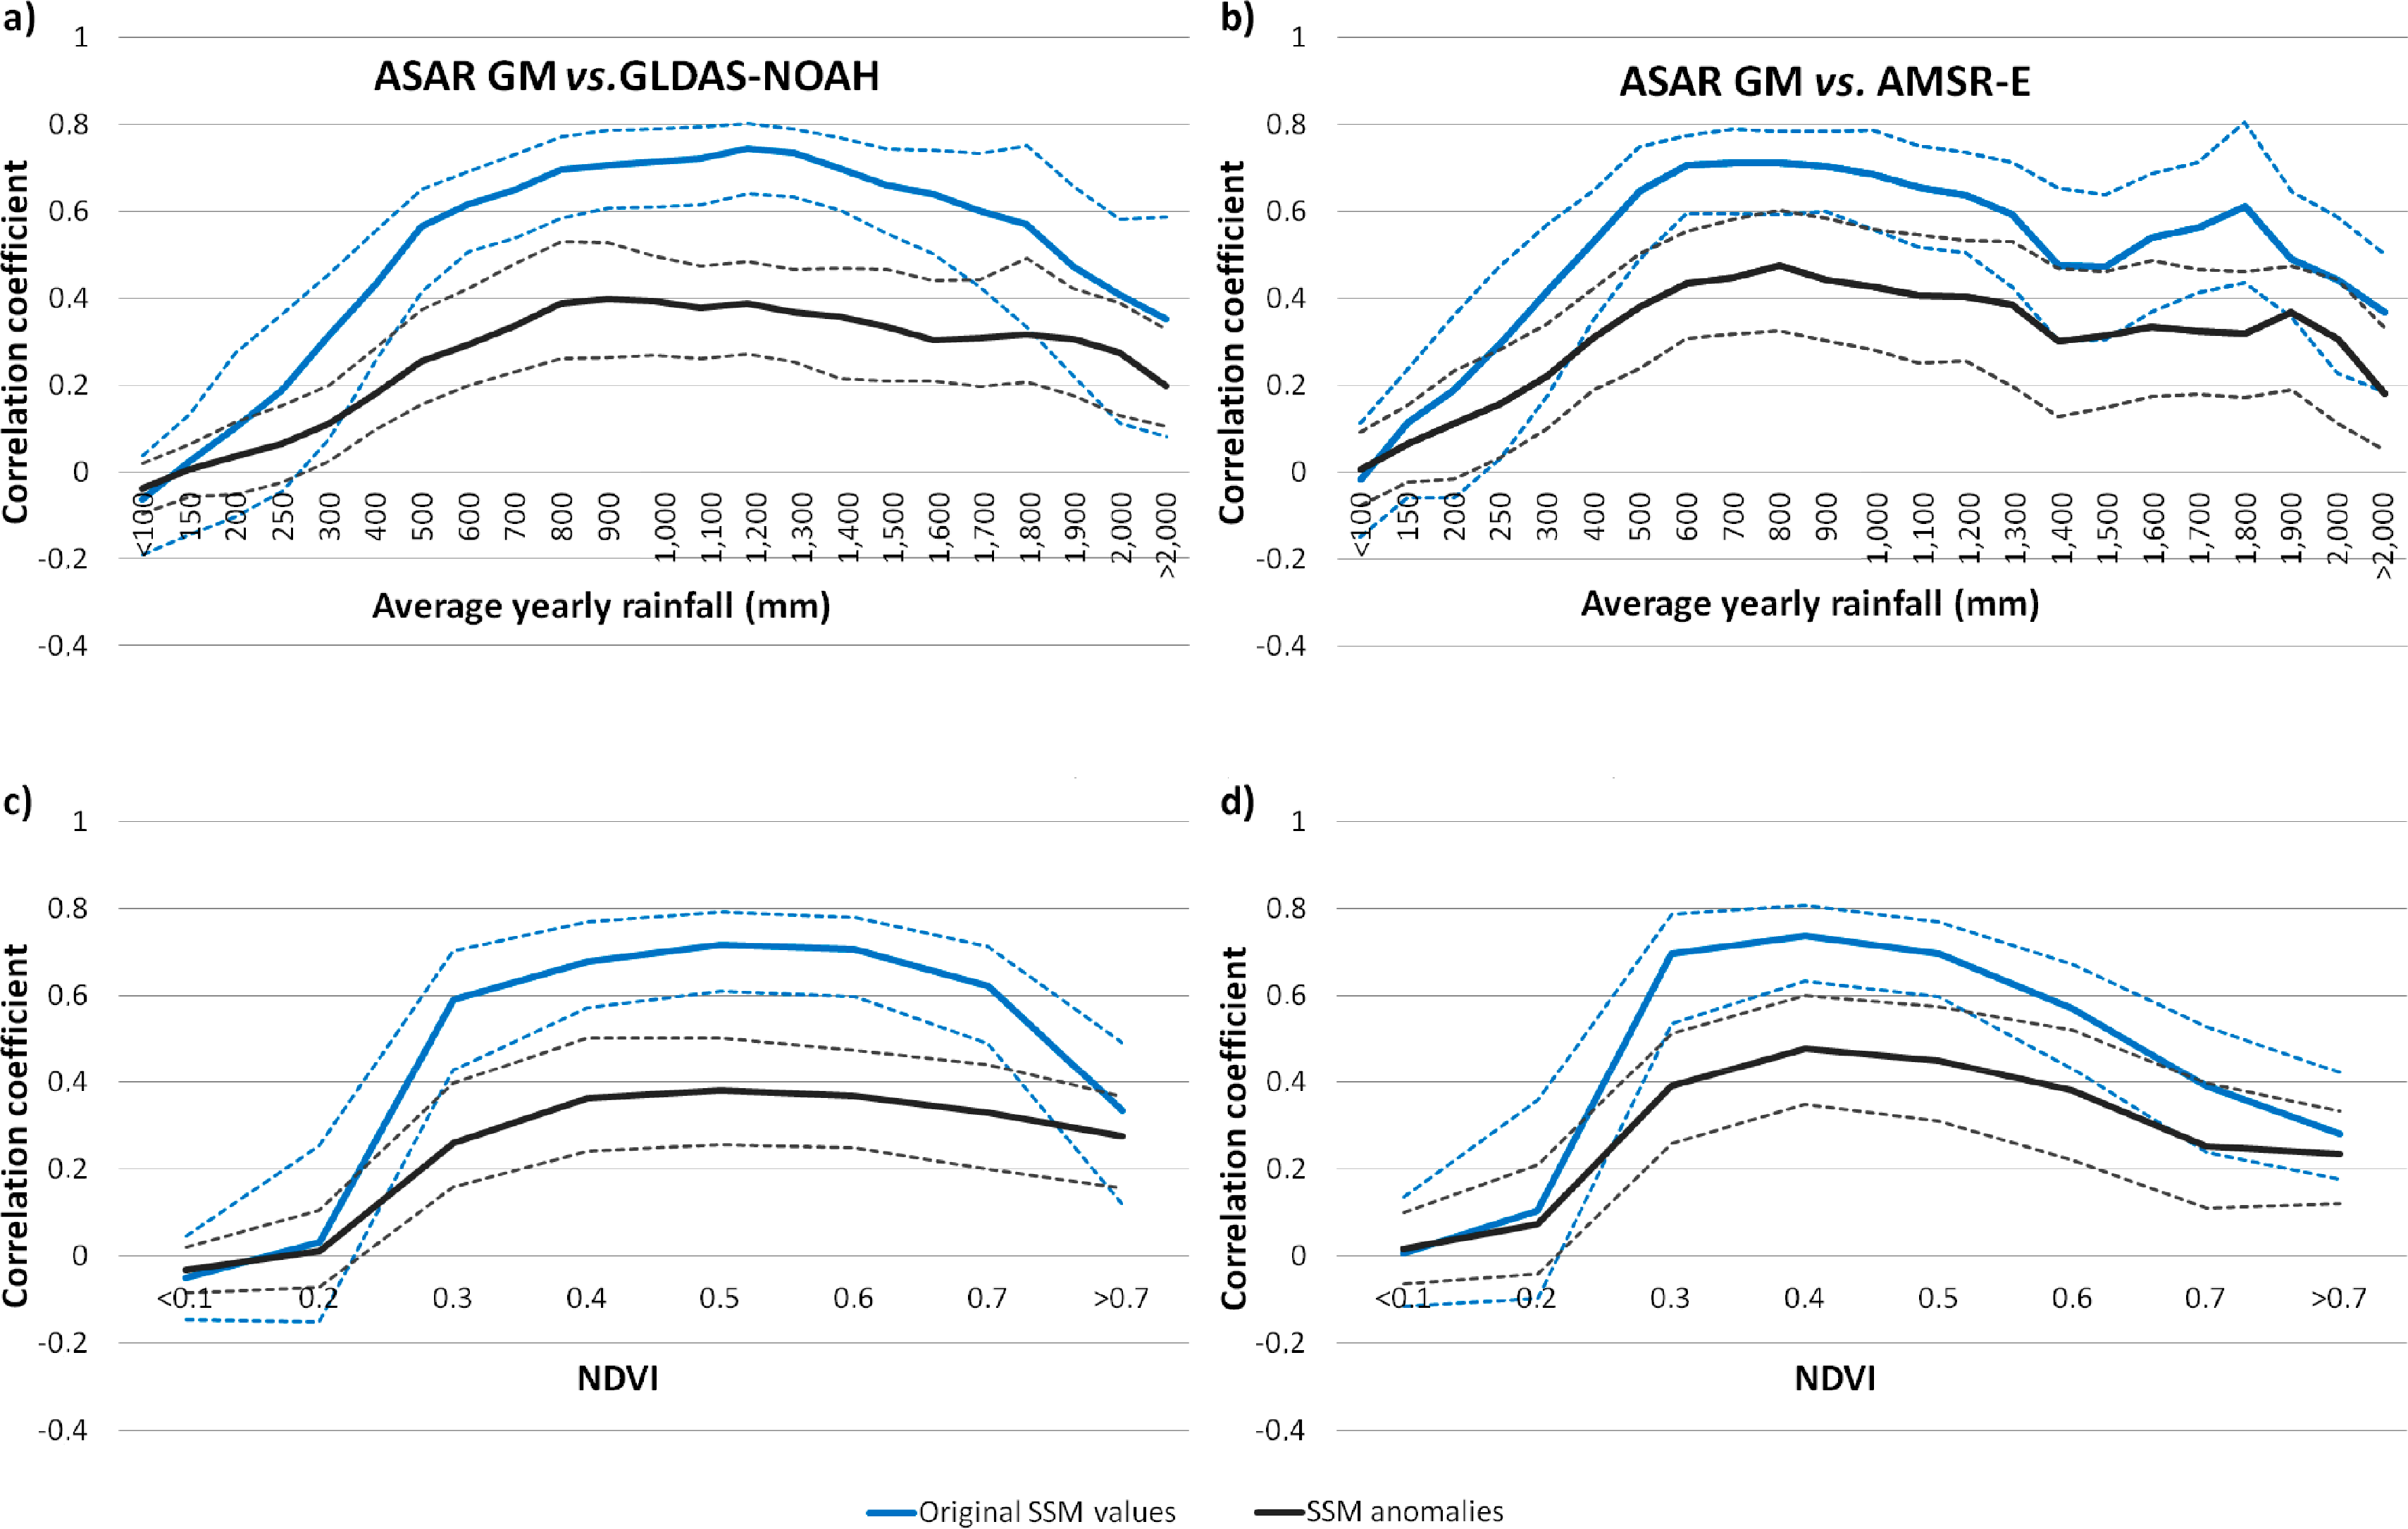
The correlation results (Figure 3) indicate a good ability of the ASAR GM to depict SSM variability over areas with mean annual rainfall greater than 300 mm and mean NDVI above 0.2 (Figure 2a,b) The mean R over the entire continent equals 0.35 and 0.34 for SSM values for AMSR-E and GLDAS-NOAH, respectively. As expected, the corresponding mean R for the SSM anomalies is lower (0.23 and 0.2, respectively) due to the lower variability of the SSM anomalies time series. It should be reiterated that urban areas, water bodies and vegetated areas are not included in the latter results. Arid and semi-arid regions (precipitation < 300 mm/year and NDVI < 0.2) are dominated by correlation values below 0.3. In some areas, negative correlation values down to −0.7 are found. Such negative correlations have been previously observed at the C-band between scatterometer acquisitions and modeled SSM [35]. The assumption is that the inverse behavior may be attributed to enhanced backscatter due to the volume scattering over very dry soils [1]. The highest positive correlations of original SSM values (>0.6) were found over areas with sufficient rainfall (500 to 1500 mm/year) and moderate vegetation cover (mean NDVI of 0.3 to 0.6). Correlation values of the SSM anomalies are generally lower (∼0.4) in these areas. The results suggest that the ASAR GM SSM product can capture the seasonal cycle of soil moisture well, whereas its ability to represent single precipitation events is lower. The possible reasons may be the low ASAR GM radiometric accuracy. The correlation values sharply increase towards middle NDVI (∼0.4) and precipitation values (∼800 mm for GLDAS and ∼600 mm for AMSR-E) and then stagnate to decrease towards denser vegetation and higher annual rainfall. The dependency of R on precipitation amount and vegetation density is shown in Figure 4. The figure also depicts the lower R values at higher vegetation density when computed with AMSR-E as a reference (Figure 4d). Dorigo et al. [36] made similar observations and attributed the behavior to the lower quality of the AMSR-E product over vegetated areas.
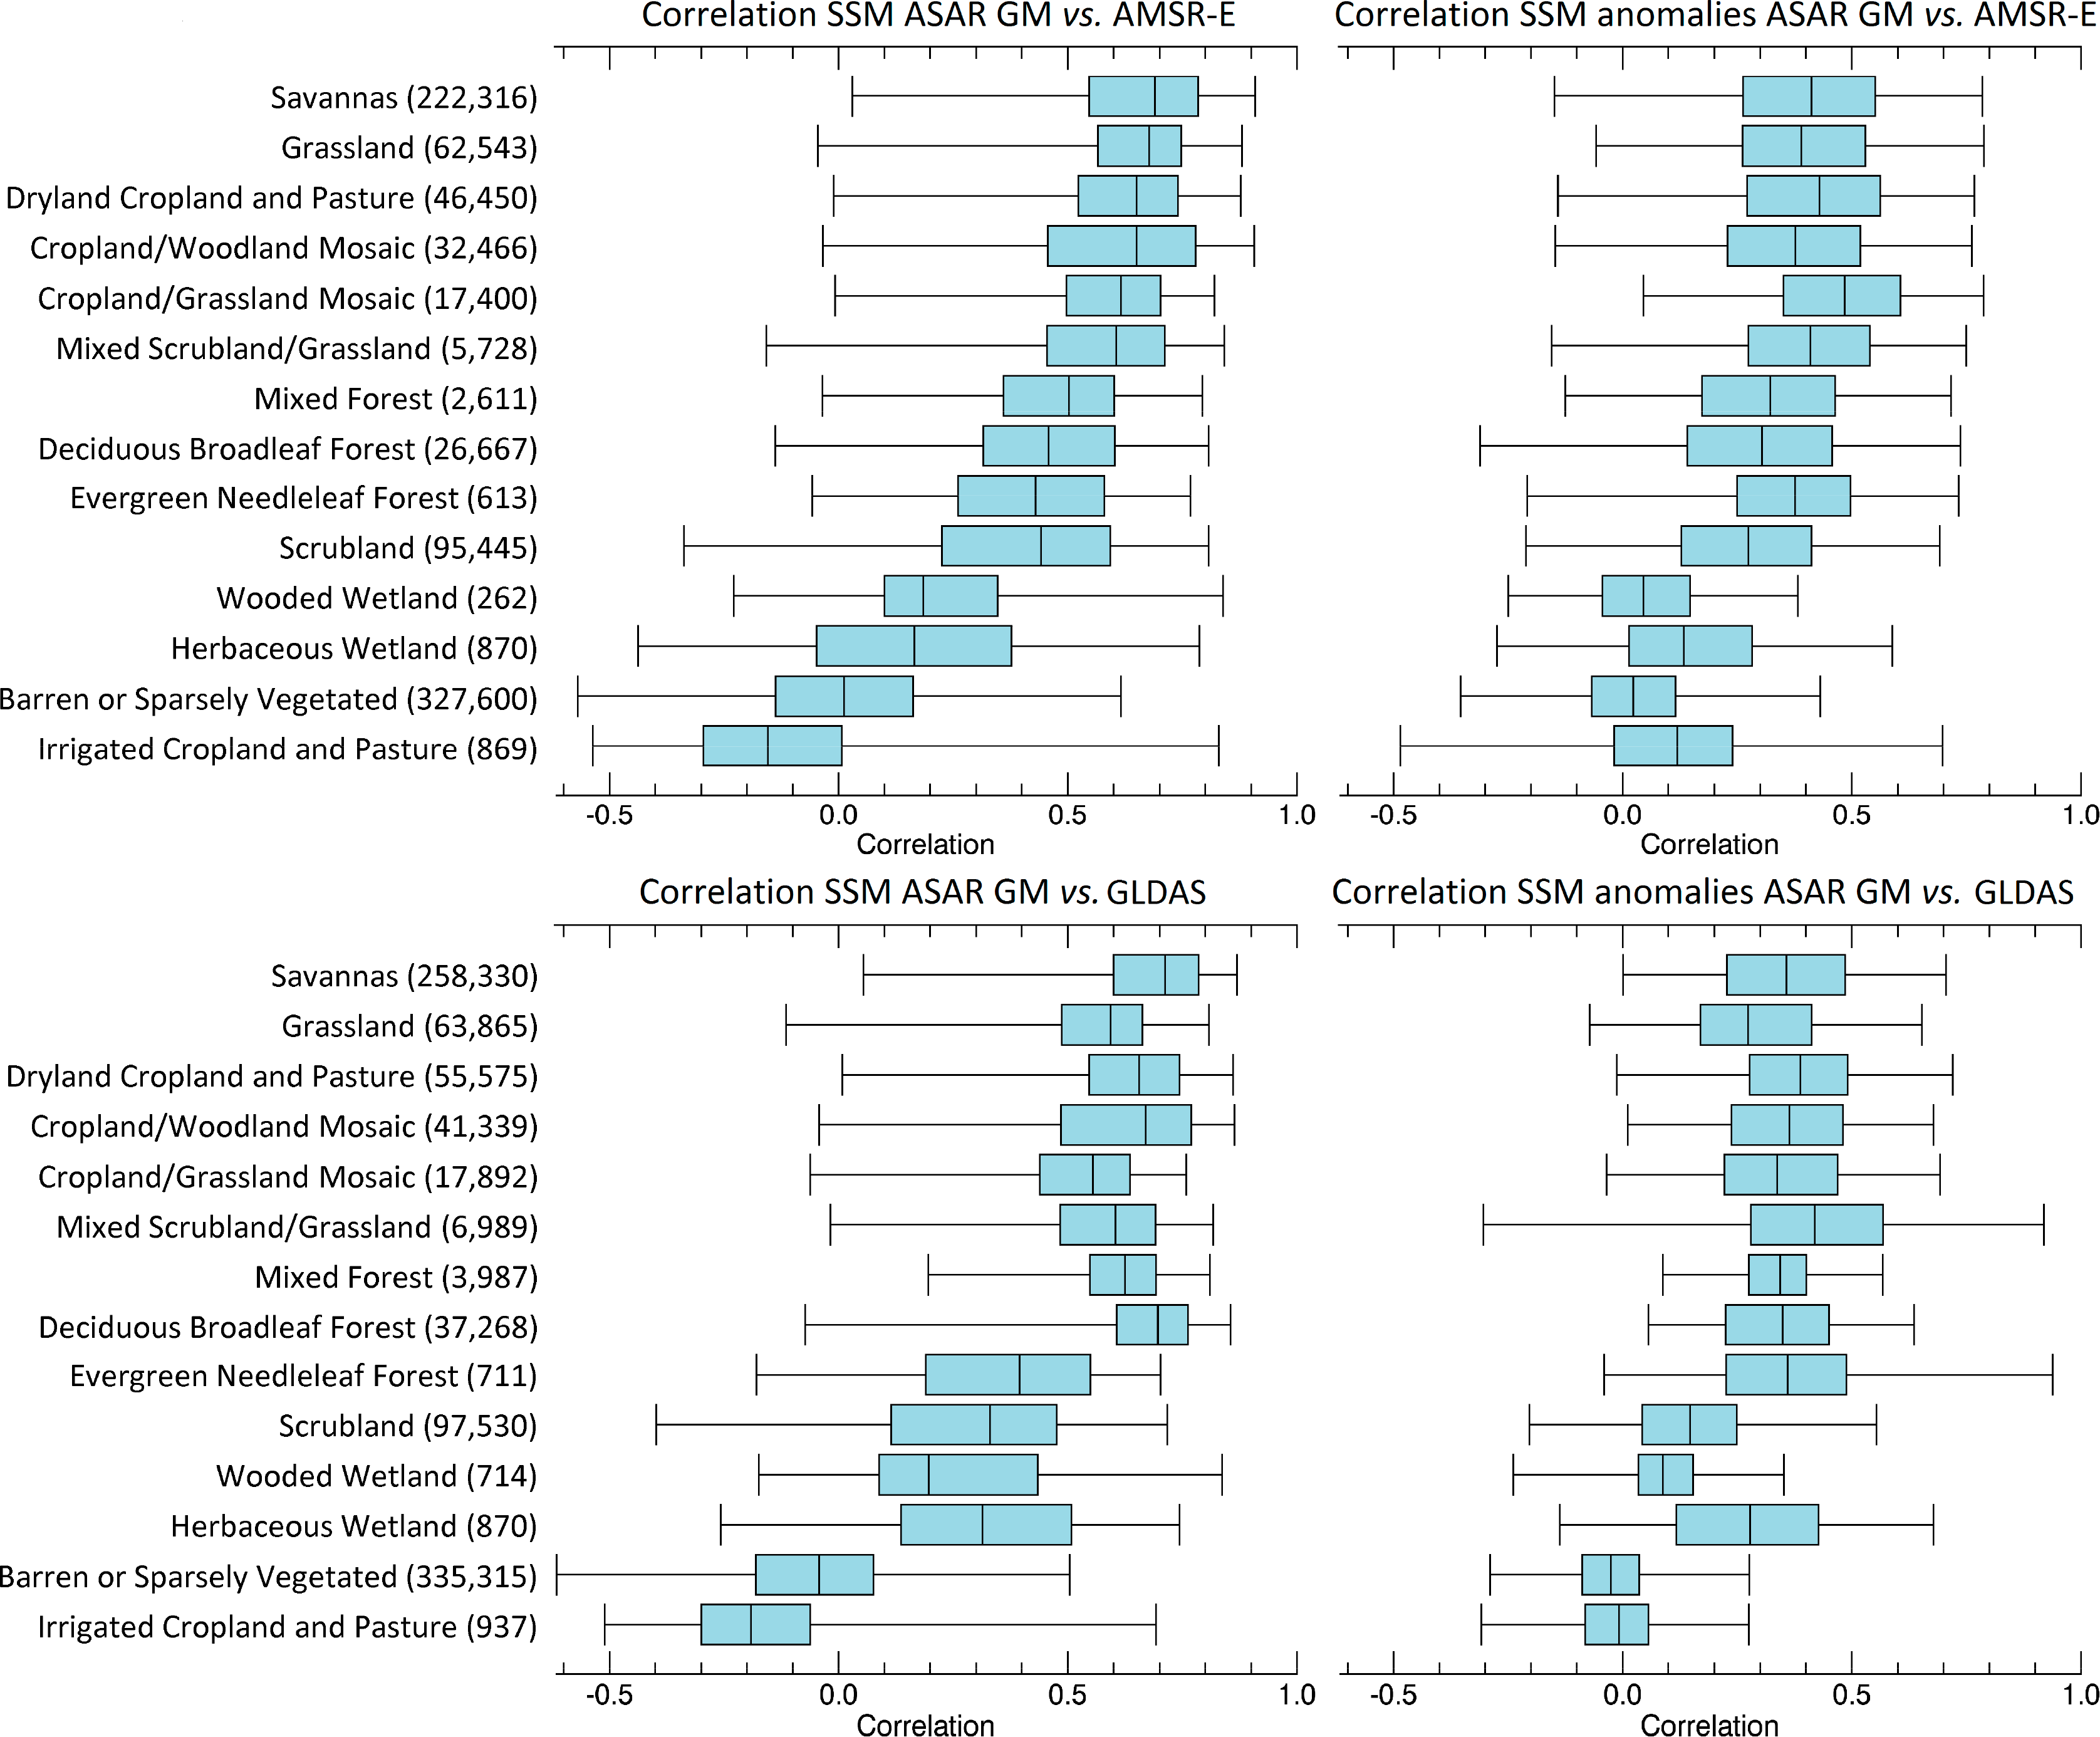
The R values close to zero are found over desert areas and also over the irrigated cropland and pasture classes (Figure 5). A significant portion of the latter class is composed of the regularly flooded vegetated areas in the Nile Delta. Similarly, a weak correlation (R = ∼0.3) is found over wetlands. In both cases, the change detection algorithm is hampered by the backscatter decrease, due to the regular flooding. The scrubland class according to the USGS GLCC represents a wide variety of regions. In particular, it spreads over areas with average yearly rainfall between 100 and 500 mm/year. This causes the range of R values to be between 0.1 and 0.6.
The R values for anomalies are less stratified by the land cover class when compared to the absolute values. The possible reason is that the impact of the ASAR GM noise on the R values is higher than the impact due to the vegetation attenuation. Furthermore, the influence of the strong seasonal cycle causing the large variability of SSM values in some land cover classes (i.e., savannas) is reduced.
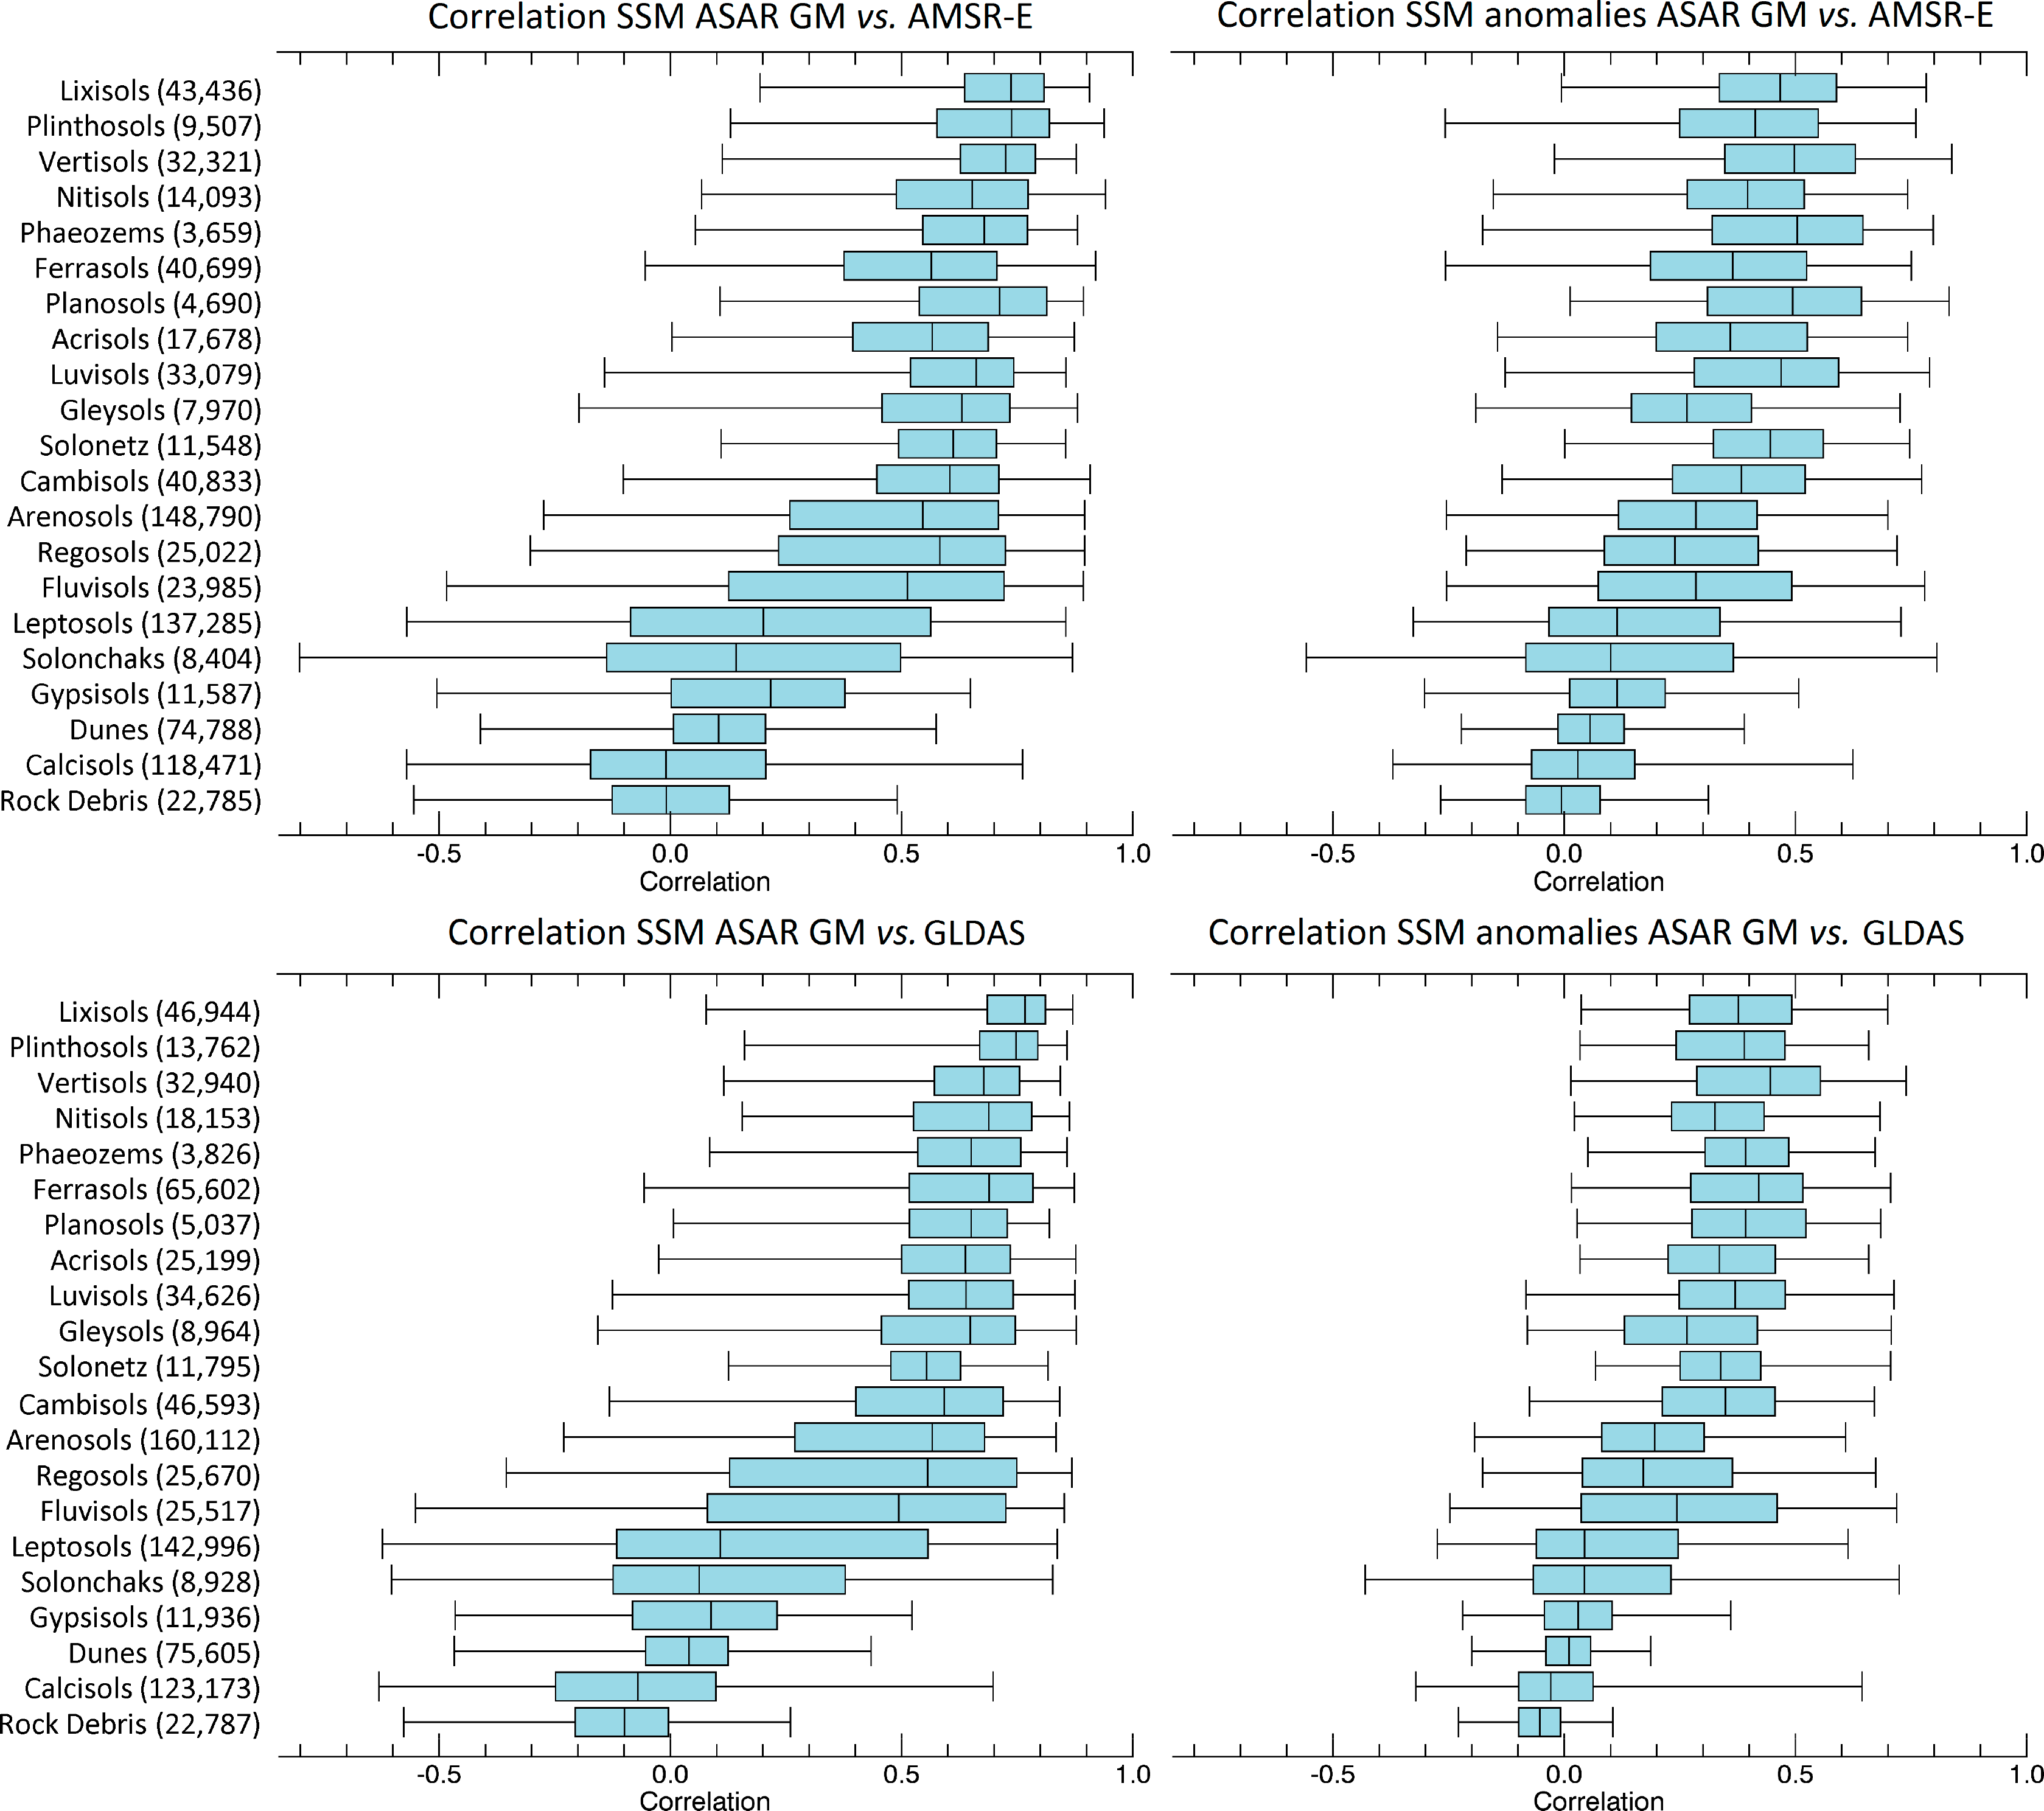
As for the soil types, high correlation values are found over the tropical and sub-tropical soils connected to pronounced dry and wet periods over these regions (i.e., Plinthosols, Lixisols or Vertisols) (Figure 6). Strong seasonality with repeated wetting and drying of these soil types is well captured in ASAR GM SSM data, resulting in median correlation values around 0.7. The lowest R values are found over the soils connected with permanently dry environments, such as Calcisols and Gypsisols, or over Solonchaks, characterized by soluble salt accumulation.
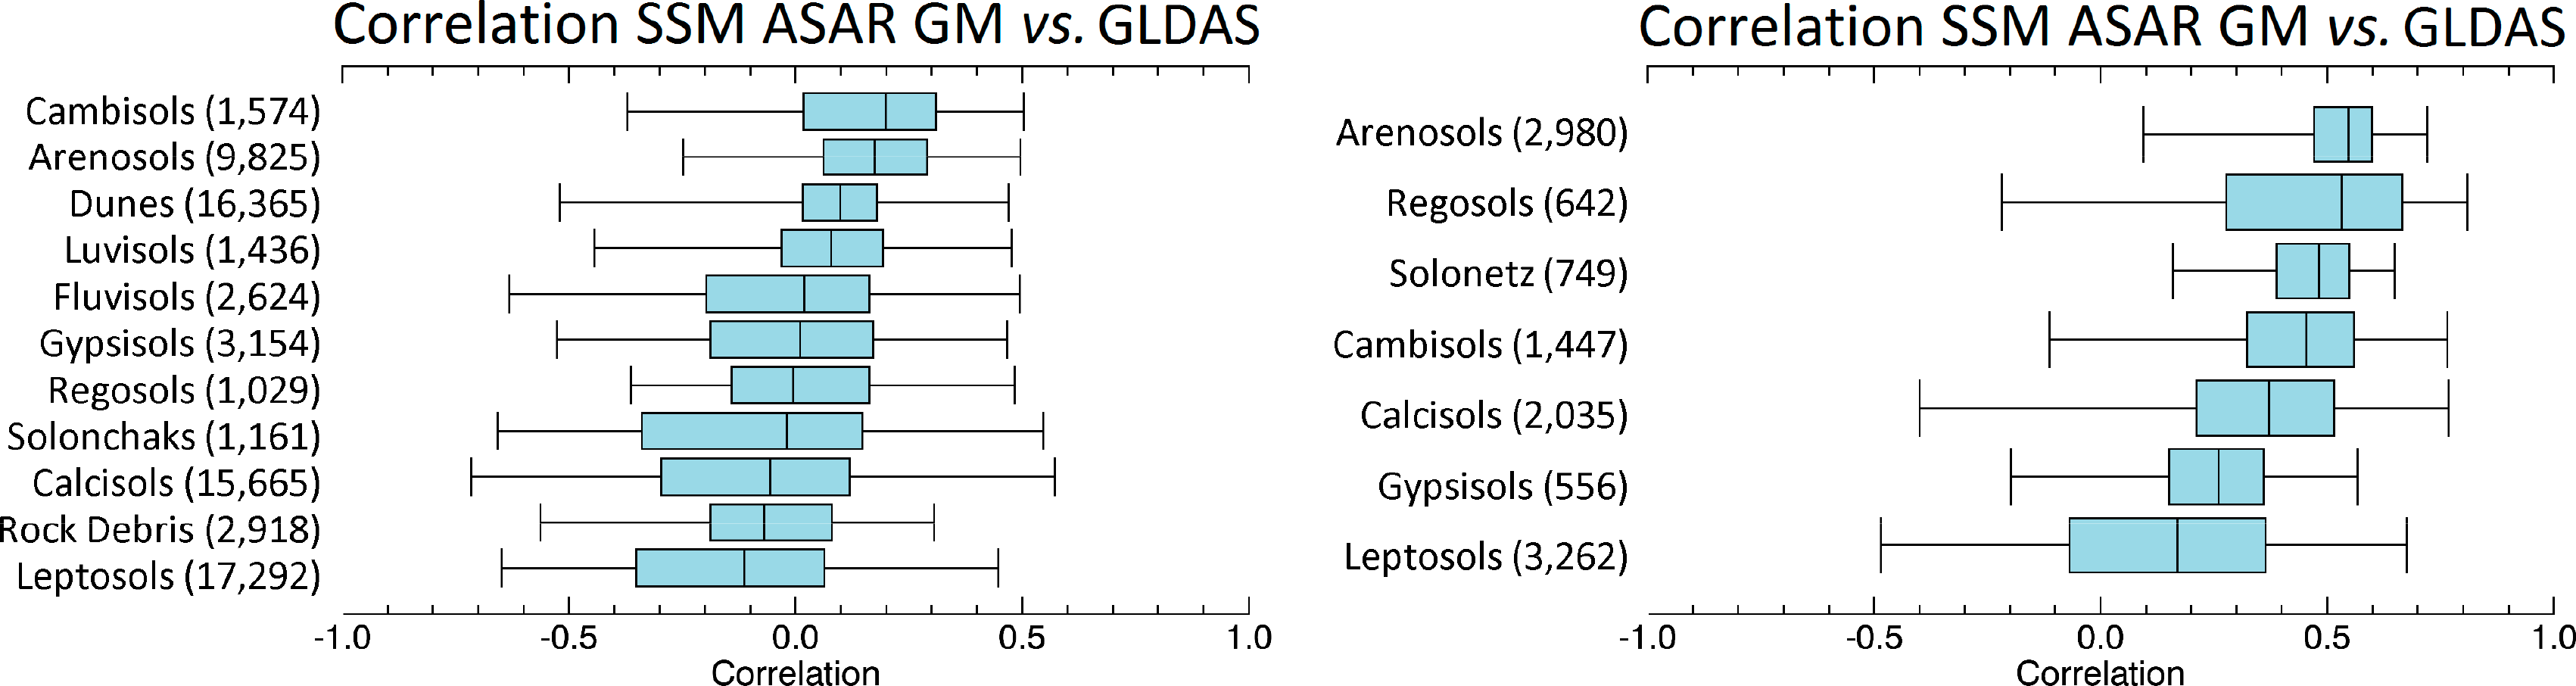
Strikingly low and even negative correlation values can be found in arid regions that appear to be related to soil type composition (Figure 2b). To quantify this relationship, the R values were computed for different soil types over Barren or sparsely vegetated land cover classes with annual rainfall between 100 and 250 mm (Figure 7a). Generally, the correlation values are close to zero, but the distribution over various soil types differs. The lowest correlation values can be found over Calcisols, Leptosols and Solonchaks with a median value of about −0.1, whereas Cambisols and Arenosols show a median correlation of 0.2. Similarly, differences in the correlation results can be observed also in other land cover classes and precipitation ranges. A strong dependency on soil type is observable; for instance, in the case of the land cover class, scrubland, combined with an annual rainfall between 400 and 500 mm, and the median correlation varies between 0.17 in the case of Leptosols and 0.55 in the case of Arenosols (Figure 7b).
The Calcisol top-layer soil is traditionally crumb or granular. Although it has good water holding properties, slaking and crust formation may hinder the infiltration of rain water and cause surface run-off. The Leptosols soil group is widely spread with different physical and hydrological properties, but generally, it is defined as very shallow (<25 cm) soils over hard rock or extremely gravely and/or stony deeper soils. The Arenosols group consists of sandy soils. It is usually deep and has less than 35% of rock fragments within 100 cm of the soil surface, enabling good sensitivity to surface soil moisture. Cambisols are typically medium-textured and have a high porosity and a good water holding capacity [37]. Clearly, the soil structure and hydrological properties influence the behavior of backscatter over arid areas. This topic requires further research together with detailed and precise soil information.
4.2. RMSD Results Analysis
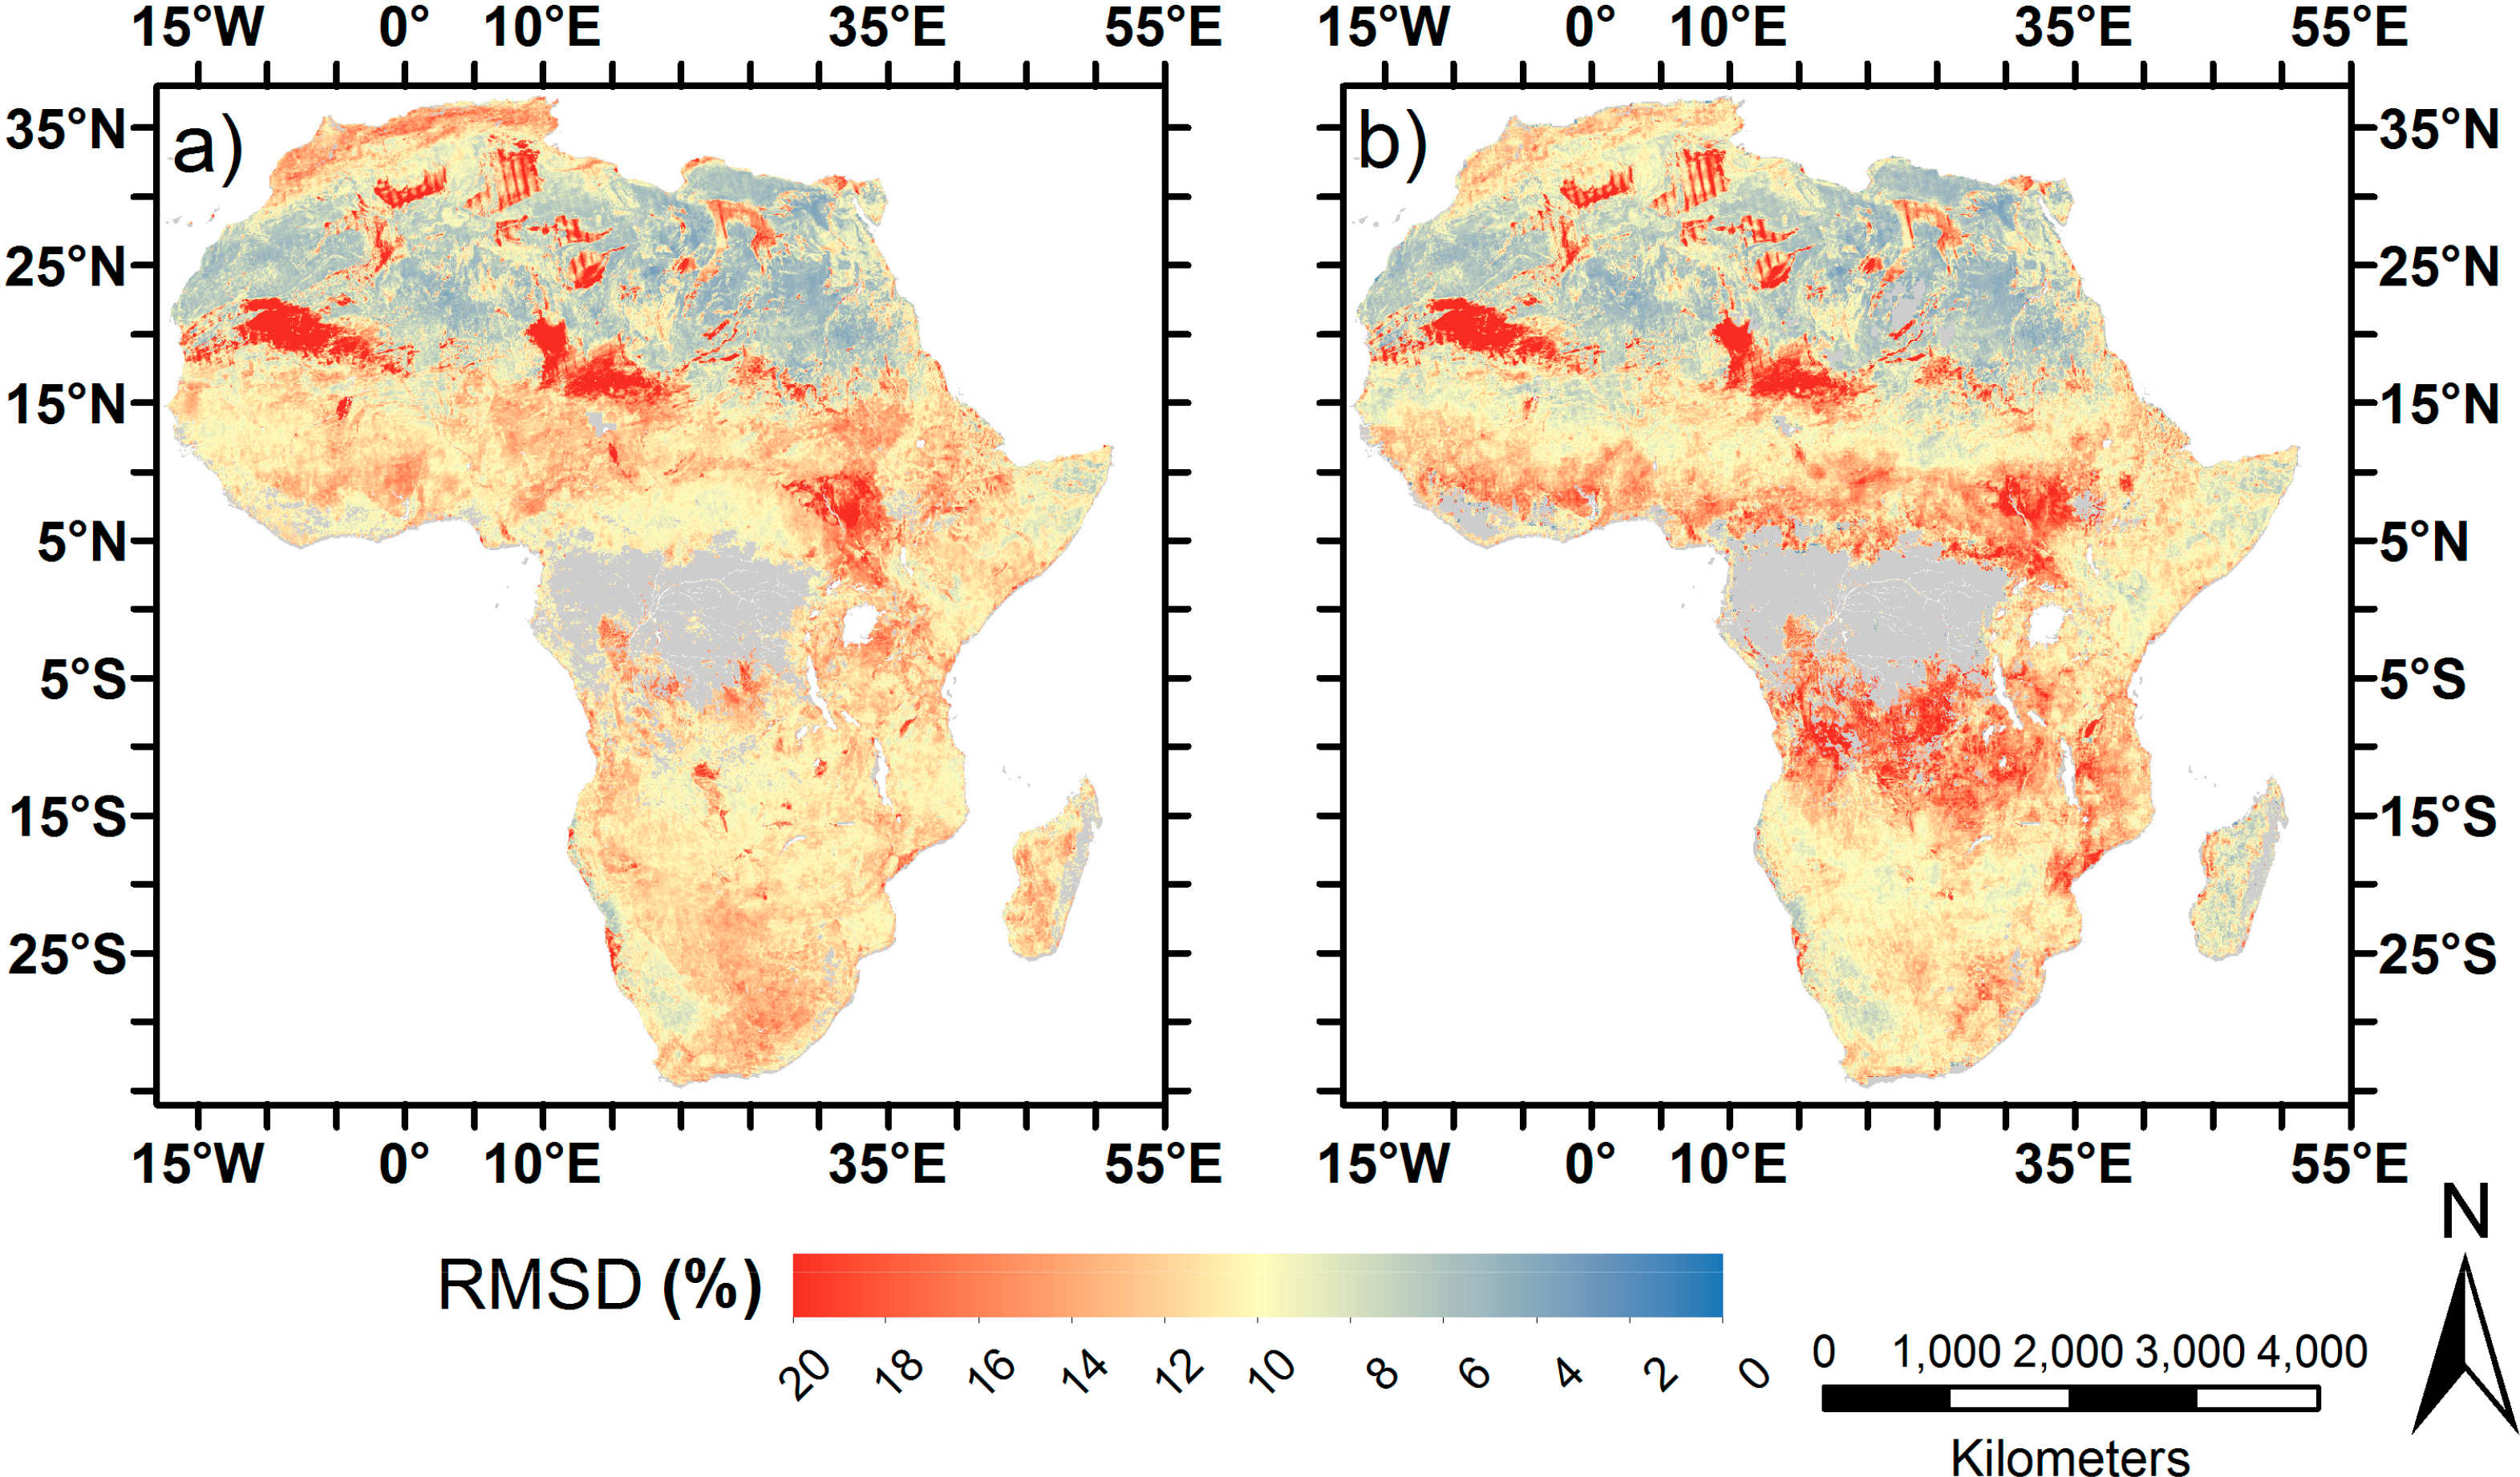
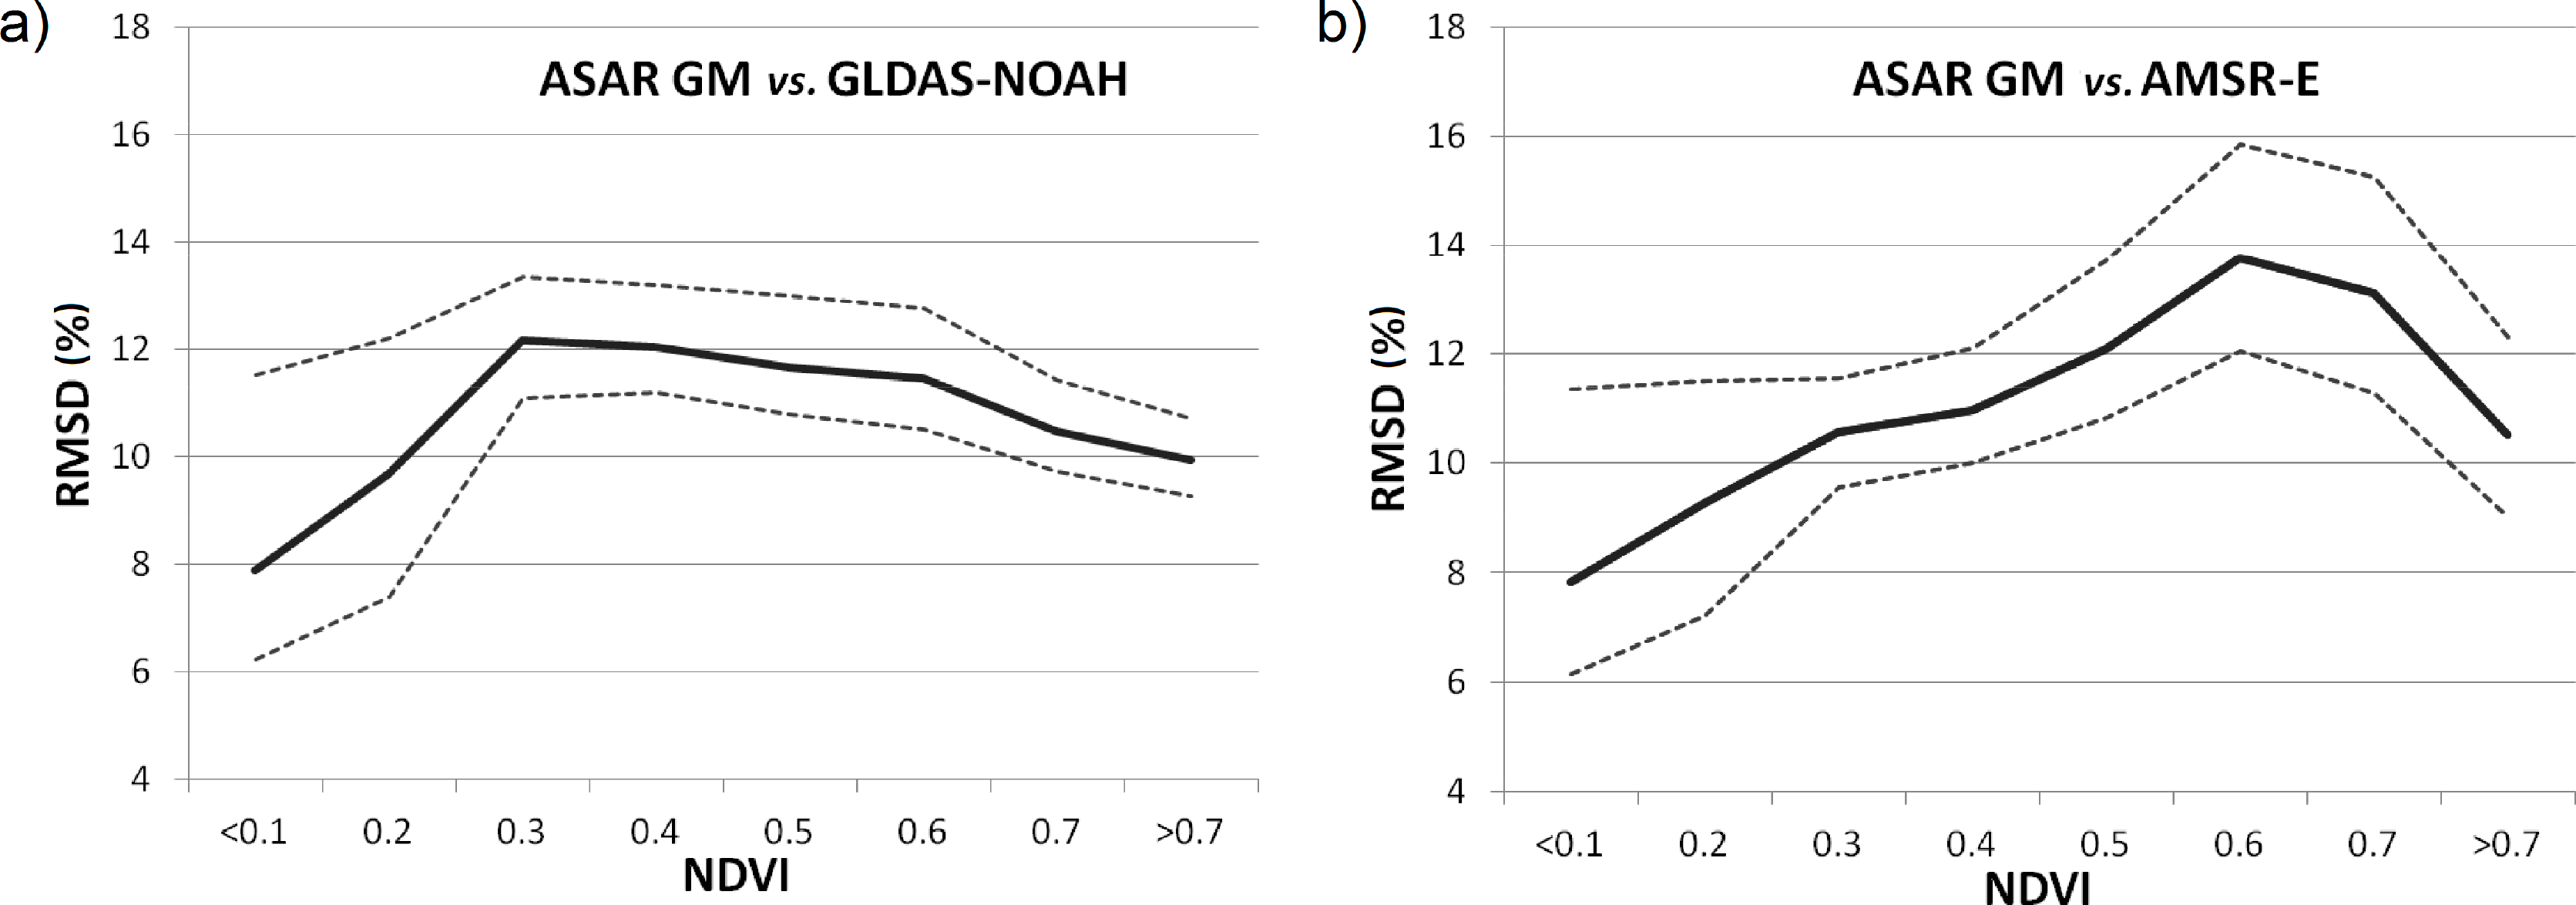
The overall patterns of the RMSD maps (Figure 8) reflect the large-scale precipitation forcing and the vegetation and geomorphological structures at medium (∼5 km) scales. The distribution of RMSD values can be divided into areas with high RMSDs over regions with higher annual rainfall (>250 mm) and those with relatively low RMSD values over dry regions (<250 mm) (Figure 2a). This was expected, as the magnitude of the RMSD is also dependent on the local variability of soil moisture [38]. The RMSD maps correspond quite well over sparse vegetation with lower values of about 1.5% for AMSR-E and differ over vegetated areas (NDVI > 0.5) (Figure 9). Similarly, a decrease in correlation values between ASAR GM and AMSR-E was observed for NDVI > 0.5 (see Figure 4d). In the case of GLDAS-NOAH, the RMSD values remain relatively stable for NDVI values between 0.3 and 0.7. This discrepancy can be explained by the higher error of the AMSR-E when compared to active microwave sensor acquisitions over vegetated areas [36]. The mean RMSD is, however, identical (11%) for both maps and corresponds also to the mean RMSD at 5 km over Australia, reported in [26].
As expected, the R values remain low over desert areas due to the lack of soil moisture variability. On the other hand, the RMSD maps show the large variability of values in these regions (Figure 6). While in some desert areas, the RMSD remains relatively low (<8%), as expected, given the low soil moisture variations, the RMSD values can reach up to 20% to 35% elsewhere in the desert. Such extremely high values were not found over other continents [17,26] and, therefore, deserve more attention.
To investigate the origin of the large RMSD variations over deserts, analyses of the backscatter dependence on the local incidence angle were performed. Generally, the change detection algorithm assumes a linear dependency of the backscatter on the local incidence angle and accounts for this by normalizing the backscatter to the local incidence angle of 30° using a regression line [17]. However, this assumption is hampered over desert areas with an RMSD over 20%. The observed limitations can be separated into two groups. Figure 10a represents a location with RMSD values over 20%. In this area, the backscatter from the descending and ascending orbits of the ASAR GM suffer a bias that devaluates the data normalization fit and adds an additional non-random error to the normalized data. The strong bias can be explained by the azimuthal effects that occur due to the spatial orientation of topographic features within the sensor footprint. A similar behavior is observable also over mountainous areas and has been demonstrated in the case of scatterometer acquisitions [39,40]. Usage of only ascending or descending orbit could overcome the problem; this would, however, further reduce the temporal resolution of the product. Next, the exceptionally high RMSD (23%) in Figure 10b is due to high backscatter occurring at an incidence angle of about 30°. This effect forms characteristic striping on the RMSD maps (i.e., around 30°N and 10°E) and can be explained by resonant Bragg scattering. The surface ripples on sand dunes cause constructive interference of the coherent radar signal at certain incidence angles (dependent on the slope of the sand dune) [39]. Stripes of strongly enhanced backscatter values are clearly visible in SAR images over these areas (see Figure 10d). The locations of the illustrative points are shown at Figure 10c.
Figure 11 shows the box-plot representations of RMSD for the USGS Land Use/Land Cover and HWSD soil type classes. The wide inter-quartile range of the non-soil classes, dunes and shifting sands (9% to 19%), indicates that these regions are connected with the above described geometrical distortions in the desert areas. Exceptionally high values can also be found over land cover class herbaceous wetland, with a median of 19%. This class is comprised of the Okavango Delta region and the Ez Zeraf Game Reserve. Both areas are seasonally flooded. The resulting double-bounce effect from water surface and vegetation hampers the soil moisture retrieval and causes large RMSD values.
The RMSD results are influenced by the bias correction method applied. Recently, a study by Yilmaz et al. [41] suggested that using the triple collocation-based rescaling method results in an optimal solution, whereas regression techniques offer only approximations of this optimal solution. Hence, the investigation on the differences in RMSD maps using the triple collocation-based matching technique could provide additional insights. Even further, triple collocation error assessments removes reference uncertainty and could thus refine the RMSD results.
Apparently, the discussed factors (precipitation, NDVI, land cover class and soil type) have influence on the skill of the retrieval algorithm to represent soil moisture. However, these factors are also inter-correlated. Additional research is needed to assess the influence of the individual factors. This requires detailed combined analysis, such as principal component analysis.
4.3. Mask for the ASAR GM SSM Dataset
Motivated by the results of this study, a mask for the ASAR GM SSM product was created to distinguish the problematic areas. Across the continent, areas covered by surface water, rain forest and urban areas were masked according to the USGS GLCC Land Use/Land Cover System. Areas with a correlation below −0.2 between ASAR GM and GLDAS-NOAH SSM were masked, as well. Additionally, for areas with sufficient rainfall (south of 15°N), masking was based on the ASAR GM scaling layer. The scaling layer quantifies the temporal correlation between the backscatter intensities on the local (1 km) and the regional (25 km) scales [42]. The scaling layer masking is based on the concept of the temporal stability of soil moisture fields [22]. The assumption is that in the case of a low correlation (R2 < 0.3) between the local and regional backscatter intensities, the land cover and soil structure/texture characteristics influence the final ASAR GM product stronger than the temporal variation in soil moisture. However, in arid environments where the temporal dynamics of the soil moisture is strongly limited and, in some areas, backscatter intensities are strongly dependent on the azimuth angle and, thus, on the orbital direction of the satellite, the masking with the help of the scaling layer is not suitable.
In case of scatterometer measurements, the estimated standard deviation (ESD) parameter was used to quantify the effect of azimuthal dependence. This parameter is described in detail in [27]. The areas of high (>0.4 dB) ESD correspond to the high RMSD values between ASAR GM SSM and the reference datasets in the arid regions. Therefore, the mask based on the ERS scatterometer measurements was created to mask the areas with geometrical distortions in arid areas (north of 15°N). An example of the resulting masked surface soil moisture maps are shown in Figure 12.
4.4. Comparison with ASAR WS SSM
Due to the radiometric resolution of about 1.2 dB, the noise in the ASAR GM SSM product is relatively high. The averaging of the product to approximately 3 to 10 km reduces the noise [16–18]; the advantage of high (1 km) resolution is, however, lost. Data with a higher radiometric resolution can provide comparable results to the aggregated 5-km product, also at 1-km spatial resolution. This was demonstrated over Zambezi catchment by comparing 1-km aggregated ASAR WS data with 1-km and 5-km aggregated ASAR GM data. Figure 13 shows box-plot representations of R values between ASAR products and GLDAS-NOAH. Overall, at 89% of the points, the correlation between ASAR and GLDAS-NOAH SSM is significantly improved for ASAR WS when compared to 1-km ASAR GM. The significance level was set to 0.05 using the z-test and Fishers R to z transformation [43]. The average R improvement equals 0.22. Clearly, the change detection algorithm fails to deliver reliable soil moisture retrievals over the herbaceous wetland and barren or sparsely vegetated land cover classes, both in the case of GM, as well as WS mode. For other land cover classes, a significant improvement of the correlation of approximately 0.2 can be observed when using WS mode or 5-km aggregated GM mode measurements instead of the 1-km GM SSM dataset.
These results indicate that the quality of the soil moisture estimates derived with the TU Wien method can be significantly improved over some landscapes with the use of data with higher radiometric resolution. This is encouraging considering that the Sentinel-1 sensor should provide a three-fold improvement in radiometric resolution compared to ASAR WS [44].
4.5. Limitations of the Evaluation Methodology
The limitations of our study should be reiterated, as they reveal the potential areas for further research. Due to the unavailability of another high or medium resolution SSM dataset over the entire African continent, coarse resolution reference datasets were used for the evaluation. The spatial sampling error together with the uncertainties in the reference data will be included in the bivariate error measures [26]. Furthermore, the use of linear matching using the minimal least squares distance is expected to impact the final RMSD estimates. To overcome the later, an investigation of more complex matching techniques, such as the triple-collocation-based matching technique, is recommended [41]. Even further, triple-collocation error assessments remove reference uncertainty and are therefore expected to refine the RMSD results.
An important limitation of the ASAR SSM product is the relatively low and irregular temporal resolution (typically four to seven days in the case of ASAR GM, but dependent also on the sensor acquisition plan). Especially in the case of SSM anomalies, the spatial differences in temporal resolution are visible in the correlation results. The areas with a lower number of measurements within the time-window correspond to the areas of lower correlation results (i.e., the stripe around 10°N and 25°E in Figure 3c). The computation of SSM anomalies as the difference between the absolute soil moisture value and the seasonal cycle of SSM averaged over several years could reduce this effect.
Finally, the influence of various factors (precipitation, NDVI, land cover class and soil type) on the TU Wien algorithm’s ability to retrieve surface soil moisture estimates was presented. These factors are however also inter-correlated, and the influence of the individual factors cannot be assessed without detailed combined analysis, such as principal component analysis.
5. Conclusions
The high resolution soil moisture product has the potential to contribute to a number of applications, such as hydrological or runoff modeling. However, the understanding of the quality and limitations of the product is a vital precondition for its usage. This work presents the continental-wide evaluation of the Advanced Synthetic Aperture Radar (ASAR) Global Monitoring (GM) mode Surface Soil Moisture (SSM) product developed at TU Vienna using the change detection algorithm over African continent. The study is unique, as it presents the first long-term and large-scale evaluation of the soil moisture dataset derived from the SAR data over Africa. The results were stratified by the precipitation amount, vegetation cover, land cover classes and soil types and provide insights into the product performance over various environments. Based on the evaluation results, a new mask for the African continent was introduced, covering the areas where the algorithm does not provide reliable SSM estimates.
A comparison with coarse resolution SSM datasets from Advanced Microwave Scanning Radiometer for Earth Observing System (AMSR-E) and the Noah land surface model from the Global Land Data Assimilation system (GLDAS-NOAH) proved the ability of the ASAR GM SSM product to demonstrate the temporal variability of the soil moisture over areas with sufficient rainfall (>250 mm/year) and low to medium density vegetation (a mean Normalized Difference Vegetation Index of 0.2 to 0.6). Correlations over 0.6 were found, i.e., in savannas or croplands, whereas arid regions or wetlands showed low or negative correlations, down to −0.7. Furthermore, differences in performance over various soil types were presented, revealing lower correlations over some soil types (i.e., Leptosols, Calcisols) within the same land cover class and precipitation thresholds.
Three distinct problems in the ASAR GM SSM algorithm were detected during the evaluation process, all of which were located in the arid regions: (i) an inverse relationship between ASAR GM backscatter and soil moisture, causing negative correlation values; (ii) biases between the backscatter from the descending and ascending orbits; and (iii) a distinct bias in the backscatter around a 30° local incidence angle. While the first phenomenon could be explained by the extreme behavior of backscatter over very dry soils, the other two problems could be explained by azimuthal anisotropy effects and Bragg scattering. Further investigation of these problems is expected to bring improvements to soil moisture products based on ASAR GM, scatterometer, as well as future Sentinel-1 data.
At the time of the writing of this publication, the Sentinel-1 sensor is in the commissioning phase. The transfer of the change detection algorithm to Sentinel-1 is therefore foreseen. Given the significantly improved radiometric resolution of Sentinel-1, soil moisture products derived from Sentinel-1 are expected to be of considerably better quality when compared to the ASAR GM SSM products. The impact of enhanced radiometric resolution on the 1-km SSM product was evaluated in this work over Zambezi catchment in Southern Africa using 1-km ASAR Wide Swath (WS) SSM. Significantly higher correlations (improvements of ∼0.2) were obtained over most landscapes using WS data instead of GM data. Further research is required to quantify the robustness and possible areas of improvements of the TU Wien method applied to low-noise SAR data, such as those that will become available through the Sentinel-1 mission.
Acknowledgments
This study has been carried out in the framework of the ESA Data User Element (DUE) Tiger Innovator Projects SHARE (European Space Research Institute (ESRIN)/Contract No. 19420/05/I-EC) and TIGER-NET (ESRIN/Contract No. 4000105732/12/I-NB).
Author Contributions
All authors contributed extensively to the work presented in this paper. Specific contributions included the development of the ASAR GM SSM algorithm (Wolfgang Wagner, Daniel Sabel, Marcela Doubková), SAR data processing and quality checking (Daniel Sabel, Marcela Doubková, Alena Dostálová, Bernhard Bauer-Marschallinger), data evaluation over Africa (Alena Dostálová) and preparation of the manuscript and figures (Alena Dostálová, Marcela Doubková). All co-authors contributed to the editing of the manuscript and to the discussion and interpretation of the results.
Conflicts of Interest
The authors declare no conflict of interest.
References
- Gruhier, C.; de Rosnay, P.; Hasenauer, S.; Holmes, T.; de Jeu, R.; Kerr, Y.; Mougin, E.; Njoku, E.; Timouk, F.; Wagner, W.; et al. Soil moisture active and passive microwave products: Intercomparison and evaluation over a Sahelian site. Hydrol. Earth Syst. Sci 2010, 14, 141–156. [Google Scholar]
- Brocca, L.; Hasenauer, S.; Lacava, T.; Melone, F.; Moramarco, T.; Wagner, W.; Dorigo, W.; Matgen, P.; Martínez-Fernández, J.; Llorens, P.; et al. Soil moisture estimation through ASCAT and AMSR-E sensors: An intercomparison and validation study across Europe. Remote Sens. Environ 2011, 115, 3390–3408. [Google Scholar]
- Draper, C.S.; Walker, J.P; Steinle, P.J; de Jeu, R.A.M; Holmes, T.R.H. An evaluation of AMSR-E derived soil moisture over Australia. Remote Sens. Environ 2009, 113, 703–710. [Google Scholar]
- Jackson, T.J.; Cosh, M.H.; Bindlish, R.; Starks, P.J.; Bosch, D.D.; Seyfried, M.; Goodrich, D.C.; Moran, M.S.; Du, J. Validation of advanced microwave scanning radiometer soil moisture products. IEEE Trans. Geosci. Remote Sens 2010, 48, 4256–4272. [Google Scholar]
- Scipal, K.; Drusch, M.; Wagner, W. Assimilation of a ERS scatterometer derived soil moisture index in the ECMWF numerical weather prediction system. Adv. Water Resour 2008, 31, 1101–1112. [Google Scholar]
- Mahfouf, J.-F. Assimilation of satellite-derived soil moisture from ASCAT in a limited-area NWP model. Q. J. R. Meteorol. Soc 2010, 136, 784–798. [Google Scholar]
- Crow, W.T.; Ryu, D. A new data assimilation approach for improving runoff predictions using remotely sensed soil moisture retrievals. Hydrol. Earth Syst. Sci 2002, 13, 1–16. [Google Scholar]
- Brocca, L.; Melone, F.; Moramarco, T.; Wagner, W.; Naeimi, V.; Bartalis, Z.; Hasenauer, S. Improving runoff prediction through the assimilation of the ASCAT soil moisture product. Hydrol. Earth Syst. Sci. Discuss 2010, 7, 4113–4144. [Google Scholar]
- Bolten, J.D.; Crow, W.T.; Zhan, X.; Jackson, T.J.; Reynolds, C.A. Evaluating the utility of remotely sensed soil moisture retrievals for operational agricultural drought monitoring. IEEE J. Sel. Top. Appl. Earth Obs. Remote Sens 2010, 3, 57–66. [Google Scholar]
- Draper, C.S.; Reichle, R.H.; de Lannoy, G.J.M.; Liu, Q. Assimilation of passive and active microwave soil moisture retrievals. Geophys. Res. Lett 2012, 34. [Google Scholar] [CrossRef]
- Taylor, C.M.; de Jeu, R.A.M.; Guichard, F.; Harris, P.P.; Dorigo, W.A. Afternoon rain more likery over drier soils. Nature 2002, 489, 282–286. [Google Scholar]
- Wagner, W.; Pathe, C.; Sabel, D.; Bartsch, A.; Kuenzer, C.; Scipal, K. Experimental 1 km soil moisture products from ENVISAT ASAR for Southern Africa. Proceedings of the ENVISAT Symposium, Montreux, Switzerland, 23–27 July 2007.
- Wagner, W.; Scipal, K.; Bartsch, A.; Pathe, C. ENVISAT’s capabilities for global monitoring of the hydrosphere. Proceedings of 2005 IEEE International Geoscience and Remote Sensing Symposium (IGARSS), Seoul, Korea, 25–26 June 2005; pp. 5678–5680.
- Gruber, A.; Wagner, W.; Hegyiova, A.; Greifeneder, F.; Schlaffer, S. Potential of Sentinel-1 for high-resolution soil moisture monitoring. Proceedings of 2013 IEEE International Geoscience and Remote Sensing Symposium (IGARSS), Melbourne, Australia, 21–26 July 2013; pp. 4030–4033.
- Hornacek, M.; Wagner, W.; Sabel, D.; Truong, H.-L.; Snoeij, P.; Hahmann, T.; Diedrich, E.; Doubkova, M. Potential for high resolution systematic global surface soil moisture retrieval via change detection using Sentinel-1. IEEE J. Sel. Top. Appl. Earth Obs. Remote Sens 2012, 5, 1303–1311. [Google Scholar]
- Sabel, D.; Bartalis, Z.; Bartsch, A.; Doubkova, M.; Hasenauer, S.; Naeimi, V.; Pathe, C.; Wagner, W. Synergistic use of scatterometer and scanSAR data for extraction of surface soil moisture information in Australia. Proceedings of the 2008 EUMETSAT Meteorological Satellite Conference, Darmstadt, Germany, 8–12 September 2008.
- Pathe, C.; Wagner, W.; Sabel, D.; Doubkova, M.; Basara, J. Using ENVISAT ASAR global mode data for surface soil moisture retrieval over Oklahoma, USA. IEEE Trans. Geosci. Remote Sens 2009, 47, 468–480. [Google Scholar]
- Doubková, M.; van Dijk, A.I.J.M.; Sabel, D.; Wagner, W.; Blöschl, G. Evaluation of the predicted error of the soil moisture retrieval from C-band SAR by comparison against modelled soil moisture estimates over Australia. Remote Sens. Environ 2012, 120, 188–196. [Google Scholar]
- Baup, F.; Mougin, E.; Hiernaux, P.; Lopes, A.; de Rosnay, P.; Chenerie, I. Radar signatures of Sahelian surfaces in Mali using ENVISAT-ASAR data. IEEE Trans. Geosci. Remote Sens 2007, 45, 2354–2363. [Google Scholar]
- Loew, A.; Ludwig, R.; Mauser, W. Derivation of surface soil moisture from ENVISAT ASAR wide swath and image mode data in agricultural areas. IEEE Trans. Geosci. Remote Sens 2006, 44, 889–899. [Google Scholar]
- Rahman, M.M.; Moran, M.S.; Thoma, D.P.; Bryant, R.; Holifield, C.D.; Jackson, T.; Orr, B.J.; Tischler, M. Mapping surface roughness and soil moisture using multi-angle radar imagery without ancillary data. Remote Sens. Environ 2008, 112, 391–402. [Google Scholar]
- Wagner, W.; Pathe, C.; Doubkova, M.; Sabel, D.; Bartsch, A.; Hasenauer, S.; Blöschl, G.; Scipal, K.; Martínez-Fernández, J.; Löw, A. Temporal stability of soil moisture and radar backscatter observed by the Advanced Synthetic Aperture Radar (ASAR). Sensors 2008, 8, 1174–1197. [Google Scholar]
- Balenzano, A.; Mattia, F.; Satalino, G.; Pauwels, V.; Snoeij, P. SMOSAR algorithm for soil moisture retrieval using Sentinel-1 data. Proceedings of 2012 IEEE International Geoscience and Remote Sensing Symposium (IGARSS), Munich, Germany, 22–27 July 2012; pp. 1200–1203.
- Wagner, W.; Sabel, D.; Doubkova, M.; Hornacek, M.; Schlaffer, S.; Bartsch, A. Prospects of Sentinel-1 for land applications. Proceedings of 2012 IEEE International Geoscience and Remote Sensing Symposium (IGARSS), Munich, Germany, 22–27 July 2012; pp. 1741–1744.
- Wagner, W.; Lemoine, G.; Borgeaud, M.; Rott, H. A study of vegetation cover effects on ERS scatterometer data. IEEE Trans. Geosci. Remote Sens 1999, 37, 938–948. [Google Scholar]
- Doubkova, M.; Dostalova, A.; van Dijk, A.; Blöschl, G.; Wagner, W.; Diego, F. How do extrinsic errors and noise impact the bivariate error measures of the radar derived ASAR 1 km surface soil moisture? J. Sel. Top. Appl. Earth Obs. Remote Sens 2014. (In print). [Google Scholar]
- Naeimi, V.; Scipal, K.; Bartalis, Z.; Hasenauer, S.; Wagner, W. An improved soil moisture retrieval algorithm for ERS and METOP scatterometer observations. IEEE Trans. Geosci. Remote Sens 2009, 47, 1999–2013. [Google Scholar]
- Owe, M.; de Jeu, R.A.M.; Holmes, T. Multi-sensor historical climatology of satellite-derived global land surface. Hydrol. Earth Syst. Sci 2008, 15, 425–436. [Google Scholar]
- Rodell, M.; Houser, P.R.; Jambor, U.; Gottschalck, J.; Mitchell, K.; Meng, C.-J.; Arsenault, K.; Cosgrove, B.; Radakovich, J.; Bosilovich, M.; et al. The global land data assimilation system. Bull. Am. Meteorol. Soc 2004, 85, 381–394. [Google Scholar]
- Loveland, T.R.; Reed, B.C.; Brown, J.F.; Ohlen, D.O.; Zhu, J; Yang, L.; Merchant, J.W. Development of a global land cover characteristics database and IGBP DISCover from 1-km AVHRR data. Int. J. Remote Sens 2000, 21, 1303–1330. [Google Scholar]
- FAO; IIASA; ISRIC; ISSCAS; JRC. Harmonized World Soil Database (Version 1.2); FAO: Rome, Italy, 2012. [Google Scholar]
- Huffman, G.J.; Bolvin, D.T.; Nelkin, J.; Wolff, D.B.; Adler, R.F.; Gu, G.; Hong, Y.; Bowman, K.P.; Stocker, E.F. The TRMM Multisatellite Precipitation Analysis (TMPA): Quasi-global, multiyear, combined-sensor precipitation estimates at fine scales. J. Hydrometeorol 2007, 8, 38–55. [Google Scholar]
- NASA Land Processes Distributed Active Archive Center (LP DAAC). In MODIS L3 Vegetation Indices 16-Day L3 Global 250 m (MOD13Q1); USGS/Earth Resources Observation and Science (EROS) Center: Sioux Falls, SD, USA, 2006.
- Entekhabi, D.; Reichle, H.R.; Koster, D.R.; Crow, T.W. Performance metrics for soil moisture retrievals and application requirements. J. Hydrometeorol 2010, 11, 832–840. [Google Scholar]
- Wagner, W.; Hahn, S.; Gruber, A.; Dorigo, W. Identification of soil moisture retrieval errors: Learning from the comparison of SMOS and ASCAT. Proceedings of 2012 IEEE International Geoscience and Remote Sensing Symposium (IGARSS), Munich, Germany, 22–27 July 2012; pp. 3795–3798.
- Dorigo, W.A.; Scipal, K.; Parinussa, R.M.; Liu, Y.Y.; Wagner, W.; de Jeu, R.A.M.; Naeimi, V. Error characterisation of global active and passive microwave soil moisture datasets. Hydrol. Earth Syst. Sci 2010, 14, 2605–2616. [Google Scholar]
- Driessen, P.; Deckers, J.; Spaargaren, O.; Nachtergaele, F. Lecture Notes on the Major Soils of the World; Number 94 in World Soil Resources Reports; Food and Agriculture Organization (FAO): Rome, Italy, 2001. [Google Scholar]
- Draper, C.; Reichle, R.; de Jeu, R; Naeimi, V.; Parinussa, R.; Wagner, W. Estimating root mean square errors in remotely sensed soil moisture over continental scale domains. Remote Sens. Environ 2013, 137, 288–298. [Google Scholar]
- Bartalis, Z.; Scipal, K.; Wagner, W. Azimuthal anisotropy of scatterometer measurements over land. IEEE Trans. Geosci. Remote Sens 2006, 44, 2083–2092. [Google Scholar]
- Stephen, H.; Long, D.G. Microwave backscatter modeling of erg surfaces in the Sahara desert. IEEE Trans. Geosci. Remote Sens 2005, 43, 238–247. [Google Scholar]
- Yilmaz, M.T.; Crow, W.T. The optimality of potential rescaling approaches in land data assimilation. J. Hydrometeorol 2012, 14, 650–660. [Google Scholar]
- Sabel, D.; Pathe, C.; Wagner, W.; Hasenauer, S.; Bartsch, A.; Künzer, C.; Scipal, K. Using ENVISAT Scansar Data for Characterising Scaling Properties of Scatterometer Derived Soil Moisture Information over Southern Africa. Available online: http://earth.esa.int/workshops/envisatsymposium/proceedings/posters/4P9/457362sa.pdf (accessed on 14 May 2014).
- Fisher, R.A. On the probable error of a coefficient of correlation deduced from a small sample. Metron 1921, 1, 3–32. [Google Scholar]
- Snoeij, P.; Attema, E.; Davidson, M.; Duesmann, B.; Floury, N.; Levrini, G.; Rommen, B.; Rosich, B. The Sentinel-1 radar mission: Status and performance. IEEE Aerosp. Electron. Syst. Mag 2010, 25, 32–39. [Google Scholar]


| Global Monitoring Mode | Wide Swath Mode | |
|---|---|---|
| Central frequency | 5.331 GHz (C-Band) | 5.331 GHz (C-Band) |
| Spatial resolution | 1000 m | 150 m |
| Radiometric resolution | ∼1.2 dB | ∼0.6 dB |
| Temporal resolution | Irregular, typically 4 to 7 days | Irregular, dependent on the sensor acquisition plan |
| Spatial coverage | Global | Regional, dependent on the sensor acquisition plan |
| Polarization used | H/H | H/H |
| Orbit direction used | Ascending and descending | Ascending and descending |
© 2014 by the authors; licensee MDPI, Basel, Switzerland This article is an open access article distributed under the terms and conditions of the Creative Commons Attribution license (http://creativecommons.org/licenses/by/3.0/).
Share and Cite
Dostálová, A.; Doubková, M.; Sabel, D.; Bauer-Marschallinger, B.; Wagner, W. Seven Years of Advanced Synthetic Aperture Radar (ASAR) Global Monitoring (GM) of Surface Soil Moisture over Africa. Remote Sens. 2014, 6, 7683-7707. https://0-doi-org.brum.beds.ac.uk/10.3390/rs6087683
Dostálová A, Doubková M, Sabel D, Bauer-Marschallinger B, Wagner W. Seven Years of Advanced Synthetic Aperture Radar (ASAR) Global Monitoring (GM) of Surface Soil Moisture over Africa. Remote Sensing. 2014; 6(8):7683-7707. https://0-doi-org.brum.beds.ac.uk/10.3390/rs6087683
Chicago/Turabian StyleDostálová, Alena, Marcela Doubková, Daniel Sabel, Bernhard Bauer-Marschallinger, and Wolfgang Wagner. 2014. "Seven Years of Advanced Synthetic Aperture Radar (ASAR) Global Monitoring (GM) of Surface Soil Moisture over Africa" Remote Sensing 6, no. 8: 7683-7707. https://0-doi-org.brum.beds.ac.uk/10.3390/rs6087683