Spatial Patterns of Fire Recurrence Using Remote Sensing and GIS in the Brazilian Savanna: Serra do Tombador Nature Reserve, Brazil


 ,
,
Abstract
: The Cerrado is the second largest biome in Brazil after the Amazon and is the savanna with the highest biodiversity in the world. Serra Tombador Natural Reserve (STNR) is the largest private reserve located in Goiás State, and the fourth largest in the Cerrado biome. The present study aimed to map the burnt areas and to describe the spatial patterns of fire recurrence and its interactions with the classes of land-cover that occurred in STNR and its surroundings in the period between 2001 and 2010. Several Landsat TM images acquired around the months of July, August and September, coinciding with the region’s dry season when fire events intensify, were employed to monitor burnt areas. Fire scars were mapped using the supervised Mahalanobis-distance classifier and further refined using expert visual interpretation. Burnt area patterns were described by spatial landscape metrics. The effects of fire on landscape structure were obtained by comparing results among different land-cover classes, and results summarized in terms of fire history and frequencies. During the years covered by the study, 69% of the areas analyzed had fire events. The year with the largest burnt area was 2004, followed by 2001, 2007 and 2010. Thus, the largest fire events occurred in a 3-year cycle, which is compatible with other areas of the Brazilian savanna. The regions with higher annual probabilities of fire recurrence occur in the buffer zone around the park. The year 2004 also had the highest number of burnt area patches (831). In contrast, the burnt area in 2007 showed the most extensive fires with low number of patches (82). The physiognomies that suffered most fires were the native savanna formations. The study also identified areas where fires are frequently recurrent, highlighting priority areas requiring special attention. Thus, the methodology adopted in this study assists in monitoring and recovery of areas affected by fire over time.1. Introduction
The Cerrado is the second largest Brazilian biome with an approximate area of 2 million km2, occurring in different soil types and geological formations. Among the determinant factors in shaping these ecosystems are fire, seasonal rainfall patterns and nutrient-poor soils [1]. Evidences of fire in this region have been dated from 32,000 years BP [2].
Natural fires are common in the Cerrado (savanna) region, where the grassy herbaceous biomass becomes especially dry and very flammable during the dry season, and may be caused by lightning at the beginning of the wet season [3]. Thus, the Cerrado species are adapted to a natural fire regime [1,4]. Several studies report that fire exerts considerable control over the proportion of woody and herbaceous plants in the Cerrado and causes changes in the structure and composition of the vegetation [5,6]. Fire tends to favor herbaceous plants [7,8], while fire suppression induces gradual changes in the density of tree species, leading to more dense savannas [9,10]. In certain ecosystems, natural fire suppression causes a reduction in the quantity of plant species [11]. Therefore, the description of the fire regime is an important factor in understanding the spatial distribution of plants and their different regeneration strategies, particularly in regions with climatic seasonality.
Anthropogenic fires have occurred in the Cerrado for over 10,000 years, related to the beginning of human occupation. Biomass burning in the tropical savanna is a common practice for the expansion of agriculture or pastures; either through burning residues or through stimulating the regrowth of grasses to feed cattle in the dry season [12]. Eventually, these fires get out of control, causing large wildfires. Typically, anthropogenic fires in the Brazilian Cerrado occur in the dry season and cover extensive areas, contrasting with the natural fires that burn small patches and are rapidly extinguished by rain [12]. Thus, human actions alter the natural fire occurrences, changing the responses of organisms to fire, nutrient cycling, and distribution of vegetation types [13].
Remotely sensed images have a considerable potential for mapping burnt areas and fire regimes, particularly at the regional level. This technology is useful in comparison to other conventional approaches because of its accuracy, repeatability, and speed in data acquisition, longer historical data and ease of combination with other thematic data. Satellite-based burnt area mapping is performed using different sensors (various spatial and temporal resolutions) and classification procedures. Many research studies about fire recurrence and burnt area have used Landsat data [14–19].
The main limitation with Landsat imagery is the difficulty in finding a temporal series adequate to accurately map the fire regime. Meanwhile, burnt area maps generated from satellite sensors with high temporal-resolution and coarse spatial-resolution (approximately 1-km), such as System Pour l’Observation de la Terre (SPOT-VEGETATION), Advanced Very High Resolution Radiometer (AVHRR), Along Track Scanning Radiometer (ATSR-2), Geostationary Operational Environmental Satellite (GOES) and Moderate Resolution Imaging Spectrometer (MODIS), fail to detect the majority of small and fragmented burnt areas [20–22]. Silva et al. [22] compared burnt area estimates derived from SPOT-VEGETATION and Landsat ETM+ data in African savannas and found an underestimation for the coarser resolution ranging from 14.3%–28.5%. Schroeder et al. [20,23] performed a validation of GOES and MODIS active fire detection products using ASTER and ETM+ data and highlighted a high overall omission error. In this case, the result interpretation should be oriented to the larger biomass burning events, which show higher rates of successful detections. Furthermore, annual fire occurrence maps derived from the different coarse spatial-resolution datasets such as active fire and burnt area detected by the MODIS and Along Track Scanning Radiometer (ATSR) exhibited the poorest agreement [24]. Consequently, mapping fire scars using fine spatial resolution data (for example Landsat ETM+) enables improved delineation of small and patchy fires [25].
Most wildfire-mapping efforts have supported either the analyses of climate–fire relationships or the operational, real-time efforts of wildfire suppression and recovery, and thus, little work has used wildfire mapping to inform long-term strategies for wildfire management. This paper aimed to map the fire scars that occurred at the STNR and its surroundings during the period 2001–2010, using remote sensing and Geographic Information System (GIS) data analyses. Therefore, this article uses an approach that relies on fire distribution data for understanding and refining wildfire-management strategy issues. We characterized the region’s fire regime in terms of area, number of fragments, recurrence, and location according to the vegetation types. This information could assist park managers to improve firefighting practices, identifying areas with highest incidence of fire, which at present are assumed according to fire managers contacted during the course of this study.
2. Study Area
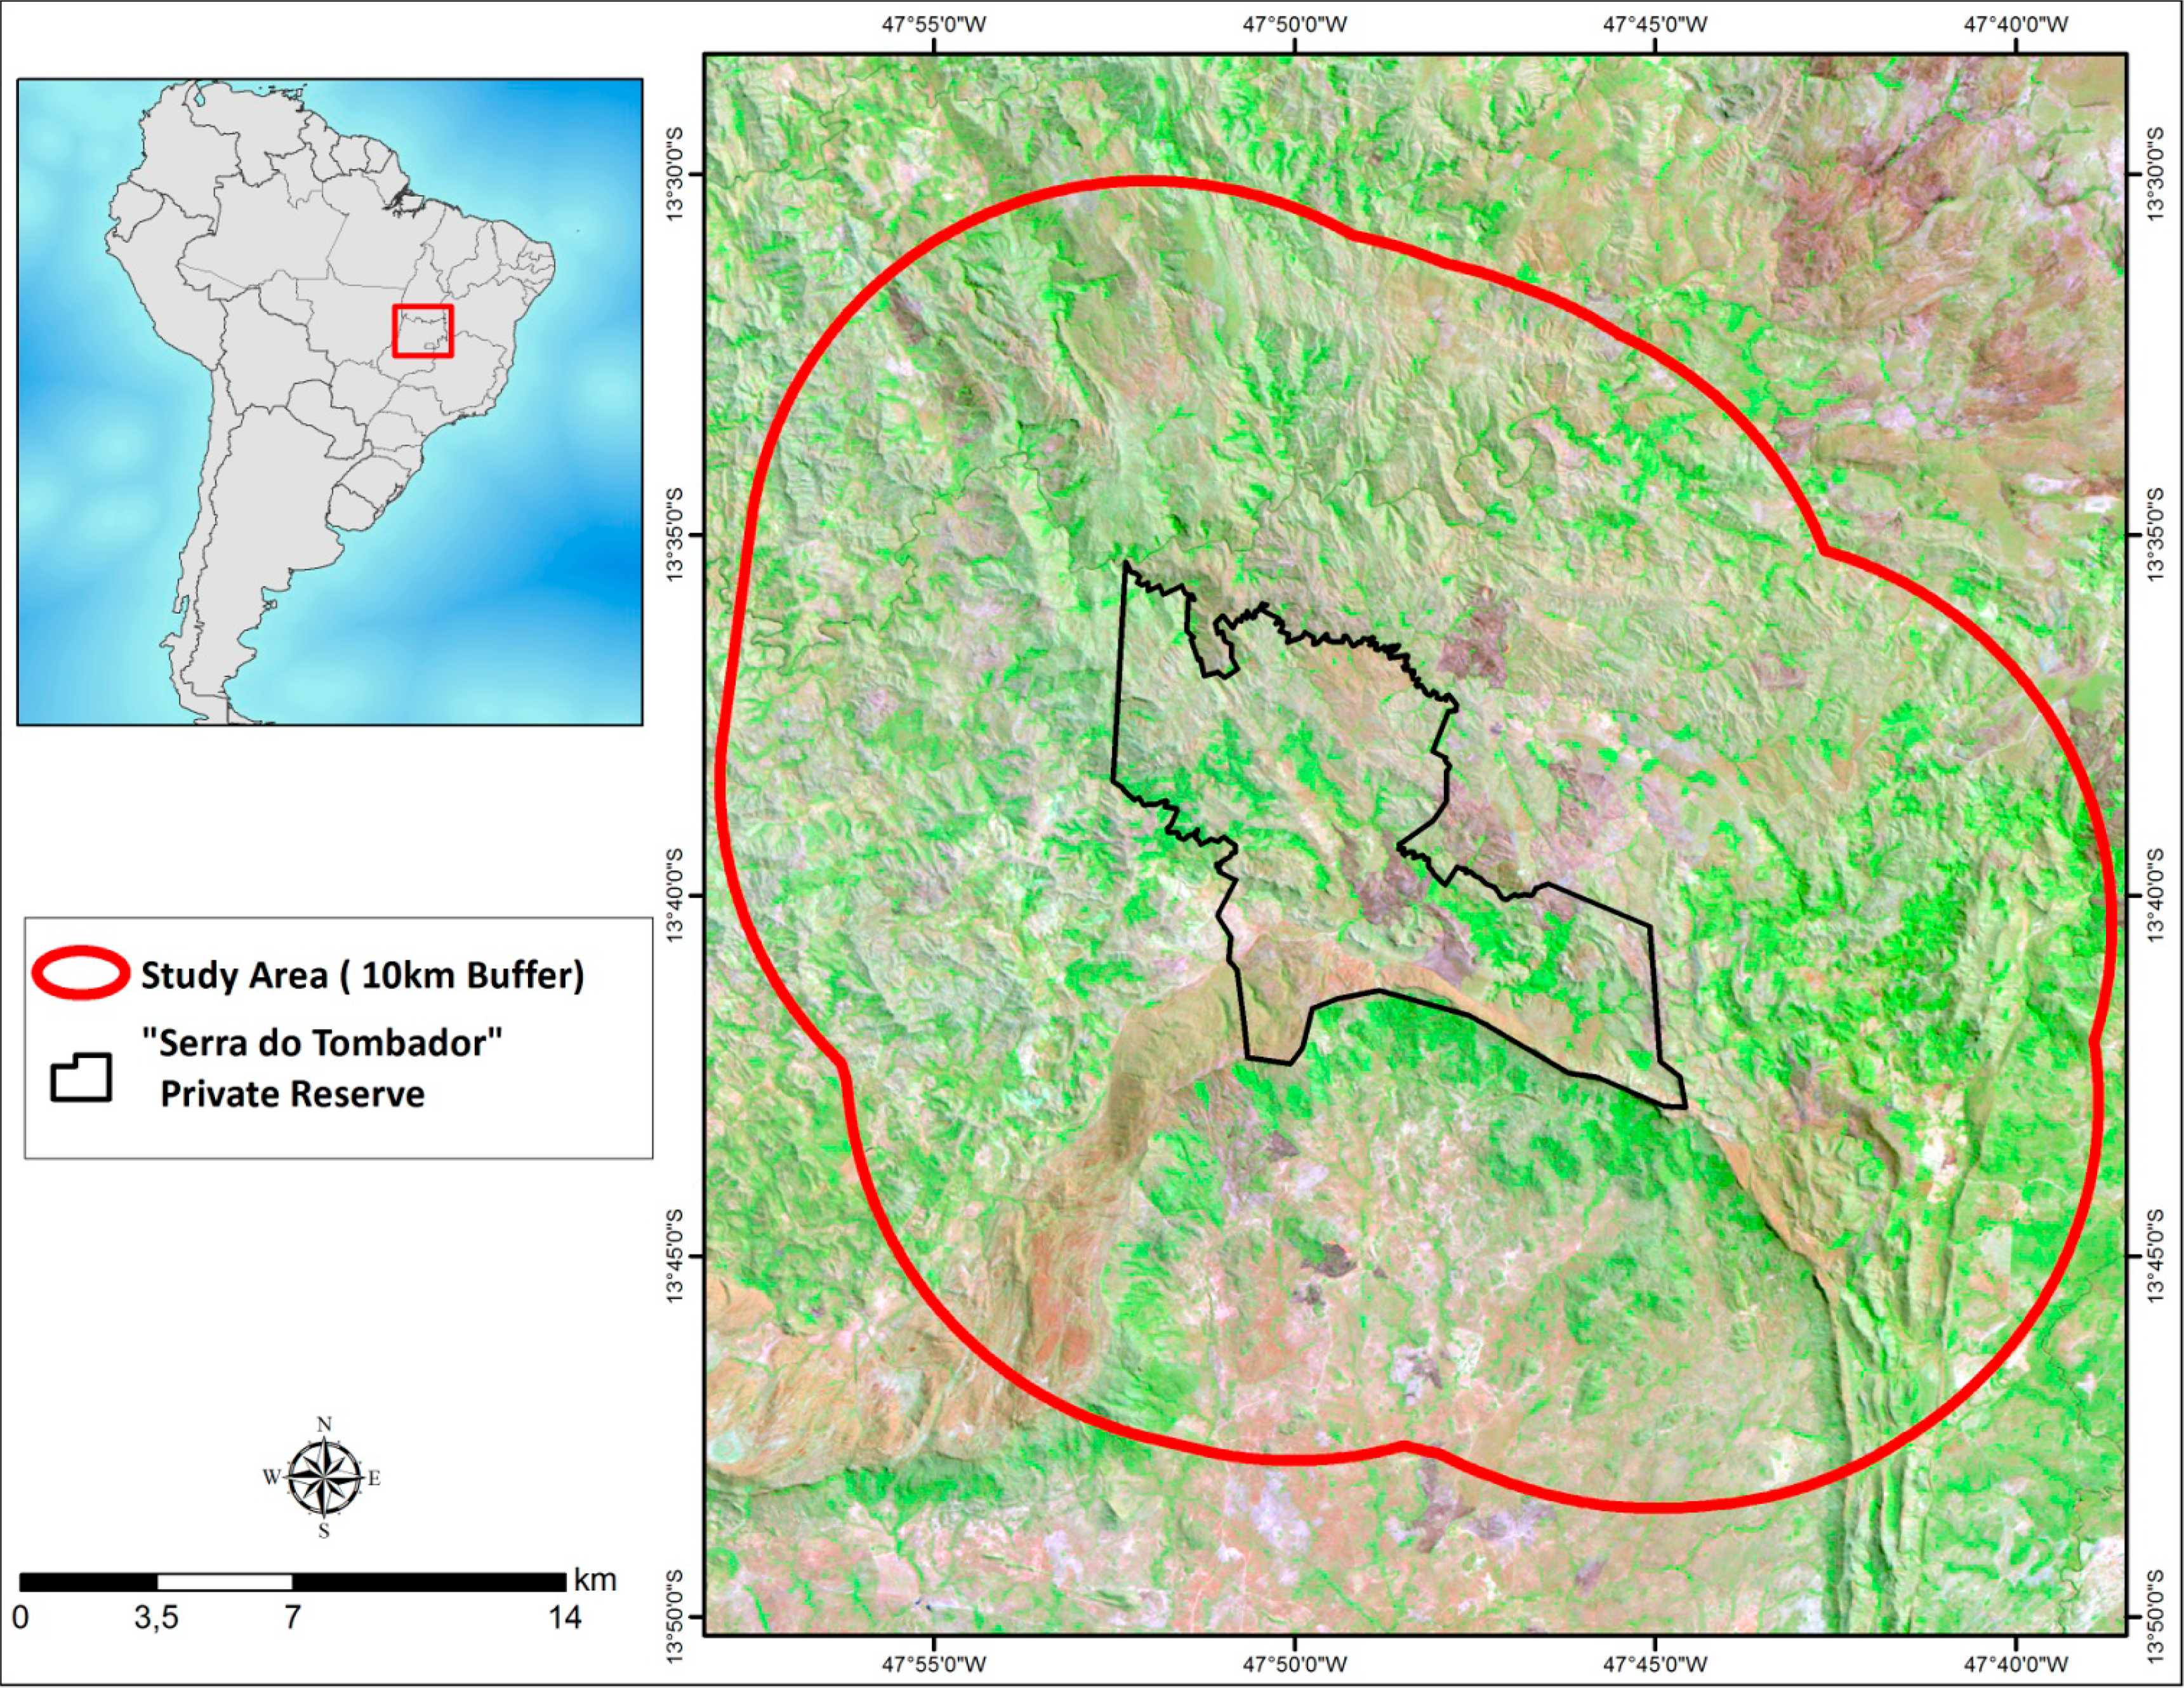
The study area totals 90,029 ha and covers the entire STNR, plus a 10 km buffer extending outward from the reserve limits (Figure 1). The STNR was acquired in 2007 by the Boticario Group Foundation for Nature Protection with support from The Nature Conservancy and in 2009 it was recognized as a Private Natural Heritage Reserve. The STNR is the largest private reserve in Goiás State.
The region has a tropical precipitation regime characterized by well-defined wet and dry seasons. The historical average annual precipitation is 1491 mm, most of which (80%) is concentrated between October and March [26]. This rainfall regime directly influences the occurrence of anthropogenic fires in the dry season [13]. Small and medium-sized watercourses are predominant. The soils are shallow and developed on impervious metamorphic rocks. Thus, during the dry season, the smaller watercourses tend to dry up, while in the rainy season, torrential rains can lead to flash flooding.
3. Datasets
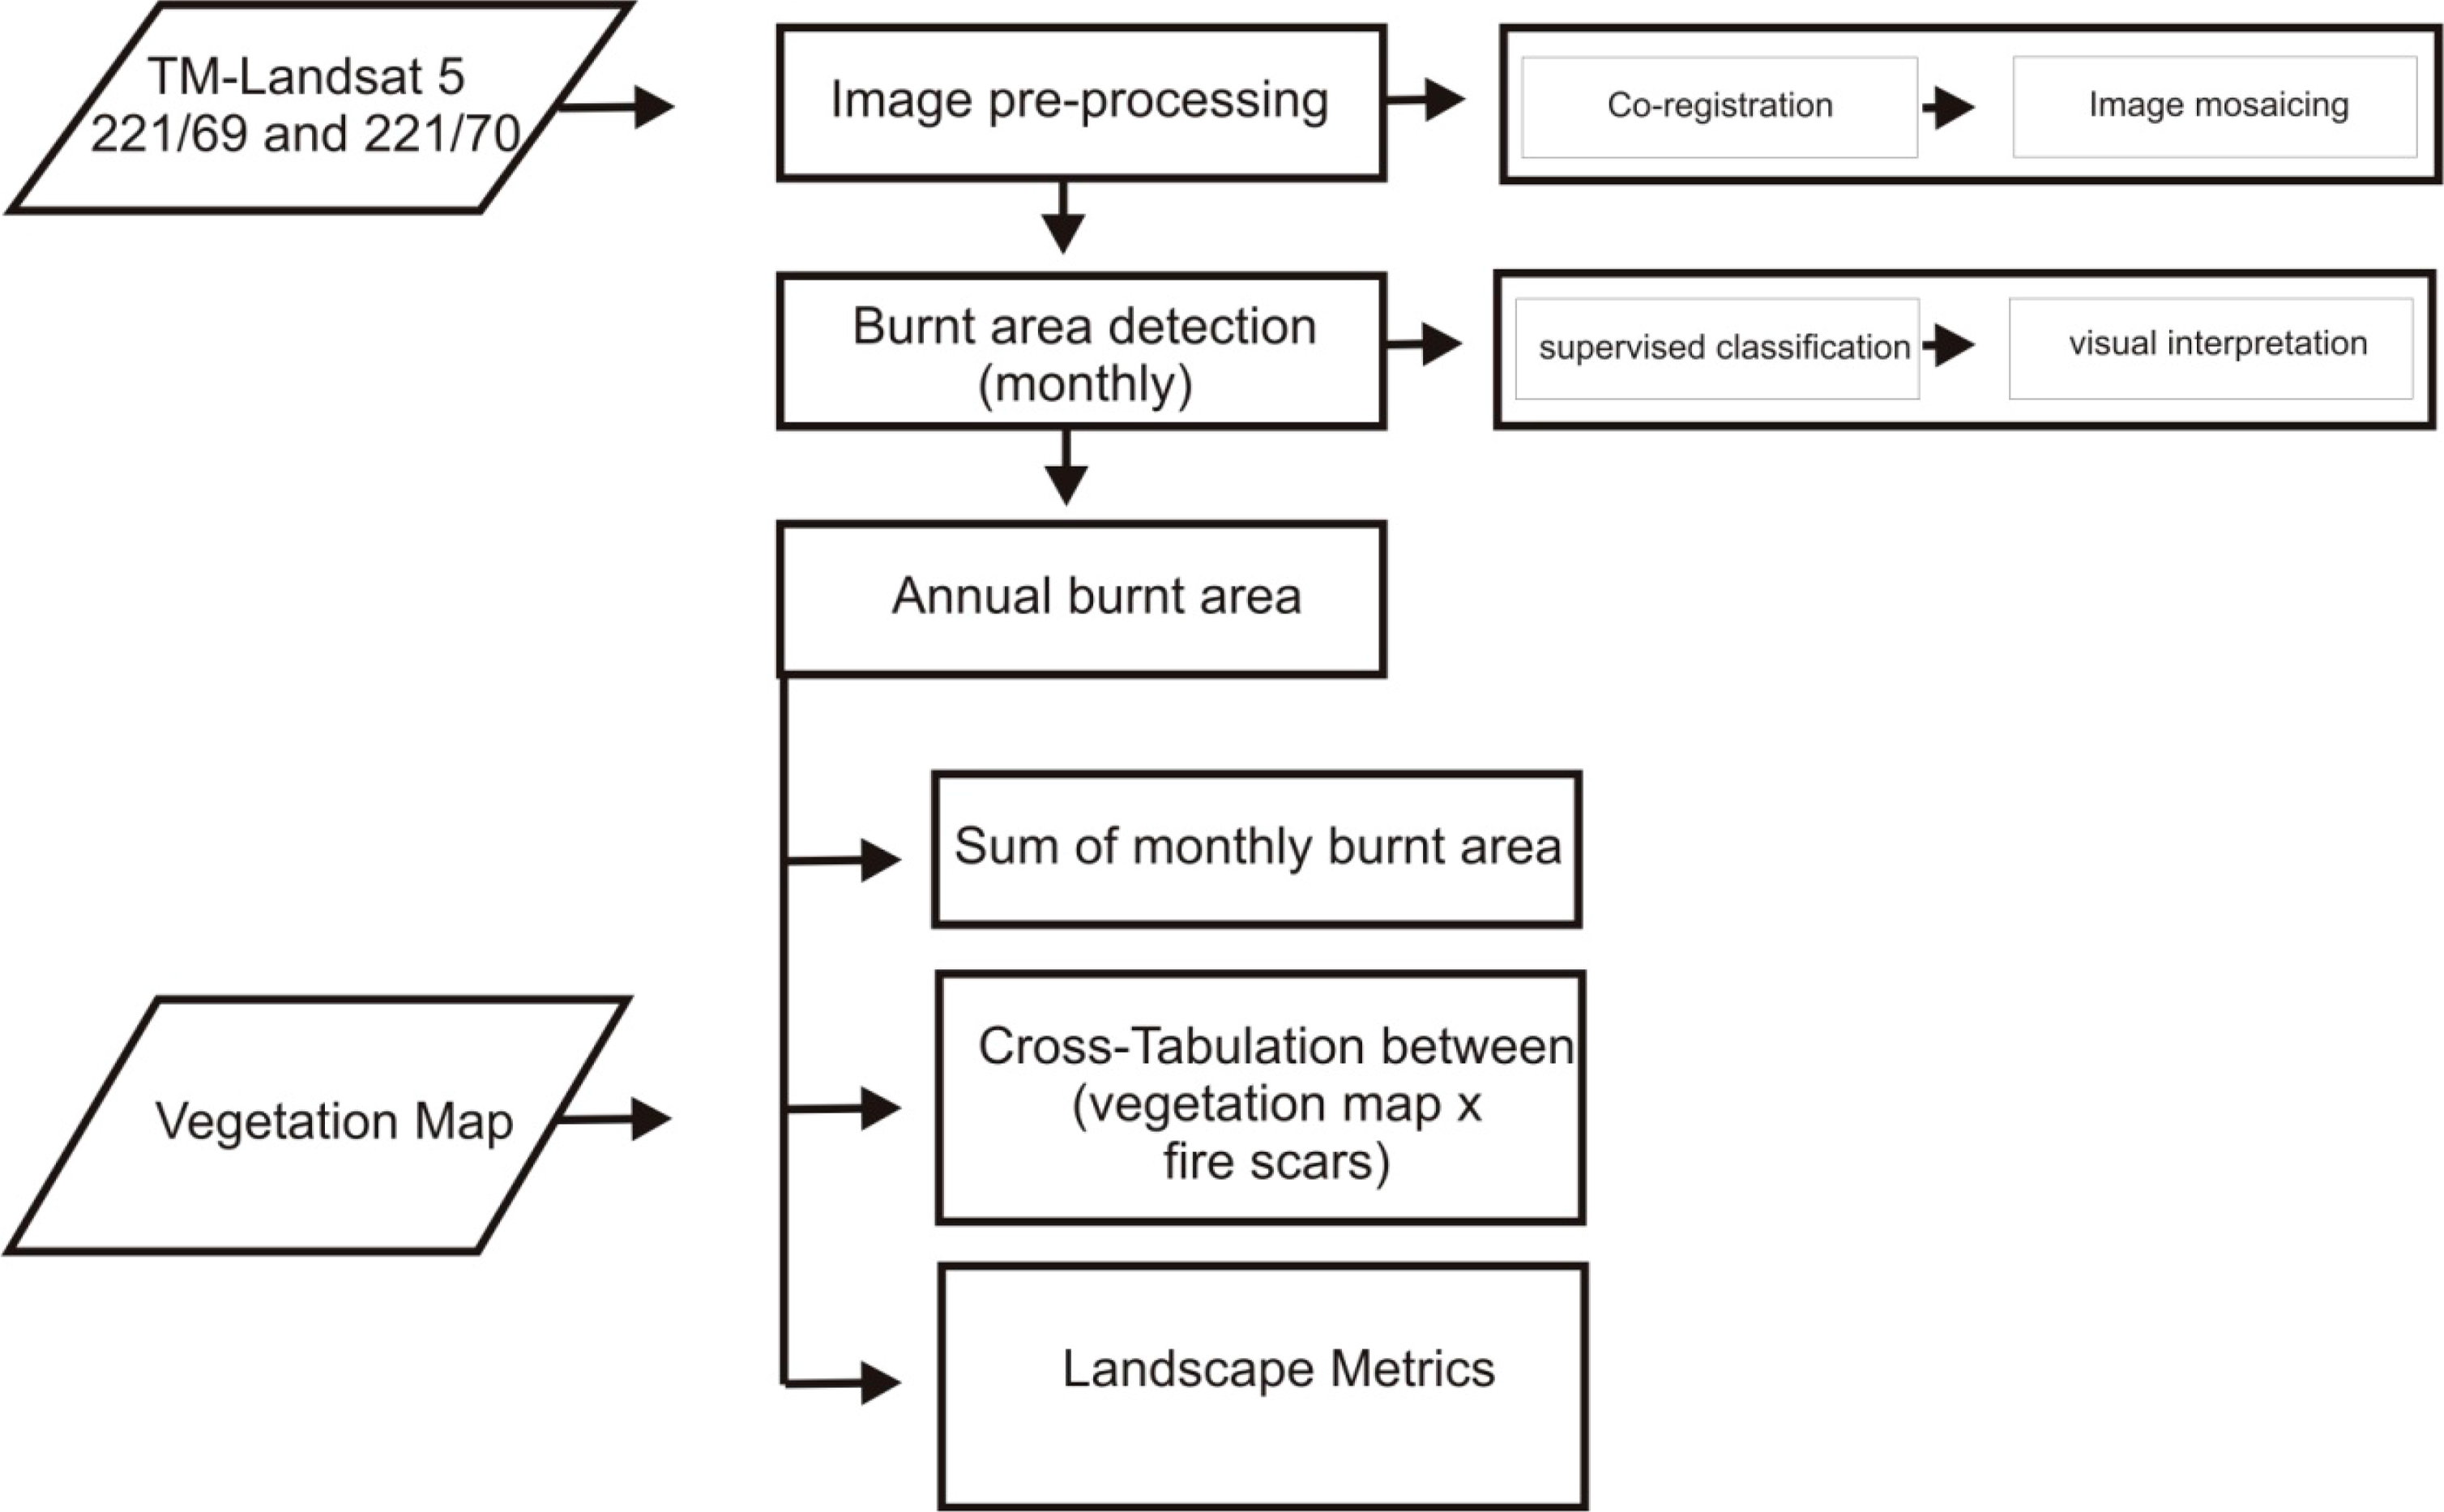
The input data used were the remote sensing images and the vegetation map. We used all available Landsat-5 Thematic Mapper (TM) images acquired between 2001 and 2010 during the months of July, August and September, when the fire events intensify in the region (Table 1). The study area overlaps two Landsat −5 TM scenes (221/69 and 221/70) totaling 50 images, which were warped through pairs of images to create 25 mosaics.
Annual burnt area mapping representativeness was subject to image availability. All the images were downloaded from the Instituto Nacional de Pesquisas Espaciais (INPE) website. Each image is composed of six bands (bands 1, 2, 3, 4, 5 and 7), stacked following the correct sequence. The pairs of images (221/69 and 221/70) were mosaicked and subsequently we performed a subset process in order to cover only the study area.
The Nature Conservancy produced the vegetation map of the study area [27] from the expert interpretation of SPOT images (5-m spatial resolution) for the year 2007 (Figure 2). The vegetation-map accuracy through visual interpretation and fieldworks shows a Kappa Index equal to 0.87. This map describes the following classes: Forest formation (dense savanna woodland), savanna formation, grassland formation, anthropic use and water bodies. The main economic activities in the region are extensive cattle grazing and subsistence farming.
4. Methods
The methodology was subdivided into the following steps: (a) pre-processing of TM-Landsat images; (b) burnt-area detection by combining a supervised classification and visual interpretation for the months of July, August and September over 10 years; (c) definition of annual burnt area; (d) calculation of landscape metrics for burnt areas; and (e) cross-tabulation analysis between the burnt areas with natural vegetation. Figure 3 shows a flowchart of the methodology used in this work, which summarizes the relationships among the different procedures for image processing and GIS analysis. The results from these last two analyses were integrated to characterize the fire cycle in both time and space. Our hypothesis is that the fire cycle should exhibit periodic activity and occur preferentially in certain types of vegetation under the influence of anthropogenic activities. Each of these steps is discussed in detail below.
4.1. Pre-Processing
The images were mosaicked and co-registered using the ERDAS Imagine software. Images were superimposed within 0.2 pixel root mean squared error (RMS) to achieve an error of only 10% [28,29]. For this work, the Landsat-5 TM images were co-registered onto a SPOT-5 mosaic (i.e., 5-m spatial-resolution), which was corrected from two double-frequency GPS receivers (Hiper-Plus, Topcon Positioning Systems, Inc., Livermore, CA, USA).
4.2. Burnt Area Classification and Fire Recurrence Analysis
Automatic detection of burnt areas is a complex procedure because it does not have a defined spatial pattern and includes a wide variety of spectral characteristics (charcoal, scorched leaves or even green leaves) [14,30]. These spectral measures can change based on the observation time and fire factors, such as the severity of the fire, the time elapsed since the fire was extinguished, type of vegetation and soil exposure [14,30,31]. Thus, different methods were proposed to enhance and detect burnt areas and minimize the spectral confusion, for example, spectral indices [32–34], change detection algorithm using difference between pre-and post-fire [35,36]; spectral mixture analysis [37,38]; change vector analysis [39]; neural networks [40–42]; and object-based classification [43,44]. However, classification algorithms for burnt areas may lead to very different results [45]. Despite the large number of methods available in the literature, specific information about the advantages and limitations of different algorithms is limited, as well as the appropriate environmental conditions to apply each method [17,46,47]. According to Mallinis and Koutsias [17], the variance imposed by environmental factors in the study area may be greater than variance imposed by methods. Consequently, many studies have focused on the advantages of one technique over another in the specific context of a single experiment, which cannot be generalized across all situations [17]. Thus, the theme about mapping burnt areas remains active in remote sensing researches [48].
Nevertheless, the burnt areas are easily identified by visual interpretation obtaining reliable results [14]. Normally, visual interpretation of remote sensing data by photointerpreters is used for the validation of burnt areas from other mapping techniques [14,49,50]. Bowman et al. [50] evaluated four methods to map the apparent fire scars in Landsat-TM and concluded that visual methods were better able to discriminate burnt areas than other methods.
Fire scars were mapped using a supervised Mahalanobis-distance classifier (from all bands) and a post-classification by expert visual interpretation. Mahalanobis distance consists of a normalized distance, which incorporates an ellipsoidal distribution that best represents the probability distribution of the set estimated by covariance matrix of spectral band images [51]. Li et al. [52] use this particular distance in burnt area mapping, providing an image pixel-by-pixel probability of fire, which can be an important input to statistical methods for fire propagation estimation.
The 27 mosaics were classified considering the following main targets: Photosynthetically active vegetation, water, bare soil, rocky outcrop, shade and burnt vegetation. However, we found a low accuracy in supervised classification, which required an extensive complementation with visual interpretation. Therefore, fire scars were eventually confused with shaded areas in supervised classification, being corrected by manual editing. Burnt area vectors (27 layers) were visually inspected with their correspondent mosaics and edited to eliminate inconsistencies or erroneous polygons. The monthly data (July, August and September) were grouped by year resulting in nine layers from 2001–2010 (with the exception of 2002). Fire recurrence map was obtained by summing the annual fire maps from the GIS. This map contains nine classes (from 1–9), which represents the recurrence of fire events.
4.3. Landscape Metrics to Describe Burnt Area Patterns
This study uses spatial landscape metrics to describe burnt area patterns. Initially, landscape metrics were used to characterize the habitat fragmentation, which refers specifically to the progressive subdivision of habitat blocks into fragments and the effects on biodiversity [53]. Various theoretical and empirical studies of the ecological effects of habitat fragmentation have been made, developing a variety of landscape metrics [54]. These landscape metrics were also adapted for modeling of urban growth and land-use change [55–57] and landscape heterogeneity [58]. In the study of fire, the spatial metrics were used to compare measures (size, shape, arrangement of patches and geographic orientation) of burnt area [59]; forest fragments after fire [60]; fire severity [61–63] or changes in vegetation patterns associated with fire regimes [64,65]. Landscape metrics of burnt areas were calculated using the Patch Analyst public domain software [54], considering the following patch density and size metrics: Mean Patch Size (MPS); Number of Patches (NumP); Median Patch Size (MedPS); Patch Size Standard Deviation (PSSD); and Total Burnt Area (TBA). These metrics are well known in the Landscape Ecology science and their use is very common in the analysis of patch patterns.
4.4. Cross-Tabulation of the Vegetation Map and Fire Scars
The effects of fire on landscape structure were obtained by comparing the land-cover classes from the Tombador-Veadeiros Ecological Corridor Project and the burnt areas between 2001 and 2010, through cross-tabulation method. Several studies implemented cross-tabulation analysis between fire scars and land-cover classes [66–68]. Thus, exact shapes of the fire scars are overlaid with the land use/cover layer to yield preliminary statistics and identify co-occurrences among them, providing the percentage of area burned for each class. Cross-tabulation provided the history of burnt areas throughout the study region, indicating both where and when those disturbances took place.
The vegetation cover in the study area has not changed significantly during the years 2002–2010, according to the official map of remaining natural vegetation [69,70]. The loss of natural vegetation in this conservation area with low population density was 760 hectares (0.85%) between 2002 (88,578 ha) [69] and 2010 (87,818 ha) [70]. Therefore, we assumed that the vegetation map produced in 2007 did not change over the study period because of its irrelevance in the statistical analysis.
5. Results
5.1. Burnt Areas in the 2001–2010 Period
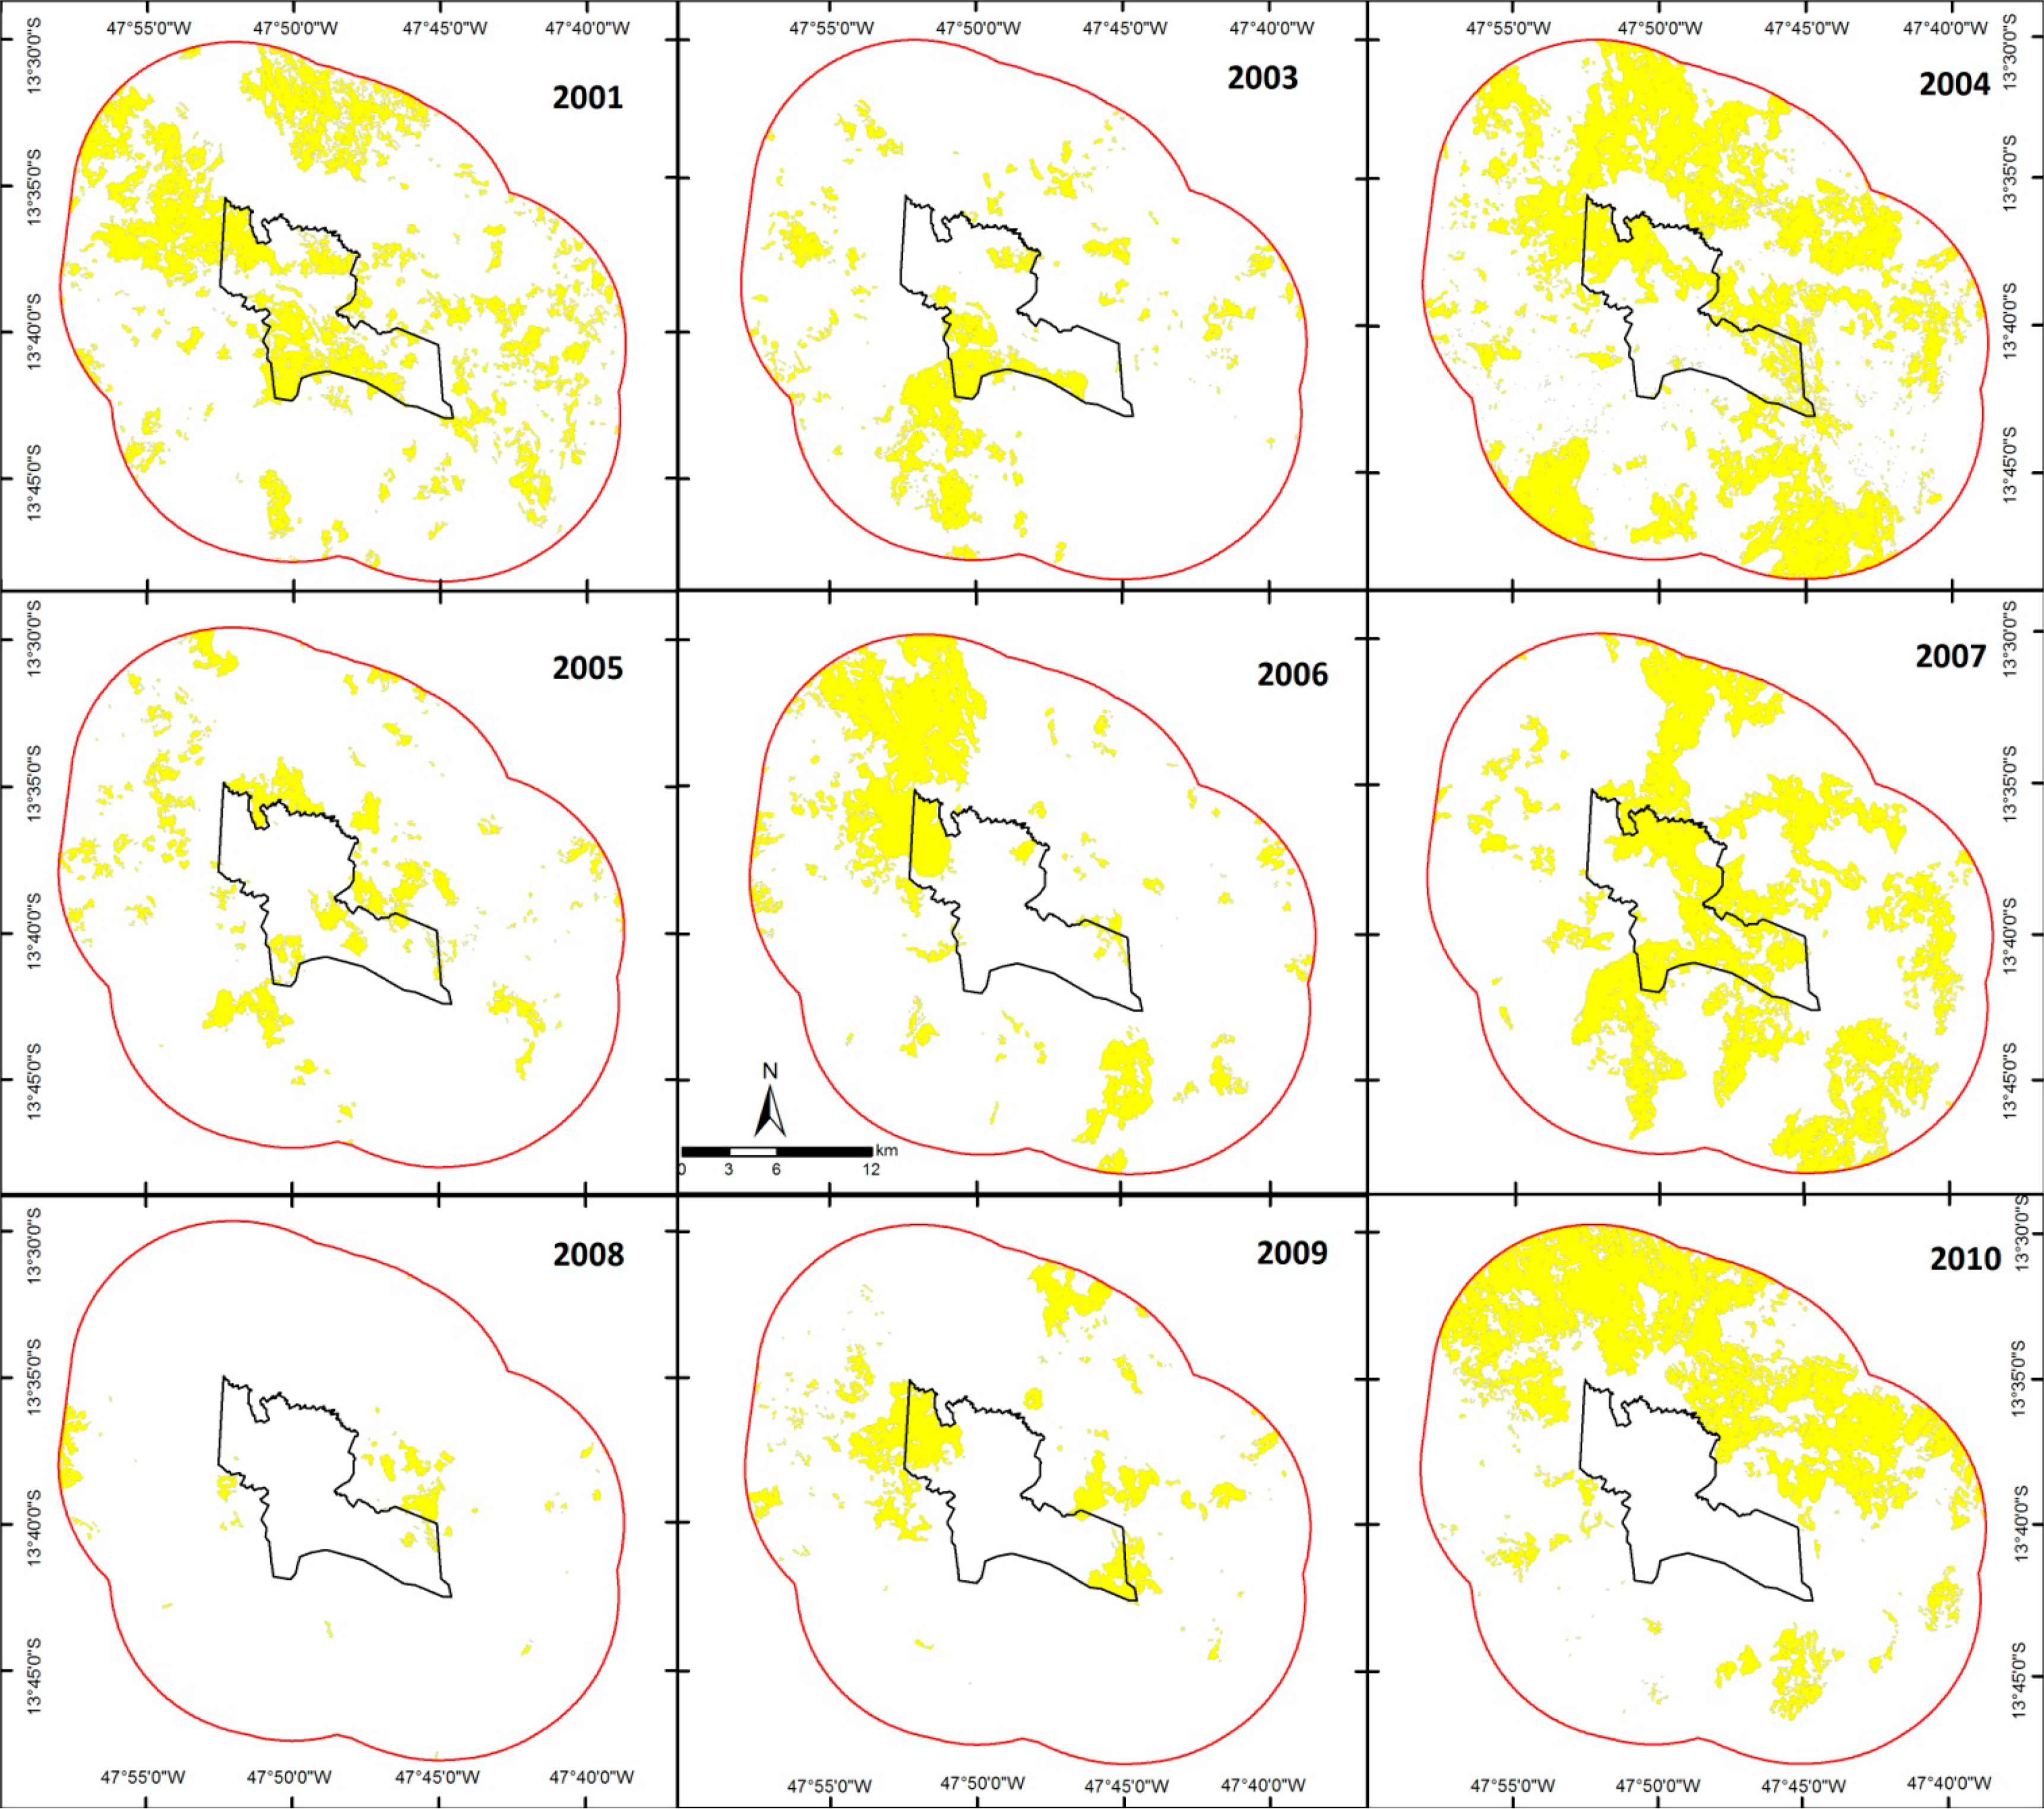
The total area that has been burned at least once in the 2001–2010 period corresponds to 62,015 ha (∼69% of the study region) (Figure 4).
The year 2004 had the largest area burned in a single year (30,623 ha, 34.1%) and the highest number of burnt area patches (831). In contrast, 2008 had the lowest burnt area (1,665 ha, 1.9%) represented in 55 polygons (Table 2). Burnt area varied widely over the years studied, showing cyclical behavior, in which intense fire events were followed by a vegetation recovery and biomass accumulation. The largest burnt area occurred in a 3-year cycle: 2001 (19,568 ha), 2004 (30,623 ha), 2007 (24,754 ha) and 2010 (23,192 ha) (Table 2 and Figure 5). This cyclical behavior of fires events agrees with other results found for savanna environment [69–72].
In the restricted area of the STNR, the total burnt area during the study period was 7231 ha (82% of the reserve’s area) (Table 2). In 2007, more than half the area (4442 ha) had fire events. The years of 2001 (3869 ha) and 2004 (2893 ha) also show extensive burnt areas. Comparing burnt areas within the park and in the buffer zone, the highest difference occurred in 2010, where extensive fires occurred in the buffer zone, while there were few events in the reserve. The cycle of three years of fire events was also observed in the restricted area of the SNTP, except for 2010.
5.2. Landscape Metrics Results
Table 3 shows the landscape metrics of burnt areas for the years 2001–2010. In general, individual fires do not spread over very large areas, whereas, due to the large number of fire events during the dry season, the total burnt area occupies an extensive fraction of the region studied. Although some years have a large total burnt area, the burnt patches are small.
The landscape metrics of the burnt area in 2007 showed the most extensive fires, characterized by: (a) second highest total area; (b) low number of patches (82); and hence (c) high Mean Patch Size (301 ha). This period also coincided with the highest patch size standard deviation, indicating high variation in individual burnt area sizes. The year of 2004 had the highest total burnt area (30,623.21 ha), but also had the lowest median burnt patch size (0.53), showing a higher dispersion of fire events (831 number burnt patch) (Figure 5).
5.3. Fire Recurrence
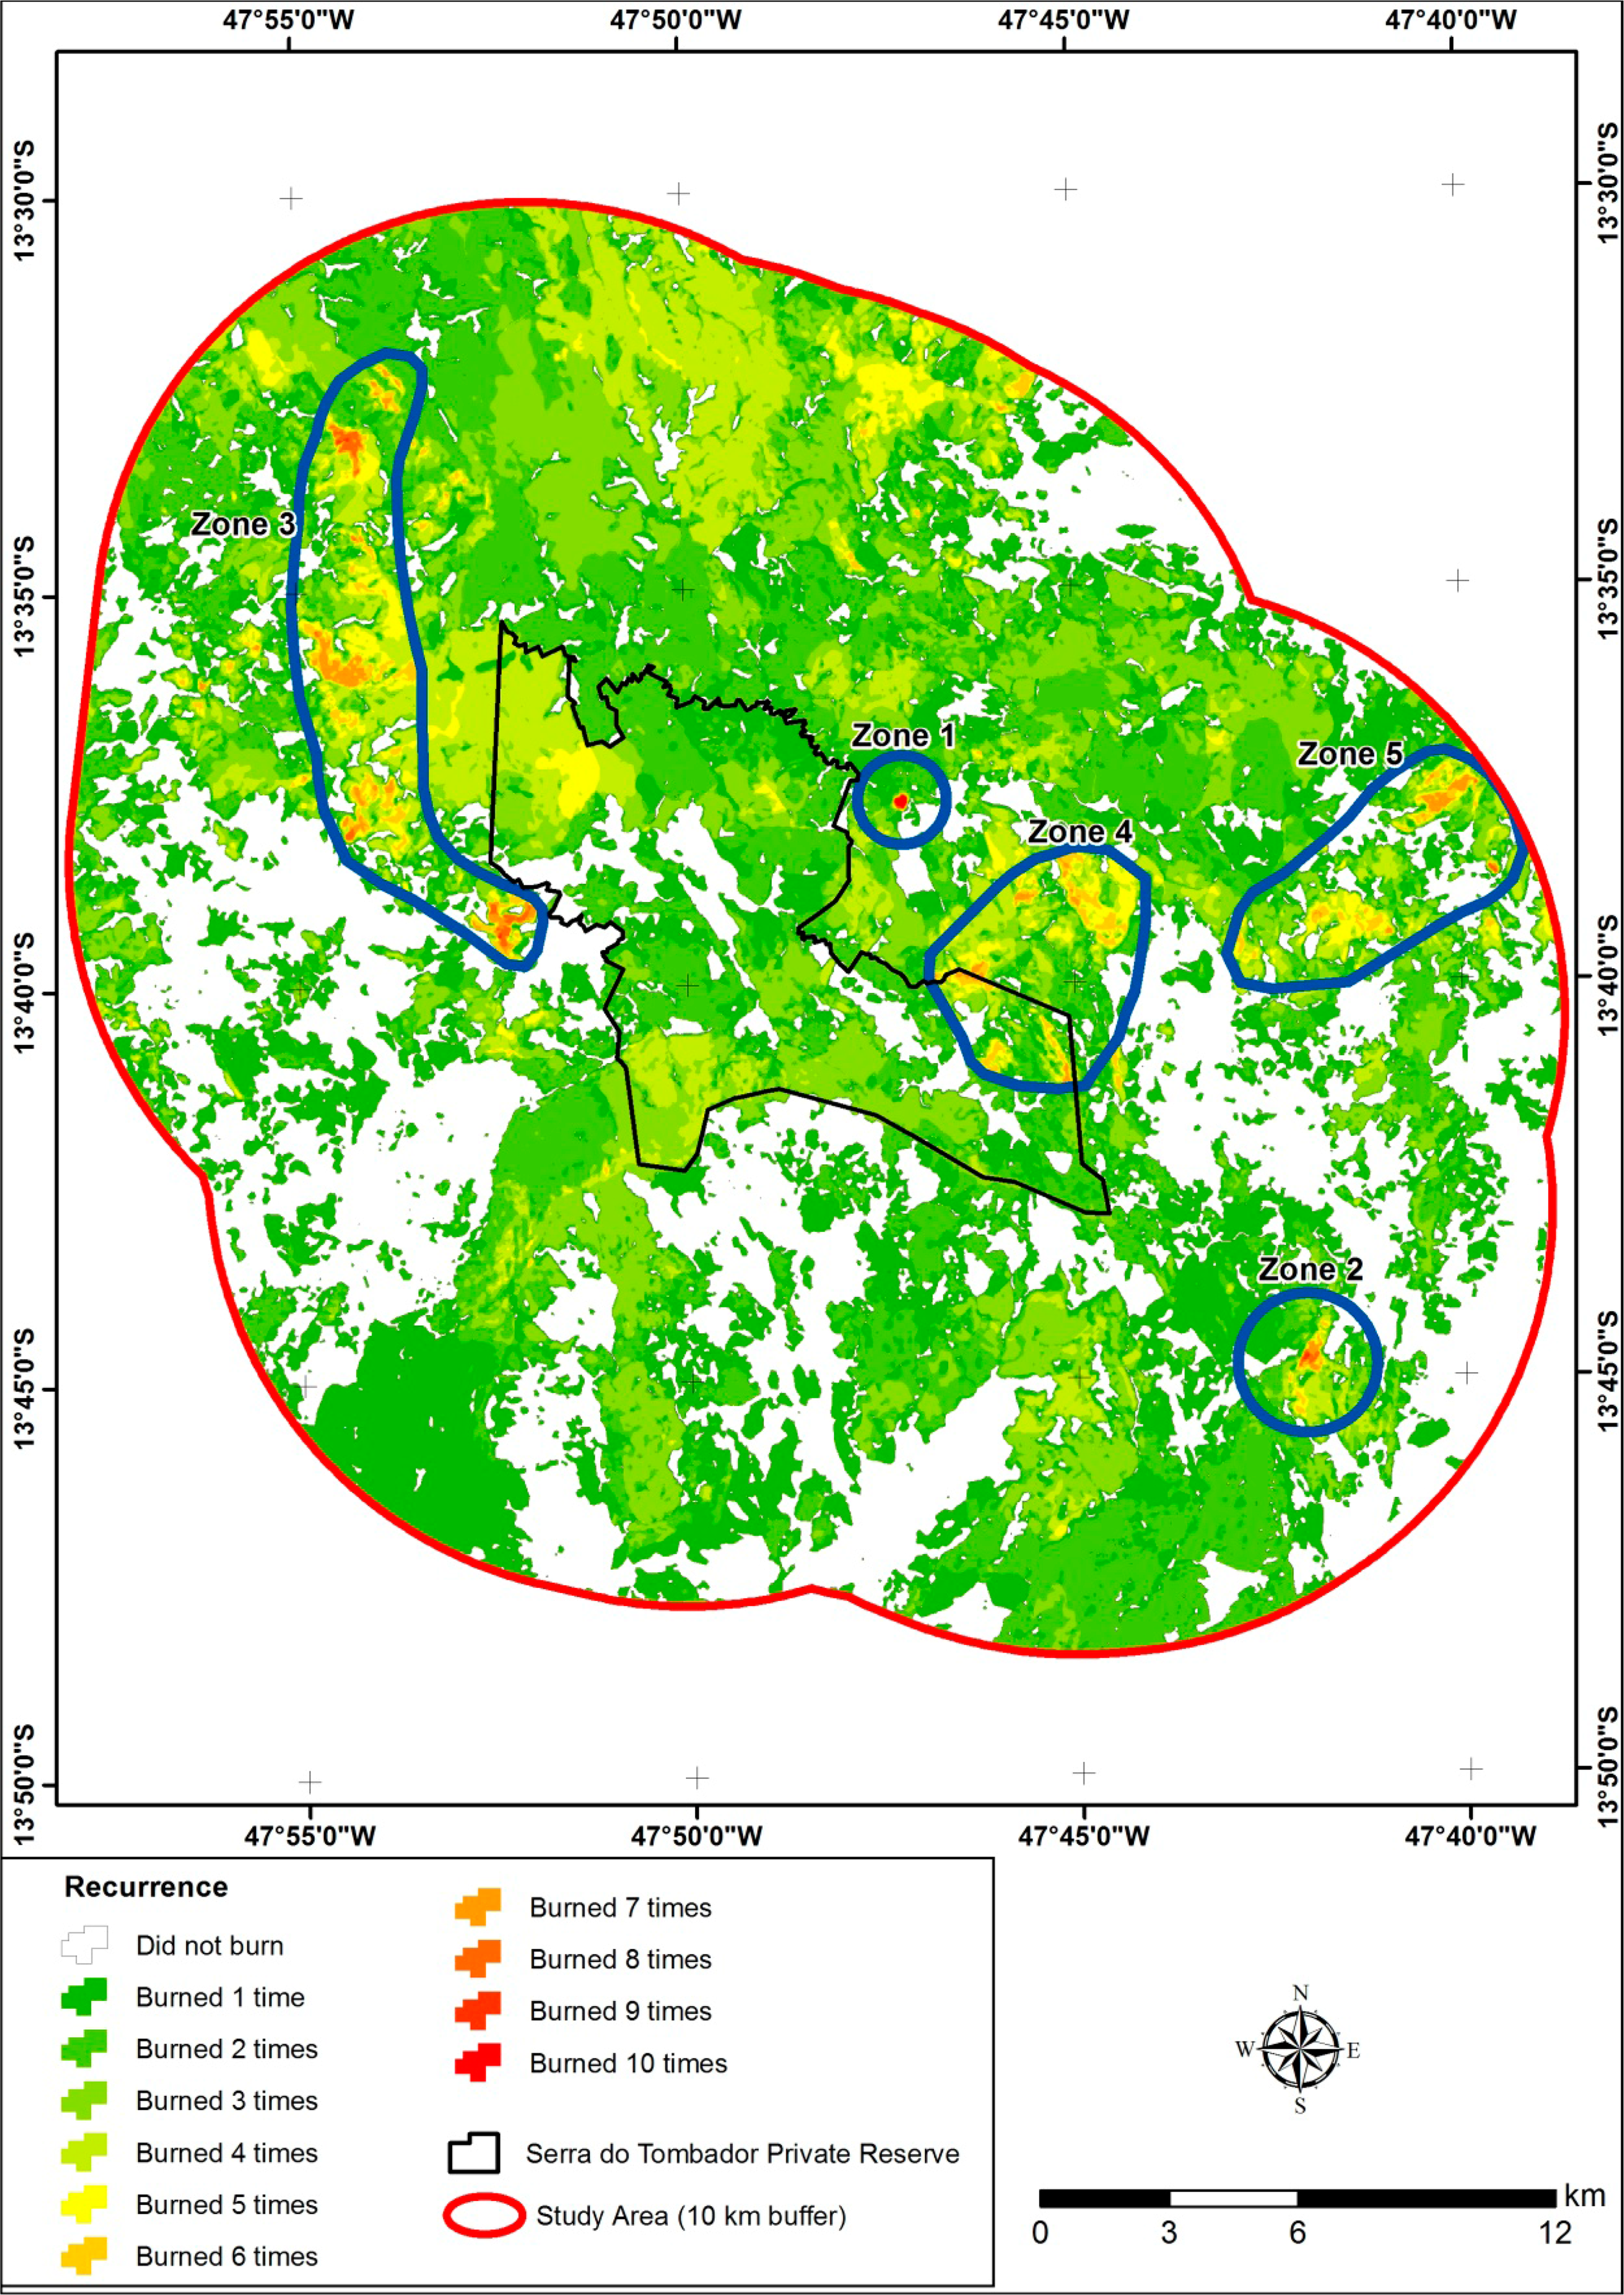
A total of 62,248 ha was mapped as burnt area between 2001 and 2010. Of that total, 42,403 ha (68%) were mapped as burned more than once (Table 4). The total area burned twice was 20,728 ha (33%), value close to total area burned once (19,904 ha, 32%).
Figure 6 shows the fire recurrence map, highlighting the main spatial zones of high fire recurrence (marked in blue). All major areas of fire recurrence are located in the buffer zone around the park. The maximum fire recurrence (nine times) was identified in a small area (5 ha) in the northeast of the park, i.e., burnt areas were identified in all years surveyed (Zone 1). Another small area (4 ha) presented a fire recurrence of nine times during the study period (Zone 2).
Zone 3 corresponds to the largest cluster with higher fire recurrence, forming a north-south lineament in the northwestern limits of STNR. Zone 4 is the most critical area because it crosses the eastern boundary of the park. Zone 5 is located farther from the park boundary, in East and Southeast portions, indicating areas where fires occurred five times in the 10-year period. Within the boundaries of STNR, two regions with fire recurrence over five times in 10 years were studied: One in the Northwest portion near the Zone 3 and another in Southeast near the Zone 4.
5.4. Results of Fire Events by Land Cover Classes
As described above, the land-cover map does not fully cover the buffer zone (Figure 2). Thus, the total burnt areas were changed to match the available information (Table 5). In absolute numbers, the largest burnt area occurred in native Savanna Formation (37,232 ha), four times more than the Grassland Formation, the second most burnt-class (9435 ha). However, the sum of areas of the Grassland and Savanna Formations contain approximately 76% of the burnt areas in relation to its total area. Forest formations had a burnt area of 4981 ha and Anthropic Use had the lowest burnt area with 701 ha. However, the relative percentage of burnt area within the class of anthropic use corresponds to 46%. The main economic activities in the region are extensive cattle and subsistence farming, and environmental conditions are not suitable for intensive agribusiness activities [27].
Analysis of fire occurrence within the SNTR boundaries shows that the burnt areas in each land-cover class are proportional to the values of the total study area. The main burnt areas were in savanna (5398 ha, 74.66%) and grassland (1244 ha, 17.21%) totaling 91.86% of burnt areas inside the park. Forest Formation had 573 ha (7.93%) affected by fire and the Anthropic Use 15 ha (0.21%) (Table 6). Unburnt areas in the reserve correspond, in their great majority, to valleys with gallery forests.
6. Discussion
There is increasing interest in fire management approaches based on the understanding of historical dynamics of fire events using remote sensing and in how these dynamics may be changing through time [73–75]. The present work uses different techniques of remote sensing and GIS to describe the spatial and temporal patterns of fires in savanna regions. Spatial analysis described in this research intends to help land managers with regional data on current conditions of vegetation and burnt areas to conduct fire management and maintain ecosystems.
The supervised classification from the Mahalanobis distance showed the main sites of the burnt area, but has severe limitations in establishing the required dataset, on which all studies should be based. The main errors of supervised classification for burnt areas observed by visual inspection were the low-reflectance targets, such as water bodies, bare soils, shadows or cloud-shadows. These unburnt targets that produce potential confusions with burnt areas are comprehensively described in different studies and consist of a constant challenge for burnt area classification [30,48,76–79]. Therefore, the burnt areas have only a group of pixels that can be enclosed by Mahalanobis distance classification, while the others still require further identification.
The automatic detection of burnt areas is not a trivial task due to its high spatial, spectral and temporal variability, which increases the potential for interference between unburnt and burnt area. Most of the available algorithms are adjusted to the local conditions; however, these generally offer very diverse omission and commission errors in different ecosystems [80–82]. An alternative to solve the apparent contradiction is to apply a visual interpretation approach, such as official fire perimeters in Portugal that are derived from visual analysis of Landsat images [14]. Thus, we opted for refining the burnt-area detection by visual interpretation from TM-Landsat images. Visual inspection is a key step because it allowed a redefinition of erroneous polygons of supervised classification. The accuracy analysis of visual interpretation data was not performed because of the following factors: (a) uncertainty of the historical fire records; (b) the area has difficulty of access to conduct fieldwork, which is aggravated for a long period; and (c) the visual interpretation provides reliable data that often are used as reference in studies of supervised or unsupervised classification of burnt areas [14,49,50,77–80]. Furthermore, the spatial analysis of burn scars may contain omission errors, since it refers to a specific satellite overpass time, which may miss events occurring at other times. In this context, the months with the highest incidence of fires were included in the survey. In spite of inherent errors on the visual mapping or fire records, the model used allowed a reasonable interpretation of the different fire cycles and spatial patterns of burnt area on savanna composition.
Although visual interpretation by a skilled interpreter yields accurate and precise results, this option is more time consuming and expensive. Hence, future work should focus on the comparison between the obtained results with other automatic classification techniques for mapping burnt areas ranging from the simplest ones as the spectral indexes to a multi-temporal classification approach, and in any case after the application of an adequate pre-processing of the data to resolve any shadow, water and cloud noise.
Proper fire management requires an understanding of the nature of fire and its changes. Therefore, fire recurrences and patch analysis are particularly important features to describe regional trends and develop strategies in order to mitigate fire events. The spatially/temporally aggregated burn scar data demonstrated that 69% of the study region was fire. Results highlight that the burnt area is very dependent on the type of coverage, where the grassland and savanna formation are strongly linked to fire events. Thus, the savanna and grasslands had the highest area of burning during the study period. These results confirm previous studies dealing with Brazilian savanna structure and seasonal occurrence of fire [83,84]. In the forest formation, the conditions that are more humid limit the fire events to small patches, obtaining the lowest proportion of burnt areas. Thus, residual vegetation islands in the fire events have a strong relationship with forest formation, located in the landscape under different edaphic water content and topography.
The year 2005 had the largest fires and the highest number of burnt-area fragments. Other years with high percentage of burnt areas did not demonstrate high values in the number of fragments. The fragmented burnt area during the 2005 year was probably due to the fire occurrence in the early dry season, where remaining green vegetation prevented the spatial spread of fires, creating islands of burned and unburned vegetation. Bucini and Lambin [85] also demonstrate a higher occurrence of the small and fragmented burn scars due to an early fire in the savanna environment.
The spatial distribution of burned areas during 2001–2010 reveals a pattern of recurrent burns in specific zones around the park. Five zones were highlighted as priority for monitoring and firefighting. In this study, we observed the occurrence of uncontrolled burning caused by anthropogenic fires outside the park during the dry season, which expands into the park area. In the study region, extensive grazing systems typically use fire to stimulate vegetation regrowth and increase food availability for animals. Normally, the increased incidence of human-caused fires around national parks is linked to hunting and other subsistence activities, such as cattle. Other parks in the Brazilian savanna exhibit similar patterns with anthropogenic fire characterized by their occurrence in the dry season and their possession of an extensive burned area, such as the Chapada dos Veadeiros National Park [86] and Serra da Canastra National Park [87]. Burning typically occurred at intervals of 3-years due to human intervention, similarly to other savanna localities as noted by França and Setzer [71] in Emas National Park.
Interestingly, a marked decrease of the fire extent inside STNR occurred after 2007, which coincided with the creation of the park and consequently of the fire prevention programs. The total burnt area inside the park in the period 2008–2010 was only 1752.31 ha, far below most of the other analyzed years. Moreover, only a negligible park area experienced fire recurrence in this period. The year 2010 showed a high percentage of fires, located in the northern portion of the buffer zone; however, the fires do not affect the STNR. This suggests that the underlying reason for the changes in fire recurrence in the region could be attributed to the park boundary and an increase in firefighting. Thus, the long-term strategy to extend the network of parks in the savannah proves to be an important component of nature conservation. Another issue that must be examined is whether the performance of protected areas is restricted to local effects or has a regional scope. During the specific event of 2010, it was observed that the burned areas stopped at the reserve boundary and did not progress to the southern region.
Therefore, the official implementation of the STNR in the 2007 showed changes in spatial patterns, with a decrease in burnt area mainly within the park boundaries. However, confirmation of this decrease should be based on a longer period of monitoring. Moreover, climate change and population growth around the park can intensify the fire regional trends. An integration of STNR and the community living in the buffer zone should be pursued in order to raise awareness of the appropriate use of fire. The fire management programs should consider and maintain natural biological cycles, thereby avoiding fuel accumulation and the increased risk of more serious fires, which pose a threat to native flora and endemic species. Thus, fire management is necessary, so it can play its ecological role in the Cerrado biome.
7. Conclusions
This paper proposes a new methodology for the study of fire in Brazilian savanna that integrates different spatial analysis techniques, such as fire recurrence, landscape metrics to describe burnt area patterns, and cross-tabulation between vegetation and fire scars. The survey results show that the largest fire events in Brazilian savanna occurred in a 3-year cycle. The burnt areas during 2001–2010 occurred predominantly in the Savanna Formation. Burnt-area proportion within the same class demonstrates similar values between Savanna and Grassland Formations (74%). Some sites showed no burn scars, such as valleys occupied by forest formations, which are less susceptible to fire occurrence. The burnt area patches described the spatial features and factors driving the fire patterns. Current fire patterns in this region are dominated by anthropogenic causes, predominantly in the buffer zone around the park.
The way forward is to define strategies from regional trends using this approach to constrain human incendiary activities. Therefore, zones of high fire recurrence could be used as priority areas for firefighting actions and awareness campaigns involving local residents. In the Serra do Tombador Nature Reserve, increased enforcement is needed to the Northwest and Southeast limits, regions with high fire recurrence. Furthermore, a systematic assessment of burnt areas using remote sensing should be implemented in the region, providing basic knowledge for monitoring and recovery of fire-affected landscapes over time.
Acknowledgments
The authors are grateful for the support of the following institutions: The Nature Conservancy (TNC) and Boticario Group Foundation for Nature Protection, for logistical support; and Conselho Nacional de Desenvolvimento Científico e Tecnológico (CNPq) for research grants.
Author Contributions
Gabriel Antunes Daldegan and Osmar Abílio de Carvalho Júnior wrote the manuscript and were responsible for the research design, mathematical model, data preparation and analysis. Renato Fontes Guimarães, Roberto Arnaldo Trancoso Gomes and Concepta McManus supported the analysis and interpretation of the results. Fernanda de Figueiredo Ribeiro provided some of the data, conducted the field-works and gave relevant technical support. All of the authors contributed in editing and reviewing the manuscript.
Conflicts of Interest
The authors declare no conflict of interest.
References
- Miranda, H.S.; Neto, W.N.; Neves, B.M.C. Caracterização das queimadas de cerrado. In Efeitos Do Regime Do Fogo Sobre a Estrutura De Comunidades De Cerrado: Resultados do Projeto Fogo, 1st ed; Miranda, H.S., Ed.; IABAMA/MMA: Brasilia, Brazil, 2010; Volume 1, pp. 23–33. [Google Scholar]
- Salgado-Labouriou, M.L.; Ferraz-Vincentini, K.R. Fire in the Cerrado 32,000 years ago. Curr. Res. Pleistocene 1994, 11, 85–87. [Google Scholar]
- Ramos-Neto, M.B.; Pivello, V.R. Lightning fires in a Brazilian savanna national park: Rethinking management strategies. Environ. Manag 2000, 26, 675–684. [Google Scholar]
- Cirne, P.; Miranda, H.S. Effects of prescribed fires on the survival and release of seeds of Kielmeyeracoriacea (Spr.) Mart. (Clusiaceae) in savannas of Central Brazil. Braz. J. Plant Physiol 2008, 20, 197–204. [Google Scholar]
- Medeiros, M.B.; Miranda, H.S. Post-fire resprouting and mortality in Cerrado woody plant species over a three-year period. Edinb. J. Bot 2008, 65, 1–16. [Google Scholar]
- Medeiros, M.B.; Miranda, H.S. Mortalidade pós-fogo em espécies lenhosas de campo sujo submetido a três queimadas prescritas anuais. Acta Bot. Bras 2005, 19, 493–500. [Google Scholar]
- Loiola, P.D.P.; Cianciaruso, M.V.; Silva, I.A.; Batalha, M.A. Functional diversity of herbaceous species under different fire frequencies in Brazilian savannas. Flora 2010, 205, 674–681. [Google Scholar]
- Silva, I.A.; Batalha, M.A. Woody plant species co-occurrence in Brazilian savannas under different fire frequencies. Acta Oecol 2010, 36, 85–91. [Google Scholar]
- Durigan, G.; Ratter, J.A. Successional changes in cerrado and cerrado/forest ecotonal vegetation in western São Paulo State, Brazil, 1962–2000. Edinb. J. Bot 2006, 63, 119–130. [Google Scholar]
- Geiger, E.L.; Gotsch, S.G.; Damasco, G.; Haridasan, M.; Franco, A.C.; Hoffmann, W.A. Distinct roles of savanna and forest tree species in regeneration under fire suppression in a Brazilian savanna. J. Veg. Sci 2011, 22, 312–321. [Google Scholar]
- Bond, W.J.; Keeley, J.E. Fire as a global “herbivore”: The ecology and evolution of flammable ecosystems. Trends Ecol. Evol 2005, 20, 387–394. [Google Scholar]
- Pivello, V.R. The use of fire in the Cerrado and Amazonian rainforests of Brazil: Past and present. Fire Ecol 2011, 7, 24–39. [Google Scholar]
- Miranda, H.S.; Bustamante, M.M.C.; Miranda, A.C. The fire factor. In The Cerrados of Brazil: Ecology and Natural History of a Neotropical Savanna; Oliveira, P.S., Marquis, R.J., Eds.; Columbia University Press: New York, NY, USA, 2002; pp. 51–68. [Google Scholar]
- Bastarrika, A.; Chuvieco, E.; Martín, M.P. Mapping burned areas from Landsat TM/ETM+ data with a two-phase algorithm: Balancing omission and commission errors. Remote Sens. Environ 2011, 115, 1003–1012. [Google Scholar]
- Brewer, C.K.; Winne, J.C.; Redmond, R.L.; Opitz, D.W.; Mangrich, M.V. Classifying and mapping wildfire severity: A comparison of methods. Photogramm. Eng. Remote Sens 2005, 71, 1311–1320. [Google Scholar]
- Jones, J.W.; Hall, A.E.; Foster, A.M.; Smith, T.J. Wetland fire scar monitoring and analysis using archival Landsat data for the Everglades. Fire Ecol 2013, 9, 133–150. [Google Scholar]
- Mallinis, G.; Koutsias, N. Comparing ten classification methods for burned area mapping in a Mediterranean environment using Landsat TM satellite data. Int. J. Remote Sens 2012, 33, 4408–4433. [Google Scholar]
- Petropoulos, G.P.; Kontoes, C.; Keramitsoglou, I. Burnt area delineation from a uni-temporal perspective based on Landsat TM imagery classification using Support Vector Machines. Int. J. Appl. Earth Obs 2011, 13, 70–80. [Google Scholar]
- Picotte, J.J.; Robertson, K. Timing constraints on remote sensing of wildland fire burned area in the Southeastern US. Remote Sens 2011, 3, 1680–1690. [Google Scholar]
- Schroeder, W.; Prins, E.; Giglio, L.; Csiszar, I.; Schmidt, C.; Morisette, J.; Morton, D. Validation of GOES and MODIS active fire detection products using ASTER and ETM+ data. Remote Sens. Environ 2008, 112, 2711–2726. [Google Scholar]
- Simon, M.; Plummer, F.; Fierens, F.; Hoelzmann, J.; Arino, O. Burnt area detection at the global scale using ATSR-2: The GLOBESCAR products and their qualification. J. Geophys. Res 2004, 109, 1–16. [Google Scholar]
- Silva, J.M.N.; Sá, A.C.L.; Pereira, J.M.C. Comparison of burned area estimates derived from SPOT-VEGETATION and Landsat ETM+ data in Africa: Influence of spatial pattern and vegetation type. Remote Sens. Environ 2005, 96, 188–201. [Google Scholar]
- Schroeder, W.; Csiszar, I.; Giglio, L.; Schmidt, C.C. On the use of fire radiative power, area, and temperature estimates to characterize biomass burning via moderate to coarse spatial resolution remote sensing data in the Brazilian Amazon. J. Geophys. Res-Atmos 2010, 115. [Google Scholar] [CrossRef]
- Freeborn, P.H.; Cochrane, M.A.; Wooster, M.J. A decade long, multi-scale map comparison of fire regime parameters derived from three publically available satellite-based fire products: A case study in the Central African Republic. Remote Sens 2014, 6, 4061–4089. [Google Scholar]
- Laris, P.S. Spatiotemporal problems with detecting and mapping mosaic fire regimes with coarse-resolution satellite data in savanna environments. Remote Sens. Environ 2005, 99, 412–424. [Google Scholar]
- Brazil, Plano De Manejo Da Área De Proteção Ambiental APA Pouso Alto-GO, 1st ed; Agência Ambiental de Goiás (AGMA): Goiânia, GO, Brazil, 2005.
- Fundação Grupo Boticário, Plano de Manejo da Reserva Natural Serra do Tombador; Internal FGB Report; Fundação Grupo Boticário: Brasília, DF, Brazil, 2011.
- Townshend, J.R.G.; Justice, C.O.; Gurney, C.; McManus, J. The impact of misregistration on change detection. IEEE Trans. Geosci. Remote Sens 1992, 30, 1054–1060. [Google Scholar]
- Dai, X.; Khorram, S. The effects of image misregistration on the accuracy of remotely sensed change detection. IEEE Trans. Geosci. Remote Sens 1998, 36, 1566–1577. [Google Scholar]
- Chuvieco, E.; Riaño, D.; Danson, F.M.; Martín, M.P. Use of a radiative transfer model to simulate the post-fire spectral response to burn severity. J. Geophys. Res-Biogeo 2006, 111, G04S09. [Google Scholar] [CrossRef]
- Lentile, L.Z.; Holden, Z.A.; Smith, A.M.S.; Falkowski, M.J.; Hudak, A.T.; Morgan, P.; Lewis, S.A.; Gessler, P.E.; Benson, N.C. Remote sensing techniques to assess active fire characteristics and post-fire effects. Int. J. Wildland Fire 2006, 15, 319–345. [Google Scholar]
- Bisquert, M.; Sánchez, J.M.; Caselles, V. Modeling fire danger in Galicia and Asturias (Spain) from MODIS Images. Remote Sens 2014, 6, 540–554. [Google Scholar]
- Harris, S.; Veraverbeke, S.; Hook, S. Evaluating spectral indices for assessing fire severity in chaparral ecosystems (Southern California) using MODIS/ASTER (MASTER) airborne simulator data. Remote Sens 2011, 3, 2403–2419. [Google Scholar]
- Lozano, F.J.; Suárez-Seoane, S.; de Luis, E. Assessment of several spectral indices derived from multi-temporal Landsat data for fire occurrence probability modelling. Remote Sens. Environ 2007, 107, 533–544. [Google Scholar]
- De Santis, A.; Chuvieco, E. Burn severity estimation from remotely sensed data: Performance of simulation versus empirical models. Remote Sens. Environ 2007, 108, 422–435. [Google Scholar]
- Miller, J.D.; Thode, A.E. Quantifying burn severity in a heterogeneous landscape with a relative version of the delta Normalized Burn Ratio (dNBR). Remote Sens. Environ 2007, 109, 66–80. [Google Scholar]
- Smith, A.M.S.; Lentile, L.B.; Hudak, A.T.; Morgan, P. Evaluation of linear spectral unmixing and ΔNBR for predicting post-fire recovery in a North American ponderosa pine forest. Int. J. Remote Sens 2007, 28, 5159–5166. [Google Scholar]
- Quintano, C.; Fernández-Manso, A.; Fernández-Manso, O.; Shimabukuro, Y.E. Mapping burned areas in Mediterranean countries using spectral mixture analysis from a uni-temporal perspective. Int. J. Remote Sens 2006, 27, 645–662. [Google Scholar]
- Maeda, E.E.; Arcoverde, G.F.; Pellikka, P.K.; Shimabukuro, Y.E. Fire risk assessment in the Brazilian Amazon using Modis imagery and change vector analysis. Appl. Geogr 2011, 31, 76–84. [Google Scholar]
- Maeda, E.E.; Formaggio, A.R.; Shimabukuro, Y.E.; Arcoverde, G.F.B.; Hansen, M.C. Predicting forest fire in the Brazilian Amazon using MODIS imagery and artificial neural networks. Int. J. Appl. Earth Obs 2009, 11, 265–272. [Google Scholar]
- Petropoulos, G.P.; Vadrevu, K.P.; Xanthopoulos, G.; Karantounias, G.; Scholze, M. A comparison of spectral angle mapper and artificial neural network classifiers combined with Landsat TM imagery analysis for obtaining burnt area mapping. Sensors 2010, 10, 1967–1985. [Google Scholar]
- Gómez, I.; Martín, M. P. Prototyping an artificial neural network for burned area mapping on a regional scale in Mediterranean areas using MODIS images. Int. J. Appl. Earth Obs 2011, 13, 741–752. [Google Scholar]
- Mitri, G.H.; Gitas, I.Z. Mapping the severity of fire using object-based classification of IKONOS imagery. Int. J. Wildland Fire 2008, 17, 431–442. [Google Scholar]
- Polychronaki, A.; Gitas, I.Z.; Veraverbeke, S.; Debien, A. Evaluation of ALOS PALSAR imagery for burned area mapping in Greece using object-based classification. Remote Sens 2013, 5, 5680–5701. [Google Scholar]
- Smith, A.M.S.; Drake, N.A.; Wooster, M.J.; Hudak, A.T.; Holden, Z.A.; Gibbons, C.J. Production of Landsat ETM+ reference imagery of burned areas within Southern African savannahs: Comparison of methods and application to MODIS. Int. J. Remote Sens 2007, 28, 2753–2775. [Google Scholar]
- San-Miguel-Ayanz, J.; Pereira, J.M.C.; Boca, R.; Strobl, P.; Kucera, J.; Pekkarinen, A. Forest fires in the European Mediterranean region: Mapping and analysis of burned areas. In Earth Observation of Wildland Fires in Mediterranean Ecosystems; Chuvieco, E., Ed.; Springer: Berlin, Germany, 2009; pp. 189–204. [Google Scholar]
- Sá, A.C.L.; Pereira, J.M.C.; Gardner, R.H. Analysis of the relationship between spatial pattern and spectral detectability of areas burned in southern Africa using satellite data. Int. J. Remote Sens 2007, 28, 3583–3601. [Google Scholar]
- Stroppiana, D.; Boschetti, M.; Zaffaroni, P.; Brivio, P.A. Analysis and interpretation of spectral indices for soft multicriteria burned-area mapping in mediterranean regions. IEEE Geosci. Remote Sens. Lett 2009, 6, 499–503. [Google Scholar]
- Fraser, R.H.; Li, Z.; Landry, R. SPOT VEGETATION for characterizing boreal forest fires. Int. J. Remote Sens 2000, 21, 3525–3532. [Google Scholar]
- Bowman, D.M.J.S.; Zhang, Y.; Walsh, A.; Williams, R.J. Experimental comparison of four remote sensing techniques to map tropical savanna fire-scars using Landsat-TM7 imagery. Int. J. Wildland Fire 2003, 12, 341–348. [Google Scholar]
- Mahalanobis, P.C. On the Generalised Distance in Statistics. Available online: http://www.unt.edu/rss/class/Jon/MiscDocs/1936_Mahalanobis.pdf (accessed on 5 March 2014).
- Li, Y.; Vodacek, A.; Kremens, R.L.; Ononye, A.; Tang, C. A hybrid contextual approach to wildland fire detection using multispectral imagery. IEEE Trans.Geosci. Remote. Sens 2005, 43, 2115–2126. [Google Scholar]
- Smith, A.C.; Fahrig, L.; Francis, C.M. Landscape size affects the relative importance of habitat amount, habitat fragmentation, and matrix quality on forest birds. Ecography 2011, 34, 103–113. [Google Scholar]
- McGarigal, L.; Marks, B.J. FRAGSTATS Manual: Spatial Pattern Analysis Program for Quantifying Landscape Structure, 1994. Available online: http://ftp.fsl.orst.edu/pub/fragstats.2.0 (accessed on 5 March 2014).
- Herold, M.; Couclelis, H.; Clarke, K.C. The role of spatial metrics in the analysis and modeling of urban land use change. Comput. Environ. Urban 2005, 29, 369–399. [Google Scholar]
- Seto, K.C.; Fragkias, M. Quantifying spatiotemporal patterns of urban land-use change in four cities of China with time series landscape metrics. Landsc. Ecol 2005, 20, 871–888. [Google Scholar]
- Weng, Y.C. Spatiotemporal changes of landscape pattern in response to urbanization. Landsc. Urban Plan 2007, 81. [Google Scholar]
- Kashian, D.M.; Tinker, D.B.; Turner, M.G.; Scarpace, F.L. Spatial heterogeneity of lodgepole pine sapling densities following the 1988 fires in Yellowstone National Park, Wyoming, USA. Can. J. For. Res 2004, 34, 2263–2276. [Google Scholar]
- Parisien, M.A.; Peters, V.S.; Wang, Y.; Little, J.M.; Bosch, E.M.; Stocks, B.J. Spatial patterns of forest fires in Canada, 1980–1999. Int. J. Wildland Fire 2006, 15, 361–374. [Google Scholar]
- Wang, X.; Hamann, A.; Cumming, S.G. Measuring boreal forest fragmentation after fire: Which configuration metrics are best? Ecol. Indic 2012, 13, 189–195. [Google Scholar]
- Collins, B.M.; Kelly, M.; van Wagtendonk, J.W.; Stephens, S.L. Spatial patterns of large natural fires in Sierra Nevada wilderness areas. Landsc. Ecol 2007, 22, 545–557. [Google Scholar]
- Hayes, J.J.; Robeson, S.M. Relationships between fire severity and post-fire landscape pattern following a large mixed-severity fire in the Valle Vidal, New Mexico, USA. For. Ecol. Manag 2011, 261, 1392–1400. [Google Scholar]
- Lee, S.W.; Lee, M.B.; Lee, Y.G.; Won, M.S.; Kim, J.J.; Hong, S.K. Relationship between landscape structure and burn severity at the landscape and class levels in Samchuck, South Korea. For. Ecol. Manag 2009, 258, 1594–1604. [Google Scholar]
- Loepfe, L.; Martinez-Vilalta, J.; Oliveres, J.; Piñol, J.; Lloret, F. Feedbacks between fuel reduction and landscape homogenisation determine fire regimes in three Mediterranean areas. For. Ecol. Manag 2010, 259, 2366–2374. [Google Scholar]
- Soares-Filho, B.; Silvestrini, R.; Nepstad, D.; Brando, P.; Rodrigues, H.; Alencar, A.; Coe, M.; Locks, C.; Lima, L.; Hissa, L.; et al. Forest fragmentation, climate change and understory fire regimes on the Amazonian landscapes of the Xingu headwaters. Landsc. Ecol 2012, 27, 585–598. [Google Scholar]
- Díaz-Delgado, R.; Lloret, F.; Pons, X. Spatial patterns of fire occurrence in Catalonia, NE, Spain. Landsc. Ecol 2004, 19, 731–745. [Google Scholar]
- Lee, B.; Kim, S.Y.; Chung, J.; Park, P.S. Estimation of fire severity by use of Landsat TM images and its relevance to vegetation and topography in the 2000 Samcheok forest fire. J. For. Res 2008, 13, 197–204. [Google Scholar]
- Syphard, A.D.; Franklin, J.; Keeley, J.E. Simulating the effects of frequent fire on southern California coastal shrublands. Ecol. Appl 2006, 16, 1744–1756. [Google Scholar]
- Sano, E.E.; Rosa, R.; Brito, J.L.S.; Ferreira, L.G. Mapeamento do Uso do Solo e Cobertura Vegetal -Bioma Cerrado: Ano Base 2002. Série Biodiversidade, 1st ed; Ministério do Meio Ambiente-Secretaria de Biodiversidade e Florestas: Brasília, Brazil, 2010. [Google Scholar]
- Brazil Monitoramento do Desmatamento nos Biomas Brasileiros por Satélite. In Monitoramento do Bioma Cerrado 2009–2010; Ministério do Meio Ambiente (MMA) and Instituto Brasileiro do Meio Ambiente e dos Recursos Naturais Renováveis (IBAMA): Brasília, Brazil, 2011.
- França, H.; Ramos Neto, M.B.; Setzer, A. O fogo no Parque Nacional das Emas, 1st ed; Ministério do Meio Ambiente: Brasília, DF, Brazil, 2007. [Google Scholar]
- Pereira, A.C.; Gama, V.F. Anthropization on the Cerrado biome in the Brazilian Uruçuí-Una Ecological Station estimated from orbital images. Braz. J. Biol 2010, 70, 969–976. [Google Scholar]
- Dennis, R.A.; Mayer, J.; Applegate, G.; Chokkalingam, U.; Colfer, C.J.P.; Kurniawan, I.; Lachowski, H.; Maus, P.; Permana, R.P.; Ruchiat, Y.; et al. Fire, people and pixels: Linking social science and remote sensing to understand underlying causes and impacts of fires in Indonesia. Hum. Ecol 2005, 33, 465–504. [Google Scholar]
- Driscoll, D.A.; Lindenmayer, D.B.; Bennett, A.F.; Bode, M.; Bradstock, R.A.; Cary, G.J.; Clarke, M.F.; Dexter, N.; Fensham, R.; Friend, G.; et al. Fire management for biodiversity conservation: Key research questions and our capacity to answer them. Biol. Conserv 2010, 143, 1928–1939. [Google Scholar]
- Chang, Y.; He, H.S.; Hu, Y.; Bu, R.; Li, X. Historic and current fire regimes in the Great Xing’an Mountains, northeastern China: Implications for long-term forest management. For. Ecol. Manag 2008, 254, 445–453. [Google Scholar]
- Chuvieco, E.; Englefield, P.; Trishchenko, A.P.; Luo, Y. Generation of long time series of burn area maps of the boreal forest from NOAA–AVHRR composite data. Remote Sens. Environ 2008, 112, 2381–2396. [Google Scholar]
- Chuvieco, E.; Martin, M.P.; Palacios, A. Assessment of different spectral indices in the red-near-infrared spectral domain for burned land discrimination. Int. J. Remote Sens 2002, 23, 5103–5110. [Google Scholar]
- Stroppiana, D.; Bordogna, G.; Carrara, P.; Boschetti, M.; Boschetti, L.; Brivio, P.A. A method for extracting burned areas from Landsat TM/ETM+ images by soft aggregation of multiple spectral indices and a region growing algorithm. ISPRS J. Photogramm. Remote Sens 2012, 69, 88–102. [Google Scholar]
- Verbyla, D.L.; Kasischke, E.S.; Hoy, E.E. Seasonal and topographic effects on estimating fire severity from Landsat TM/ETM+ data. Int. J. Wildland Fire 2008, 17, 527–534. [Google Scholar]
- Roy, D.P.; Boschetti, L. Southern Africa validation of the MODIS, L3JRC, and GlobCarbon burned-area products. IEEE Trans. Geosci. Remote Sens 2009, 47, 1032–1044. [Google Scholar]
- Roy, D.P.; Boschetti, L.; Justice, C.O. The collection 5 MODIS burned area product Global evaluation by comparison with the MODIS active fire product. Remote Sens. Environ 2008, 112, 3690–3707. [Google Scholar]
- Tansey, K.; Grégoire, J.M.; Defourny, P.; Leigh, R.; Peckel, J.F.; van Bogaert, E.; Bartholome, E. A new, global, multi-annual (2000–2007) burnt area product at 1 km resolution. Geophys. Res. Lett 2008, 35. [Google Scholar] [CrossRef]
- Hoffmann, W.A.; Adasme, R.; Haridasan, M.; de Carvalho, M.T.; Geiger, E.L.; Pereira, M.A.B.; Gotsch, S.G.; Franco, A.C. Tree topkill, not mortality, governs the dynamics of savanna-forest boundaries under frequent fire in central Brazil. Ecology 2009, 90, 1326–1337. [Google Scholar]
- Miranda, A.C.; Miranda, H.S.; Dias, I.O.; Dias, B.F. Soil and air temperatures during prescribed Cerrado fires in central Brazil. J. Trop. Ecol 1993, 9, 313–320. [Google Scholar]
- Bucini, G.; Lambin, E.F. Fire impacts on vegetation in Central Africa: A remote-sensing-based statistical analysis. Appl. Geogr 2002, 22, 27–48. [Google Scholar]
- Fiedler, N.C.; Merlo, D.A.; Medeiros, M.B. Ocorrência de incêndios florestais no Parque Nacional da Chapada dos Veadeiros. Goiás. Ciência Florestal 2006, 16, 153–161. [Google Scholar]
- Medeiros, M.B.; Fiedler, N.C. Incêndios florestais no Parque Nacional da Serra da Canastra: Desafios para a conservação da biodiversidade. Ciência Florestal 2004, 14, 157–168. [Google Scholar]


| Path | Rows | Month | Day | Year |
|---|---|---|---|---|
| 221 | 69 and 70 | July | 8 | 2001 |
| 221 | 69 and 70 | September | 30 | |
| 221 | 69 and 70 | July | 2 | 2003 |
| 221 | 69 and 70 | September | 20 | |
| 221 | 69 and 70 | July | 4 | 2004 |
| 221 | 69 and 70 | August | 21 | |
| 221 | 69 and 70 | September | 6 | |
| 221 | 69 and 70 | July | 23 | 2005 |
| 221 | 69 and 70 | August | 24 | |
| 221 | 69 and 70 | September | 5 | |
| 221 | 69 and 70 | July | 26 | 2006 |
| 221 | 69 and 70 | August | 27 | |
| 221 | 69 and 70 | September | 12 | |
| 221 | 69 and 70 | July | 13 | 2007 |
| 221 | 69 and 70 | August | 14 | |
| 221 | 69 and 70 | September | 15 | |
| 221 | 69 and 70 | July | 31 | 2008 |
| 221 | 69 and 70 | August | 16 | |
| 221 | 69 and 70 | September | 1 | |
| 221 | 69 and 70 | July | 2 | 2009 |
| 221 | 69 and 70 | August | 19 | |
| 221 | 69 and 70 | September | 14 | |
| 221 | 69 and 70 | July | 5 | 2010 |
| 221 | 69 and 70 | August | 22 | |
| 221 | 69 and 70 | September | 23 |
| Within the STNR and Buffer Zone | Within the Restricted Area of the STNR | ||||||
|---|---|---|---|---|---|---|---|
| Year | Months | Number of Patches | Área ha | % | Number of Patches | Área ha | % |
| 2001 | Jul/Set | 363 | 19,568.16 | 21.74 | 36 | 3,868.84 | 44.31 |
| 2003 | Jul/Set | 196 | 8,577.35 | 9.53 | 16 | 2,063.99 | 23.64 |
| 2004 | Jul/Ago/Set | 831 | 30,623.20 | 34.01 | 79 | 2,893.93 | 33.15 |
| 2005 | Jul/Ago/Set | 216 | 7,608.83 | 8.45 | 25 | 915.71 | 10.49 |
| 2006 | Jul/Ago/Set | 154 | 13,395.06 | 14.88 | 11 | 1,270.99 | 14.56 |
| 2007 | Jul/Ago/Set | 82 | 24,754.09 | 27.50 | 8 | 4,442.28 | 50.88 |
| 2008 | Jul/Ago/Set | 55 | 1,665.09 | 1.85 | 5 | 130.19 | 1.49 |
| 2009 | Jul/Ago/Set | 150 | 7,392.92 | 8.21 | 11 | 1,620.26 | 18.56 |
| 2010 | Jul/Ago/Set | 175 | 23,192.02 | 25.76 | 1 | 0.28 | 0.00 |
| Year | MPS | NumP | MedPS | PSSD | TBA |
|---|---|---|---|---|---|
| 2001 | 53.91 | 363 | 5.28 | 290.45 | 19,568.17 |
| 2003 | 43.76 | 196 | 6.44 | 230.40 | 8577.35 |
| 2004 | 36.85 | 831 | 0.53 | 513.39 | 30,623.21 |
| 2005 | 35.23 | 216 | 4.68 | 109.80 | 7608.83 |
| 2006 | 86.98 | 154 | 7.88 | 681.16 | 13,395.07 |
| 2007 | 301.88 | 82 | 14.96 | 1609.66 | 24,754.10 |
| 2008 | 30.27 | 55 | 4.91 | 77.95 | 1665.10 |
| 2009 | 49.29 | 150 | 4.41 | 207.74 | 7392.93 |
| 2010 | 132.53 | 175 | 3.24 | 1411.25 | 23,192.02 |
| Recurrence (Number of Years Burned) | Hectares | % |
|---|---|---|
| 1 | 19,904 | 31.93 |
| 2 | 20,728 | 33.26 |
| 3 | 12,800 | 20.54 |
| 4 | 6597 | 10.58 |
| 5 | 1529 | 2.45 |
| 6 | 471 | 0.76 |
| 7 | 208 | 0.33 |
| 8 | 57 | 0.09 |
| 9 | 4 | 0.01 |
| Land-Cover Classes | Total Area (ha) | Burnt Area (ha) | Burnt Area/Total Burnt Area | Burnt area % within Each Class |
|---|---|---|---|---|
| Forest Formation | 16,074 | 4981 | 18.02 | 30.99 |
| Grassland Formation | 12,406 | 9435 | 9.52 | 76.06 |
| Savanna Formation | 48,731 | 37,232 | 71.12 | 76.40 |
| Anthropic Use | 1528 | 701 | 1.34 | 45.88 |
| Land-Cover Class | Area (ha) | % |
|---|---|---|
| Forest Formation | 573 | 7.93 |
| Grassland Formation | 1244 | 17.21 |
| Savanna Formation | 5398 | 74.65 |
| Anthropic Use | 15 | 0.21 |
| Total | 7231 | 100.00 |
© 2014 by the authors; licensee MDPI, Basel, Switzerland This article is an open access article distributed under the terms and conditions of the Creative Commons Attribution license (http://creativecommons.org/licenses/by/4.0/).
Share and Cite
Daldegan, G.A.; De Carvalho, O.A., Jr.; Guimarães, R.F.; Gomes, R.A.T.; Ribeiro, F.D.F.; McManus, C. Spatial Patterns of Fire Recurrence Using Remote Sensing and GIS in the Brazilian Savanna: Serra do Tombador Nature Reserve, Brazil. Remote Sens. 2014, 6, 9873-9894. https://0-doi-org.brum.beds.ac.uk/10.3390/rs6109873
Daldegan GA, De Carvalho OA Jr., Guimarães RF, Gomes RAT, Ribeiro FDF, McManus C. Spatial Patterns of Fire Recurrence Using Remote Sensing and GIS in the Brazilian Savanna: Serra do Tombador Nature Reserve, Brazil. Remote Sensing. 2014; 6(10):9873-9894. https://0-doi-org.brum.beds.ac.uk/10.3390/rs6109873
Chicago/Turabian StyleDaldegan, Gabriel Antunes, Osmar Abílio De Carvalho, Jr., Renato Fontes Guimarães, Roberto Arnaldo Trancoso Gomes, Fernanda De Figueiredo Ribeiro, and Concepta McManus. 2014. "Spatial Patterns of Fire Recurrence Using Remote Sensing and GIS in the Brazilian Savanna: Serra do Tombador Nature Reserve, Brazil" Remote Sensing 6, no. 10: 9873-9894. https://0-doi-org.brum.beds.ac.uk/10.3390/rs6109873