1. Introduction
The incoming solar radiation (SSR, here also ‘surface irradiance’) at Earth’s surface is an important parameter for the planet’s climate through its role in the surface energy budget. At the same time, mapping the surface irradiance and its spatiotemporal variations provides the solar energy industry with valuable information for new capacity planning and energy production forecasting. Considering the remarkable growth of the solar energy industry over the last decade [
1], the importance of the latter application is increasing.
As ground-based measurements of SSR can provide continuous temporal, but only sparse spatial sampling, better geographical coverage is sought from satellite-based estimates. Over the course of the satellite remote sensing era, several studies have been carried out with the aim of obtaining surface irradiance estimates from satellite observations, beginning with some of the very first optical remote sensing imagery from TIROS III [
2,
3]. The work done until the mid-1990s is collected and analyzed in a review paper by Pinker
et al. [
4]. As computing power available for satellite data processing has increased, the SSR retrieval methods have generally moved towards increasingly more sophisticated treatments of the radiative transfer of solar radiation through Earth’s atmosphere, requiring fewer assumptions and simplifications.
The Satellite Application Facility on Climate Monitoring (CM SAF), a project of EUMETSAT, has produced several long-term homogenized datasets of surface irradiance from both polar-orbiting and geostationary optical imager data. Specifically, the CM SAF cLoud, Albedo and RAdiation dataset from AVHRR data—edition 1 (CLARA-A1) [
5] is composed of 28 years of polar-orbiting data from AVHRR instruments. The Meteosat Visible Infra-Red Imager (MVIRI) Data Set 1.0 [
6,
7] contains 23 years of data, and CLAAS [
8] contains eight years of data from the geostationary Meteosat First and Second generation satellites, respectively. The recently generated Surface Solar Radiation Data Set—Heliosat (SARAH) [
9] combines the generational Meteosat observation records to offer 30 years of coverage. The datasets are based on state-of-the-art algorithms and promise to provide high-quality irradiance estimates for creating solar radiation atlases for various regions. The datasets are available through the following DOI:
CLARA-A1: 10.5676/EUM_SAF_CM/CLARA_AVHRR/V001
MVIRI Data Set 1.0: 10.5676/EUM_SAF_CM/RAD_MVIRI/V001
CLAAS: 10.5676/EUM_SAF_CM/CLAAS/V001
SARAH: 10.5676/EUM_SAF_CM/SARAH/V001
In addition to the validation done for all datasets as a part of the release process, the accuracy of particularly the MVIRI dataset has also been explored in several recent publications [
7,
10,
11,
12,
13,
14]. However, because of their novelty, the CLARA-A1 and SARAH time series of surface irradiance have not yet received much attention in the form of dedicated validation studies. This study seeks to improve the situation and explore the quality of both CLARA-A1 and SARAH in depth over the Nordic countries of Finland and Sweden with a station network spanning the latitudes from
ca. 55 N to 70 N. This choice offers the possibility for a performance comparison between polar-orbiter and geostationary datasets over high latitudes.
Our geographical region of interest is another novel aspect of this study. From the point of view of solar energy generation, a common misconception is that only the lower latitudes receive sufficient solar radiation for useful solar energy generation. Yet, during the summer in the Nordic countries, the long hours of sunlight yield considerable amounts of energy [
15]. Combined with the high degree of development and increasing interest for solar energy generation in the region, we find that a dedicated study mapping the strengths and weaknesses of satellite-based irradiance estimates over the Nordic countries is called for. The solar radiation observation networks in the area offer rather good geographical and high temporal coverage for the
in situ data. The study has value for climate research also, as improved understanding of the irradiance data quality will aid future studies of the surface energy budget in the sensitive Arctic and sub-Arctic regions.
In this study, we begin by introducing the satellite datasets to be validated, summarizing the most important algorithm and coverage features. Our validation is based on collocated comparisons of the satellite data against in situ solar radiation measurements from the observation networks of the Finnish Meteorological Institute (FMI) and the Swedish Meteorological and Hydrological Institute (SMHI). Therefore, we will also introduce the observation networks and principal aspects of the in situ data. We will then describe the validation method used and show the results obtained. Finally, we will discuss the significance of the results in context with earlier studies and provide concluding remarks.
2. Data and Methods
The CM SAF SARAH dataset covers 1983–2013, based on observations from the MVIRI and SEVIRI (Spinning Enhanced Visible and InfraRed Imager) instruments on board the Meteosat First and Second Generation satellites (MFG, MSG) [
9]. A vicarious calibration approach after Mueller
et al. [
16] has been utilized in the intercalibration of the imagers’ data. The provided temporal resolution of SARAH SSR dataset matches CLARA-A1-SIS (daily and monthly means). The spatial resolution of the dataset family is 0.05 degrees on a regular latitude-longitude grid. Hourly MVIRI/SEVIRI data was used as input, implying that a large sampling frequency of SSR is achievable over the instruments’ viewing area. On the other hand, the viewing geometry of geostationary imaging leads to a coarsening spatial resolution and long atmospheric path lengths towards the high latitudes [
17], having a potential negative impact on the retrieval of the effective cloud albedo and the subsequent estimation of solar surface radiation over sites in Finland and Sweden. The limits in the observable area mean that the northernmost validation sites will not have any coverage in SARAH.
The SARAH climate data record has been retrieved by application of the SPECMAGIC method [
18]. In brief, SPECMAGIC uses a sophisticated look-up table approach, which is referred to as the “eigenvector-hybrid” approach. All applied look-up tables and parameterizations are based on radiative transfer modeling using the libRadtran model [
19]. The necessary aerosol information is taken from the MACC reanalysis data [
20] and water vapor from ERA reanalysis [
21,
22]. Please see Mueller
et al. [
9] or Amillo
et al. [
23] for further details about the input data. SPECMAGIC also needs information about the effective cloud albedo as input in order to estimate the all sky solar surface irradiance. The respective information of the cloud albedo is retrieved by application of the Heliosat method [
24,
25] to the visible channels of the METEOSAT satellites. Images from the broadband visible channel have been used for the Meteosat First Generation satellites. The high-resolution visible (HRV) channel of SEVIRI on MSG satellites does not cover the full Earth disc. Hence, combination of the visible channels VIS006 and VIS008 has been used for Meteosat Second Generation satellites. The use of such a combination was first proposed by Cros
et al. [
26] and adapted for the CM SAF by Posselt
et al. [
7].
The CLARA-A1 dataset family, based on homogenized AVHRR satellite observations spanning 1982–2009, consists of a wide variety of Thematic Climate Data Records (TCDRs) of Essential Climate Variables (ECVs) relevant to the water and energy cycles of Earth’s climate. CLARA-A1 datasets provide global coverage with a daily or monthly temporal resolution (for SSR) and a spatial resolution of 0.25 degrees on a regular latitude-longitude grid [
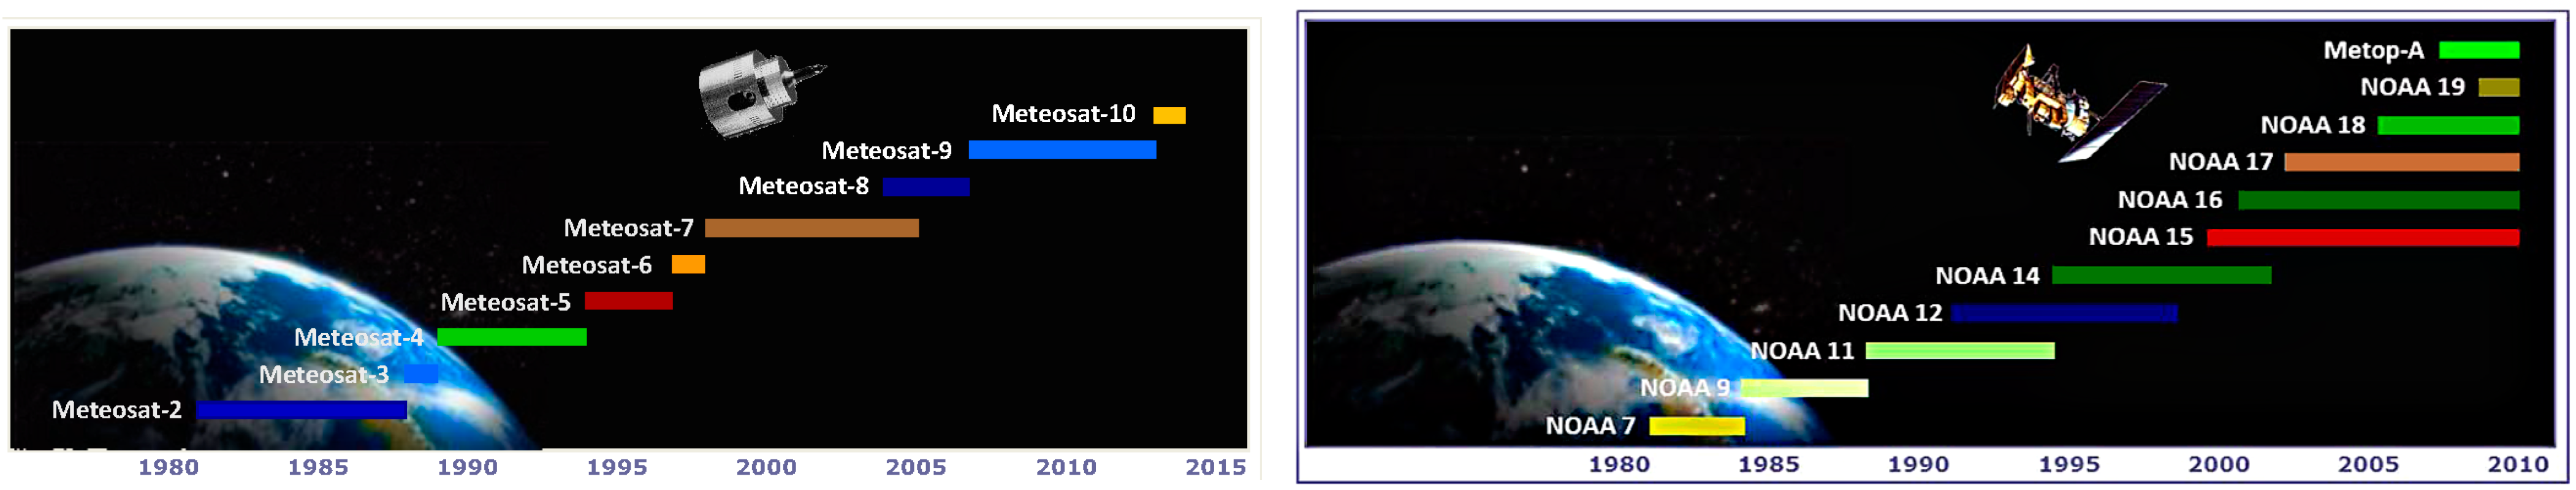
5]. As CLARA-A1 is based on observations from polar-orbiting AVHRR satellites with a wide imaging swath, it has the potential to provide very good coverage of the high latitude regions also for solar energy applications. The CLARA-A1 member dataset describing the surface solar irradiance is called CLARA-A1-SIS. In this study, we refer to the variable being studied (surface solar radiation) as SSR, and SIS refers to the satellite-based estimate of this variable (although we refer to SARAH and not SARAH-SIS for brevity). The temporal coverage by satellite of both CLARA and SARAH datasets is shown in
Figure 1.
Figure 1.
(
Left): Surface Solar Radiation Data Set—Heliosat (SARAH) temporal coverage by satellite. (
Right): CM SAF cLoud, Albedo and RAdiation dataset from AVHRR data—edition 1 (CLARA-A1) temporal coverage by National Oceanic and Atmospheric Administration (NOAA) satellite number. Right panel figure with permission from [
5].
The Heliosat method used in SARAH requires high temporal resolution in the input observations, therefore a different approach is needed for obtaining a SSR data record from polar-orbiting satellites. Thus, the algorithm of Mueller
et al. [
27] has been used to retrieve the CLARA surface radiation. This method is also based on the sophisticated eigenvector-hybrid look-up table approach, but in contrast to SPECMAGIC, only for broadband radiation. Furthermore, the top of atmosphere albedo is needed as input in order to treat the effect of clouds on the solar surface irradiance. The required top of atmosphere albedo is derived from the channels 1 and 2 of the AVHRR instrument series on-board of the NOAA satellites by application of a narrow-to-broadband conversion [
28] and a subsequent anisotropy correction [
29]. The aerosol information for the radiative transfer calculations is taken from the mean values of the aerosol climatology of MPI Hamburg [
30].
As the two satellite-based datasets have significant differences, which affect their comparability, we describe the differences here for the reader’s convenience. SARAH has no coverage over the northernmost areas of Scandinavia and its SSR retrievals will be affected by the long atmospheric path lengths, as discussed earlier. CLARA-A1 has no coverage over snow-covered areas (excluding most of the period between December and March from the study), though we note that this coverage will be added in the future successor dataset CLARA-A2. Both retrieval algorithms are based on the hybrid-eigenvector approach, but the aerosol information used as input for the radiative transfer calculations comes from different sources. Müller and Träger-Chatterjee [
31] found MACC to be superior to the MPI-H climatology for SSR retrievals, although the difference was less pronounced over Europe. The different temporal sampling in the datasets implies that the inferred cloud fields may vary, potentially impacting the daily mean SSR retrievals over short timeframes, especially for the CLARA-A1. However, our investigation period is in the interannual and -decadal scale, meaning that random effects at short temporal scales are effectively ameliorated.
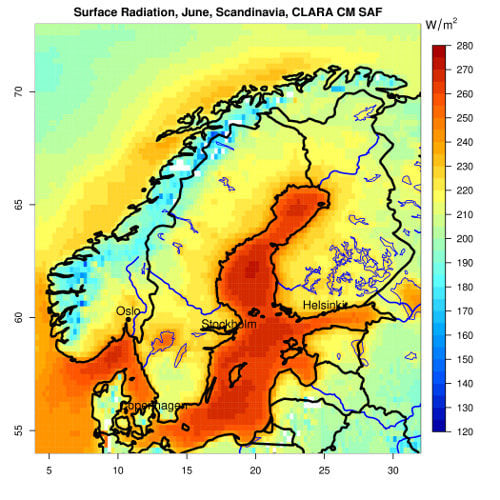
As an example, the overall mean SSR in June from both CLARA and SARAH datasets over Scandinavia is shown in
Figure 2.
Figure 2.
(Left) The 1982–2009 mean SSR in June over Scandinavia from CLARA-A1-SIS. (Right) The 1983–2013 mean SSR in June over Scandinavia from SARAH. The white areas do not have valid retrievals in the dataset(s).
Figure 2.
(Left) The 1982–2009 mean SSR in June over Scandinavia from CLARA-A1-SIS. (Right) The 1983–2013 mean SSR in June over Scandinavia from SARAH. The white areas do not have valid retrievals in the dataset(s).
Global solar radiation and its direct and diffuse flux constituents are routinely monitored by the
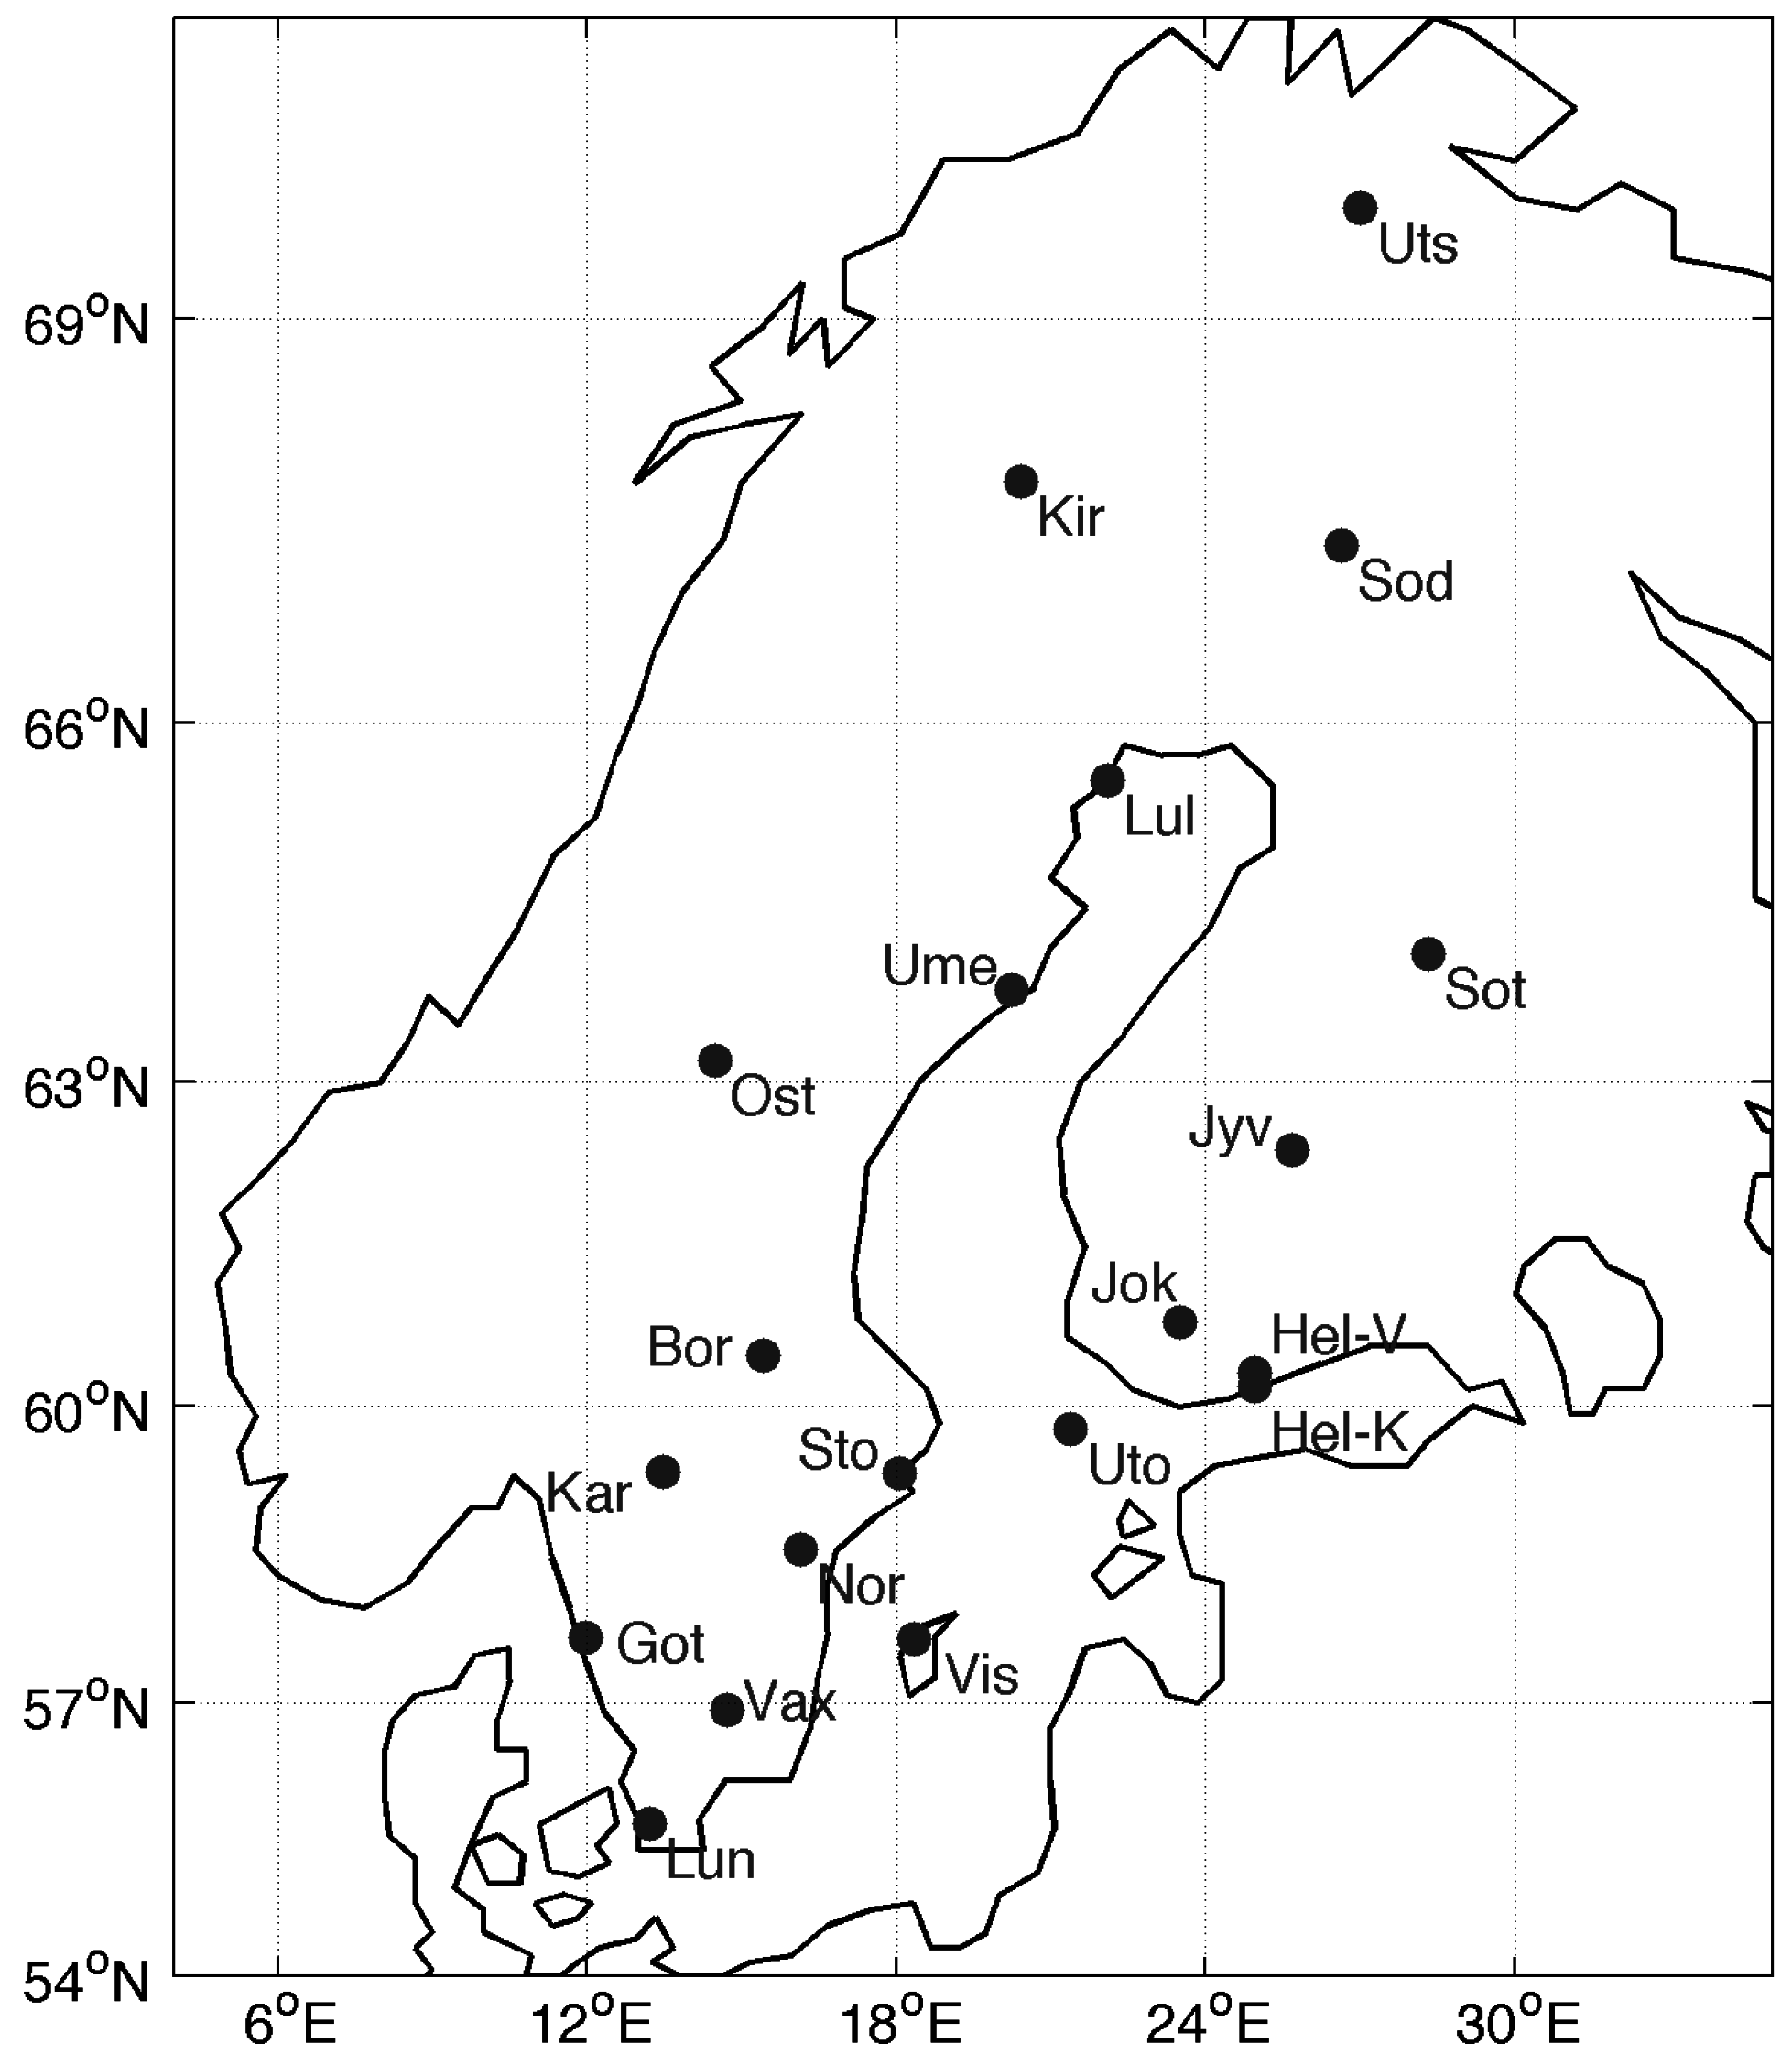
in situ observation networks of FMI and SMHI. The locations of the measurement stations are listed in
Table 1 and illustrated in
Figure 3.
Table 1.
Locations of the SMHI and FMI SSR measurement stations used in this study.
Table 1.
Locations of the SMHI and FMI SSR measurement stations used in this study.
| SMHI Station | Latitude (deg. N) | Longitude (deg. E) | Area Land Cover/Comments |
|---|
| Kiruna | 67.842 | 20.410 | Sparse forest No coverage in SARAH |
| Luleå | 65.544 | 22.111 | Rural/coastal/archipelago (airport)
No coverage in SARAH |
| Umeå | 63.811 | 20.240 | Rural/urban mix |
| Östersund | 63.197 | 14.480 | Rural/close to lake (airport) |
| Borlänge | 60.488 | 15.430 | Urban/rural/forest |
| Karlstad | 59.359 | 13.472 | Rural/close to lake (airport) |
| Stockholm | 59.353 | 18.063 | Urban/coastal/archipelago |
| Norrköping | 58.582 | 16.148 | Urban/rural mix |
| Göteborg | 57.708 | 11.992 | Urban/coastal |
| Visby | 57.673 | 18.345 | Rural/coastal (airport) |
| Växjö | 56.927 | 14.731 | Forest/rural/small lakes mix (airport) |
| Lund | 55.714 | 13.212 | Urban/rural mix |
| FMI station | | | |
| Utsjoki | 69.756 | 27.007 | Fells/sparse forest
No coverage in SARAH |
| Sodankylä | 67.367 | 26.629 | Forest/wetland/rural
No coverage in SARAH |
| Sotkamo | 64.112 | 28.336 | Rural/lakes/forest
No coverage in SARAH |
| Jyväskylä | 62.398 | 25.671 | Forest/rural (airport) |
| Jokioinen | 60.814 | 23.498 | Forest/rural |
| Helsinki-Vantaa | 60.327 | 24.957 | Urban/grass (airport) |
| Helsinki-Kumpula | 60.203 | 24.961 | Urban/coastal |
| Utö | 59.784 | 21.368 | Baltic Sea |
Figure 3.
Validation site locations in Finland and Sweden.
Figure 3.
Validation site locations in Finland and Sweden.
In Sweden, fully automated solar radiation observations have been operated since 1983. This first automated network ran more or less unchanged until 2007. A network upgrade was carried out during 2006–2007 and the updated stations became operational from 2008. In 2007, the old and new stations were operated in parallel. The stations that have been used in this study are the twelve stations that have been, and still are, in operation since 1983 (Borlänge since 1987). These are listed in
Table 1.
In the older network global irradiance measurements were made with Kipp & Zonen CM11 pyranometers. From 2008, Kipp & Zonen CM21 pyranometers were introduced at the updated stations. Both in the old and in the upgraded network, the pyranometers have always been ventilated. The ventilation prevents dew and frost formation on the domes, which otherwise frequently disturb the measurements, especially at high latitudes. The ventilation also significantly reduces the thermal offset problem in all thermopile pyranometers, such as the ones used in Finland and Sweden [
32,
33].
The Swedish measurements, both before and after 2008, are described in more detail by Carlund [
34]. In that report, results of the comparison of the old and new measurements are also presented. Over the whole comparison period of about a year the ratio of accumulated global irradiation from the old
versus the new network was 0.997. Monthly global irradiation values at individual stations normally differed 1% or less during the summer half of the year. During November–January, the monthly values could differ 5%, or even more, mostly with the old measurements being higher than the new ones.
The SSR measurements at FMI stations are taken with Kipp & Zonen pyranometers. Since the early 1990s, CM11 has been the standard sensor (CM2–CM10 prior to this). All observations are subjected to automatic quality control following BSRN standard tests [
35] with minor local adaptations, with augmenting human evaluation for all observations flagged as suspect. The FMI station records cover the full analysis period with the exceptions of Helsinki-Kumpula (starting 2005), Utö (starting 1997) and Sotkamo (starting 1996).
SMHI Pyranometer calibrations are performed outdoors at the main station in Norrköping. The field instruments are compared to field reference instruments, which are calibrated against SMHI’s secondary standard pyrheliometers, which in turn are calibrated at the International Pyrheliometer Comparisons held every fifth year at the Physikalisch-Meteorologisches Observatorium Davos/World Radiation Center in Davos, Switzerland. The Finnish secondary standard pyrheliometers have also participated at IPCs or have been compared to the SMHI references at regional Pyrheliometer comparisons [
36].
All FMI pyranometers in the field are ventilated, regularly maintained and periodically calibrated against reference pyranometers following a similar procedure as SMHI instruments. The calibration procedure itself was changed in the early 2000s, but no impact on the measurement accuracy has been observed as a result.
Prior investigations have also shown that a well-maintained pyranometer of WMO secondary standard, such as Kipp & Zonen CM11, has a flux measurement uncertainty on the order of 2%–5% [
37]. For time integrated (monthly) SSR measurements, the lower uncertainty of 2% is expected to be realistic for summer periods based on intercomparison trials [
37], with the 5% uncertainty being realistic for winter conditions. These uncertainties set an upper limit to the evaluation of SSR retrieval accuracy.
The validation metrics we have chosen to report fall into two categories. We report the classical Mean Bias Difference, Mean Absolute Bias Difference and Root Mean Square Difference (MBD, MABD and RMSD) for each site, keeping with the practice adopted by Sanchez-Lorenzo
et al. [
10] for the validation of the CM SAF MVIRI dataset. Additionally, we have calculated the correlation of anomalies of the monthly mean irradiances relative to the dataset mean SSR (per month) at each site. This quality measure provides additional information regarding the annual and intra-annual stability of the SIS datasets since the annual cycle of irradiance is removed from the result. The mathematical definitions of the quality indicators are as follows.
where SIS is the satellite-derived irradiance,
F is the site-measured irradiance, and n is the number of available valid observations (in the period in question). In addition to these basic metrics, we will also utilize the Mean Absolute Percentage Error (MAPE) for some parts of the analysis, as that allows for e.g., comparing the relative validation accuracy for the full study results between seasons. The definition of MAPE is
The quality assessment results are provided for both the monthly and daily means, expanding upon previous studies, which mainly focus on the monthly mean SIS products.
Quality assurance procedures for the in situ data were carried out prior to the calculations. All in situ measurements not flagged for highest quality (if quality flags were present) were discarded. Also, all monthly mean data from FMI stations with large data gaps (>10% of the days) were discarded. Also, as the SIS product is intended to represent the daily mean surface irradiance, no Sun Zenith Angle-based culling of the in situ data was employed to preserve comparability. This may induce a slight increase in the uncertainty of the in situ observations, as pyranometer measurements at low Sun elevation conditions are typically less precise.
The collocation of the
in situ and satellite-based irradiances considered three aspects. Temporal collocation consisted of averaging the daily high-quality
in situ data to conform to the satellite temporal resolution. Spatial collocation was based on a simple nearest-neighbor selection of a satellite grid cell containing the validation site. As some earlier validation studies of satellite-based irradiance estimates have used composites of satellite product grid cells around the validation sites [
7], we have also tested the difference of the nearest-neighbor
versus composite SIS irradiance selection on the validation results at two of our sites (Jokioinen and Utö). When using the mean CLARA-derived SSR of a 3 × 3 grid cell block around the site, the validation metrics of the monthly means (MBD, MABD, RMSD) all varied by less than 1 W/m
2 relative to the metrics from nearest-neighbor validation. This suggests that on the CLARA-A1 resolution of 0.25 degrees, the variation of SSR over the areas surrounding the validation site is not strong enough to significantly affect the comparison at a monthly time scale [
38]. The spectral collocation of the datasets required no further work; the SIS algorithm is defined over the waveband of 0.2–4 µm, which matches closely the radiation represented by the pyranometer measurements at FMI and SMHI stations.
3. Validation Results for CLARA-A1-SIS
The validation results for the CLARA monthly mean dataset are shown in
Table 2. Apart from one notable exception (Göteborg), the validation metrics are remarkably similar for the 20 sites we have investigated. We find that the CLARA-A1-SIS reaches an accuracy of 10 W/m
2 (MABD) for Sweden and Finland during the snow-free period. The results shown are also similar or slightly better to the ones obtained from the CLARA-A1-SIS release validation study and documented in Karlsson
et al. [
5]. Overall, CLARA-A1-SIS tends to slightly overestimate SSR over Finland and Sweden.
Table 2.
CLARA-A1-SIS validation results for monthly and daily means for the period 1982–2009. Numbers in parentheses are the results for the daily mean product. Mean monthly SSR is the 1982–2009 average SSR from valid in situ observations.
Table 2.
CLARA-A1-SIS validation results for monthly and daily means for the period 1982–2009. Numbers in parentheses are the results for the daily mean product. Mean monthly SSR is the 1982–2009 average SSR from valid in situ observations.
| SMHI Sites | MBD [W/m2] | MABD [W/m2] | RMSD [W/m2] | N [Valid Months (Days)] | r2 for Correlation of Anomalies | Mean Monthly SSR [W/m2] |
|---|
| Kiruna | 3.29 (2.13) | 5.38 (14.79) | 6.85 (20.54) | 123 (4154) | 0.91 (0.88) | 90.14 |
| Luleå | 5.51 (4.94) | 6.29 (14.92) | 7.69 (20.89) | 128 (4992) | 0.93 (0.90) | 98.43 |
| Umeå | 2.14 (1.84) | 4.54 (14.77) | 6.02 (20.44) | 153 (5238) | 0.93 (0.90) | 100.41 |
| Östersund | 0.96 (0.49) | 4.90 (15.49) | 6.27 (21.42) | 166 (5429) | 0.91 (0.88) | 100.39 |
| Borlänge | 0.66 (0.69) | 4.98 (14.49) | 6.30 (20.40) | 160 (5524) | 0.93 (0.89) | 106.29 |
| Karlstad | 2.14 (1.85) | 5.55 (14.71) | 6.87 (21.02) | 214 (6875) | 0.89 (0.88) | 112.31 |
| Stockholm | 6.79 (6.66) | 7.81 (16.04) | 9.41 (22.94) | 206 (6873) | 0.90 (0.86) | 109.35 |
| Norrköping | 1.06 (0.93) | 5.42 (15.39) | 7.10 (22.36) | 206 (6836) | 0.90 (0.87) | 110.77 |
| Göteborg | 11.45 (11.61) | 11.63 (18.74) | 13.98 (26.92) | 216 (7420) | 0.87 (0.84) | 107.82 |
| Visby | 1.72 (1.55) | 5.80 (15.62) | 7.63 (23.72) | 212 (7020) | 0.86 (0.85) | 121.09 |
| Växjö | 4.45 (3.93) | 6.54 (15.82) | 8.11 (22.49) | 227 (7297) | 0.92 (0.87) | 107.08 |
| Lund | 2.53 (2.29) | 6.36 (17.21) | 7.98 (24.80) | 222 (7579) | 0.89 (0.83) | 112.69 |
| FMI Sites | | | | | | |
| Utsjoki | 7.41 (6.21) | 8.39 (15.71) | 10.04 (20.78) | 109 (3709) | 0.89 (0.89) | 81.33 |
| Sodankylä | 1.00 (−0.09) | 4.43 (12.52) | 5.87 (16.91) | 145 (4477) | 0.92 (0.92) | 88.94 |
| Sotkamo | 0.08 (−0.48) | 4.69 (13.34) | 6.26 (18.24) | 78 (2747) | 0.92 (0.91) | 97.54 |
| Jyväskylä | 2.51 (2.09) | 6.60 (14.20) | 8.04 (19.89) | 182 (5657) | 0.87 (0.89) | 98.98 |
| Jokioinen | −0.07 (0.21) | 6.56 (15.17) | 8.74 (21.22) | 195 (6049) | 0.85 (0.88) | 104.79 |
| Helsinki-Vantaa | −0.67 (−0.52) | 5.91 (15.25) | 8.00 (21.57) | 199 (6167) | 0.87 (0.88) | 108.50 |
| Helsinki-Kumpula | 3.42 (3.52) | 4.74 (11.30) | 5.39 (14.80) | 35 (1207) | 0.96 (0.95) | 113.50 |
| Utö | 3.32 (3.24) | 4.91 (12.20) | 6.03 (16.66) | 97 (3244) | 0.93 (0.92) | 120.48 |
| Overall | 2.79 (2.65) | 6.04 (14.88) | 7.52 (20.90) | | 0.90 (0.88) | |
The results from the validation of the daily means of CLARA-A1-SIS show similar MBD, but considerably larger MABD and RMSD relative to the monthly mean results: 14.9 W/m
2 (MABD) and 20.9 W/m
2 (RMSD) for the daily means compared to 6.0 W/m
2 (MABD) and 7.5 W/m
2 (RMSD) for the monthly means. This is expected given that under- and overestimated retrievals balance each other in the calculation of MBD (Equation (1)). All daily mean validation metrics are somewhat better than those in the CLARA-A1-SIS global validation study within the scope of the dataset release [
5]. The metrics are based on over 1,000,000 compared daily mean samples and are thus considered well representative of the Nordic region.
From the solar energy production viewpoint, it is useful to examine the SSR retrieval accuracy in terms of the daily and monthly sums of solar energy in kilowatt hours per square meter. For brevity, we will only report the overall mean MBD, MABD and RMSD for all stations considered; the respective values are 1.99 (0.07) kWh/m2 for MBD, 4.69 (0.36) kWh/m2 for MABD, and 5.97 (0.50) kWh/m2 for RMSD, with the daily mean metrics in parentheses. The lower mean retrieval uncertainties for the daily energy sums may appear counterintuitive but are actually expected as the energy sum for any given day is always much smaller than that of the full month it belongs to, thus its average retrieval error is consequently much lower.
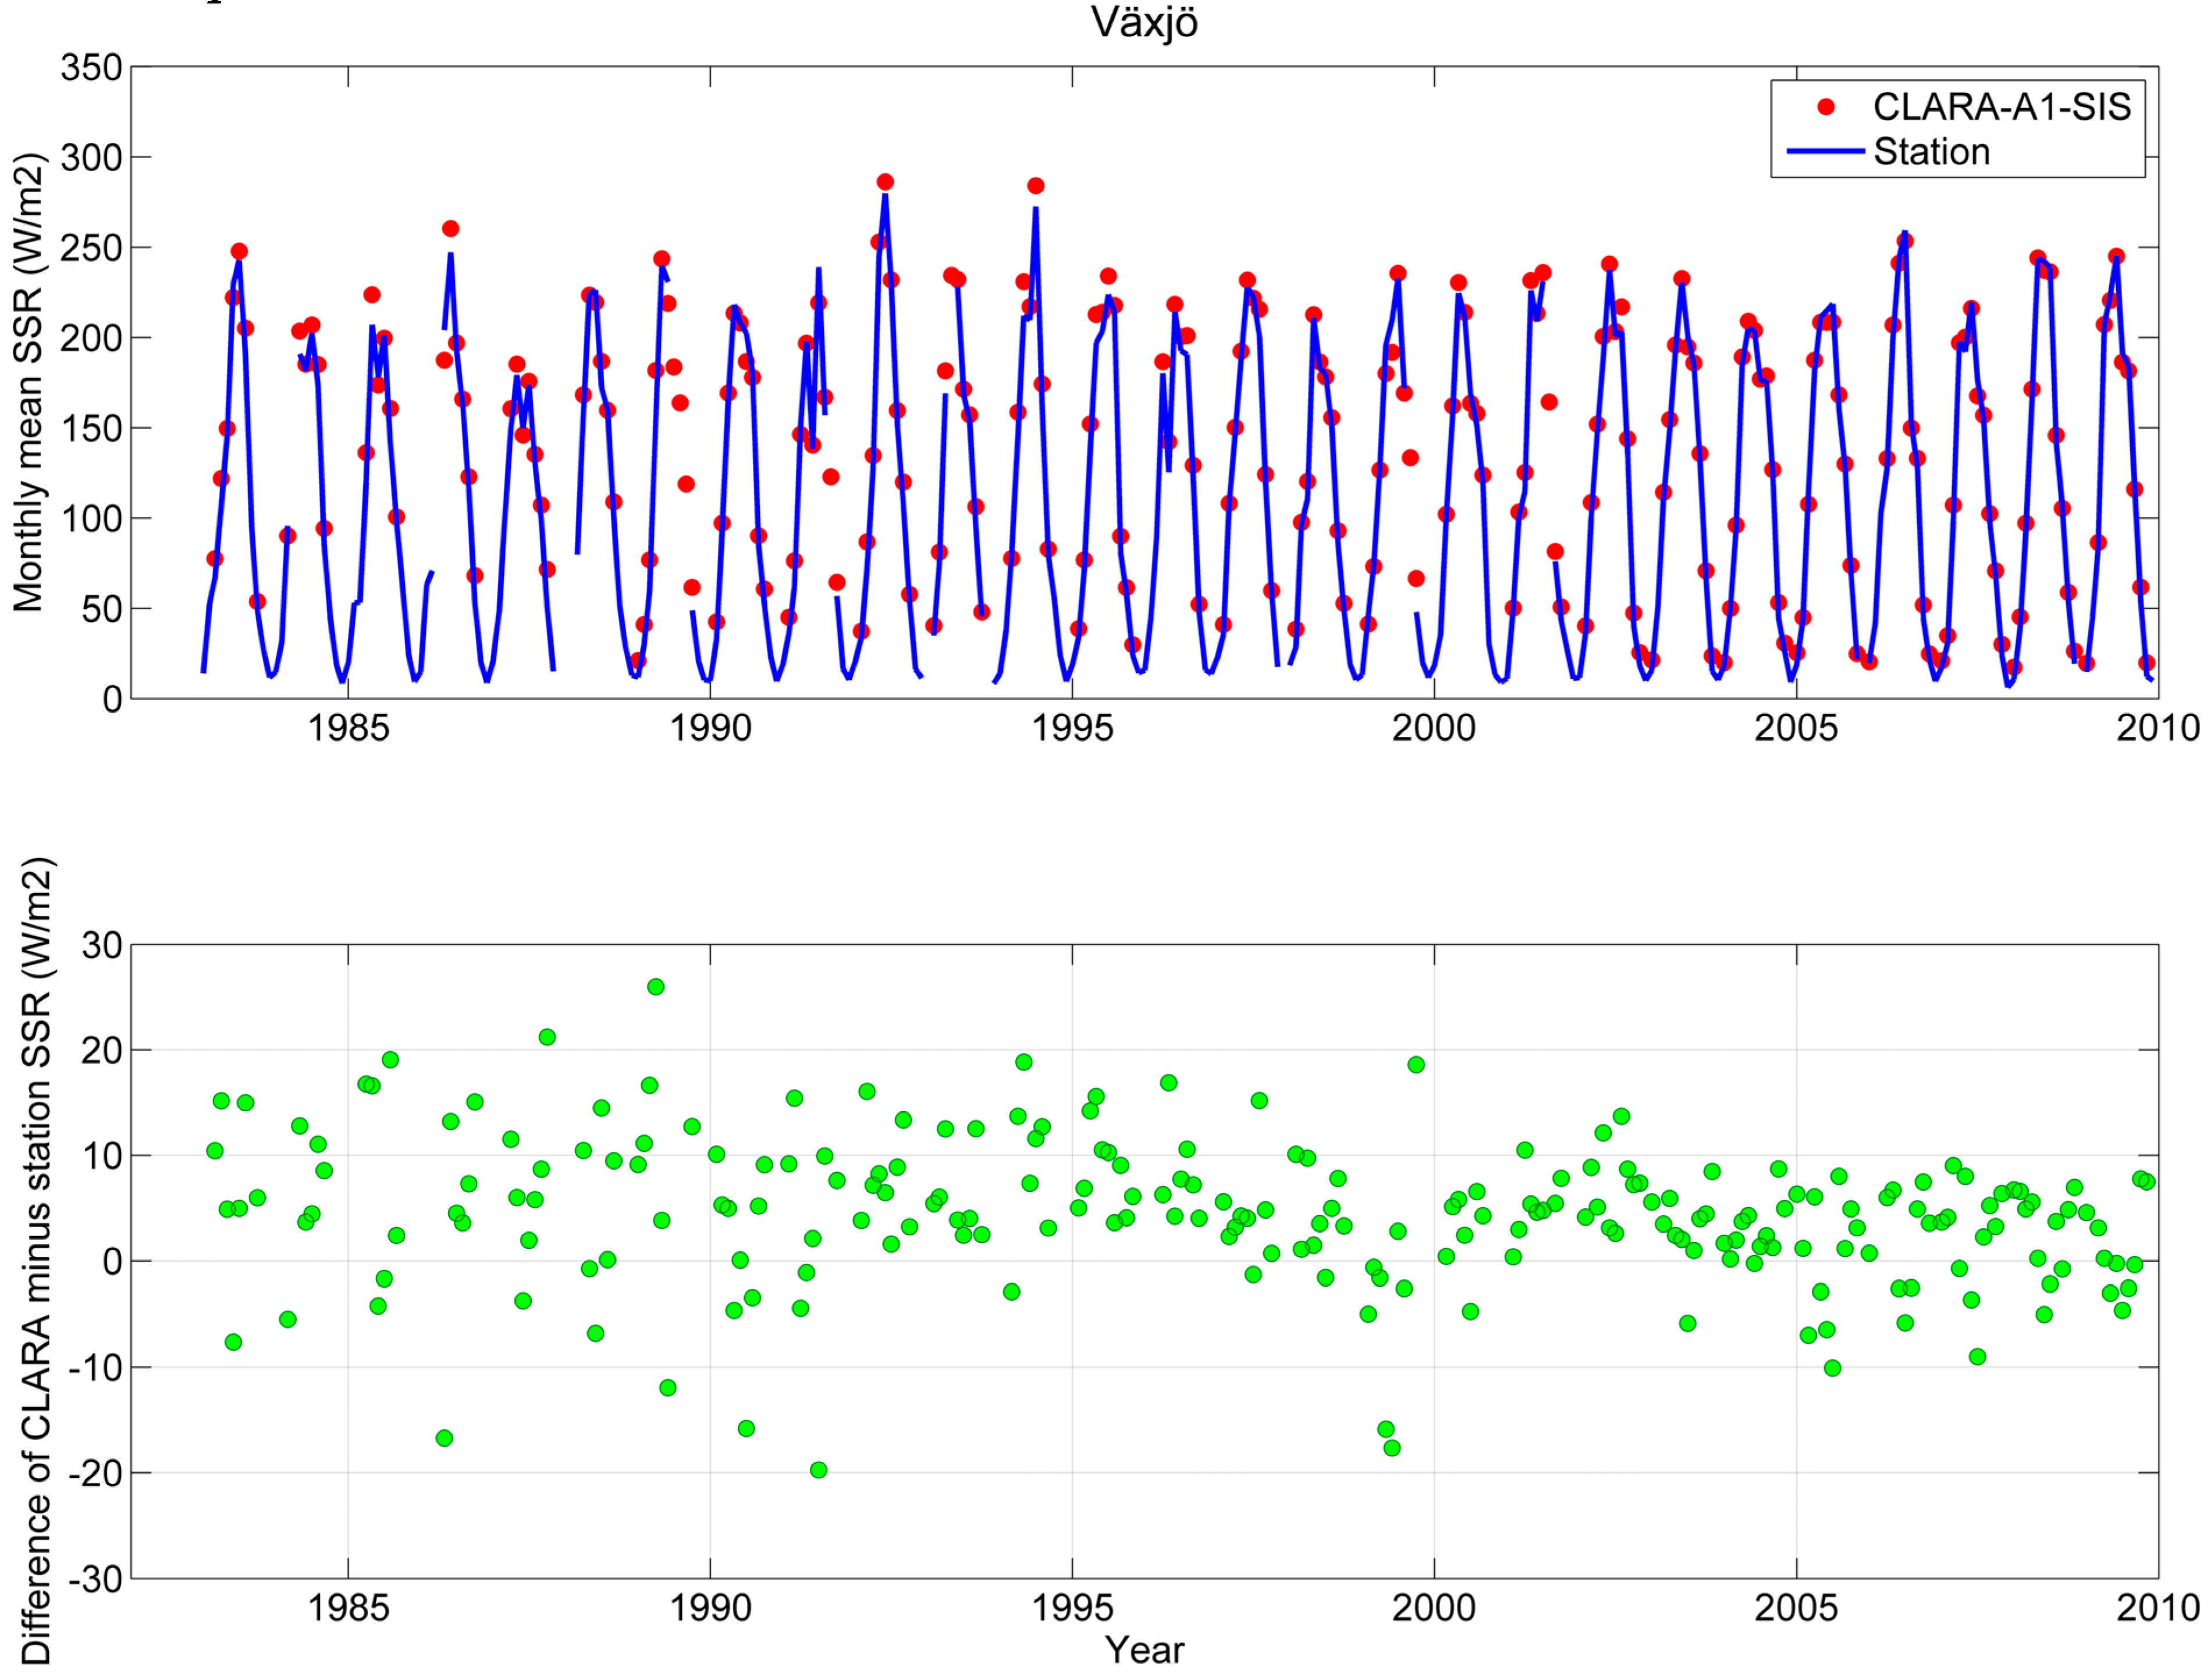
The validation results are visualized in
Figure 4 for the station of Växjö in the central part of southern Sweden, which has one of the largest number of comparable valid monthly mean retrieval pairs in this study. The results from Växjö are representative of the overall results from all 20 sites with some exceptions that are discussed later. In general, CLARA-A1-SIS tracks the seasonal cycle of SSR very well, with similar retrieval metrics for all seasons (see
Table 3). Although the basic validation metrics, expressed in W/m
2 appear best for the winter and autumn seasons (December–February and September–November), this simply reflects the low insolation. The mean absolute percentage error (MAPE) for the monthly mean SSR of the JJA period is actually considerably lower than that of the DJF or SON period.
Figure 4.
Comparison of retrieved monthly mean SSR by CLARA-A1-SIS against station observations at Växjö, Sweden. (Upper panel) station observations (blue line) versus CLARA-A1-SIS retrievals (red circle). All valid retrievals for either source shown. (Lower panel) Difference in the obtained monthly mean SSR.
Table 3.
Compiled seasonal validation metrics for CLARA-A1-SIS (monthly means) from all 20 sites. Mean monthly SSR is from in situ observations with valid matching CLARA retrievals, excludes snow periods.
Table 3.
Compiled seasonal validation metrics for CLARA-A1-SIS (monthly means) from all 20 sites. Mean monthly SSR is from in situ observations with valid matching CLARA retrievals, excludes snow periods.
| Season\Metric | MBD [W/m2] | MABD [W/m2] | RMSD [W/m2] | MAPE [%] | N [Valid Months | Mean Monthly SSR [W/m2] |
|---|
| DJF | 3.10 | 4.32 | 5.40 | 15.1 | 243 | 33.55 |
| MAM | 3.22 | 7.64 | 10.07 | 4.3 | 723 | 189.26 |
| JJA | 1.85 | 7.16 | 9.57 | 3.7 | 1470 | 199.31 |
| SON | 4.33 | 5.34 | 6.65 | 11.1 | 867 | 70.89 |
An interesting feature that is apparent in
Figure 4 is that the scatter in the month-to-month SSR retrieval error decreases towards the end of the CLARA-A1 dataset. This is likely related to the increase in the number of operational AVHRR satellites (see
Figure 1) at any given time and the subsequent increase in available observations per day. Because of the polar orbit of the AVHRR satellites, this increase in available observations is notable in the high latitudes, including Finland and Sweden. Indeed, a similar decrease in the scatter of the retrieval bias may be observed at most sites in our study. This finding is consistent with previous results on the effects of variable temporal sampling on daily UV dose retrieval from satellite data [
39].
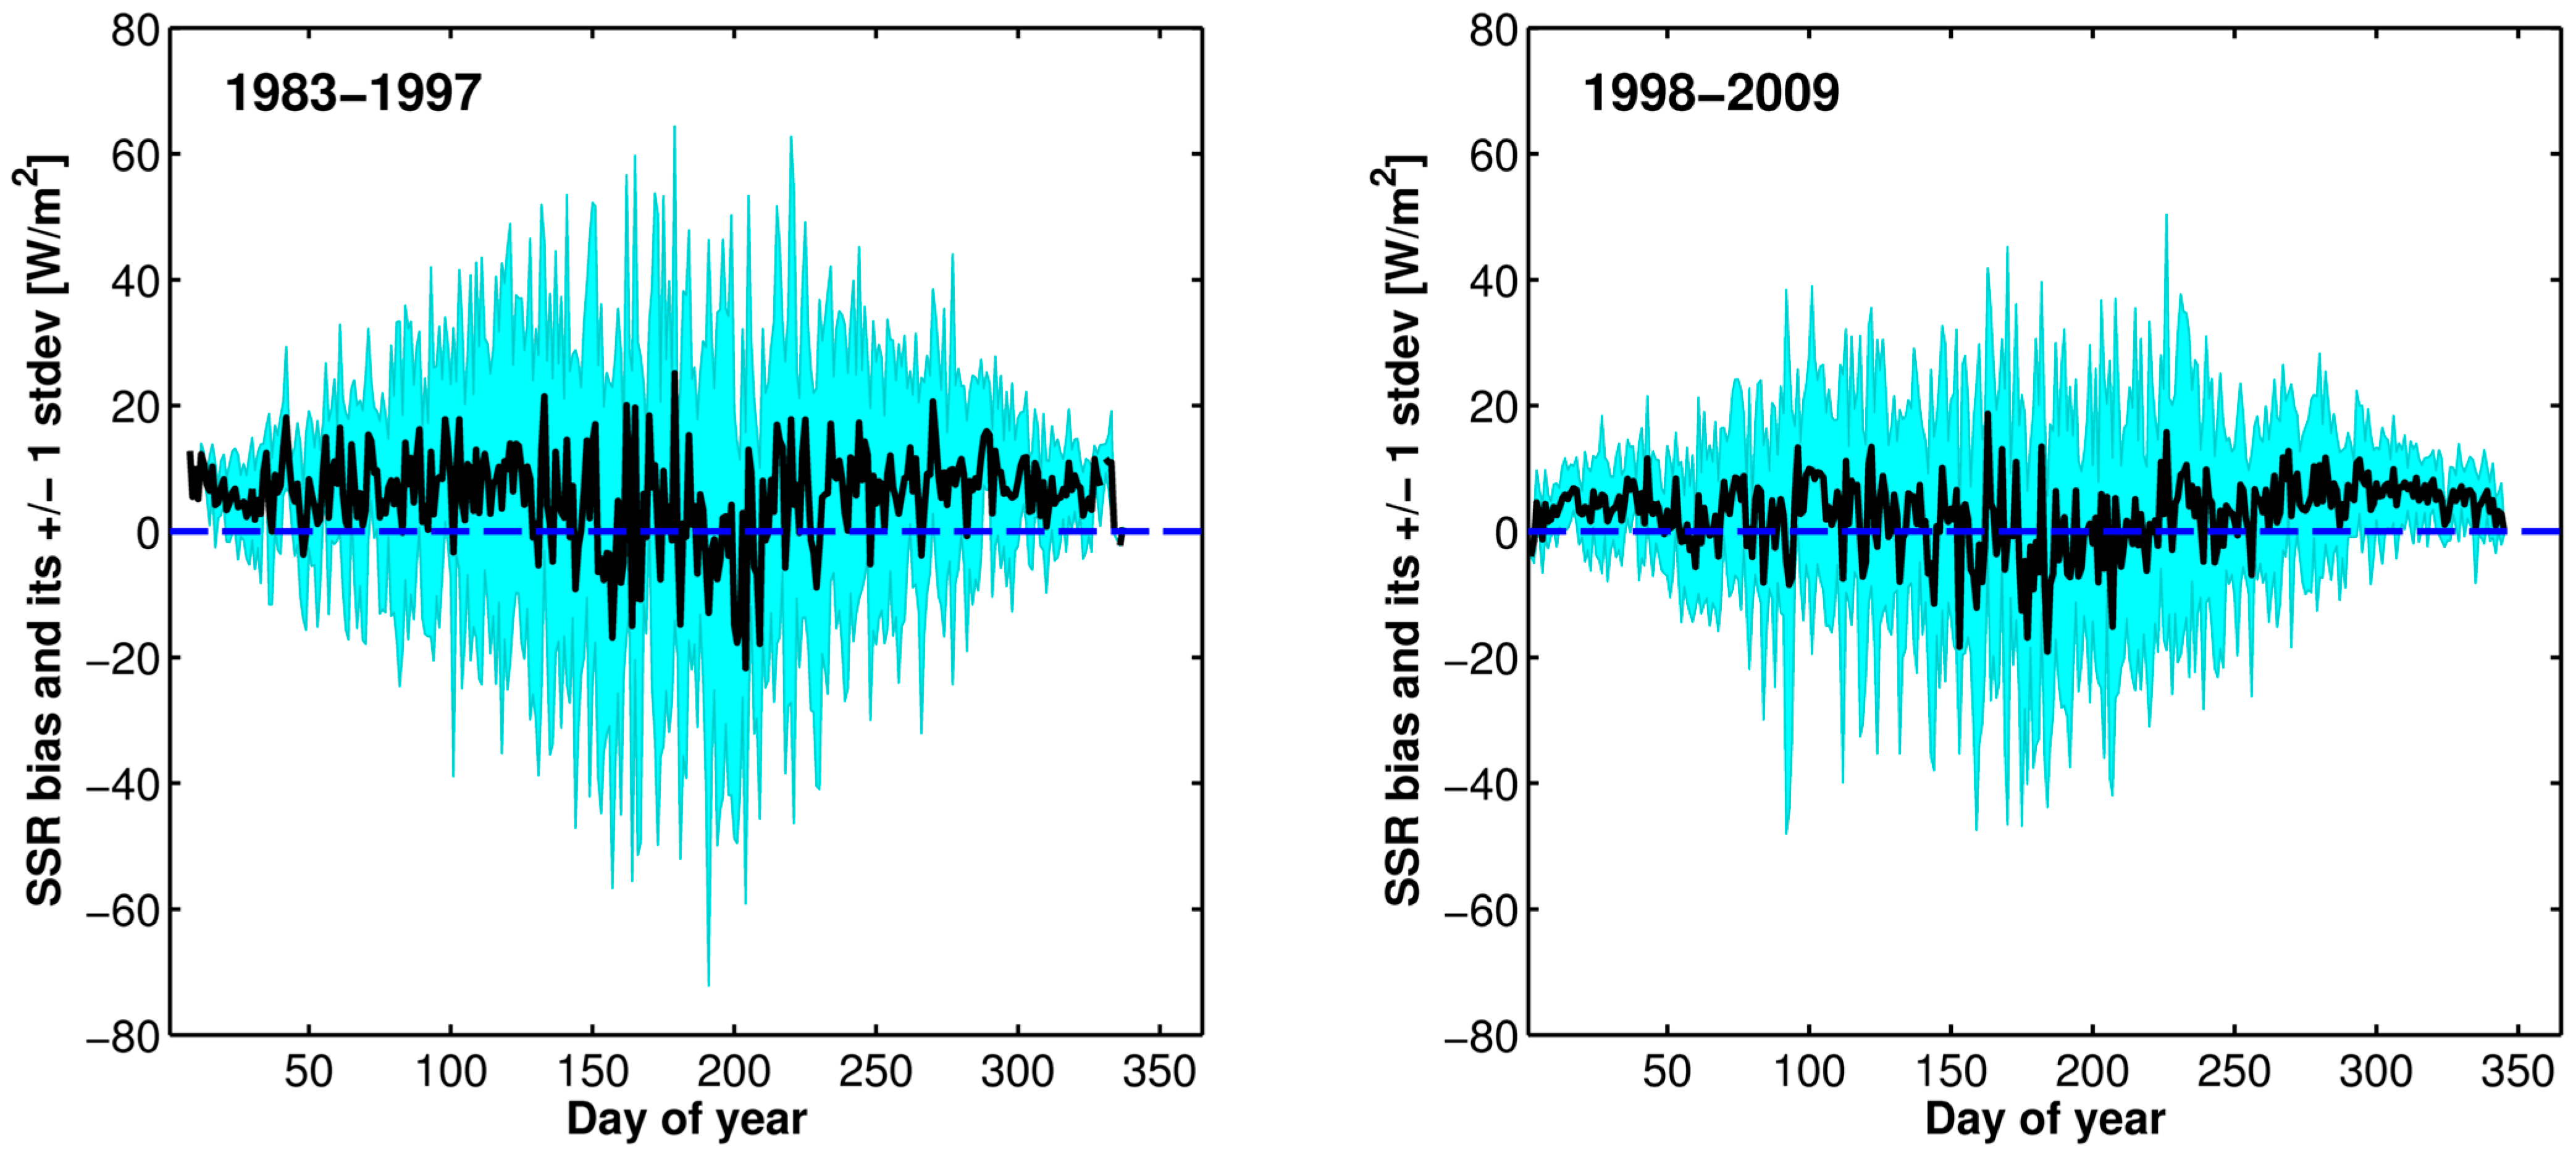
Figure 5.
The annual cycle of the multiyear-averaged daily mean SSR bias (black) and its ±1 standard deviation (cyan) over Växjö station for 1983–1997 (Left) and 1998–2009 (Right).
Figure 5.
The annual cycle of the multiyear-averaged daily mean SSR bias (black) and its ±1 standard deviation (cyan) over Växjö station for 1983–1997 (Left) and 1998–2009 (Right).
This improvement in retrieval quality may be visualized better by examining the multiyear-averaged daily mean SSR retrieval bias and its standard deviation.
Figure 5 shows the daily SSR biases and their standard deviations over Växjö station, averaged over the (subjectively chosen) early and late parts of CLARA-A1 coverage. While the SSR bias itself improves only marginally in the latter half with increasing satellite coverage, the decrease in the standard deviation of the daily mean retrievals is evident. It is also apparent that CLARA-A1-SIS has a tendency to overestimate SSR during the early and late part of the year, whereas the summer retrievals are more evenly distributed around the zero-bias line.
The results shown are representative for most validation sites, although there are cases (Kiruna, Borlänge, Sodankylä, and Utsjoki) where there was little apparent improvement in quality between the earlier and latter half of CLARA-A1 coverage. Most of these cases are high-latitude inland sites, for which the number of satellite overpasses per day is relatively high even for the early years of CLARA coverage with fewer satellites. Thus the retrieval accuracy for these sites conceivably improves less with the inclusion of more satellites in the later years of the time series. It is also likely that local cloudiness characteristics play a role; over areas with persistent similarity in cloud cover (or lack thereof), fewer overpasses per day are required for reliable SSR retrievals.
4. Validation Results for SARAH
The validation results for the monthly and daily mean SARAH data are shown in
Table 4. Based on the results, the retrieval accuracy of SARAH is comparable to CLARA-A1-SIS despite the less than optimal viewing conditions of geostationary imagers over Finland and Sweden. SARAH shows a consistent tendency to slightly underestimate SSR (MBD of −4.68 W/m
2 for the monthly means) over the northern latitudes, in contrast to CLARA-A1-SIS. However, the larger amount of imaging data per day also translates into a smaller RMSD of 17.01 W/m
2 in the daily means (versus 20.90 W/m
2 for CLARA). Overall, the results are remarkably similar for both CLARA-A1-SIS and SARAH, both achieving <10 W/m
2 multi-site mean MABD for the monthly means. The metrics for the monthly means indicate slightly better yet generally comparable SSR retrieval quality to the Meteosat MVIRI dataset [
6] as evaluated by Sanchez-Lorenzo
et al. [
10].
Table 4.
SARAH validation results for 1983–2013. Numbers in parentheses are the results for the daily mean product. Mean monthly SSR is the 1983–2013 average SSR from valid in situ observations.
Table 4.
SARAH validation results for 1983–2013. Numbers in parentheses are the results for the daily mean product. Mean monthly SSR is the 1983–2013 average SSR from valid in situ observations.
| SMHI Sites | MBD [W/m2] | MABD [W/m2] | RMSD [W/m2] | N [Valid Months (Days)] | r2 for Correlation of Anomalies | Mean Monthly SSR [W/m2] |
|---|
| Umeå | −5.78 (−5.97) | 7.72 (13.18) | 10.80 (19.23) | 337 (10371) | 0.85 (0.90) | 102.13 |
| Östersund | −10.09 (−10.29) | 10.51 (14.46) | 13.53 (20.89) | 341 (10409) | 0.84 (0.89) | 101.18 |
| Borlänge | −5.67 (−5.67) | 6.44 (11.79) | 8.44 (17.29) | 290 (9112) | 0.90 (0.92) | 108.16 |
| Karlstad | −3.44 (−3.52) | 4.93 (10.25) | 7.00 (15.44) | 344 (10626) | 0.90 (0.93) | 113.81 |
| Stockholm | −1.82 (−1.82) | 4.02 (9.86) | 5.42 (14.96) | 336 (10604) | 0.91 (0.92) | 110.79 |
| Norrköping | −3.86 (−3.14) | 5.02 (11.34) | 6.81 (18.78) | 339 (10676) | 0.91 (0.89) | 112.17 |
| Göteborg | −1.09 (−0.64) | 3.93 (10.27) | 5.16 (15.51) | 322 (10674) | 0.92 (0.92) | 109.48 |
| Visby | −4.70 (−4.00) | 5.79 (12.23) | 7.71 (20.51) | 344 (10758) | 0.89 (0.86) | 122.77 |
| Växjö | −3.31 (−3.35) | 4.94 (9.86) | 6.60 (14.52) | 353 (10872) | 0.92 (0.94) | 108.41 |
| Lund | 0.82 (1.03) | 4.95 (11.54) | 7.13 (17.75) | 334 (11023) | 0.90 (0.90) | 113.96 |
| FMI sites | | | | | | |
| Jyväskylä | −6.62 (−6.78) | 7.60 (11.79) | 10.16 (17.02) | 348 (10422) | 0.85 (0.92) | 99.55 |
| Jokioinen | −6.34 (−6.50) | 7.07 (11.91) | 9.92 (17.26) | 358 (10525) | 0.84 (0.91) | 104.77 |
| Helsinki-Vantaa | −4.66 (−4.91) | 5.93 (11.11) | 8.04 (15.85) | 362 (10570) | 0.87 (0.92) | 109.53 |
| Helsinki-Kumpula | −5.52 (−6.65) | 6.37 (11.92) | 7.95 (16.02) | 89 (2560) | 0.90 (0.94) | 117.30 |
| Utö | −8.09 (−8.57) | 8.24 (10.28) | 10.12 (14.14) | 173 (5216) | 0.92 (0.96) | 121.48 |
| Overall | −
4.68 (−4.72) | 6.23 (11.45) | 8.32 (17.01) | | 0.89 (0.92) | |
While we do find a tendency in SARAH to underestimate the surface solar radiation over Finland and Sweden, in general, SARAH tends to slightly overestimate the surface radiation by about 1.3 W/m
2 [
9]. In contrast to SARAH the MVIRI-based CM SAF surface radiation data set tends to also overestimate the surface radiation for some of the Scandinavian surface stations used in this study [
10]. The cause of this change in the sign of the bias for Scandinavia is not yet clear; aerosol effects seem rather unlikely as an explanation; the modified determination of the clear-sky reflectivity could have such an impact.
The correlation of anomalies between the SARAH and the CLARA results are very similar. The sites showing the largest retrieval biases are different in the datasets; for CLARA, Göteborg showed largest retrieval errors, whereas for SARAH the largest bias sites are Östersund and Umeå. Noting that these sites are also the northernmost in this study where SARAH has coverage, we examined the retrieval bias (MABD) as a function of site latitude.
Figure 6 shows the results. The apparent increase in mean retrieval bias with increasing site latitude is expected, given that the SARAH SSR retrieval algorithm has to deal with very long atmospheric path lengths and decreasing spatial resolution at the edges of the geostationary imaging area.
Figure 6.
Site mean Mean Absolute Bias Difference (MABD) as a function of site latitude for SARAH.
Figure 6.
Site mean Mean Absolute Bias Difference (MABD) as a function of site latitude for SARAH.
The fact that Göteborg is a high bias site for CLARA but not for SARAH implies that the dataset spatial resolution likely has an effect on the results. SARAH, having substantially higher spatial resolution and a higher sampling rate, is expected to provide a more consistent retrieval than CLARA. Although in terms of MBD the CLARA dataset is actually better, the lower daily mean MABD and RMSD for SARAH indicate that there is markedly less scatter in its daily mean retrievals.
Examination of the seasonally divided retrieval quality metrics of SARAH (
Table 5) shows that the winter period with low Sun elevation across the Nordic countries is problematic, the average MAPE being over 25%. On the other hand, the summer retrievals (MAM and JJA) are of good and comparable quality with CLARA-A1 retrievals.
Table 5.
Compiled seasonal validation metrics for SARAH monthly means (1983–2013) from the valid 15 sites. Mean monthly SSR is from in situ observations with valid matching SARAH retrievals, including snow periods.
Table 5.
Compiled seasonal validation metrics for SARAH monthly means (1983–2013) from the valid 15 sites. Mean monthly SSR is from in situ observations with valid matching SARAH retrievals, including snow periods.
| Season\Metric | MBD [W/m2] | MABD [W/m2] | RMSD [W/m2] | MAPE [%] | N [Valid Months] | Mean Monthly SSR [W/m2] |
|---|
| DJF | −4.33 | 4.86 | 6.35 | 28.3 | 1092 | 20.66 |
| MAM | −6.65 | 8.93 | 12.08 | 5.1 | 804 | 184.78 |
| JJA | −3.61 | 6.42 | 8.14 | 3.1 | 1201 | 206.28 |
| SON | −2.04 | 3.34 | 4.15 | 9.1 | 1164 | 56.81 |
5. Assessment of SSR trends
An assessment of SSR trends in the datasets
versus in situ observations is a useful complementary means of assessing dataset quality. For comparability, we have followed the methods of Sanchez-Lorenzo
et al. [
10]. We compared the monthly mean anomalies of CLARA-A1, SARAH and
in situ records, averaging all assessed sites per month.
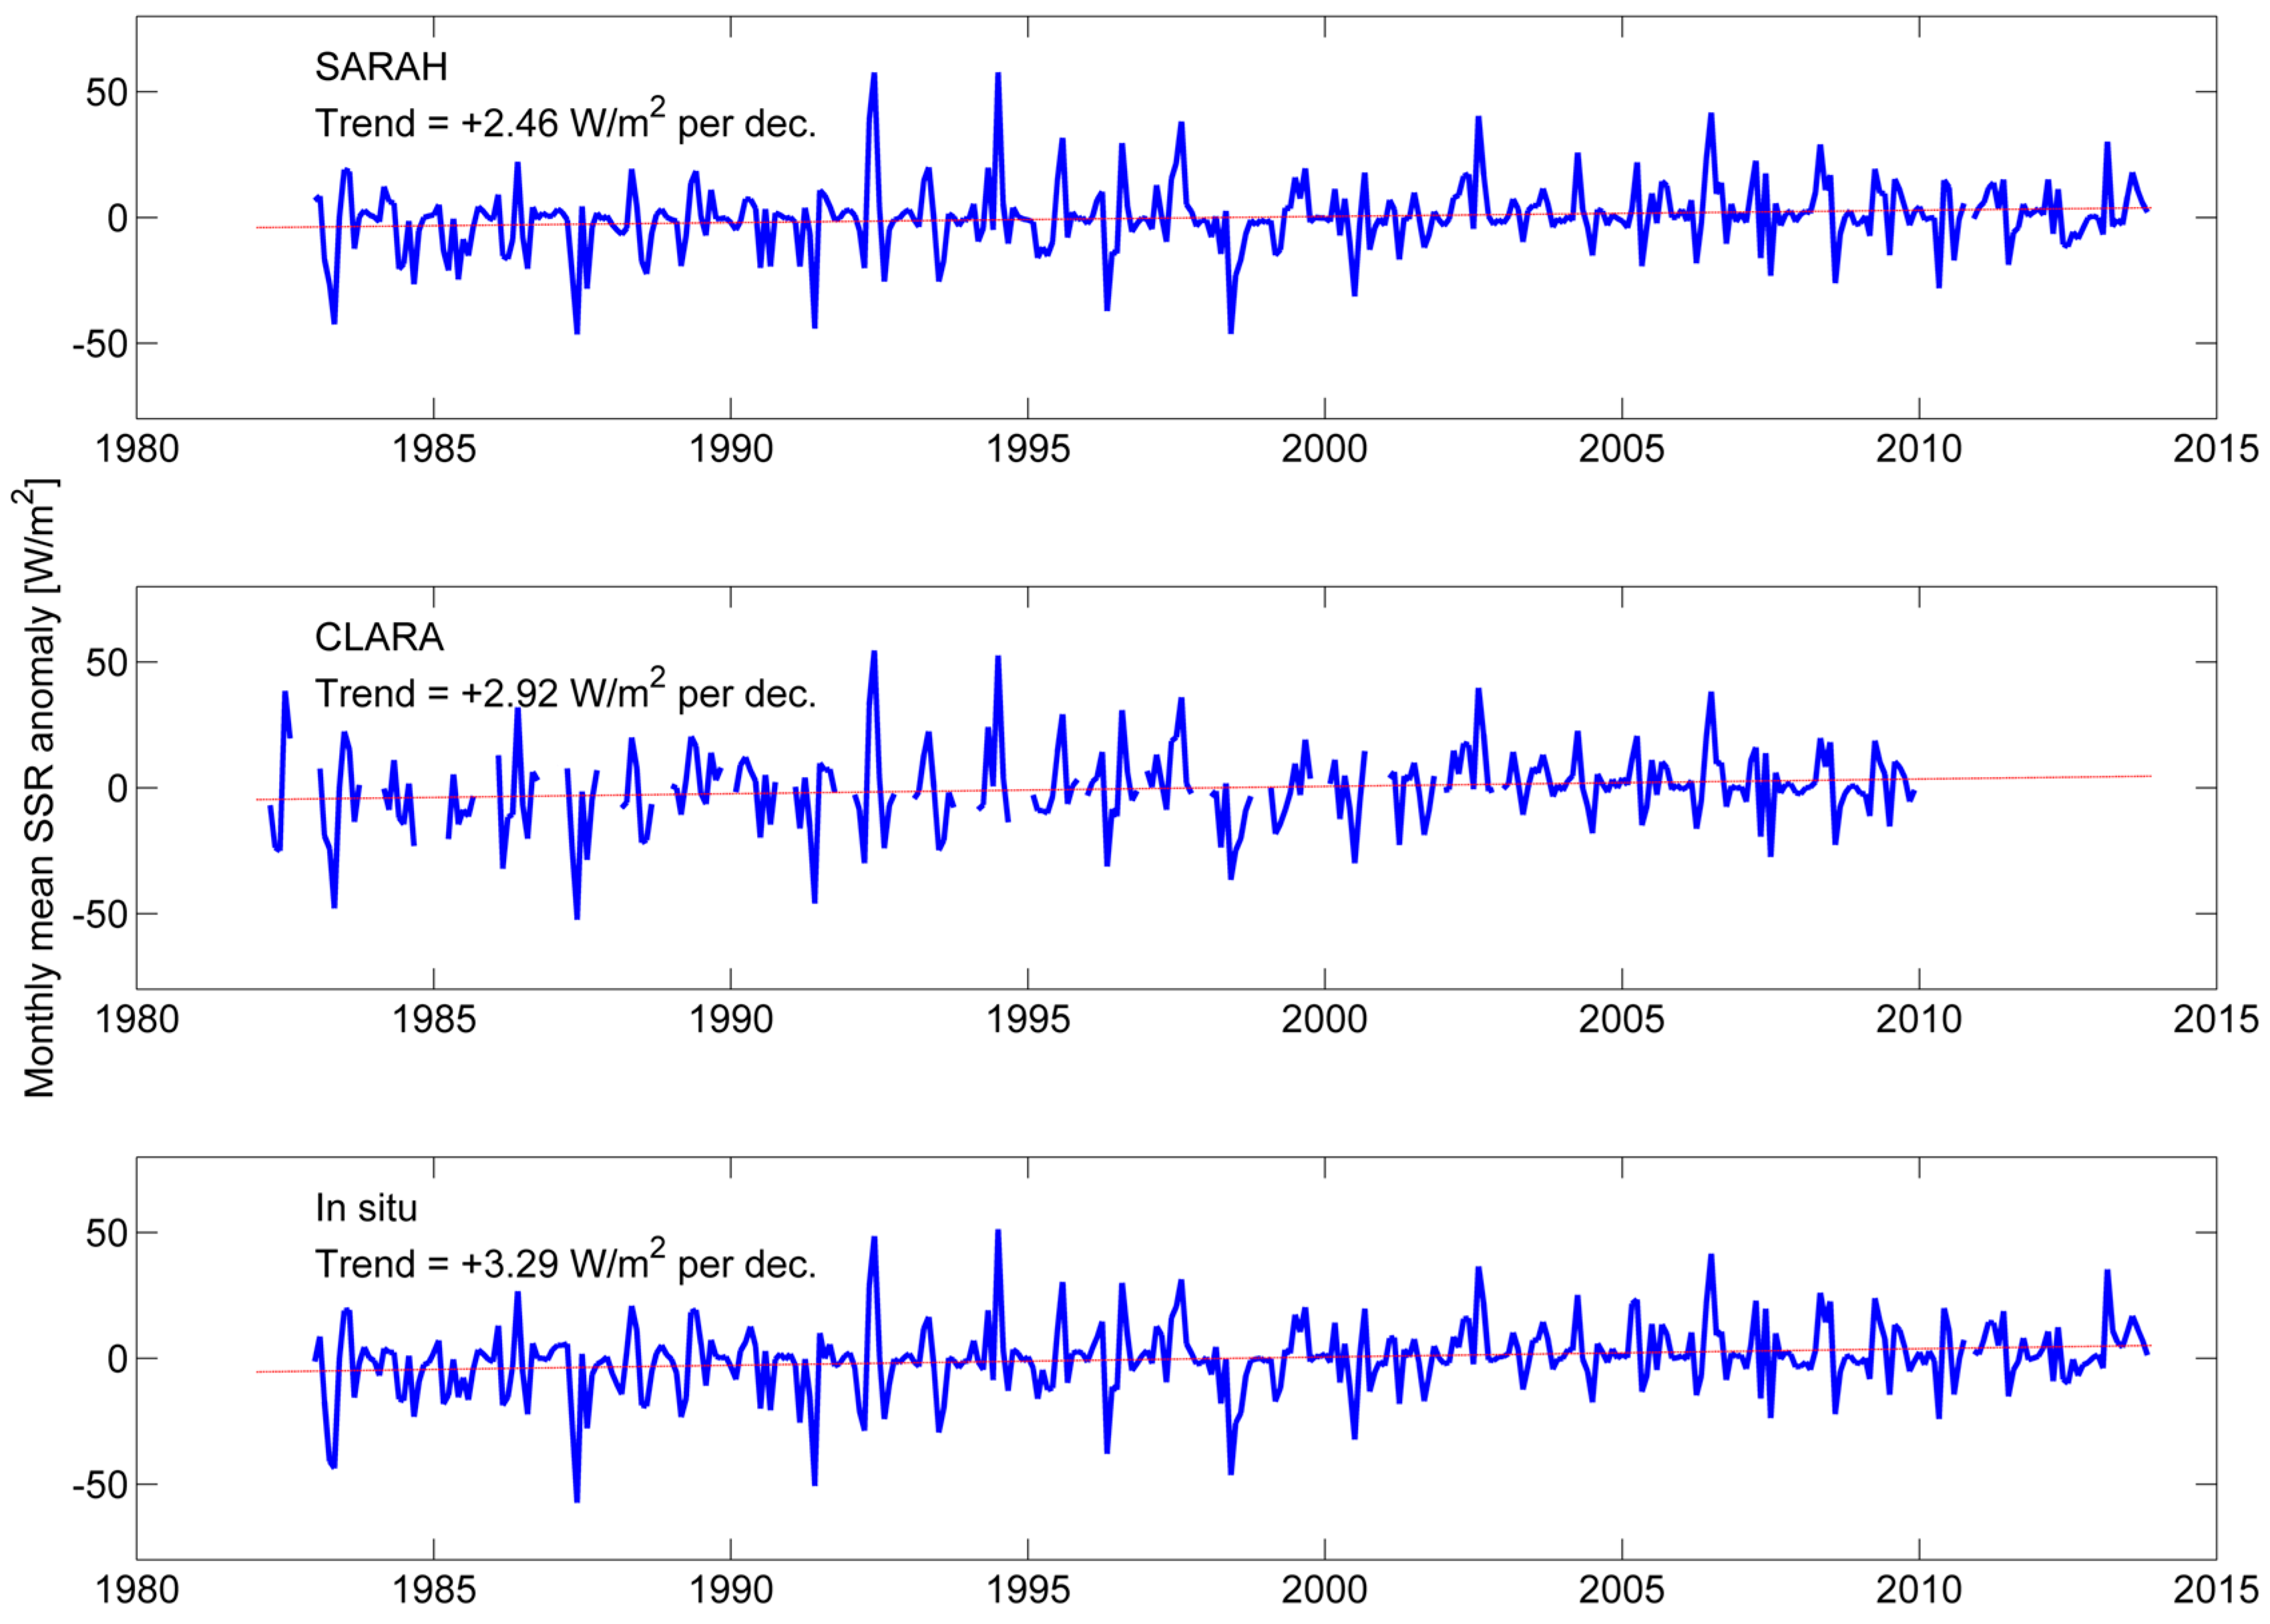
Figure 7 shows the obtained anomaly time series and their linear trends. All trends were found to be statistically significant at the 95% confidence level according to the Mann-Kendall nonparametric test (e.g., [
40]).
In
Figure 7, the trend of the
in situ observations (calculated over the SARAH coverage period, from observations with valid SARAH counterparts) is +3.29 W/m
2/decade, which agrees well with the trend of SSR anomalies seen in the Europe-wide GEBA
in situ dataset (+3.56 W/m
2/decade) [
10]. These values are also consistent with the trends of 2.5%–4.4%/decade for individual stations in Finland and Sweden (Sodankylä, Jokioinen, Norrköping) found by Lindfors
et al. [
41]. The observed trend also agrees well with the reported “global brightening” phenomenon—increasing SSR from the 1980s to 2000s over most regions of the world [
42]. We further note that because the
in situ SSR measurement sites in Finland and Sweden are usually located in rural areas, the effect of local air pollution variations in the prevailing aerosol conditions on the observed trend is expected to be small.
Both satellite-based SSR trends are quite similar, with the polar orbiter-based CLARA showing a trend of +2.92 W/m
2/decade
versus the geostationary satellite-based SARAH at +2.46 W/m
2/decade. If the CLARA period of 1982–2009 is considered, then the SARAH trend is +3.11 W/m
2/decade (noting that its coverage begins in 1983), with the corresponding
in situ trend being +3.73 W/m
2/decade. Both satellite datasets thus underestimate the
in situ trend, although the underestimation is not as significant as in the MVIRI dataset [
10]. However, it should be kept in mind that the SARAH dataset adds nearly a full decade of data from the 2000s where positive SSR anomalies are very common also in the reference data, thus the presence of a stronger SSR trend in SARAH relative to the MVIRI dataset is expected.
The trends in other satellite-based SSR datasets at continental or global scales have been examined in several studies [
43,
44,
45], sometimes with conflicting results. Hinkelman
et al. [
45] indicated a renewed dimming over Europe between 1999–2004, in contrast with analyses of surface measurements [
42] and satellite-based SSR datasets [
10,
46]). Our results (
Figure 7) clearly indicate that Northern Europe has followed the continuous brightening trend reported for the whole Europe since the 1980s. The trends seen in SARAH and CLARA-A1 for this region are also stronger than the global SSR trends reported by Pinker
et al. [
43] at +1.6 W/m
2 between 1983–2001, or +2.4 W/m
2 for 1984–2000 reported by Hatzianastassiou
et al. [
44], and in fairly good agreement with
in situ data-based trends in Europe [
10,
42], as discussed previously.
Figure 7.
Trends of the monthly mean SSR anomalies of the employed datasets. Anomalies calculated only for months where both satellite estimate and in situ observation have valid values. All validation sites averaged together. All anomalies calculated per-month against that month’s mean SSR over the dataset coverage.
However, a more complete comparison of SSR trends from satellite datasets remains a topic for a more rigorous investigation. As discussed before, differences in the treatment of aerosol effects on SSR and applied aerosol climatologies may vary substantially between datasets, with potentially significant impacts on the retrieved SSR. On the other hand, even modest differences in the detection and treatment of cloudiness can also have a substantial impact on the retrieved SSR.
The particular case of causes behind (
in situ) SSR trends in Northern Europe has been investigated by Stjern
et al. [
47] and Parding
et al. [
48]. They found that cloudiness decrease appears to be the main driver for the 1990s–2000s brightening in Scandinavia, with likely additional contributions from decreasing aerosol concentrations. The relative contributions of cloud and aerosol effects may vary between Northern and Central Europe, although a strong cloudiness influence on SSR trends has also been found for the Iberian Peninsula [
49]. Attribution of the differences in SSR trends and their drivers is a goal for future research, and one where satellite-based datasets such as CLARA and SARAH can play substantial roles.
A final point of interest in the comparison of SARAH and CLARA-A1 is the difference in SSR over water bodies.
Figure 1 shows the overall mean SSR for June over Scandinavia and the Baltic Sea from both CLARA-A1 and SARAH. There is an obvious level difference in the SSR over the Baltic Sea. Investigation of the causes of the difference is challenging, as reference SSR data over the Baltic Sea is sparse. One of the FMI stations (Utö) is located on the southern edge of the Archipelago Sea and thus provides our best point of reference. According to the validation results from Utö, the SSR retrieved by CLARA-A1 is closer to the
in situ observations, with SARAH showing clear underestimations. This suggests that the strong land-sea SSR contrast in CLARA-A1 over the Baltic Sea could be a real phenomenon. More research on also this issue is recommended.
6. Conclusions
The validation results show that the retrieval accuracies of the CLARA-A1-SIS and SARAH datasets are very good, and closely comparable over Finland and Sweden. Both datasets are well capable of retrieving SSR with accuracy better than 10 W/m2 for the monthly means (roughly translating to a 5% error during summer). The tendency of SARAH to slightly underestimate the in situ SSR is balanced by lower RMSD overall relative to CLARA-A1. The seasonal cycle of SSR is reproduced, although with some limitations. SARAH provides coverage for the lower-latitude Nordic sites also during the snow-covered period, which CLARA-A1 does not (although the future successor dataset CLARA-A2 will also have this coverage). On the other hand, SARAH has no coverage over the northernmost regions and its error characteristics show an apparent dependence on site latitude. This dependence is expected as it results from the bias in effective cloud albedo (and thus in SSR) introduced by long atmospheric path lengths (and low Sun elevation) for the high-latitude retrievals at the geostationary Meteosat imagers’ viewable area edges.
The accuracy of the daily means is also comparable between CLARA and SARAH. While the mean bias of the daily and monthly means is very similar, the daily means display a lower precision (larger MABD and RMSD, i.e., more scatter) than monthly means for both datasets, highlighting the larger uncertainty in the retrieval of any single day’s mean SSR. Regardless, both datasets demonstrate an overall accuracy of 15 W/m2. It should be kept in mind that the markedly non-zero MBD in SARAH also affects its RMSD. If this effect is considered, we may say that SARAH daily mean retrievals are more precise (less scatter) than CLARA daily means.
A comparison of the trends in SSR anomalies between the two satellite-based datasets and the corresponding in situ measurements showed that all three sources indicate a positive overall trend in SSR over Finland and Sweden between 1980s and early 2010s. The satellite datasets underestimate the in situ trend strength, but less so than in earlier studies. However, for climate monitoring purposes, a more rigorous assessment of the overall stability of CLARA and SARAH datasets is recommended before adopting the results shown here.
From the solar energy production viewpoint, both CLARA and SARAH datasets demonstrate sufficient accuracy to serve as useful tools in the planning of production capacity, and their algorithms show applicability also for short-term solar forecasting applications. For the Nordic countries, the limited spatial coverage of SARAH and the lack of data from the snow-covered period in CLARA-A1 need to be kept in mind when considering their use.


