Article

FLCNDEMF: An Event Metamodel for Flood Process Information Management under the Sensor Web Environment

1
State Key Laboratory of Information Engineering in Surveying, Mapping and Remote Sensing, Wuhan University, Luoyu Road No. 129, Wuhan 430079, China
2
Collaborative Innovation Center of Geospatial Technology, Luoyu Road No. 129, Wuhan 430079, China
*
Author to whom correspondence should be addressed.
Remote Sens. 2015, 7(6), 7231-7256; https://0-doi-org.brum.beds.ac.uk/10.3390/rs70607231
Submission received: 17 March 2015 / Revised: 12 May 2015 / Accepted: 27 May 2015 / Published: 3 June 2015
(This article belongs to the Special Issue Remote Sensing in Flood Monitoring and Management)

Abstract

:
Significant economic losses, large affected populations, and serious environmental damage caused by recurrent natural disaster events (NDE) worldwide indicate insufficiency in emergency preparedness and response. The barrier of full life cycle data preparation and information support is one of the main reasons. This paper adopts the method of integrated environmental modeling, incorporates information from existing event protocols, languages, and models, analyzes observation demands from different event stages, and forms the abstract full life cycle natural disaster event metamodel (FLCNDEM) based on meta-object facility. Then task library and knowledge base for floods are built to instantiate FLCNDEM, forming the FLCNDEM for floods (FLCNDEMF). FLCNDEMF is formalized according to Event Pattern Markup Language, and a prototype system, Natural Disaster Event Manager, is developed to assist in the template-based modeling and management. The flood in Liangzi (LZ) Lake of Hubei, China on 16 July 2010 is adopted to illustrate how to apply FLCNDEM in real scenarios. FLCNDEM-based modeling is realized, and the candidate remote sensing (RS) dataset for different observing missions are provided for LZ Lake flood. Taking the mission of flood area extraction as an example, the appropriate RS data are selected via the model of simplified general perturbation version 4, and the flood area in different phases are calculated and displayed on the map. The phase-based modeling and visualization intuitively display the spatial-temporal distribution and the evolution process of the LZ Lake flood, and it is of great significance for flood responding. In addition, through the extension mechanism, FLCNDEM can also be applied in other environmental applications, providing important support for full life cycle information sharing and rapid responding.

Graphical Abstract

1. Introduction

In 2012, 357 reported natural disaster events (NDE) in 120 countries killed more than 9655 people, left 122.9 million victims and caused a record amount of US$157.3 billion in damages [1]. The enormous casualties and property losses that are caused by NDE indicate weakness in event management. In an information-based world, disasters are often abstracted as virtual event information representation models, and the management of these models could help in the management of physical events in occasions which decision-makers cannot arrive in the scenes [2]. Thus, the quality of the virtual models directly influence the efficiency of NDE management. Until now, many studies [3,4,5,6,7,8,9,10,11,12,13,14,15,16,17,18,19,20] have tried to propose different event information representation models or metamodels to describe, organize, and manage information effectively. This paper divides these models or metamodels into three types, including the existing information exchanging carriers, phase-based models, and non-phase-based models.
There are two types of disaster event information exchanging carriers: general and specific. General information exchanging carriers include Common Alert Protocol (CAP), Emergency Data Exchange Language-Distribution Element (EDXL-DE) and Emergency Data Exchange Language-Resource Messaging (EDXL-RM). CAP is a data interchange protocol that is used for all types of disaster alert and internet-based disaster message distributions [3]. EDXL-DE can be used as an envelope/container to support the dissemination of other EDXL components, such as CAP payloads or resource messages [4]. EDXL-RM aims to provide a comprehensive set of message formats for resource management across all areas of the emergency sector [5]. Specific information exchanging carriers are of many types, covering Tsunami Warning Markup Language [6], Cyclone Warning Markup Language [7], the earthquake markup language [8], etc. These protocols and languages define the elements needed for disaster event information exchanging, and the types, the organization and other properties of them, which can be referenced by other event models or metamodels as one of the attribute sources.
Phase-based models are mainly models with different elements for different phases of NDE. The disaster management metamodel put forward in [9], and the metamodel that was proposed in [10] are typical representatives of phase-based models. The former is about the detailed iterative building process of the metamodel, and the entities, missions, relationships between entities, and entities’ operations on the missions are all offered for different phases of disasters. The latter mainly focuses on disaster management based on the presented metamodel. In addition, Asghar et al. [11] proposed a comprehensive conceptual model for disaster management, and management actions in different disaster phases are provided. The World Wide Web Consortium (W3C) [12] reported phased emergency information interoperability frameworks in the W3C Incubator Group Report 6, and the primary entities (each with many properties) of the emergency management and the explicit inter-relationships between them are defined for the seamless and productive cooperation among different participants.
Non-phase-based models are the relative concept of phase-based models. They refer to the models the information of which are not organized according to the development stage of emergencies, or they can be single-mission models for specific activities in emergency management. Scherp et al. [13] presented the Event-Model-F (a formal model of events) based on the foundational ontology DOLCE + DnS Ultralite (DUL) and provides comprehensive support to represent time and space, objects and persons, and the mereological, causal, and correlative relationships between events. Kruchten et al. [14] put forward a conceptual model to be used as a common language to communicate, analyze and simulate the interdependencies of critical infrastructures (power, transport, communication, etc.), without having to disclose all of the critical and confidential data. Sanjay and McLean [15] presented a framework for systematically integrating modeling and simulation tools for emergency responses, and the information that is needed during an emergency is analyzed. Malizia et al. [16] proposed an ontology for communicating emergencies and critical information to different categories of users. Zhang et al. [17] put forward a knowledge management framework to support decision making in humanitarian assistance/disaster relief. HernaÂndez and Serrano [18] reported knowledge-based models for emergency management systems. All of these models are models that are not phase-based organized. There are many single-mission models. Cheng and HoKo [19] developed a decision support model and system DSS for the safe monitoring of hillsides. Slobodan and Sajjad [20] presented a computerized simulation model for capturing human behavior during flood emergency evacuation.
For general information exchanging carriers, CAP and EDXL-RM can only complete a certain mission in disaster management, and EDXL-DE can just act as a container and requires specific information to fill in. In terms of specific information exchanging carriers, these models all have explicit application areas, and it is difficult for them to be extended to other types of disasters. Regarding the phase-based models mentioned above, static concepts, relationships, and operations are defined in the models. However, for a specific disaster event, these models cannot provide observation information, and cannot help in the real-time information support. Models that are not phase-based-organized are not able to cover all the information demanded from different event stages. Single-mission models are aimed only for a certain task, and other missions in disaster event management are not considered. To cope with NDE efficiently, an information representation model for NDE which meets the following two requirements should be proposed:
(1)
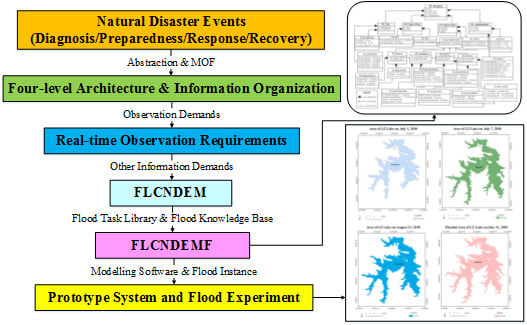
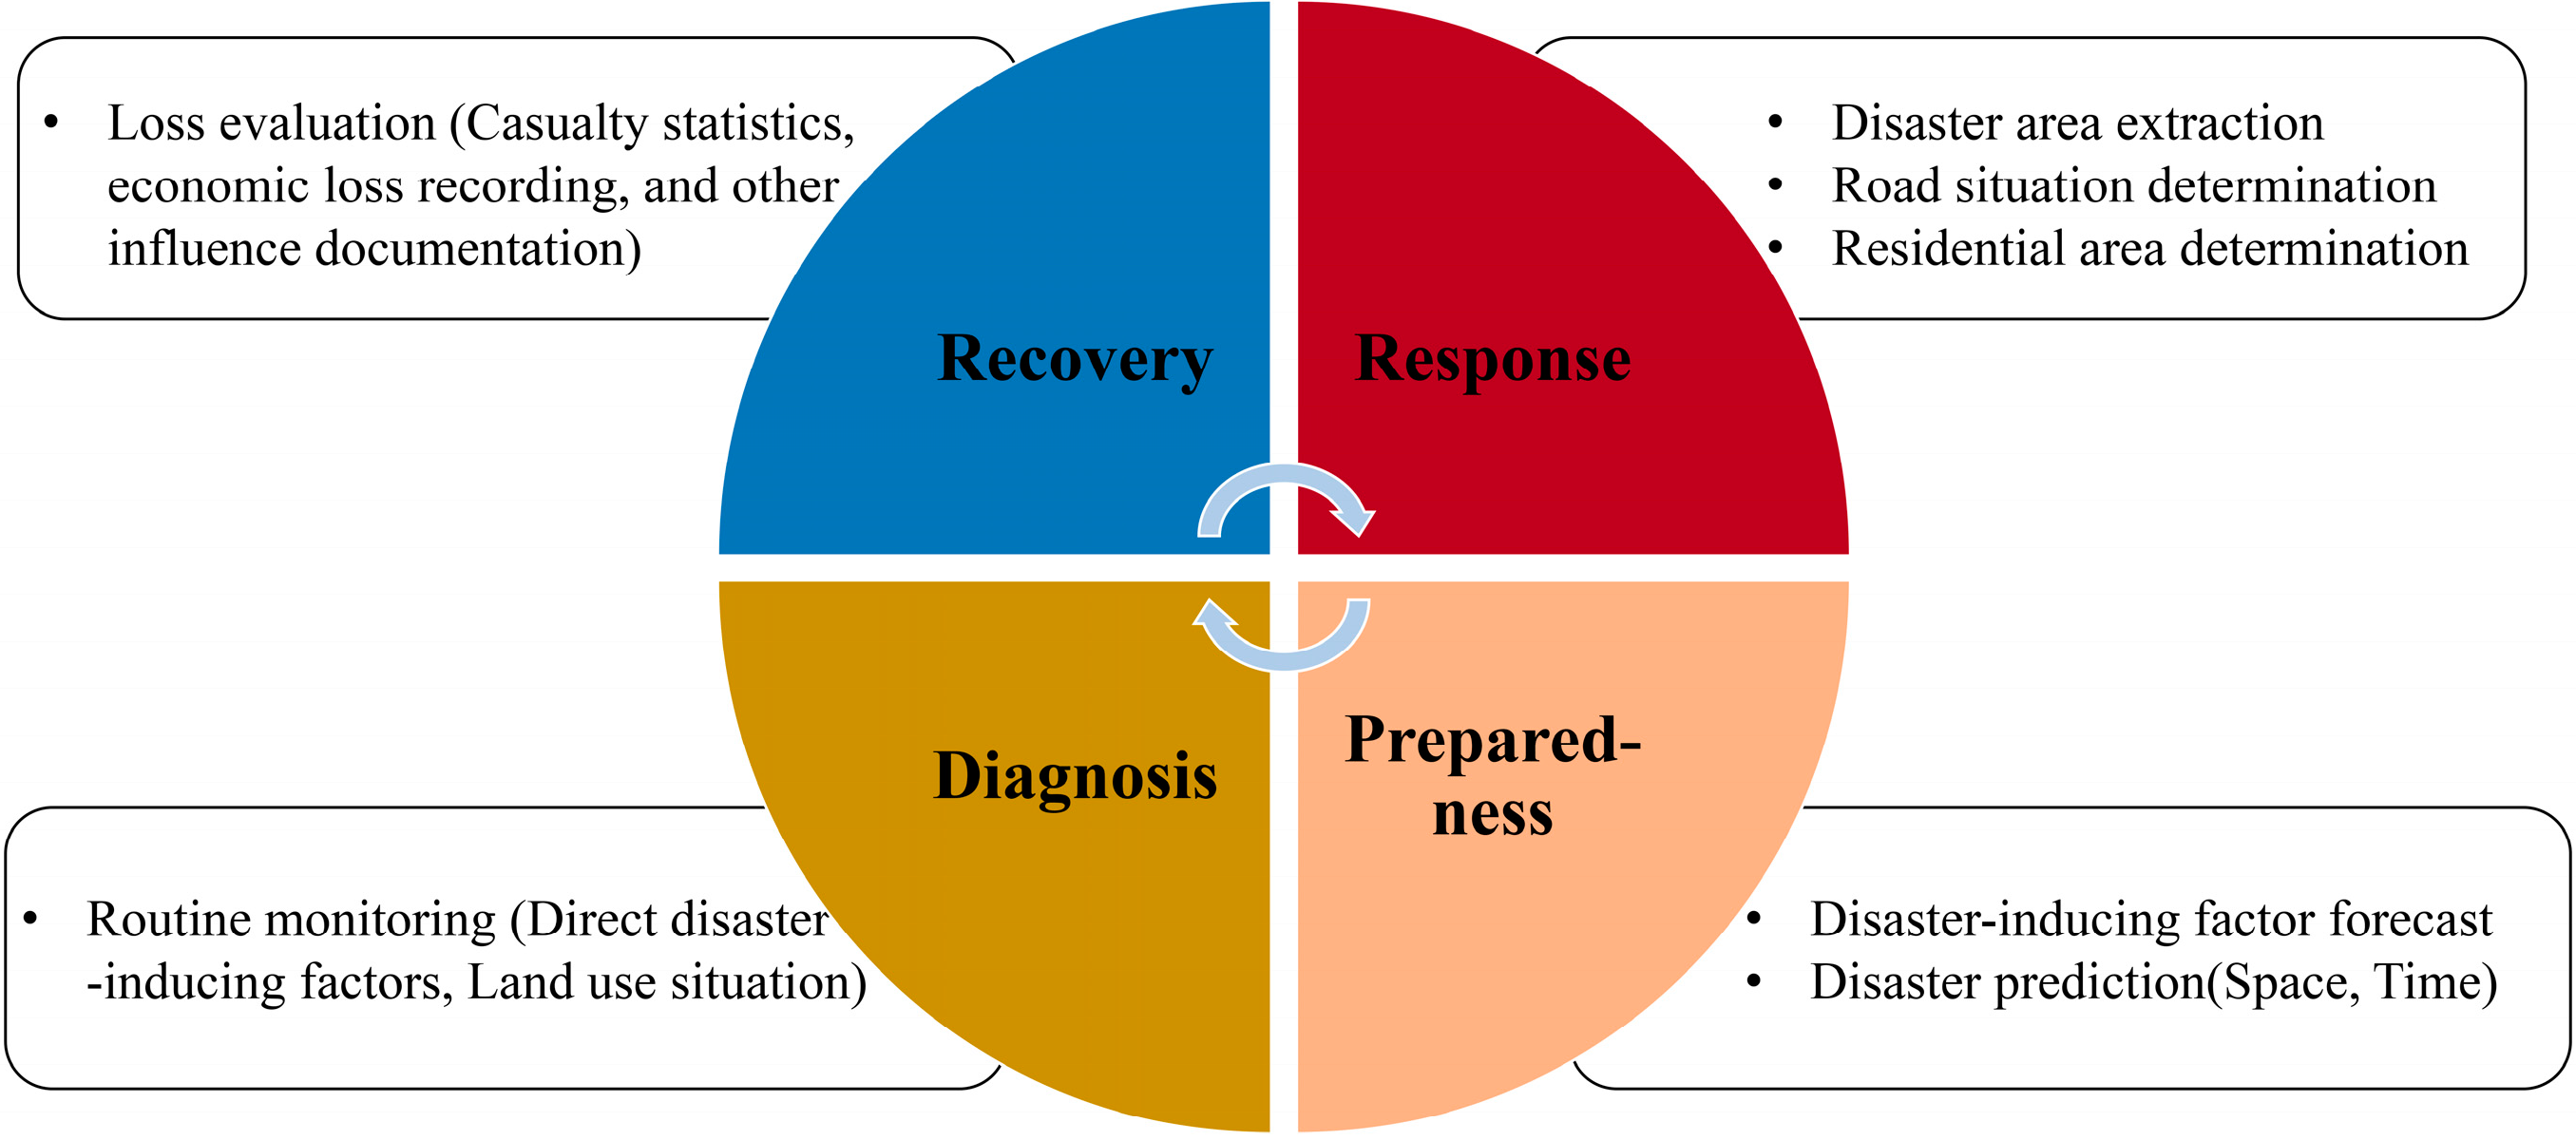
Covering information demands from all emergency phases. It is far from enough to just provide information for one or two emergency phases. Only with full life cycle information support, can the disaster be probably avoided, predicted, effectively responded to, or rapidly recovered. Here full life cycle refers to covering all the occurrence and development phases of events.
(2)
Providing observation support. Knowing what missions should be done during emergency is important, and candidate dataset for completing the missions is even more important. Therefore, both missions and candidate dataset for each mission should be included in the event model.
The full life cycle natural disaster event metamodel (FLCNDEM), which covers the information of all the phases and could provide observation support for disasters, is proposed in this paper. Full life cycle means covering all the phases of disasters. Disasters are divided into four phases, including mitigation, preparedness, response, and recovery, according to the definition of the United Nations International Strategy for Disaster Risk [9]. However, in real situations, what should be done first is to diagnose the abnormal situation rather than do the mitigation. Therefore, the four phases of disasters in this paper are defined as diagnosis phase, preparedness phase, response phase, and recovery phase, and full life cycle means covering all the four phases of diagnosis, preparedness, response, and recovery. FLCNDEM uses the idea of integrated environmental modeling (IEM) to complete the event mapping from the physical world to the information world. IEM is a system analysis-based approach for combining models, data, methods, and expert elicitations and applying them to explain, explore and predict the behavior of complex social-economic-environmental systems [21,22]. IEM concerns the issue of decision making [23,24], and emergency planning and response are IEM applications [25]. In addition, FLCNDEM uses the event pattern markup language (EML) of sensor web to implement its formalization. Sensor web is a notion that was first described by [26] and is now defined as an infrastructure that enables the interoperable use of sensor resources (a sensor or sensor system) by enabling their discovery, access, tasking, eventing, and alerting in a standardized way [27]. Sensor web is composed of a series of information models and interface specifications for the interoperability of sensor resources, among which EML is one. EML is composed of three parts, including patterns, capabilities and objects, and it specifies the description of event patterns, which is used to filter incoming event objects and to derive higher level information [28]. Objects of EML provide a general, flexible, and extensible framework for describing events, but specific attributes for event description have not been defined in it. What FLCNDEM will do to improve EML is to determine the attribute set required for event representation and fill them in EML. Moreover, our previous work on the heterogeneous sensor web node metamodel for the management of a flood monitoring system [24] and a sharable and interoperable metamodel for atmospheric satellite sensors and observations [29] have laid a solid foundation for the research on FLCNDEM.
FLCNDEM is designed to solve the problems that only the information from one or two phases are covered, and no dynamic observation information are included in existing protocols, languages, and models. What needs to be done in this paper is to analyze both the static representation and dynamic observation requirements from all the four stages of events, and to form the event metamodel. This paper first analyzes the static representation and dynamic observation requirements from all stages of emergencies, second references the organization of elements, the element types and names from the abovementioned protocols, languages, and models, and then proposes the common description framework for all types of NDE based on meta-object facility (MOF), which is FLCNDEM. After FLCNDEM is proposed, the task library and knowledge base for floods are built, forming the FLCNDEM for floods (FLCNDEMF). FLCNDEMF is formalized by EML, and an FLCNDEMF-based disaster event modeling software is built for template-based event modeling and management. The feasibility of FLCNDEMF is tested by applying it in the four phases of the Liangzi (LZ) Lake flood occurring on 16 July 2010. In the remainder of this paper, the methodology and description framework of FLCNDEM are proposed in Section 2; the flood task library and knowledge base for floods, and the system implementation of FLCNDEM are demonstrated in Section 3; the Liangzi Lake flood from 1 July 2010 to 31 August 2010, is elaborated in Section 4; discussion of FLCNDEM is provided in Section 5; and conclusion and outlook are given in Section 6.

2. FLCNDEM

The detailed construction process of FLCNDEM is elaborated in this section. Five steps are needed to complete the building of FLCNDEM, followed by the MOF based four-level architecture construction, the information organization of FLCNDEM, the analysis of different observations needs from different event phases, the content determination of FLCNDEM, and the formalization of FLCNDEM. These steps are illustrated in the following sections, respectively.

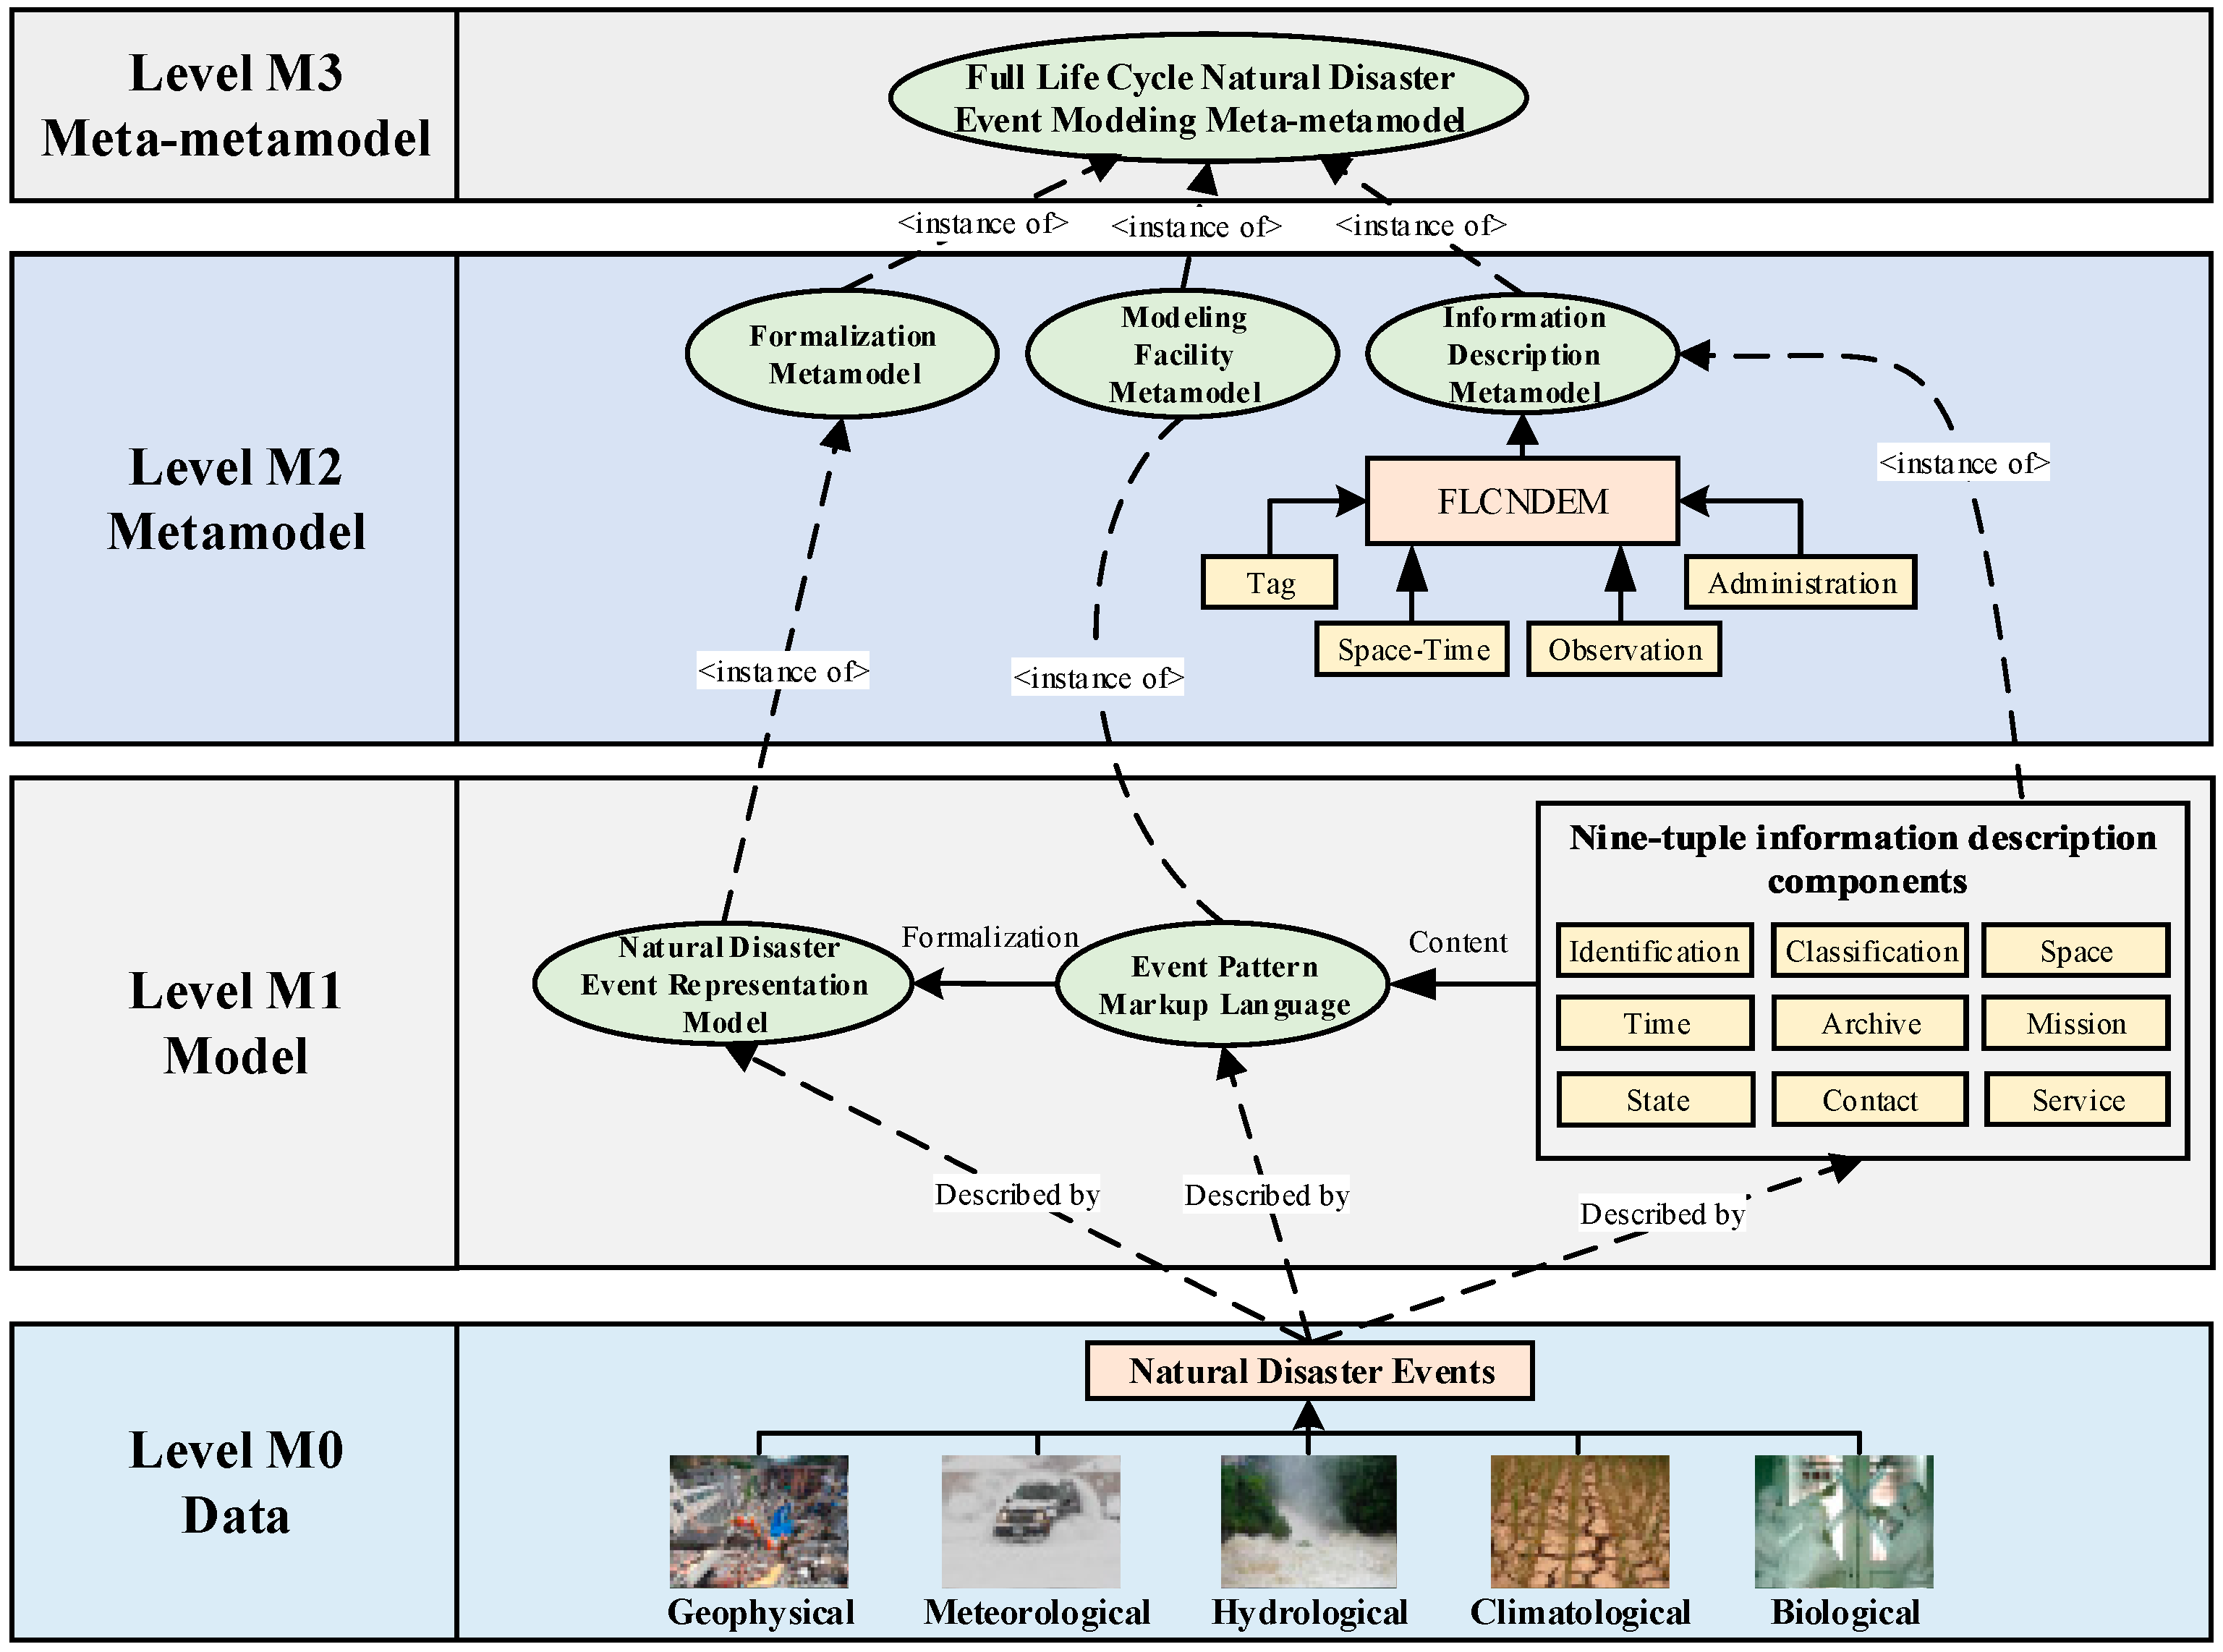
2.1. Meta-Object Facility for NDE

The MOF proposed by the Object Management Group [30] is released as a meta-metamodel to write models and metamodels (models of models). MOF has a four-level hierarchy and defines the most essential concepts that are needed for software engineering and modeling, and its leveled architecture can provide great help in realizing the event information abstraction [31]. Therefore, the MOF is adopted here as the design architecture of FLCNDEM.
Figure 1. The four-level meta-object facility (MOF) architecture for the full life cycle natural disaster event metamodel (FLCNDEM).
Remotesensing 07 07231 g001
Based on the four-level hierarchy of MOF [30], the architecture of FLCNDEM is shown in Figure 1. The M0 level consists of data from the real world, including instances of NDE, such as geophysical, meteorological, hydrological, climatological and biological disasters. The M1 level consists of models, which may also be considered as metamodel instances. This level includes elements such as nine-tuple information description components, EML, and representation models of NDE. The M2 level consists of metamodels, which may also be considered as MOF model instances. This level consists of information description models, modeling facility metamodels and formalization metamodels, which are the abstract expressions for the nine-tuple information description components, EML and disaster event representation models, respectively. The top M3 level defines the basic concepts and relations of FLCNDEM and is the high-level abstraction of metamodels. More than one metamodel can be defined in the M3 level, and the metamodel concepts, such as classes, packages, and associations, are the main modeling elements.

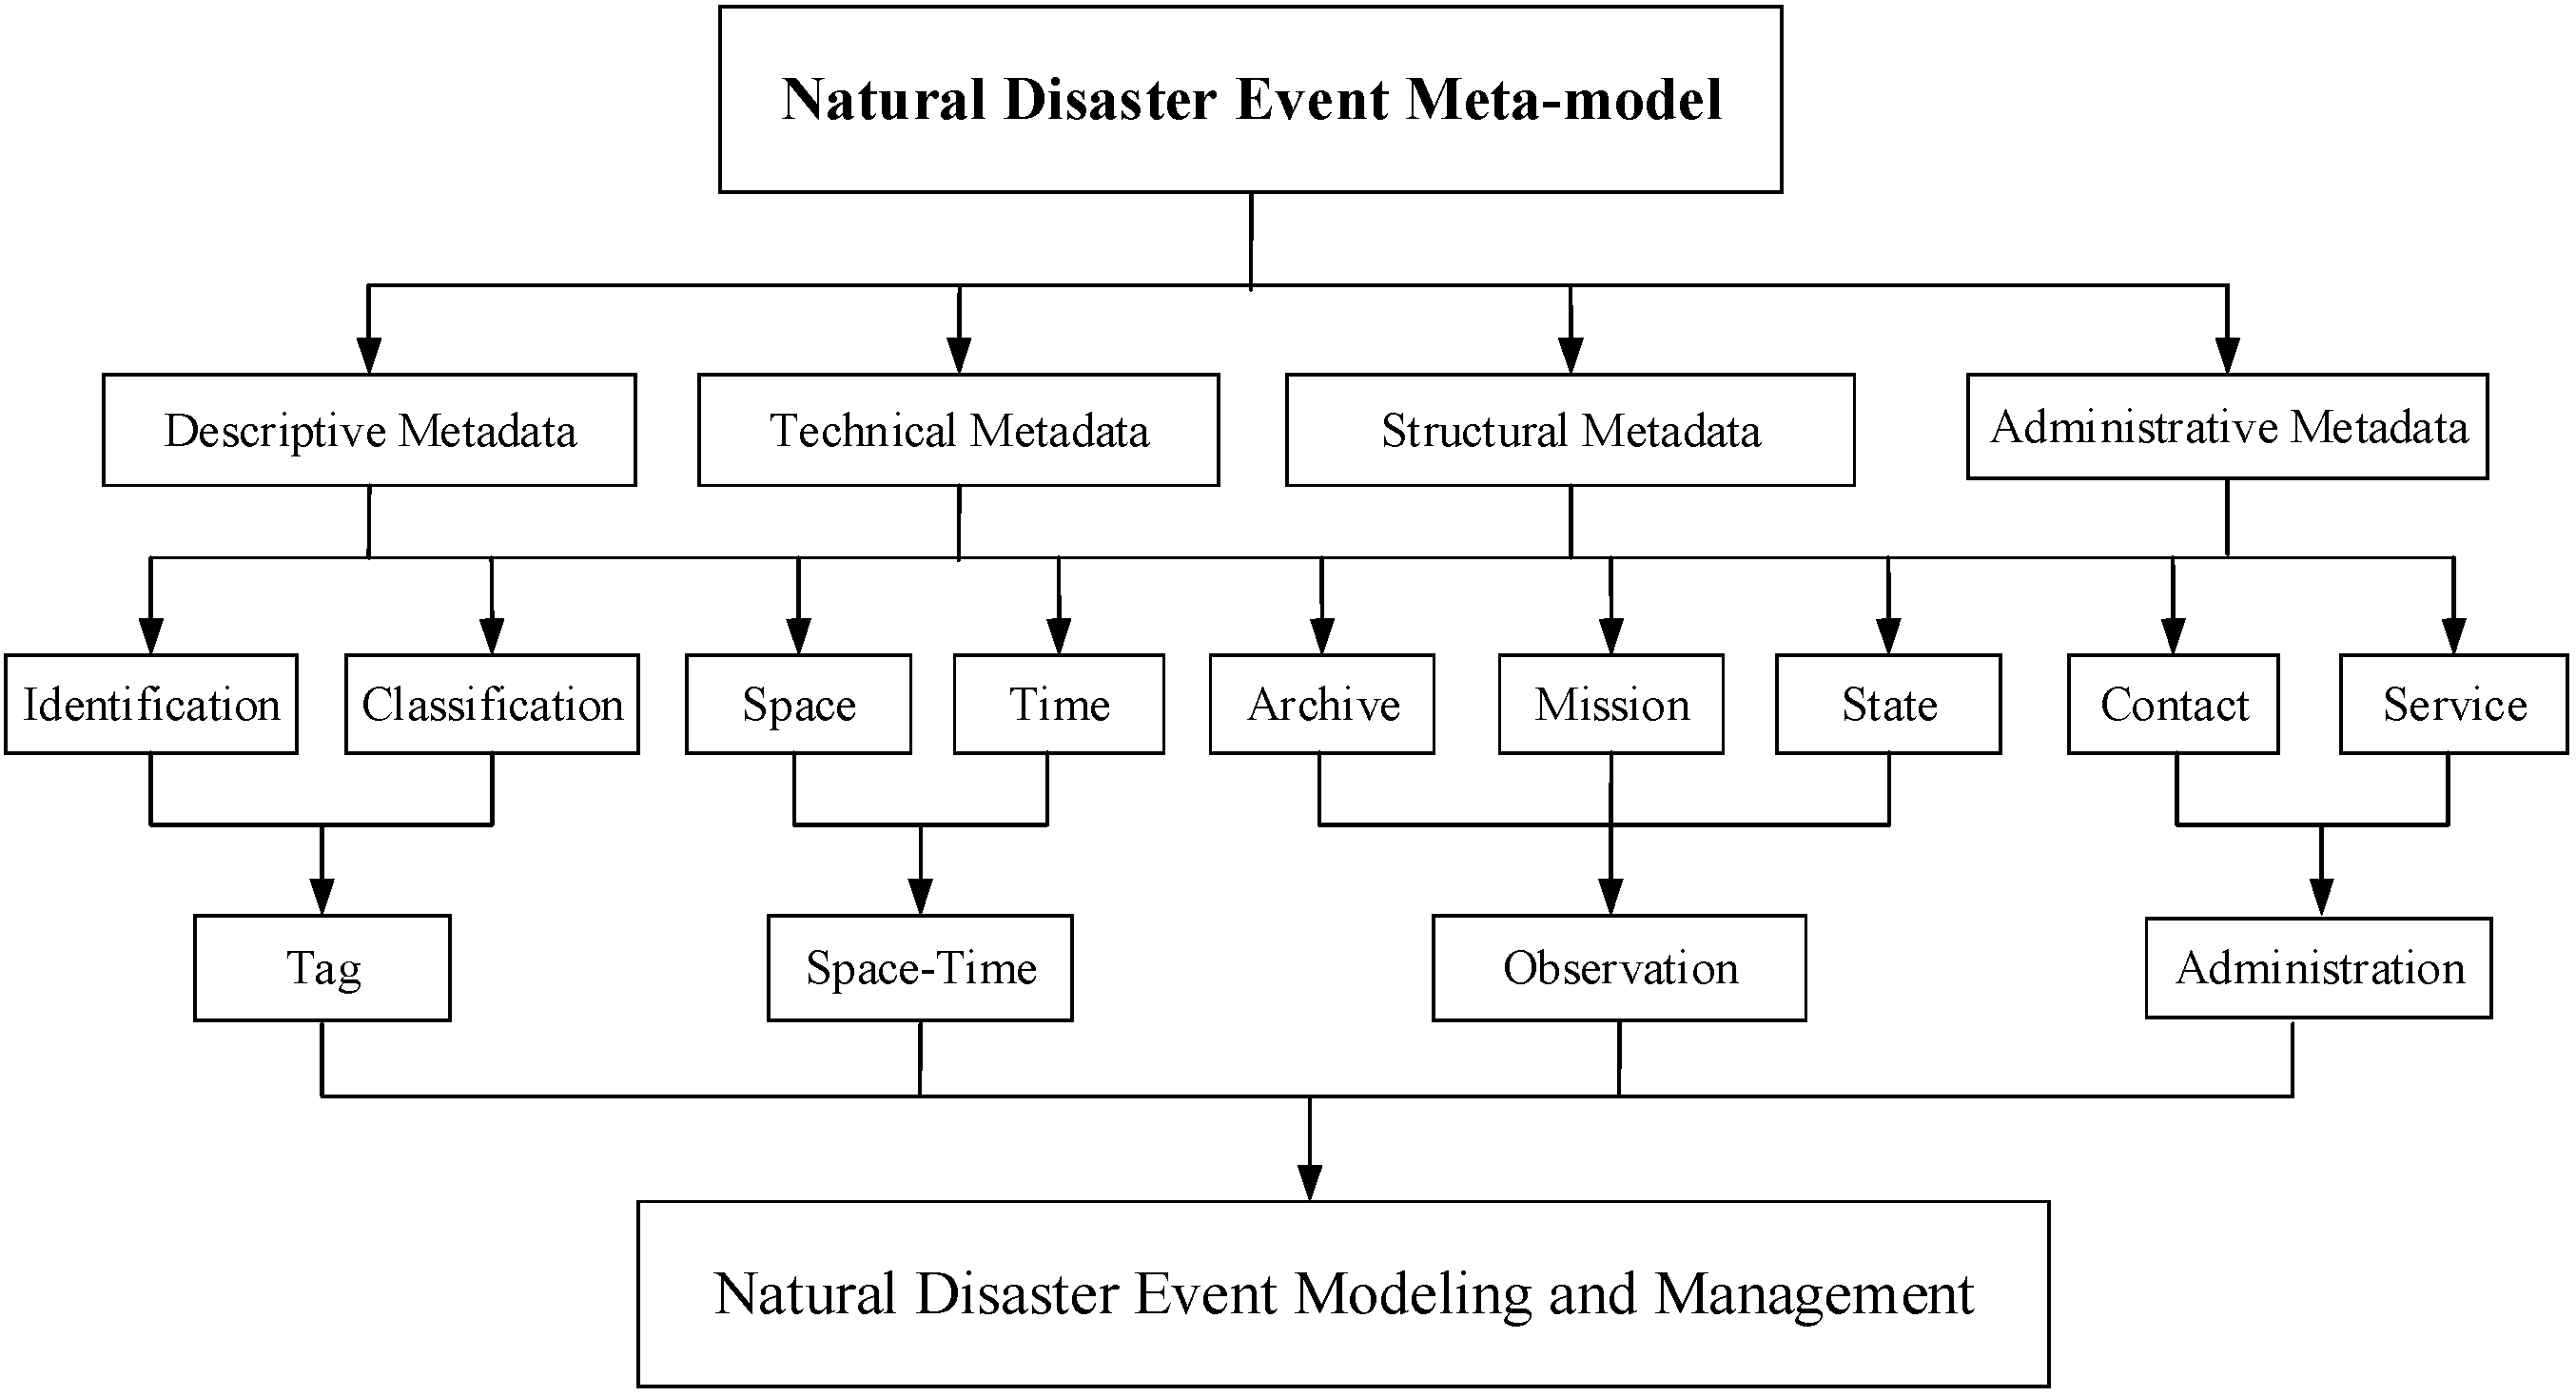
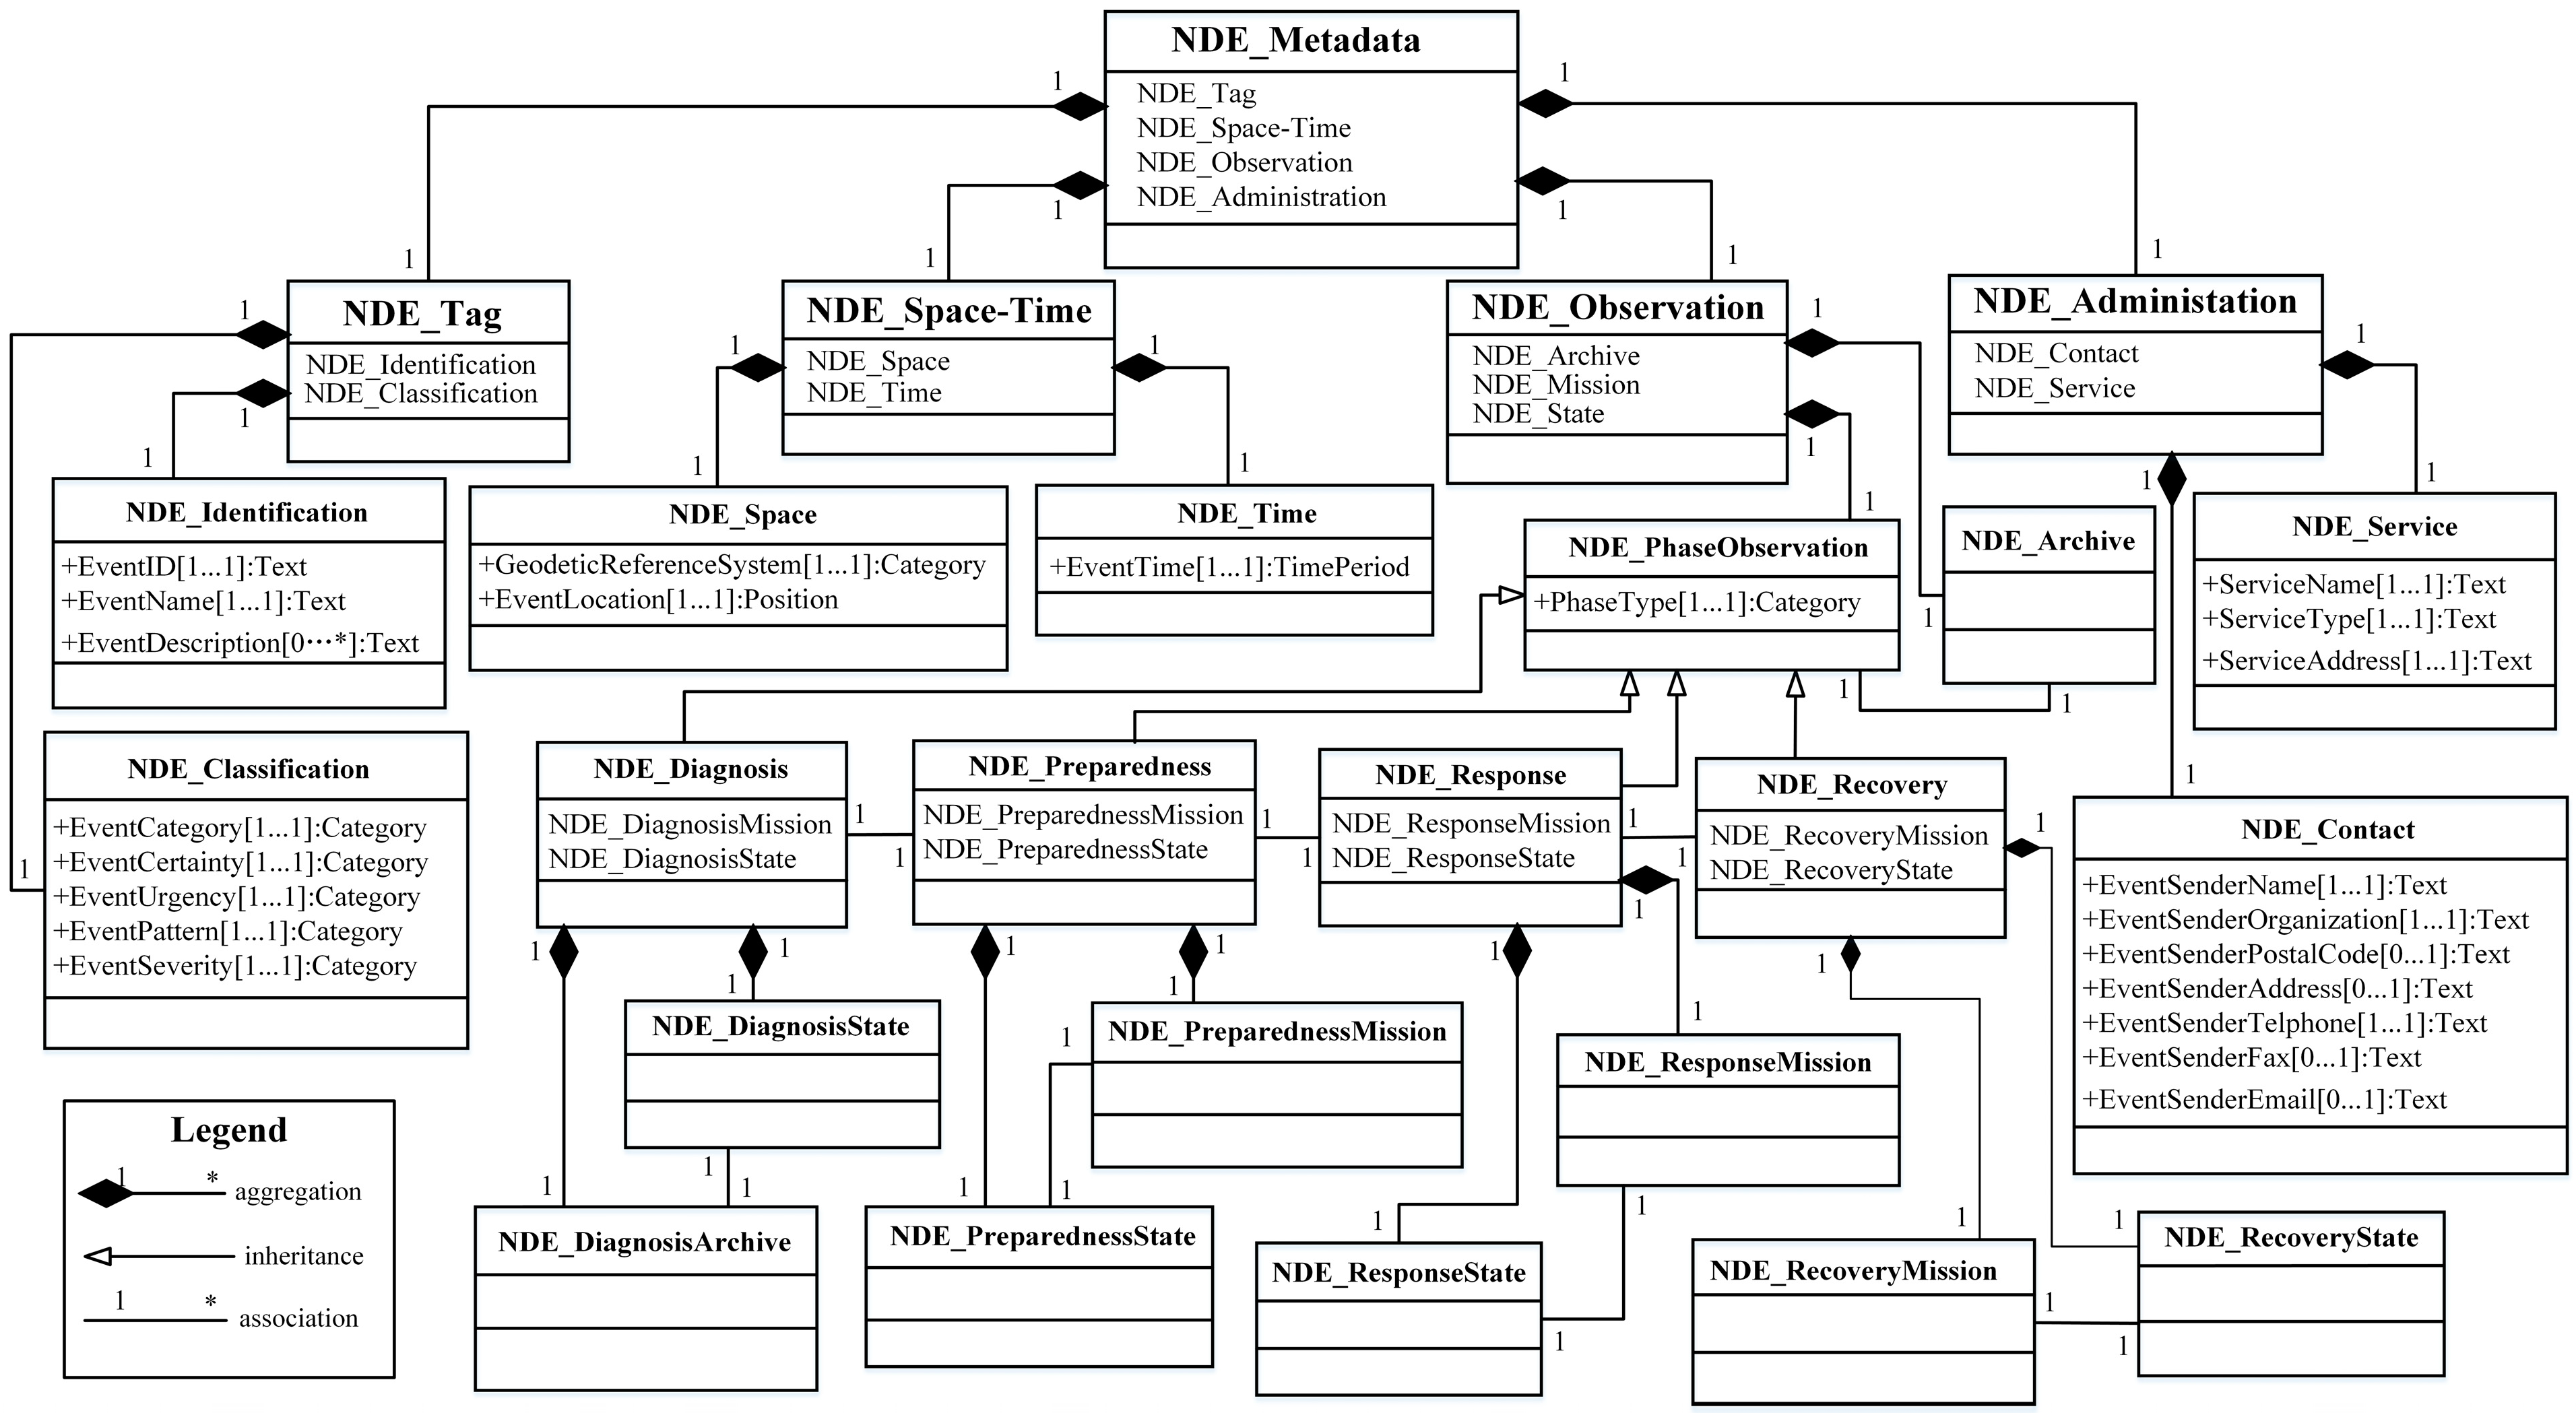
2.2. Information Organization of FLCNDEM

FLCNDEM classifies the hazard information into four components, including tag, space-time, observation, and administration, according to their functionalities. Tag information is essential for all types of representation metamodels and should be included in FLCNDEM. Space-time information of disasters should be provided so that we could know when and where disasters occur and take appropriate actions. Observation is composed of archive information and able to reflect the occurrence and development of events, and it is of great significance to realize timely planning and responding to disasters. Therefore, observations should be recorded. Administration is used to keep a record of the information sender in case of information confirmation or further information. The four information components of FLCNDEM can be further divided as follows:
(1)
Tag: Tag information is composed of the identification information and the classification information. Identification information is used to describe the event ID, name, and other identity elements. Classification is for the description of event types under different classification criteria and could help in the event query and discovery. Once the event type is decided, the corresponding observations are determined.
(2)
Space-Time: Space-Time information includes space information and time information, which are designed to represent the spatial and temporal aspects of NDE, respectively.
(3)
Observation: Observation information is divided into archive, mission, and state information. All these three kinds of information vary with the event type and phase.
(4)
Administration: Administration information consists of contact information and service information. Contact information is applied to record the information of the event sender, and service information is for keeping track of the information about the event service.
Figure 2. Organization of the hazard information.
Remotesensing 07 07231 g002
Therefore, NDE can be represented as follows: Natural Disaster Events = {{Identification}, {Classification}, {Space}, {Time}, {Archive}, {Mission}, {Status}, {Contact}, {Service}}. The organization of the hazard information is depicted in Figure 2.

2.3. Observation Needs from Different Event Stages

Different disaster phases have different missions; therefore, the observation needs from different event stages vary. In the diagnosis phase, routine monitoring is the fundamental mission. Thus, the most direct disaster-inducing factors, such as precipitation monitoring in the flood event, should be recorded in real time. In addition, the distribution of roads, residential areas, farms, and other features should be understood in case of comparative analysis. The main task of the preparedness phase is to forecast the values of disaster-inducing factors and to make predictions about when and where the event will occur. For the response phase, the focus is to determine the range of the disaster area, which can be overlaid with the land use situation of the diagnosis phase to determine the current road conditions and the possible locations of trapped men. In terms of the recovery phase, damage assessment should be performed, mainly including casualties, economic losses and other effects, such as ecological impacts, farm submergence, etc. The concrete information requirements of all emergency stages are given in Figure 3.
Figure 3. Observation needs from different emergency stages.
Remotesensing 07 07231 g003

2.4. Contents of FLCNDEM

The contents of FLCNDEM are the refinement of the four information components and the nine-tuple information description framework. These contents are elaborated as follows:
Identification: In identification, the event id, name and brief descriptive information are included. The event id is the unique identification of the disaster event and stays the same during the developmental phases of events. The event name can usually reflect the event type and location, and different event phases have the same prefix. Description information provides a brief introduction to the event process and varies with the event phase.
Classification: Classification information includes the event category, event certainty, event urgency, event pattern, and event severity. The event category is the same as that stated in the M0 layer of the MOF framework for FLCNDEM. The event pattern is adopted from EML, and the possible values can be simple pattern, complex pattern, timer pattern and repetition pattern. The event urgency, event severity and event certainty are all inherited from the CAP, and the event urgency can be divided into immediate, expected, future, past and unknown. Event severity is categorized as extreme, severe, moderate, minor and unknown, and event certainty is split into observed, likely, possible, unlikely and unknown.
Space: NDE are usually geospatial events; therefore, space information is of great importance. In FLCNDEM, space information can not only be expressed as concrete place names, but can also be expressed as geographical spatial coordinates.
Time: Time information is necessary for all metamodels. Time information is provided according to the form of the geography markup language [32] in FLCNDEM.
Archive: Archive information is mainly composed of text and electronic messages. Names and storage locations should be provided for text information. Values of electronic messages are usually web sites instead of information entities.
Mission: During the process of event planning and responding, it is the real-time observation that really matters. The mission here refers to the real-time observation tasks. Missions are predefined, and different phases have different missions. Once the event category is determined, the missions in different event phases are decided.
State: The state is the synthesis of all of the phase-based observations and is an indicator of the event situation. The state varies with the event stage, and when the event category is certain, the state corresponds.
Contact: Contact information is composed of event sender name, event sender organization, event sender postal code, event sender address, event sender telephone, event sender fax and event sender E-mail. The contact information can be used to contact the event provider to confirm the information, acquire more information, etc.
Service: The service section can be divided into the service name, service type, and service address. This section provides consumers the publisher name, the publisher type, and the publication location.
The unified modeling language (UML) diagram of FLCNDEM is shown in Figure 4.
Figure 4. The Resultant of Full Life Cycle Natural Disaster Event Metamodel (FLCNDEM).
Remotesensing 07 07231 g004

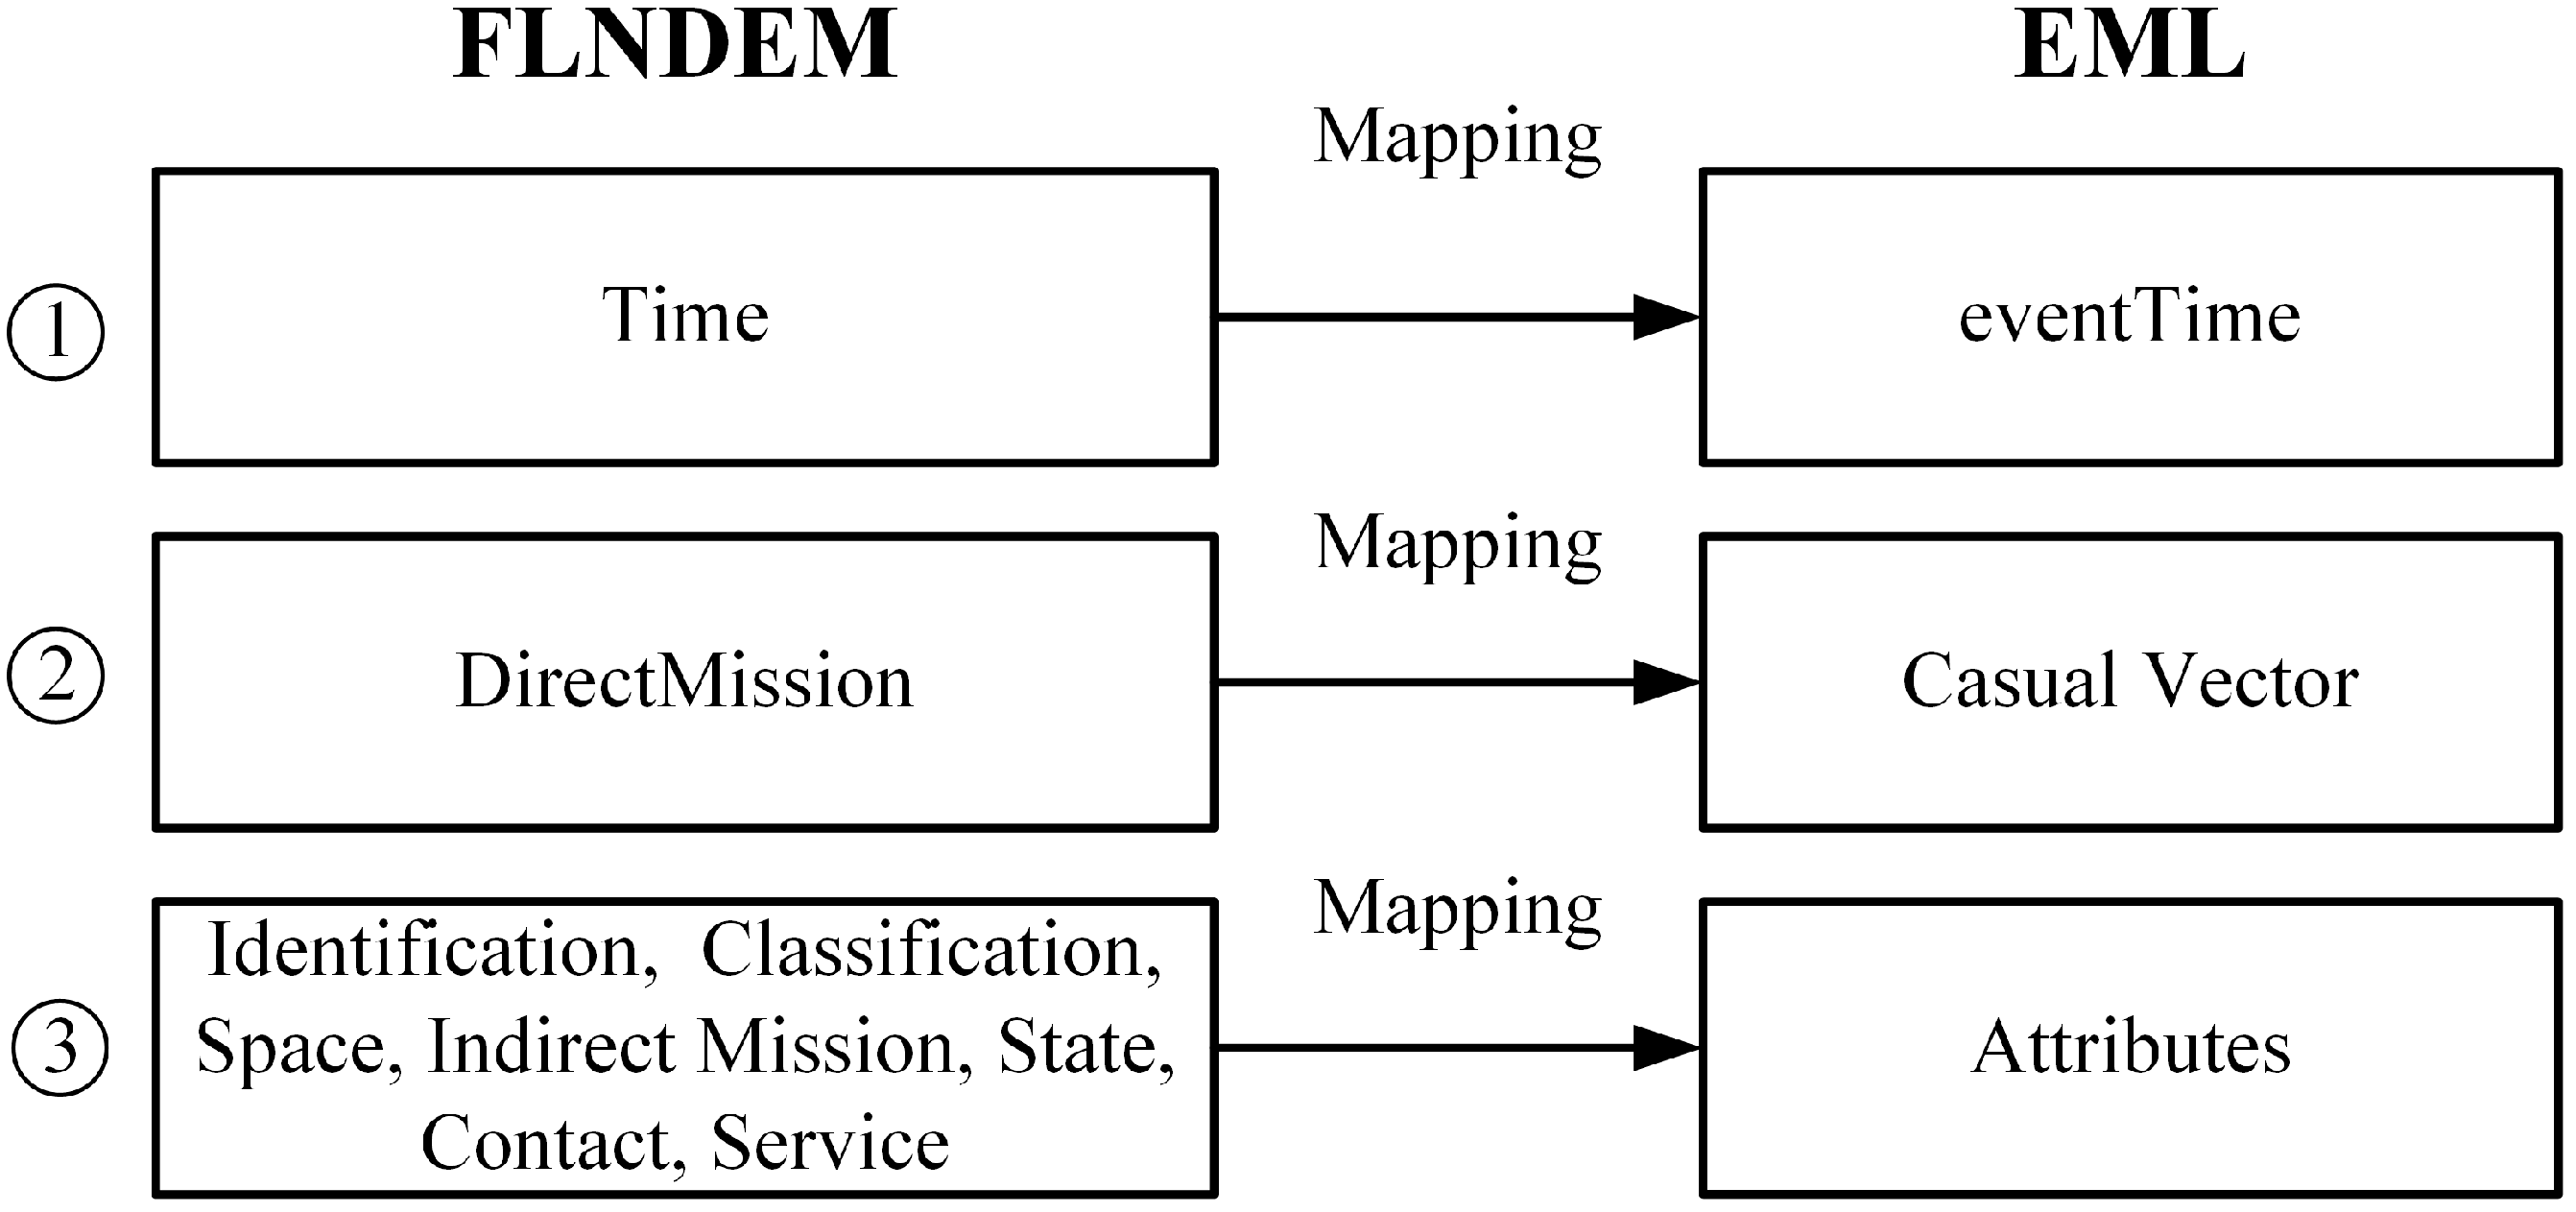
2.5. Formalization of FLCNDEM

FLCNDEM is formalized by EML because of the representation form of EML can be used by sensor event service (SES) [33], which is an interface specification proposed by open geospatial consortium for filtering streams of incoming observations based upon user defined filter criteria, to perform the filtering of observations and thus realize the abnormality detection. The EML object is composed of event time, casual vector and attributes. In the formalization of FLCNDEM, (1) time information in FLCNDEM is mapped into the event time in EML; (2) the most direct disaster-inducing factors are projected into the casual vectors in EML; and (3) other information, including identification, classification, space, missions except for the most direct disaster-inducing factor monitoring, state, contact and service, are all mapped into attributes of EML. The mapping from FLCNDEM to EML is presented in Figure 5.
Figure 5. Mapping from FLCNDEM to event pattern markup language (EML).
Remotesensing 07 07231 g005

3. System Implementation

This section focuses on the implementation of the FLCNDEM-based modeling and management system of NDE. As FLCNDEM is an abstract framework, and it requires support from the task library and knowledge base when used for a particular type of NDE, this paper uses the flood as a case study, builds the task library and knowledge base for floods, and develops the modeling and management system for floods based on FLCNDEM, the task library, and the knowledge base.

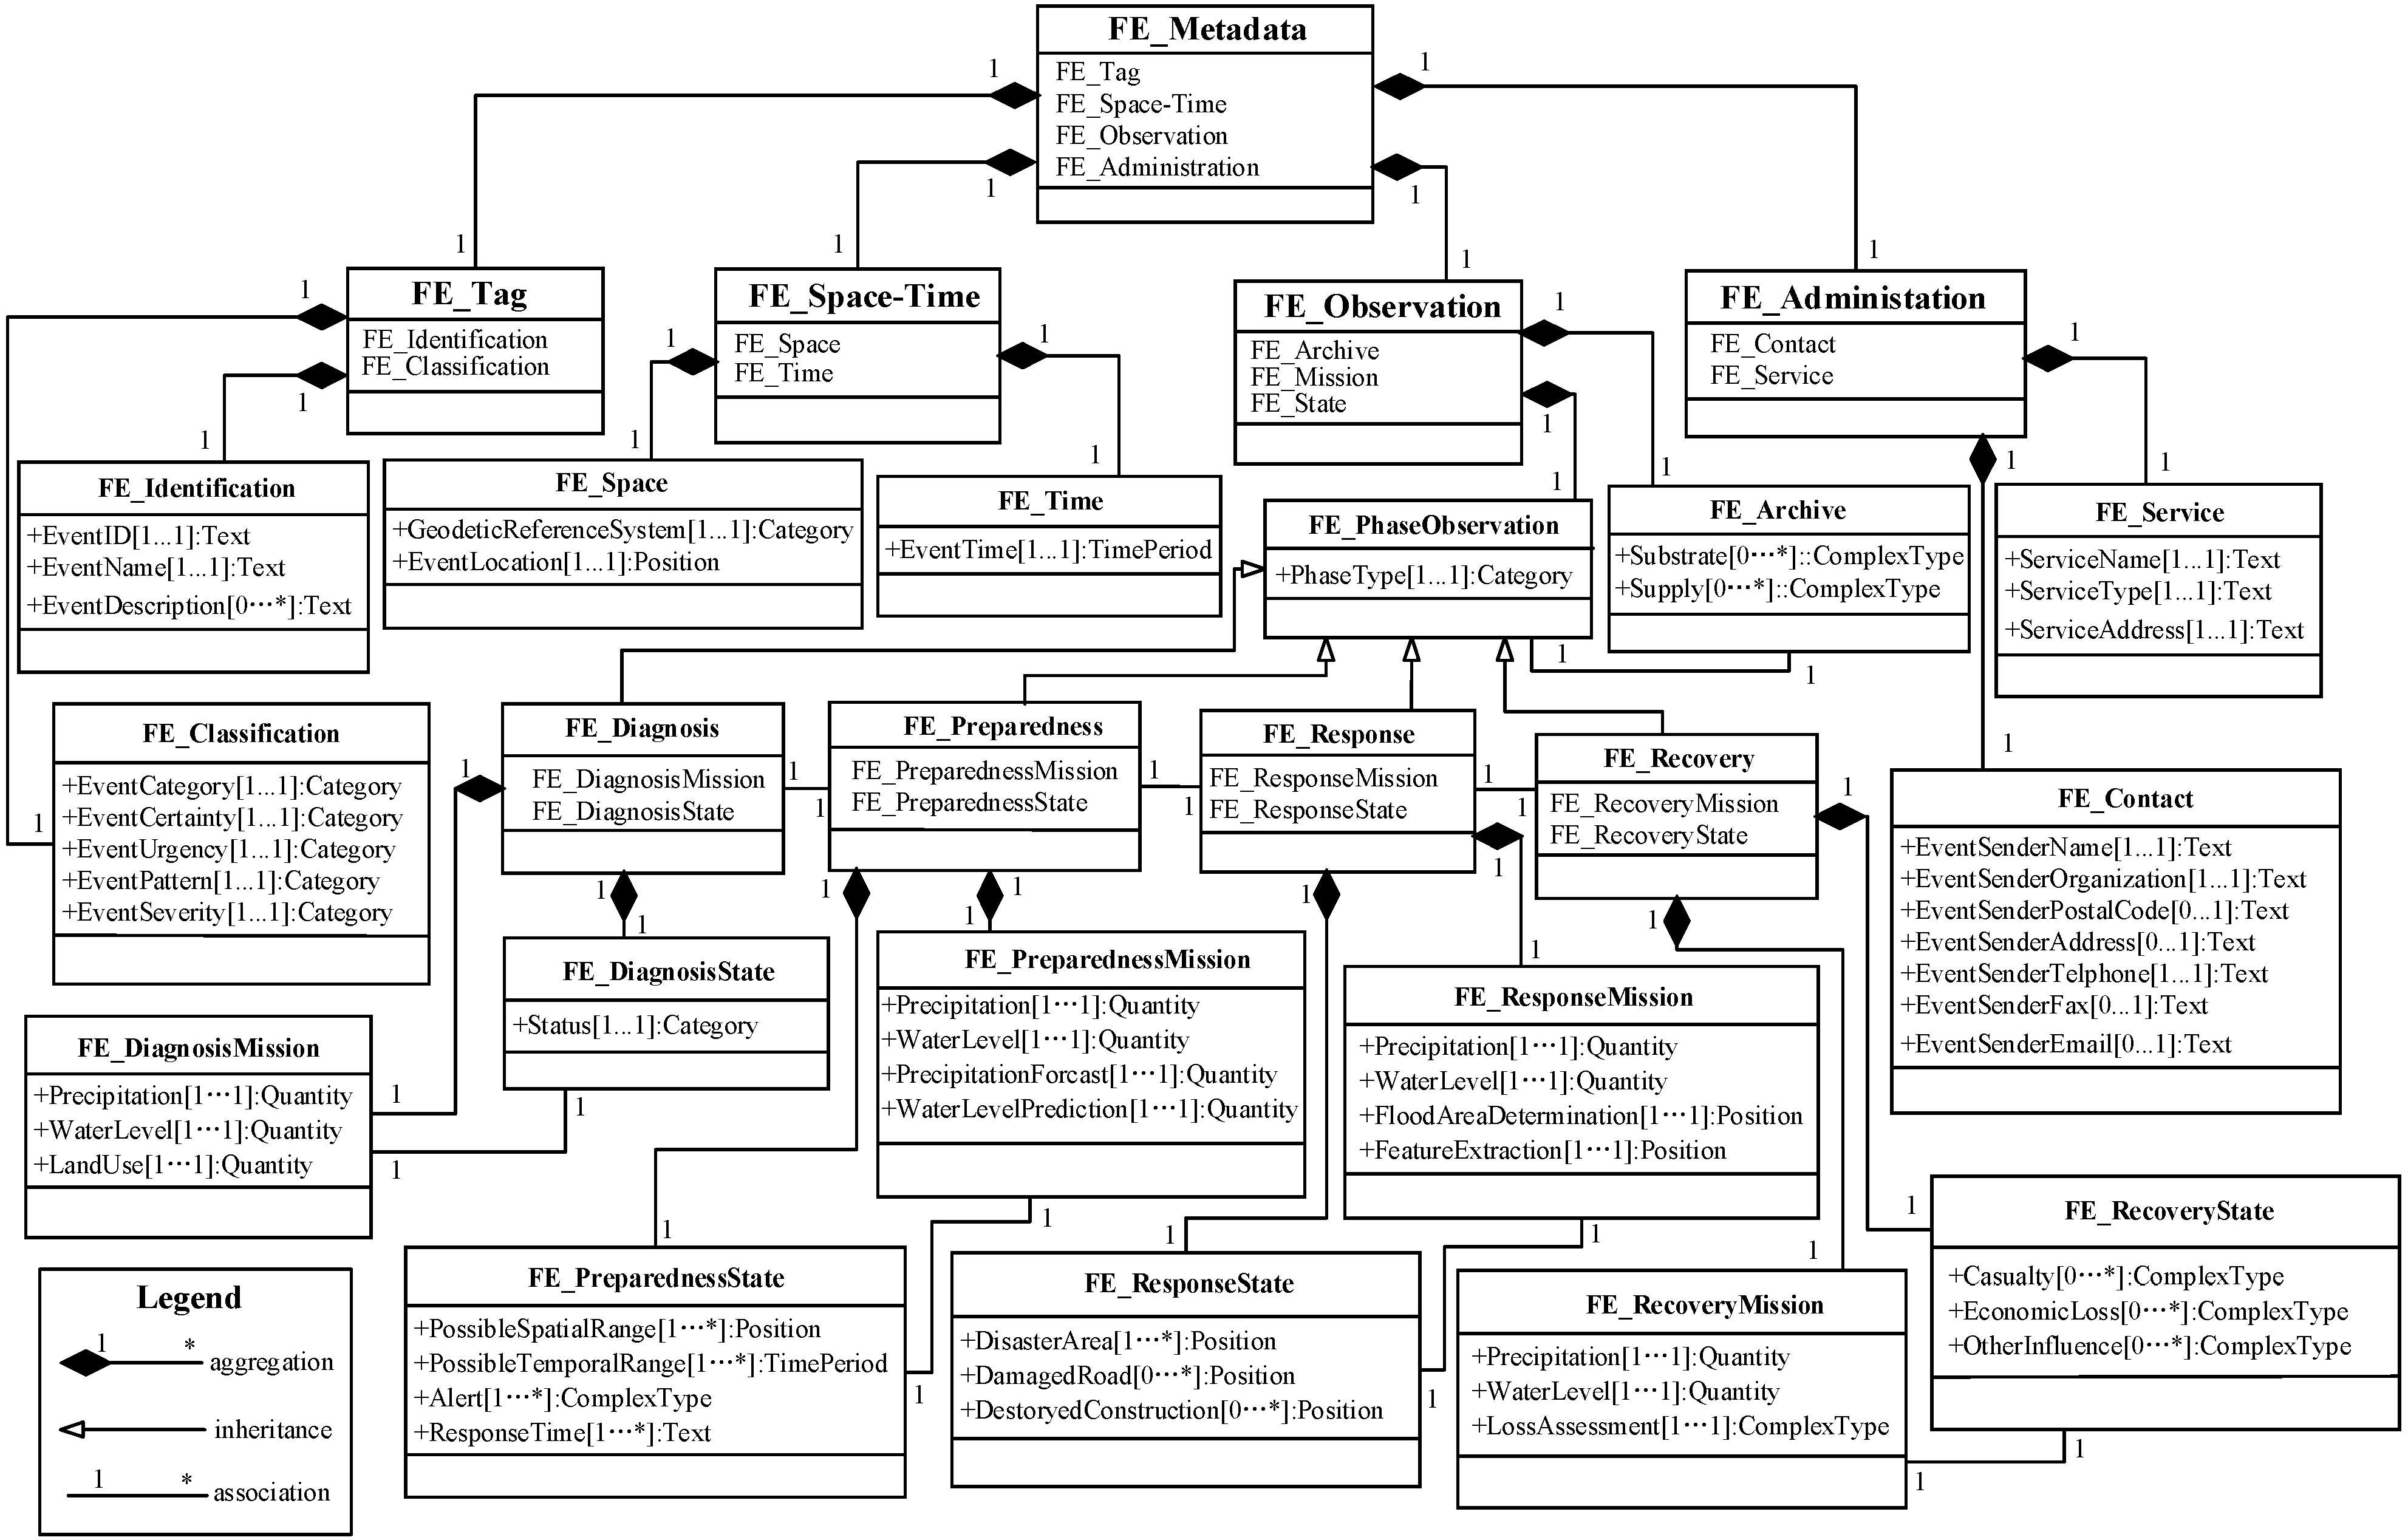
3.1. FLCNDEM for Floods

FLCNDEM only provides a high-level abstract information framework for NDE. The observation part of the metamodel varies according to different disaster types. For a specific type of NDE, missions, the candidate dataset for completing the missions, and states should be provided before it can be used. Among all of the types of natural disasters, floods occur the most frequently and cause the most serious consequences. In 2012, 53% of victims were from floods [1]. Thus, this paper analyzes the missions and states for flood events in different stages, summarizes the candidate dataset for each mission, builds the task library and knowledge base for floods, instantiates the FLCNDEM, and forms FLCNDEMF to realize the flood process information management.
There are many types of floods, they have different incentives, thus have different missions and states in different phases correspondingly. As our study area is in Hubei, China, which is famous as a province with thousands of lakes, so here we choose lake flooding as an example, and analyze the missions and states in different phases of lake flooding.
Archive information for floods is mainly composed of the substrate and supply information, and they are fixed for a particular flood type. For lake floods, substrate information includes the information of population, economy, terrains, and land features, and they can be entity files in government departments or they can be found on the internet. The supply information of lake floods mainly consists of the information of basics, medicines, fire brigades, rescuer teams, and the possible assistance of other departments, such as electricians, plumbers, etc. As stated in Section 2.3, in the diagnosis phase, the main task is routine monitoring. For floods, the precipitation and water level are the direct disaster-inducing factors, and they are monitored throughout the entire flood process. In addition, the land use situation should be understood in preparation for overlay analysis during disasters. Therefore, precipitation statistics, water level determination, and land use are the missions of the diagnosis phase. In addition, the main goal of the diagnosis phase is abnormality detection; thus, the status element, which is used to represent whether the observation value exceeds the threshold, is chosen as the indicator of the state of the flood diagnosis phase. In the preparedness stage, the main goal is to perform the spatio-temporal prediction of floods, and precipitation and water level forecasts are necessary observations for flood prediction. Therefore, missions of the preparedness phase are precipitation forecasting and water level predicting. Correspondingly, the possible flood range, the possible flood time, and the flood alert are the components of the status information. In terms of the response stage, the most important thing is to rescue people. Therefore, the missions are to realize the flood area determination, and feature extraction, mainly including damaged road determination and residential area extraction. The status information is composed of the flooded area, damaged road, and destroyed construction. In the recovery phase, the mission is mainly focused on loss assessment. Loss assessment is performed to classify all of the land features, compare them to the land use in the diagnosis phase, and to determine the number of causalities, economic losses and other influences caused by the disaster. All of the missions and states form the flood task library, supporting the formation of FLCNDEMF. The missions and states in different flood event phases are listed in Table 1.
By incorporating flood missions and states into FLCNDEM, the FLCNDEM for floods is developed. The UML diagram of FLCNDEM for floods is shown in Figure 6.
Just knowing the missions and states during floods are far from enough. Offering the candidate dataset missions can really help in data query or acquisition and further shorten the event response time. Therefore, it is imperative to provide the candidate dataset for flood missions. Some missions can be easily accomplished by in situ observations, while other missions are exactly what remote sensing (RS) is good at completing. Because in situ data can be found quickly according to the location, time, type, and other information, only the remotely sensed candidate dataset is provided here. This paper summarizes all of the candidate datasets for flood missions and forms the flood knowledge base. The summarization is mainly from studies, projects, and websites. A candidate remote-sensed dataset for precipitation is depicted in Table 2.
Table 1. Missions and states in different flood event phases.
PhaseMissionState
DiagnosisPrecipitation Statistics
Water Level Determination
Land Use
Status
PreparednessPrecipitation Statistics
Water Level Determination
Precipitation Forecast
Water Level Prediction
Possible Spatial Range
Possible Temporal Range
Flood Alert
ResponsePrecipitation Statistics
Water Level Determination
Flooded Area Determination
Feature Extraction
Flooded Area
Damaged Road
Destroyed Construction
RecoveryPrecipitation Statistics
Water Level Determination
Loss Assessment
Casualty
Economic Loss
Other influence
Figure 6. Unified modeling language (UML) diagram of FLCNDEM for floods. FE here means flood event.
Remotesensing 07 07231 g006
Among all of the candidate datasets for precipitation monitoring, satellite TRMM and CMORPH are mostly used internationally, and satellite FY2 and FY3 are often used in China. After the candidate dataset is provided, users could use the simplified general perturbation version 4 (SGP4) model [34,35] and input the spatio-temporal range to quickly acquire the data meeting their demands.
Table 2. Candidate remote-sensed dataset for precipitation monitoring.
MissionSatelliteSensor
Precipitation MonitoringGOES-13, GOES-14, GOES-15Imager
Nimbus5/Nimbus6ESMR
Seadsat/Nimbus7SMMR
DMSP-F8/DMSP-F10/DMSP-F11/DMSP-F12SSM/I
TRMMTMI/PR/VIRS
CMORPHSSM/I/AMSU-B/TMI
EOS(Terra/Aqua)MODIS
GMS-5Moisture sensor
NOAA-KAVHRR
GPMDPR/GMI
FY-2CVISSR
FY-3CVIRR/MWTS/MWHS/MWRI

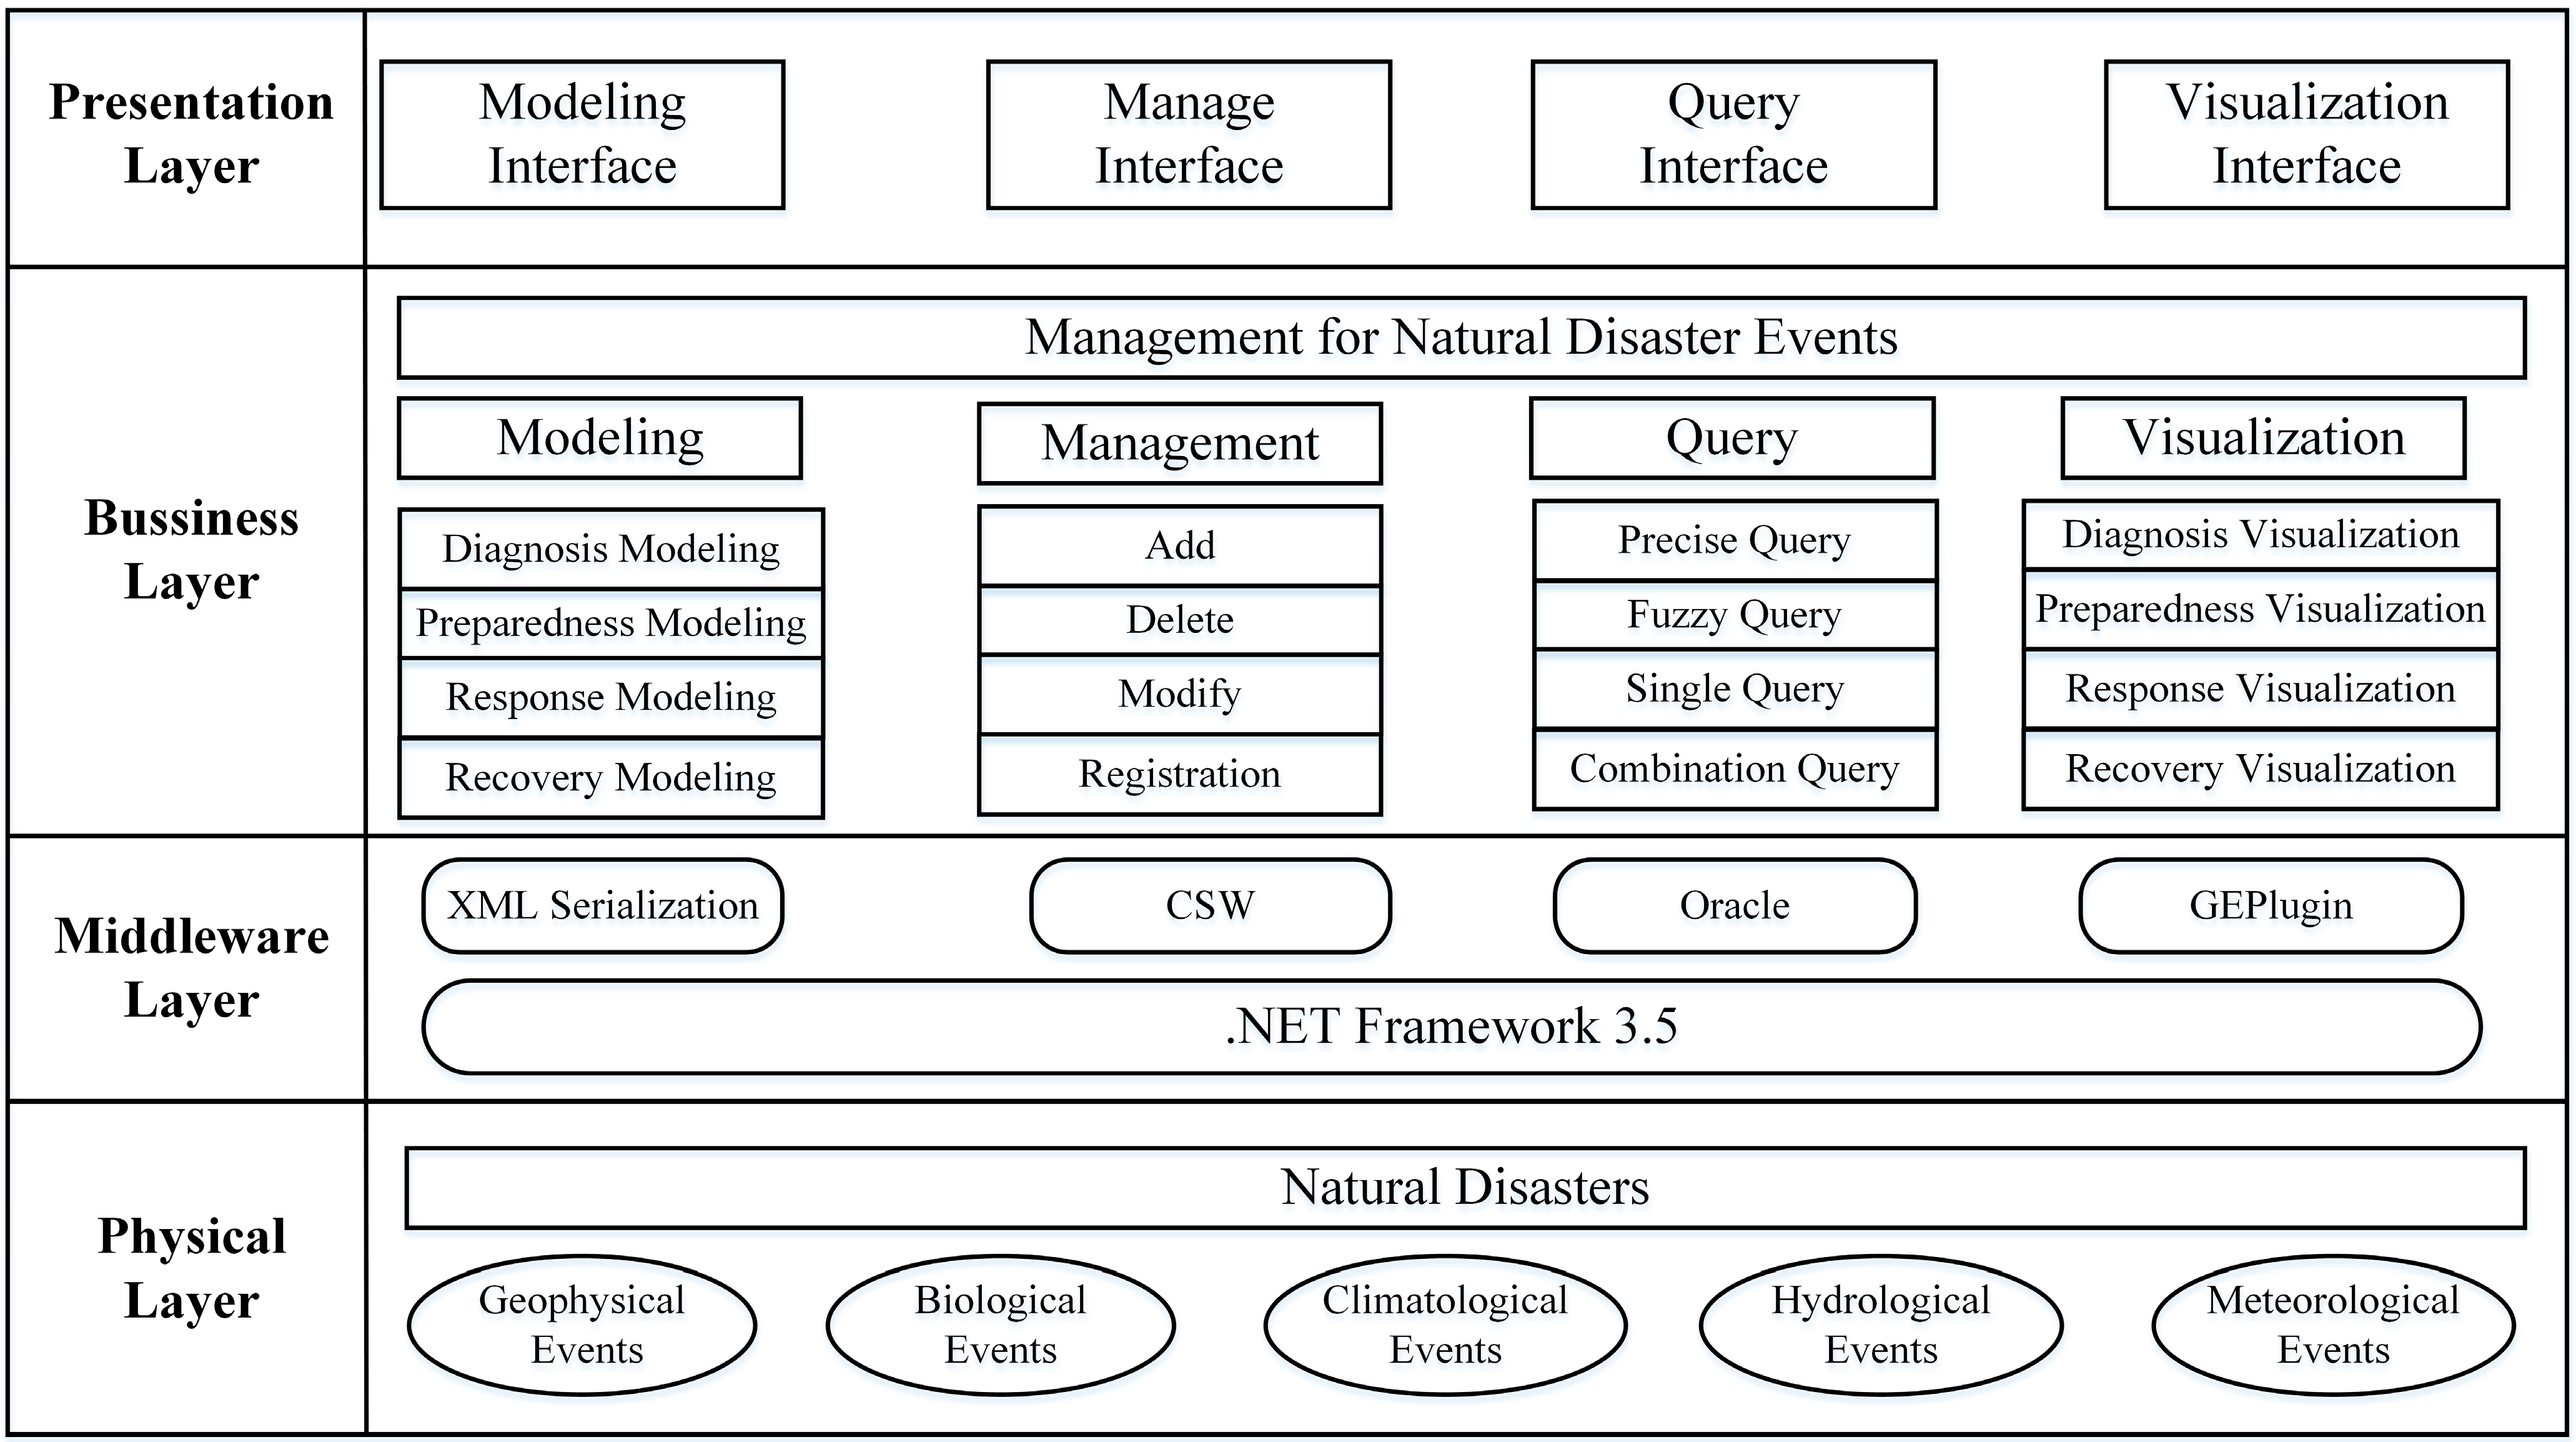
3.2. System Architecture and Components

The prototype system named Natural Disaster Event Manager is designed to provide the modeling, management, querying, and visualization of different types of NDE based on the FLCNDEM proposed in this paper, the task library, and the knowledge base of different categories of disasters. The architecture of the Natural Disaster Event Manager system is shown in Figure 7.
Figure 7. Architecture of the Natural Disaster Event Manager system.
Remotesensing 07 07231 g007
There are four layers in the architecture of Natural Disaster Event Manager, including the physical layer, the middleware layer, the business layer, and the presentation layer. The physical layer is composed of all types of actual NDE. The middleware layer is responsible for completing the mapping from NDE in the real world to those events in the virtual world. The business layer is the core of the system, in which a series of functions and operations are defined to achieve decision support and management for NDE, mainly including the FLCNDEM-based event modeling, management, query, and visualization. The presentation layer provides a set of graphical user interfaces for communication and interaction between clients and the prototype system and can be used to implement the operations that are provided in the business layer.

4. Experiment

The LZ Lake flood which occurred between 1 July 2010, and 31 August 2010 is used as a case study to test the feasibility of FLCNDEMF. In the following sections, first the reason why the LZ Lake flood is selected as the case study is explained, then the phase-based modeling, registration, query, and visualization of the LZ Lake flood are presented successively.

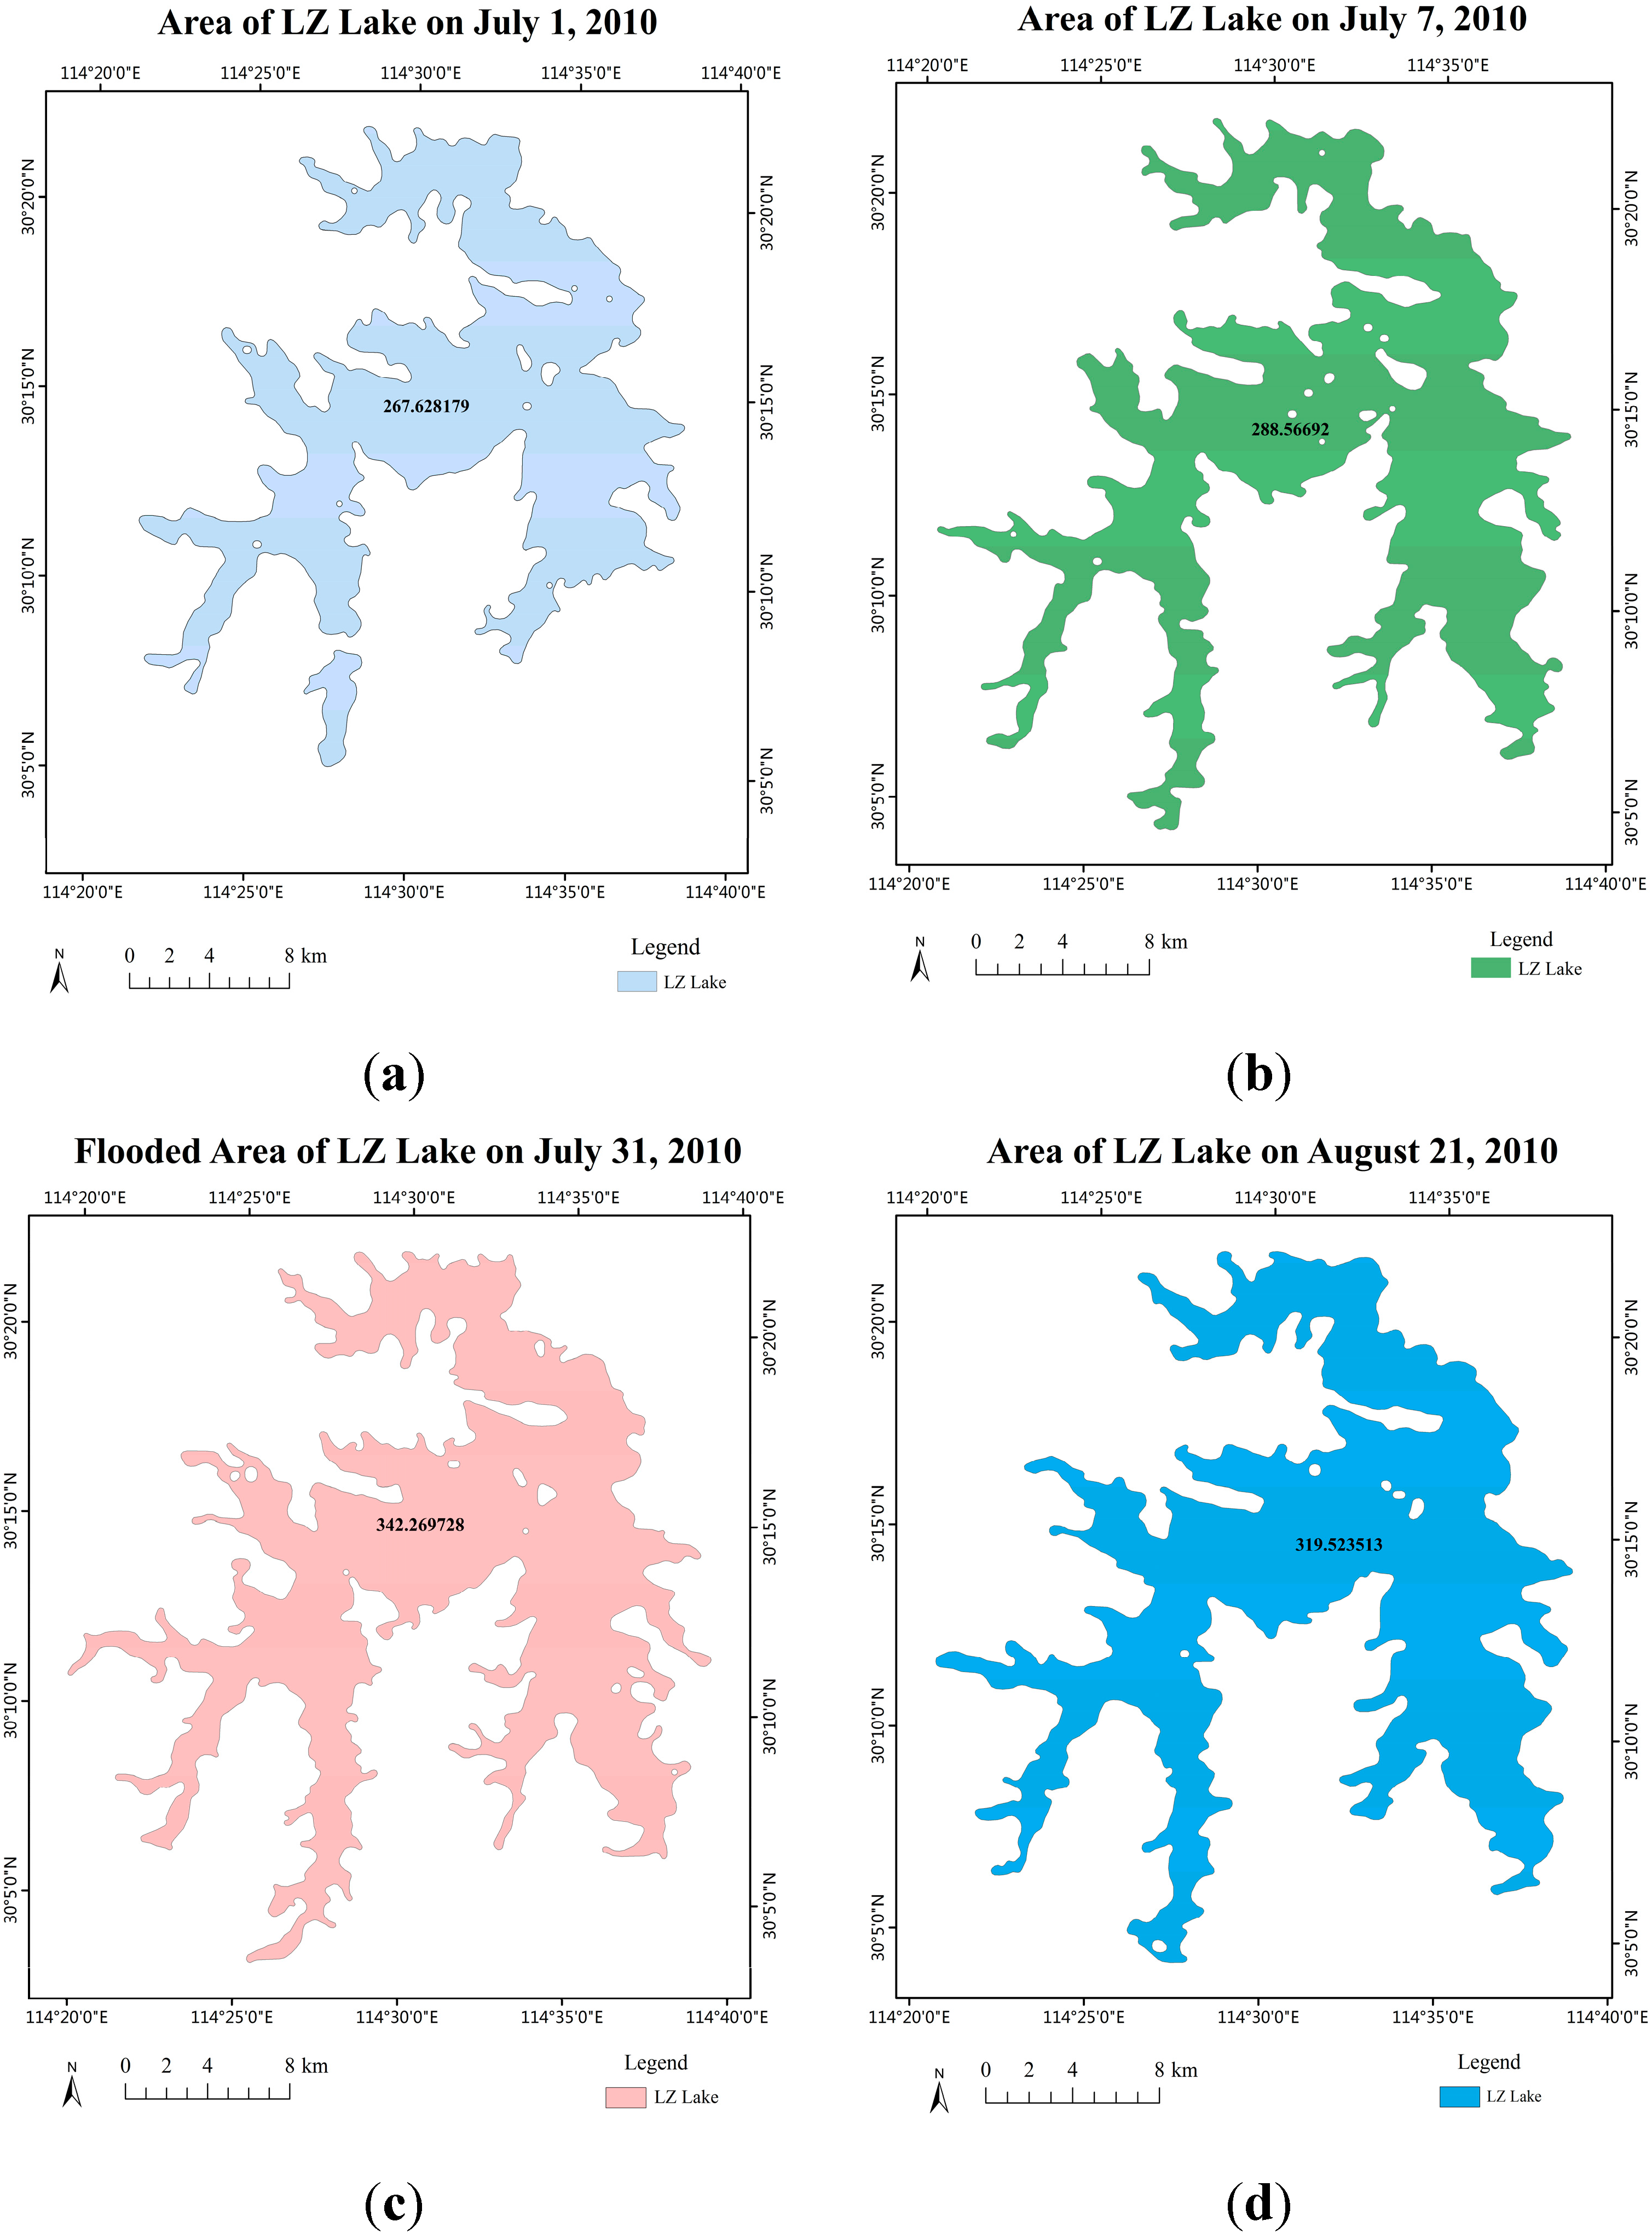
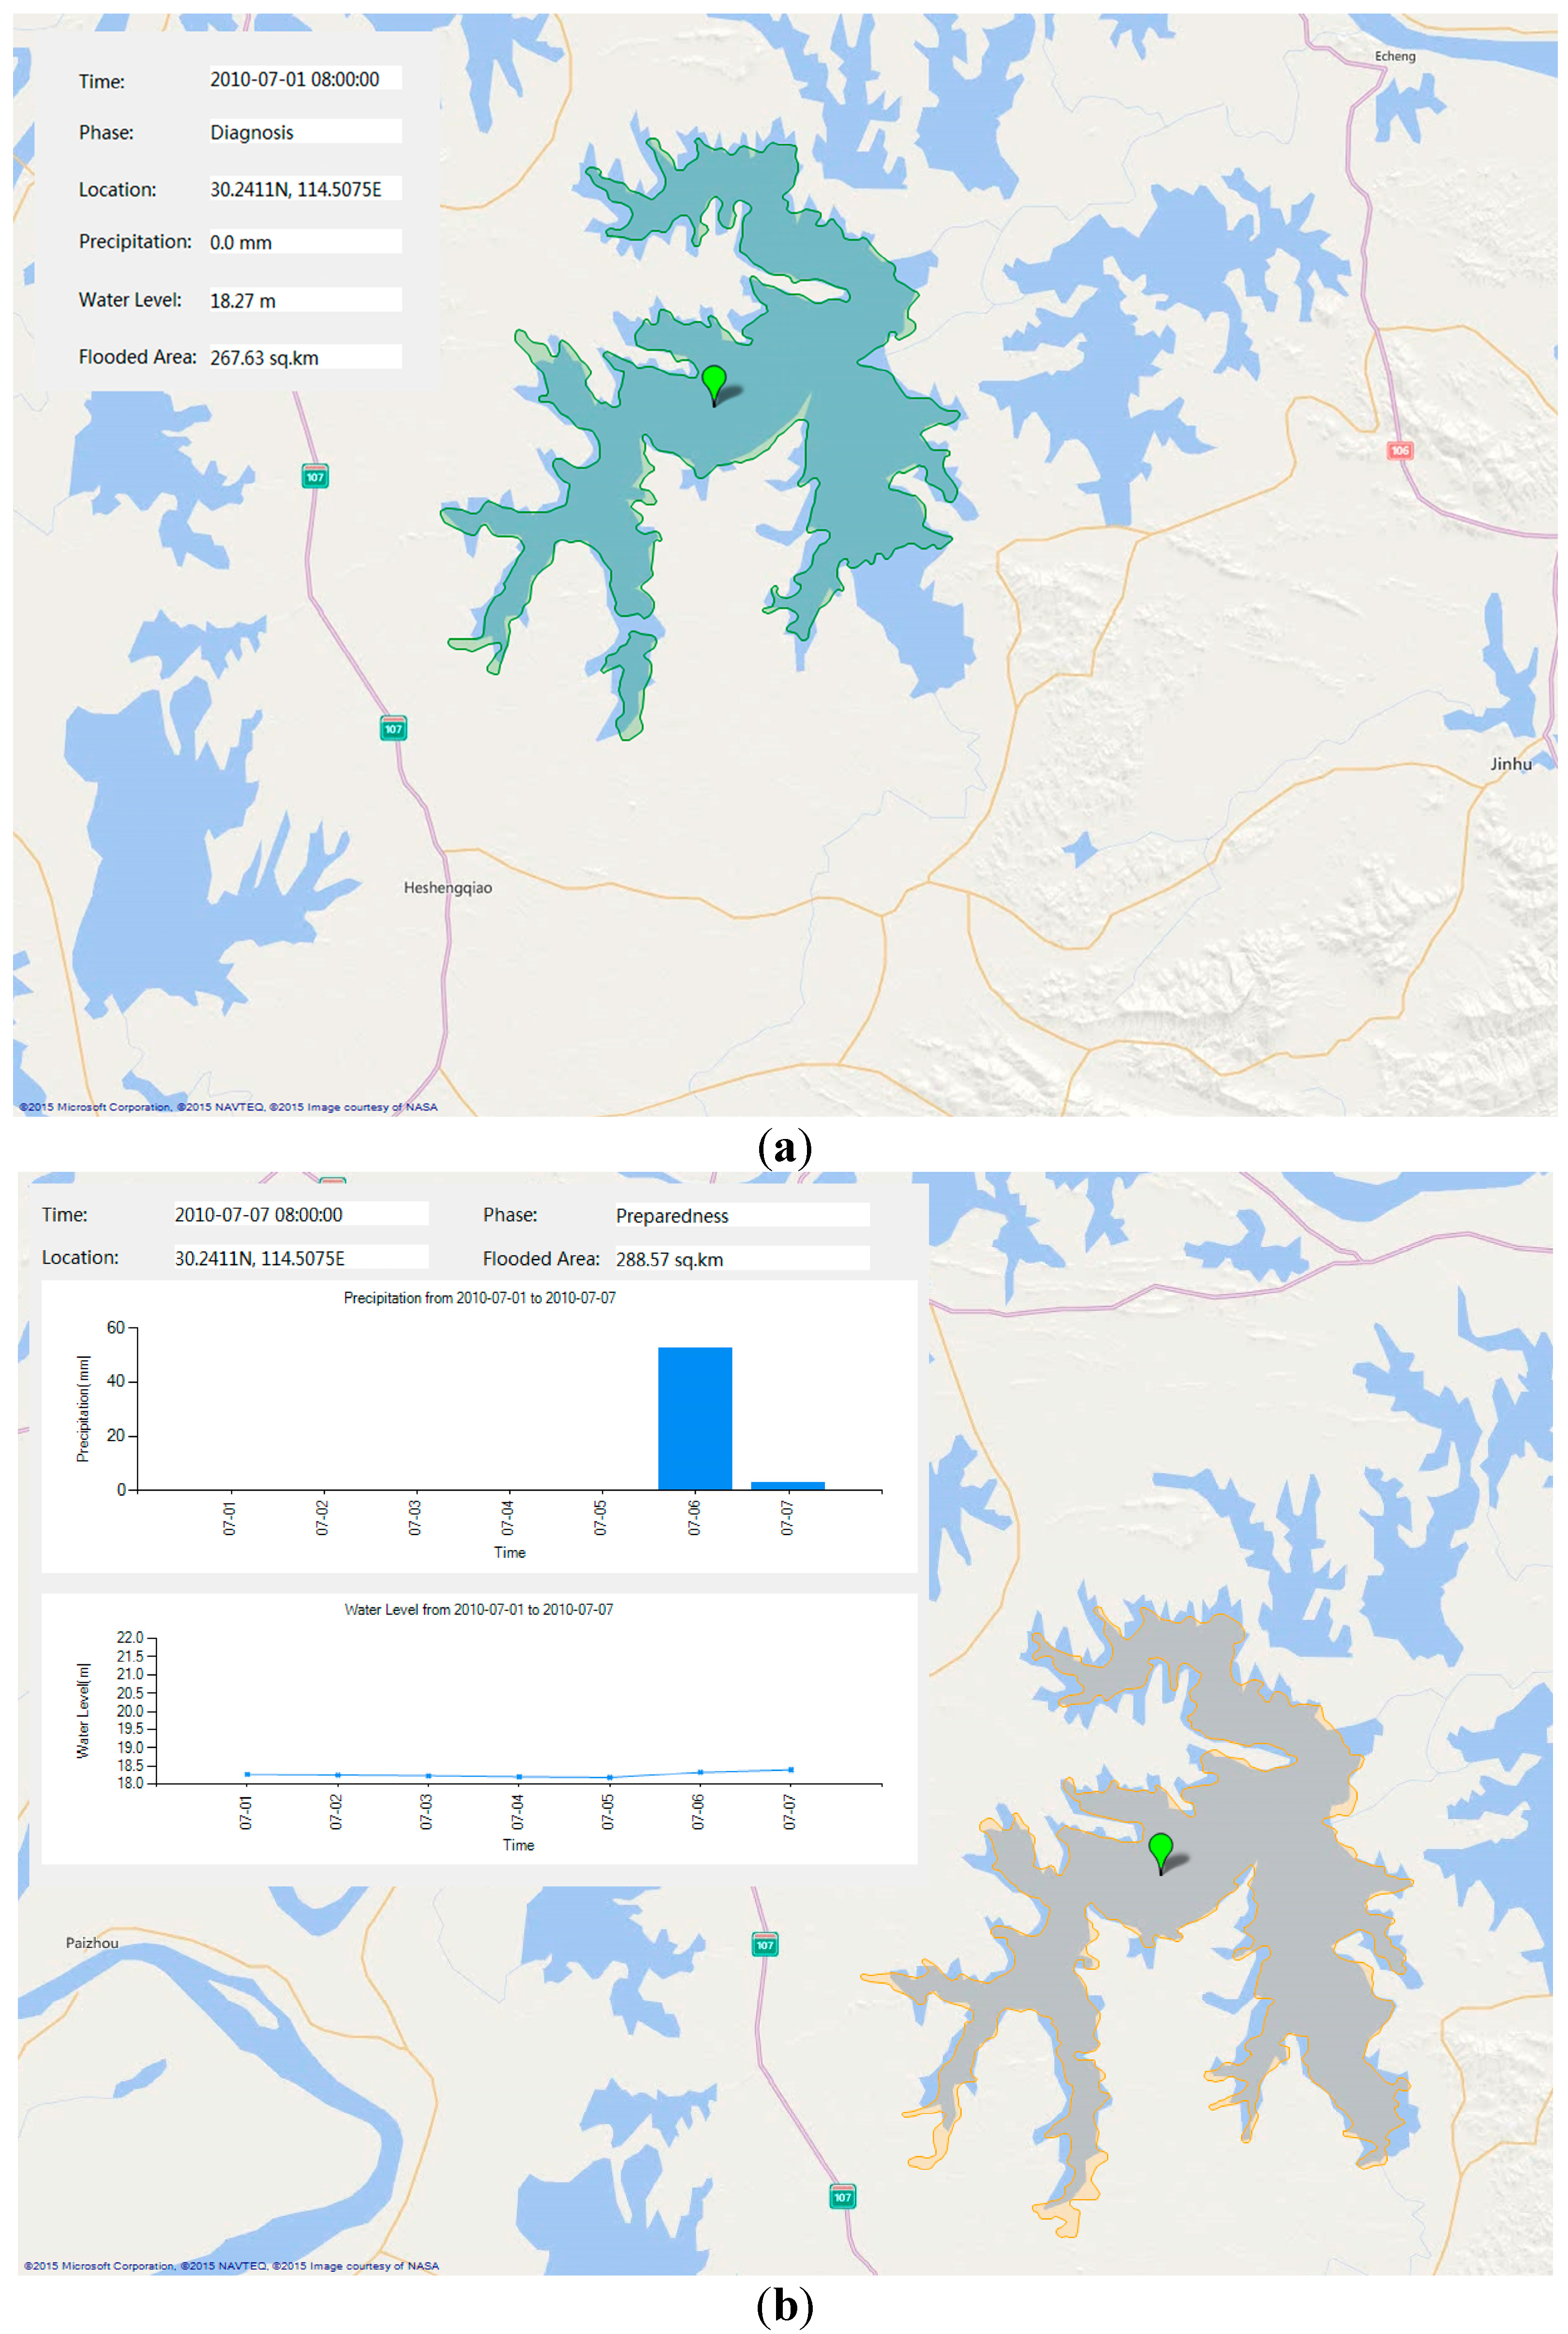
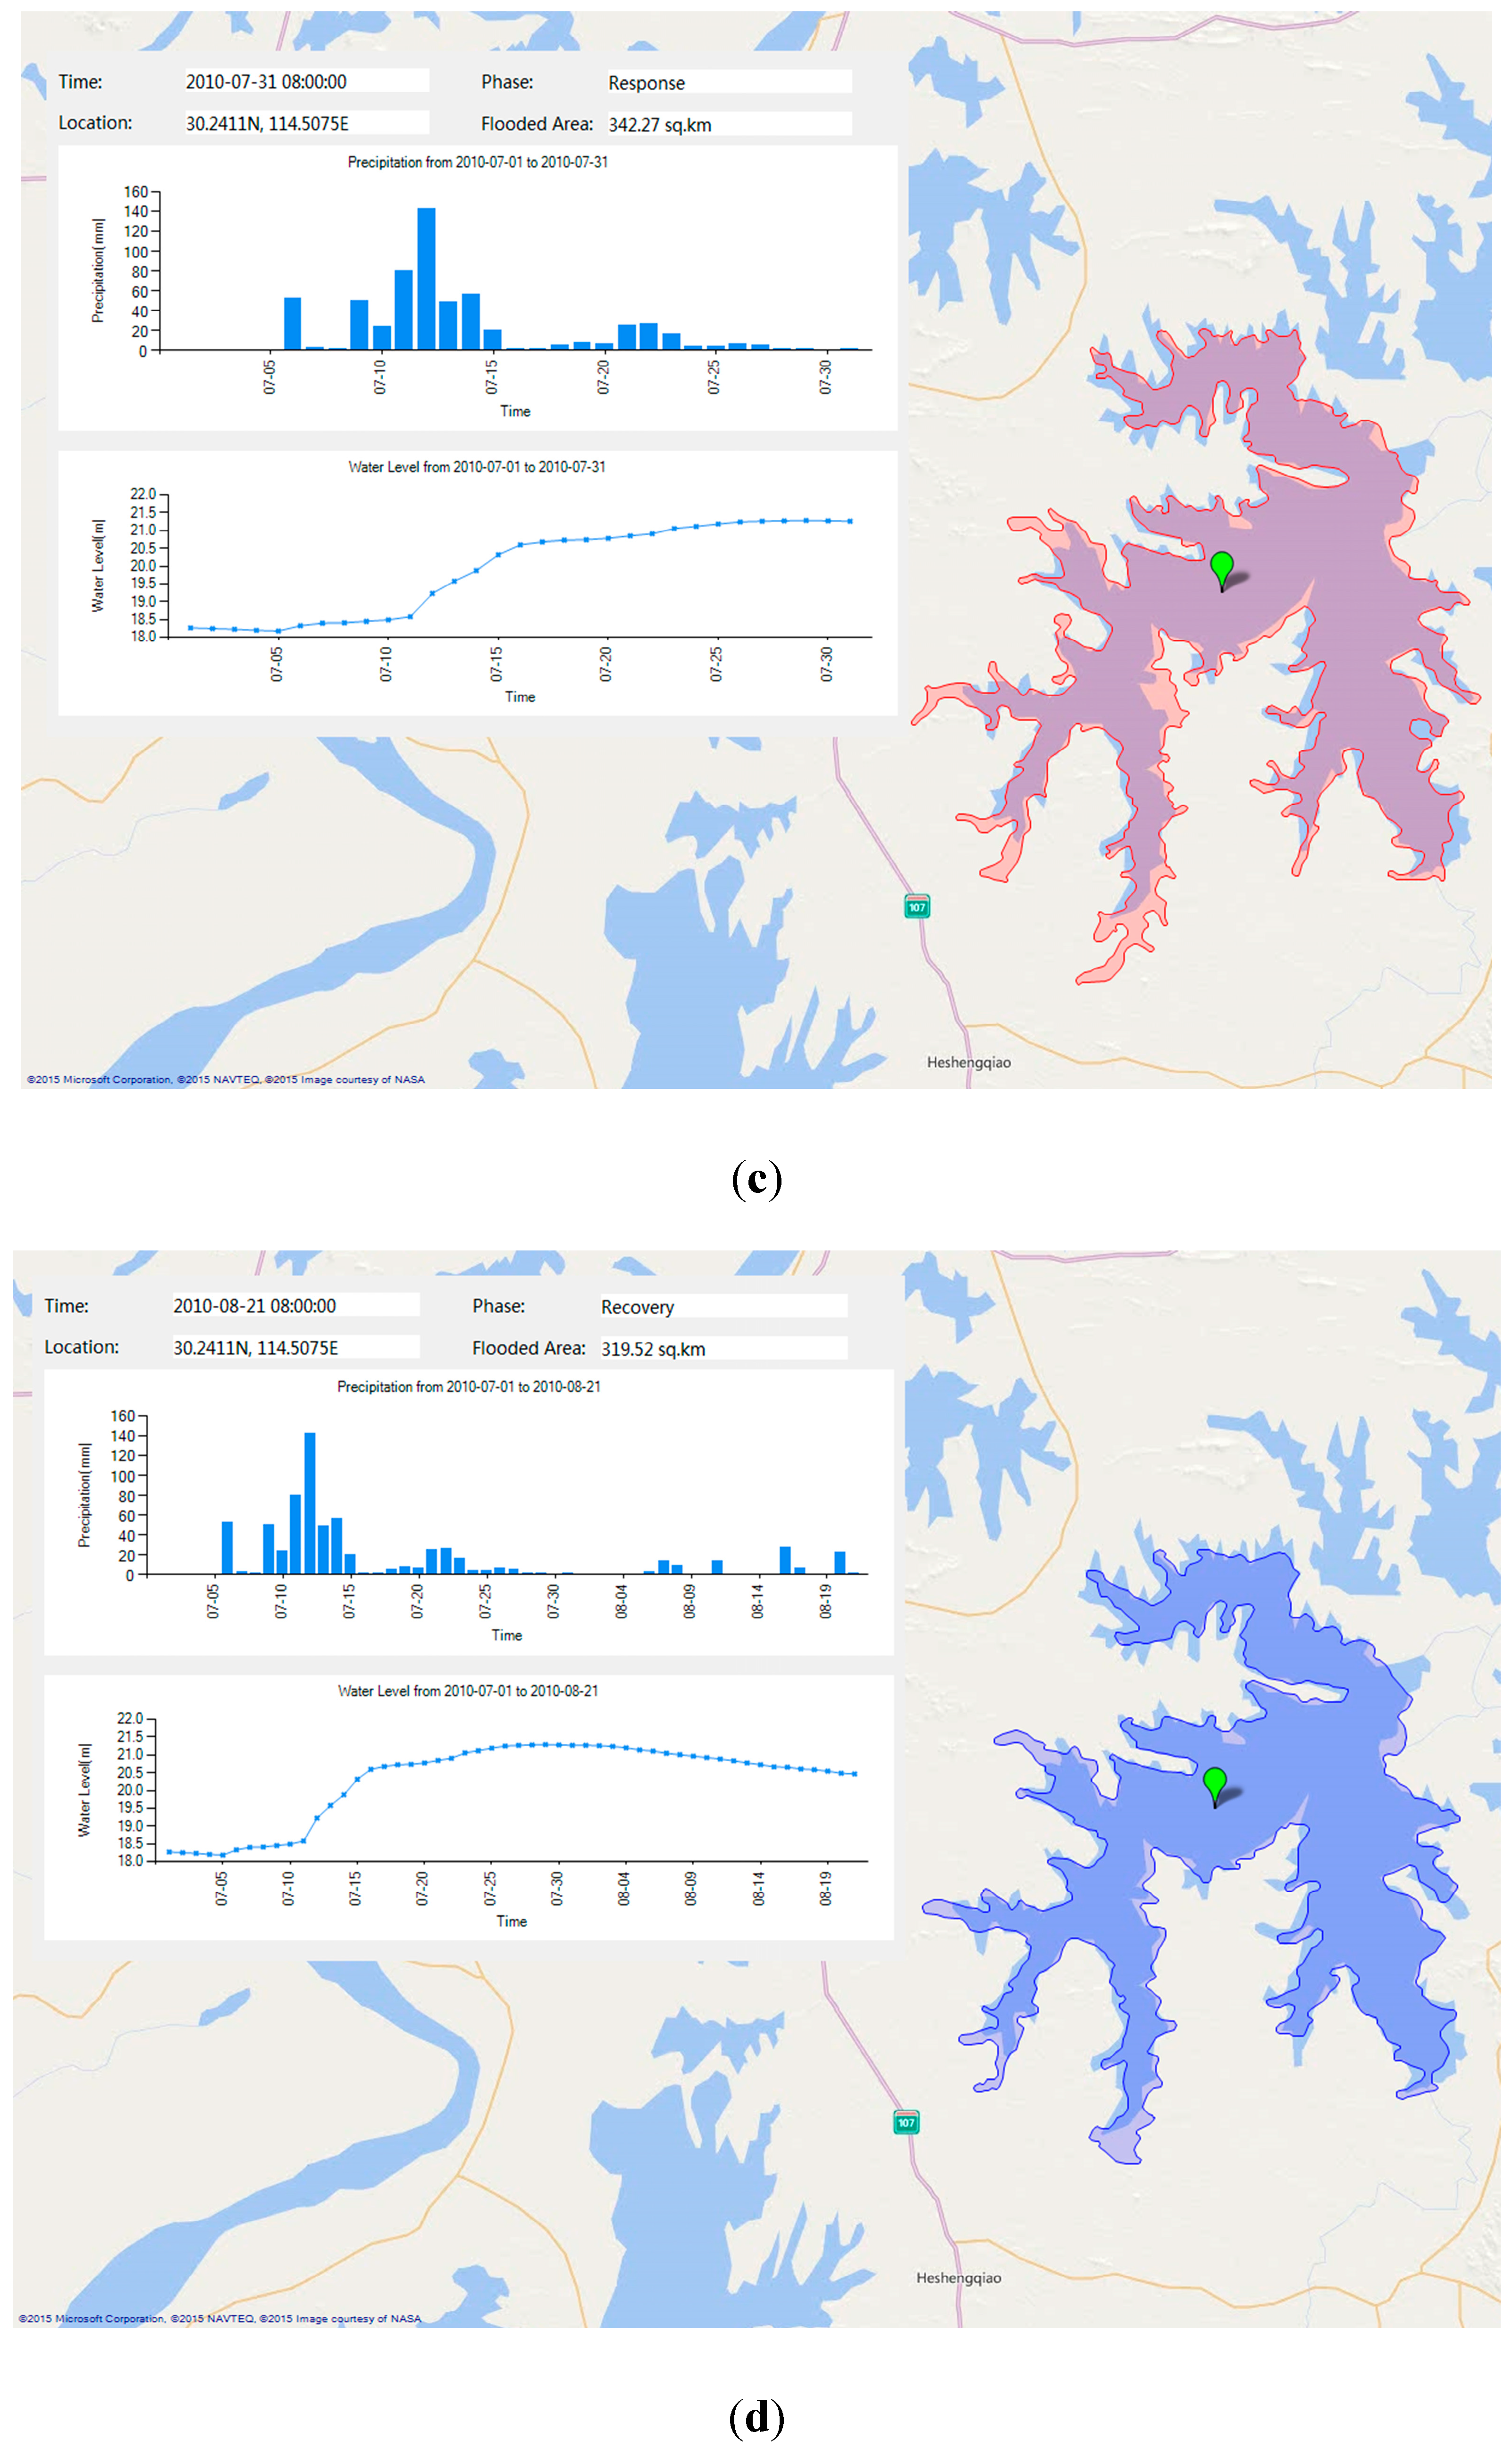
4.1. LZ Lake Flood Scenario

LZ Lake is located in the southeastern part of Hubei province, and it is one of the largest freshwater lakes in Hubei province, with the lake area of approximately 280 km2 and the drainage area of 3260 km2. There are a variety of plants and fishes in the LZ Lake, and it is of great ecological significance to the surrounding areas. The LZ Lake summer flood event occurring between 1 July 2010, and 31 August 2010 has been the largest flood since 1998. The flood caused the death of a large number of animals and plants, and significantly damaged its ecological environment. Thus, the flood was chosen as the experiment object.

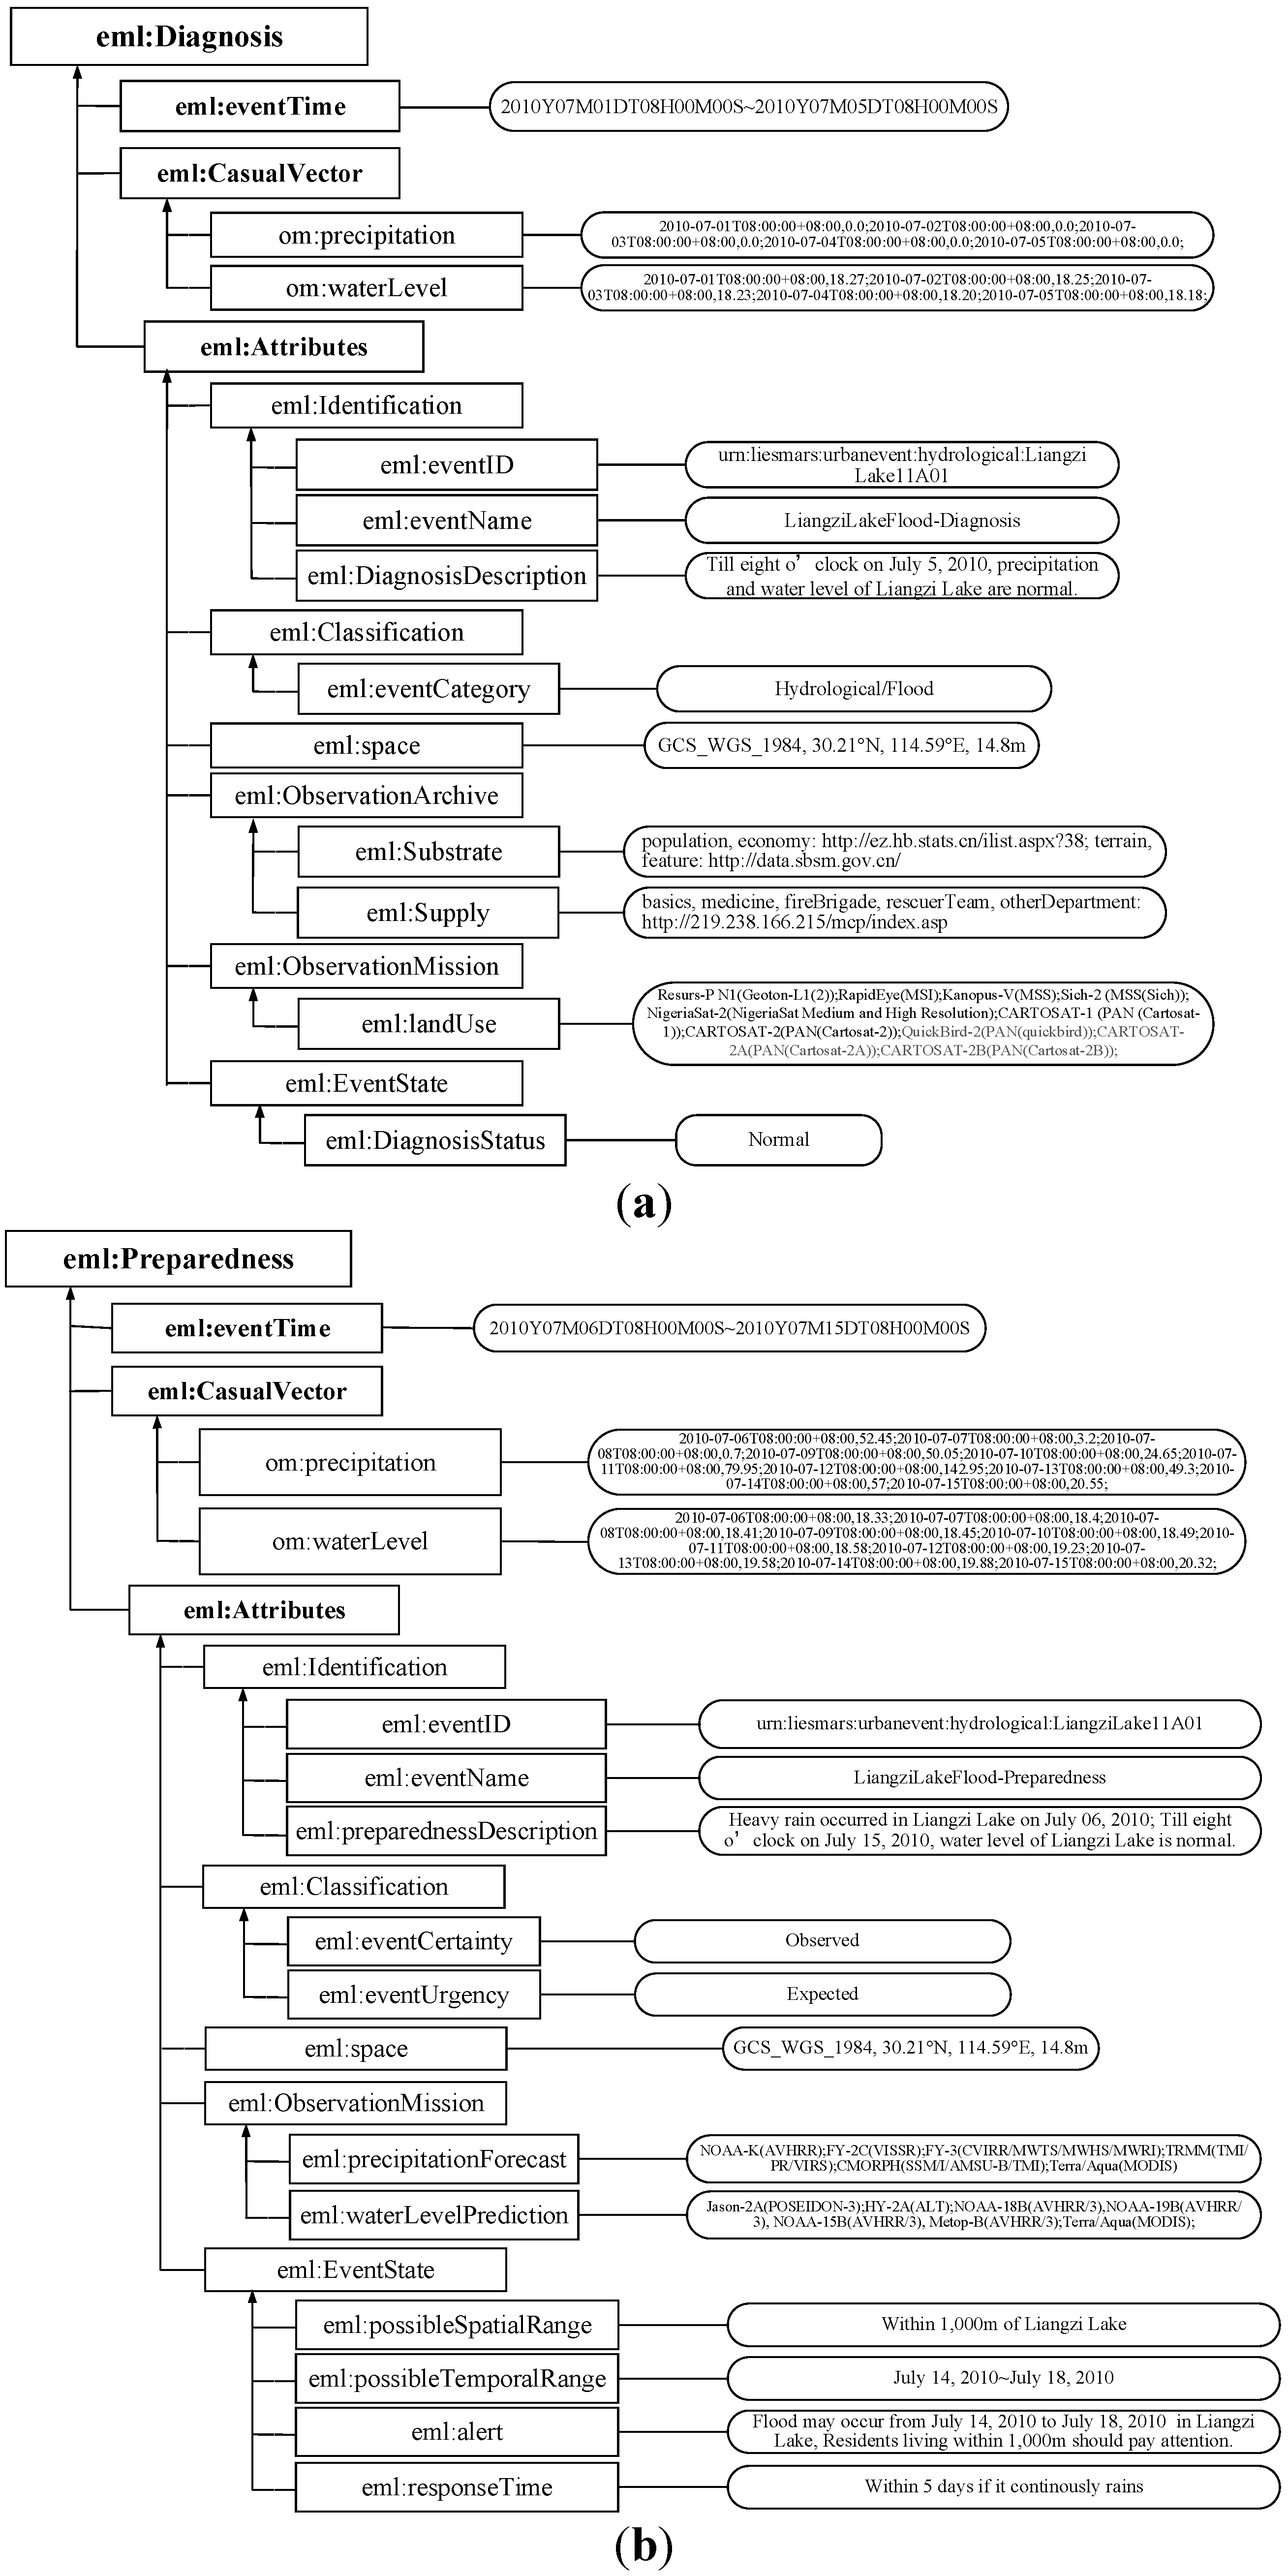
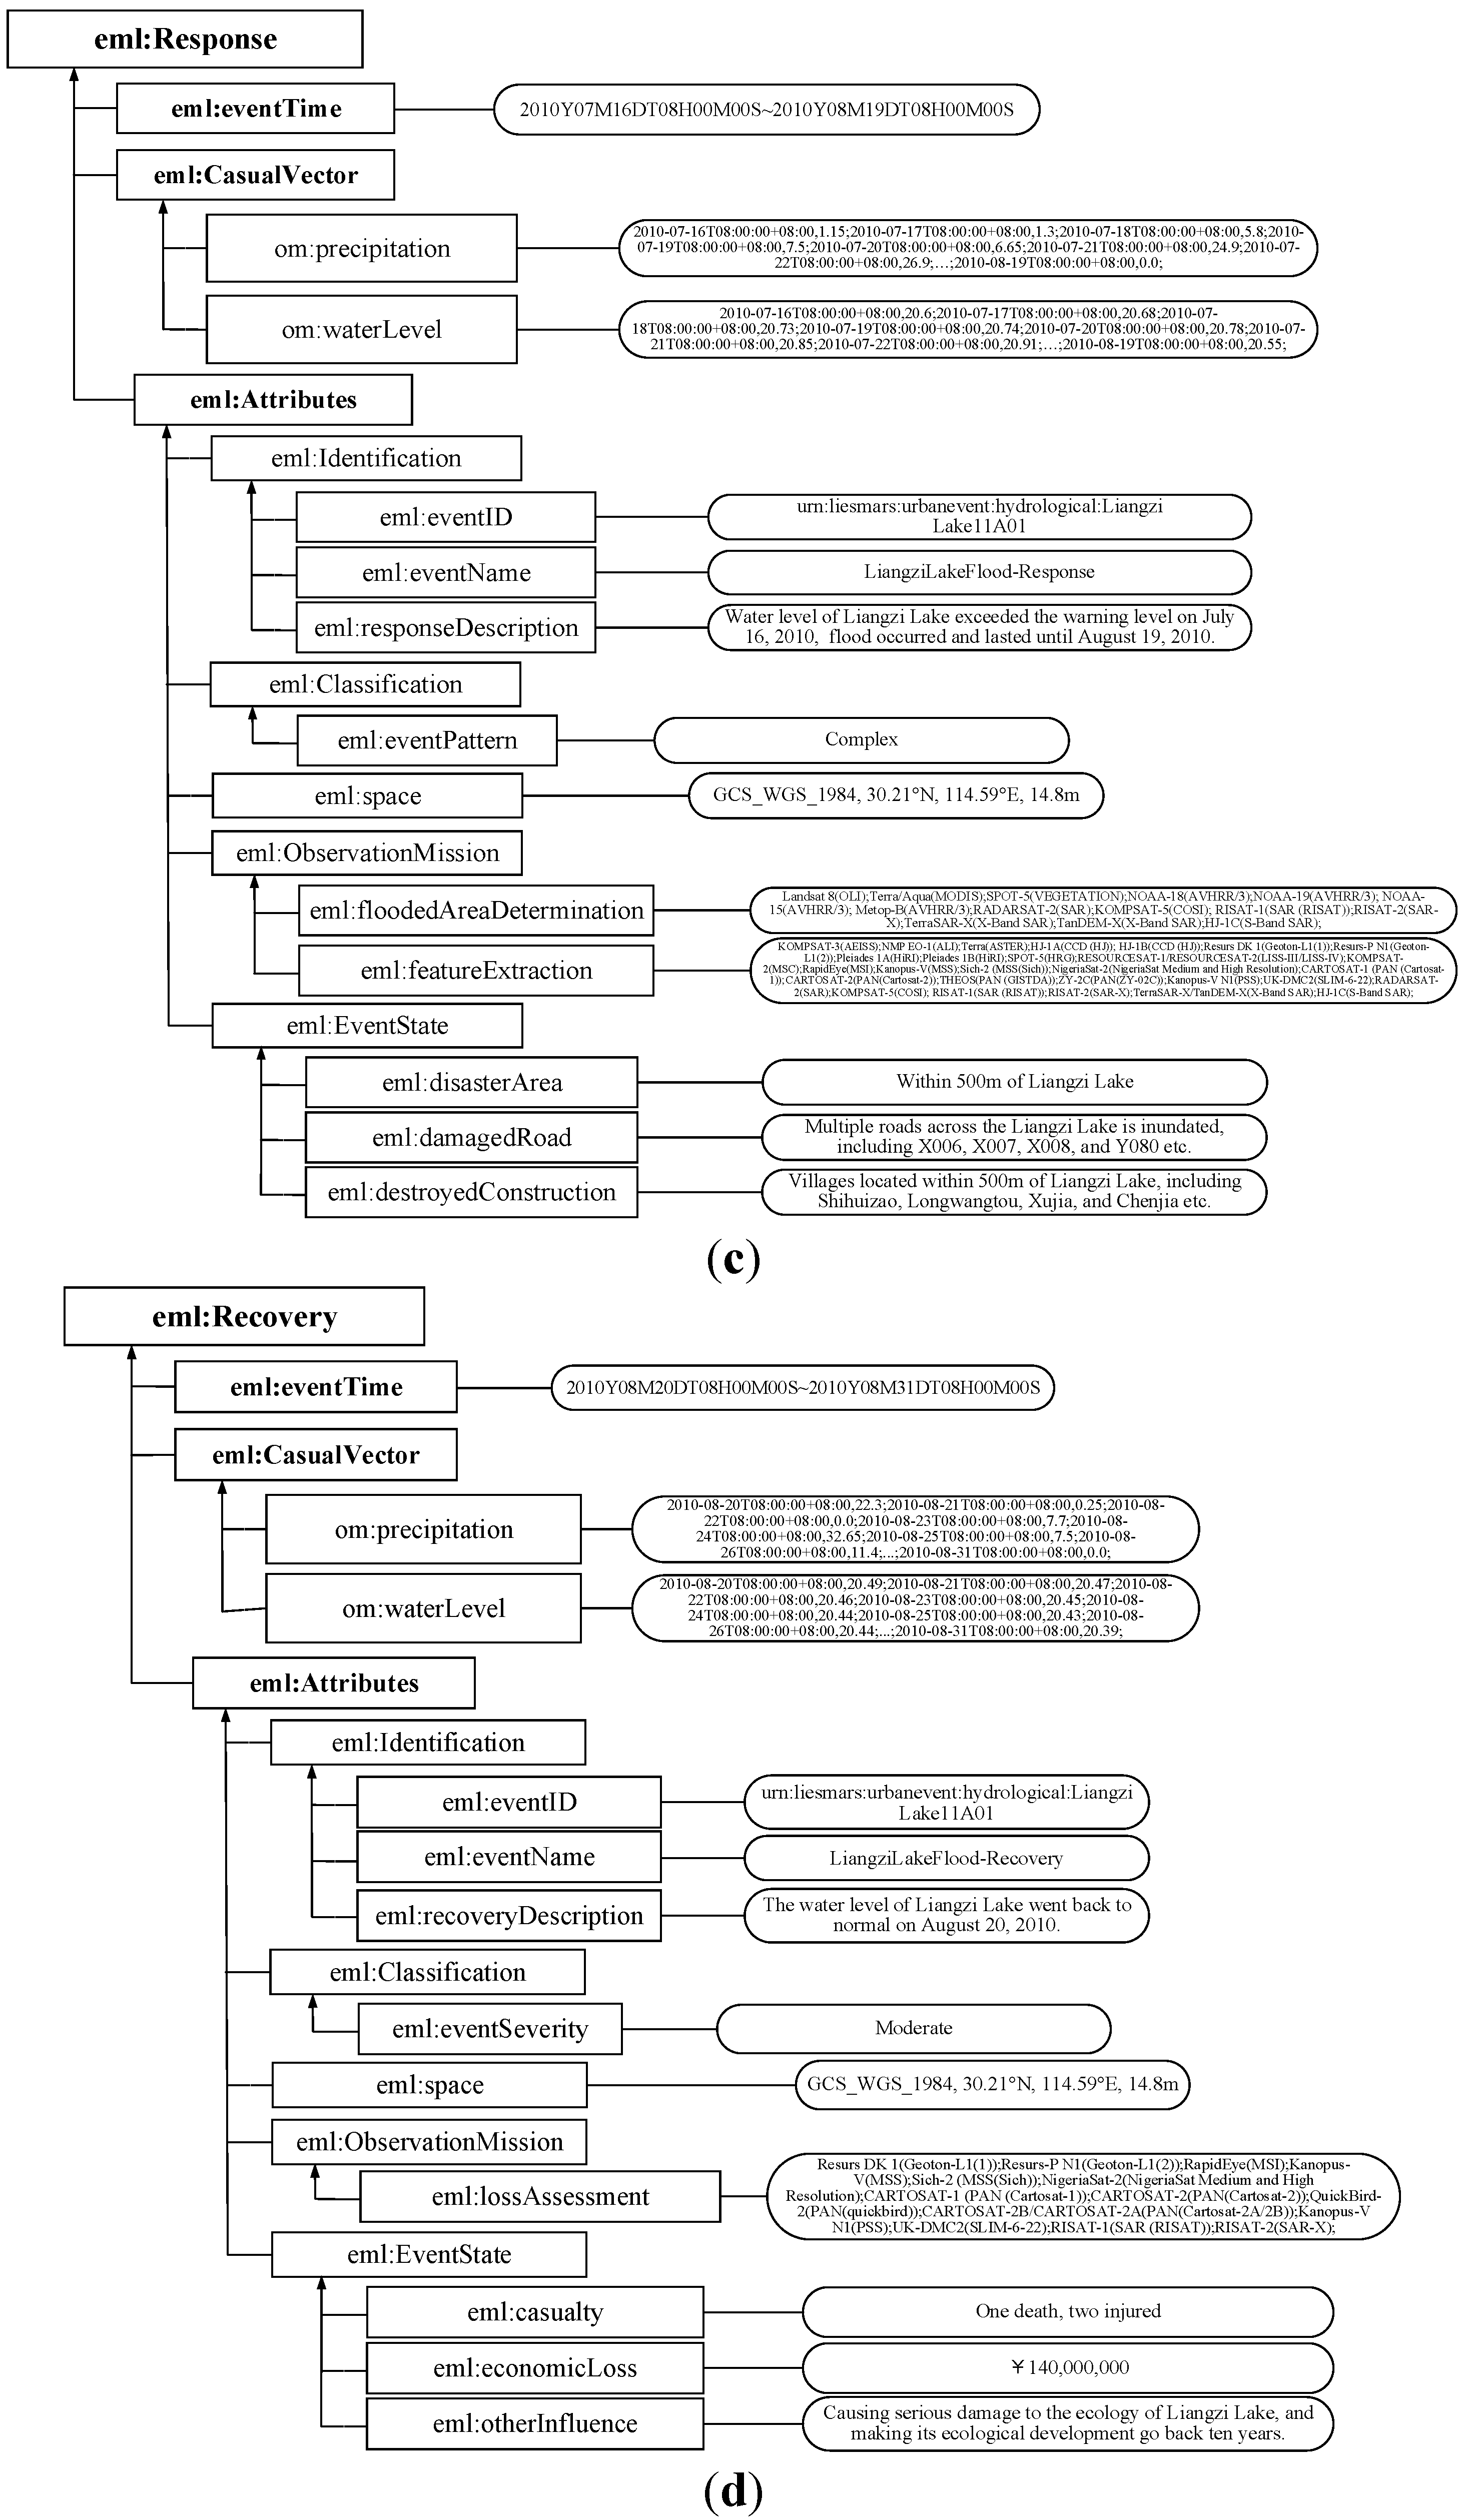
4.2. Phase-Based LZ Lake Flood Event Modeling

For floods, precipitation and water level are the direct disaster-inducing factors, thus precipitation and water level are the casual vectors of the LZ Lake summer flood. During all the four stages of the LZ Lake flood modeling, the precipitation and water level monitoring sensors in the LZ Lake area are accessed into the sensor observation service [36], after that the real-time rainfall and water level are acquired through the GetObservation request, and then the observations are put into the values of casual vectors in the metamodel. At the same time, the space and time values of the water level observations are automatically passed into the spatio-temporal attributes of the metamodel. Every time a new datum enters, the beginning time remains the same, while the space and ending time values are refreshed.
On 1 July 2010, firstly, the precipitation, 0 mm, and the water level, 18.27 m, are obtained and recorded in the casual vectors of the metamodel, and the starting time, 1 July 2010 08:00:00, the ending time, 1 July 2010 08:00:00, and the space information, 30.21°N, 114.59°E, 14.8 m, are automatically filled; Secondly, event ID, name, description, and classification information are added; Thirdly, the RS data which is archived for land use is written into the value of the mission, and the status, normal or abnormal, is determined; Fourthly, the contact and service information are filled. After the information is all filled, clicking on the confirm button, then the modeling result will be registered in the registration center. The information of the next days are added or modified based on the registered result. Till 5 July 2010, the precipitation and water level of LZ Lake were normal. The daily accumulated precipitation of the LZ Lake reached 52.45 mm on 6 July 2010, which went beyond the rainstorm warning threshold of 50 mm, indicating the end of the diagnosis phase. Thus, the diagnosis stage of the LZ Lake flood lasted from 1 July 2010 to 5 July 2010. In the diagnosis phase, the LZ Lake area of 1 July is acquired through the moderate resolution imaging spectroradiometer (MODIS) aboard the Terra satellite and recorded in FLNDEMF to serve as a contrast to possible flooded areas in the future. The area of the LZ Lake on 1 July 2010 and the modeling interface of the diagnosis phase are presented in Figure 8a and Figure 9a, respectively.
Figure 8. Areas of LZ Lake in different phases. (a) Area of LZ Lake on 1 July 2010 (Diagnosis phase); (b) Area of LZ Lake on 7 July 2010 (Preparedness phase); (c) Flooded area of LZ Lake on 31 July 2010 (Response phase); (d) Area of LZ Lake on 21 August 2010 (Recovery phase).
Remotesensing 07 07231 g008
Figure 9. Modeling results of different event phases of the LZ Lake flood in 2010. (a) Diagnosis modeling result; (b) Preparedness modeling result; (c) Response modeling result; (d) Recovery modeling result.
Remotesensing 07 07231 g009aRemotesensing 07 07231 g009b
Precipitation on 5 July 2010 triggered the rainstorm alert, and it was the start of the preparedness stage. Values of casual vectors were updated as mentioned above. Event ID and name were inherited from the diagnosis stage. The beginning time is the time when the precipitation went above the alert rainfall value, and the location and the ending time are updated with the real-time water level data. The description reads that the daily-accumulated rainfall exceeds the rainstorm alert threshold, and the people living in the neighborhood of LZ Lake should prepare. The goal of the preparedness stage is to predict the possible spatio-temporal range of the event and to send an alert. There are mainly two missions that RS could accomplish to provide support for mission completion. One mission is to predict future precipitation, while another is to forecast the water level changes. As in the diagnosis phase, with the assistance of the SGP4 model and the knowledge base, useful sensors are rapidly discovered, state information is acquired, and the sensors are recorded in the metamodel for further reference. After all the information is filled, the modeling result can be registered in the registration center by clicking on the confirm button. The information on the following days will be added or modified on the registered result until the event goes into another phase. The water level values of LZ Lake are all below the warning water level from 5 July 2010 to 15 July 2010. Then this time period is identified as the preparedness phase. The areas of LZ Lake are interpreted from satellite images every several days in this phase to understand the expansion of the lake. In this phase, under the guidance of FLCNDEMF and taking our data availability into consideration, the MODIS image of 7 July 2010, is selected to calculate the area of LZ Lake. The area of LZ Lake on 7 July 2010, which is acquired from the MODIS image, is presented in Figure 8b. After all the necessary information is obtained, the modeling result of the preparedness phase is formed, and it is displayed in Figure 9b in this paper.
The water level on 16 July 2010, increased to 20.6 m, exceeding the alarm value of 20.5 m, after which the flood passed into the response stage. In this phase, the precipitation and water level data were acquired as in the diagnosis and preparedness phases. The ID and name were inherited from the diagnosis and preparedness stages. The beginning time was the time when the water level went above the alert water level value, and the location and the ending time were updated with the real-time water level data. The description shows that the water level exceeded the alert value, flooding occurred in the LZ Lake area, and the government department should try to rescue people and possessions. The missions were completed with the assistance of the knowledge base, and the state information was obtained and documented in the metamodel. The information registration and supplement are the same as the diagnosis and preparedness phase. The water level values are all above the warning water level from 16 July 2010 to 19 August 2010. Then this time period is identified as the response phase. The areas of LZ Lake are interpreted from satellite images every single day in this phase to sense the area changes of the lake in real time. Here the flooded area of LZ Lake on 31 July 2010, which is interpreted from the MODIS image, is shown in Figure 8c. The modeling result of the response phase is formed and displayed in Figure 9c after all the necessary information is obtained.
The water level on 20 August 2010, decreased to 20.49 m, lower than the alert value of 20.5 m, after which the LZ Lake flood ended and entered the recovery phase. In this phase, the precipitation and water level data are still obtained to monitor the recurrence of floods. The ID and name were inherited from the diagnosis, preparedness, and response stages. The beginning time was the time when the water level fell below the alert water level value, and the location and the ending time were updated with the real-time water level data. The description shows that the flood in the LZ Lake area ended. The major goal of the recovery stage is damage evaluation. RS techniques could help in this phase by providing high-spatial-resolution images to realize feature extraction. The extracted features can be compared to the original feature information to implement damage evaluation. The missions and sensors that are used in their accomplishment are archived, and stated information is complemented. The full life cycle of disasters is a closed loop, and the recovery phase of this flood is often the diagnosis phase of another one in real disaster situations. In this paper, to check whether the flood threat has been completely eliminated, we observe for another few days and artificially define the recovery phase of the LZ Lake flood as the time period from 20 August 2010 to 31 August 2010. The flooded area of LZ Lake on 21 August 2010 is interpreted from the satellite image and shown in Figure 8d as a comparison to that of other three phases. The modeling result of the recovery phase is formed and presented in Figure 9d after the information needed is acquired. The modeling results of all these four phases are combined together at the end of this flood to form a complete event representation file for archiving and future references.

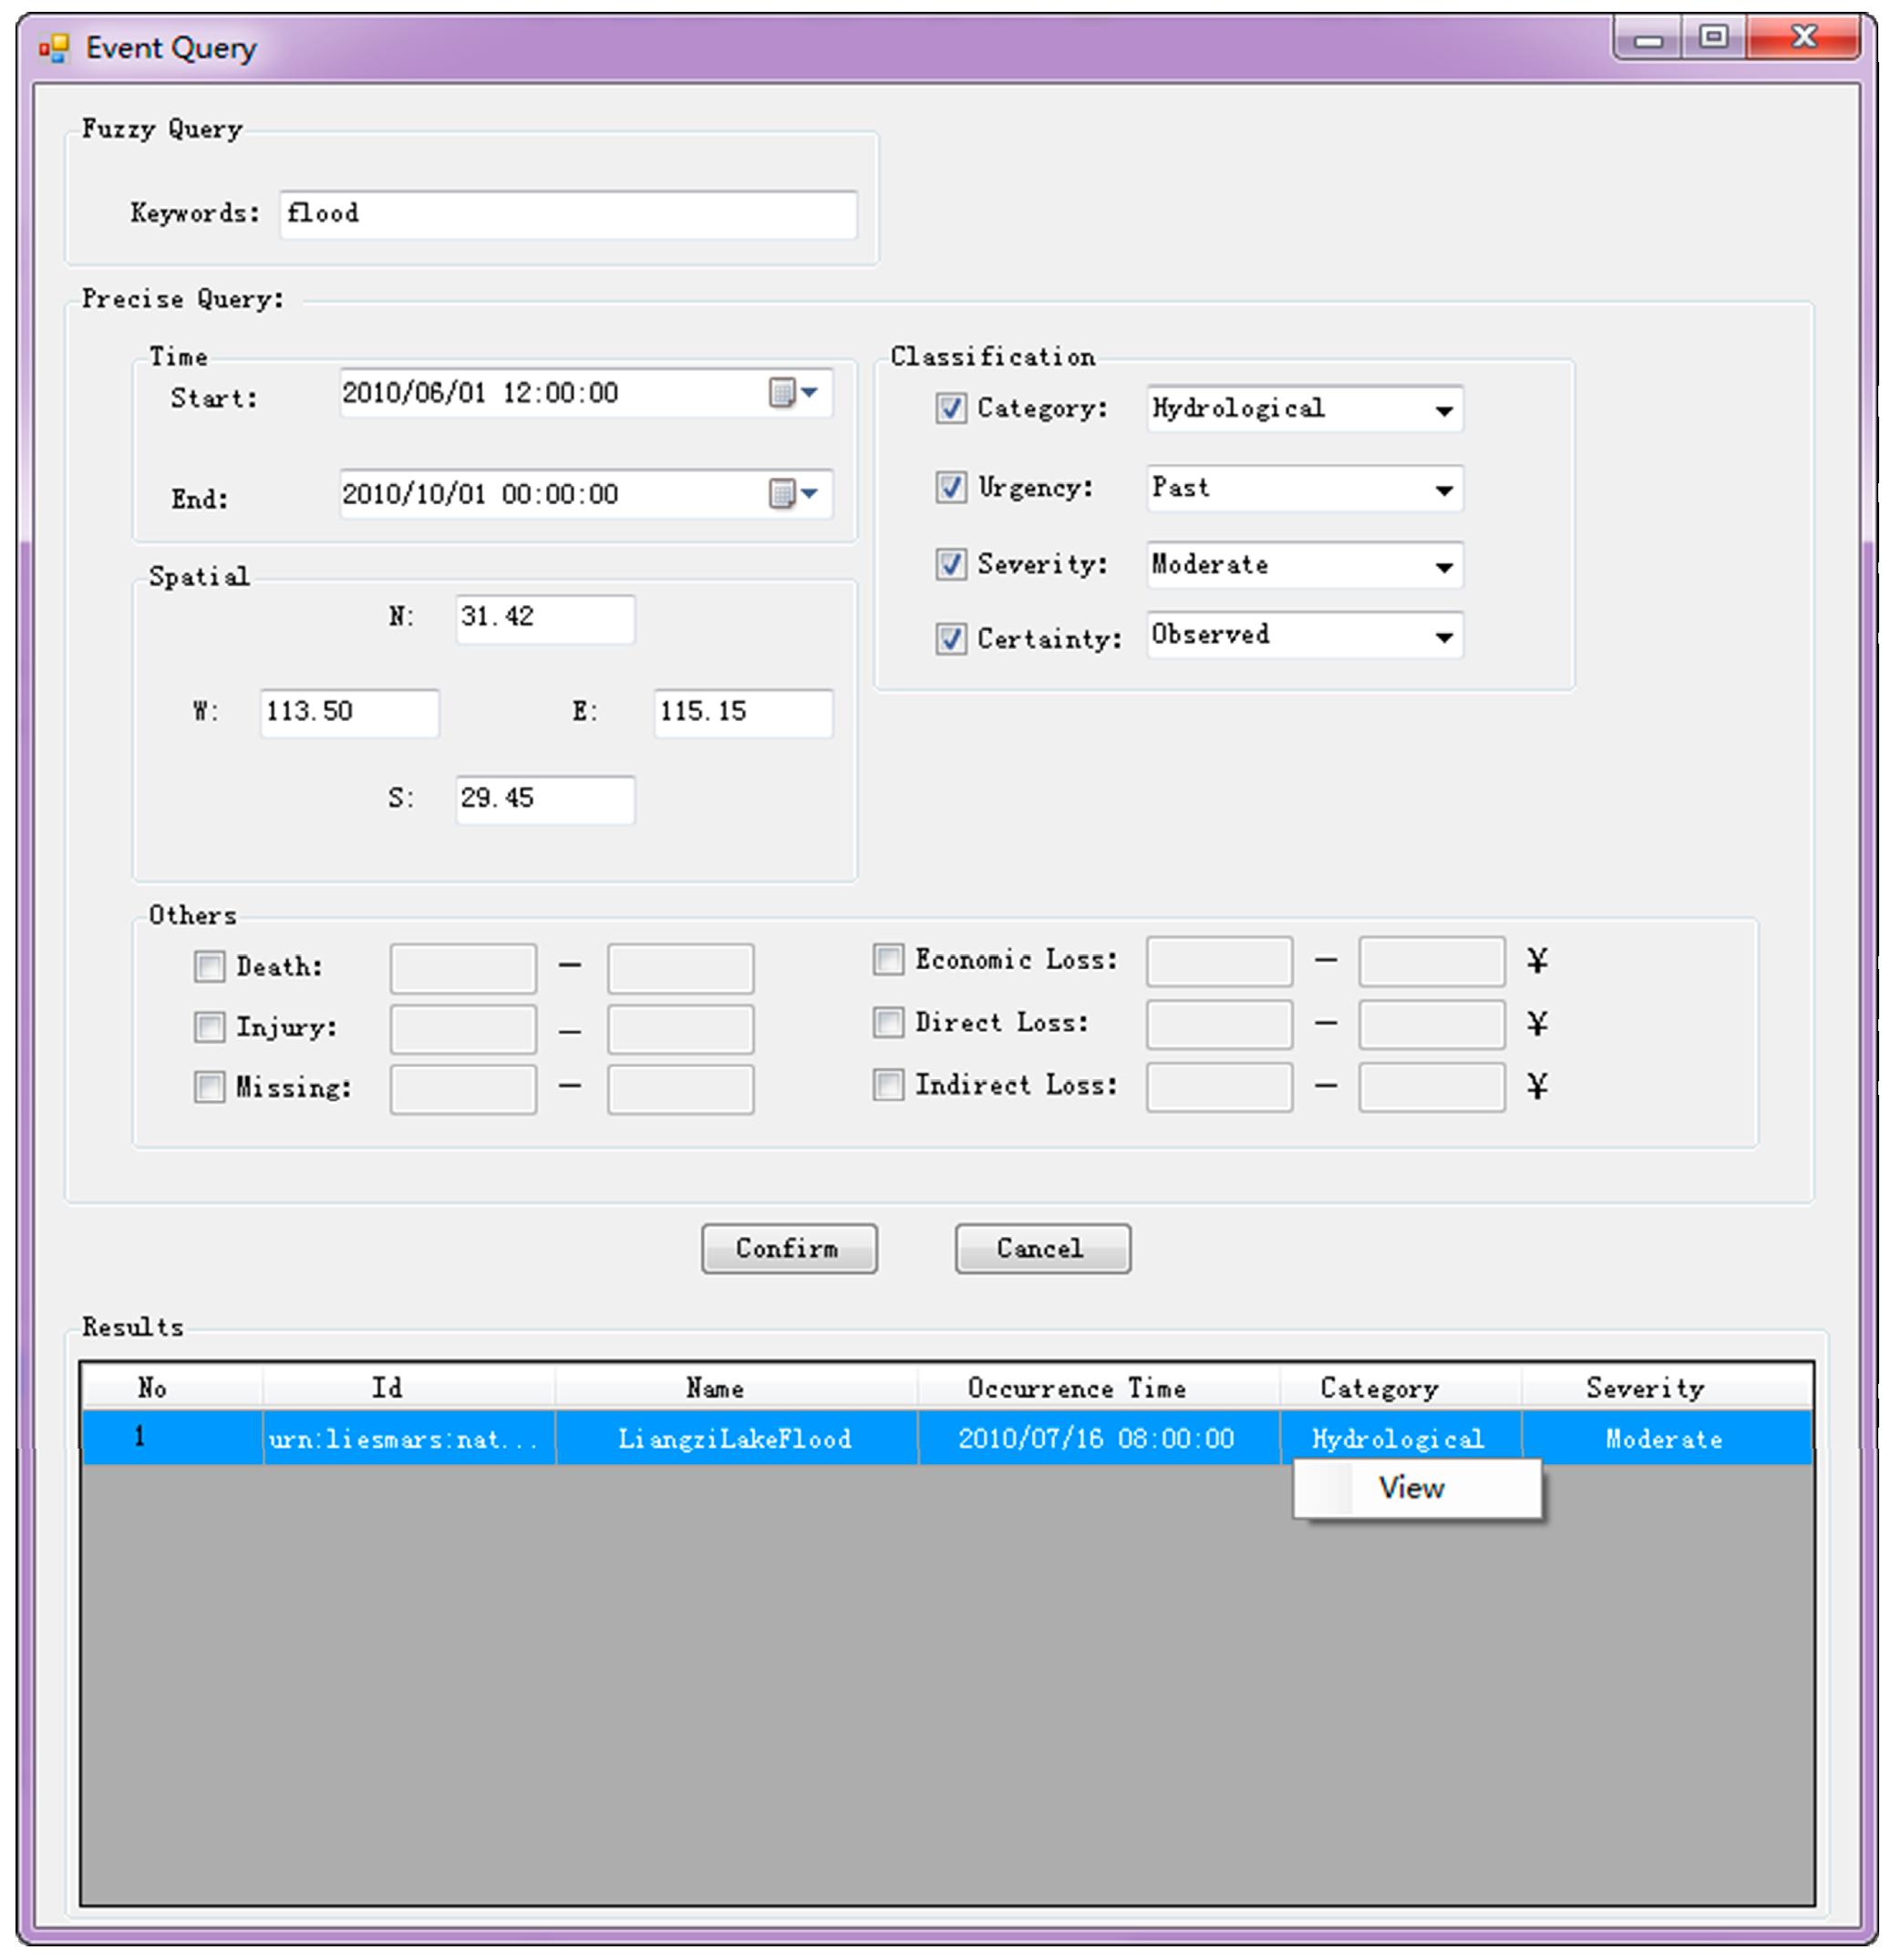
4.3. Flood Process Registration and Query

The phase-based event modeling results are registered in category service for web (CSW) [37] and managed by the registration center. Event query is implemented based on the interface that is provided by the registration center. Event information discovery can be realized by fuzzy query, precise query, single query, or combination query. Fuzzy query inputs key words and gets the results of an ambiguous match. Precise query finds a certain event according to the precise match of query parameters, and query parameters include space, time, category, and other event attributes. Single query means only using a parameter to search for an event, while combination query uses multiple parameters to look for a specific event. When inputting the space and time information of the LZ Lake flood, the query result is shown in Figure 10.
Figure 10. Query result when inputting the space-time information of LZ Lake.
Remotesensing 07 07231 g010

4.4. Flood Process Visualization

The basic function of the LZ Lake flood process visualization is to display the real-time changes of precipitation, water level, and flooded area during the four phases on the map, and to help decision makers to clearly understand the event situation. 1 July, 7 July, 31 July, and 21 August are selected as the representatives as the diagnosis, preparedness, response, and recovery phase, respectively. They are all real-time images, and can be helpful in the LZ Lake flood prediction or responding. Extracted water bodies are overlaid on the map in all the four figures, and flooded areas are shown alongside. The precipitation and water level are shown as the single point in the diagnosis phase because 1 July is the first day of the LZ Lake flood and there is no more data available. While the precipitation and water level in other three stages are displayed in the form of curve in order to help users gain an intuitive understanding of the changes of precipitation and water level.
In the diagnosis phase, as shown in Figure 11a, flooded area image are overlaid, and values of precipitation, water level and are shown on the map. The threshold for the water level is 20.5 m, while that for precipitation is 50 mm. The thresholds are all predefined in the modeling software. On 6 July 2010, when the precipitation passed beyond the threshold, the state, which is used to indicate whether the precipitation value is normal or not, became abnormal, and the event passed into the preparedness stage. Figure 11b presents the visualization of the real-time observations of the preparedness phase. They can be used as the input of predicting models, and can be combined with other information, such as the land use, or the demographic and economic statistics data, to deduce the possible flood scope and impacts, or to work out the feasible evacuation plan, etc. In the response phase, the real-time precipitation curve, water level curve, and flooded area are demonstrated on the map for decision makers to intuitively observe where the disaster occurred. When the flooded area is overlaid with the distribution map of roads, constructions and other land features, where the possible crowd is located, and how to travel to the crowd location can be quickly determined. Meanwhile, the flooding area dynamically changes over time, which may indicate the shift of the rescue focus and whether reinforcement is needed. The visualization interface of the response stage is presented in Figure 11c. The focus of the recovery phase is to perform damage assessment and conduct daily monitoring to prevent future floods. The flooded area of this phase is shown on the map in Figure 11d to indicate the approximate scope for damage assessment. The curves of precipitation and water level are also displayed for predictive monitoring.

5. Discussion

FLCNDEM proposed in this paper, can on one hand, provide all-stage dynamic information support for NDE, and on the other hand, assist in efficient disaster information management. FLCNDEMF, as the flood application of FLCNDEM, can be extended to other environmental applications. How to use FLCNDEM in all-stage dynamic information support and efficient information management of disasters, and what should be done when extending FLCNDEMF to other environmental applications, are discussed in detail in the sections followed.
Figure 11. Visualization of different event phases of the LZ Lake flood in 2010. (a) Diagnosis visualization; (b) Preparedness visualization; (c) Response visualization; (d) Recovery visualization.
Remotesensing 07 07231 g011aRemotesensing 07 07231 g011b

5.1. All-Stage Dynamic Information Support for Disasters

The current disaster event representation models are often static models that serve mainly for post-event archives and cannot provide dynamic information support for the pre-event detection and the real-time event response. FLCNDEM proposed in this paper divides the disaster event into four phases, assigns explicit missions for different phases, represents the states of different stages, and dynamically demonstrates the emergence and development process of disasters.
The status item in the diagnosis phase is used to indicate whether the abnormality in ground observations will lead to a disaster or not, and it is the factor that determines the starting of the preparedness work. The forecasting results, including the possible spatial range and the possible temporal horizon, in the preparedness stage are able to remind decision makers of the potential events. In addition, alert information can be formed based on the predicting information, and decision makers can easily send the alert information to the public. In the response stage, through the integration of the disaster area, damaged roads and residential area information, the decision makers can know exactly where the disaster occurred, where the crowd is located, and how to access the crowd trapped in the disaster area. In the recovery phase, information of causalities, economic losses, and other influences, such as environmental damages, ecological impacts, and public psychological changes, is recorded to provide references for post-disaster reconstructions. The stage situation information can be demonstrated on the map; thus, the real-time disaster situation can be intuitively grasped and controlled.

5.2. Information Management for Disasters

In a disaster process, the data in need are mainly composed of historical data and real-time-acquired data. The historical data can be easily acquired from governmental departments, while the real-time-acquired data matter more. Due to the phase-based information that is provided in the FLCNDEM, when similar events occur, the required RS data can be efficiently discovered using the SGP4 model, the task library, and the knowledge base. In addition, when additional event instances are recorded, missions of similar events in the future can be efficiently accomplished, and the aim of timely detection, early warning, rapid response, and exact loss statistics can be achieved.
FLCNDEM proposed in this paper provide a way for event information representation and organization and completes the event mapping from the physical world to the information world. FLCNDEM not only covers the information from all event stages, but also analyzes the event missions and provides candidate dataset for the missions. Moreover, FLCNDEM is formalized by the universal EML of sensor web, allowing it to be easily combined with other sensor and data information metamodels, thereby increasing the efficiency of event planning and response.
Registration and query make event information archiving and efficient discovery possible. Until now, there was no specialized tool for event query, and just using Google chrome to find the event information can be frustrating. The registration and query mechanism that is implemented in this paper can be used as a specialized tool to efficiently collect, archive, and manage event information. Visualization makes the intuitive information display possible. Receiving the information from the modeling module and presenting it on the map can help decision makers gain a more clear sense of the event situation and can assist in proper decision making.

5.3. Other Environmental Applications

For other types of natural disasters, all the information is the same except for the observation part. The FLCNDEM model can be extended for applications of all types of NDE provided that the missions and states are given. New variables can be added in the casual vector and RS mission part when they are required to complete other types of NDE. In addition, new RS data sources can be extended when new satellites are launched, new processing techniques are developed, or new retrieval methods are proposed. If all NDE use FLCNDEM for modeling and management, the corresponding observation missions and candidate dataset will be recorded, which could provide important information support for the responding of NDE in the same area, and for the referencing of NDE in other areas.

6. Conclusions and Future Works

The full life cycle information sharing and data preparation for NDE are of great significance to the disaster detection, alert, response, and recovery. However, there is no way for realization, but the FLCNDEM proposed in this paper makes it possible. First, the common features of NDE are analyzed. Second, the disaster event metamodel is proposed based on the MOF framework. Third, the common missions and the RS data that can be used to complete the missions are summarized for flood events. Fourth, EML is used to formalize the event metamodel. Fifth, a modeling software is developed to implement the building of event instances. Finally, the LZ Lake flood event lasting from 1 July to 31 August is used as a case study to test the feasibility of the event metamodel, and the result demonstrates that FLCNDEM can be used for all-stage information support and data preparation for natural disasters.
However, there is still much work regarding the metamodel, such as summarizing all of the missions and RS data for different types of NDE, and performing further studies on how to efficiently combine the historical information with the information of FLCNDEM to realize early warnings, timely responses, and casualty as well as economic loss reductions. In addition, after using EML to formalize the FLCNDEM, SES can be used to perform the real-time data filtering and realize the abnormality detection. Moreover, FLCNDEM-based web and mobile applications can be developed to integrate information of multi-sources for disaster reporting and responding.

Acknowledgments

This work was supported by grants from the National High Technology Research and Development Program of China (863 Program) (no. 2013AA01A608), the National Basic Research Program of China (973 Program) (no. 2011CB707101), the National Nature Science Foundation of China (NSFC) Program (nos. 41171315, 41301441), the Fundamental Research Funds for the Central Universities (no.2042014kf0200), and the China Postdoctoral Science Foundation funded project (no. 2014M562050).

Author Contributions

Nengcheng Chen and Wenying Du conceived and designed the project. Wenying Du and Fan Song performed the experiments. Wenying Du wrote the paper. Nengcheng Chen, Wenying Du and Zeqiang Chen reviewed and edited the manuscript. All authors read and approved the manuscript.

Conflicts of Interest

The authors declare no conflict of interest.

References

  1. Guha-Sapir, D.; Hoyois, P.; Belo, R. Annual Disaster Statistical Review 2012: The Numbers and Trends; CRED: Brussels, Belgium, 2013. [Google Scholar]
  2. Lee, E.A. The past, present and future of cyber-physical systems: A focus on models. Sensors 2015, 15, 4837–4869. [Google Scholar] [CrossRef] [PubMed]
  3. Jones, E.; Botterell, A. Common Alerting Protocol (Version 1.1); OASIS: Burlington, MA, USA, 2005. [Google Scholar]
  4. Raymond, M.; Webb, S.; Aymond, P.I. Emergency Data Exchange Language (EDXL) Distribution Element (Version 1.0); OASIS: Burlington, MA, USA, 2006. [Google Scholar]
  5. Aymond, P.; Brooks, R.; Grapes, T.; Ham, G.; Iannella, R.; Robinson, K.; Joerg, W.; Triglia, A. Emergency Data Exchange Language Resource Messaging (EDXL-RM) (Version 1.0); OASIS: Burlington, MA, USA, 2009. [Google Scholar]
  6. Iannella, R.; Robinson, K. Tsunami Warning Markup Language (TWML) (Version 1.0); National ICT Australia: Sydney, Australia, 2006. [Google Scholar]
  7. Sun, S.; Iannella, R.; Robinson, K. Cyclone Warning Markup Language (CWML) (Version 1.0); National ICT Australia: Sydney, Australia, 2006. [Google Scholar]
  8. Babaie, H.A.; Babaei, A. Developing the earthquake markup language and database with UML and XML schema. Comput. Geosci. 2005, 31, 1175–1200. [Google Scholar] [CrossRef]
  9. Othman, S.H.; Beydoun, G.; Sugumaran, V. Development and validation of a disaster management metamodel. Inf. Process. Manag. 2014, 50, 235–271. [Google Scholar] [CrossRef]
  10. Othman, S.H.; Beydoun, G. Model—Driven disaster management. Inf. Manag. 2013, 50, 218–228. [Google Scholar] [CrossRef]
  11. ReliefWeb. Available online: http://sites.tufts.edu/jha/files/2011/04/a193.pdf (accessed on 12 February 2015).
  12. W3C Incubator Group Report. Available online: http://www.w3.org/2005/Incubator/eiif/XGR-Framework-20090806/#ack (accessed on 6 December 2014).
  13. Scherp, A.; Franz, T.; Saathoff, C.; Staab, S. F—A model of events based on the foundational ontology dolce + DnS ultralight. In Proceedings of the Fifth International Conference on Knowledge Capture, ACM, New York, NY, USA, 1–4 September 2009.
  14. Kruchten, P.; Monu, C.W.; Sotoodeh, M. A conceptual model of disasters encompassing multiple stakeholder domains. Int. J. Emerg. Manag. 2008, 5, 25–56. [Google Scholar] [CrossRef]
  15. Sanjay, J.; McLean, C. A framework for modeling and simulation for emergency response. In Proceedings of the 2003 Winter Simulation Conference, New Orleans, LA, USA, 7–10 December 2003.
  16. Malizia, A.; Onorati, T.; Díaz, P.; Aedo, I.; Astorga-Paliza, F. SEMA4A: An ontology for emergency notification systems accessibility. Expert Syst. Appl. 2010, 37, 3380–3391. [Google Scholar] [CrossRef]
  17. Zhang, D.; Zhou, L.; Nunamaker, J.F., Jr. A knowledge management framework for the support of decision making in humanitarian assistance/disaster relief. Knowl. Inf. Syst. 2002, 4, 370–385. [Google Scholar] [CrossRef]
  18. HernaÂndez, J.Z.; Serrano, J.M. Knowledge-based models for emergency management systems. Expert Syst. Appl. 2001, 20, 173–186. [Google Scholar] [CrossRef]
  19. Cheng, M.; HoKo, C. Computer-Aided DSS for Hillside Safety Monitoring. Autom. Constr. 2002, 11, 453–466. [Google Scholar] [CrossRef]
  20. Slobodan, S.; Sajjad, A. Computer-based model for flood evacuation emergency planning. Nat. Hazards 2005, 34, 25–51. [Google Scholar]
  21. Laniak, G.F.; Olchin, G.; Goodall, J.; Voinov, A.; Hill, M.; Glynn, P.; Whelan, G.; Geller, G.; Quinn, N.; Blind, M.; et al. Integrated environmental modeling: A vision and roadmap for the future. Environ. Model. Softw. 2013, 39, 3–23. [Google Scholar] [CrossRef] [Green Version]
  22. Laniak, G.F.; Rizzoli, A.E.; Voinov, A. Thematic issue on the future of integrated modeling science and technology preface. Environ. Model. Softw. 2013, 39, 1–2. [Google Scholar] [CrossRef]
  23. Bulatewicz, T.; Allen, A.; Peterson, J.M.; Staggenborg, S.; Welch, S.M.; Steward, D.R. The simple script wrapper for OpenMI: Enabling interdisciplinary modeling studies. Environ. Model. Softw. 2013, 39, 283–294. [Google Scholar] [CrossRef]
  24. Chen, N.; Wang, K.; Xiao, C.; Gong, J. A heterogeneous sensor web node meta-model for the management of a flood monitoring system. Environ. Model. Softw. 2014, 54, 222–237. [Google Scholar] [CrossRef]
  25. Akbar, M.; Aliabadi, S.; Patel, R.; Watts, M. A fully automated and integrated multi-scale forecasting scheme for emergency preparedness. Environ. Model. Softw. 2013, 39, 24–38. [Google Scholar] [CrossRef]
  26. Delin, K.; Jackson, S.; Some, R. Sensor webs. NASA Tech Briefs 1999, 23, 80. [Google Scholar]
  27. Bröring, A.; Echterhoff, J.; Jirka, S.; Simonis, I.; Everding, T.; Stasch, C.; Liang, S.; Lemmens, R. New generation sensor web enablement. Sensors 2011, 11, 2652–2699. [Google Scholar] [CrossRef] [PubMed]
  28. Everding, T.; Echterhoff, J. Event Pattern Markup Language (EML) (Version: 0.3.0) 08-132; Open Geospatial Consortium: Wayland, MA, USA, 2008. [Google Scholar]
  29. Chen, N.C.; Hu, C. A Sharable and interoperable meta-model for atmospheric satellite sensors and observations. IEEE J. Sel. Top. Appl. Earth Obs. Remote Sens. 2012, 5, 1519–1530. [Google Scholar] [CrossRef]
  30. OMG’s MetaObject Facility. Available online: http://www.omg.org/mof/ (accessed on 12 August 2014).
  31. Overbeek, J.F. Meta Object Facility (MOF): Investigation of the State of the Art. Master’s Thesis, University of Twente, Enschede, The Netherlands, 2006. [Google Scholar]
  32. ISO Standard. Available online: http://www.iso.org/iso/iso_catalogue/catalogue_tc/catalogue_detail.htm?csnumber=32554 (accessed on 18 August 2014).
  33. Fan, M.H.; Fan, H.; Chen, N.C.; Chen, Z.Q.; Du, W. Active on-demand service method based on event-driven architecture for geospatial data retrieval. Comput. Geosci. 2013, 56, 1–11. [Google Scholar] [CrossRef]
  34. Chen, N.C.; Zhang, X. A dynamic observation capability index for quantitatively pre-evaluating diverse optical imaging satellite sensors. IEEE J. Sel. Top. Appl. Earth Obs. Remote Sens. 2014, 7, 515–530. [Google Scholar] [CrossRef]
  35. Vallado, D.A.; Crawford, P.; Hujsak, R.; Kelso, T.S. Revisiting Spacetrack Report No. 3. In Proceedings of the AAIA/AAS Astrodynamics Specialist Conference, Keystone, CO, USA, 21–24 August 2006.
  36. Chen, N.C.; Di, L.P.; Yu, G.N.; Min, M. A flexible geospatial sensor observation service for diverse sensor data based on web service. ISPRS J. Photogramm. Remote Sens. 2009, 64, 234–242. [Google Scholar] [CrossRef]
  37. Chen, N.; Wang, X.; Yang, X. A direct registry service method for sensors and algorithms based on the process model. Comput. Geosci. 2013, 56, 45–55. [Google Scholar] [CrossRef]

