Article

Madagascar’s Mangroves: Quantifying Nation-Wide and Ecosystem Specific Dynamics, and Detailed Contemporary Mapping of Distinct Ecosystems

1
Blue Ventures Conservation, Villa Bella Fiharena, Rue Gambetta, Lot 259, Toliara, Madagascar
2
Dynamic Ecosystems and Landscapes Lab, Department of Environmental Science and Management, Portland State University, Portland, OR 97201, USA
3
Department of Forestry, PO Box 175, University of Antananarivo, Antananarivo 101, Madagascar
4
United States Geological Survey, Earth Resources Observation and Science Center, Duke University, Durham, NC 27708, USA
5
WWF Madagascar West Indian Ocean Programme Office, Antsakaviro, B.P. 738, Antananarivo 101, Madagascar
*
Author to whom correspondence should be addressed.
Submission received: 31 August 2015 / Revised: 21 November 2015 / Accepted: 8 January 2016 / Published: 30 January 2016
(This article belongs to the Special Issue Remote Sensing of Mangroves: Observation and Monitoring)

Abstract

:
Mangrove ecosystems help mitigate climate change, are highly biodiverse, and provide critical goods and services to coastal communities. Despite their importance, anthropogenic activities are rapidly degrading and deforesting mangroves world-wide. Madagascar contains 2% of the world’s mangroves, many of which have undergone or are starting to exhibit signs of widespread degradation and deforestation. Remotely sensed data can be used to quantify mangrove loss and characterize remaining distributions, providing detailed, accurate, timely and updateable information. We use USGS maps produced from Landsat data to calculate nation-wide dynamics for Madagascar’s mangroves from 1990 to 2010, and examine change more closely by partitioning the national distribution in to primary (i.e., >1000 ha) ecosystems; with focus on four Areas of Interest (AOIs): Ambaro-Ambanja Bays (AAB), Mahajamba Bay (MHJ), Tsiribihina Manombolo Delta (TMD) and Bay des Assassins (BdA). Results indicate a nation–wide net-loss of 21% (i.e., 57,359 ha) from 1990 to 2010, with dynamics varying considerably among primary mangrove ecosystems. Given the limitations of national-level maps for certain localized applications (e.g., carbon stock inventories), building on two previous studies for AAB and MHJ, we employ Landsat data to produce detailed, contemporary mangrove maps for TMD and BdA. These contemporary, AOI-specific maps provide improved detail and accuracy over the USGS national-level maps, and are being applied to conservation and restoration initiatives through the Blue Ventures’ Blue Forests programme and WWF Madagascar West Indian Ocean Programme Office’s work in the region.

Graphical Abstract

1. Introduction

Found in over 120 countries and territories between 30°N and 30°S latitude, mangrove ecosystems support high floral and faunal biodiversity and provide a diverse range of goods (e.g., food, fuel, building materials) and services (e.g., water filtration; storm protection) to coastal populations. Furthermore, a growing number of studies report that mangroves possess similar or greater above- and exceptionally larger below-ground carbon stocks as compared with their terrestrial peers [1,2,3,4,5,6,7,8,9,10,11,12,13,14,15,16,17,18,19,20,21,22,23,24,25], meaning that intact mangrove ecosystems contribute to global climate change mitigation through sequestering significant amounts of CO2. Despite their tremendous and diverse value, throughout the world mangrove ecosystems are rapidly being degraded, deforested and converted for other uses. Over the past several decades, annual global mangrove loss is estimated at 1%–2%, exceeding rates in many inland tropical forests [6,26,27,28,29,30]. The primary drivers of loss include conversion for agri- and aquaculture, coastal development, over-extraction of woody materials, and the ripple effects of upstream terrestrial agriculture and deforestation (i.e., erosion, sedimentation and siltation) [31,32,33,34,35,36,37,38,39,40]. While anthropogenic activities are the primary drivers of loss, natural phenomena such as tropical storms and rising ocean temperatures and sea-levels also play a significant role; the impacts of which are expected to continue to increase based on current climate change projections [6,11,30,31,37,40,41,42,43,44,45]. Many of the world’s enduring mangrove ecosystems have already been degraded, and may functionally collapse within this century without intervention [27,46,47].
To quantify dynamics and initiate effective management and decision-making, contemporary information on the extent and status of mangrove ecosystems is required. Remotely sensed data can be employed to map and monitor mangrove ecosystems, providing managers and decision makers with detailed, accurate, timely and updateable information [15,48]. In particular, the Landsat archive, which extends back >40 years, is well tested for identifying and quantifying mangrove distribution and dynamics, and for mapping and monitoring specific mangrove ecosystems at the level of thematic detail required for management strategies [25,49,50,51,52,53,54,55,56,57,58,59,60,61,62,63,64,65]. As described in [66], there is a growing need to use remotely sensed data such as Landsat to monitor shifts in stable states in coastal wetlands, such as mangroves. New techniques which go beyond single-date mapping and multi-date change detection are needed to create evolutionary models of mangroves; pushing the boundaries of Landsat-like remotely sensed data [66]. Along these lines, a recent study in the Mekong delta by [67] demonstrates how to study the spatial and temporal evolution of mangroves using a time series of Landsat data augmented by Shuttle Radar Topography Mission (SRTM) data. Factoring in the need for and benefit of monitoring shifts in stable states, detailed, contemporary single-date maps are still required for many management tasks and are unavailable for much of the world’s mangrove ecosystems [25,61].
The island nation of Madagascar contains extensive mangrove ecosystems, which as of 2005 totaled approximately 280,000 hectares (ha); Africa’s fourth largest amount and 2% of the global distribution [10,57,68,69]. Many of Madagascar’s mangrove ecosystems have undergone or are starting to show signs of wide-spread degradation and deforestation. To date, numerous studies have employed remotely sensed data to produce single- or multi-date nation–wide mangrove maps (i.e., [68,69,70,71,72]). However, national-level maps, while critical for country-wide overviews, do not provide the thematic detail required for many localized (e.g., ecosystem-specific) applications. Prior to 2010, localized mapping was undertaken for several specific mangrove ecosystems (i.e., Bombetoka Bay, Betsiboka Estuary, Mahajamba Bay (MHJ), and Mangoky Delta) (i.e., [73,74,75,76,77]). However, these maps are either out-of-date or lack the thematic detail required for certain management initiatives (e.g., carbon stock inventories); and for many of Madagascar’s mangrove ecosystems, are simply non-existent.
Here, we inventory and compare existing national-level mangrove maps for Madagascar. Using the most comprehensive and contemporary available data, we quantify nation-wide mangrove dynamics from 1990 to 2010. To use these data to examine dynamics at a finer scale, we partition Madagascar’s mangroves in to non-contiguous, primary (i.e., >1000 ha) mangrove ecosystems; with focus on four distinct mangrove ecosystems representing areas of interest (AOIs): Ambaro-Ambanja Bays (AAB), MHJ, Tsiribihina Manambolo Delta (TMD) and Baie des Assassins (BdA. Given the limitations of national-level maps for certain localized applications, and the limitations of existing and/or lack of ecosystem-specific maps for AOIs, we build on two previous studies for AAB and MHJ [25,61] and employ Landsat data to produce detailed, contemporary, maps of TMD and BdA. The applications of existing (AAB; MHJ) and new (TMD; BdA) AOI-specific maps to mangrove conservation initiatives through Blue Ventures’ Blue Forests programme are discussed.

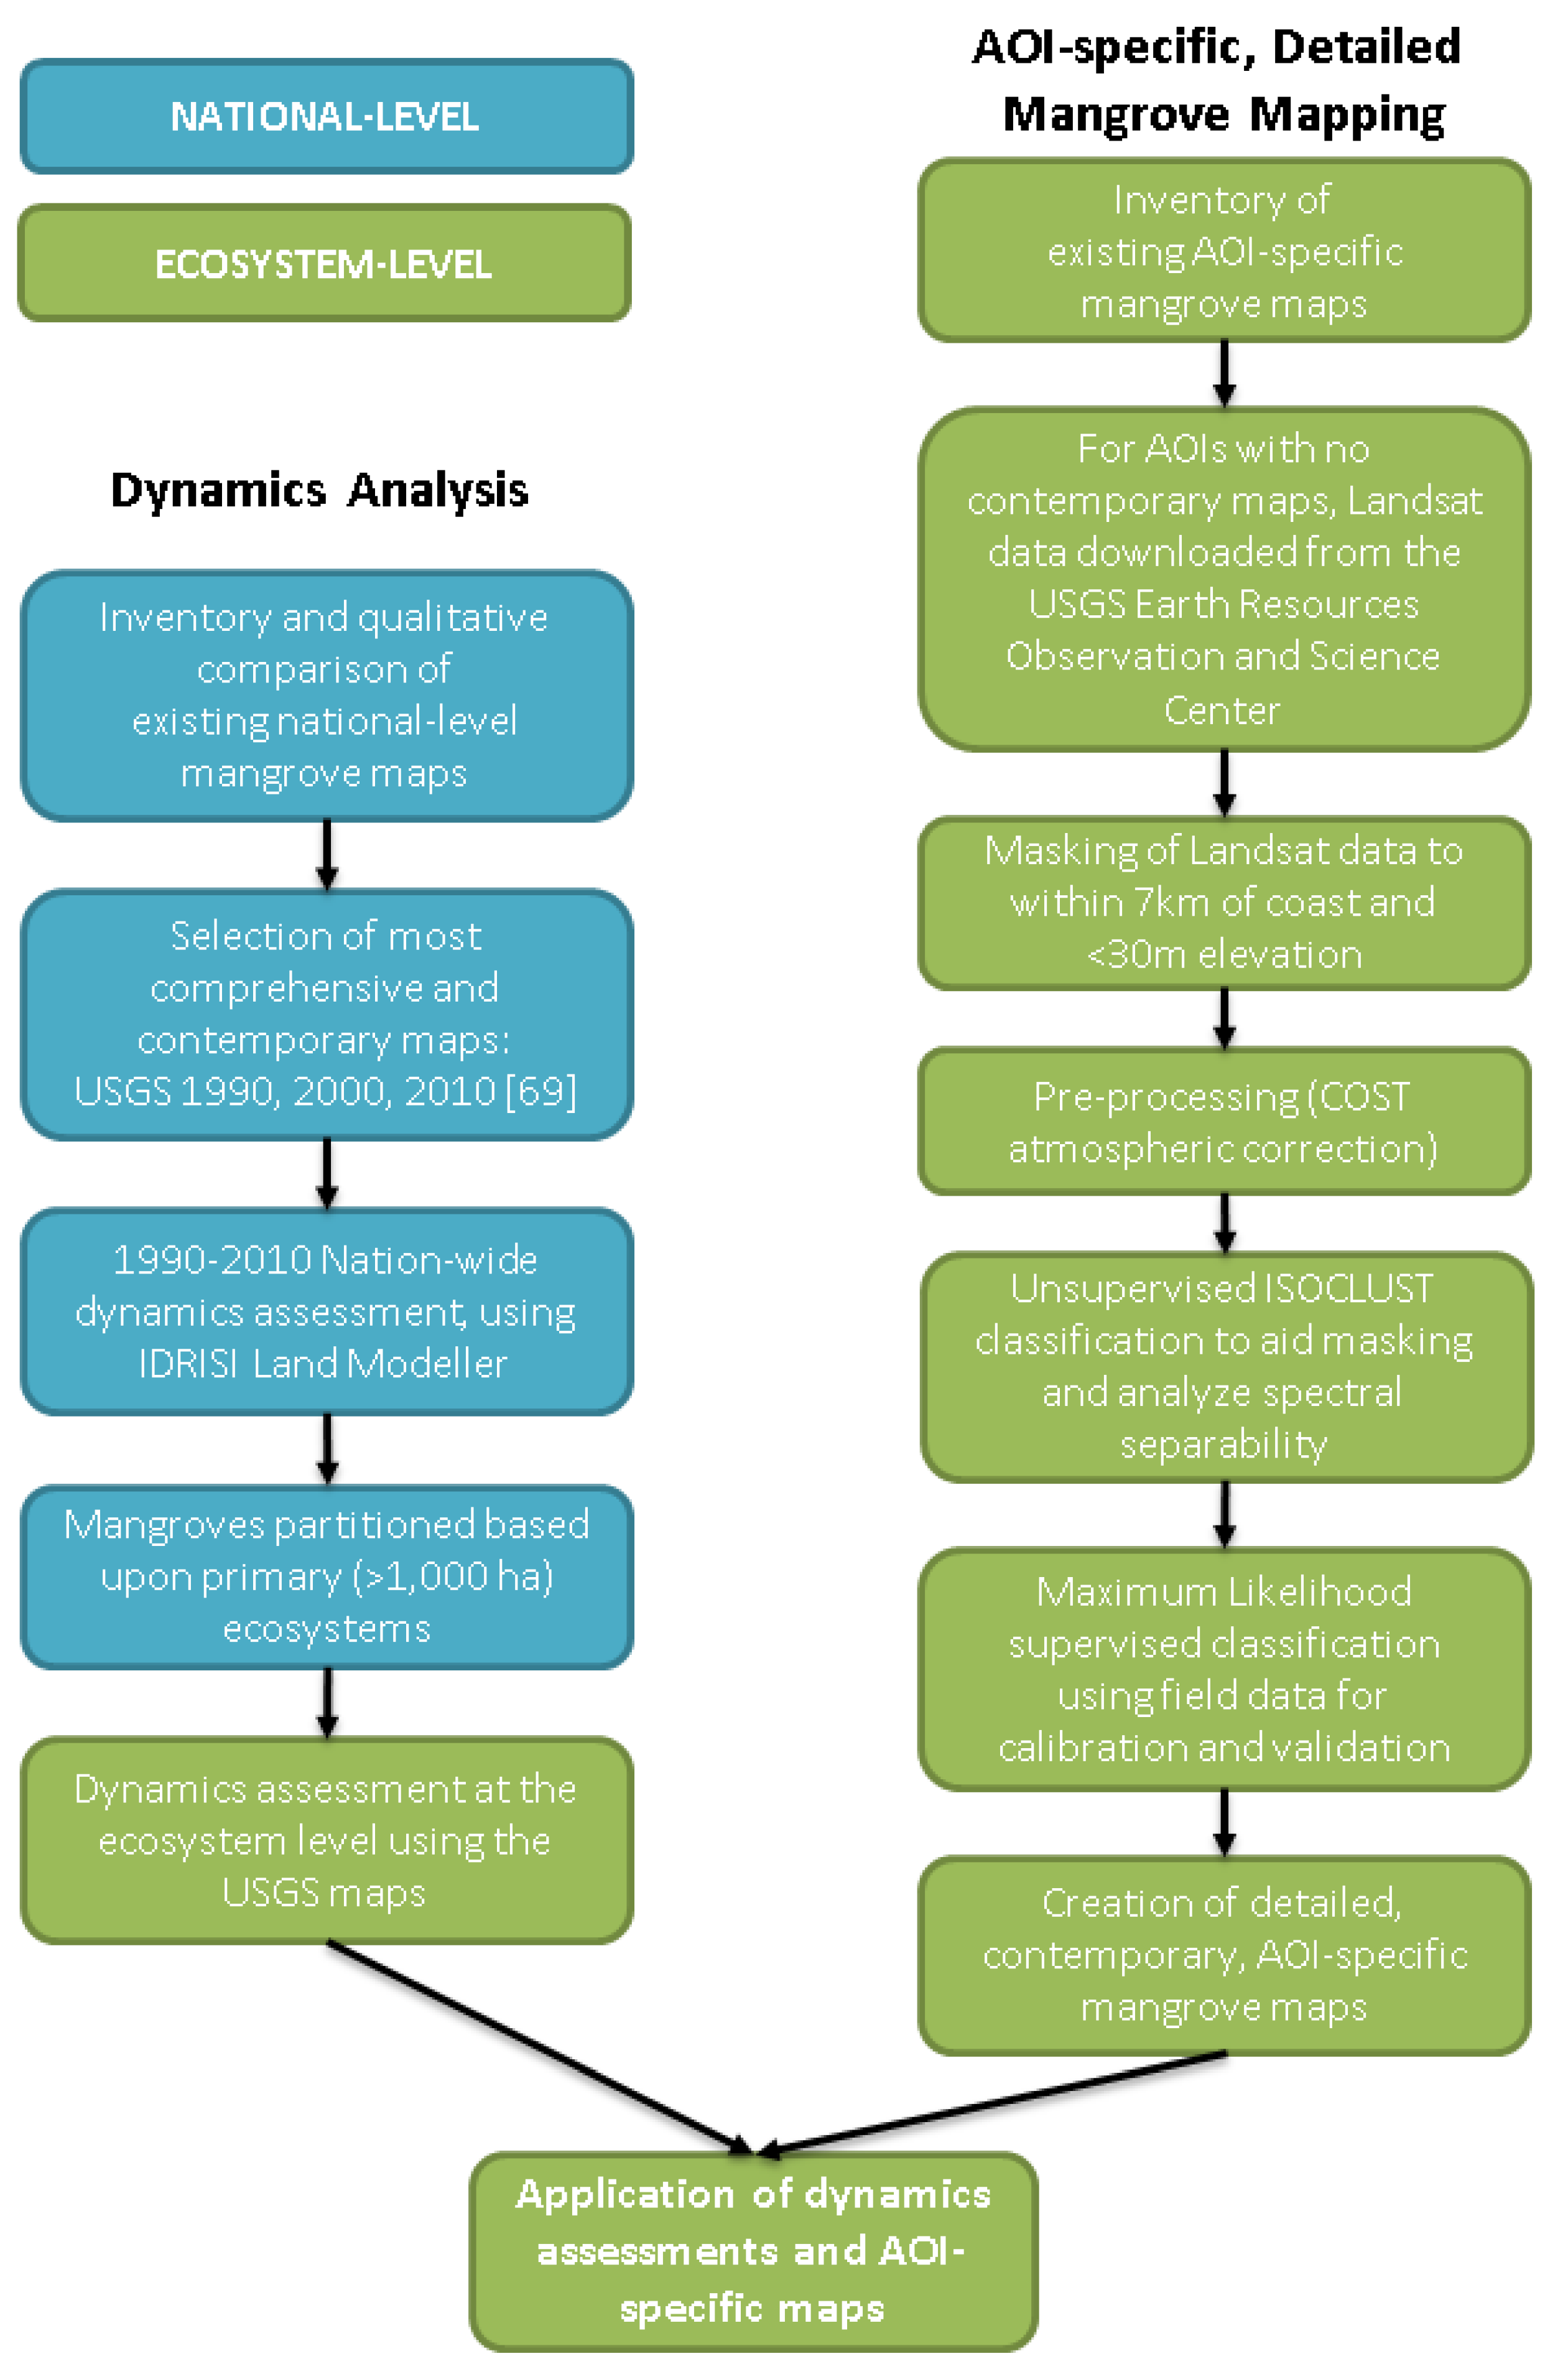
2. Experimental Section
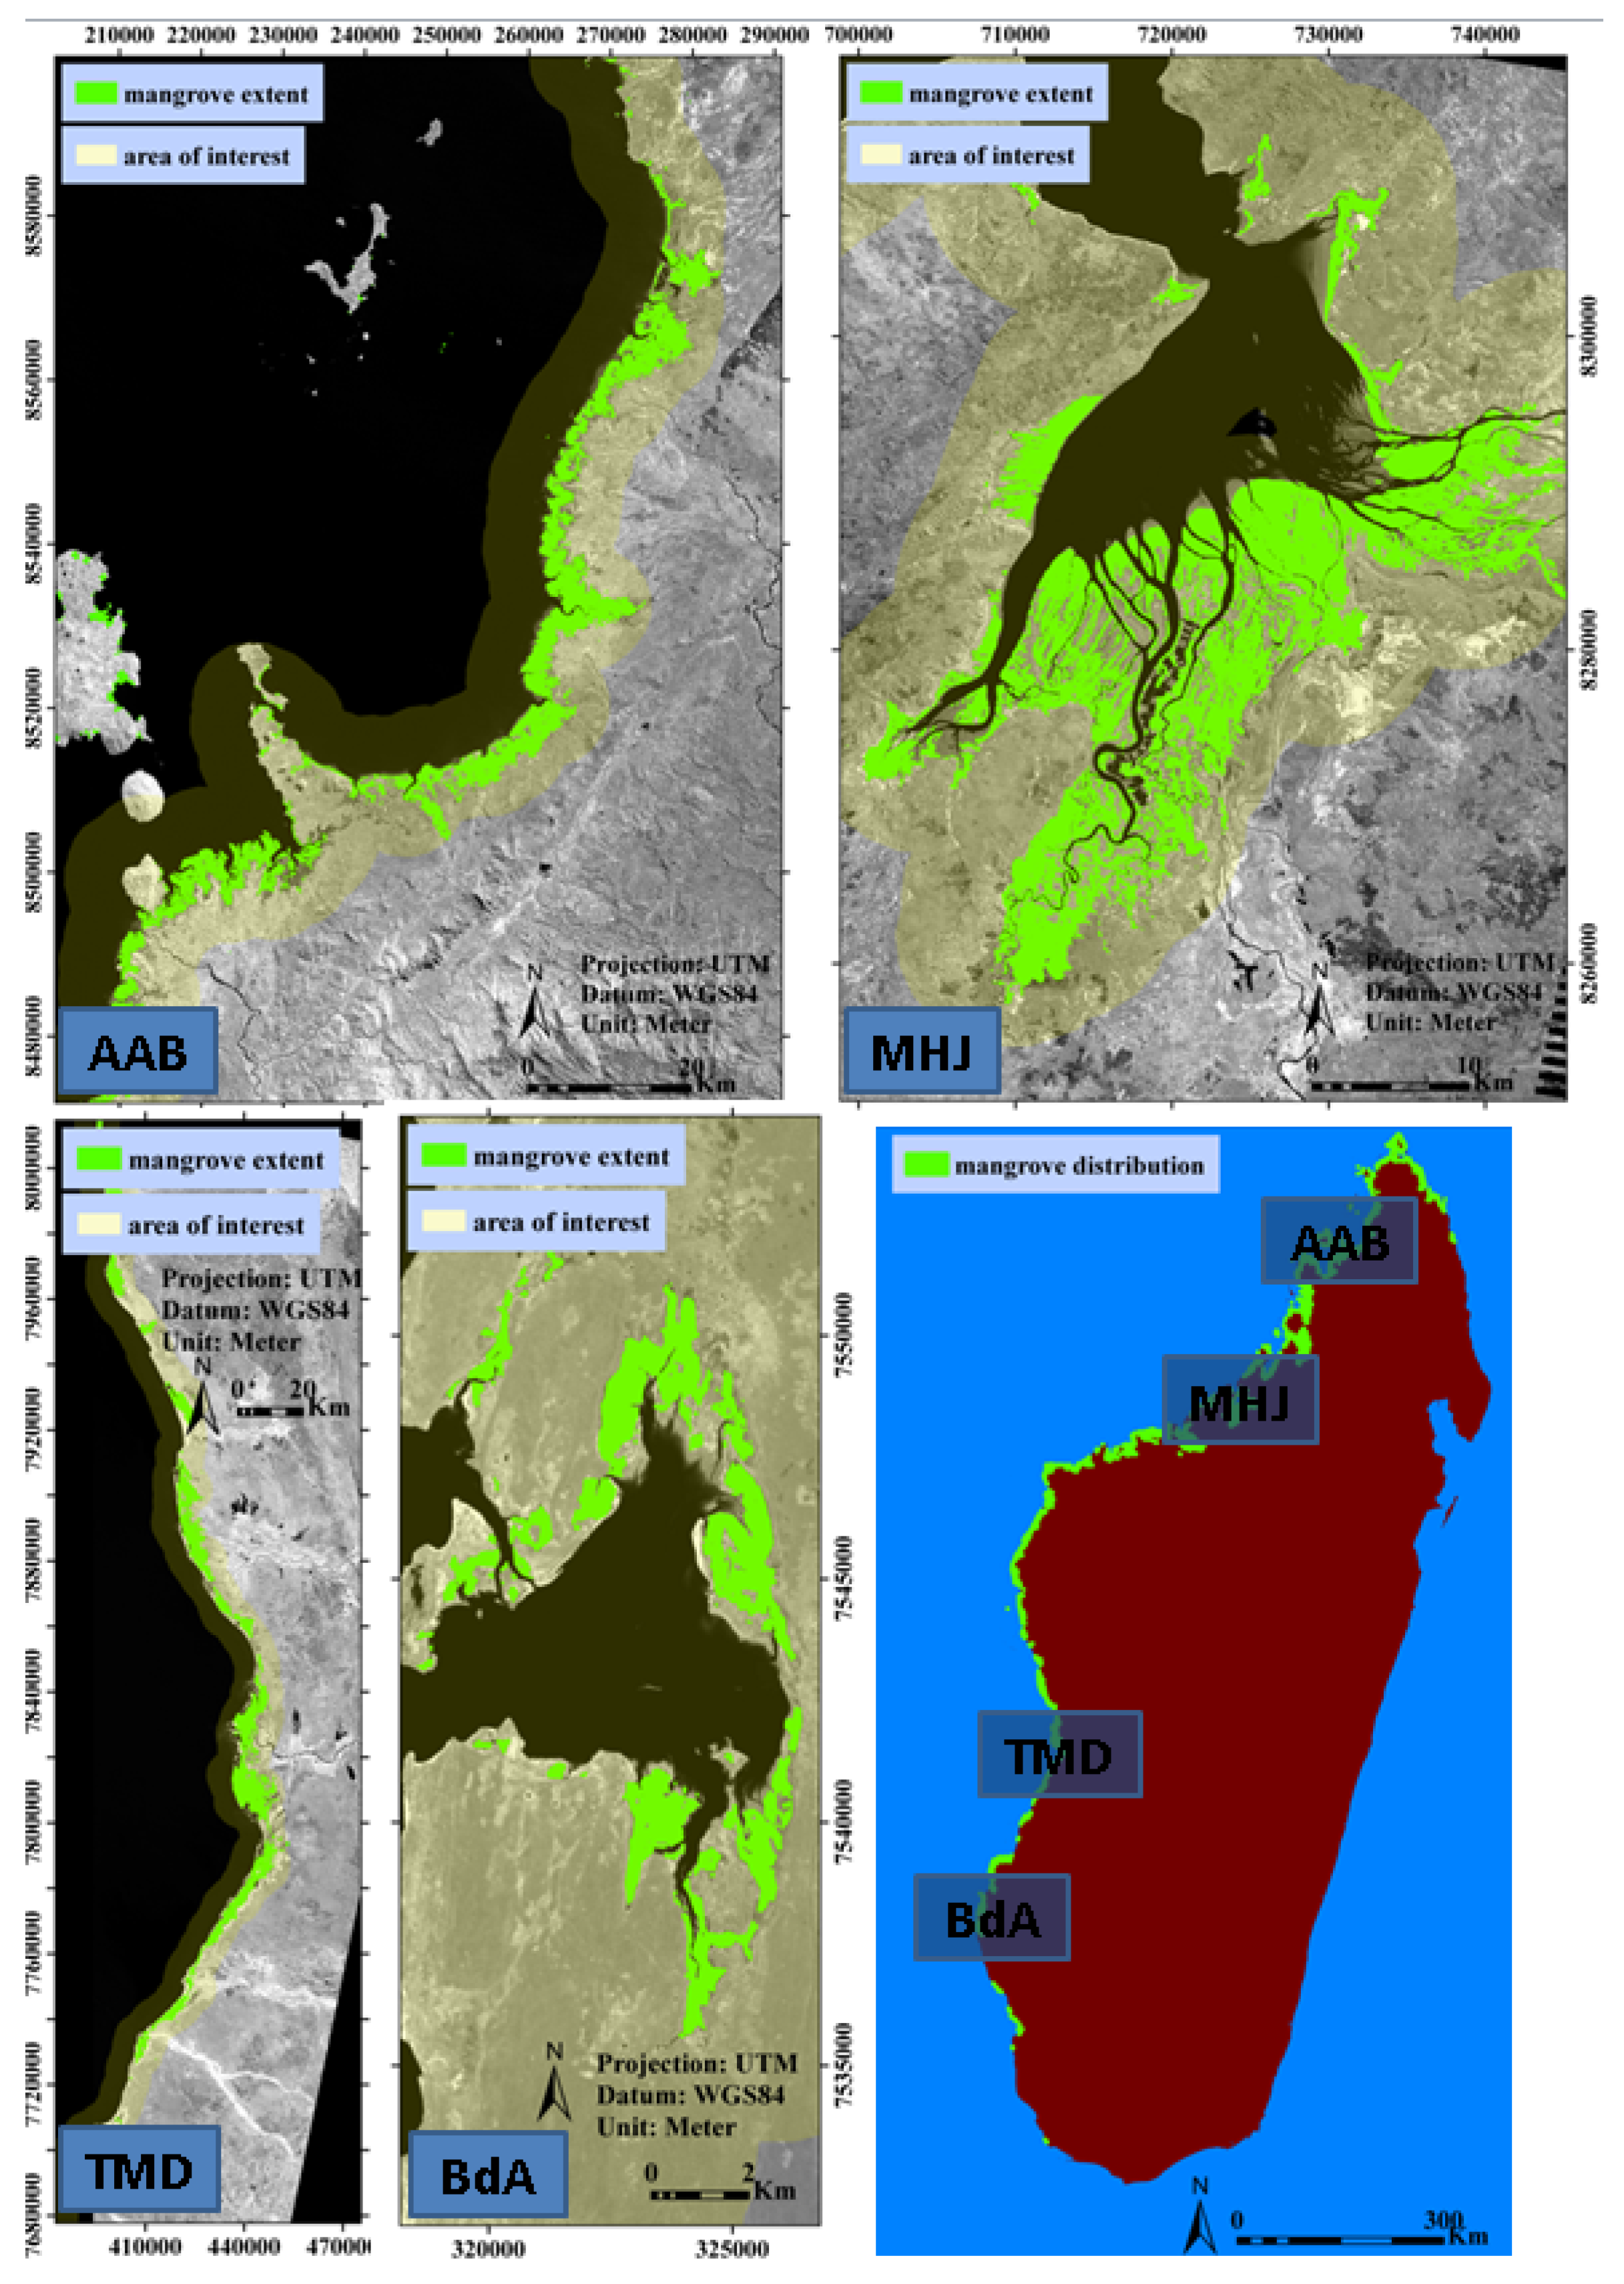
2.1. Study Area

The study area includes the entire distribution of Madagascar’s mangroves (Figure 1). Madagascar’s ~5000 km coastline is one of the most extensive shallow marine areas in the Western Indian Ocean (WIO), wherein mangrove ecosystems are located almost entirely along the west coast. While not as species-rich as other regions, at least eight true mangrove species occur, supporting unique flora and fauna, much of which is currently endangered or at-risk [12,68].
Figure 1. The study area includes the entire distribution of Madagascar’s mangroves (shown in green, circa 2010, bottom right) (data obtained with permission from Giri [69]). The combined marine and terrestrial extent within 7 km from the coast in four primary mangrove ecosystems (i.e., Ambaro-Ambanja Bays (AAB), Mahajamba Bay (MHJ), Tsiribihina-Manambolo Delta (TMD) and the Baie des Assassins (BdA)) represent four specific areas of interest (AOIs). The location of each AOI is shown in the country-wide inset (bottom right). Mangrove extent (circa 2010) within each AOI is shown in green (data obtained with permission from Giri [69]).
Remotesensing 08 00106 g001
Madagascar’s mangrove ecosystems are governed by a complex legal framework involving forestry, land planning, fisheries and environmental laws [78,79,80,81,82,83,84,85]. The most relevant texts regarding mangrove management and use are found in the forestry and environmental sectors. Under forestry laws, mangroves are within the public domain of the state, but local communities can be granted user rights for their domestic use of related resources, including timber [78,80,82]. Under environmental laws, mangroves fall within the sensitive area category, in which an environmental impact assessment is compulsory prior to any type of investment, and where commercial timber extraction has been forbidden since 2000 [79,81]. More recently, in 2014 a Decree was issued by the Government of Madagascar to ban the extraction, transportation, stocking and sale of timber specifically in mangrove ecosystems [85]. In practice, the Forestry Administration continues to grant communities user rights on mangrove timber, despite the two-above mentioned bans. Local management rights can be established through either Protected Areas or Natural Resource Management Transfer regulations; though this process is complex, expensive and time consuming. Regardless of management rights, comprehensive and effective management, which impedes mangrove degradation and loss, is lacking for almost all mangrove ecosystems in Madagascar. Due to the lack of governance, an increasing demand in fuel-wood and timber, as well as the expansion of agricultural land, the pressure on mangrove ecosystems from anthropogenic activities continues to rise [25]. If degradation and conversion continue unimpeded, biodiversity will be imperiled, greenhouse gas emissions will increase, and many important services provided to coastal communities will be seriously compromised [86].
Owing to the lack of effective mangrove management in Madagascar and local people’s high dependence on the numerous goods and services mangroves provide, the marine conservation NGO Blue Ventures (www.blueventures.org) initiated its Blue Forests programme in 2011, to work with coastal communities, partner NGOs, Malagasy and foreign Universities, and government bodies at all levels to establish incentivized models for community-based sustainable mangrove forest and fisheries management. The national-level mangrove dynamics data detailed herein and complementary socioeconomic information highlighted three priority AOIs along the west coast of Madagascar for Blue Ventures’ Blue Forest programme: Ambaro-Ambanja Bays (AAB), Mahajamba Bay (MHJ) and the Baie des Assassins (BdA) (Figure 1). The Tsiribihina and Manambolo Deltas (TMD) form a fourth AOI, where the localized mapping detailed herein is supporting WWF Madagascar West Indian Ocean Programme Office’s work in the region. Each AOI encompasses the marine and terrestrial extent below 30 meters (m) elevation within 7 km of the coast.
AAB (centered at latitude 13°26′S, longitude 48°30′E) is comprised of two bays lined with extensive mangroves, which in aggregate form a contiguous ecosystem. AAB is most influenced by the Sambirano, Mananjeba, Mahavavy and Ifasy Rivers, with their headwaters in the Tsarantanana Massif mountain range to the southeast, including Maromokotro, Madagascar’s highest peak at 2876 m. Situated at the convergence of the Sofia and Mahajamba rivers (centered at latitude 15°24′S, longitude 47°05′E), the tidal plains of MHJ encompass an extensive mangrove ecosystem. MHJ experiences a semidiurnal tidal range of 1.5–3 m (4–4.5 m during spring tide), an average surface water salinity range of 25–45 parts per thousand, and a mean annual precipitation of 1500 mm [73,74]. TMD (centered at latitude 19°36′S, longitude 44°27′E) is comprised of two deltas lined with extensive mangroves, forming a contiguous ecosystem. TMD is fed by the Mahajilo, Sakay, Kitsamby, Mania and Sakeny Rivers [87], with their headwaters in the Central Highlands (Ankaratra Massif [88]). The BdA (centered at latitude 22°12′S, longitude 43°17′E) is comprised of a single bay with a comparatively modest amount of mangroves, representing a contiguous ecosystem. A north-south rainfall gradient along the west coast results in a comparative abundance of precipitation in the north (e.g., AAB, MHJ and TMD), which contributes to higher stature mangrove trees than further south (e.g., BdA) [68,89].

2.2. Inventory and Comparison of Existing Data-Sets

Several studies have resulted in single- or multi-date national-level mangrove distribution maps for Madagascar (i.e., [68,70,71,72]). Mayaux et al. [70] delineated mangrove and five other vegetation cover types, circa 1998/1999, using 1 km Satellite Pour l’Observation de la Terre (SPOT) VEGETATION data. The Critical Ecosystem Partnership Fund (CEPF) [71] Madagascar Mapping Project mapped mangroves and 14 other vegetation types, circa 2001, with Moderate-resolution Imaging Spectroradiometer (MODIS) and Landsat data. Harper et al. [72] employed Landsat data to map forest cover, including mangroves, for 1973, 1990 and 2000. Giri and Muhlhausen [68] and Giri [69] utilized Landsat data to map mangrove and non-mangrove for 1973, 1990, 2000, 2005 and 2010. National-level dynamics calculated from these maps through 2005 are presented in Giri and Muhlhausen [68]). To date, no studies have reported on the nation-wide dynamics of Madagascar’s mangroves beyond 2005.
Of the four specific AOIs, prior to 2014, AOI-specific maps existed for only MHJ and the BdA. For MHJ, Rasolofoharinoro et al. [73] employed Satellite Pour l’Observation de la Terre (SPOT) data to map seven intertidal vegetation zones for 1986 and 1993, which included four mangrove classes (i.e., pioneering; dense mature; decaying; back (e.g., mangrove/terrestrial interface)). Pasqualini et al. [74] combined SPOT and radar data to delineate 10 coastal ecosystem types, circa 1993, including four morphologically (i.e., frontal; interfluvial) and dynamics (i.e., mature; recessive) related mangrove classes. Guillet et al. [75] utilized Landsat and SPOT data to map 12 coastal ecosystem classes, circa 1973, 1989, 2000 and 2006, including four mangrove types (i.e., sparse Avicennia marina; average density Avicennia marina; dense Avicennia marina; and dense Rhizophora mucronata). For BdA, Roy et al. [90] used Quickbird (DigitalGlobe, Longmont, CO, USA) data to produce a map of mangrove and surrounding marine classes, circa 2005. These maps (i.e., [73,74,75,90] are no longer contemporary and/or unable to provide the thematic detail required for specific applications (e.g., carbon stock estimation).
As described in later sections, to improve upon the shortcomings associated with available maps for MHJ, Jones et al. [61] used Landsat data acquired in 2011 to produce a detailed, contemporary AOI-specific map of MHJ. Using similar methodologies, Jones et al. [25] produced an AOI-specific map for AAB from Landsat data acquired in 2010. At the time of writing, detailed contemporary maps existed for no other specific mangrove ecosystems in Madagascar; highlighting the need to produce new maps for TMD and BdA to complement those produced for AAB and MHJ.

2.3. National-Level Mangrove Distribution and Dynamics; Ecosystem-Level Dynamics

National-level data-sets were compared to determine which offered the most comprehensive (i.e., in terms of their coverage of actual known mangrove area) and contemporary (i.e., most recent) mangrove distributional information. Contemporary Landsat data, finer spatial resolution imagery viewable in Google Earth (Google, Mountain View, CA, USA) and extensive field observations were used to guide qualitative comparisons (Figure 2). Building on Giri and Muhlhausen [68], who reported mangrove extent circa 2005 and dynamics from 1990 to 2005, the maps deemed most comprehensive and contemporary were employed to establish contemporary (i.e., beyond 2005) mangrove extent and quantify national-level mangrove dynamics (i.e., loss, persistence and gain) from 1990 to 2010 using the Idrisi Land Change Modeler; a land planning and decision support tool (Clark Labs, Worcester, MA, USA). To investigate mangrove extent and dynamics at a finer scale, national-level mangrove data-sets were partitioned in to primary mangrove ecosystems, defined herein as individual ecosystems occupying at least 1000 ha and containing true mangroves: salt-tolerant halophytic trees and/or shrubs occurring entirely in tidal and inter-tidal areas [91].
Figure 2. Workflow. Blue boxes represent national-level processing including the entire distribution of Madagascar’s mangroves. Green boxes represent ecosystem-level processing, including 30 primary mangrove ecosystems, with focus on four AOIs (i.e., Ambaro-Ambanja Bays (AAB), Mahajamba May (MHJ), Tsiribihina-Manambolo Delta (TMD) and Baie des Assassins (BdA)). The results of nation-wide and ecosystem-specific dynamics from 1990 to 2010, and ecosystem-specific maps for TMD and BdA are presented in this study for the first time. The production of ecosystem-specific maps builds on previous studies which employed similar methods for AAB and MHJ (i.e., Jones et al. [25]; Jones et al. [61]).
Remotesensing 08 00106 g002

2.4. AOI-Specific Ecosystem-Level Mapping

2.4.1. Acquisition and Pre-Processing of Remotely Sensed Data

Following the methodology described in Jones et al. [25] for AAB, and Jones et al. [61] for MHJ, for mapping efforts in TMD and BdA, 30 m spatial resolution Landsat scenes were downloaded from the United States Geological Survey (USGS) Earth Resources Observation and Science Center (Sioux Falls, SD, USA) (Table 1). All Landsat scenes were orthorectified to a Shuttle Radar Topography Mission (SRTM) digital elevation model (DEM). Atmospheric correction was undertaken using the Cos(t) model [92], which estimates the impact of absorption by atmospheric gases and Rayleigh scattering, minimizes systematic haze, and converts image units to at-surface reflectance.
The bounding extent for all AOIs were established using distance to coastline (i.e., 7 km) as an assumed mangrove habitat requirement [55,58,93]. Reducing the image extent based on habitat requirement through masking can increase classification accuracy by decreasing spectral confusion amongst target classes [57]. Emulating studies that establish the effectiveness of SRTM data to estimate mangrove forest canopy height (e.g., [94,95,96,97,98]), an SRTM height mask further eliminated unnecessary scene components based on a 30 m threshold, above which mangrove habitat were observed in each AOI not to exist [25,61].
Table 1. Summary of single-date Landsat scenes used for detailed, contemporary mapping of the four AOIs. Maps produced for Ambaro-Ambanja Bays (AAB) and Mahajamba Bay (MHJ) are originally described in Jones et al. [25] and Jones et al. [61]; whereas maps produced for Tsiribihina-Manambolo Delta (TMD) and Baie des Assassins (BdA) result from this study. Tide (m) indicates the average tidal height above mean sea level in or near the AOI during image acquisition.
AOISensorDatePath/rowTide (m)
AABLandsat 7 (L7) ETM09/06/2010159/691.9
MHJLandsat 5 (L5) TM29/07/2011160/711.7
TMDLandsat 8 (L8) OLI28/07/2014161/73; 161/741.5
BdALandsat 8 (L8) OLI23/04/2014161/752.3

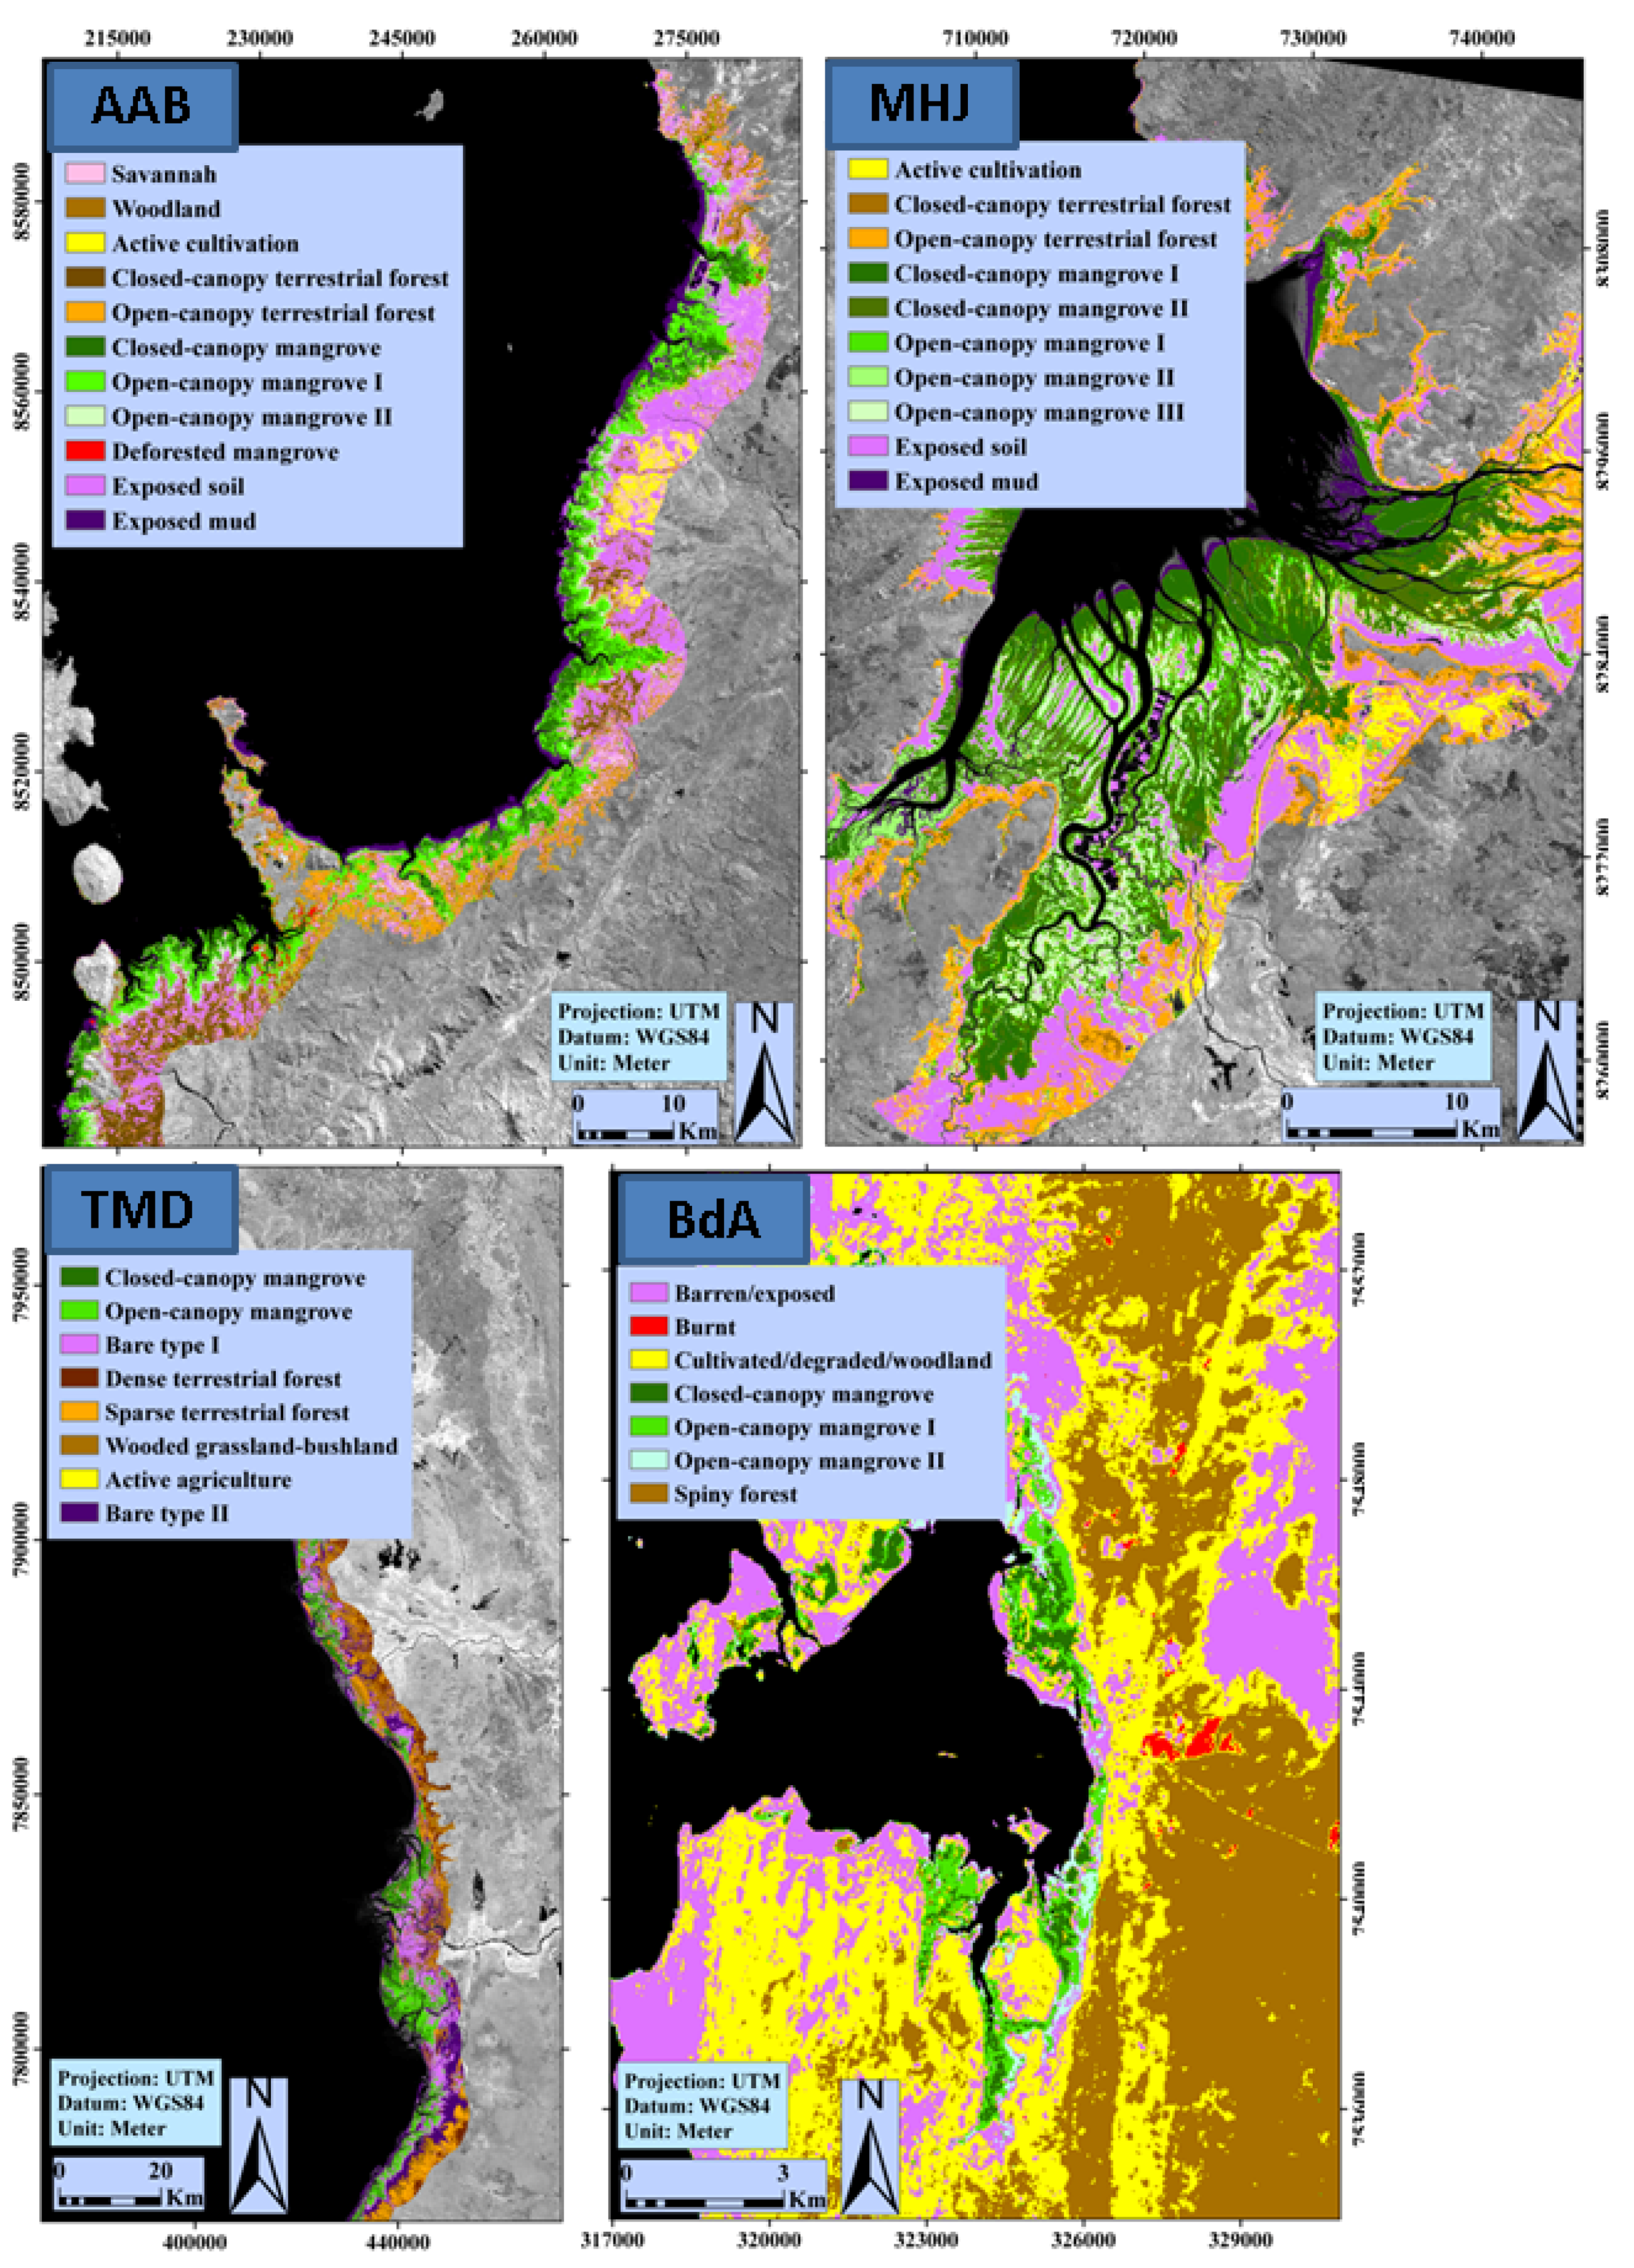
2.4.2. Initial Mapping; Definition and Refinement of Mangrove and Surrounding Land-Cover Categories

Adhering to the methods described in Jones et al. [25] for AAB, and Jones et al. [61] for MHJ, to produce initial maps for TMD and BdA, an unsupervised iterative self-organizing classification algorithm (i.e., ISOCLUST) was employed to group pixels in to dominant cover types based on shared spectral properties in bands 1–5 and 7 (i.e., TM and ETM) or bands 2–7 (i.e., OLI). Unsupervised classification for mapping mangroves and closely related ecosystem types is proven, and has produced both preliminary and final maps described in numerous studies [25,57,59,61,68,96,97,99,100,101,102]. Unsupervised classification results further facilitated masking based on areas dominated by water, cloud and/or shadow. Making reference to existing maps and finer spatial resolution imagery viewable in Google Earth, aggregation and iterative labelling was used to define and refine mangrove and surrounding land-cover types. Mangrove types varied slightly between AOIs, but were based on spectral differences attributable to ecological properties such as canopy-cover, stature and density (Table 2). All mangrove classes represent true mangroves and are assumed to be dominated by salt-tolerant halophytic trees and/or shrubs occurring entirely in tidal and inter-tidal areas [91]. Mangrove classes dominated by trees are considered forested stands; whereas classes dominated by shrubs/stunted trees do not meet international or national definitions for forest. Herein, the term mangrove ecosystem refers to a contiguous ecological unit containing both forest and non-forest areas of mangrove. Forested classes within a particular mangrove ecosystem are collectively referred to as mangrove forest.
In accordance with the approach described in Jones et al. [25] for AAB, and Jones et al. [61] for MHJ, to ensure the representativeness of and refine mangrove type and surrounding land-cover categories for TMD and BdA maps, preliminary field surveys were conducted in all four AOIs. Stratified random sampling was employed to target ha-sized reference plot locations within strata defined by the unsupervised classification results. Within mangrove reference plots established within each strata (Table 2), the height, diameter, canopy-cover, and crown dimensions were recorded for representative examples of each mangrove species present. Within non-mangrove reference plots, field notes and photographs recorded variability and confirmed representativeness. Within all reference plots, plot center was established with a Garmin GPSmap 62sc GPS unit left recording during the duration of measurements.
Table 2. Mapped classes, descriptions and 3 × 3 pixel calibration and validation reference areas for each of the four AOIs. Mapped classes for TMD and BdA build on previously published studies for AAB ([25]) and MHJ ([61]).
AreaClassDescriptionCalibrationValidationTotal
AABSavannahDry grass, exposed soil, extremely sparse trees/shrubs10616
WoodlandDry grass and scattered trees/shrubs; canopy <30% closed8614
Active cultivationDominated by pre-harvest agriculture (e.g., rice; sugar cane)10616
Closed-canopy terrestrial forestStands of trees with well-formed canopies >60% closed12618
Open-canopy terrestrial forestStands of trees/shrubs with canopies 30%–60% closed8614
Closed-canopy mangroveTall, mature stands; canopy >60% closed201030
Open-canopy mangrove IShort-medium stands of trees/shrubs; canopy 30%–60% closed; moderately influenced by background soil/mud15924
Open-canopy mangrove IIStunted/short stands, shrub-dominant, very sparse; canopy ≥10% closed11617
Deforested mangroveMosaic of stumps, scattered trees; canopy <30% closed8614
Exposed soilInactive agri/aquacultural fields; extremely patchy savannah; extremely dry mud-flats10515
Exposed mudMangrove/ocean interface; river sediment; wet mud-flats8513
Total12071191
MHJActive cultivationDominated by pre-harvest agriculture (e.g., rice)14721
Closed-canopy terrestrial forestStands of trees with well-formed canopies >60% closed14721
Open-canopy terrestrial forestStands of trees/shrubs with canopies 30%–60% closed16824
Closed-canopy mangrove ITall, mature stands; canopy >80% closed221032
Closed-canopy mangrove IITall, mature stands; canopy >60% closed221032
Open-canopy mangrove IShort-medium stands of trees/shrubs; canopy 30%–70% closed; moderately influenced by background soil/mud14721
Open-canopy mangrove IIShort-medium stands of trees/shrubs; canopy 30%–70% closed; significantly influenced by background soil/mud12719
Open-canopy mangrove IIIStunted/short stands, shrub-dominant, very sparse; canopy <30% closed14721
Exposed soilInactive agri/aquacultural fields; sparsely vegetated, soil-dominated areas; dry mud-flats211031
Exposed mudMangrove/ocean interface; river sediment; wet mud-flats; inactive aquaculture ponds14721
Total16380243
TMDDense mangroveTall, mature stands; canopy >70% closed16622
Sparse mangroveShort-medium stands of trees/shrubs; canopy 30%–70% closed; moderately influenced by background soil/mud12517
Bare type IExposed soil; scrub mangrove; mud-flats; fallow agriculture; patchy grass/bushland14620
Dense terrestrial forestHigh-stature terrestrial trees with well-formed canopies12618
Sparse terrestrial forestMixed-stature terrestrial trees with relatively open canopies interspersed with wooded grassland-bushland10515
Wooded grassland-bushlandGrassland and/or bush-land10515
Active agricultureDominated by pre-harvest agriculture (e.g., rice)314
Bare type IITypically dry soil and/or sand; extremely dry patchy grass/bushland10515
Total8739126
BdASpiny forestModerate-high stature, relatively closed-canopy stands9312
Barren/exposedDominance of rock, sand, dry soil; interspersed with sparse vegetation9312
Cultivated/degraded/woodlandActive or fallow cultivation; degraded and/or sparse terrestrial forest; woodland9312
BurntAreas which have recently experienced fire9312
Water dominatedWater dominant; mud-flats10414
Closed-canopy mangroveTall, mature stands; canopy >60% closed9312
Open-canopy mangrove IShort-medium stands of trees/shrubs; canopy 30%–70% closed; influenced by background soil/mud9312
Open-canopy mangrove IIStunted/short stands; shrub-dominant, very sparse; canopy <30% closed9312
Total732598

2.4.3. Supervised Image Classification

As with previously reported mapping efforts in AAB and MHJ, for TMD and BDA, reference plots facilitated both calibrating the spectral properties of different mangrove and surrounding land-cover types for image classification (i.e., calibration) and assessing resulting map accuracy (i.e., validation). By exploiting the familiarity gained with the appearance and location of target classes, supplemental reference areas were located in finer spatial resolution imagery viewable in Google Earth for all mapped categories. Reference areas were spread throughout and randomly partitioned to facilitate both calibration and validation (Table 2). In adherence with methods described in Jones et al. [25] for AAB, and Jones et al. [61] for MHJ, for TMD and BdA, supervised classification of Landsat data was employed to produce maps of class distributions using the maximum likelihood (ML) algorithm. Numerous studies have shown the effectiveness of ML for classifying mangrove habitat with Landsat-like data [25,58,60,61,73,95,103,104,105,106,107,108]. The accuracies of resulting maps were quantified using confusion matrices, which cross-tabulate independent validation data against mapped classes. The Kappa index of agreement further assessed how much better than random each map was [109].

3. Results and Discussion

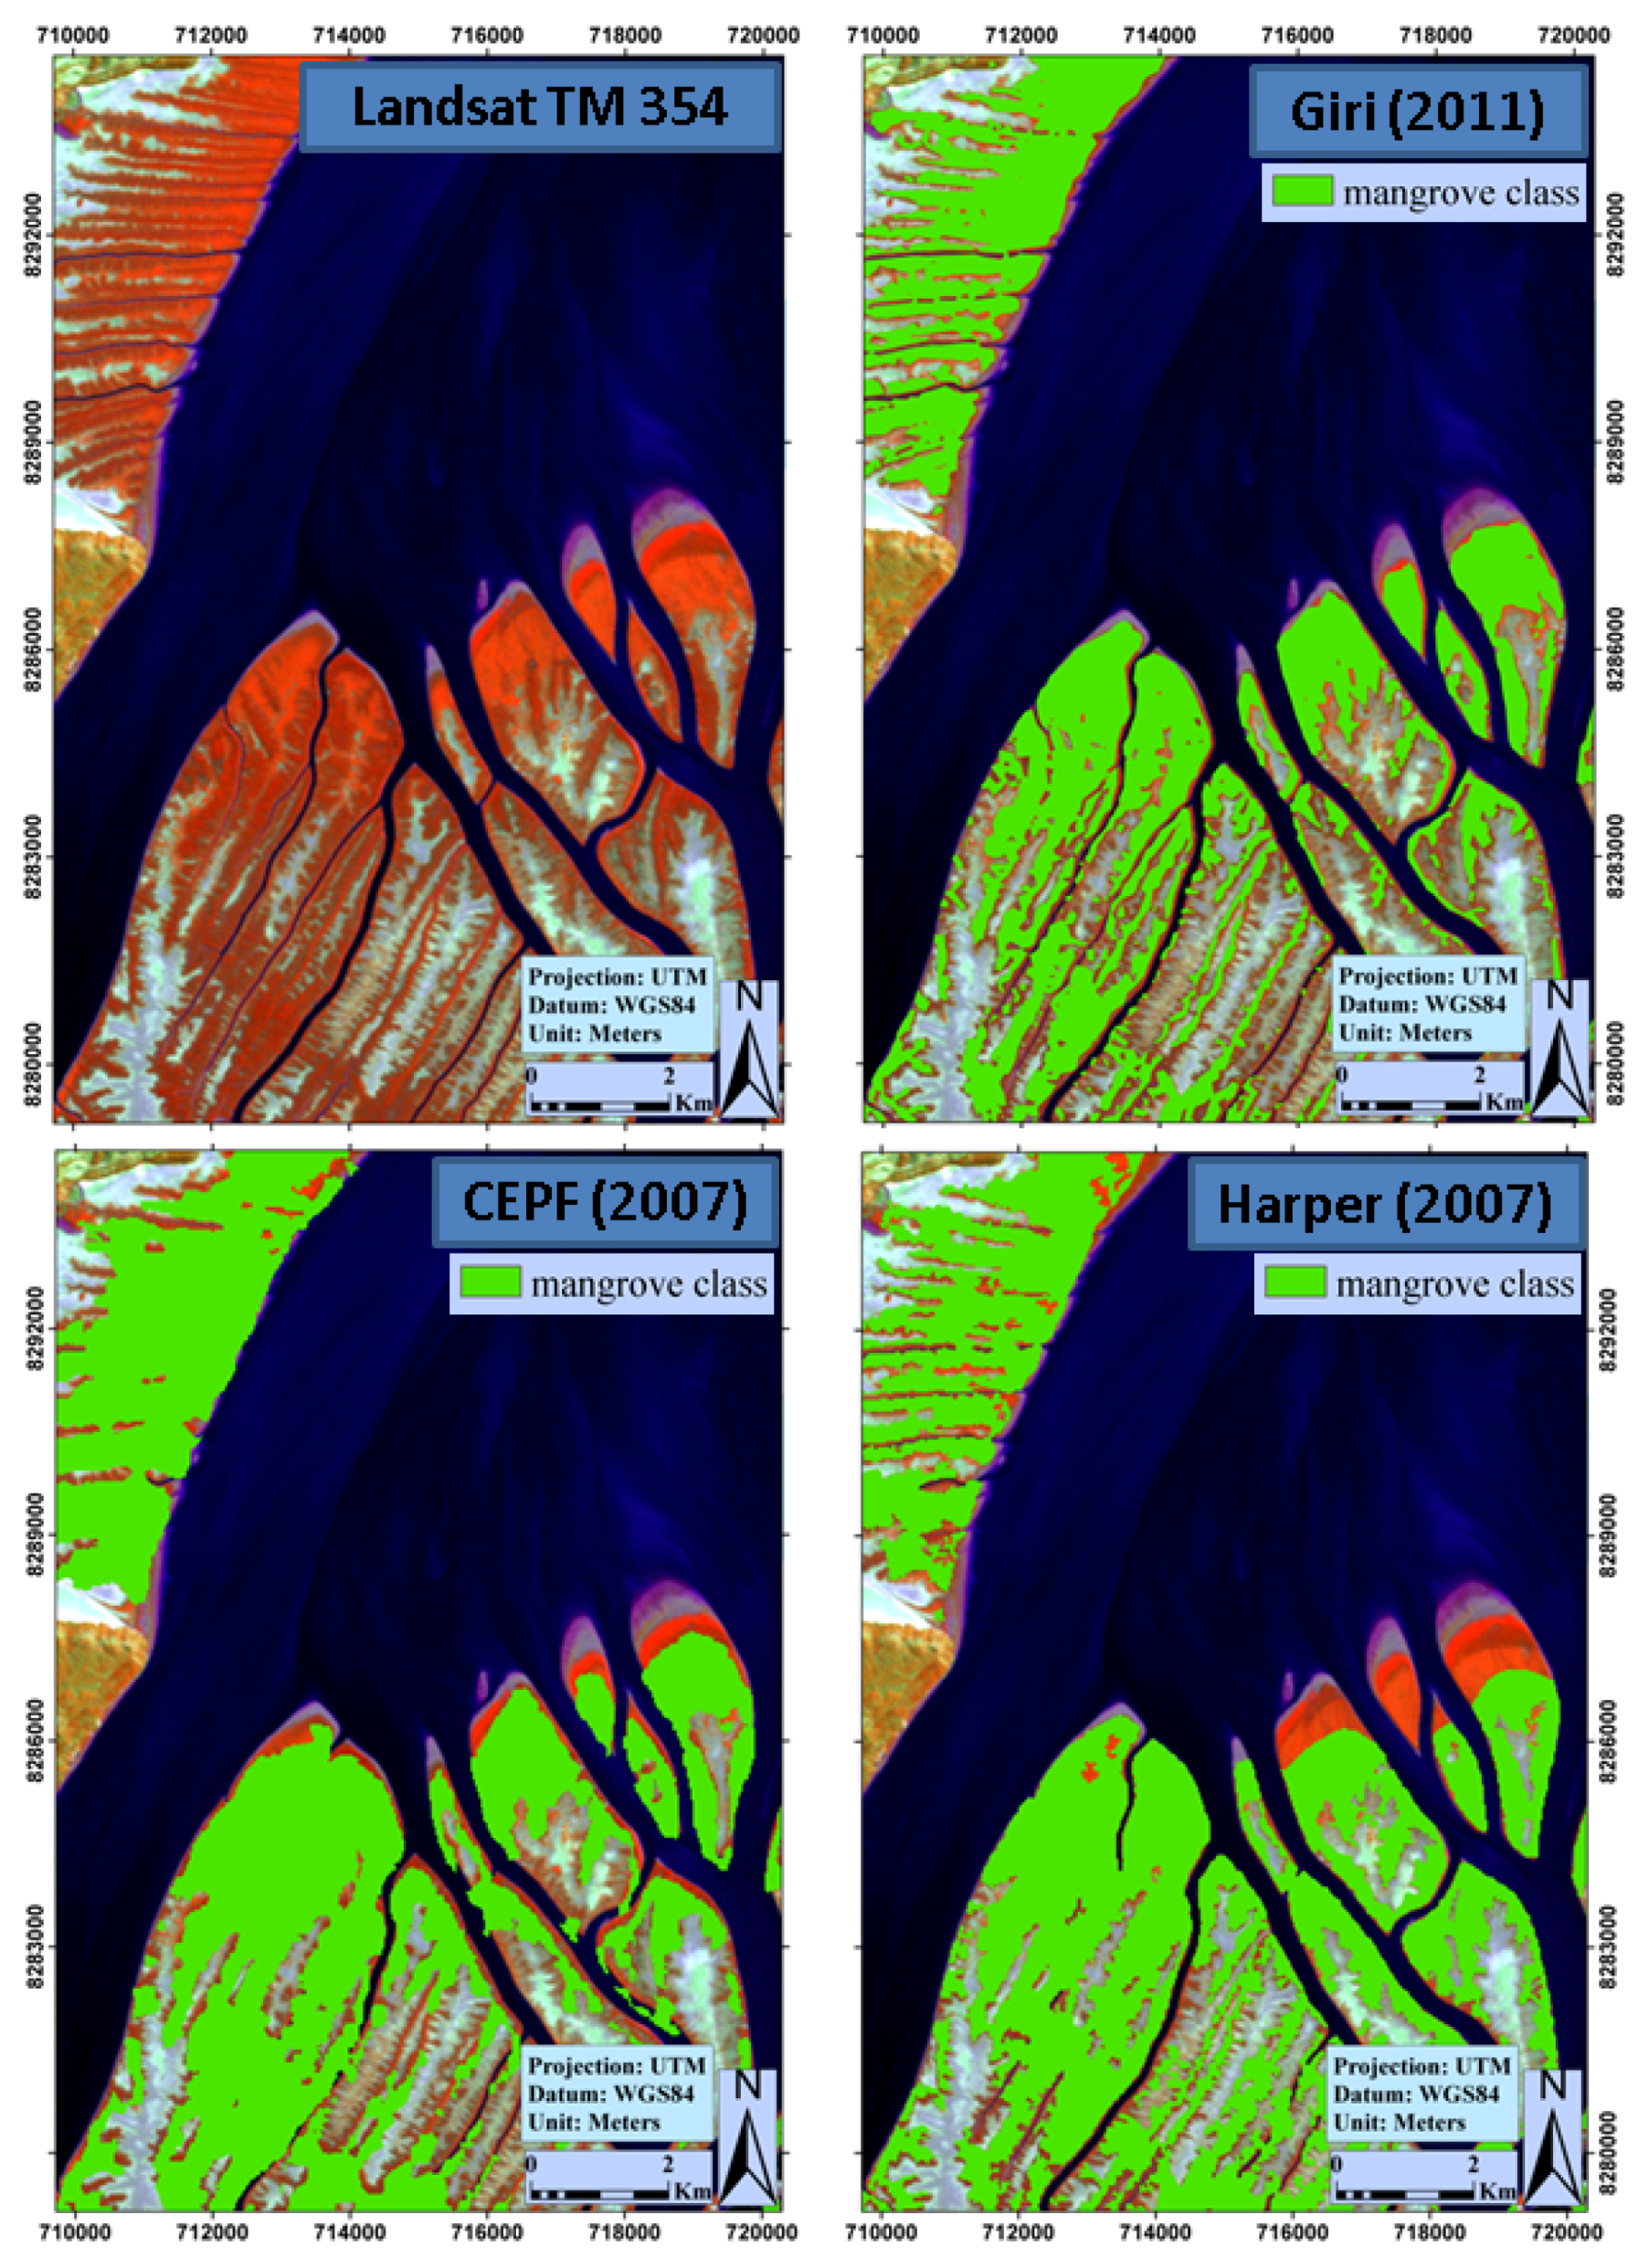
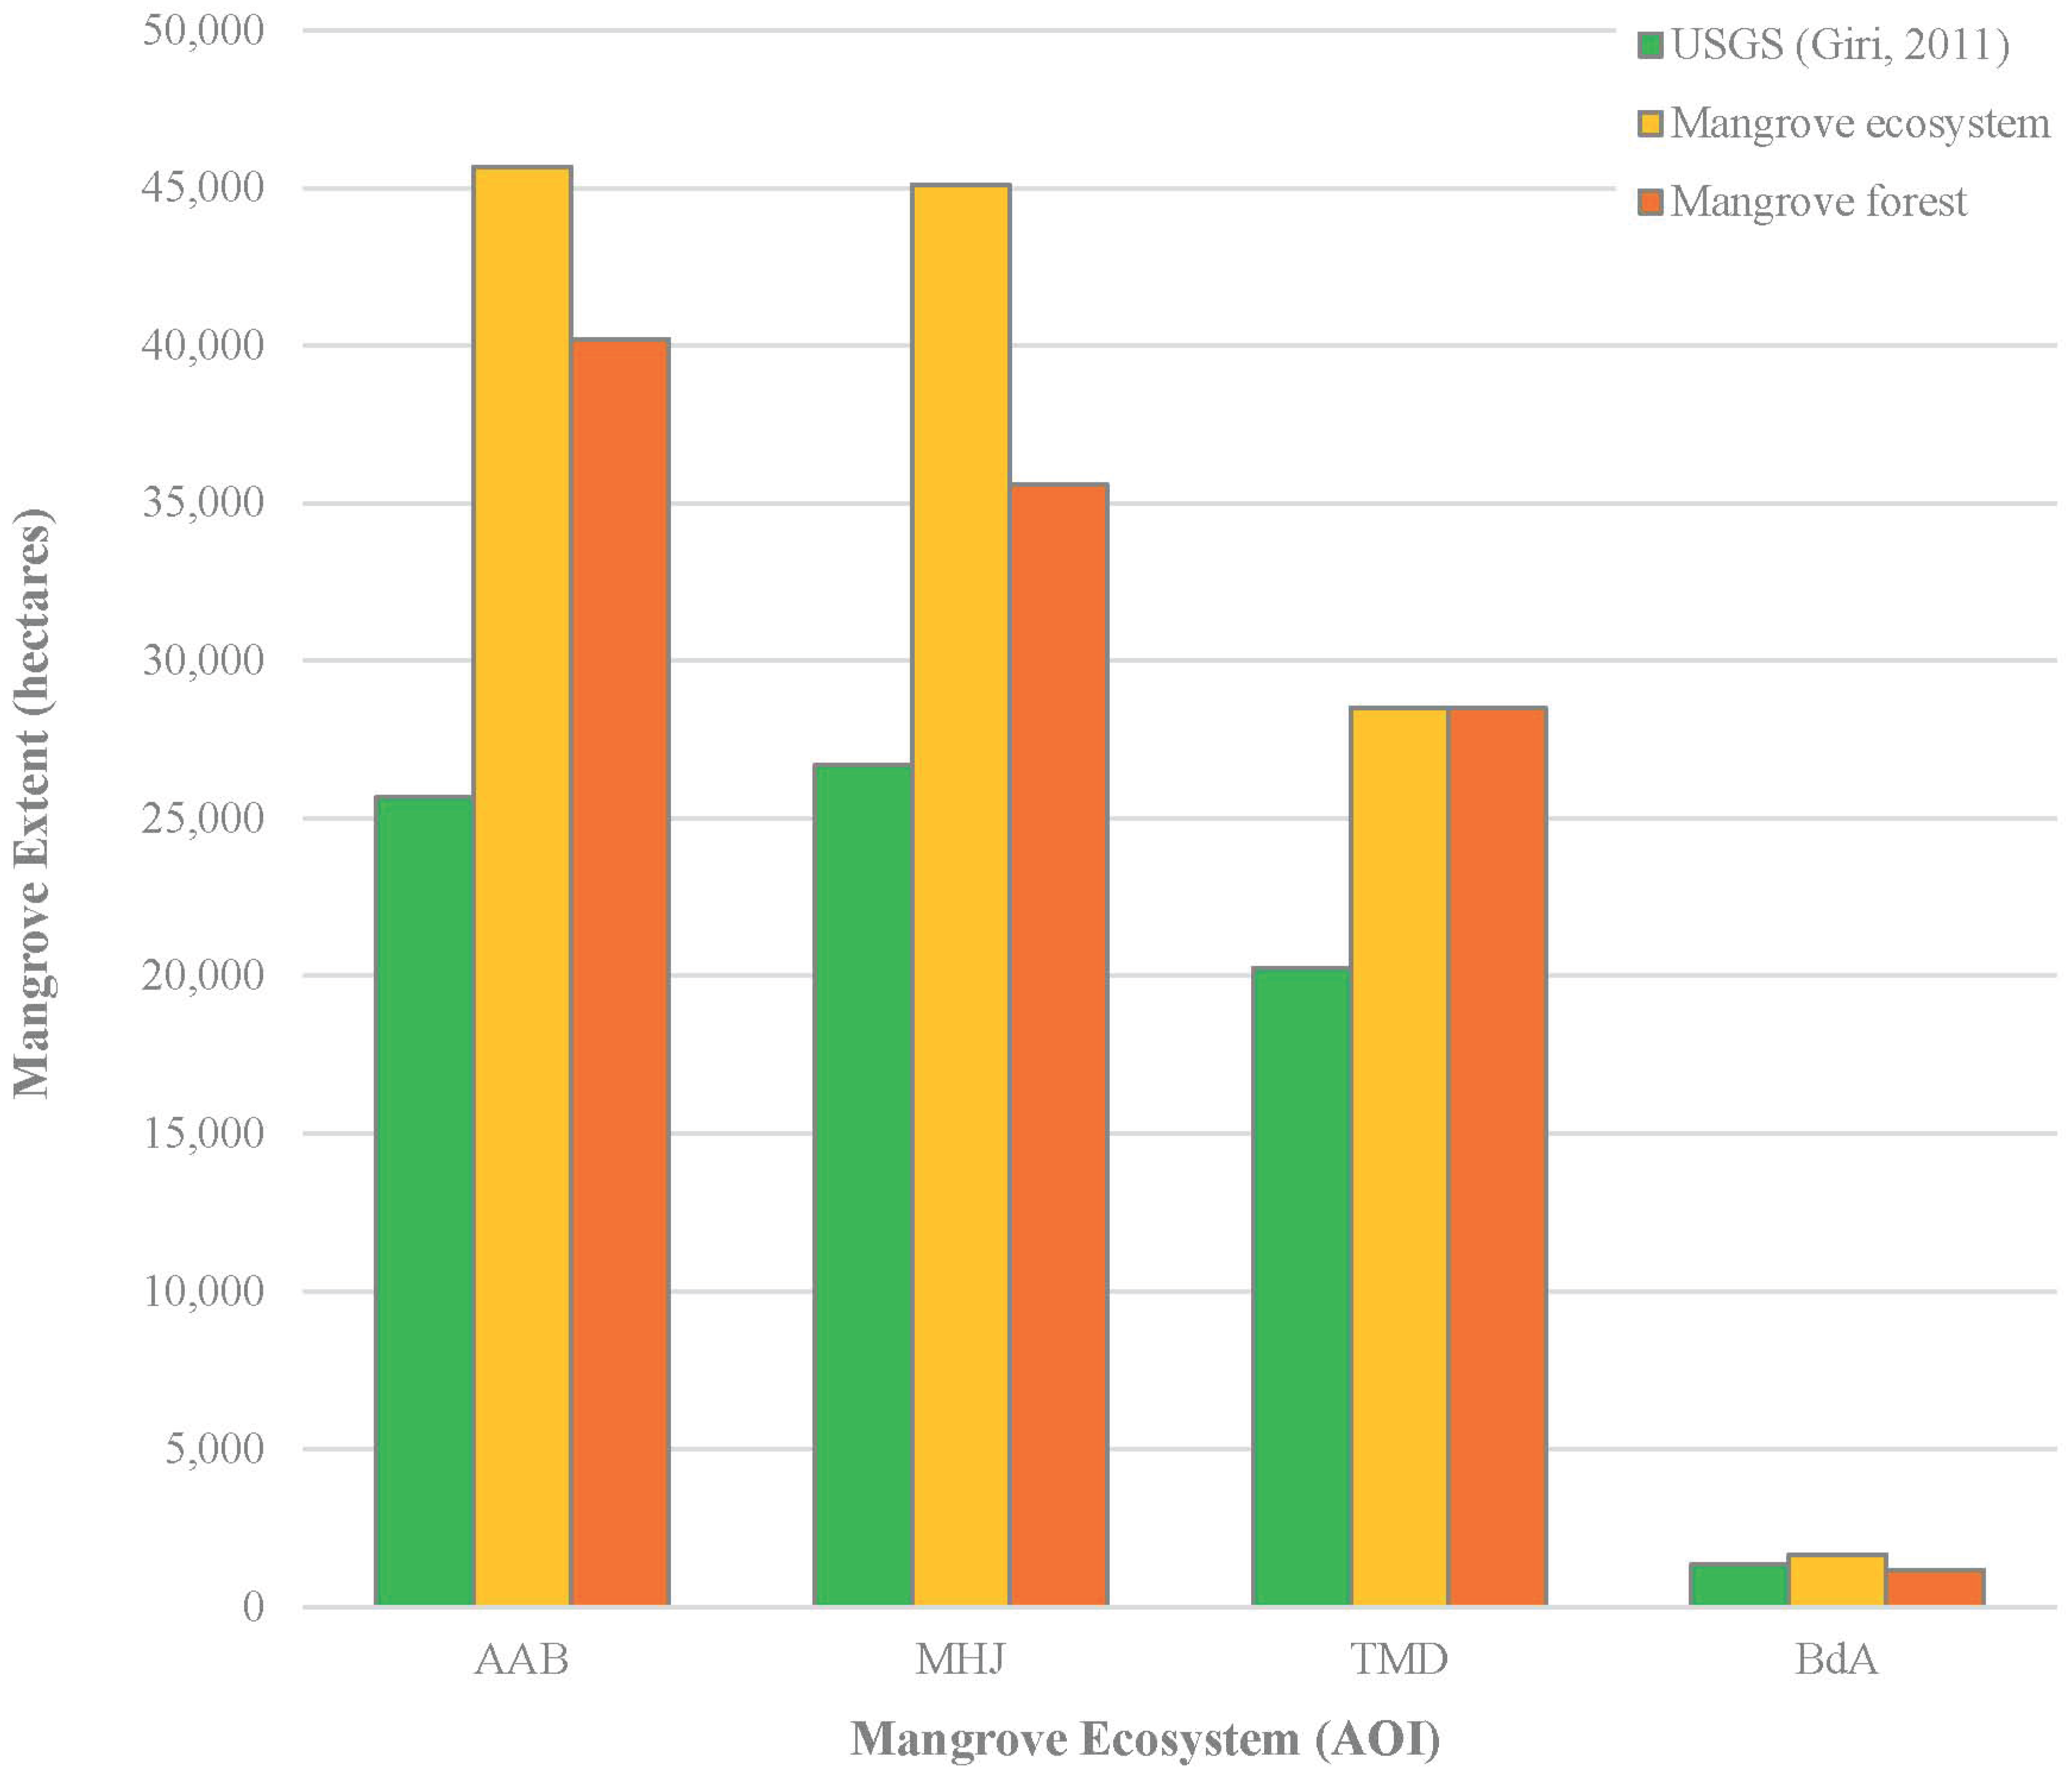
3.1. Overview of Existing National-Level Maps and Data-Sets

A qualitative comparison of existing national-level mangrove data-sets (i.e., [68,70,71,72]) concluded that those produced by the USGS (i.e., [69]) offered the most comprehensive historic and contemporary areal estimates of Madagascar’s mangroves (Figure 3). Crucially, the USGS produced maps were the only ones to provide relatively contemporary (i.e., 2010) distribution and focus solely on mangroves, with all other national-level maps representing multiple forest types and time periods nearly or greater than 10 years earlier. Thus, the USGS data-sets were utilized for all consequent dynamics analyses. Additional details regarding comparisons between Madagascar’s existing national-level mangrove data-sets are available in Giri and Muhlhausen [68], Jones et al. [25] and Jones et al. [61]. Further details outlining loss calculated for Madagascar’s mangroves using USGS maps through to 2005 is available in Giri and Muhlhausen [68].
Figure 3. A Landsat TM Blue-Green-Red 354 false color composite from July, 2011 is shown in the top left panel wherein mangroves appear primarily in shades of red. Mangrove coverage from three national data-sets (i.e., Giri [69]; CEPF [71]; Harper et al. [72]) is overlain on the Landsat composite in the three other panels. This comparison illustrates how data produced by Giri [69] provide the most comprehensive (in terms of representing actual known mangrove area) and contemporary (in terms of year) mangrove coverage; as is illustrated by the variably represented mangrove covered islands in the middle-right of each panel. The area shown in all four panes is a portion of MHJ.
Remotesensing 08 00106 g003

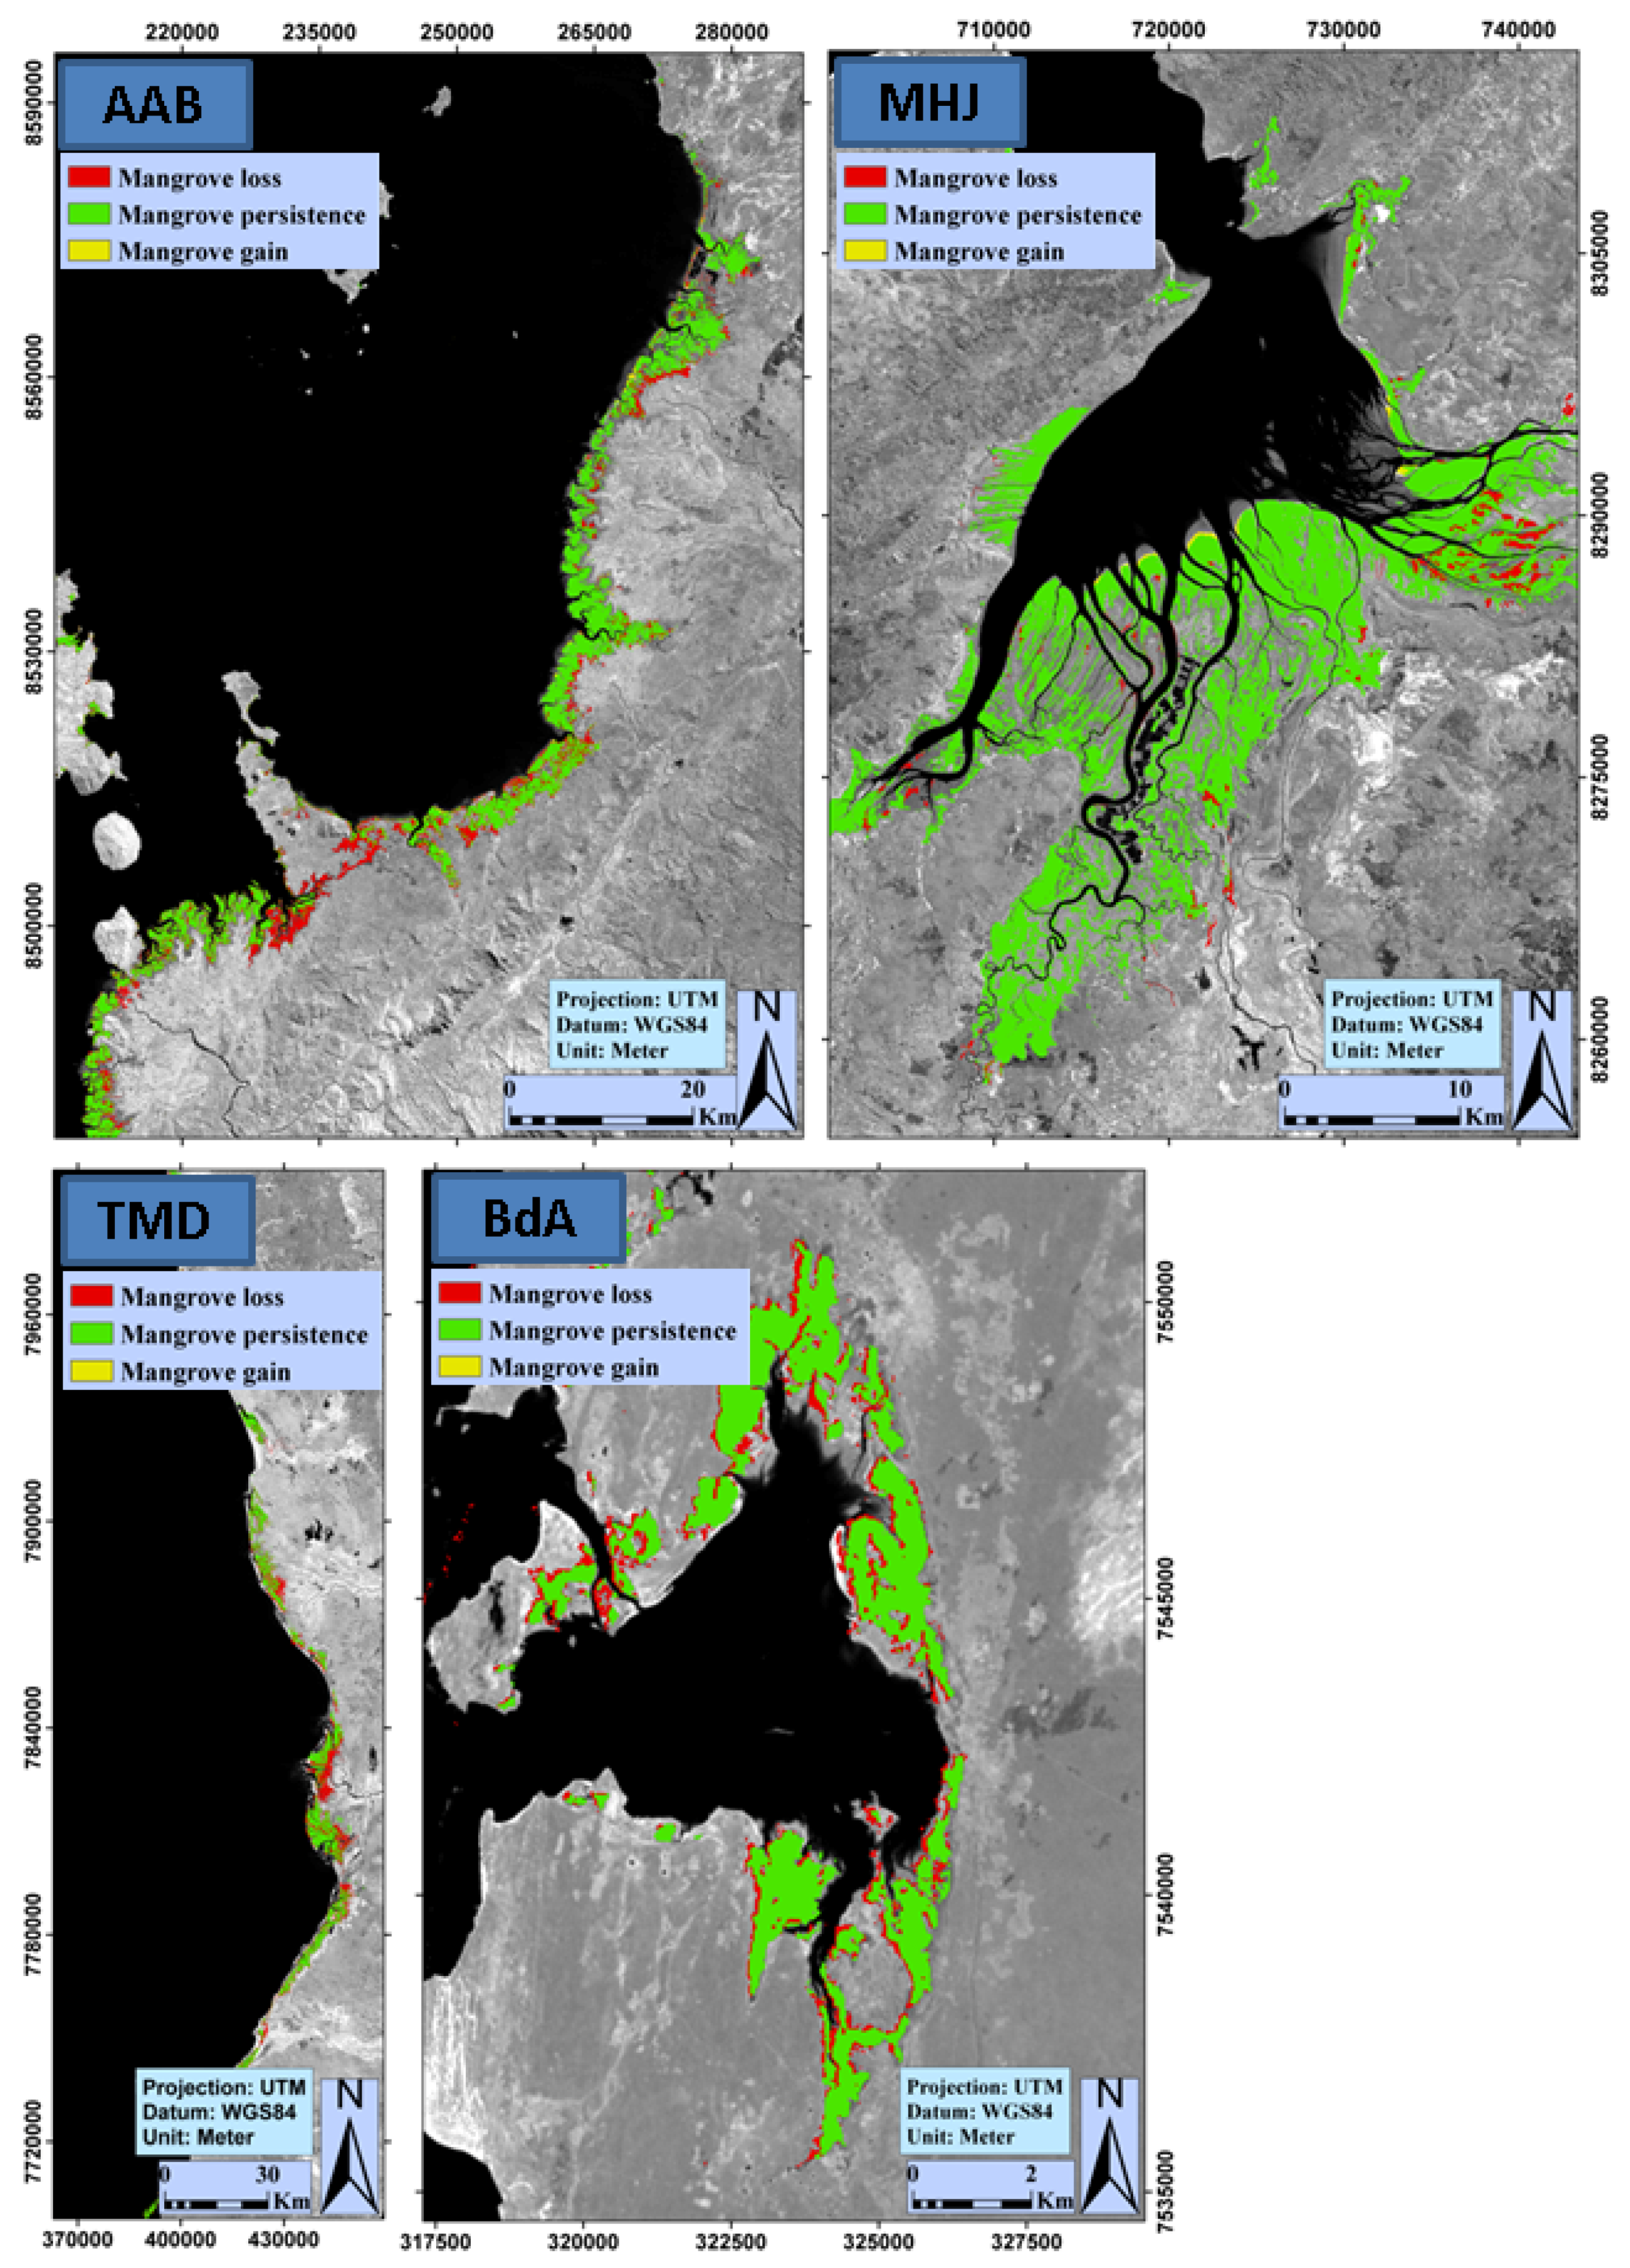
3.2. Mangrove Distribution and Dynamics: 1990–2010

3.2.1. National-Level Distribution and Dynamics

According to the USGS-produced Landsat-derived maps of national-level mangrove coverage from 1990, 2000 and 2010 [69], as of 2010 Madagascar contained approximately 213,000 ha of mangrove ecosystems distributed primarily along the west coast, with scattered, isolated pockets found on the north east coast (Figure 1). Analysis of the 1990, 2000 and 2010 USGS maps indicates that from 1990 to 2010, there was a country-wide net loss (i.e., loss-gain) of 21% (i.e., 57,359 ha).

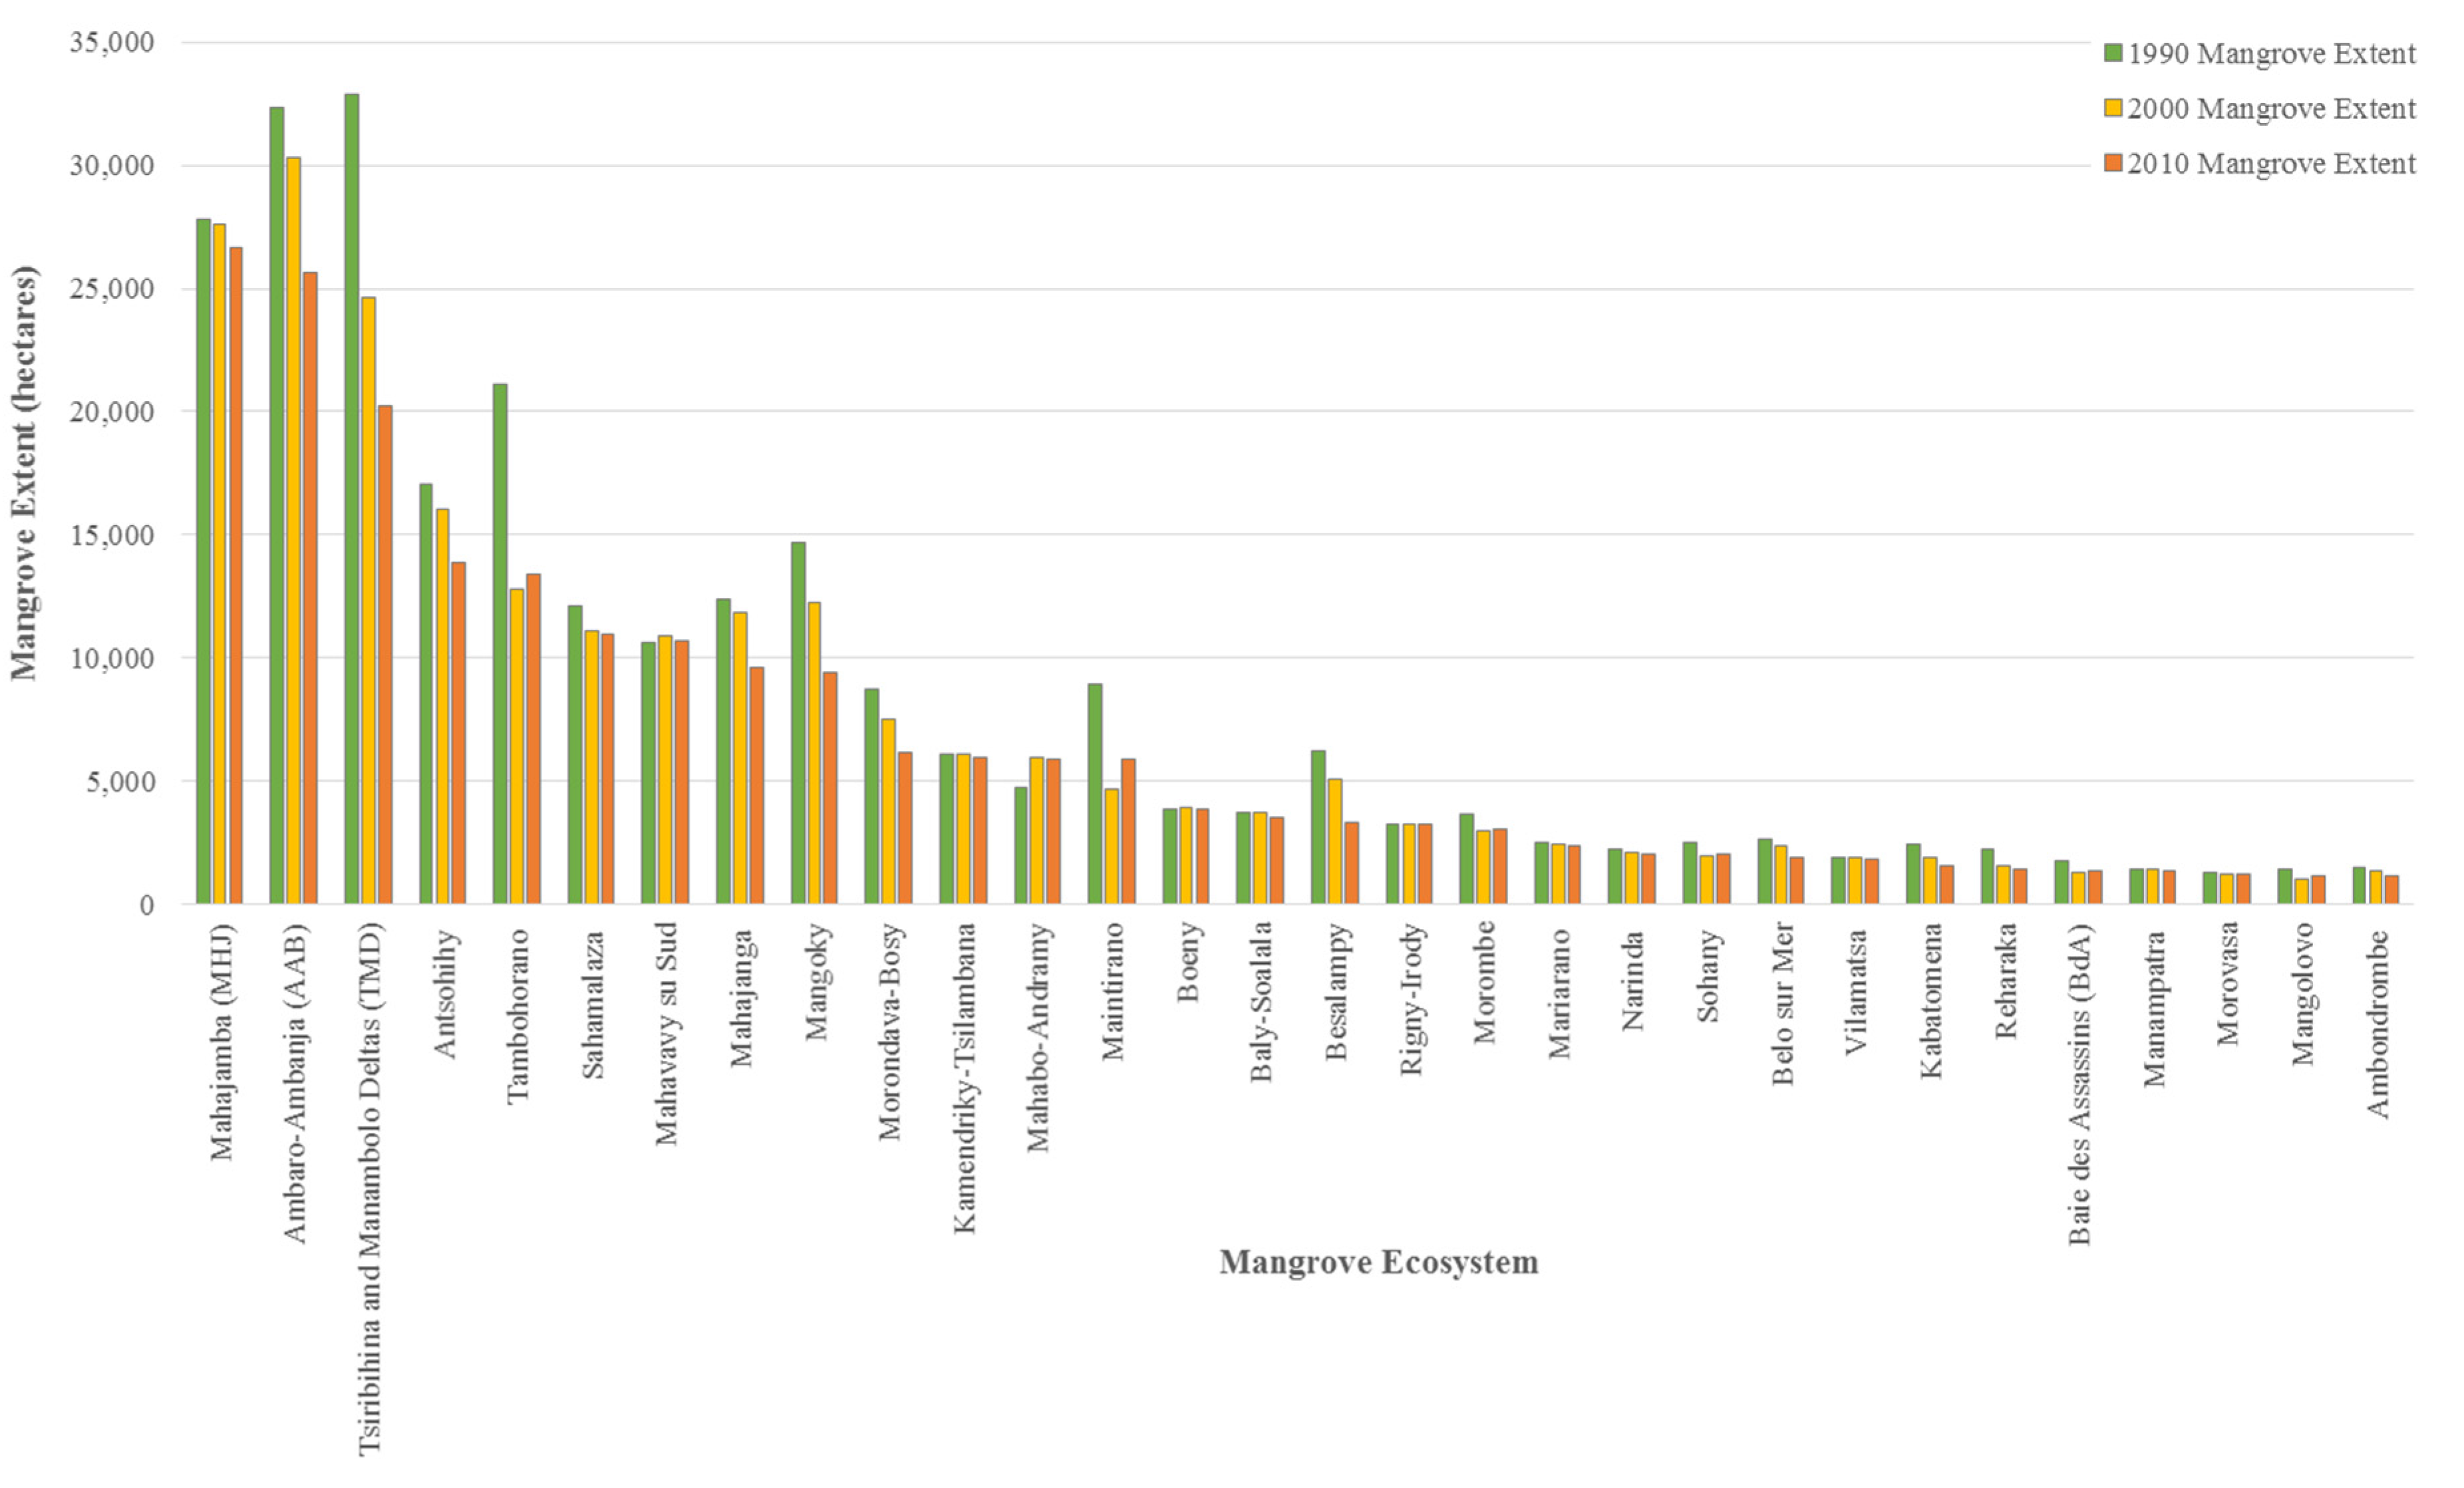
3.2.2. Ecosystem-Level Dynamics

Considered independently, there are nearly 100 distinct, non-contiguous mangrove ecosystems in Madagascar; however, over 200,000 ha (circa 2010) are represented by 30 primary ecosystems, each greater than 1000 ha in size. Of these primary ecosystems, according to the USGS maps, as of 2010, MHJ had the greatest extent (i.e., 26,667 ha), followed by AAB (i.e., 25,664) and TMD (i.e., 20,242 ha) (Table 3; Figure 4). BdA, ranked as Madagascar’s 26th largest mangrove ecosystem, containing 1362 ha as of 2010. The extent in ha for 1990, 2000 and 2010 according to USGS-produced maps as partitioned by primary mangrove ecosystems are provided in Table 3 and Figure 4.
As previously reported in Jones et al. [25], and Jones et al. [61], in AAB, the analysis of USGS maps suggest a loss of 7659 ha (23.7%) and gain of 995 ha (3.1%) from 1990 to 2010 (Figure 5). Deforestation is mostly occurring on or near the peninsular base, which separates the two Bays. As described in Jones et al. [61], for MHJ, analyzing the USGS maps indicate 1251 ha were lost (4.5%) and 150 gained (0.5%) from 1990 to 2010 (Figure 5). As compared with other primary mangrove ecosystems in Madagascar, notably AAB, MHJ’s mangroves have remained comparatively stable. Comparisons with terrestrial data (i.e., [72]) also imply that from 2000 to 2005 alone, loss in the terrestrial forests surrounding MHJ exceeded mangrove loss from 2000 to 2010. However, mangrove loss in MHJ does appear to be increasing, particularly in the east. For TMD, the analysis of the USGS maps indicated a net loss of 12,612 ha (38.4%) from 1990 to 2010 (Figure 5). For BdA, analyzing the USGS maps indicated that from 1990 to 2010 there was a net loss of 360 ha (20.9%) (Figure 5).
Table 3. The extent in hectares for Madagascar’s primary mangrove ecosystems for 1990, 2000 and 2010, based on partitioning USGS-produced Landsat-derived national-level mangrove cover maps for 1990, 2000 and 2010 [69] in to primary (i.e., >1000 ha) mangrove ecosystems. Extents are ordered from largest to smallest based on 2010 values.
Mangrove Extent (Hectares)
Mangrove ecosystem199020002010
Mahajamba Bay (MHJ)277782757726677
Ambaro-Ambanja Bays (AAB)323283032125664
Tsiribihina and Manambolo Deltas (TMD)328542465120242
Antsohihy170811606513838
Tambohorano211401278113418
Sahamalaza121071106310956
Mahavavy su Sud106151087010654
Mahajanga12375118149574
Mangoky14684122479431
Morondava-Bosy874375006123
Kamendriky-Tsilambana610261025924
Mahabo-Andramy472159395905
Maintirano893746445900
Boeny387038883867
Baly-Soalala368736833507
Besalampy624750973287
Rigny-Irody322432323231
Morombe365229523035
Mariarano247224122330
Narinda224920582036
Sohany247019842025
Belo sur Mer260323871917
Vilamatsa188118811847
Kabatomena245818821529
Reharaka222915281406
Baie des Assassins (BdA)172313011362
Manampatra140514041327
Morovasa125311991199
Mangolovo14159811172
Ambondrombe146213491109
Total253,765220,792200,492
Figure 4. The extent in hectares for Madagascar’s primary mangrove ecosystems for 1990, 2000 and 2010, based on partitioning USGS-produced Landsat-derived national-level mangrove cover maps for 1990, 2000 and 2010 [69] in to primary (i.e., >1000 ha) mangrove ecosystems. Extents are ordered from largest to smallest based on 2010 values.
Remotesensing 08 00106 g004
Figure 5. Dynamics from 1990 to 2010 for each of four AOIs calculated using the USGS-produced, Landsat-derived mangrove cover maps for 1990, 2000 and 2010 [69]. Background images are Landsat NIR bands from AOI-specific dates provided in Table 1.
Remotesensing 08 00106 g005

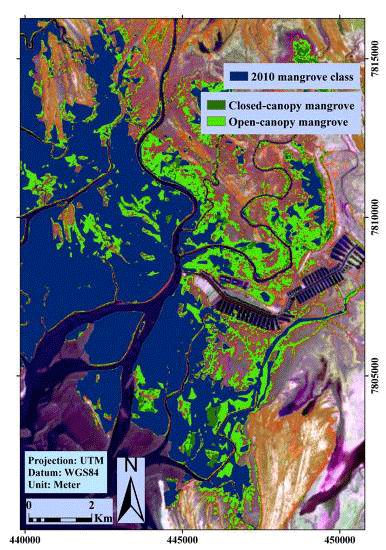
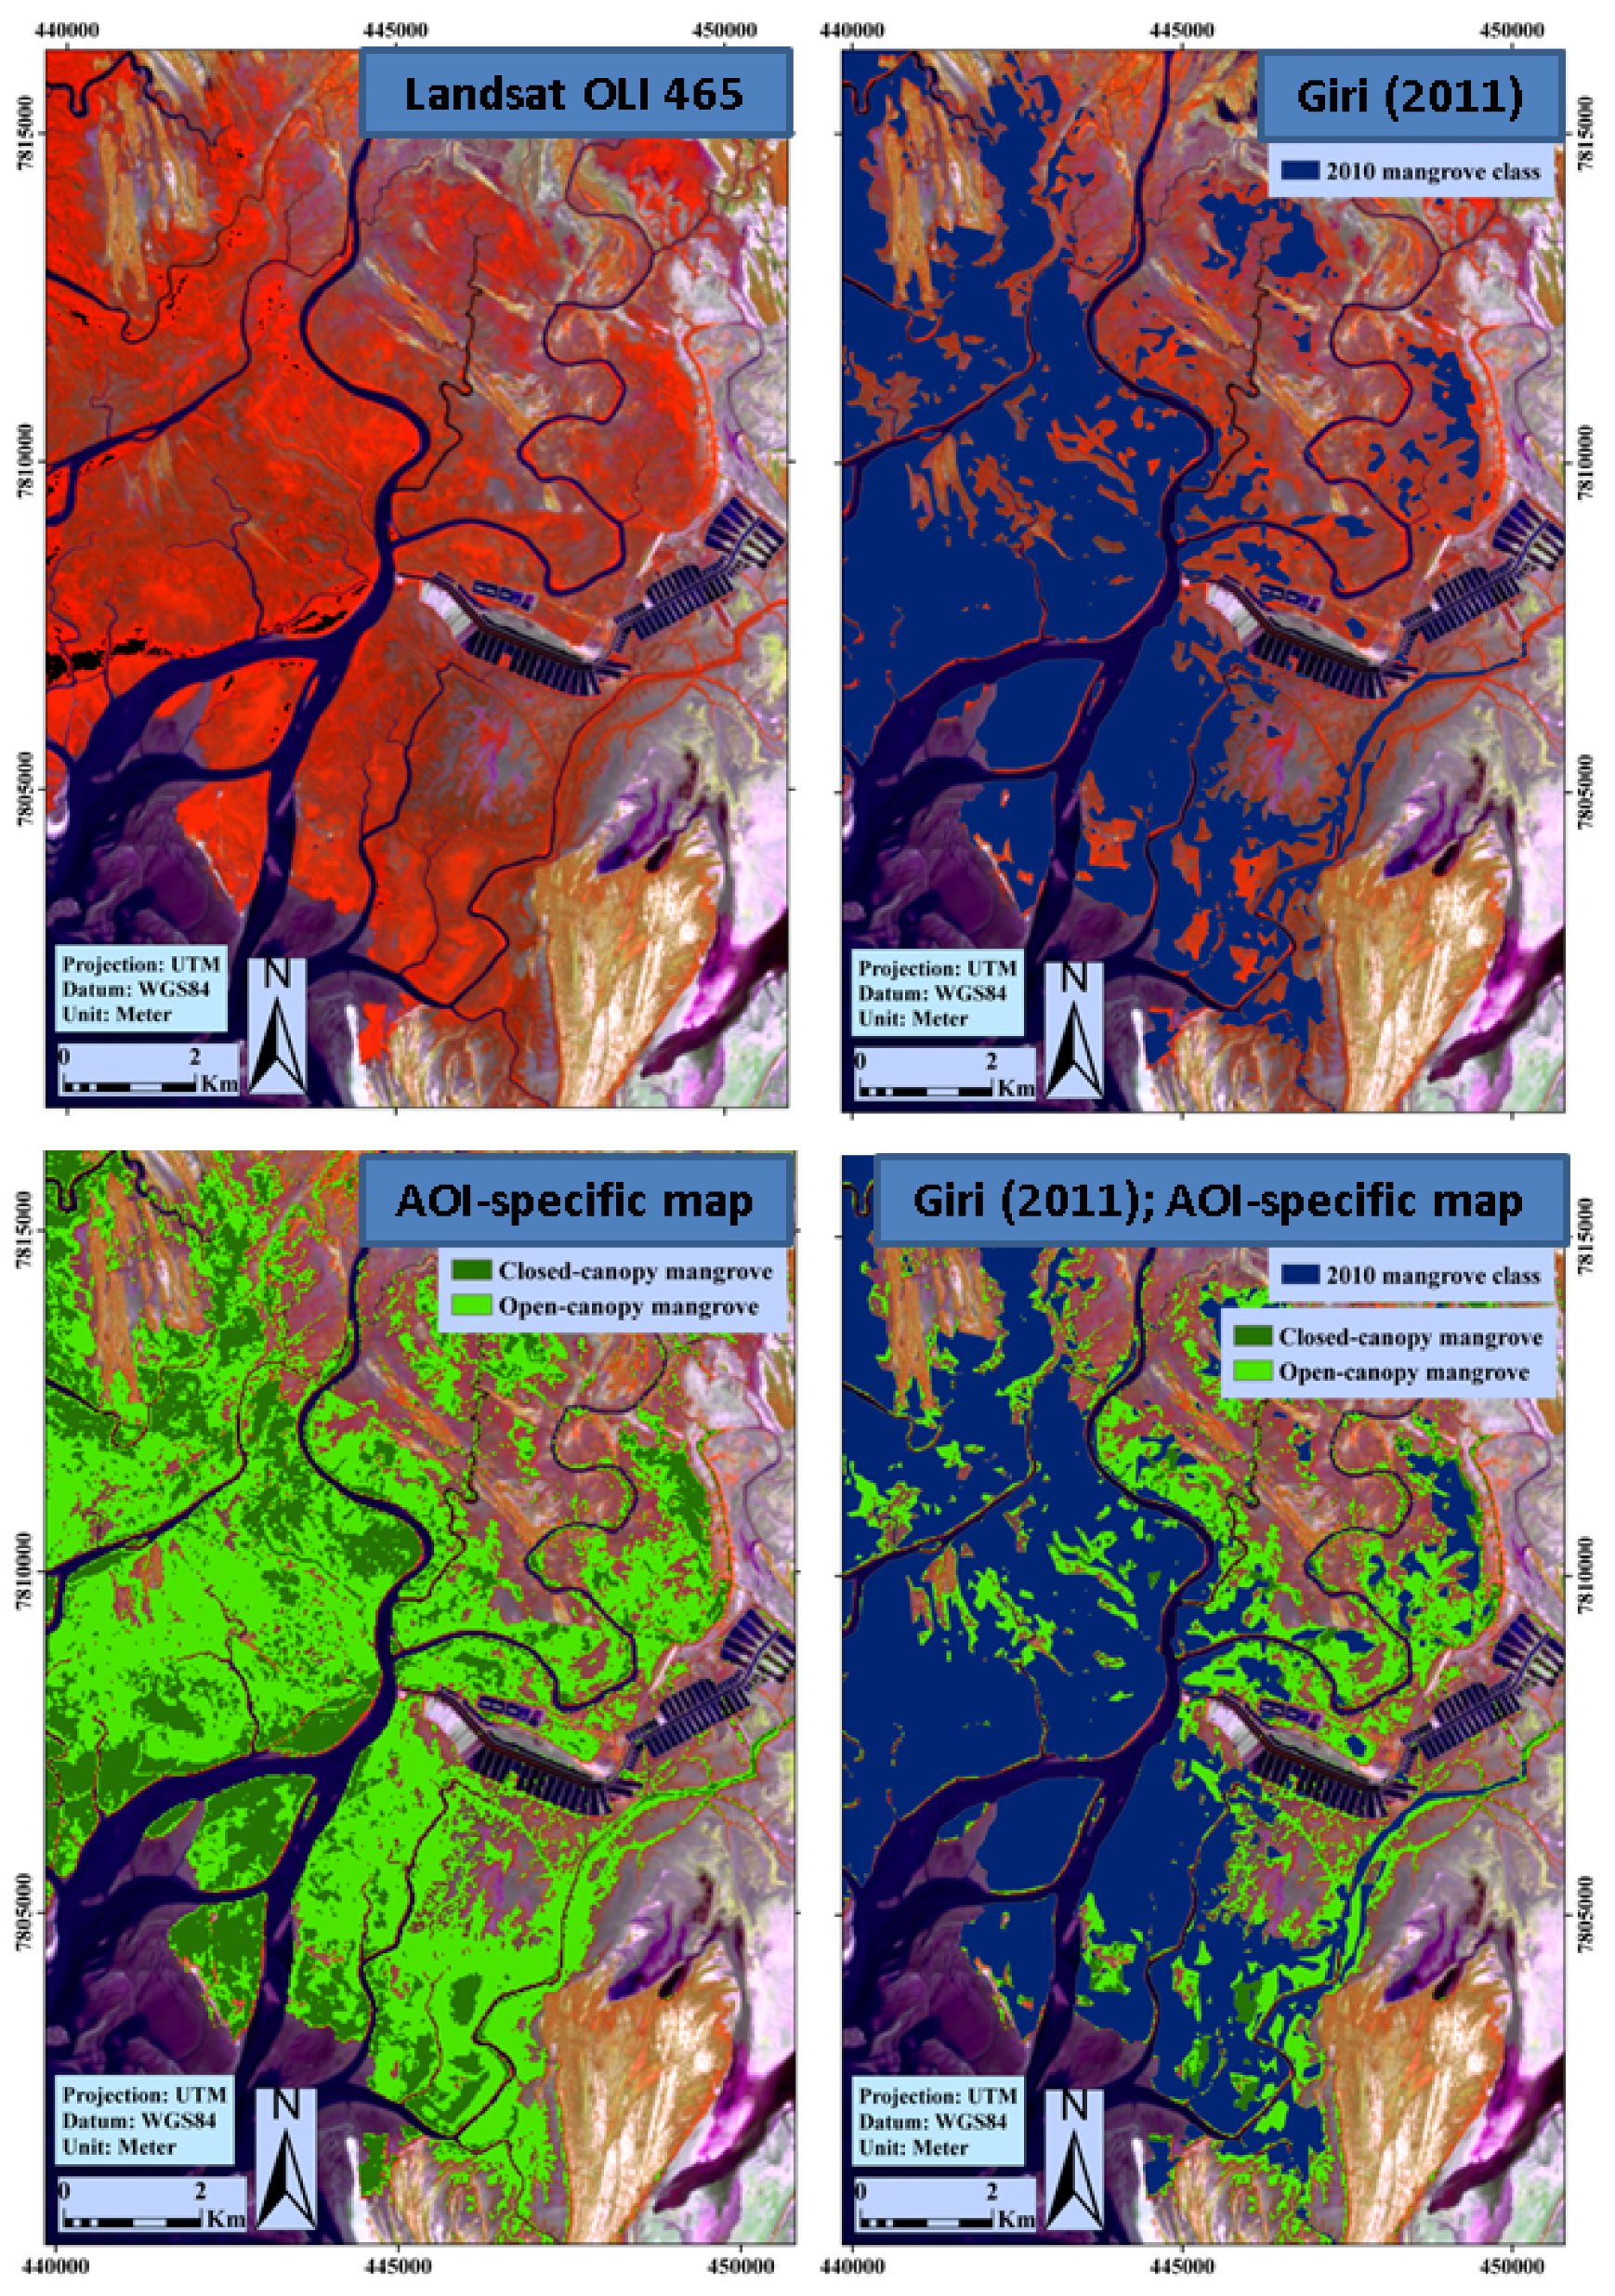
3.3. AOI-Specific Ecosystem-Level Mapping Results

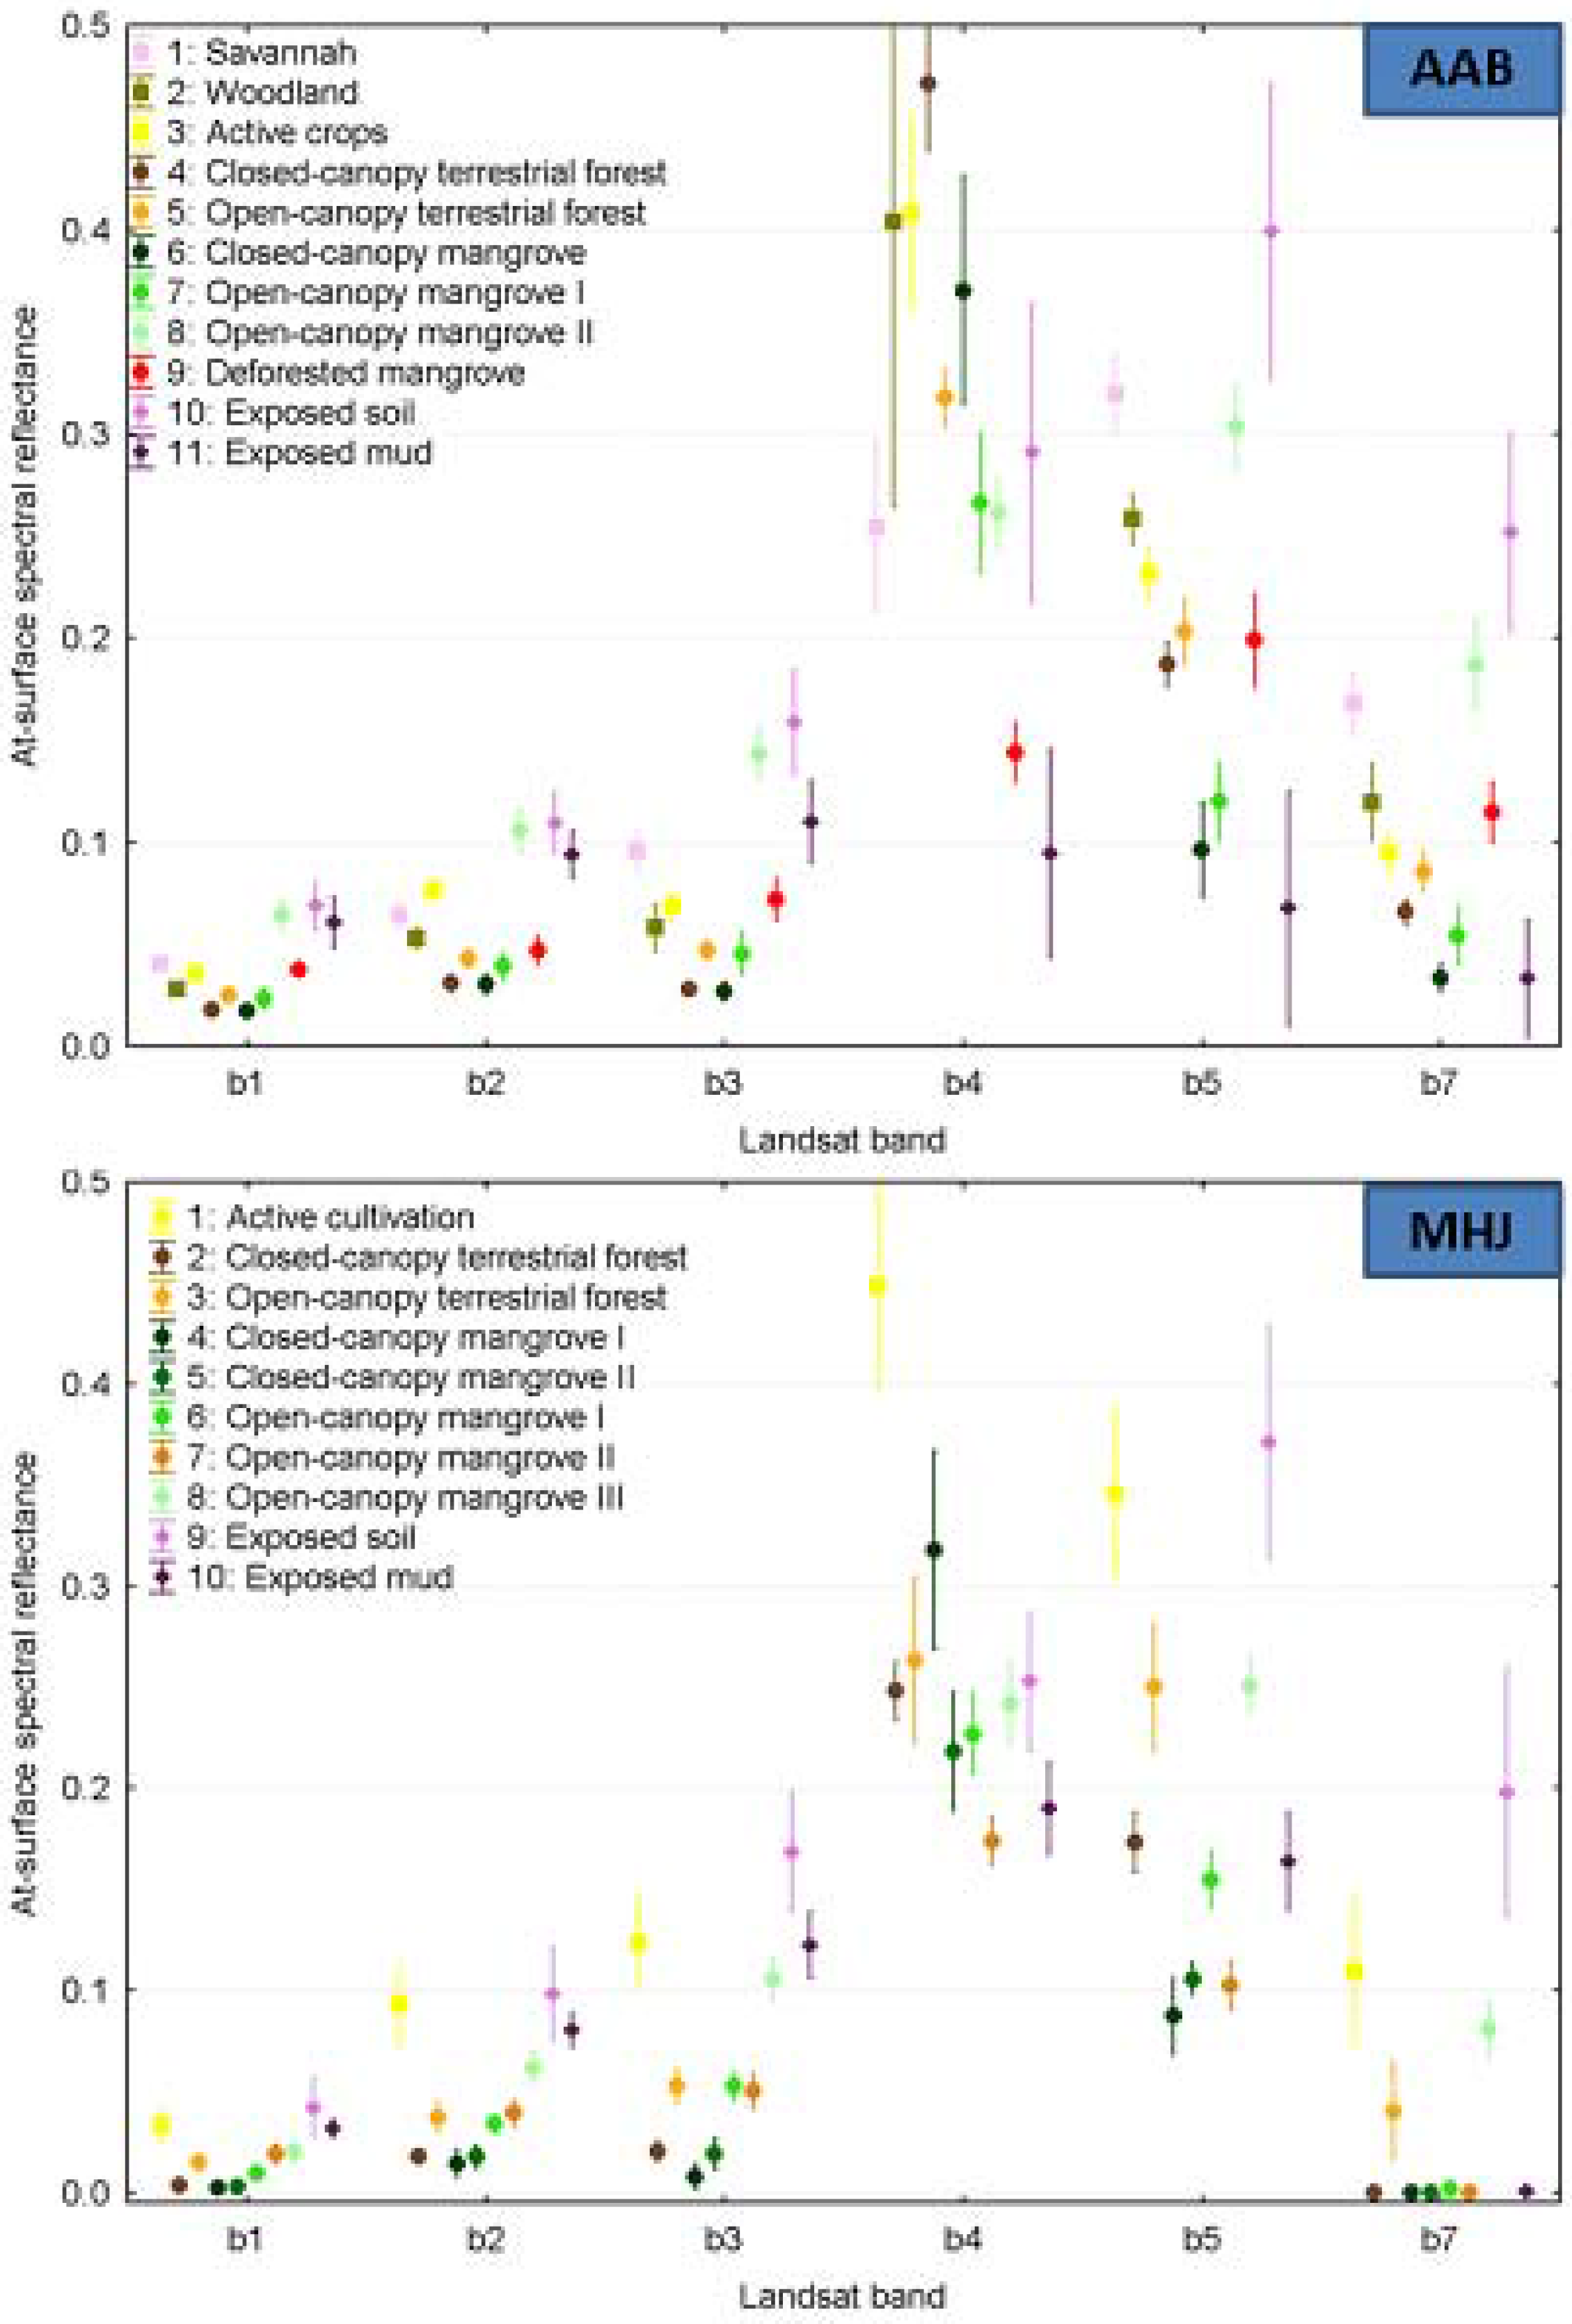
3.3.1. Spectral Separability and Classification Results

As demonstrated through results initially presented in Jones et al. [25] for AAB, and Jones et al. [61] for MHJ (Figure 6), for TMD and BdA, all mapped classes are spectrally separable using specific portions of the electromagnetic spectrum as represented by certain Landsat bands. In particular, the near-infrared (NIR) and short-wave infrared (SWIR) were useful for distinguishing between mangrove types and differentiating mangroves from surrounding mapped categories. In the NIR (0.76–0.90 micrometers (µm)), the spectral distinctiveness of mangrove classes was probably driven by vegetative reflectance relating to the transitional red-edge, internal vegetation structure, and leaf dry-matter content [15,69,99,110]. In the SWIR (1.55–1.75 and 2.08–2.35 µm), differences in reflectance were driven by vegetation and soil moisture content, and canopy-level biogeochemical constituents likely facilitated mangrove differentiation [100]. These results further support previous studies, which demonstrate that SWIR wavelengths help distinguish mangroves from surrounding terrestrial vegetation [25,111]. Mangroves types were also further differentiated in the visible bands (i.e., blue: 0.45–0.52 μm, green: 0.53–0.61 μm, and red: 0.63–0.69 μm).
Figure 6. The mean spectral reflectance (±1 standard deviation) of mapped classes for Ambaro-Ambanja Bays (AAB) and Mahajamba Bay (MHJ) (adapted from [25,61]).
Remotesensing 08 00106 g006
In support of results originally described in Jones et al. [25] for AAB, and Jones et al. [61] for MHJ, ML classification for TMD and BdA resulted in highly accurate AOI-specific maps (Table 4; Figure 7). Our results further indicate that while common as a source of classification error in mangrove studies, confusion with other vegetation classes (e.g., terrestrial forest types) was mostly avoided. As compared with single-class contemporary (i.e., 2010) mangrove coverage provided by the USGS national-level map, it is clear that our classification results provide more detailed and comprehensive representation of mangroves (Figure 8). In total, USGS maps imply 25,664, 26,677, 20,242 and 1362 ha of mangroves for AAB, MHJ, TMD and BdA, respectively. In contrast, AOI-specific maps imply 45,680, 45,107, 28,513, and 1652 ha of mangrove ecosystem for AAB, MHJ, TMD and BdA, respectively. When considering mangrove forest only and excluding classes dominated by shrub/scrub, the amount of mangroves in each AOI is reduced but still markedly higher than USGS estimates (Figure 9). The USGS map under-represents mangrove stands which are naturally lower stature and more open or highly degraded, and completely omits most scrub/shrub-dominated areas and certain narrow linear strips. The under-representation results in conservative distribution estimates, which in turn impacts ranking primary mangrove ecosystems by extent, as undertaken in this study. This is exemplified by MHJ being estimated as Madagascar’s largest mangrove ecosystem based on the USGS map; whereas our AOI-specific map indicates that AAB was slightly larger.
Under-representation of lower stature or sparser mangrove areas associated with national-level USGS maps can also exaggerate dynamics by indicating loss in areas that may actually represent degradation or sparse areas of mangrove on the edge of the limits of detection by the automated algorithms used to create the data. Field observations confirm that certain areas appearing as loss in the USGS maps were in actuality occupied by sparse or degraded mangroves. In addition, given that numerous Landsat images were mosaicked together for each temporal increment to create the USGS maps, the influence of different dates and thus tidal conditions may have also exaggerated dynamics. The potential for exaggerated dynamics in the USGS maps needs to be taken in to account when considering the national-level dynamics presented in this study; though concerns of exaggerated loss must be tempered with an acknowledgement of an under-representation of sparse and degraded mangroves, which leads to initial under-estimates of mangrove distributions from which dynamics are calculated. Bearing in mind the limitations of the single mangrove class represented by the USGS maps, they also provide no context regarding surrounding land-cover categories, including extensive mud flats that once were or could again become mangrove ecosystems. In aggregate, these shortcomings highlight the importance of detailed, contemporary ecosystem-specific localized mapping; which is bolstered by USGS maps being >four years old, providing outdated representation for ecosystems which continue to experience increased and widespread degradation and deforestation.
Table 4. (ad) Classification accuracies, including overall accuracies, Kappa statistics and per-class user’s and producer’s accuracies. Results for AAB and MHJ were previously reported in Jones et al. [25] and Jones et al. [61].
(a)
Area:Class:1234567891011TotalUser’s (%)Commission (%)
AAB:Savannah (1)54300000001058937
Woodland (2)039000000000391000
Active cultivation (3)005100000000511000
Closed-canopy terrestrial forest (4)000540000000541000
Open-canopy terrestrial forest (5)04005400000058937
Closed-canopy mangrove (6)000007990000889010
Open-canopy mangrove I (7)0000011720200858515
Open-canopy mangrove II (8)000000052000521000
Deforested mangrove (9)000000006000601000
Exposed soil (10)083000021530677921
Exposed mud (11)000000000054541000
Total5454545454908154635454666
Producer’s (%)10072941001008889969598100 Overall Accuracy = 93.4%
Omission (%)02860012114520 Kappa = 0.9
(b)
Area:Class:12345678910TotalUser’s (%)Commission (%)
MHJ:Active cultivation (1)63000000000631000
Closed-canopy terrestrial forest (2)06200000000621000
Open-canopy terrestrial forest (3)0172003010077946
Closed-canopy mangrove I (4)0009020000092982
Closed-canopy mangrove II (5)00008800000881000
Open-canopy mangrove I (6)00000600000601000
Open-canopy mangrove II (7)00000060000601000
Open-canopy mangrove III (8)00000006200621000
Exposed soil (9)00000000900901000
Exposed mud (10)0000003006366955
Total63637290906363639063720
Producer’s (%)1009810010098959598100100 Overall Accuracy = 98.6%
Omission (%)0200255200 Kappa = 0.9
(c)
Area:Class:12345678TotalUser’s (%)Commission (%)
TMD:Dense mangrove (1)540000000541000
Sparse mangrove (2)045000000451000
Bare type I (3)005200000521000
Dense forest (4)000540000541000
Sparse forest (5)000045000451000
Wooded grassland-bushland (6)000004500451000
Active agriculture (7)0000009091000
Bare type II (8)00200004850964
Total544554544545948354
Producer’s (%)10010096100100100100100 Overall Accuracy = 99.4%
Omission (%)00400000 Kappa = 0.99
(d)
Area:Class:12345678TotalUser’s (%)Commission (%)
BdA:Spiny forest (1)270000000271000
Barren/exposed (2)030000000301000
Cultivated/degraded/woodland (3)002700000271000
Burnt (4)000270000271000
Water dominated (5)000042000421000
Closed-canopy mangrove (6)000002700271000
Open-canopy mangrove I (7)000000270271000
Open-canopy mangrove II (8)000000027271000
Total2730272742272727234
Producer’s (%)100100100100100100100100 Overall Accuracy = 100
Omission (%)00000000 Kappa = 1
Figure 7. The results of detailed, contemporary, ecosystem-level mapping for four AOIs (i.e., Ambaro-Ambanja Bays (AAB), Mahajamba bay (MHJ), Tsiribihina Manambolo Delta (TMD), and Baie des Assassins (BdA)). The water dominated class is excluded for BdA and is excluded from the figure. For each AOI, the background image is a Landsat NIR band (i.e., band 4: Landsat 5 TM and Landsat 7 ETM+ ; band 5: Landsat 8 OLI) as described in Table 2. Mapping results for AAB and MHJ were originally presented in Jones et al. [25] and Jones et al. [61].
Remotesensing 08 00106 g007
Figure 8. A Landsat OLI 465 false color composite from July, 2014, over the Tsiribihina-Manambolo Delta (TMD) AOI, is shown in the top left panel, wherein mangroves appear primarily in shades of red. The other panels compare USGS-produced national-level mangrove coverage circa 2010 (Giri [69]) to one of the detailed, contemporary, AOI-specific maps produced through this study. The comparison demonstrates how the USGS map (Giri [69]) underrepresents naturally lower stature, more open or highly degraded mangroves and at times omits scrub/shrub and narrow linear strips of mangroves.
Remotesensing 08 00106 g008
Figure 9. The extent of mangroves based on the 2010 national-level USGS-produced Landsat derived mangrove cover map [69] versus the results of AOI-specific contemporary mapping is shown for each AOI. For AOI-specific mapping results, extent is shown based on all mangrove classes including shrub/scrub dominated (i.e., mangrove ecosystem) and based on only classes meeting the definition of forest (i.e., mangrove forest).
Remotesensing 08 00106 g009

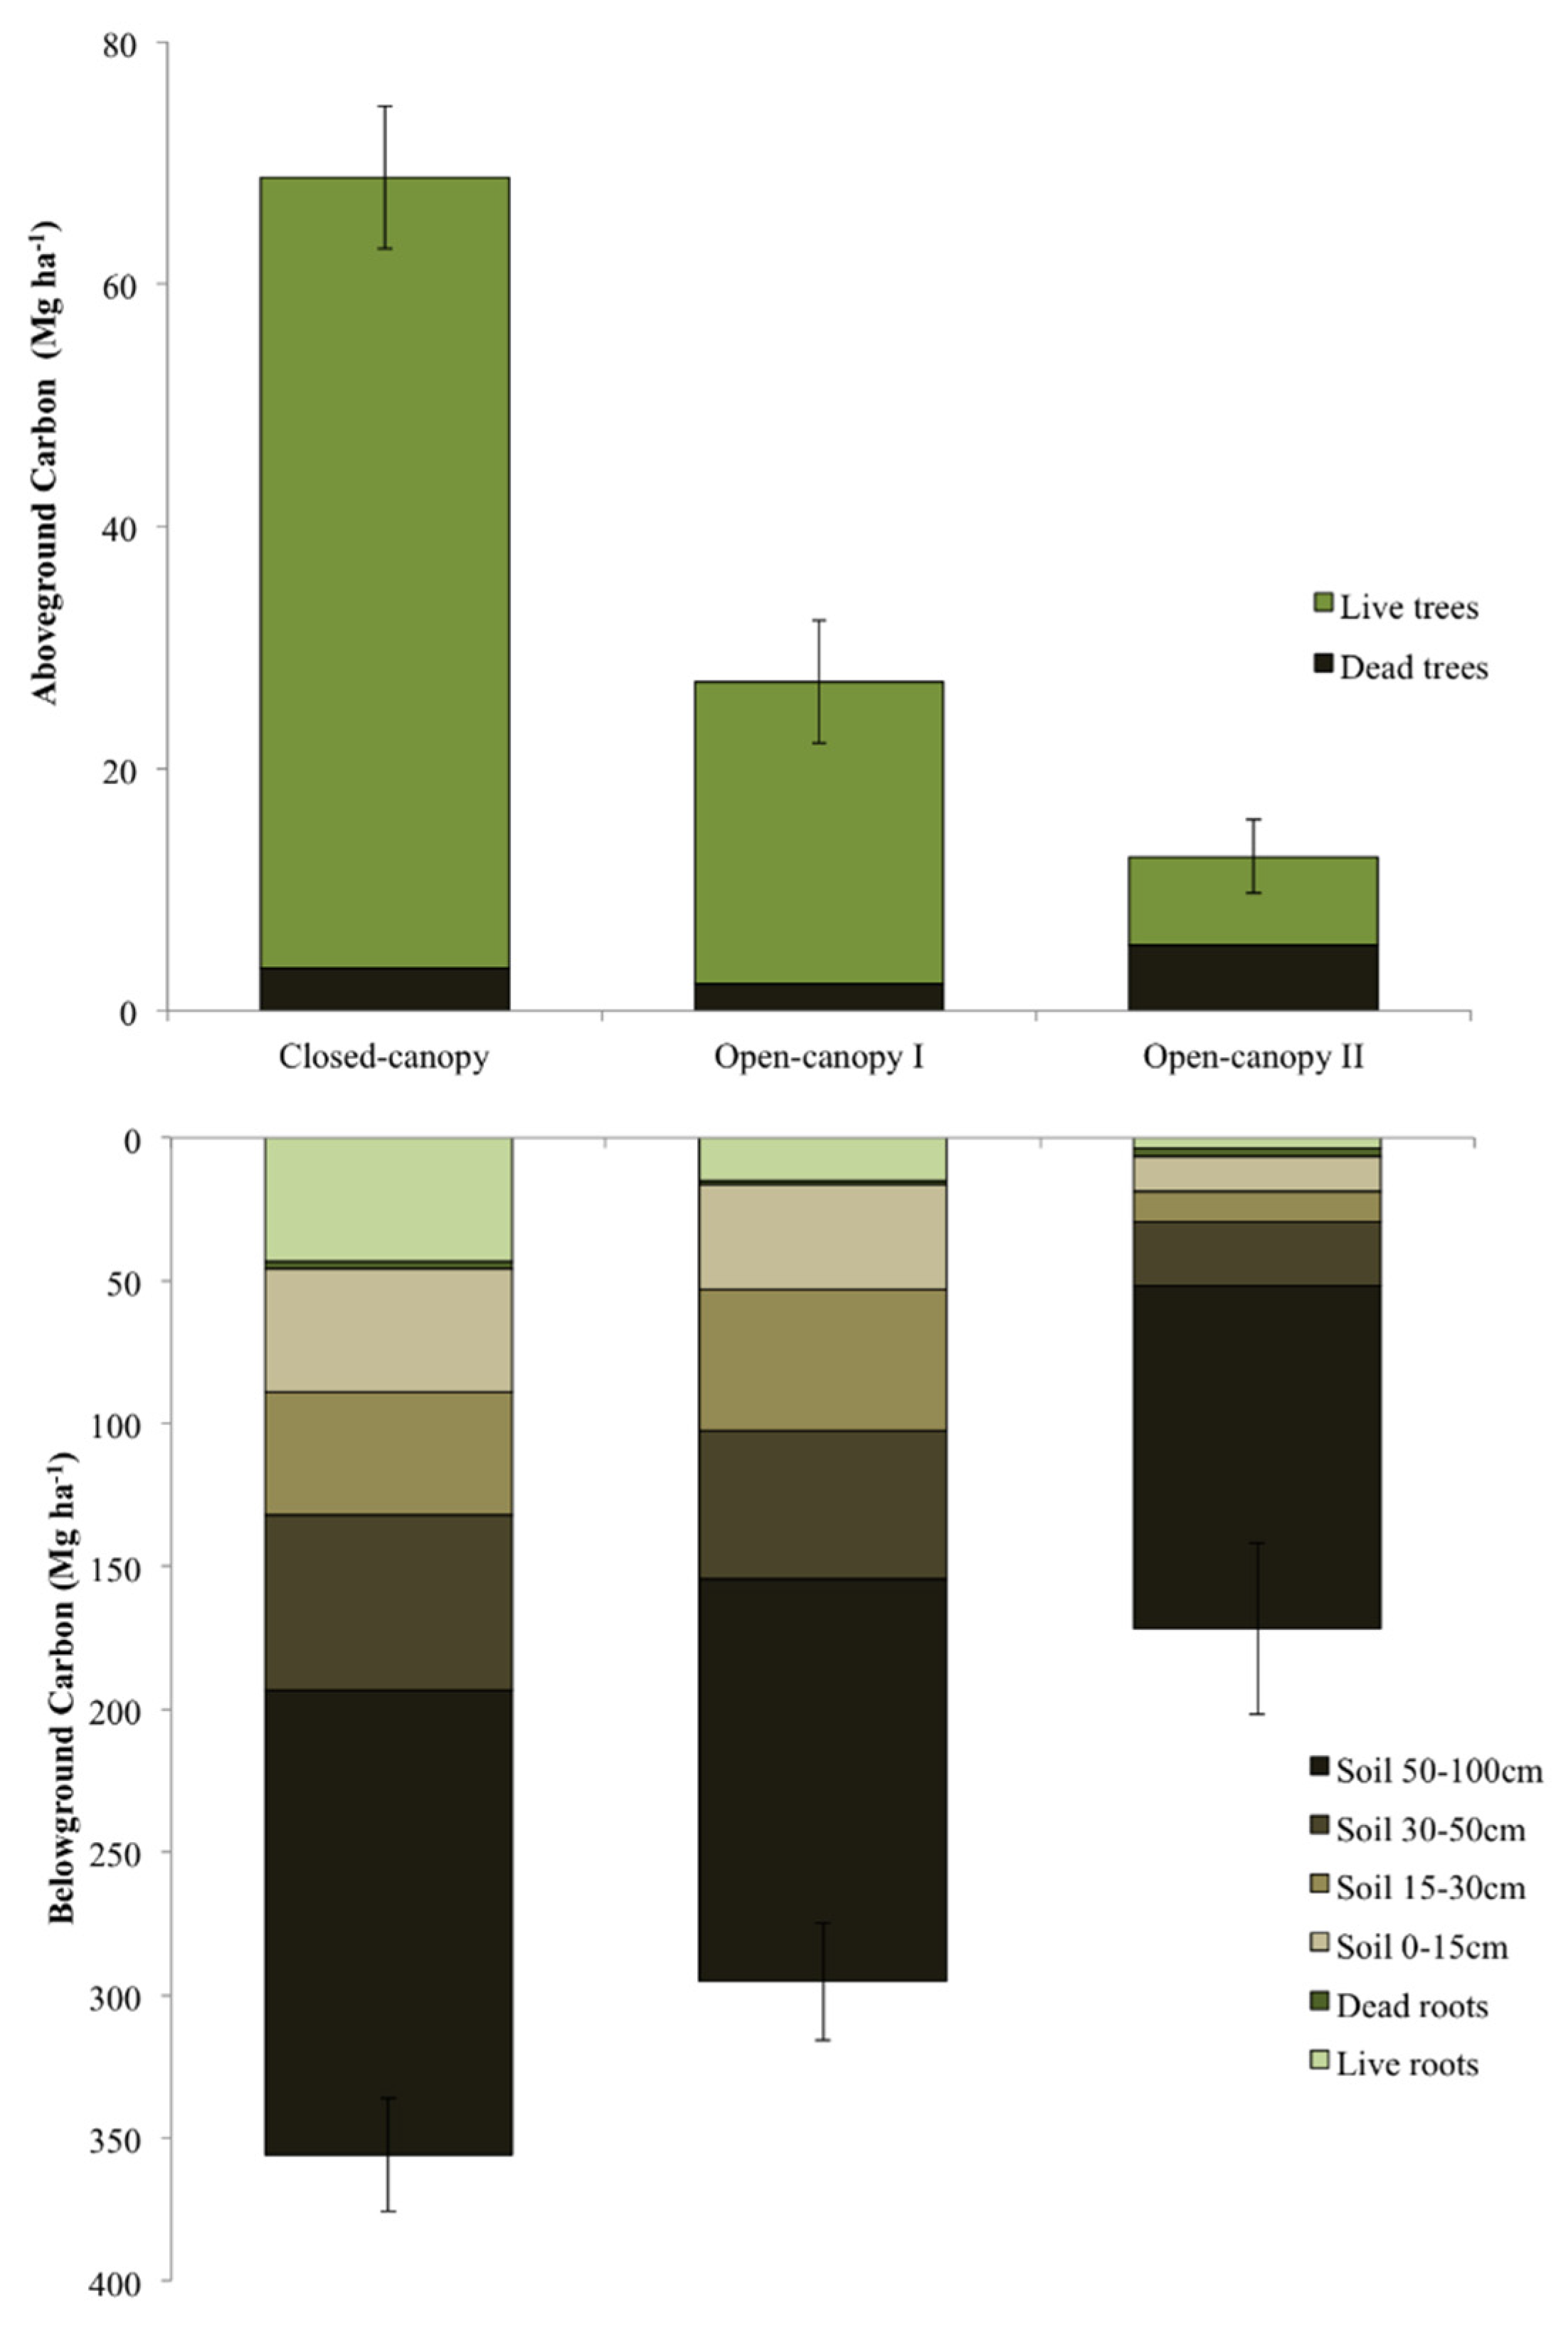
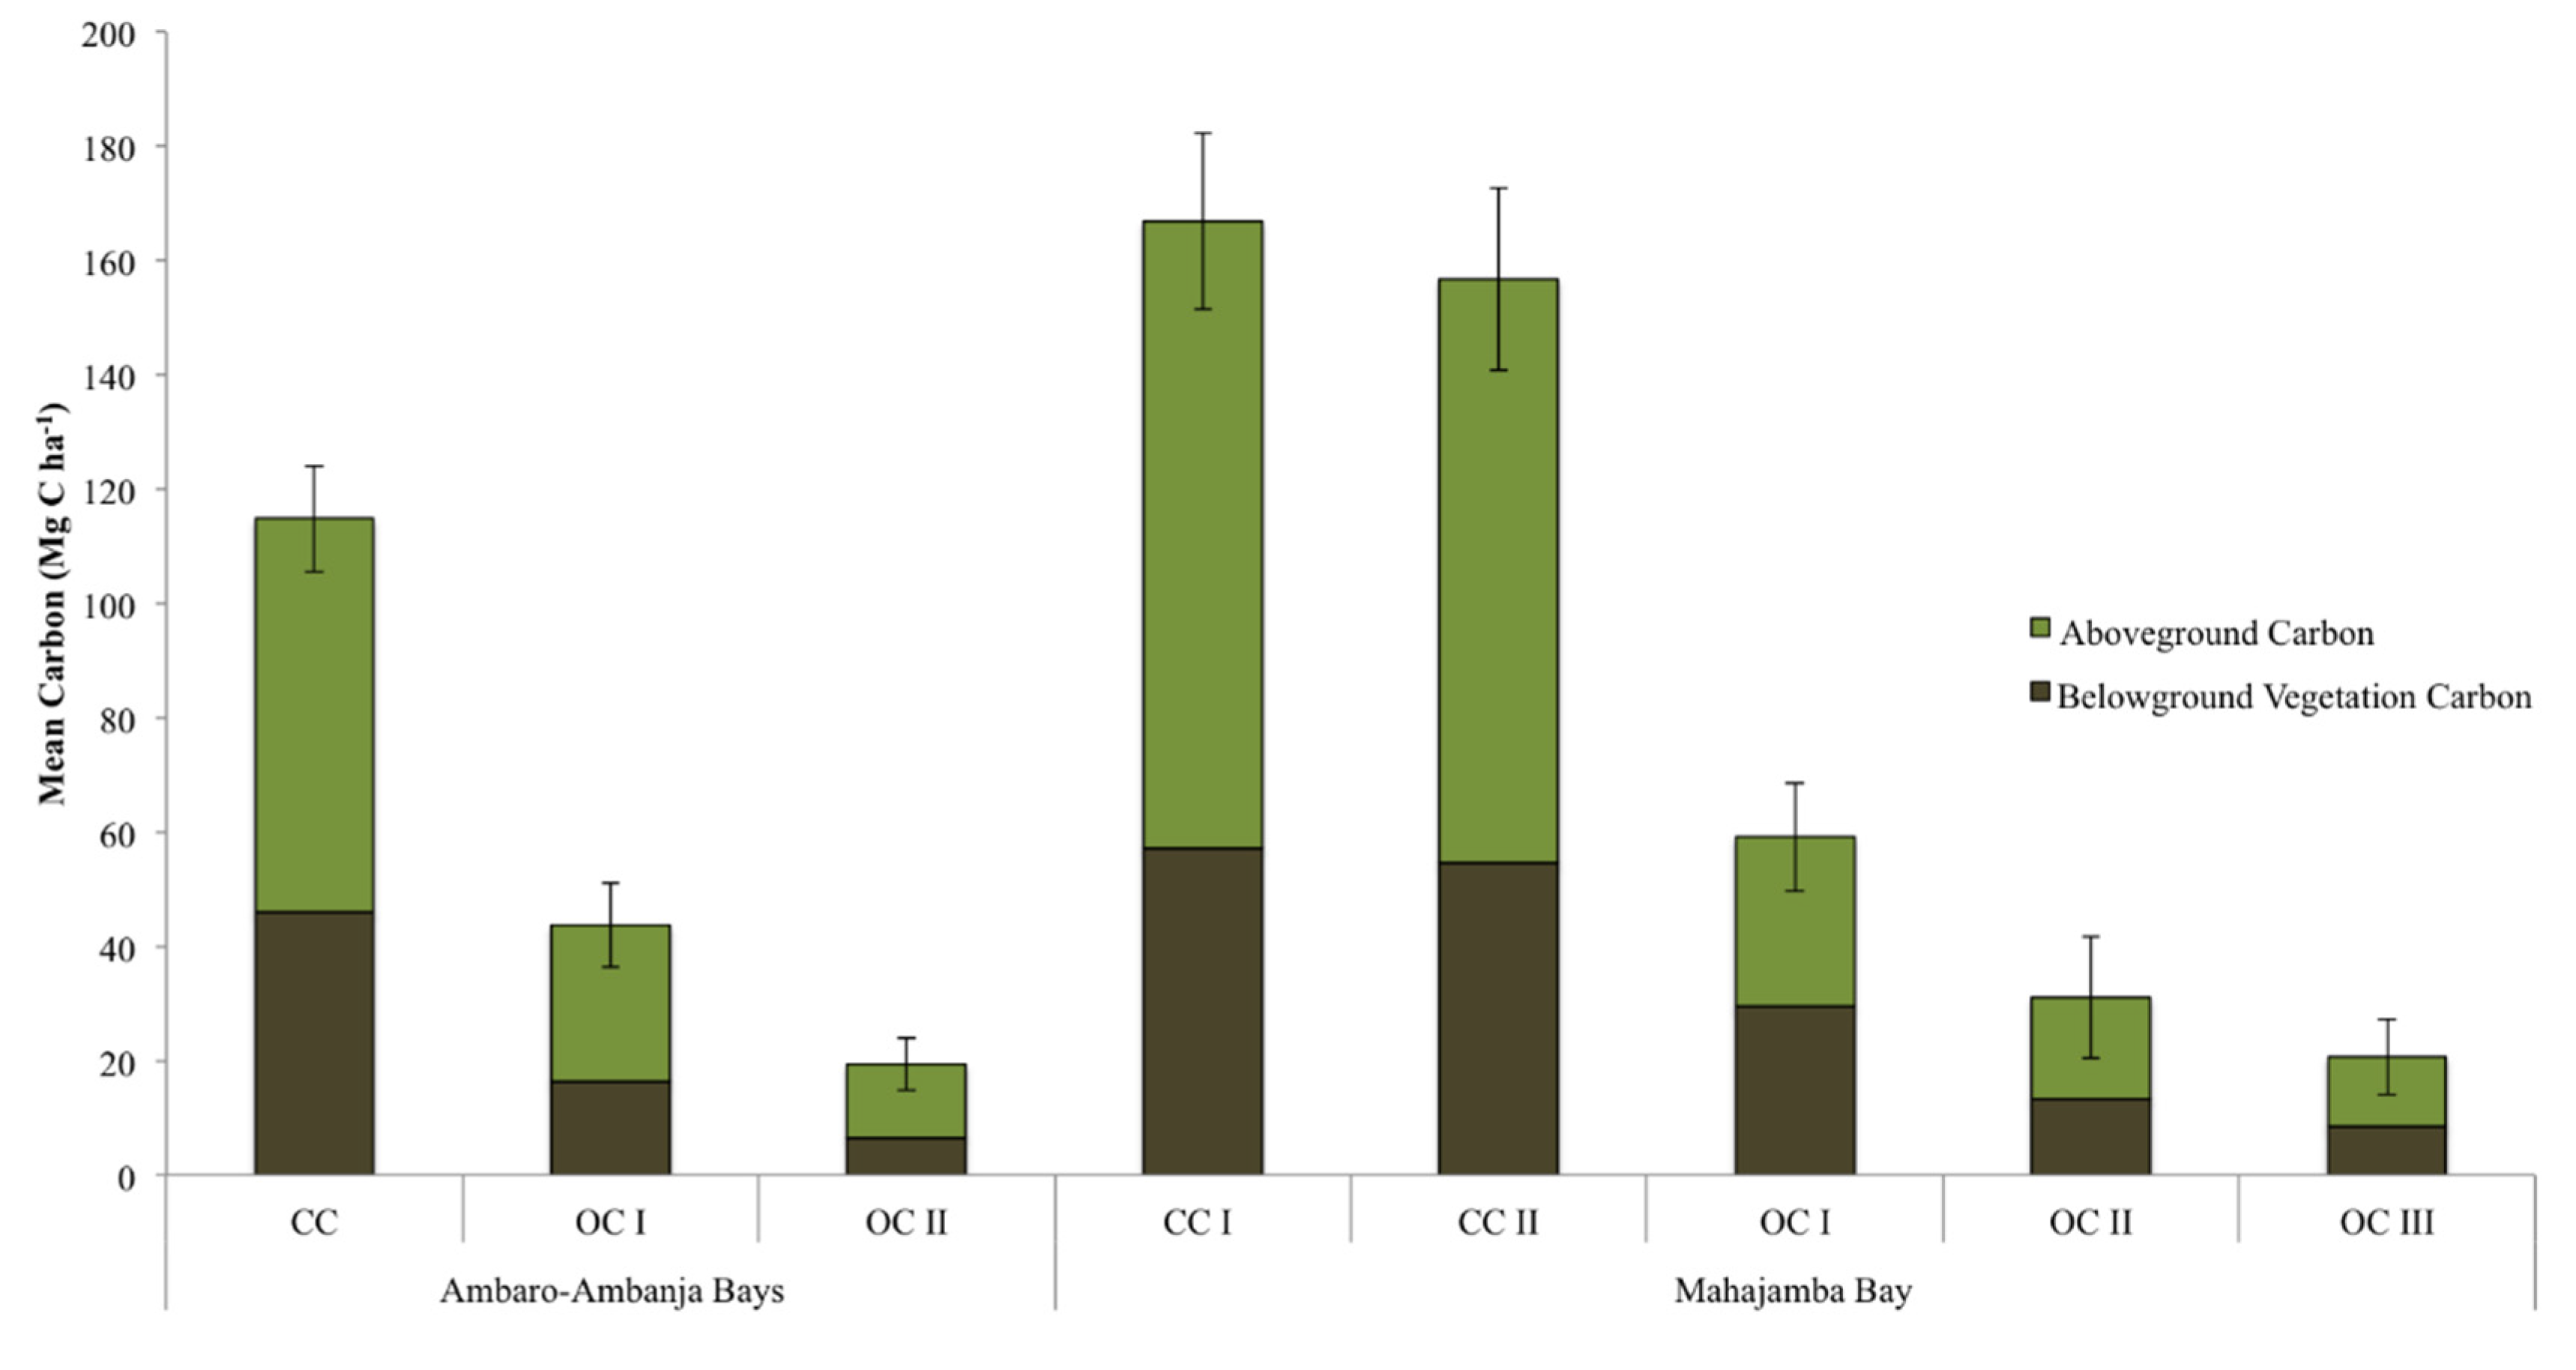
3.3.2. Application of Mapping Results

The results of the national- and ecosystem-level dynamics analysis described in Section 3.2 have supported Blue Venture’s Blue Forests programme in selecting areas in critical need of mangrove conservation and restoration. The contemporary AOI-specific maps described in Section 3.3 are being applied for ecological characterization and carbon stock estimation, to provide baselines for historical mapping/future monitoring, and to support the establishment of carbon projects.
As described in Jones et al. [25] for AAB, and Jones et al. [61] for MHJ, localized mangrove maps were used to stratify mangroves and systematically establish carbon plots based on adaptations of methods proposed by the Centre for International Forestry Research (CIFOR) as outlined in Kauffman and Donato [24]. In total, 55 and 51 carbon plots were established for AAB and MHJ, respectively. Tree measurements summed at the plot-level allowed for summarizing the primary ecological characteristics of each mapped mangrove type, and allowed breaking mangrove classes in to sub-types based on dominant ecological traits (Table 5). Open-canopy areas were typically comprised of sparse and mostly stunted/shrub, low stature mangroves with very open canopies or moderately-dense stands of medium stature trees with relatively open canopies. In contrast, closed-canopy areas were typified by higher stature trees of variable density with well-formed canopies. Exceptions to these typical ecosystem characteristics included, (1) areas dominated by extremely dense, closed-canopy medium/near-tall trees and (2) mature stands which were either highly degraded or naturally open, both of which can spectrally appear as open-canopy mangrove. This overlap highlights a distinct limitation of our maps, which is the inability to reliably detect and distinguish mangrove degradation. While field observations confirm that degradation exists in all AOIs, of both natural and anthropogenic in origin, the full extent of degradation remains uncertain. While mangrove conversion (i.e., deforestation) can be reliably mapped and monitored with moderate resolution data (e.g., Landsat) using established methods, accurately detecting and tracking the subtle sub-pixel modification (i.e., degradation) of mangrove ecosystems remains a vexing challenge. Finer spatial resolution imagery can be employed to accurately detect tree-level degradation, but these data remain prohibitively expensive for small or not-for-profit organizations. Directly incorporating other remotely sensed data–sets, such as those representing forest structure (e.g., LiDAR; radar), into the classification process could greatly increase explanatory power and help further sub-divide existing classes based on degradation; though access to such complimentary data-sets remains limited. Even if able to accurately detect degradation, it would remain difficult to confidently partition natural versus anthropogenic. Despite the limitations of our mangrove classes, they are spectrally distinct and field observations confirm that they are ecologically different and meaningful.
For AAB and MHJ, the tree diameter and height measurements collected in plots were used as input in allometric equations to calculate above-ground biomass and estimate carbon stocks. Tree below-ground biomass was calculated with a generalized equation presented in Komiyama et al. [112]. Equations found in Kauffman and Donato [24] were used to estimate the biomass of standing dead wood. Soil samples taken at the center of each plot allow for the determination of soil organic carbon (SOC), which is still ongoing. For AAB, preliminary SOC was estimated using a modified Walkley-Black method [113,114,115] from samples sent to the Laboratoire des Radio Isotopies (LRI) in Antananarivo, Madagascar. Estimates of carbon calculated based on plot measurements in all AOIs were scaled to the ha-level.
As presented in Jones et al. [61,62], and representing the first total carbon stock estimates for a mangrove ecosystem in Madagascar, total carbon stock estimates in AAB varied from 126.42 to 570.72 Mg·C·ha−1, with an overall mean of 356.36 (±16.96) Mg·C·ha−1 (Figure 10). Average vegetation carbon was highest within the tall-stature closed-canopy mangroves (114.8 (±9.3) Mg·C·ha−1). In comparison, open-canopy I and open-canopy II mangroves had average vegetation C values of 43.6 (±7.3) Mg·C·ha−1 and 19.3 (±4.6) Mg·ha−1 respectively. Mean SOC values, based on soil depth up to 100 cm, ranged from 165.2 (±29.1) Mg·C·ha−1 for open-canopy II mangroves, to 278.80 (±20.99) Mg·C·ha−1 for open-canopy I mangroves, and 309.87 (±19.36) Mg·C·ha−1 for closed-canopy mangroves. Total carbon stock estimates of trees (i.e., above- and below-ground) in MHJ varied from 2.97 to 279.49 Mg·C·ha−1, with an overall mean of 100.96 (±10.49) Mg·C·ha−1 (Jones et al. [61,62]) (Figure 11). The closed-canopy I class, wherein tree stature was largest and tree density highest, had the highest carbon values (166.82 (±15.38) Mg·C·ha−1).
The differences in carbon stock estimates between closed- and open-canopy classes in AAB and MHJ (Figure 11) reflect variable forest stature and density and supports that larger, taller, denser trees contain significantly greater amounts of carbon. The difference in carbon stocks between the two AOIs is influenced by disproportionate amounts of higher stature trees in MHJ as compared with AAB. Collectively, these estimates support a growing body of evidence that mangroves are amongst the most carbon-dense forests in the tropics, with similar above- and larger below-ground stocks than terrestrial tropical upland systems [14,17,21,22,23,116,117,118,119,120,121].
Table 5. Mangrove class, species dominance, average tree height (m) (± standard error (SE)), average dbh (cm) (±SE) and average trees per hectare (ha-1) (± SE) for mapped mangrove categories. Adapted from Jones et al. [25] and Jones et al. [61].
ClassCodeDescriptionSpecies DominanceNAverage Tree Height (m)Average dbh (cm)Average Number of Trees (ha−1)
(a) Ambaro-Ambanja Bays (AAB)
Closed-canopy mangroveCCIntact, tall, mature stands A. marina18.614.91250
C. tagal37.3 (± 1.2)10.1 (± 0.5)2625 (± 318)
R. mucronata147.0 (± 1.3)10.1 (± 3.0)4719 (± 1133)
S. alba15.610.65300
Mixed species26.7 (± 1.6)11.3 (± 2.5)1825 (± 248)
Very dense medium-tall stands R. mucronata24.8 (+ 0.1)7.8 (± 1.1)5600 (± 1838)
Open-canopy mangrove IOC IMedium stands C. tagal74.6 (± 0.8)7.5 (± 1.6)3300 (± 8.49)
R. mucronata64.2 (± 0.6)7.3 (± 1.3)2160 (± 498)
Mixed species24.8 (± 0.1)9.5 (± 2.0)1800 (± 141)
Naturally open/very degraded tall Mixed species45.7 (± 0.3)10.1 (± 1.2)1525 (± 35)
very dense short stands C. tagal52.5 (± 0.3)5.1 (± 0.9)2780 (± 750)
Open-canopy mangrove IIOC IIStunted, scrub ecosystems A. marina41.7 (± 0.5)4.6 (± 0.2)1306 (± 554)
(b) Mahajamba Bay (MHJ)
Closed-canopy mangrove ICC ITall, mature stands; canopy >80% closedA. marina710.24 (± 0.52)13.68 (± 1.01)1571 (± 255)
R. mucronata25.62 (± 0.55)7.27 (± 1.69)4900 (± 1500)
S. alba19.398.315100
Mixed species312.48 (± 1.40)18.18 (± 1.56)1108 (± 208)
Closed-canopy mangrove IICC IITall mature stands; canopy >60% closedA. marina107.68 (± 0.56)12.95 (± 1.26)895 (± 102)
Mixed species27.74 (± 0.04)12.45 (± 0.08)1412 (± 12)
Open-canopy mangrove IOC IShort-medium stands; canopy 30%–70% closed; moderately influenced by background soil/mudA. marina63.32 (± 0.16)4.85 (± 0.43)1417 (± 226)
R. mucronata13.217.392200
X. granatum15.4110.841300
Mixed species54.33 (± 0.44)7.62 (± 0.86)1185 (± 237)
Open-canopy mangrove IIOC IIShort-medium stands; canopy 30%–70% closed; significantly influenced by background soil/mudC. tagal23.39 (± 0.18)6.18 (± 0.12)963 (± 238)
R. mucronata44.63 (± 0.30)7.85 (± 1.66)1388 (± 449)
Open-canopy mangrove IIIOC IIIStunted, short stands, very sparse; canopy < 30% closed; dominated by exposed soil/mudA. marina72.31 (± 0.17)3.96 (± 0.18)1089 (±134)
Figure 10. Total vegetation carbon and soil organic carbon stocks for the Ambaro-Ambanja Bays, Northwest Madagascar. Error bars represent ± SE of total carbon stocks. Adapted from Jones et al. [62] with permission of Springer).
Remotesensing 08 00106 g010
Figure 11. Above- and below-ground mangrove vegetation carbon estimates for the Ambaro-Ambanja Bays (AAB) [62] and Mahajamba Bay (MHJ) [61], Madagascar. Error bars represent ± SE of total vegetation carbon stocks. Adapted from Jones et al. [61].
Remotesensing 08 00106 g011
Mapping and modelling of historical ecosystem loss is a critical element in both the assessment of feasibility and the development of carbon projects. The generation of carbon credits through the conservation, restoration and reduced-impact use of mangroves has the potential to catalyze and fund sustainable mangrove management in coastal communities, augmenting existing livelihoods, preparing for climate change and safeguarding biodiversity. While national-level datasets are very valuable for the initial selection of potential project sites, the limitations outlined in Section 3.3.1 prevent them from being suitable for ecosystem-specific/project-scale historical deforestation analysis in Madagascar. The existing (i.e., AAB and MHJ) and new (i.e., TMD and BdA) AOI-specific maps presented in here can be used as a starting point for more detailed project-scale deforestation analysis, and also as a baseline for future project monitoring.
Working with local communities, the University of Antananarivo and other partners in AAB, the Blue Forests programme is using the data described above to assess the feasibility of a community-centered mangrove carbon project validated under the VCS standard (www.v-c-s.org), which focusses on the locally-led conservation and sustainable use of AAB’s mangrove resources.
In TMD, in addition to supporting WWF Madagascar West Indian Ocean Programme Office’s broader work in the region, the mapping detailed herein was also central to assessing the feasibility of a mangrove carbon project in the region].
In BdA, Blue Ventures is supporting communities to develop a Plan Vivo mangrove carbon project. Plan Vivo initiatives differ from other types of forest carbon projects. Whilst they are still measured and valued according to their impact on greenhouse gas emissions, Plan Vivo project design must be community-led. Fifty-two Plan Vivo projects have been initiated throughout the world to date, yet in only three countries (i.e., Kenya, Columbia and Madagascar) are there projects focusing specifically on mangroves.
By piloting and developing mangrove carbon projects in close contact with in-country government institutions, the Blue Forests programme is supplying robust greenhouse gas emissions reductions estimates and helping to integrate mangroves into Madagascar’s national REDD+ strategy.

4. Conclusions

This study presents, for the first time, national-level and mangrove ecosystem specific dynamics for Madagascar from 1990 to 2010, providing an unprecedented overview of mangrove loss. While not without their limitations, our AOI-specific contemporary maps offer numerous improvements over national-level USGS data-sets, providing detailed and accurate coverage of spectrally and ecologically distinct mangrove types and surrounding land-cover categories for two new specific Madagascan mangrove ecosystems (i.e., TMD and BdA); building on and complementing similar maps for AAB and MHJ. Taken as a whole, these maps are the first of their kind for AAB and TMD, and provide updated information and improved thematic detail for MHJ and BdA. The methods used are easily replicable and employ freely available Landsat data. Factoring in their strengths, the primary weakness of our AOI-specific maps is their inability to represent degradation. The ability to accurately detect degradation would be greatly augmented through the incorporation of complementary remotely sensed data-sets (e.g., LiDAR; radar; finer spatial resolution optical imagery) in further mapping and monitoring.
A continuation and acceleration of modification and deforestation of Madagascar’s mangrove ecosystems will jeopardize if not halt key ecosystem services. The extent and consequences of the ripple effects from continued loss and degradation in to surrounding ecosystems is unknown. To help safeguard the long-term status of Madagascar’s mangrove forests, improved resource management is required. The AOI-specific maps described in this study are being applied through Blue Ventures’ Blue Forests programme towards standardizing replicable methods for improved, community-led mangrove resource management throughout Madagascar’s mangroves and beyond. Resulting carbon stock estimates for AAB and MHJ include the first total (i.e., above- and below-ground including soil) estimates published for Madagascar (i.e., [25]), and the first total-tree estimates published for MHJ (i.e., [61]. While carbon stock estimates for MHJ are limited to trees, they are still high, consistent with regional estimates, and highlight the importance of this ecosystem towards climate change mitigation. Ongoing soil analysis will also finalize SOC values for AAB and MHJ, and total carbon stock estimates for MHJ, TMD and BdA, resulting in comprehensive carbon stock estimates for all four AOIs.
AOI-specific maps are directly helping to explore the feasibility of mangrove carbon projects in AAB and TMD and support the establishment of a Plan Vivo project in BdA. In addition to carbon projects, the results presented in this study provide an invaluable updated scientific baseline for policy makers and civil society to identify efficient mangrove conservation strategies at the ecosystem or national scale.

Acknowledgments

This research was funded by the Global Environmental Facility’s Blue Forest project and grants from the Western Indian Ocean Marine Science Association, the John D. and Catherine T. MacArthur Foundation and the Darwin Initiative. All TMD analysis was done in collaboration with the World Wildlife Fund’s Madagascar West Indian Ocean Programme Office. The authors greatly appreciate the logistical support for field work in MHJ provided by AQUALMA. Many thanks to Raymond Raherindray, Zo Andriamahenina, Ismael Ratefinjanahary, Jaona Ravelonjatovo, Ferdinand Botsy, Tina Haingonirina and Holy Andriamitantsoa for assisting with field missions. Thanks also to Kate England, Bienvenue Zafindrasilivonona, Sylvia Paulot, Pierre-Francois Roy and Rado Rakotomanana for contributions to socio-economic research and analysis. Special thanks to community members from within all AOIs for their guidance, hospitality and assistance with field work. Additional thanks to extremely helpful anonymous reviewers.

Author Contributions

Trevor Jones took the lead on designing and undertaking the dynamics assessment, AOI- specific mapping, and writing the manuscript. Leah Glass assisted with the dynamics assessment and AOI-specific mapping and helped provide oversight for the manuscript, contextualizing loss. Samir Gandhi assisted with geospatial data pre-processing, the dynamics assessment, AOI-specific mapping and formatting the manuscript. Lalao Ravaoarinorotsihoarana helped design, and lead field missions, summarize resulting data, and further helped with carbon stock estimates. Aude Carro provided specific input regarding contextualizing mangrove loss. Lisa Benson assisted with calculating, compiling and presenting carbon stock estimates. Harifidy Rakoto Ratsimba helped design and provided oversight of field missions, and assisted with the dynamics assessment and AOI-specific mapping. Chandra Giri assisted with the dynamics assessment and AOI-specific mapping. Dannick Randriamanatena assisted with all logistics, field work and mapping related to TMD. Garth Cripps helped provide overall oversight on design and implementation.

Conflicts of Interest

The authors declare no conflict of interest.

References

  1. Lugo, A.E.; Snedaker, S.C. The ecology of mangroves. Annu. Rev. Ecol. Syst. 1974, 5, 39–64. [Google Scholar] [CrossRef]
  2. Blasco, F.; Bellan, M.F.; Chaudhury, M.U. Estimating the extent of floods in Bangladesh—Using SPOT data. Remote Sens. Environ. 1992, 39, 167–178. [Google Scholar] [CrossRef]
  3. Marshall, N. Mangrove conservation in relation to overall environmental considerations. Hydrobiologia 1994, 285, 303–309. [Google Scholar] [CrossRef]
  4. Primavera, J.H. Socio-economic impacts of shrimp culture. Aquac. Res. 1997, 28, 815–827. [Google Scholar] [CrossRef]
  5. Kathiresan, K.; Bingham, B. Biology of mangroves and mangrove ecosystems. Adv. Mar. Biol. 2001, 40, 81–251. [Google Scholar]
  6. Alongi, D.M. Present state and future of world’s mangrove forest. Environ. Conserv. 2002, 29, 331–349. [Google Scholar] [CrossRef]
  7. Mumby, P.J.; Edwards, A.J.; Arias-Gonzáles, E.; Lindeman, K.C.; Blackwell, P.G.; Gall, A.; Gorczynska, M.I.; Harborne, A.R.; Pescod, C.L.; Renken, H.; et al. Mangrove enhance the biomass of coral reef fish communities in the Caribbean. Nature 2004, 427, 533–536. [Google Scholar] [CrossRef] [PubMed]
  8. Dahdouh-Guebas, F.; Jayatissa, L.P.; di Nitto, D.; Bosire, J.O.; Lo Seen, D.; Koedam, N. How effective were mangroves as a defence against the recent tsunami? Curr. Biol. 2005, 15, R443–R447. [Google Scholar] [CrossRef] [PubMed]
  9. Barbier, E.B. Natural barriers to natural disasters: Replanting mangroves after tsunami. Front. Ecol. Environ. 2006, 4, 124–131. [Google Scholar] [CrossRef]
  10. Food and Agricultural Organization (FAO). The World’s Mangroves 1980–2005; FAO Forestry Paper 153; FAO: Rome, Italy, 2007. [Google Scholar]
  11. Alongi, D.M. Mangrove forests: Resilience, protection from tsunamis, and responses to global climate change. Estuar. Coast. Shelf Sci. 2008, 76, 1–13. [Google Scholar] [CrossRef]
  12. Nagelkerken, I.; Blaber, S.J.; Bouillon, S.; Green, P.; Haywood, M.; Kirton, L.G.; Meynecke, J.-O.; Pawlik, J.; Penrose, H.M.; Sasekumar, A.; et al. The habit function of mangroves for terrestrial and marine fauna: A review. Aquat. Bot. 2008, 89, 155–185. [Google Scholar] [CrossRef]
  13. Alongi, D.M. Carbon payments for mangrove conservation: Ecosystem constraints and uncertainties of sequestration potential. Environ. Sci. Policy 2011, 14, 462–470. [Google Scholar] [CrossRef]
  14. Donato, D.C.; Kauffman, J.B.; Murdiyarso, D.; Kumianto, S.; Stidham, M.; Kanninen, M. Mangroves among the most carbon-rich forests in the tropics. Nat. Geosci. 2011, 4, 293–297. [Google Scholar] [CrossRef]
  15. Kuezner, C.; Bluemel, A.; Gebhardt, S.; Quoc, T.V.; Dech, S. Remote sensing of mangrove ecosystems: A review. Remote Sens. 2011, 3, 878–928. [Google Scholar]
  16. Pendleton, L.; Donato, D.C.; Murray, B.C.; Crooks, S.; Jenkins, W.A.; Sifleet, S.; Craft, C.; Fourqurean, J.W.; Kauffman, J.B.; Marba, N.; et al. Estimating global “blue carbon” emissions from conversion and degradation of vegetated coastal ecosystems. PLoS ONE 2012, 7, e43542. [Google Scholar] [CrossRef] [PubMed] [Green Version]
  17. Kauffman, J.B.; Heider, C.; Norfolk, J.; Payton, F. Carbon stocks of intact mangroves and carbon emissions arising from their conversion in the Dominican Republic. Ecol. Appl. 2014, 24, 518–527. [Google Scholar] [CrossRef] [PubMed]
  18. Thompson, B.S.; Clubbe, C.P.; Primavera, J.H.; Curnick, D.; Koldeway, H.J. Locally assessing the economic viability of blue carbon: A case study from Panay Island, the Philippines. Ecosyst. Serv. 2014, 8, 128–140. [Google Scholar] [CrossRef]
  19. Giri, C.; Long, J.; Abbas, S.; Mani Murali, R.; Qamer, F.M.; Pengra, B.; Thau, D. Distribution and dynamics of mangrove forests of South Asia. J. Environ. Manag. 2015, 148, 101–111. [Google Scholar] [CrossRef] [PubMed]
  20. Huxham, M.; Emerton, L.; Kairo, J.; Munyi, F.; Abdirizak, H.; Muriuki, T.; Nunan, F.; Briers, R.A. Applying Climate Compatible Development and economic valuation to coastal management: A case study of Kenya’s mangrove forests. J. Environ. Manag. 2015, 157, 168–181. [Google Scholar] [CrossRef] [PubMed]
  21. Kauffman, J.B.; Heider, C.; Cole, T.G.; Dwire, K.A.; Donato, D.C. Ecosystem carbon stocks of Micronesian mangrove forests. Wetlands 2011, 31, 343–352. [Google Scholar] [CrossRef]
  22. Adame, M.F.; Kauffman, J.B.; Medina, I.; Gamboa, J.N.; Torres, O.; Caamal, J.P.; Reza, M.; Herrera-Silveira, J.A. Carbon stocks of tropical coastal wetlands within the Karstic landscape of the Mexican Caribbean. PLoS ONE 2013, 8, e56569. [Google Scholar] [CrossRef] [PubMed]
  23. Wang, G.; Dongsheng, G.; Peart, M.R.; Chen, Y.; Peng, Y. Ecosystem carbon stocks of mangrove forest in Yingluo Bay, Guangdon Province of South China. For. Ecol. Manag. 2013, 310, 539–546. [Google Scholar] [CrossRef]
  24. Kauffman, J.B.; Donato, D.C. Protocols for the Measurement, Monitoring and Reporting of Structure, Biomass and Carbon Stocks in Mangrove Forests; Working Paper 86; CIFOR: Bogor, Indonesia, 2012. [Google Scholar]
  25. Jones, T.G.; Ratsimba, H.R.; Ravaoarinorotsihoarana, L.; Cripps, G.; Bey, A. Ecological Variability and Carbon Stock Estimates of Mangrove Ecosystems in Northwestern Madagascar. Forests 2014, 5, 177–205. [Google Scholar] [CrossRef]
  26. Valiela, I.; Bowen, J.L.; York, J.K. Mangrove forests: One of the world’s threatened major tropical environments. Bioscience 2001, 51, 807–815. [Google Scholar] [CrossRef]
  27. Duke, N.C.; Meynecke, J.O.; Dittmann, S.; Ellison, A.M.; Anger, K.; Berger, U.; Cannicci, S.; Diele, K.; Ewel, K.C.; Field, C.D.; et al. A world without mangroves? Science 2007, 317, 41–42. [Google Scholar] [CrossRef] [PubMed] [Green Version]
  28. Spalding, M.; Kainuma, M.; Collins, L. World Atlas of Mangroves; Earthscan: London, UK, 2010. [Google Scholar]
  29. Friess, D.A.; Webb, E.L. Variability in mangrove change estimates and implications for the assessment of ecosystem provision. Glob. Ecol. Biogeogr. 2013, 23, 715–725. [Google Scholar] [CrossRef]
  30. Alongi, D.M. The Impact of Climate Change on Mangrove Forests. Curr. Clim. Chang. Rep. 2015, 1, 30–39. [Google Scholar] [CrossRef]
  31. Farnsworth, E.J.; Ellison, A.M. The global conservation status of mangroves. Ambio 1997, 26, 328–334. [Google Scholar]
  32. Primavera, J.H. Development and conservation of Philippine mangroves: Institutional issues. Ecol. Econ. 2000, 35, 91–106. [Google Scholar] [CrossRef]
  33. Dahdouh-Guebas, F. The use of remote sensing and GIS in the sustainable management of tropical coastal ecosystems. Environ. Dev. Sustain. 2002, 4, 93–112. [Google Scholar] [CrossRef]
  34. Primavera, J.H. Mangroves, fishponds, and the quest for sustainability. Science 2005, 310, 57–59. [Google Scholar] [CrossRef] [PubMed]
  35. Gopal, B.; Chauhan, M. Biodiversity and its conservation in the Sundarban Mangrove Ecosystem. Aquat. Sci. 2006, 68, 338–354. [Google Scholar] [CrossRef]
  36. Primavera, J.H. Overcoming the impacts of aquaculture on the coastal zone. Ocean Coast. Manag. 2006, 49, 531–545. [Google Scholar] [CrossRef]
  37. Gilman, E.L.; Ellison, J.; Duke, N.C.; Field, C. Threats to mangroves from climate change and adaptation options: A review. Aquat. Bot. 2008, 89, 237–250. [Google Scholar] [CrossRef]
  38. Walters, B.B.; Rönnbäck, P.; Kovacs, J.M.; Crona, B.; Hussain, S.A.; Badola, R.; Primavera, J.H.; Barbier, E.; Dahdouh-Guebas, F. Ethnobiology, socio-economics and management of mangrove forests: A review. Aquat. Bot. 2008, 89, 220–236. [Google Scholar] [CrossRef]
  39. Webb, E.L.; Jachowski, N.R.A.; Phelps, J.; Friess, D.A.; Than, M.M.; Ziegler, A.D. Deforestation in the Ayeyarwady Delta and the conservation implications of an internationally-engaged Myanmar. Glob. Environ. Chang. 2014, 24, 321–333. [Google Scholar] [CrossRef]
  40. Sitoe, A.A.; Mandlate, L.J.C.; Guedes, B.S. Biomass and Carbon Stocks of Sofala Bay Mangrove Forests. Forests 2014, 5, 1967–1981. [Google Scholar] [CrossRef]
  41. Field, C.D. Impact of expected climate change on mangroves. Hydrobiologia 1995, 295, 75–81. [Google Scholar] [CrossRef]
  42. Krauss, K.W.; Lovelock, C.E.; McKee, K.L.; Lopez-Hoffman, L.; Ewe, S.M.L.; Sousa, W.P. Environmental drivers in mangrove establishment and early development: A review. Aquat. Bot. 2008, 89, 105–127. [Google Scholar] [CrossRef]
  43. Chan, H.T.; Baba, S. Manual on Guidelines for Rehabilitation of Coastal Forests Damaged by Natural Hazards in the Asia-Pacific Region; International Society for Mangrove Ecosystems (ISME) and International Tropical Timber Organization (ITTO): Okinawa, Japan, 2009; p. 66. [Google Scholar]
  44. Suzuki, T.; Zijlema, M.; Burger, B.; Meijer, M.C.; Narayan, S. Wave dissipation by vegetation with layer schematization in SWAN. Coast. Eng. 2012, 59, 64–71. [Google Scholar] [CrossRef]
  45. Di Nitto, D.; Neukermans, G.; Koedman, N.; Defever, H.; Pattyn, F.; Kairo, J.G.; Dahdouh-Guebas, F. Mangroves facing climate change: Landward migration potential in response to projected scenarios of sea level rise. Biogeosciences 2014, 11, 857–871. [Google Scholar] [CrossRef]
  46. Polidoro, B.A.; Carpenter, K.E.; Collins, L.; Duke, N.C.; Ellison, A.M.; Ellison, J.C.; Farnsworth, E.J.; Fernando, E.S.; Kathiresan, K.; Koedam, N.E.; et al. Mangrove extinction risk and geographic areas of global concern. PLoS ONE 2010, 5, e10095. [Google Scholar] [CrossRef] [PubMed]
  47. Daru, B.H.; Yessoufou, K.; Mankga, L.T.; Davies, J. A Global Trend towards the Loss of Evolutionarily Unique Species in Mangrove Ecosystems. PLoS ONE 2013, 8, 1–9. [Google Scholar] [CrossRef] [PubMed]
  48. Heumann, B.W. Satellite remote sensing of mangrove forests: Recent advances and future opportunities. Prog. Phys. Geogr. 2011, 35, 87–108. [Google Scholar] [CrossRef]
  49. Manson, F.J.; Loneragan, N.R.; McLeod, I.M.; Kenyon, R.A. Assessing techniques for estimating the extent of mangroves: Topographic maps, aerial photographs, and Landsat TM images. Mar. Freshw. Res. 2001, 52, 787–792. [Google Scholar] [CrossRef]
  50. Ruiz-Luna, A.; Berlanga-Robles, C.A. Land use, land cover changes and coastal lagoon surface reduction associated with urban growth in northwest Mexico. Landsc. Ecol. 2003, 18, 159–171. [Google Scholar] [CrossRef]
  51. Cornejo, R.H.; Koedam, N.; Luna, A.R.; Troell, M.; Dahdouh-Guebas, F. Remote sensing and ethno-botanical assessment of the mangrove forest changes in the Navachiste-San Ignacio-Macapule lagoon complex, Sinaloa, Mexico. Ecol. Soc. 2005, 10, 16. [Google Scholar]
  52. Beland, M.; Goita, K.; Bonn, F.; Pham, T.T.H. Assessment of land-cover changes related to shrimp aquaculture using remote sensing data: A case study in the Giao Thuy District, Vietnam. Int. J. Remote Sens. 2006, 27, 1491–1510. [Google Scholar] [CrossRef]
  53. Giri, C.; Pengra, B.; Zhu, Z.L.; Singh, A.; Tieszen, L.L. Monitoring mangrove forest dynamics of the Sundarbans in Bangladesh and India using multi-temporal satellite data from 1973 to 2000. Estuar. Coast. Shelf Sci. 2007, 73, 91–100. [Google Scholar] [CrossRef]
  54. Giri, C.; Zhu, Z.; Tieszen, L.L.; Singh, A.; Gillette, S.; Kelmelis, J.A. Mangrove forest distributions and dynamics (1975–2005) of the tsunami-affected region of Asia. J. Biogeogr. 2008, 35, 519–528. [Google Scholar] [CrossRef]
  55. Liu, K.; Li, X.; Shi, X.; Wang, S.G. Monitoring mangrove forest changes using remote sensing and GIS data with decision-tree learning. Wetlands 2008, 28, 336–346. [Google Scholar] [CrossRef]
  56. Paling, E.I.; Kobryn, H.T.; Humphreys, G. Assessing the extent of mangrove change caused by Cyclone Vance in the eastern Exmouth Gulf, northwestern Australia. Estuar. Coast. Shelf Sci. 2008, 77, 603–613. [Google Scholar] [CrossRef]
  57. Giri, C.; Ochieng, E.; Tieszen, L.L.; Zhu, Z.; Singh, A.; Loveland, T.; Masek, J.; Duke, N. Status and distribution of mangrove forests of the world using earth observation satellite data. Glob. Ecol. Biogeogr. 2011, 20, 154–159. [Google Scholar] [CrossRef]
  58. Alsaaideh, B.; Al-Hanbali, A.; Tateishi, R.; KoBayashi, T.; Hoan, N.T. Mangrove forests mapping in the southern part of Japan using Landsat ETM+ with DEM. J. Geogr. Inf. Syst. 2013, 5, 369–377. [Google Scholar] [CrossRef]
  59. Li, M.S.; Mao, L.J.; Shen, W.J.; Liu, S.Q.; Wei, A.I. Change and fragmentation trends of Zhanjiang mangrove forests in southern China using multi-temporal Landsat imagery (1977–2010). Estuar. Coast. Shelf Sci. 2013, 130, 111–120. [Google Scholar] [CrossRef]
  60. Nguyen, H.; McAlpine, C.; Pullar, D.; Johansen, K.; Duke, N. The relationship of spatial-temporal changes in fringe mangrove extent and adjacent land-use: Case study of Ken Giang coast, Vietnam. Ocean Coast. Manag. 2013, 76, 12–22. [Google Scholar] [CrossRef]
  61. Jones, T.G.; Ratsimba, H.R.; Ravaoarinorotsihoarana, L.; Glass, L.; Benson, L.; Teoh, M.; Carro, A.; Cripps, G.; Giri, C.; Gandhi, S.; et al. The Dynamics, Ecological Variability and Estimated Carbon Stocks of Mangroves in Mahajamba Bay, Madagascar. J. Mar. Sci. Eng. 2015, 3, 793–820. [Google Scholar] [CrossRef]
  62. Jones, T.G.; Ratsimba, H.R.; Carro, A.; Ravaoarinorotsihoarana, L.; Glass, L.; Teoh, M.; Benson, L.; Cripps, G.; Giri, C.; Zafindrasilivonona, B.; et al. The mangroves of Ambanja and Ambaro Bays, northwest Madagascar: Historical dynamics, current status and deforestation mitigation strategy. In Estuaries: A Lifeline of Ecosystem Services in Western Indian Ocean; Diop, S., Scheren, P., Eds.; Springer International Publishing: Cham, Switzerland, 2016; in press. [Google Scholar]
  63. Giri, S.; Mukhopadhyay, A.; Hazra, S.; Mukherjee, S.; Roy, D.; Ghosh, S.; Ghosh, T.; Mitra, D. A study on abundance and distribution of mangrove species in Indian Sundarban using remote sensing technique. J. Coast. Conserv. 2014, 18, 359–367. [Google Scholar] [CrossRef]
  64. Jhonnerie, R.; Siregar, V.P.; Nababan, B.; Prasetyo, L.B.; Wouthuyzen, S. Random Forest Classification for Mangrove Land Cover Mapping Using Landsat 5 TM and Alos Palsar Imageries. Procedia Environ. Sci. 2015, 24, 215–221. [Google Scholar] [CrossRef]
  65. Ramdani, F.; Rahman, S.; Setiani, P. Inexpensive Method to Assess mangroves Forest through the Use of Open Source Software and Data Available Freely in Public Domain. J. Geogr. Inf. Syst. 2015, 7, 43–57. [Google Scholar] [CrossRef]
  66. Moffett, K.B.; Nardin, W.; Silvestri, S.; Wang, C.; Temmerman, S. multiple stable states and catastrophic shifts in coastal wetlands: Progress, challenges, and opportunities in validating theory using remote sensing and other methods. Remote Sens. 2015, 7, 10184–10226. [Google Scholar] [CrossRef]
  67. Nardin, W.; Locatelli, S.; Pasquarella, V.; Rulli, M.C.; Woodcock, C.E.; Fagherazzi, S. Dynamics of a fringe mangrove forest detected by Landsat images in the Mekong delta, Vietnam. Earth Surf. Process. Landf. 2015. In press. [Google Scholar]
  68. Giri, C.; Muhlhausen, J. Mangrove forest distributions and dynamics in Madagascar (1975–2005). Sensors 2008, 8, 2104–2117. [Google Scholar] [CrossRef]
  69. Giri, C. National-Level Mangrove Cover Data-Sets for 1990, 2000 and 2010; United States Geological Survey: Sioux Falls, SD, USA, 2011. [Google Scholar]
  70. Mayaux, P.; Gond, V.; Bartholome, E. A near-real time forest-cover map of Madagascar derived from SPOT-4 VEGETATION data. Int. J. Remote Sens. 2000, 21, 3139–3144. [Google Scholar] [CrossRef]
  71. Critical Ecosystem Partnership Fund (CEPF). Madagascar Vegetation Mapping Project; CEPF: Arlington, VA, USA, 2007. [Google Scholar]
  72. Harper, G.J.; Steininger, M.K.; Tucker, C.J.; Juhn, D.; Hawkins, F. Fifty years of deforestation and forest fragmentation in Madagascar. Environ. Conserv. 2007, 34, 325–333. [Google Scholar] [CrossRef]
  73. Rasolofoharinoro, M.; Blasco, F.; Bellan, M.F.; Aizpuru, M.; Gauquelin, T.; Denis, J. A remote sensing based methodology for mangrove studies in Madagascar. Int. J. Remote Sens. 1998, 19, 1873–1886. [Google Scholar] [CrossRef]
  74. Pasqualini, V.; Iltis, J.; Dessay, N.; Lointier, M.; Guelorget, O.; Polidori, L. Mangrove mapping in North-Western Madagascar using SPOT-XS and SIR-C radar data. Hydrobiologia 1999, 413, 127–133. [Google Scholar] [CrossRef]
  75. Guillet, M.; Renou, E.; Robin, M.; Debaine, F.; Ratsivalaka, S. Suivi et analyse de l’evolution de la mangrove de Mahajamba (Nord-ouest de Madagascar). In Proceedings of the International Pluridisciplinary Conference, Lille, France, 16–18 January 2008.
  76. Raharimahefa, T.; Kusky, T.M. Environmental monitoring of Bombetoka Bay and the Betsiboka Estuary, Madagascar, using multi-temporal satellite data. J. Earth Sci. 2010, 21, 210–226. [Google Scholar] [CrossRef]
  77. Rakotomavo, A.; Fromard, F. Dynamics of mangrove forests in the Mangoky River delta, Madagascar, under the influence of natural and human factors. For. Ecol. Manag. 2010, 259, 1161–1169. [Google Scholar] [CrossRef]
  78. Law No. 97–017 on the Revision of Forestry Legislation; Articles 2 & 41; Government of Madagascar (GoM): Antananarivo, Madagascar, 1997.
  79. Inter-Ministerial Order No. 4355/97 on the Definition of the Sensitize Areas; Articles 2 & 3; Government of Madagascar (GoM): Antananarivo, Madagascar, 1997.
  80. Decree No. 98–781 Defining The Conditions of Application of the National Forest Policy; Articles 34 & 35; Government of Madagascar (GoM): Antananarivo, Madagascar, 1998.
  81. Prohibiting Any Extractive Activity of Wood Resources in Sensitive Areas; Order No. 12.704/2000 of 20 November, 2000; Government of Madagascar (GoM): Antananarivo, Madagascar, 2000.
  82. Decree No. 2005–849 of 13 December 2005 Revising the General Conditions of Application of Law No. 97–017 of 8 August 1997, Revising Forestry Legislation; Government of Madagascar (GoM): Antananarivo, Madagascar, 2005; Chapter 4.
  83. Law No. 2008–013 on the Public Domain, Government Gazette of 2008; Article 3(a); Government of Madagascar (GoM): Antananarivo, Madagascar, 2008.
  84. Government of Madagascar (GoM). Order No. 2055–2009 Creating Biologically Sensitive Shrimp Zones in Zone A in Ambaro Bay; Government of Madagascar (GoM): Antananarivo, Madagascar, 2009.
  85. Prohibiting Any Exploitation of Mangrove Wood on the National Territory; Inter-Ministerial Order No. 32.100/2014 of 24 October, 2014; Government of Madagascar (GoM): Antananarivo, Madagascar, 2014.
  86. Jones, T.G. Shining a light on Madagascar’s mangroves. Madag. Conserv. Dev. 2013, 8, 4–6. [Google Scholar]
  87. Hughes, R.H.; Hughes, J.S. Region 6: Madagascar. In A Directory of African Wetlands, 1st ed.; IUCN: Gland, Switzerland; Cambridge, UK; UNEP: Nairboi, Kenya; WCMC: Cambridge, UK, 1992; pp. 793–806. [Google Scholar]
  88. Vences, M.; Andreone, F.; Glaw, F.; Raminosoa, N.; Randrianirina, J.E.; Vieites, D.R. Amphibians and reptiles of the Ankaratra Massif: Reproductive diversity, biogeography and conservation of a montane fauna in Madagascar. Ital. J. Zool. 2002, 69, 263–284. [Google Scholar] [CrossRef]
  89. Rasofolo, M.V. Use of mangroves by traditional fishermen in Madagascar. Mangroves Salt Marshes 1997, 1, 243–253. [Google Scholar] [CrossRef]
  90. Roy, R.; Purkis, S.; Dunn, S. Mapping Velondriake: The Application of Bathymetric and Marine Habitat Mapping to Support Conservation Planning, Southwest Madagascar; Blue Ventures Internal Report; Blue Ventures: London, UK, 2009. [Google Scholar]
  91. Tomlinson, P.B. The Botany of Mangroves; Cambridge University Press: Melbourne, Australia, 1986. [Google Scholar]
  92. Chavez, P.S. Image-based atmospheric corrections: Revisited and improved. Photogramm. Eng. Remote Sens. 1996, 62, 1025–1036. [Google Scholar]
  93. Kirui, K.B.; Kairo, J.G.; Bosire, J.; Viergever, K.M.; Rudra, S.; Huxham, M.; Briers, R.A. Mapping of mangrove forest land cover change along the Kenya coastline using Landsat imagery. Ocean Coast. Manag. 2013, 83, 19–24. [Google Scholar] [CrossRef]
  94. Simard, M.; Zhang, K.Q.; Rivera-Monroy, V.H.; Ross, M.S.; Ruiz, P.L.; Castaneda-Moya, E.; Twilley, R.R.; Rodriguez, E. Mapping height and biomass of mangrove forests in Everglades National Park with SRTM elevation data. Photogramm. Eng. Remote Sens. 2006, 72, 299–311. [Google Scholar] [CrossRef]
  95. Fatoyinbo, T.E.; Simard, M.; Washington-Allen, R.A.; Shugart, H.H. Landscape-scale extent, height, biomass, and carbon estimation of Mozambique’s mangrove forests with Landsat ETM+ and Shuttle Radar Topography Mission elevation data. J. Geophys. Res. Biogeosci. 2008, 113. [Google Scholar] [CrossRef]
  96. Simard, M.; Rivera-Monroy, V.H.; Mancera-Pineda, J.E.; Castaneda-Moya, E.; Twilley, R.R. A systematic method for 3D mapping of mangrove forests based on Shuttle Radar Topography Mission elevation data, ICEsat/GLAS waveforms and field data: Application to Cienaga Grande de Santa Marta, Colombia. Remote Sens. Environ. 2008, 112, 2131–2144. [Google Scholar] [CrossRef]
  97. Fatoyinbo, T.E.; Simard, M. Height and biomass of mangroves in Africa from ICESat/GLAS and SRTM. Int. J. Remote Sens. 2013, 34, 668–681. [Google Scholar] [CrossRef]
  98. Aslan, A.; Rahman, A.F.; Warren, M.; Robeson, S.M.; Darusman, T. Combined use of active and passive remote sensing for mapping distribution and biomass of coastal mangroves. In Proceeding of American Geophysical Union Fall Meeting, San Francisco, CA, USA, 15–19 Decomber 2014.
  99. Sinclair, T.T.; Hoffer, R.M.; Schreiber, M.M. Reflectance and internal structure of leaves from several crops during a growing season. Agron. J. 1971, 63, 864–868. [Google Scholar] [CrossRef]
  100. Elvidge, C.D. Visible and near-infrared reflectance characteristics of dry plant materials. Int. J. Remote Sens. 1990, 11, 1775–1795. [Google Scholar] [CrossRef]
  101. Bhattarai, B.; Giri, C. Assessment of mangrove forests in the Pacific region using Landsat imagery. J. Appl. Remote Sens. 2011, 5, 053509. [Google Scholar] [CrossRef]
  102. Long, J.B.; Giri, C. Mapping the Philippines’ mangrove forests using Landsat imagery. Sensors 2011, 11, 2972–2981. [Google Scholar] [CrossRef] [PubMed]
  103. Aschbacher, J.; Ofren, R.; Delsol, J.P.; Suselo, T.B.; Vibulsresth, S.; Charrupat, T. An integrated comparative approach to mangrove vegetation mapping using advanced remote sensing and GIS technologies: Preliminary results. Hydrologica 1995, 295, 285–295. [Google Scholar]
  104. Gao, J.A. Hybrid method toward accurate mapping of mangroves in a marginal habitat from SPOT Multispectral data. Int. J. Remote Sens. 1998, 19, 1887–1899. [Google Scholar] [CrossRef]
  105. Green, E.P.; Clark, C.D.; Mumby, P.J.; Edwards, A.J.; Ellis, A.C. Remote sensing techniques for mangrove mapping. Int. J. Remote Sens. 1998, 19, 935–956. [Google Scholar] [CrossRef]
  106. Gao, J.A. Comparative study on spatial and spectral resolutions of satellite data in mapping mangrove forests. Int. J. Remote Sens. 1999, 20, 2823–2833. [Google Scholar] [CrossRef]
  107. Saito, H.; Bellan, M.F.; Al-Habshi, A.; Aizpuru, M.; Blasco, F. Mangrove research and coastal ecosystem studies with SPOT-4 HRVIR and TERRA ASTER in Arabian Gulf. Int. J. Remote Sens. 2003, 24, 4073–4092. [Google Scholar] [CrossRef]
  108. Tong, P.H.; Auda, Y.; Populus, J.; Aizpura, M.; Habshi, A.A.; Blasco, F. Assessment from space of mangroves evolution in the Mekong Delta, in relation to extensive shrimp farming. Int. J. Remote Sens. 2004, 25, 4795–4812. [Google Scholar] [CrossRef]
  109. Jensen, L.S.; Mueller, T.; Tate, K.R.; Ross, D.J.; Magid, J.; Nielsen, N.E. Soil surface CO2 flux as an index of soil respiration in situ: A comparison of two chamber methods. Soil Biol. Biochem. 1996, 28, 1297–1306. [Google Scholar] [CrossRef]
  110. Comley, B.W.T.; McGuinness, K.A. Above- and below-ground biomass, and allometry, of four common northern Australian mangroves. Aust. J. Bot. 2005, 53, 431–436. [Google Scholar] [CrossRef]
  111. Curran, P.J. Remote sensing of foliar chemistry. Remote Sens. Environ. 1989, 30, 271–278. [Google Scholar] [CrossRef]
  112. Komiyama, A.; Poungparn, S.; Kato, S. Common allometric equations for estimate the tree weight of mangroves. J. Trop. Ecol. 2005, 21, 471–477. [Google Scholar] [CrossRef]
  113. Schumacher, B. Methods for the Determination of Total Organic Carbon (TOC) in Soils and Sediments; Ecological Risk Assessment Support Center, Office of Research and Development, US Environmental Protection Agency: Washington, DC, USA, 2002.
  114. De Vos, B.; Letterns, S.; Muys, B.; Deckers, J.A. Walkley-Black analysis of forest soil organic carbon: Recovery, limitations and uncertainty. Soil Use Manag. 2007, 23, 221–229. [Google Scholar] [CrossRef]
  115. Meersmans, J.; van Wesemael, B.; van Molle, M. Determining soil organic carbon for agricultural soils: A comparison between the Walkley & Black and the dry combustion methods (North Belgium). Soil Use Manag. 2009, 25, 346–353. [Google Scholar]
  116. Ray, R.; Ganguly, D.; Chowdhury, C.; Dey, M.; Das, S.; Dutta, M.K.; Mandal, S.K.; Majumder, N.; De, T.K.; Mukhopadhyay, S.K.; et al. Carbon sequestration and annual increase of carbon stock in a mangrove forest. Atmos. Environ. 2011, 45, 5016–5024. [Google Scholar] [CrossRef]
  117. Chen, L.; Zeng, X.; Tam, N.F.Y.; Lu, W.; Luo, Z.; Du, X.; Wang, J. Comparing carbon sequestration and stand structure of monoculture and mixed mangrove plantations of Sonneratia caseolaris and S. apetala in Southern China. For. Ecol. Manag. 2012, 284, 222–229. [Google Scholar] [CrossRef]
  118. Donato, D.C.; Kauffman, J.B.; Mackenzie, R.A.; Ainsworth, A.; Pfleeger, A.Z. Whole-island carbon stocks in the tropical Pacific: Implications for mangrove conservation and upland restoration. J. Environ. Manag. 2012, 97, 89–96. [Google Scholar] [CrossRef] [PubMed]
  119. Fujimoto, K.; Imaya, A.; Tabuchi, R.; Kuramoto, S.; Utsugi, H.; Murofushi, T. Belowground C storage of Micronesian mangrove forests. Ecol. Res. 1999, 14, 409–413. [Google Scholar] [CrossRef]
  120. Jardine, S.L.; Siikamäki, J.V. A global predictive model of carbon in mangrove soils. Environ. Res. Lett. 2014, 9, 104013. [Google Scholar] [CrossRef]
  121. Liu, H.; Ren, H.; Hui, D.; Wang, W.; Liao, B.; Cao, Q. Carbon stocks and potential carbon storage in the mangrove forests of China. J. Environ. Manag. 2014, 133, 86–93. [Google Scholar] [CrossRef] [PubMed]

