Article

Validation of MODIS Aerosol Optical Depth Retrieval over Mountains in Central China Based on a Sun-Sky Radiometer Site of SONET

1
State Environmental Protection Key Laboratory of Satellite Remote Sensing, Institute of Remote Sensing and Digital Earth, Chinese Academy of Sciences, Beijing 100101, China
2
University of Chinese Academy of Sciences, Beijing 100049, China
3
China Centre for Resources Satellite Data and Application, Beijing 100094, China
*
Author to whom correspondence should be addressed.
Submission received: 4 December 2015 / Revised: 27 January 2016 / Accepted: 29 January 2016 / Published: 3 February 2016

Abstract

:
The 3 km Dark Target (DT) aerosol optical depth (AOD) products, 10 km DT and Deep Blue (DB) AOD products from the Collection 6 (C6) product data of Moderate Resolution Imaging Spectroradiometer (MODIS) are compared with Sun-sky Radiometer Network (SONET) measurements at Song Mountain in central China, where ground-based remote sensing measurements of aerosol properties are still very limited. The seasonal variations of AODs are significant in the Song Mountain region, with higher AODs in spring and summer and lower AODs in autumn and winter. Annual mean AODs (0.55 µm) vary in the range of 0.5–0.7, which indicates particle matter (PM) pollutions in this mountain region. Validation against one-year ground-based measurements shows that AOD retrievals from the MODIS onboard Aqua satellite are better than those from the Terra satellite in Song Mountain. The 3 km and 10 km AODs from DT algorithms are comparable over this region, while the AOD accuracy of DB algorithm is relatively lower. However, the spatial coverage of DB products is higher than that of 10 km DT products. Moreover, the optical and microphysical characteristics of aerosols at Song Mountain are analyzed on the basis of SONET observations. It suggests that coarse-mode aerosol particles dominate in spring, and fine-mode particles dominate in summer. The aerosol property models are also established and compared to aerosol types used by MODIS algorithm.

Graphical Abstract

1. Introduction

Aerosol in the atmosphere plays an important role in the climate system of the Earth. However, fast temporal and spatial changes of aerosol make it a major uncertain factor in the climate change studies [1]. In recent years, large numbers of satellite data have been used to characterize the aerosol spatial distributions over the world, for example, the widely used Moderate Resolution Imaging Spectroradiometer (MODIS) data. Along with the update of retrieval algorithm, the reliability of MODIS aerosol products is continuously improved. The current MODIS aerosol products have been updated to Collection 6 (C6), including important updates on calibration and cloud masking algorithms [2]. The MODIS sensor on Terra is in large degradation in the shortwave band, which causes the negative trend of multiple MODIS C5 products (for example, −0.05/decade of Terra aerosol optical depth (AOD) product over land in recent years) [3]. The new calibration of C6 removes the major calibration bias in the Level 1B data, especially in band B3 (0.47 µm), which is important for the aerosol retrievals over land. Another important update is the aerosol global products with the spatial resolution of 3 km. To meet the needs of estimating surface-level particulate matter (PM) pollution [4,5,6,7], a retrieval algorithm for the high resolution product [8,9] has been developed and released in the form of a separate Level 2 dataset. The 3 km algorithm has the same methodology, structure, inversion method, and lookup tables as the 10 km Dark Target (DT) retrievals. The differences between them are the manner in which pixels are selected and grouped for retrieval [8]. The global validation of C6 data has been performed by comparing MODIS retrieved AODs to the observations from Aerosol Robotic NETwork (AERONET) [2,3,8,9,10,11,12].
In recent years, air pollution in China is becoming more and more serious. A large number of studies have focused on the applicability and accuracy of the MODIS aerosol products in the China region [13,14,15,16,17,18,19,20]. Some of the validations focused on the AODs with different surface types, for example the desert in western China [13], the cities along the river [14], the rural areas [14], and the cites in the economic zone [15,16,17,18]. Others focused on the differences between two MODIS product collections [19] or between MODIS products and other satellite AOD products, for example POLarization and Directionality of Earth Reflectance (POLDER) [20]. However, most of these aerosol product validations are conducted at several major cities or eastern China [15,16,17,18]. In central China, especially in the mountainous region, the validation of MODIS aerosol product is very rare.
Plains, hills and mountains account for 54% of the land area in China, where more than 85% of the population in China is distributed [21]. Central China is a transition zone between plains and mountains [22]. With poor measurement infrastructure and difficulties on ground-based instrument maintenance, the observation of aerosols at central China is still very sparse. Song Mountain is located in central China and has a temperate continental monsoon climate [23]. A Songshan artificial target site with a radial target and an edge target was built on the Song Mountain in September 2013 by the China Center for Resources Satellite Data and Application. It is the first target site for a satellite remote sensor in-flight performance assessment in China [24]. Therefore, a sun-sky radiometer observation site named Songshan was set up at the target site in November 2013 to provide aerosol products for satellite applications. In this paper, we used Sun-sky Radiometer Network (SONET) Songshan measurements as validations of MODIS aerosol products over this region. It is a supplement to the global validation of C6 aerosol retrieval in China. We also analyzed aerosol characteristics and established aerosol models for this region, which can be used in local climate studies, air quality assessment, atmospheric correction of satellite images, the in-flight calibration of satellites, and so on.

2. Measurements and Data

The 10 km MODIS aerosol products in C6 include DT retrievals, Deep Blue (DB) retrievals, the merged products of DT and DB, while current 3 km product dataset only includes the retrievals from DT algorithms [2]. To analyze the differences between DT and DB retrievals and the differences between two spatial resolution retrievals over Song Mountain, the 3 km AOD products from DT and 10 km AOD products from DT and DB are all extracted.
The validations of MODIS data are usually performed by comparing with the data observed by sun-sky radiometers from AERONET stations. The methodology for generating and analyzing the data between MODIS and AERONET was developed by Ichoku et al. [25], and has been used in sampling aerosol products from multiple sensors [26]. Comparisons between the satellite data with a large spatial average (e.g., the 10 km resolution of MOD04_L2 products) and the ground-based measurements at only one site are somewhat limitative. This issue can be alleviated to some extent by comparing spatial statistics of MODIS to temporal statistics of ground-based measurements. The rationality is that a sun-sky radiometer will sample the certain horizontal span air mass captured by MODIS during a certain time [25].
To assess the performances of the three MODIS AOD retrievals (3 km DT, 10 km DT and DB retrievals of Terra and Aqua at 0.55 µm), we sample C6 products from September 2005 to August 2015. According to the MODIS AOD validation protocol [25], which suggests that satellite retrievals within a spatial radius of ±25 km centered on the ground measurement site should be sampled, the statistics of annual and seasonal mean AODs are compared with ground-based data to analyze the variations of the AODs in Song Mountain region (with spring from March to May, summer from June to August, autumn from September to November, and winter from December to February in the next year).
The Songshan site (34.53°N, 113.10°E, 475 m a.s.l.) is located in a mountainous area (Figure 1). It is a typical mountain site belonging to SONET, which provides systematic instrument maintenance, calibration, data processing and quality control [27].
Figure 1. Geographical location and topographic height around Songshan site. The site (34.53°N, 113.10°E, 475 m a.s.l.) is marked with a black pentagram and the topographic height is derived from the Shuttle Radar Topography Mission (SRTM) digital elevation model data.
Remotesensing 08 00111 g001
The sun-sky radiometer installed at the SONET Songshan site is a CIMEL CE318-DP (Dural Polar), which can measure both radiance and polarization at eight bands (0.34, 0.38, 0.44, 0.50, 0.67, 0.87, 1.02, and 1.64 µm) by combining the rotation of polarizer and filter wheels [28]. Direct solar light is measured about every 15 min and sky radiance is scanned following almucantar and solar principal plane geometry procedures approximately each hour in automatic mode [29]. Aerosol optical and microphysical parameters of Songshan site are retrieved at 0.44, 0.67, 0.87, and 1.02 μm according to the algorithm of SONET, which is similar to AERONET. First, AOD is derived on the basis of Beer–Lambert–Bouguer law [29] with corrections of Rayleigh scattering and gas absorption. The uncertainty of AOD is estimated to be about 0.01–0.02, similar to AERONET products [29]. It should be mentioned that a total number of 2286 samples from both SONET and AERONET AOD data at the Beijing_RADI site with AOD range from 0 to 4 were compared and a mean difference of 0.0058 and the biggest difference less than 0.012 are found with the correlation coefficient of 0.997. Level 1.5 AOD data selected by automatic cloud-screening algorithm are employed in this study. Aerosol optical and microphysical parameters are retrieved using the numerical inversion code [30,31] from Almucantar sky-scanning and direct-sun measurements. The inversion code allows fitting both the sky radiance and AOD, and yields aerosol optical and microphysical parameters as well as residual. The retrieved aerosol property parameters include volume particle size distribution (typical uncertainty of 25%), complex refractive index (typical uncertainty of 0.04 for real parts and 40% for imaginary parts on condition that AOD at 0.44 µm above 0.4, and solar zenith angle above 50°), single scattering albedo (SSA) (typical uncertainty of 0.03 on same condition with refractive index) [28,32], and fine mode fraction (FMF) [33,34,35,36]. In addition, seasonal and annual volume fractions of four aerosol chemical components (dust, black carbon, ammonium sulfate, and aerosol water) are estimated according to the seasonal and annual mean aerosol optical and microphysical parameters [37,38,39].
The parameters of volume particle size distribution include fine-mode and coarse-mode volume concentrations (Vf and Vc), central radii (rf and rc), and variances (σf and σc) of bimodal log-normal function, respectively [30,31]:
V = r min r max d V ( r ) d ln ( r ) d ln r
ln r = r min r max ln r d V ( r ) d ln ( r ) d ln r r min r max d V ( r ) d ln ( r ) d ln r
σ = r min r max ( ln r ln r v ) 2 d V ( r ) d ln ( r ) d ln r r min r max d V ( r ) d ln ( r ) d ln r
The cutoff radius of aerosol size distribution is set as rmax when the parameters of the fine mode are calculated, whereas it is set as rmin when the parameters of the coarse mode are calculated. The cutoff radius is also a dynamic value of different size distributions in the calculation.
In this paper, a total number of 5221 Level 1.5 AOD records are obtained from December 2013 to August 2015 at Songshan site. Aerosol retrieval results with a residual threshold of 8% [31,39] yields 718 records. The ground-based AODs at 0.55 µm used to compare with MODIS products are calculated from AOD measurements at 0.44 µm and Ångström Exponent (AE) at 0.44–0.87 µm of the sun-sky radiometer within ±30 min of transit time of MODIS (Terra and Aqua) [25].
Ångström Exponent (AE) indicates size information of aerosol particles [40], which is defined as follows:
τ a ( λ ) = β λ α
where τα is AOD, λ is wavelength in microns, α is Ångström’s wavelength exponent, and β is turbidity coefficient which equals τα at λ = 1 µm. By combining Equation (4) at two wavelengths and taking the logarithm, α can be computed as follows:
α = d ln τ a d ln λ = ln ( τ a 2 τ a 1 ) ln ( λ 2 λ 1 )

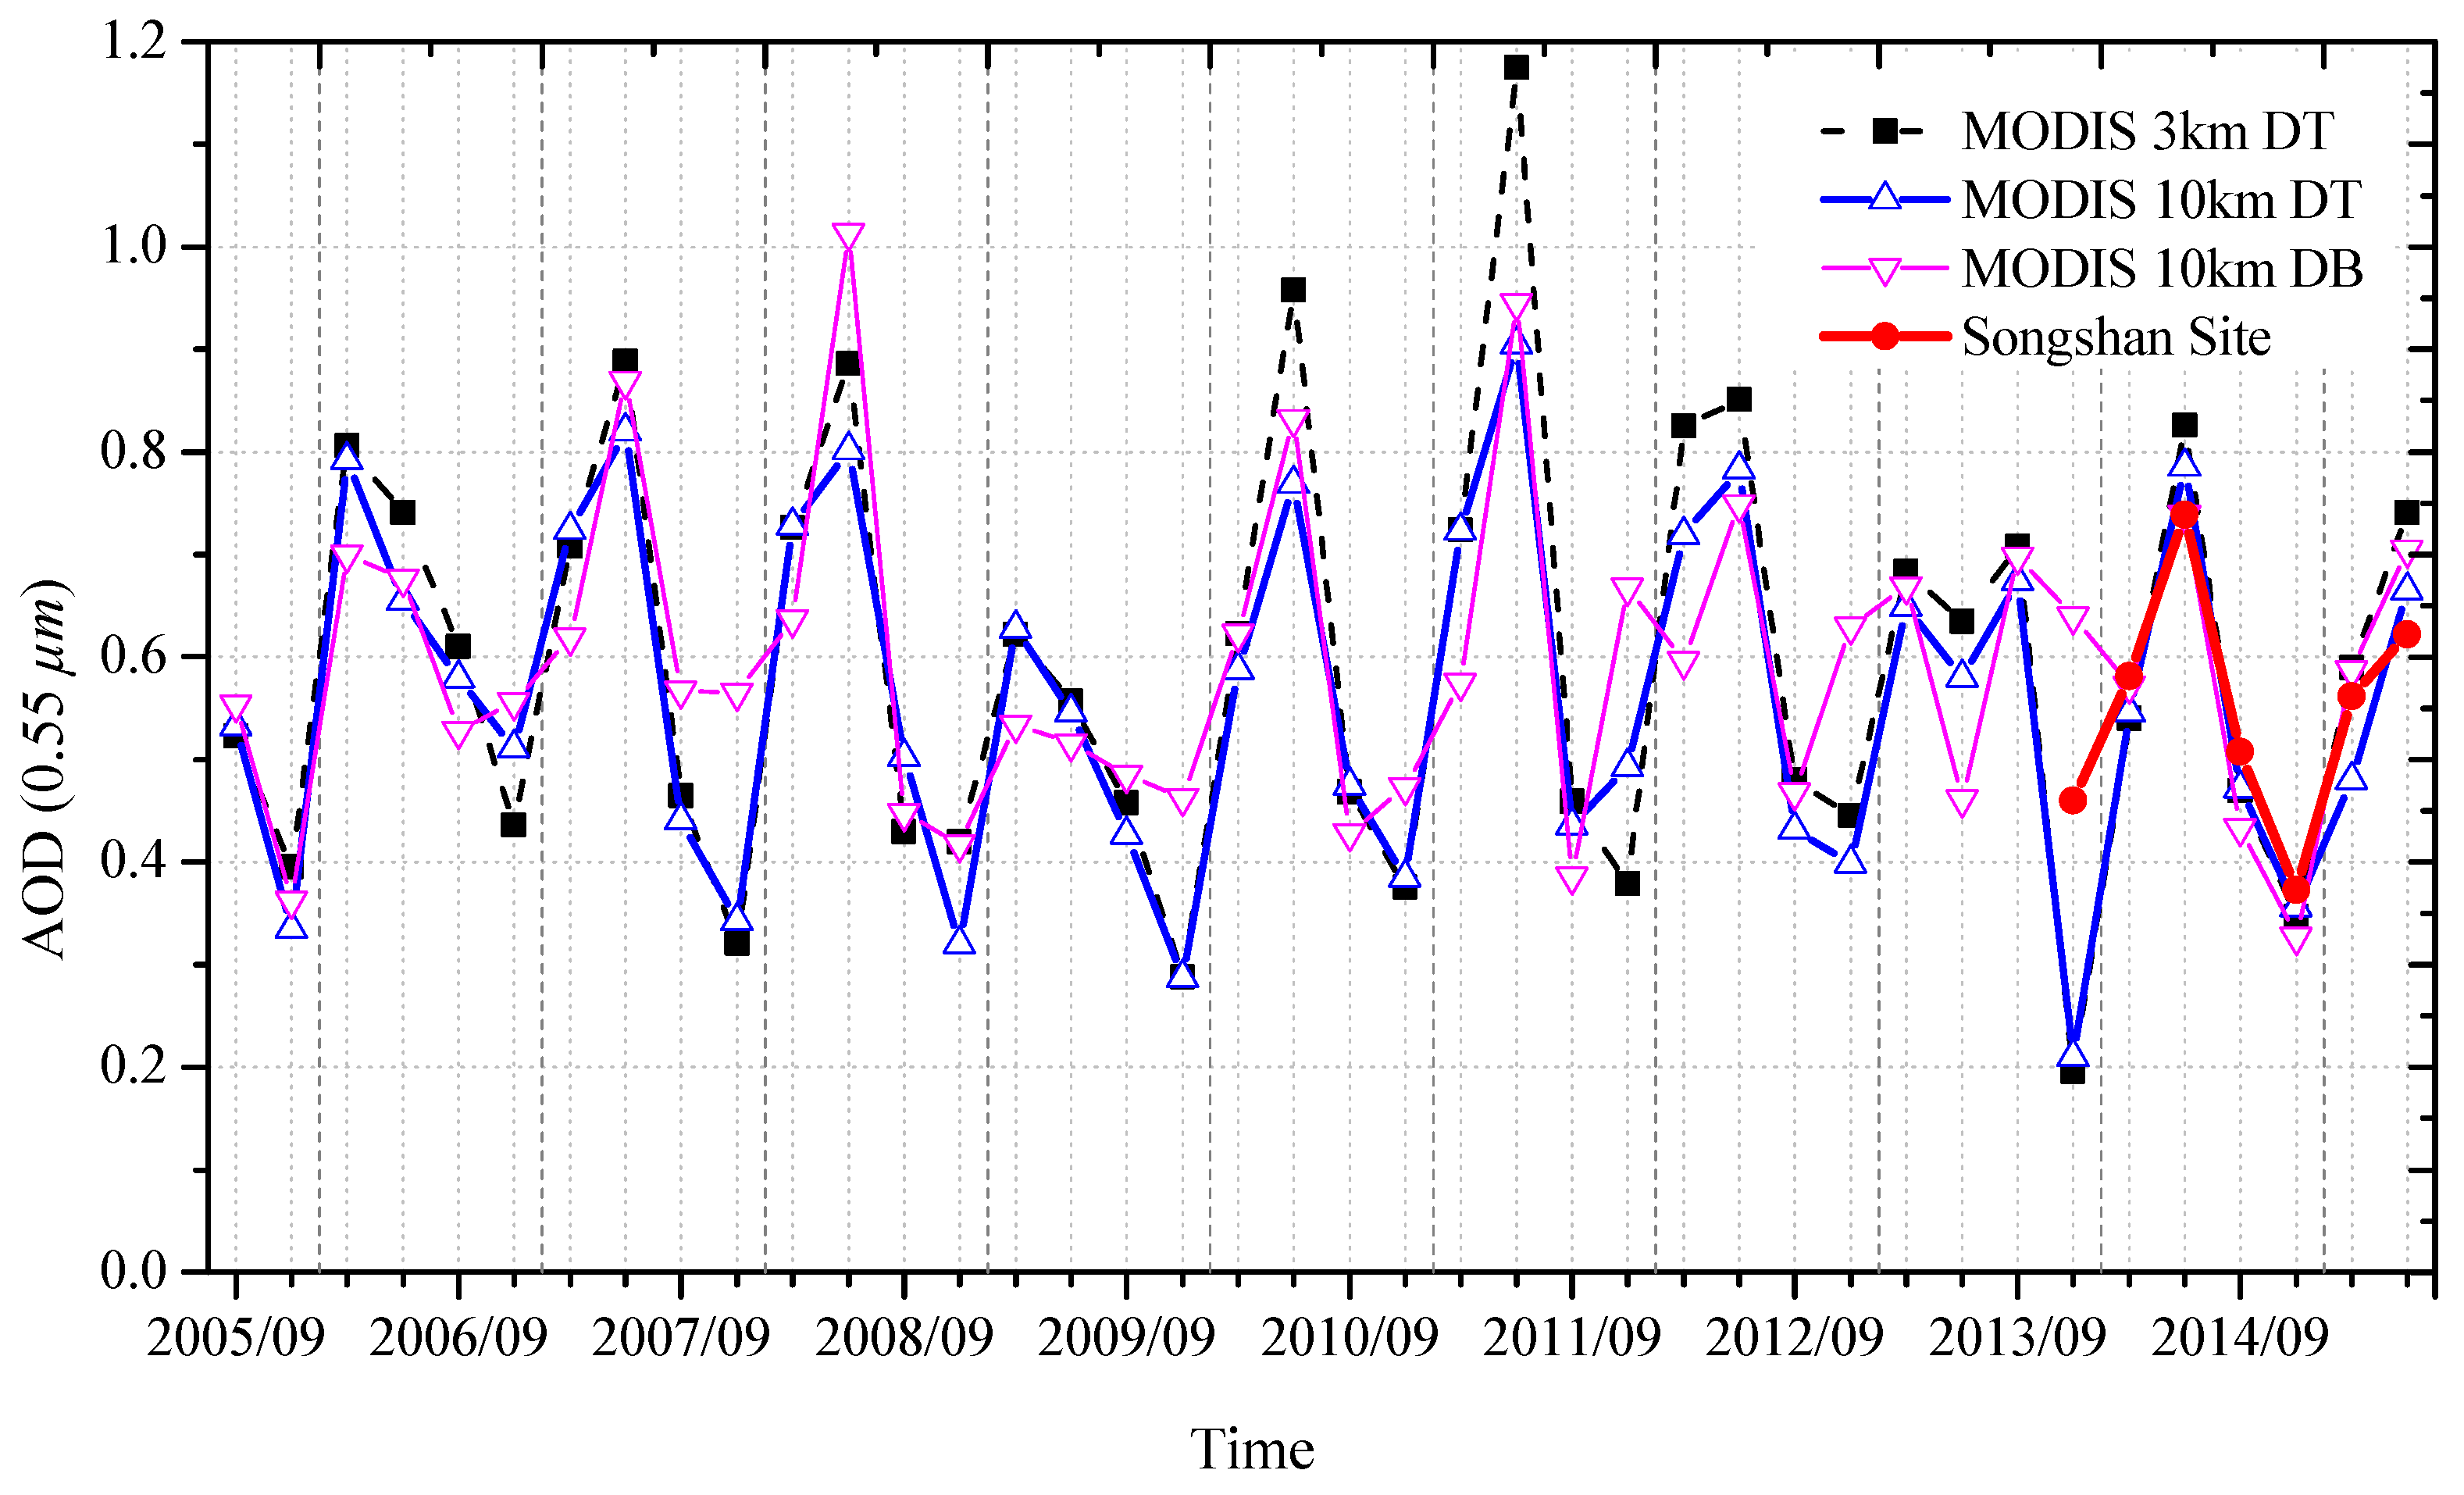
3. Validation of MODIS AOD Products

To analyze seasonal variations of AODs over Song Mountain region, seasonal mean of MODIS 3 km DT, 10 km DT and DB retrievals at 0.55 µm from 2005 to 2015 are compared and shown in Figure 2. The seasonal mean of ground-based measurements from December 2013 to August 2015 are correspondingly shown in Figure 2. Note that the MODIS curves are the average of the Terra and Aqua satellites. Although there are differences between the AODs from the three retrieval algorithms, it is clear that the seasonal trend of MODIS AOD over the Song Mountain region presents a stable annual variation. AODs in spring and summer are often higher than those of other two seasons. This temporal trend of MODIS product is well validated by ground-based measurements.
The annual mean AODs (at 0.55 µm) of the 3 km DT, 10 km DT, 10 km DB and ground-based data in the year from 2014 to 2015 are 0.54, 0.50, 0.48, and 0.52, respectively. Annual mean AODs from the three retrieval algorithms vary in the range of about 0.5–0.7 over the Song Mountain region during the past 10 years. The values denote that Song Mountain region is polluted rather than clean. Moreover, the 3 km AODs are higher than the 10 km AODs (DT and DB, about 9% on average), which is similar to the global analyses of 3 km products [8]. Less numbers of pixels selected and grouped from Level 1B data in the 3 km retrieval process might make the 3 km product noisier than 10 km [2].
Figure 2. Comparison of MODIS seasonal mean 3 km DT, 10 km DT, 10 km DB AOD products, and Songshan site ground-based measurements. The satellite data are from September 2005 to August 2015 and the ground-based measurements are from December 2013 to August 2015.
Remotesensing 08 00111 g002
The scattering plots between MODIS AODs and ground-based measurements are shown in Figure 3. One-one lines and expected error (EE) envelopes of ±(0.05 + 15%) used in the global validation of C6 DT MODIS products [2] are also shown. It has to be mentioned that the pixel level uncertainty estimate of DB product differs from that of DT product [41], but it is not used here considering comparing the three retrievals in the same EE [11]. It is found that AODs from the Terra and Aqua satellites have offsets for both the DT and DB products [2,12]. Therefore, comparisons of MODIS AODs and ground-based measurements in Figure 3 are performed separately according to the two satellites. The red points in Figure 3a–f are the data existing in the three algorithm retrievals at same time, and Nr means the number of the red points. The percentage with red color in each plot denotes the percentage of red points falling within the EE. The black points in Figure 3a–f are the rest data from the retrievals. The parameter Nt denotes the total number of points in the plot. In addition, the basic statistics (minimum, maximum, mean value and standard deviation) are listed in the plots. Overall, the retrievals of three algorithms from Aqua are better than those from Terra according to the percentages of points falling within the EE. The Terra and Aqua average percentages of points falling within EE from high to low is 10 km DT retrievals (78.7%), 3 km DT retrievals (77.5%) and 10 km DB retrievals (56.7%). In terms of mean value, 3 km DT AOD retrievals are overestimated about 7% and 10 km DB AOD retrievals are underestimated about 10%, compared to ground-based measurements. According to the percentages of Nr falling within EE, the order from high to low is not same as the order of total points. It looks like that 3 km DT retrievals (77.5%, an average of Terra and Aqua, the same to 10 km retrievals following) perform better than the others (72.7% for 10 km DT retrievals and 61.8% for DB retrievals) when only contrast the points existing in the three retrievals at same time. It may be due to that the region is mountainous and terrain around the Songshan site changes greatly. The spatial average statistics of MODIS are affected by the elevations of pixels [11]. Fine resolution of 3 km retrievals might alleviate this issue to some extent [42]. The validation results indicate that MODIS aerosol retrievals from DT algorithm (both 3 km and 10 km products) are comparable over Song Mountain region, while the accuracies of retrievals from DB algorithm are slightly lower. On the other hand, the coverage of DB retrievals is higher than the 10 km DT retrievals. The DT retrievals can be used in local climate studies and air quality assessment.
Figure 3. Validations of MODIS 3 km DT (a,b); 10 km DT (c,d) and 10 km DB AOD (e,f) with ground-based measurements at Songshan site. Nt: total points (in black); Nr: coincident points of three MODIS products (in red); Left panel: Terra satellite; Right panel: Aqua satellite. One–one lines are shown as the short dash line. EE envelopes (±(0.05 + 15%)) are shown as dash lines.
Remotesensing 08 00111 g003

4. Aerosol Properties at Song Mountain

4.1. Volume Particle Size Distribution

The retrieved size distributions are divided into 22 bins, with radii from 0.05 to 15 µm [31]. Seasonal mean variations of the size distributions at Songshan site are shown in Figure 4a, and corresponding parameters are listed in Table 1. The mean volume of coarse particles in spring (0.19 μm3/μm2) is much higher than other seasons, and the corresponding FMF (0.68) is the lowest in the four seasons. This might be due to dust transported from arid regions such as Gansu and Inner Mongolia in the spring months (volume fraction of dust (DU) is 0.68 in spring as listed in Table 1). The volume median radius of the coarse mode is 3.38 µm, which is larger than typical values of dust aerosol near the source (1.9–2.54 µm) reported in the literature [43]. This might be caused by aerosol particle coagulation during the long-distance transport, which could somewhat increase the particulate size [44]. A third mode appears at approximately 1.8 µm, similar to that reported in the literature [43,44].
Figure 4. (a) Seasonal mean aerosol volume particle size distributions at the Songshan site; (b) aerosol single scattering albedo at 0.44, 0.67, 0.87, and 1.02 µm; (c) real part of the complex refractive indexes at above four bands; (d) imaginary part of the complex refractive indexes at four bands. Error bars represent standard deviations of the statistics.
Remotesensing 08 00111 g004
Fine mode aerosol dominates the size distribution in summer with the highest FMF (0.81) in the four seasons. The volume median radius of fine mode is 0.22 µm, which are larger than that in other three seasons. This is likely due to high humidity (78% in July) that causes hygroscopic growth of particles [45,46]. The higher humidity and temperature (30.1 °C in July) during summer together make the diffusion more difficult. Aerosol particles accumulate in the atmosphere and lead to particulate pollution. The volume concentrations of fine and coarse mode particles in autumn are comparable. The shape of the volume particle size distribution during winter is similar to that in spring, with relatively higher volume concentration of coarse mode particles (Vf = 0.07 μm3/μm2, Vc = 0.12 μm3/μm2), which might be also related to the dust (volume fraction of DU is 0.66 in winter as listed in Table 1) [47].
Table 1. Mean aerosol volume particle size distribution parameters and volume fractions of four aerosol chemical components. rf and rc are median radii, σf and σc are standard deviations, Vf and Vc are volume concentrations of fine and coarse modes. fDU, fBC, fAS and fAW are the volume fraction of dust, black carbon, ammonium sulfate, and aerosol water, respectively.
rf (μm)rc (μm)σfσcVf (μm3/μm2)Vc (μm3/μm2)FMFfDU, fBC, fAS, fAW
Spring (March–May)0.183.380.500.700.100.190.680.68; 0.006; 0.25; 0.064
Summer (Junuary–August)0.223.440.520.620.130.080.810.2; 0.006; 0.35; 0.444
Autumn (September–November)0.193.050.530.670.100.110.730.53; 0.008; 0.29; 0.172
Winter (December–February)0.163.170.500.670.070.120.780.66; 0.011; 0.27; 0.059
Total0.183.100.510.670.090.120.750.58; 0.009; 0.27; 0.141

4.2. Single Scattering Albedo

SSA can reflect the light absorption proportion of aerosol extinction. The SSAs of all seasons show decrease spectral patterns as the wavelength increase (Figure 4b). The SSA in summer is the highest among the seasons (up to 0.93–0.95). As discussed in Section 4.1, the dominant mode of size distribution during summer is fine-mode, which is consistent with the highest volume fraction of ammonium sulfate (AS) (0.35) and lowest volume fraction of DU (0.2) in summer. Furthermore, the volume fraction of aerosol water (AW) in summer is highest (0.444). The AS is the representative of scattering component and responsible for aerosol hygroscopic characteristics [48,49]. The high water content in aerosol will cause the increase of AS particle size, which is followed by the increasing extinction ability of aerosol. Moreover, the SSA during winter is the lowest, with a value of approximately 0.87. Considering the highest volume fraction of black carbon (BC) (0.011) in winter (Table 1), it might be caused by the coal burning during winter in northern China for heating [50].

4.3. Complex Refractive Indices

The complex refractive indices of aerosols are closely related to aerosol chemical composition. The real part indicates the refractivity of aerosol and aerosol scattering characteristics. Refractive index of water is generally considered as 1.33 [51], which is much lower than that of dry substance. Therefore the real part can reflect water content in aerosol. The real part of the complex refractive index is lowest in summer (1.43) (Figure 4c), which indicates the highest water content level of aerosols. This is consistent with the highest volume fraction of AW (0.444) listed in Table 1. The real part indices from high to low are winter, spring, autumn and summer, which is contrary to the values of volume fraction of AW in four seasons.
The imaginary part of the complex refractive index is related to the absorption of aerosols. A higher value of imaginary part of complex refractive index indicates stronger absorption. Among the four seasons, the winter aerosols have the strongest absorption and summer aerosols have the strongest scattering (Figure 4d), which are the same as indicated by the SSAs [38,52].

5. Song Mountain Aerosol Parameter Model

The retrieval of AOD from satellite measurements is often biased due to the uncertainties associated with the employed aerosol types [53]. The scientific data set (SDS) named “Aerosol_Type_Land” of the MODIS DT aerosol products shows the aerosol types used in the satellite land data retrieval. Three spherical-derived aerosol types (Strong Absorption Fine type (SAF), Moderate Absorption Fine type (MAF), and Weak Absorption Fine type (WAF)) and one spheroid-derived aerosol type (Dust Coarse type (DC)) are employed to describe the global land aerosol properties by MODIS retrieval algorithm [54]. The aerosol types are derived from the cluster analysis of entire AERONET dataset. The spherical-derived aerosol types differ mainly in their SSA and size distribution [54]. The retrieval-assigned aerosol types at Song Mountain region included WAF type from June to November and MAF type from December to May in the next year.
Some research has analyzed aerosol volume particle size distribution with respect to varying AOD levels, yielding dynamic aerosol models of typical areas [27,51]. We establish the dynamic aerosol models for Song Mountain region based on one-year ground-based data and compare them to the aerosol type models used over Song Mountain region from the MODIS DT algorithm [54]. The specific parameters of the aerosol characteristic models are shown in Table 2. The particle volume size distribution of aerosol models in Table 2 are also ploted in Figure 5 corresponding to AOD (0.55 µm) = 0.5. The differences between the MODIS DT aerosol types are large enough to differentiate aerosol types in the world. Therefore, the differences between four seasonal dynamic size distributions of Songshan site seem weak when compared to the differences between MODIS aerosol types. Moreover, focusing on fine and coarse mode dominative characteristics, we compare the FMFs of Song Mountain observations (listed in Table 1) and the fine aerosol weightings (FW) of MODIS products. In the MODIS retrieval process, one fine-dominated model and one coarse-dominated model is matched to derive the total AOD and the FW based on the look up table (LUT). The FW here is different from that defined by O’Neill et al., [35] of AERONET products. It is the percentage of AOD attributed to fine mode dominated model, which includes fine and coarse modes [53,55]. Annual mean FW and FMF are 0.63 and 0.75, respectively. Although the definitions of the two parameters are different, the values are close. The seasonal mean FWs of four seasons are 0.57, 0.90, 0.62 and 0.49, respectively. Compared to the FMFs from ground-based measurements in Table 1 (values of four seasons are 0.68, 0.81, 0.73 and 0.78, respectively), seasonal characteristics of the aerosols in Song Mountain region can be partly represented by MODIS FWs.
Figure 5. Volume particle size distributions (normalize to AOD = 0.5 at 0.55 µm) of Song Mountain aerosol models (a) and aerosol types employed by MODIS DT algorithm over Song Mountain region (b).
Remotesensing 08 00111 g005
The established aerosol models of Song Mountain are based on the observation data from September 2014 to August 2015. Giles et al. [56] suggested that AE and SSA can be used to identify aerosol types. The independent validation is based on observations at Songshan site from December 2013 to August 2014 (Figure 6). It can be seen that although the verification points in the graph are somewhat scattered, they are distributed around the model center point in general.
Table 2. Comparison of aerosol types employed by Moderate Resolution Imaging Spectroradiometer (MODIS) aerosol retrieval algorithm and Song Mountain aerosol parameter model.
Song Mountain Aerosol ModelAerosol Types Employed by MODIS
TotalSpringSummerAutumnWinterMAFWAFDC
τa(0.44)0.71 ± 0.500.79 ± 0.510.89 ± 0.500.73 ± 0.510.55 ± 0.45---
α1.13 ± 0.291.02 ± 0.341.27 ± 0.311.16 ± 0.221.12 ± 0.24---
SSA0.92/0.93/0.92/0.91 ± 0.040.93/0.93/0.93/0.92 ± 0.040.95/0.95/0.94/0.93 ± 0.030.93/0.93/0.93/0.92 ± 0.030.90/0.90/0.89/0.87 ± 0.040.92 (@0.55 µm)0.947 (@0.55 µm)0.95 (@0.55 µm)
n1.48/1.50/1.52/1.52 ± 0.091.49/1.50/1.52/1.53 ± 0.081.43/1.44/1.45/1.45 ± 0.081.46/1.48/1.49/1.50 ± 0.071.52/1.54/1.56/1.57 ± 0.081.431.421.48τa(0.55)−0.021
k0.008/0.007/0.007/0.008 ± 0.0050.006/0.005/0.005/0.006 ± 0.0040.005/0.005/0.005/0.005 ± 0.0030.008/0.006/0.006/0.007 ± 0.0040.011/0.009/0.009/0.011 ± 0.006−0.002τa(0.55) + 0.008−0.0015τa(0.55) + 0.0070.002 (@0.55 µm)
Vf, Vc (μm3/μm2)0.14τa(0.44) ± 0.08; 0.12τa(0.44) ± 0.140.14τa(0.44) ± 0.08; 0.14τa(0.44) ± 0.120.16τa(0.44) ± 0.08; 0.04 + 0.03τa(0.44) ± 0.050.14τa(0.44) ± 0.07; 0.08τa(0.44) ± 0.080.13τa(0.44) ± 0.06; 0.13τa(0.44) ± 0.090.1642τa(0.55)0.775; 0.1482τa(0.55)0.6840.1718τa(0.55)0.821; 0.0934τa(0.55)0.6390.0871τa(0.55)1.026; 0.6786τa(0.55)1.0569
rf (µm), σf0.14 + 0.06τa(0.44) ± 0.05; 0.51 ± 0.080.14 + 0.05τa(0.44) ± 0.05; 0.50 ± 0.100.16 + 0.08τa(0.44) ± 0.07; 0.52 ± 0.080.15 + 0.06τa(0.44) ± 0.05; 0.51 ± 0.070.13 + 0.06τa(0.44) ± 0.04; 0.51 ± 0.070.0203τa(0.55) + 0.145; 0.1365τa(0.55) + 0.3740.0434τa(0.55) + 0.160; 0.1529τa(0.55) + 0.3640.1416τa(0.55)−0.0519; 0.7561τa(0.55)0.148
rc (µm), σc2.93 + 0.26τa(0.44) ± 0.51; 0.67 ± 0.072.67 + 0.34τa(0.44) ± 0.57; 0.70 ± 0.093.28 + 0.18τa(0.44) ± 0.45; 0.62 ± 0.062.78 + 0.35τa(0.44) ± 0.50; 0.67 ± 0.073.12 + 0.09τa(0.44) ± 0.41; 0.67 ± 0.060.3364τa(0.55) + 3.101; 0.098τa(0.55) + 0.7290.1411τa(0.55) + 3.325; 0.1638τa(0.55) + 0.7592.2; 0.554τa(0.55)−0.0519
The SSA, n and k of Songshan site from left to right correspond to 0.44/0.67/0.87/1.02 µm. τa(0.44) and τa(0.55) are AODs at 0.44 µm and 0.55 µm, respectively; α is AE calculated from AODs at 0.44 and 0.87 µm; SSA is single-scattering albedo; n and k are the real and imaginary parts of the refractive index; Vf and Vc, rf and rc, and σf and σc are fine-mode and coarse-mode volume concentrations, radii, and variances of bimodal log-normal size distribution, respectively; MAF: Moderate Absorption Fine, WAF: Weak Absorption Fine, DC: Dust Coarse.
Figure 6. Validation of Songshan site aerosol model via SSA and AE from ground-based measurements. Error bars represent standard deviations of samples in Song Mountain aerosol model.
Remotesensing 08 00111 g006

6. Conclusions

The studies on aerosol characteristics and validation of MODIS satellite product in central China Mountain region are rare. Validation of MODIS aerosol products over this region can be a supplement to the global validation of C6 aerosol retrievals in China. The quantitative assessment of the aerosol loading and the established Song Mountain aerosol model can be used in local climate studies and air quality assessment. Based on the comparisons between C6 MODIS 3 km DT retrievals, 10 km DT and DB retrievals, and the sun-sky radiometer measurements, as well as analyses of aerosol optical and microphysical parameters, we draw the following conclusions:
(1) Seasonal variations of the AODs are significant in Song Mountain region, with generally higher AODs in spring and summer and relative lower AODs in autumn and winter. The annual mean AODs (0.55 µm) of the Song Mountain region (0.5–0.7) indicate particle matter pollution rather than expected cleanness in this area.
(2) The validation results indicate that MODIS aerosol retrievals from DT algorithm (both 3 km and 10 km products) are generally acceptable over Song Mountain region, while the accuracies of retrievals from DB algorithms are lower. The retrievals of three algorithms from Aqua are better than those from Terra. The Terra and Aqua average percentages of points falling within EE (±(0.05% + 15%)) of the 3 km DT retrievals, 10 km DT retrievals and 10 km DB retrievals are 77.5%, 78.7% and 56.7%, respectively. However, the coverage of DB retrievals is higher than the 10 km DT retrievals.
(3) Dynamic aerosol models for Song Mountain region have been established based on one-year ground-based data, which show more detailed seasonal variabilities in aerosol properties at this site. It can be useful for other studies such as the atmospheric correction of satellite images.

Acknowledgments

This work was supported by the National Natural Science Foundation of China (No. 41222007), Strategic Priority Research Program of the Chinese Academy of Sciences (Grant No. XDA05100202) and the Chinese Academy of Sciences Key Deployment project (No. KZZD-EW-TZ-18). The authors are grateful to the staff at the Songshan site for the operation and maintenance of instruments.

Author Contributions

Zhengqiang Li conceived and designed this study, and participated in drafting and revising the article. Yan Ma substantially contributed to the analysis and interpretation of data, and drafted the article. Zhaozhou Li and Qiaoyan Fu undertook a part of the instrument maintenance job. Donghui Li and Kaitao Li contributed to the calibration of the sun-sky radiometer and analyses of the observation data. Yisong Xie, Ying Zhang and Hua Xu reviewed and edited the manuscript. All authors read and approved the manuscript.

Conflicts of Interest

The authors declare no conflict of interest.

References

  1. Stocker, T.F.; Qin, D.; Plattner, G.-K.; Tignor, M.; Allen, S.K.; Boschung, J.; Nauels, A.; Xia, Y.; Bex, V.; Midgley, P.M. Climate Change 2013: The Physical Science Basis; Cambridge University Press: Cambridge, UK, 2013. [Google Scholar]
  2. Levy, R.C.; Mattoo, S.; Munchak, L.A.; Remer, L.A.; Sayer, A.M.; Patadia, F.; Hsu, N.C. The Collection 6 MODIS aerosol products over land and ocean. Atmos. Meas. Tech. 2013, 6, 2989–3034. [Google Scholar] [CrossRef]
  3. Lyapustin, A.; Wang, Y.; Xiong, X.; Meister, G.; Platnick, S.; Levy, R.; Franz, B.; Korkin, S.; Hilker, T.; Tucker, J.; et al. Scientific impact of MODIS C5 calibration degradation and C6+ improvements. Atmos. Meas. Tech. 2014, 7, 4353–4365. [Google Scholar] [CrossRef]
  4. Chu, D.A.; Kaufman, Y.J.; Zibordi, G.; Chern, J.D.; Mao, J.; Li, C.; Holben, B.N. Global monitoring of air pollution over land from the Earth Observing System-Terra Moderate Resolution Imaging Spectroradiometer (MODIS). J. Geophys. Res. 2003, 108. [Google Scholar] [CrossRef]
  5. Wang, J.; Christopher, S.A. Intercomparison between satellite-derived aerosol optical thickness and PM2. 5 mass: Implications for air quality studies. Geophys. Res. Lett. 2003, 30. [Google Scholar] [CrossRef]
  6. Engel-Cox, J.A.; Holloman, C.H.; Coutant, B.W.; Hoff, R.M. Qualitative and quantitative evaluation of MODIS satellite sensor data for regional and urban scale air quality. Atmos. Environ. 2004, 38, 2495–2509. [Google Scholar] [CrossRef]
  7. Li, R.R.; Remer, L.; Kaufman, Y.J.; Mattoo, S.; Gao, B.C.; Vermote, E. Snow and ice mask for the MODIS aerosol products. IEEE Trans. Geosci. Remote Sens. 2005, 2, 306–310. [Google Scholar] [CrossRef]
  8. Remer, L.A.; Mattoo, S.; Levy, R.C.; Munchak, L.A. MODIS 3 km aerosol product: Algorithm and global perspective. Atmos. Meas. Tech. 2013, 6, 69–112. [Google Scholar] [CrossRef]
  9. Munchak, L.A.; Levy, R.C.; Mattoo, S.; Remer, L.A.; Holben, B.N.; Schafer, J.S.; Hostetler, C.A.; Ferrare, R.A. MODIS 3 km aerosol product: Applications over land in an urban/suburban region. Atmos. Meas. Tech. 2013, 6, 1747–1759. [Google Scholar] [CrossRef]
  10. Hsu, N.C.; Jeong, M.J.; Bettenhausen, C.; Sayer, A.M.; Hansell, R.; Seftor, C.S.; Huang, J.; Tsay, S.C. Enhanced Deep Blue aerosol retrieval algorithm: The second generation. J. Geophys. Res. 2013, 118, 9296–9315. [Google Scholar] [CrossRef]
  11. Sayer, A.M.; Munchak, L.A.; Hsu, N.C.; Levy, R.C.; Bettenhausen, C.; Jeong, M.J. MODIS Collection 6 aerosol products: Comparison between Aqua’s e-Deep Blue, Dark Target, and “merged” data sets, and usage recommendations. J. Geophys. Res. 2014, 119, 13965–13989. [Google Scholar] [CrossRef]
  12. Sayer, A.M.; Hsu, N.C.; Bettenhausen, C.; Jeong, M.J.; Meister, G. Effect of MODIS Terra radiometric calibration improvements on Collection 6 Deep Blue aerosol products: Validation and Terra/Aqua consistency. J. Geophys. Res. Atmos. 2015, 120. [Google Scholar] [CrossRef]
  13. Wu, X.P.; Yang, J.; Che, H.Z.; Li, X.J.; Xia, X.A. Verification for the satellite remote sensing products of aerosol optical depth in Talklimakan desert area. Clim. Environ. Res. 2012, 17, 149–159. [Google Scholar]
  14. Mi, W.; Li, Z.; Xia, X.; Holben, B.; Levy, R.; Zhao, F.; Chen, H.; Cribb, M. Evaluation of the moderate resolution imaging spectroradiometer aerosol products at two aerosol robotic network stations in China. J. Geophys. Res. 2007, 112. [Google Scholar] [CrossRef]
  15. Wang, L.; Xin, J.; Wang, Y.; Li, Z.; Wang, P.; Liu, G.; Wen, T. Validation of MODIS aerosol products by CSHNET over China. Chin. Sci. Bull. 2007, 52, 1708–1718. [Google Scholar] [CrossRef]
  16. Wang, L.; Xin, J.; Wang, Y.; Li, Z.; Liu, G.; Li, J. Evaluation of the MODIS aerosol optical depth retrieval over different ecosystems in China during EAST-AIRE. Atmos. Environ. 2007, 41, 7138–7149. [Google Scholar] [CrossRef]
  17. He, Q.S.; Li, C.C.; Tang, X.; Li, H.L.; Geng, F.H.; Wu, Y.L. Validation of MODIS derived aerosol optical depth over the Yangtze River Delta in China. Remote Sens. Environ. 2010, 114, 1649–1661. [Google Scholar] [CrossRef]
  18. Li, C.C.; Mao, J.T.; Lau, K.H.A.; Chen, J.C.; Yuan, Z.B.; Liu, X.Y.; Zhu, A.H.; Liu, G.Q. Characteristics of distribution and seasonal variation of aerosol optical depth in Eastern China with MODIS products. Chin. Sci. Bull. 2003, 48, 2488–2495. [Google Scholar]
  19. Li, Z.; Niu, F.; Lee, K.H.; Xin, J.; Hao, W.M.; Nordgren, B.; Wang, Y.; Wang, P. Validation and understanding of Moderate Resolution Imaging Spectroradiometer aerosol products (C5) using ground-based measurements from the handheld Sun photometer network in China. J. Geophys. Res. 2007, 112. [Google Scholar] [CrossRef]
  20. Chen, H.; Cheng, T.; Gu, X.; Li, Z.; Wu, Y. Evaluation of polarized remote sensing of aerosol optical thickness retrieval over China. Remote Sens. 2015, 7, 13711–13728. [Google Scholar] [CrossRef]
  21. Feng, Z.M.; Tang, Y.; Yang, Y.Z.; Zhang, D. Relief degree of land surface and its influence on population distribution in China. J. Geogr. Sci. 2008, 18, 237–246. [Google Scholar] [CrossRef]
  22. Zhong, Z.Z.; Li, K.H. The transition zone between Mountain and Plain and regional sustainable development. Prog. Geogr. 1998, 17, 23–31. [Google Scholar]
  23. Dong, D.P.; Zheng, J.G.; Ye, Y.Z. Flora of the woody plants in Song Mountain National Forest Park of Henan province. Sci. Silv. Sin. 2009, 45, 160–166. [Google Scholar]
  24. Li, Z.Z.; Xu, W.; Fu, Q.Y.; Min, X.J.; Zhang, L.M.; Pan, Z.Q.; Qiao, Y.L.; Zheng, X.B.; Fan, Y.T.; Su, B.J.; et al. Building and application for China Songshan artificial target site. J. Atmos. Environ. Opt. 2014, 9, 81–89. [Google Scholar]
  25. Ichoku, C.; Chu, D.A.; Mattoo, S.; Kaufman, Y.J.; Remer, L.A.; Tanré, D.; Slutsker, I.; Holben, B.N. A spatio-temporal approach for global validation and analysis of MODIS aerosol products. Geophys. Res. Lett. 2002, 29. [Google Scholar] [CrossRef]
  26. Petrenko, M.; Ichoku, C.; Leptoukh, G. Multi-sensor aerosol products sampling system (MAPSS). Atmos. Meas. Tech. 2012, 5, 913–926. [Google Scholar] [CrossRef]
  27. Li, Z.Q.; Li, D.H.; Li, K.T.; Xu, H.; Chen, X.F.; Chen, C.; Xie, Y.S.; Li, L.; Li, L.; Li, W.; et al. Sun-sky radiometer Observation Network with the extension of multi-wavelength polarization measurements. J. Remote Sens. 2015, 19, 496–520. [Google Scholar]
  28. Li, Z.; Goloub, P.; Dubovik, O.; Blarel, L.; Zhang, W.; Podvin, T.; Sinyuk, A.; Sorokin, M.; Chen, H.; Holen, B.; et al. Improvements for ground-based remote sensing of atmospheric aerosol properties by additional polarimetric measurements. J. Quant. Spectrosc. Radiat. Transfer. 2009, 110, 1954–1961. [Google Scholar] [CrossRef]
  29. Holben, B.N.; Eck, T.F.; Slutsker, I.; Tanre, D.; Buis, J.P.; Setzer, A.; Vermote, E.; Reagan, J.A.; Kaufman, Y.J.; Nakajima, T.; et al. AERONET—A federated instrument network and data archive for aerosol characterization. Remote Sens. Environ. 1998, 66, 1–16. [Google Scholar] [CrossRef]
  30. Dubovik, O.; King, M.D. A flexible inversion algorithm for retrieval of aerosol optical properties from Sun and sky radiance measurements. J. Geophys. Res. 2000, 105, 20673–20696. [Google Scholar] [CrossRef]
  31. Dubovik, O.; Sinyuk, A.; Lapyonok, T.; Holben, B.N.; Mishchenko, M.; Yang, P.; Eck, T.F.; Volten, H.; Muñoz, O.; Veihelmann, B.; et al. Application of spheroid models to account for aerosol particle nonsphericity in remote sensing of desert dust. J. Geophys. Res. 2006, 111. [Google Scholar] [CrossRef]
  32. Dubovik, O.; Smirnov, A.; Holben, B.N.; King, M.D.; Kaufman, Y.J.; Eck, T.F.; Slutsker, I. Accuracy assessments of aerosol optical properties retrieved from Aerosol Robotic Network(AERONET) Sun and sky radiance measurements. J. Geophys. Res. 2000, 105, 9791–9806. [Google Scholar] [CrossRef]
  33. O’Neill, N.T.; Eck, T.F.; Holben, B.N.; Smirnov, A.; Dubovik, O.; Royer, A. Bimodal size distribution influences on the variation of Ångström derivatives in spectral and optical depth space. J. Geophys. Res. 2001, 106, 9787–9806. [Google Scholar] [CrossRef]
  34. O’Neill, N.T.; Dubovik, O.; Eck, T.F. Modified Ångström exponent for the characterization of submicrometer aerosols. Appl. Opt. 2001, 40, 2368–2375. [Google Scholar] [CrossRef] [PubMed]
  35. O’Neill, N.T.; Eck, T.F.; Smirnov, A.; Holben, B.N.; Thulasiraman, S. Spectral discrimination of coarse and fine mode optical depth. J. Geophys. Res. 2003, 108. [Google Scholar] [CrossRef]
  36. Zhang, Y.; Li, Z.; Wang, Y.; Li, K.; Li, D.; Zhang, Y.; Wei, P.; Wang, L.; Lv, Y. Improving accumulation-mode fraction based on spectral aerosol optical depth in Beijing. Spectrosc. Spect. Anal. 2013, 33, 2795–2802. [Google Scholar]
  37. Wang, L.; Li, Z.; Li, D.; Li, K.; Tian, Q.; Li, L.; Zhang, Y.; Lv, Y.; Gu, X. Retrieval of dust fraction of atmospheric aerosols based on spectra characteristics of refractive indices obtained from remote sensing measurements. Spectrosc. Spect. Anal. 2012, 32, 1644–1649. [Google Scholar]
  38. Wang, L.; Li, Z.; Tian, Q.; Ma, Y.; Zhang, F.; Zhang, Y.; Li, D.; Li, K.; Li, L. Estimate of aerosol absorbing components of black carbon, brown carbon, and dust from ground-based remote sensing data of sun-sky radiometers. J. Geophys. Res. 2013, 118, 6534–6543. [Google Scholar] [CrossRef]
  39. Li, Z.; Gu, X.; Wang, L.; Li, D.; Xie, Y.; Li, K.; Dubovik, O.; Schuster, G.; Goloub, P.; Zhang, Y.; et al. Aerosol physical and chemical properties retrieved from ground-based remote sensing measurements during heavy haze days in Beijing winter. Atmos. Chem. Phys. 2013, 13, 10171–10183. [Google Scholar] [CrossRef] [Green Version]
  40. Ångström, A. On the atmospheric transmission of sun radiation and on dust in the air. Geogr. Ann. 1929, 12, 130–159. [Google Scholar] [CrossRef]
  41. Sayer, A.M.; Hsu, N.C.; Bettenhausen, C.; Jeong, M.J. Validation and uncertainty estimates for MODIS Collection 6 “Deep Blue” aerosol data. J. Geophys. Res. 2013, 118, 7864–7872. [Google Scholar] [CrossRef]
  42. Li, C.; Lau, A.K.H.; Mao, J.; Chu, D.A. Retrieval, validation, and application of the 1-km aerosol optical depth from MODIS measurements over Hong Kong. IEEE Trans. Geosci. Remote Sens. 2005, 43, 2650–2658. [Google Scholar]
  43. Xu, H.; Li, Z.; Li, D.; Li, L.; Chen, X.; Xie, Y.; Li, K.T.; Chen, C.; Zhang, Y. Ground-based polarimetric remote sensing of dust aerosol properties in Chinese deserts near Hexi Corridor. Adv. Meteor. 2014, 2014, 240452. [Google Scholar] [CrossRef]
  44. Yu, X.N.; Cheng, T.T.; Chen, J.M. Optical properties of columnar aerosols: A global comparison from AERONET observations. In Proceedings of the 14th National Conference on Atmospheric Environment, Kunming, China, 22 October 2007; pp. 147–153.
  45. Clarke, A.D.; Shinozuka, Y.; Kapustin, V.N.; Howell, S.; Huebert, B.; Doherty, S.; Anderson, T.; Covert, D.; Anderson, J.; Hua, X.; et al. Size distributions and mixtures of dust and black carbon aerosol in Asian outflow: Physiochemistry and optical properties. J. Geophys. Res. 2004, 109. [Google Scholar] [CrossRef]
  46. Zhang, Y.; Li, Z. Remote sensing of atmospheric fine particulate matter (PM 2.5) mass concentration near the ground from satellite observation. Remote Sens. Environ. 2015, 160, 252–262. [Google Scholar] [CrossRef]
  47. Ge, J.M.; Su, J.; Ackerman, T.P.; Fu, Q.; Huang, J.P.; Shi, J.S. Dust aerosol optical properties retrieval and radiative forcing over northwestern China during the 2008 China-US joint field experiment. J. Geophys. Res. 2010, 115. [Google Scholar] [CrossRef]
  48. Xu, J.; Bergin, M.H.; Yu, X.; Liu, G.; Zhao, J.; Carrico, C.M.; Baumann, K. Measurement of aerosol chemical, physical and radiative properties in the Yangtze Delta region of China. Atmos. Environ. 2002, 36, 161–173. [Google Scholar] [CrossRef]
  49. Wang, L.; Li, Z.Q.; Ma, Y.; Li, L.; Wei, P. Retrieval of aerosol chemical composition from ground-based remote sensing data of sun-sky radiometers during haze days in Beijing winter. J. Remote Sens. 2013, 17, 944–958. [Google Scholar]
  50. Cao, J.J.; Lee, S.C.; Chow, J.C.; Watson, J.G.; Ho, K.F.; Zhang, R.J.; Jin, Z.D.; Shen, Z.X.; Chen, G.C.; Kang, Y.M.; et al. Spatial and seasonal distributions of carbonaceous aerosols over China. J. Geophys. Res. 2007, 112. [Google Scholar] [CrossRef]
  51. Dubovik, O.; Holben, B.; Eck, T.F.; Smirnov, A.; Kaufman, Y.J.; King, M.D.; Tanre, D.; Slutsker, I. Variability of absorption and optical properties of key aerosol types observed in worldwide locations. J. Atmos. Sci. 2002, 59, 590–608. [Google Scholar] [CrossRef]
  52. Koven, C.D.; Fung, I. Inferring dust composition from wavelength-dependent absorption in Aerosol Robotic Network (AERONET) data. J. Geophys. Res. 2006, 111. [Google Scholar] [CrossRef]
  53. Levy, R.C.; Remer, L.A.; Mattoo, S.; Vermote, E.F.; Kaufman, Y.J. Second-generation operational algorithm: Retrieval of aerosol properties over land from inversion of Moderate Resolution Imaging Spectroradiometer spectral reflectance. J. Geophys. Res. 2007, 112. [Google Scholar] [CrossRef]
  54. Levy, R.C.; Remer, L.A.; Dubovik, O. Global aerosol optical properties and application to Moderate Resolution Imaging Spectroradiometer aerosol retrieval over land. J. Geophys. Res. 2007, 112. [Google Scholar] [CrossRef]
  55. Kleidman, R.G.; O’Neill, N.T.; Remer, L.A.; Kaufman, Y.J.; Eck, T.F.; Tanré, D.; Dubovik, O.; Holben, B.N. Comparison of Moderate Resolution Imaging Spectroradiometer (MODIS) and Aerosol Robotic Network (AERONET) remote-sensing retrievals of aerosol fine mode fraction over ocean. J. Geophys. Res. 2005, 110. [Google Scholar] [CrossRef]
  56. Giles, D.M.; Holben, B.N.; Eck, T.F.; Sinyuk, A.; Smirnov, A.; Slutsker, I.; Dickerson, R.R.; Thompson, A.M.; Schafer, J.S. An analysis of AERONET aerosol absorption properties and classifications representative of aerosol source regions. J. Geophys. Res. 2012, 117. [Google Scholar] [CrossRef]

