Article

InSAR Detection and Field Evidence for Thermokarst after a Tundra Wildfire, Using ALOS-PALSAR

1
International Arctic Research Center, University of Alaska Fairbanks, Fairbanks, AK 99775, USA
2
National Institute for Environmental Studies, Tsukuba 305-8506, Japan
3
Earth System Science Programme, Faculty of Science, Chinese University of Hong Kong, Hong Kong, China
4
Geophysical Institute, University of Alaska Fairbanks, Fairbanks, AK 99775, USA
5
The Remote Sensing Technology Center of Japan, Tsukuba 305-0032, Japan
*
Author to whom correspondence should be addressed.
Submission received: 22 December 2015 / Revised: 20 February 2016 / Accepted: 1 March 2016 / Published: 8 March 2016

Abstract

:
Thermokarst is the process of ground subsidence caused by either the thawing of ice-rich permafrost or the melting of massive ground ice. The consequences of permafrost degradation associated with thermokarst for surface ecology, landscape evolution, and hydrological processes have been of great scientific interest and social concern. Part of a tundra patch affected by wildfire in northern Alaska (27.5 km2) was investigated here, using remote sensing and in situ surveys to quantify and understand permafrost thaw dynamics after surface disturbances. A two-pass differential InSAR technique using L-band ALOS-PALSAR has been shown capable of capturing thermokarst subsidence triggered by a tundra fire at a spatial resolution of tens of meters, with supporting evidence from field data and optical satellite images. We have introduced a calibration procedure, comparing burned and unburned areas for InSAR subsidence signals, to remove the noise due to seasonal surface movement. In the first year after the fire, an average subsidence rate of 6.2 cm/year (vertical) was measured. Subsidence in the burned area continued over the following two years, with decreased rates. The mean rate of subsidence observed in our interferograms (from 24 July 2008 to 14 September 2010) was 3.3 cm/year, a value comparable to that estimated from field surveys at two plots on average (2.2 cm/year) for the six years after the fire. These results suggest that this InSAR-measured ground subsidence is caused by the development of thermokarst, a thawing process supported by surface change observations from high-resolution optical images and in situ ground level surveys.

Graphical Abstract

1. Introduction

The development of thermokarst in ice-rich permafrost regions is a natural hazard, causing irreversible geomorphic changes [1]. Thermokarst is the process by which characteristic landforms result from either the thawing of ice-rich permafrost or the melting of massive ice [2]. The formation of large depressions and lakes or swamps produced by thermokarst processes is observed in discontinuous and continuous permafrost zones, especially in Alaska and Northeastern Siberia. These regions are often underlain by highly ice-rich permafrost, known as Yedoma ice-complex (Yedoma). Yedoma is a unique Quaternary permafrost deposit, consisting of excessive amounts of ground ice (50%–90% in volume) and organic-rich sediments [3]. Permafrost degradation caused by thermokarst implies the mobilization of not only huge amounts of currently confined organic carbon, but also a certain amount of water preserved as ground ice. Therefore, feedbacks from permafrost degradation to the surface ecology, landscape, and hydrological processes have been of great scientific and social concern, and the need for elucidation of their role in the ecosystem and global climate system has been emphasized by many authors (e.g., [4,5,6,7,8]).
The amount of organic carbon preserved in permafrost regions is estimated to be twice as large as the amount of carbon in the atmosphere, and 211 + 160/−153 Gt are stored in Yedoma regions [9]. Zimov et al. and Walter et al. [10,11] reported that thawing of Yedoma may release a significant amount of methane (~3.8 Tg/year), which can lead to further climate warming. A warming climate can induce environmental changes including thermokarst, which accelerates climate change through the microbial breakdown of organic carbon and the further release of greenhouse gases [12]. Despite the recognition of uncertainty about the fate of Arctic regions and global climate change due to permafrost degradation, information about the spatial extent and rates of thermokarst processes is still limited.
One promising technique for the quantification of thermokarst in remote wide areas underlain by ice-rich permafrost is the deployment of Interferometric Synthetic Aperture Radar (InSAR). InSAR allows the remote detection of deformation on the terrestrial surface associated with earthquakes, volcanic activities, or other natural and anthropogenic alteration underground (e.g., [13,14]). There have been several studies regarding surface change related to frozen ground dynamics. The first successful attempt to use InSAR to detect thaw settlement was made by [15]. Short et al. [16] then compared TerraSAR-X, RADARSAT-2, and ALOS-PALSAR interferometry for monitoring permafrost environments, concluding that ALOS-PALSAR, in particular, was the most promising data source for identifying permafrost and landscape change. In recent years, both seasonal thaw settlement [17] and an increase in surface subsidence caused by Arctic tundra fire [18] in a permafrost region of north Alaska were detected by InSAR time series analysis using ALOS-PALSAR data. Liu et al. [17] provided temporally averaged levels of seasonal thaw settlement in individual drained thermokarst lake basins, demonstrating the ability to detect surface movement associated with ground freeze-thaw cycle at tens of meters spatial resolution. Large-scale thermokarst subsidence in the Anaktuvuk River Fire (ARF) scar was detected using InSAR for the first time by [18]. Although spatial variation in thermokarst subsidence at the regional scale was shown, field information and InSAR analysis served to limit understanding of local thermokarst processes, as these phenomena occur at much smaller scales (from several to one hundred meters). To date, InSAR techniques for quantifying thermokarst subsidence with enough spatial and temporal resolution for understanding local thermokarst processes in detail, including evidence from fieldwork, have not yet been reported for the ARF scar.
The objectives of this paper are to demonstrate the ability of L-band InSAR to quantify thermokarst subsidence at spatial resolutions of an order of tens of meters, including supporting evidence from field surveys and analysis of optical satellite images, and to discuss the efficiency and limitations of this method as a monitoring tool for thermokarst. To this end, we investigated the northern part of the same ARF scar in detail, using both optical and microwave remote sensing, as well as in situ fieldwork.

2. Materials and Methods

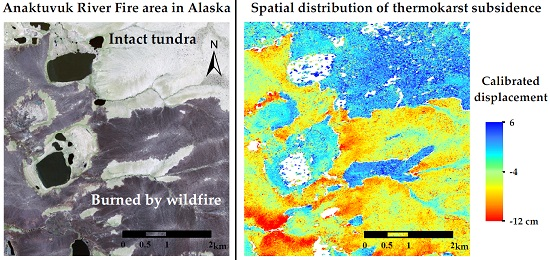
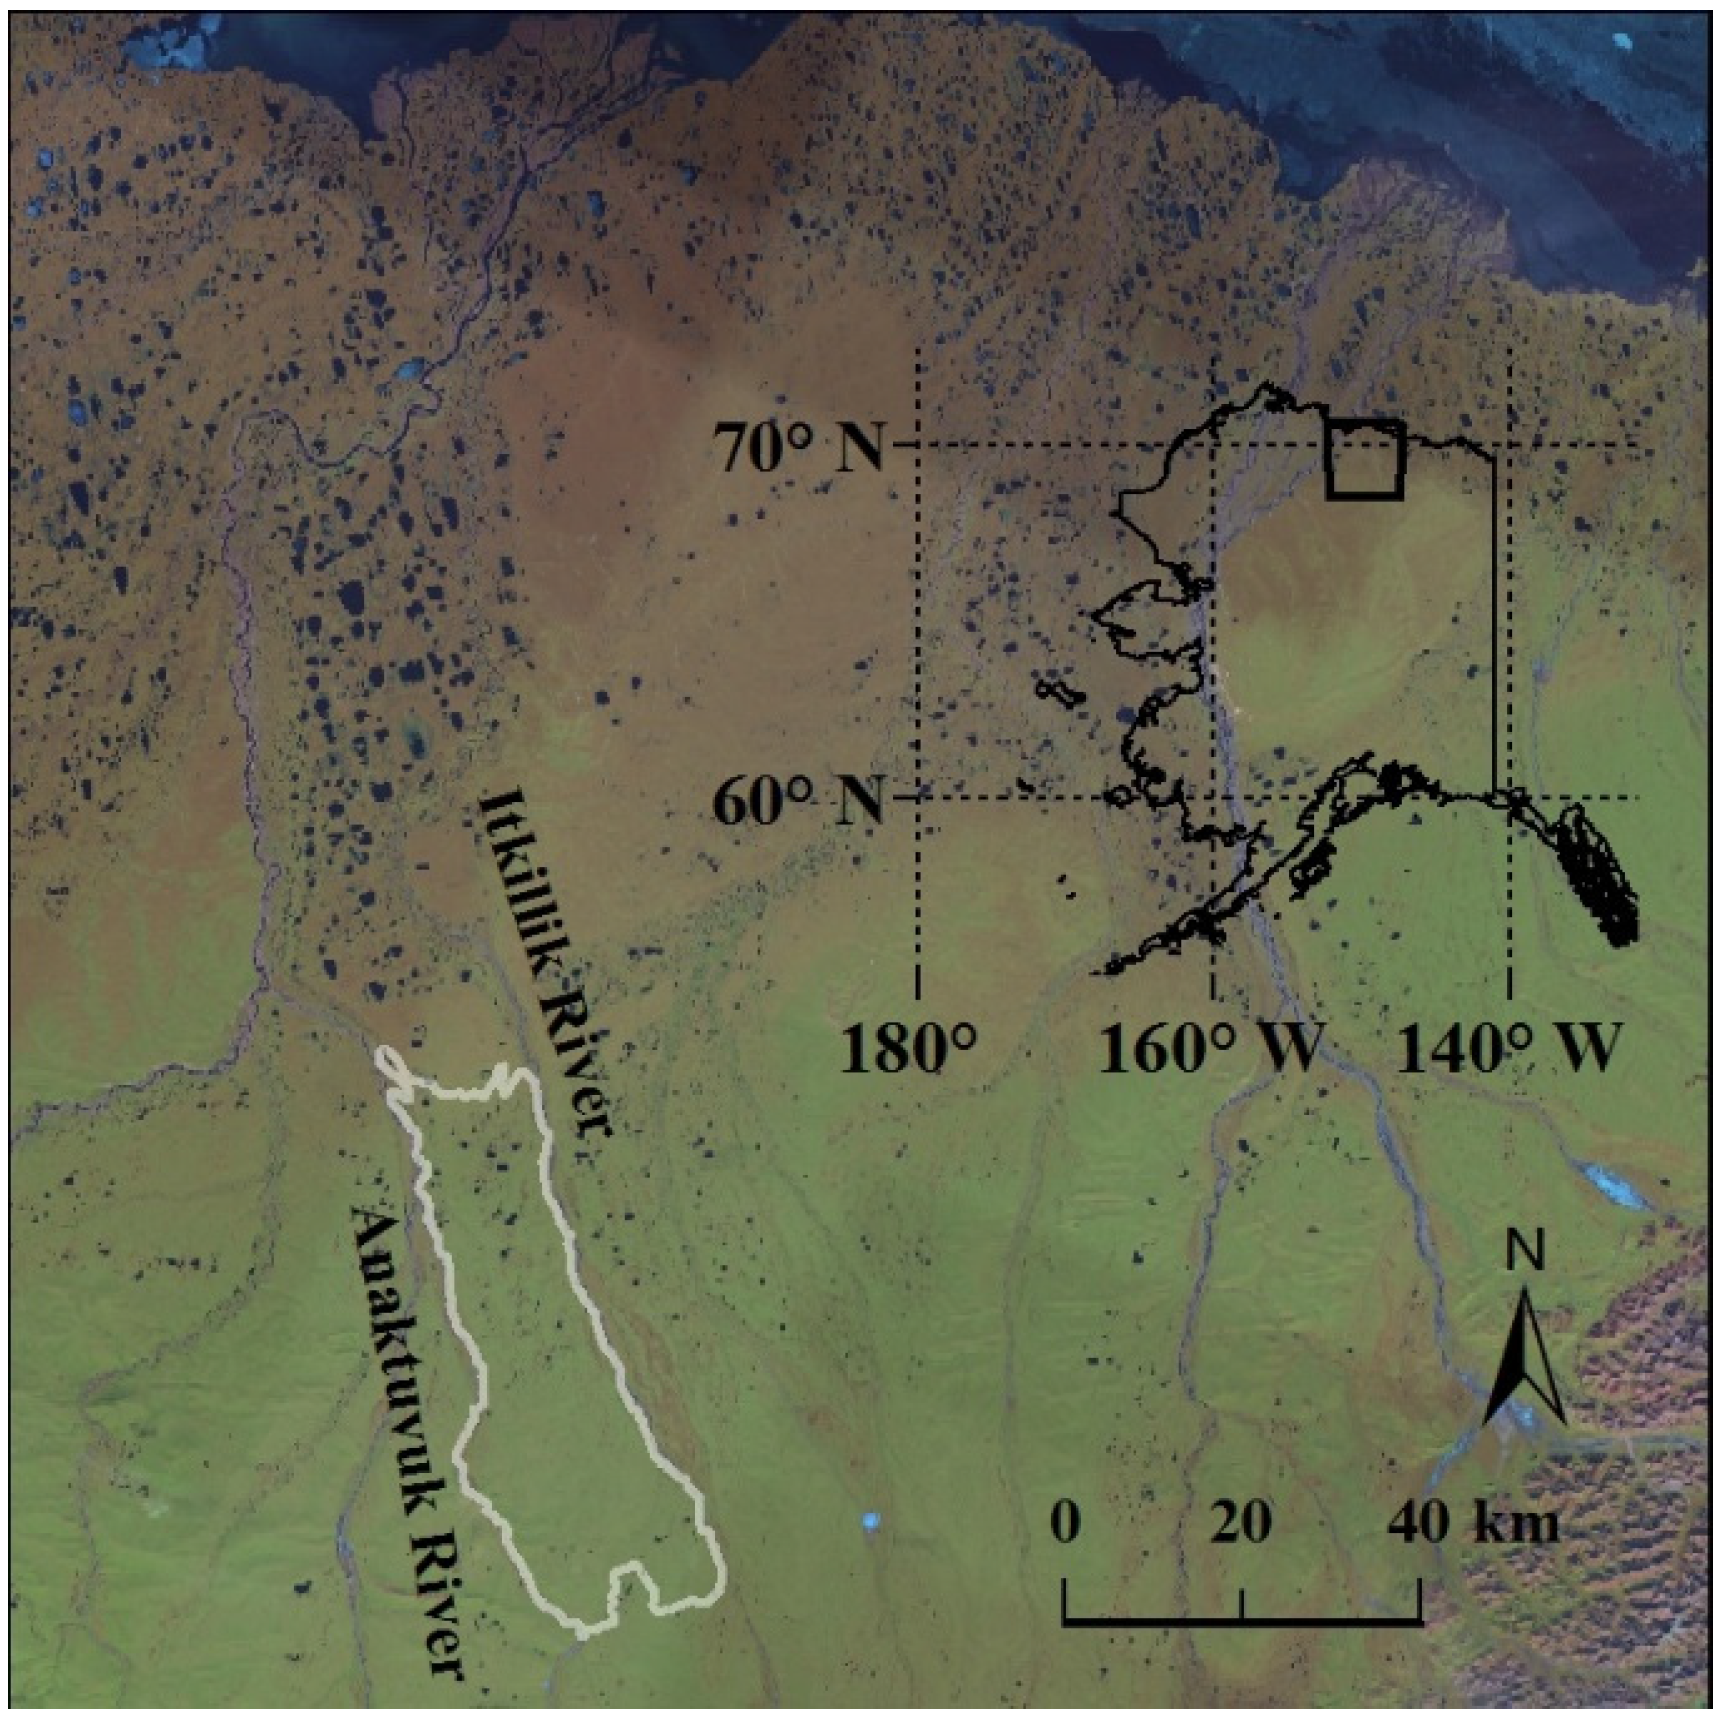
2.1. Anaktuvuk River Fire (ARF)

In 2007, ARF (the largest tundra wild fire in recorded history) occurred near the Anaktuvuk River on the North Slope of Alaska (Figure 1), an area dominated by ice-rich permafrost, according to the Circum-Arctic Map of Permafrost and Ground Ice Conditions [19]. It was estimated that the maximum age of soil carbon lost was 50 years [20]. ARF was ignited by lightning on 16 July, and burned rigorously through September [21]. Our target area is at the northernmost part of the ARF, and was burned toward the end of September. While intensive biochemical research has been conducted regarding this vast, unique, disturbed permafrost terrain [20,22,23,24], estimation of the volumetric subsidence due to thermokarst after this fire has not yet been attempted, as the burned area was too extensive (about 1000 km2) for analyses using in situ measurements.

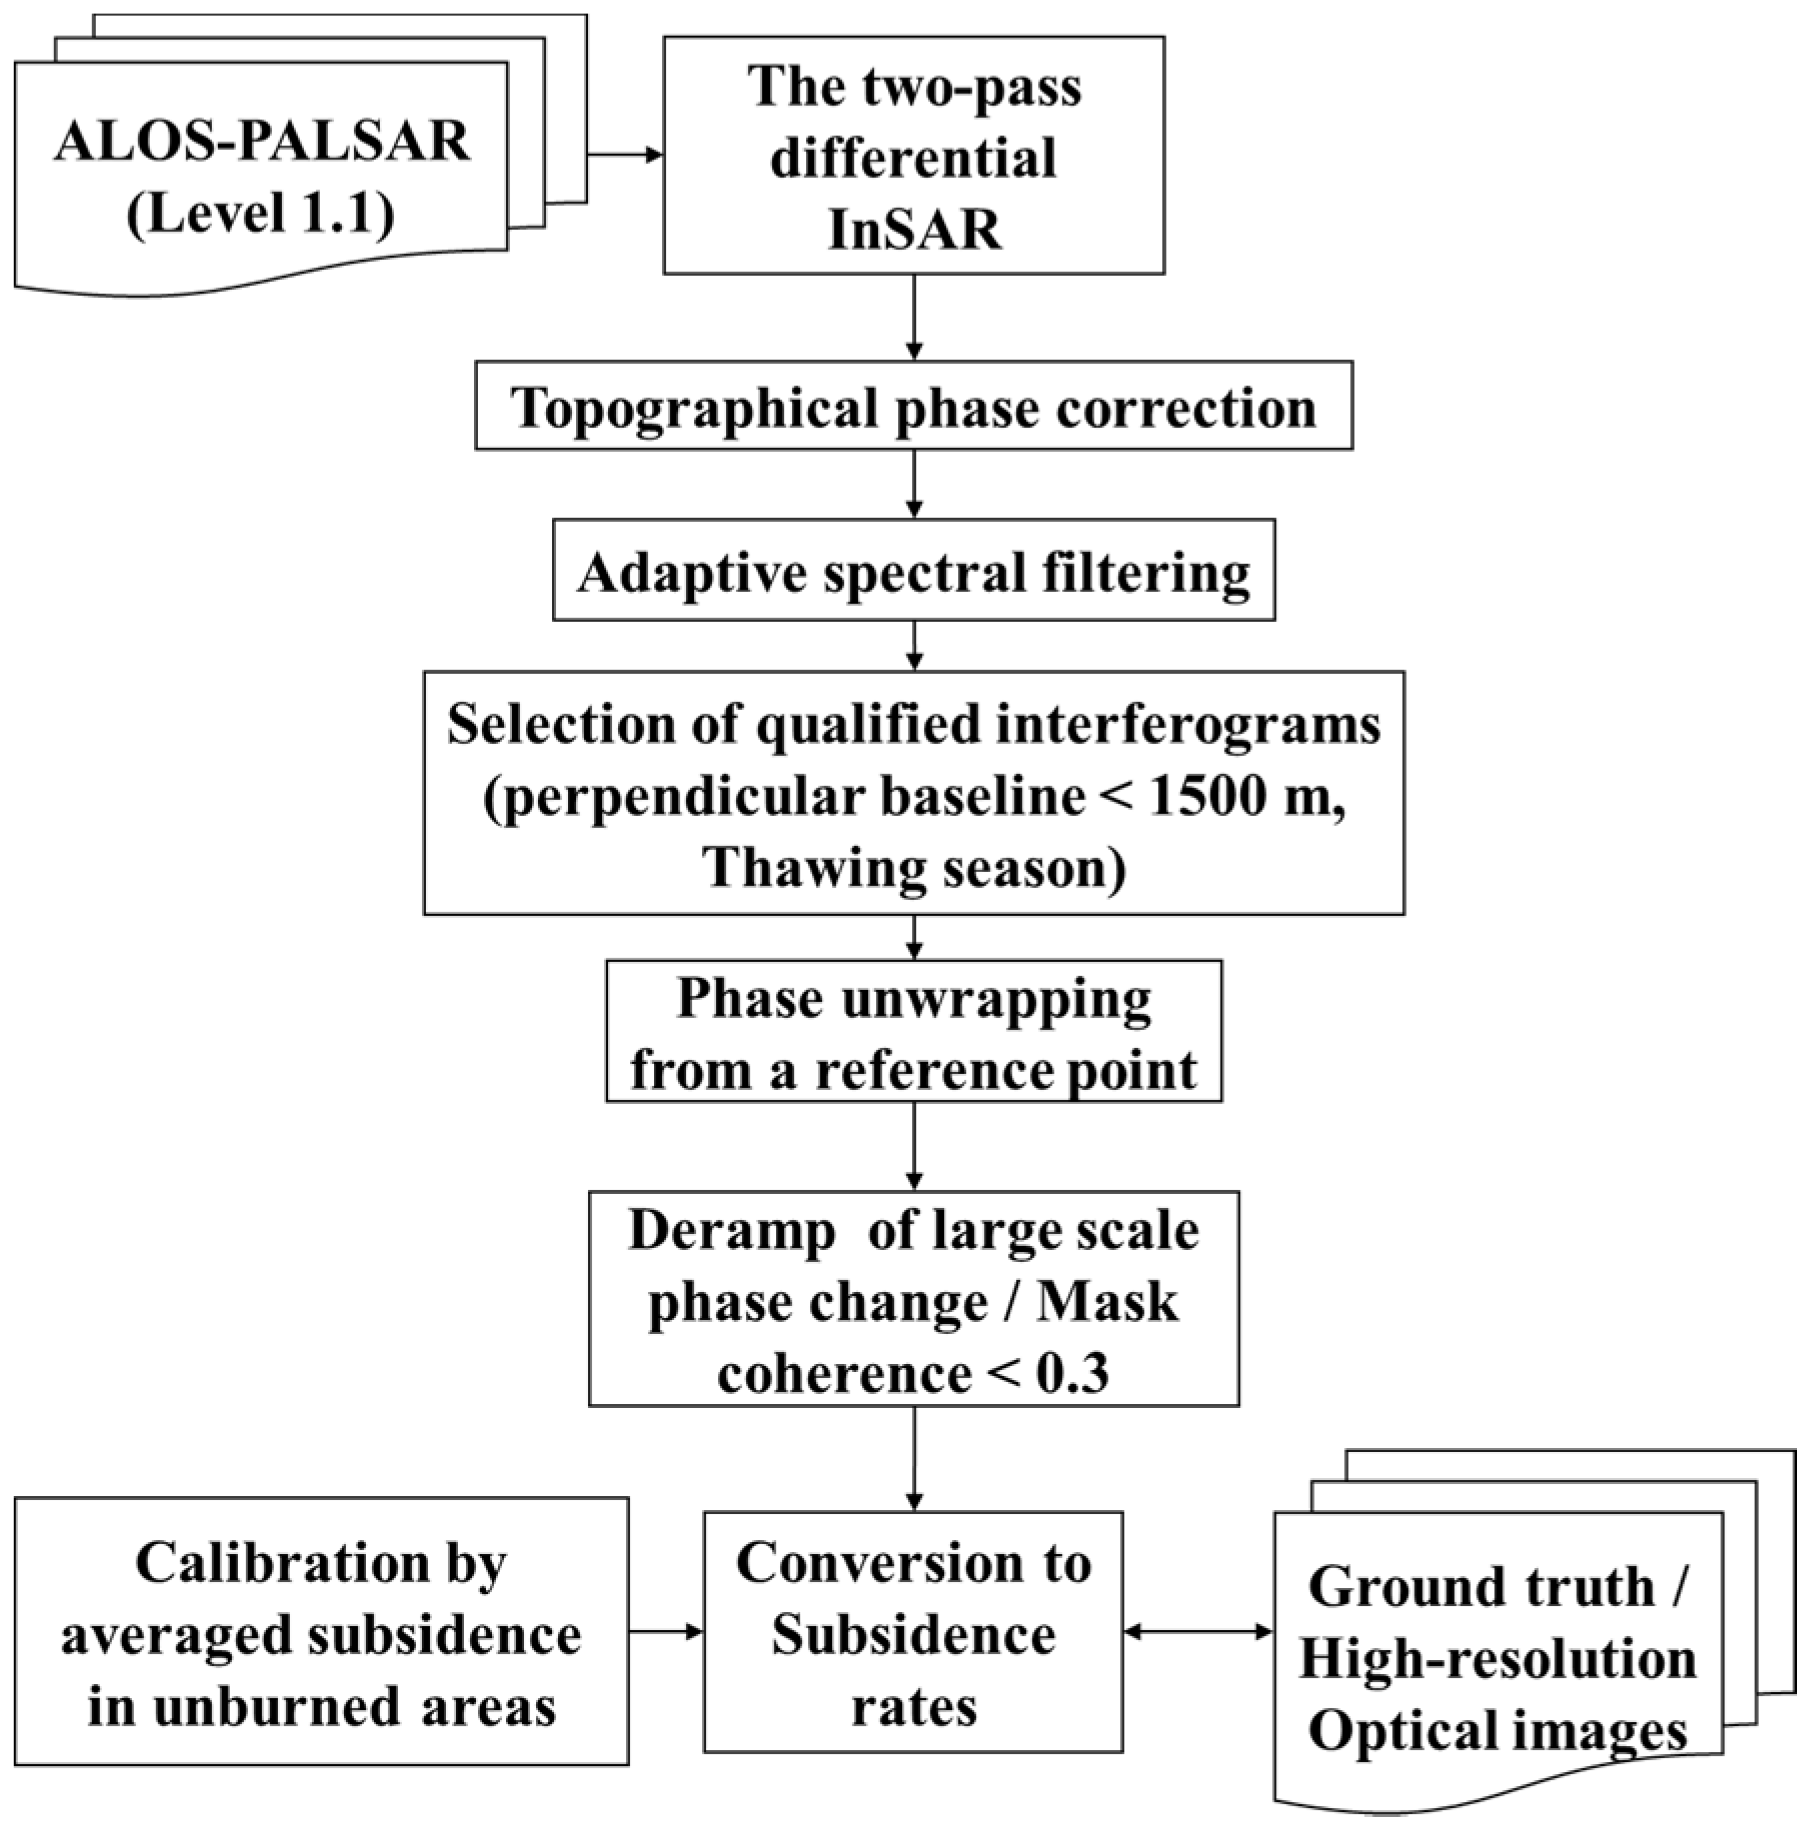
2.2. InSAR Processing

The general workflow for InSAR processing and interferograms analysis processes in our study is shown in Figure 2. ALOS-PALSAR (L-band SAR) was chosen for our analysis because at L-band the electro-magnetic wave—due to its longer wavelength (23.8 cm)—can penetrate through vegetation cover, yielding coherent signals. This is particularly suitable for thermokarst application of InSAR, as thermokarst is often associated with surface vegetation disturbance and recovery over time. The accuracy of displacement detection by InSAR in the best case is on the order of 1 mm/year [25] using time series analysis. However, accurate DEM is critical for the extraction of reliable measurements in conventional differential InSAR analysis from PALSAR pairs, as PALSAR baselines can be very large. For the target areas in this study, a 6.5-m spatial resolution DEM was created using ALOS-PRISM data, and was used for terrain correction of InSAR. The vertical accuracy of DEM was estimated as 3 m from our field surveys. Vertical displacement errors associated with DEM height ambiguities for our InSAR pairs are listed in Table 1.
Liu et al. [15] summarized three limitations of the InSAR technique when used to measure surface deformation over permafrost regions. First, InSAR cannot measure absolute ground displacements, but only determine relative displacements across an individual interferogram. In our study, interferogram phase was set to 0, at a starting point for unwrapping entire interferograms. This starting point was set in an intact (unburned) and adjacent part of the northern end of the ARF scar (Figure 3), where only seasonal freeze and thaw in the active layer affects surface deformation detectable by InSAR, assuming there is no thermokarst subsidence during our study period. Second, InSAR requires stable surface conditions to maintain phase coherence for robust differential phase measurements. If there is significant change in surface characteristics between SAR data acquisitions—such as vegetation change, snowfall or melt, or ground freeze or thaw—overall coherence in the processed interferograms will be too low [16]. Third, InSAR measures only one-dimensional surface displacements in the line-of-sight (LOS) direction. In this study, surface movements obtained in the line of sight has been projected to vertical directions using the satellite incidence angle (34.3°). The vertical displacement D was calculated as Formula (1):
D = −λ/4π × (ϕ/cos(θ)),
where θ is the incidence angle, λ is the signal wavelength, and ϕ is the interferometric phase. Our study area contains mostly flat or gentle slopes (95% of the studied area displays less than 5° slope angles), except for the boundaries between river valleys and terraces. It is assumed that thermokarst subsidence had occurred primarily in the vertical direction for short time intervals (less than a year), although ground subsides preferentially along ice wedge network lines, making the deformation three-dimensional. Little evidence of geomorphic changes inducing surface lateral movement, such as thaw slumps and active layer detachments, has been found during either our fieldwork and reconnaissance flights over the area or the surveillance of available high-resolution images obtained by optical satellite sensors. Hence, for this data set, vertical subsidence is considered a reasonable assumption.
We deployed a processing method of conventional two-pass differential InSAR, using GAMMA Software Ver. 20081204 (GAMMA Remote Sensing AG, Switzerland), for thermokarst detection. On the course of InSAR processing, intensity cross-correlation with a window size of 256 was used to estimate co-registration offset and adaptive spectral filtering with a window size of 16 was applied to created interferograms. ALOS-PALSAR initiated its operation in 2006 and ended in early 2011, covering two snow-free seasons prior to and three seasons after ARF. PALSAR level 1.1 data (Frame 1390, Track 255), with a wide range of perpendicular baselines and time intervals, were chosen for InSAR processing. The PALSAR frame includes the northern half of the fire scar and surrounding unburned areas. InSAR pairs including the snow-covered period showed strong decorrelation, and the pairs with large (>1500 m) perpendicular baselines contained unreliable signals of deformation, caused by residual error in external DEM. Decorrelation in the interferograms was especially prominent within the fire scar when SAR images were paired from acquisition times before and after the fire, as surface conditions had been altered significantly. As a result, we chose five interferograms with sufficiently good coherence conditions (0.3 was used as a threshold) and minimized noise levels from snow-free thawing seasons before or after the fire to discuss permafrost degradation due to thermokarst after the tundra fire (Table 1, Figure 3). In order for descriptions in results and discussion, we define the thawing season of a year as a period starting from 1 June until 30 September.
Some interferograms had large-scale changes in phase, likely caused by orbital errors and/or the ionosphere effect, shown as bands or stripes of InSAR phase across whole analyzed areas (see Figure 3b for an example). As we are only interested in subsidence caused by thermokarst, which is a localized deformation phenomenon of limited spatial extent, we were able to model and reduce orbital errors as well as some large-scale ionosphere artifacts using a 2D quadratic spatial ramp model. Given that the region of interest in this study has a small spatial extent, and since the ionospheric signals were large-scale, simple polynomial fitting methods were sufficient, and no ionospheric correction method [26] was necessary. Likewise, impacts from residual atmospheric signals to the spatial pattern of the subsiding area are presumed to be small.

2.3. Calibration of Seasonal Surface Movement and Selection of Target Area

Unwrapped phase changes for each interferogram were converted to vertical ground movement, with movement towards the satellite defined as positive and away as negative. As we assumed, dominant deformation in the target area was in the vertical direction, with negative values indicating subsidence relative to the reference point. Statistics for converted ground movement values were calculated for each land cover unit (burned and unburned). The values for ground movement were shown as subsidence amounts, calibrated by subtracting average values of unburned areas inside the ARF scar. This manipulation is an alternative way to remove seasonal surface displacement due to the freeze-thaw cycle from subsidence signal of InSAR, while [27] used inversion algorithm to calculate best-fit averaged trend of subsidence. In our calibration, we assumed that there was no thermokarst subsidence in the unburned areas and the areas experienced only seasonal ground movement. Unburned areas inside the ARF scar were chosen for reference rather than unburned areas outside ARF because Pre-2 and Post-3 InSAR pairs had ionospheric effects along NE–SW and N–S directions, respectively, which had the potential to cause systematic errors in subsidence magnitude comparisons between land cover units. Thus, near-field reference areas will help to reduce impacts from atmospheric artifacts and reduce the error load when analyzing subsidence magnitudes between land cover units.
Liu et al. [27] reported results from InSAR time series analysis for detecting thermokarst subsidence at a test area near Deadhorse, Alaska. Their work quantitatively discussed separation of thermokarst-induced subsidence from cyclic seasonal surface movement, using inversion algorithm with a stack of interferogram pairs using a simplified assumption that seasonal thaw settlement was induced solely by in situ freezing of water. The inversion algorithm requires a certain number of interferograms to improve trend estimation; however, the number of high-quality interferograms is often limited for some areas. This limitation motivated us to induce alternative method to separate seasonal ground heave/settlement due to freeze/thaw cycle in active layer and thermokarst subsidence as described above. By targeting a dry tundra underlain by an ice-rich permafrost area burned by a wildfire within the period of satellite operation, we could effectively estimate the significance of seasonal surface movement by comparison between burned and unburned areas, and/or pre- and post-fire images.

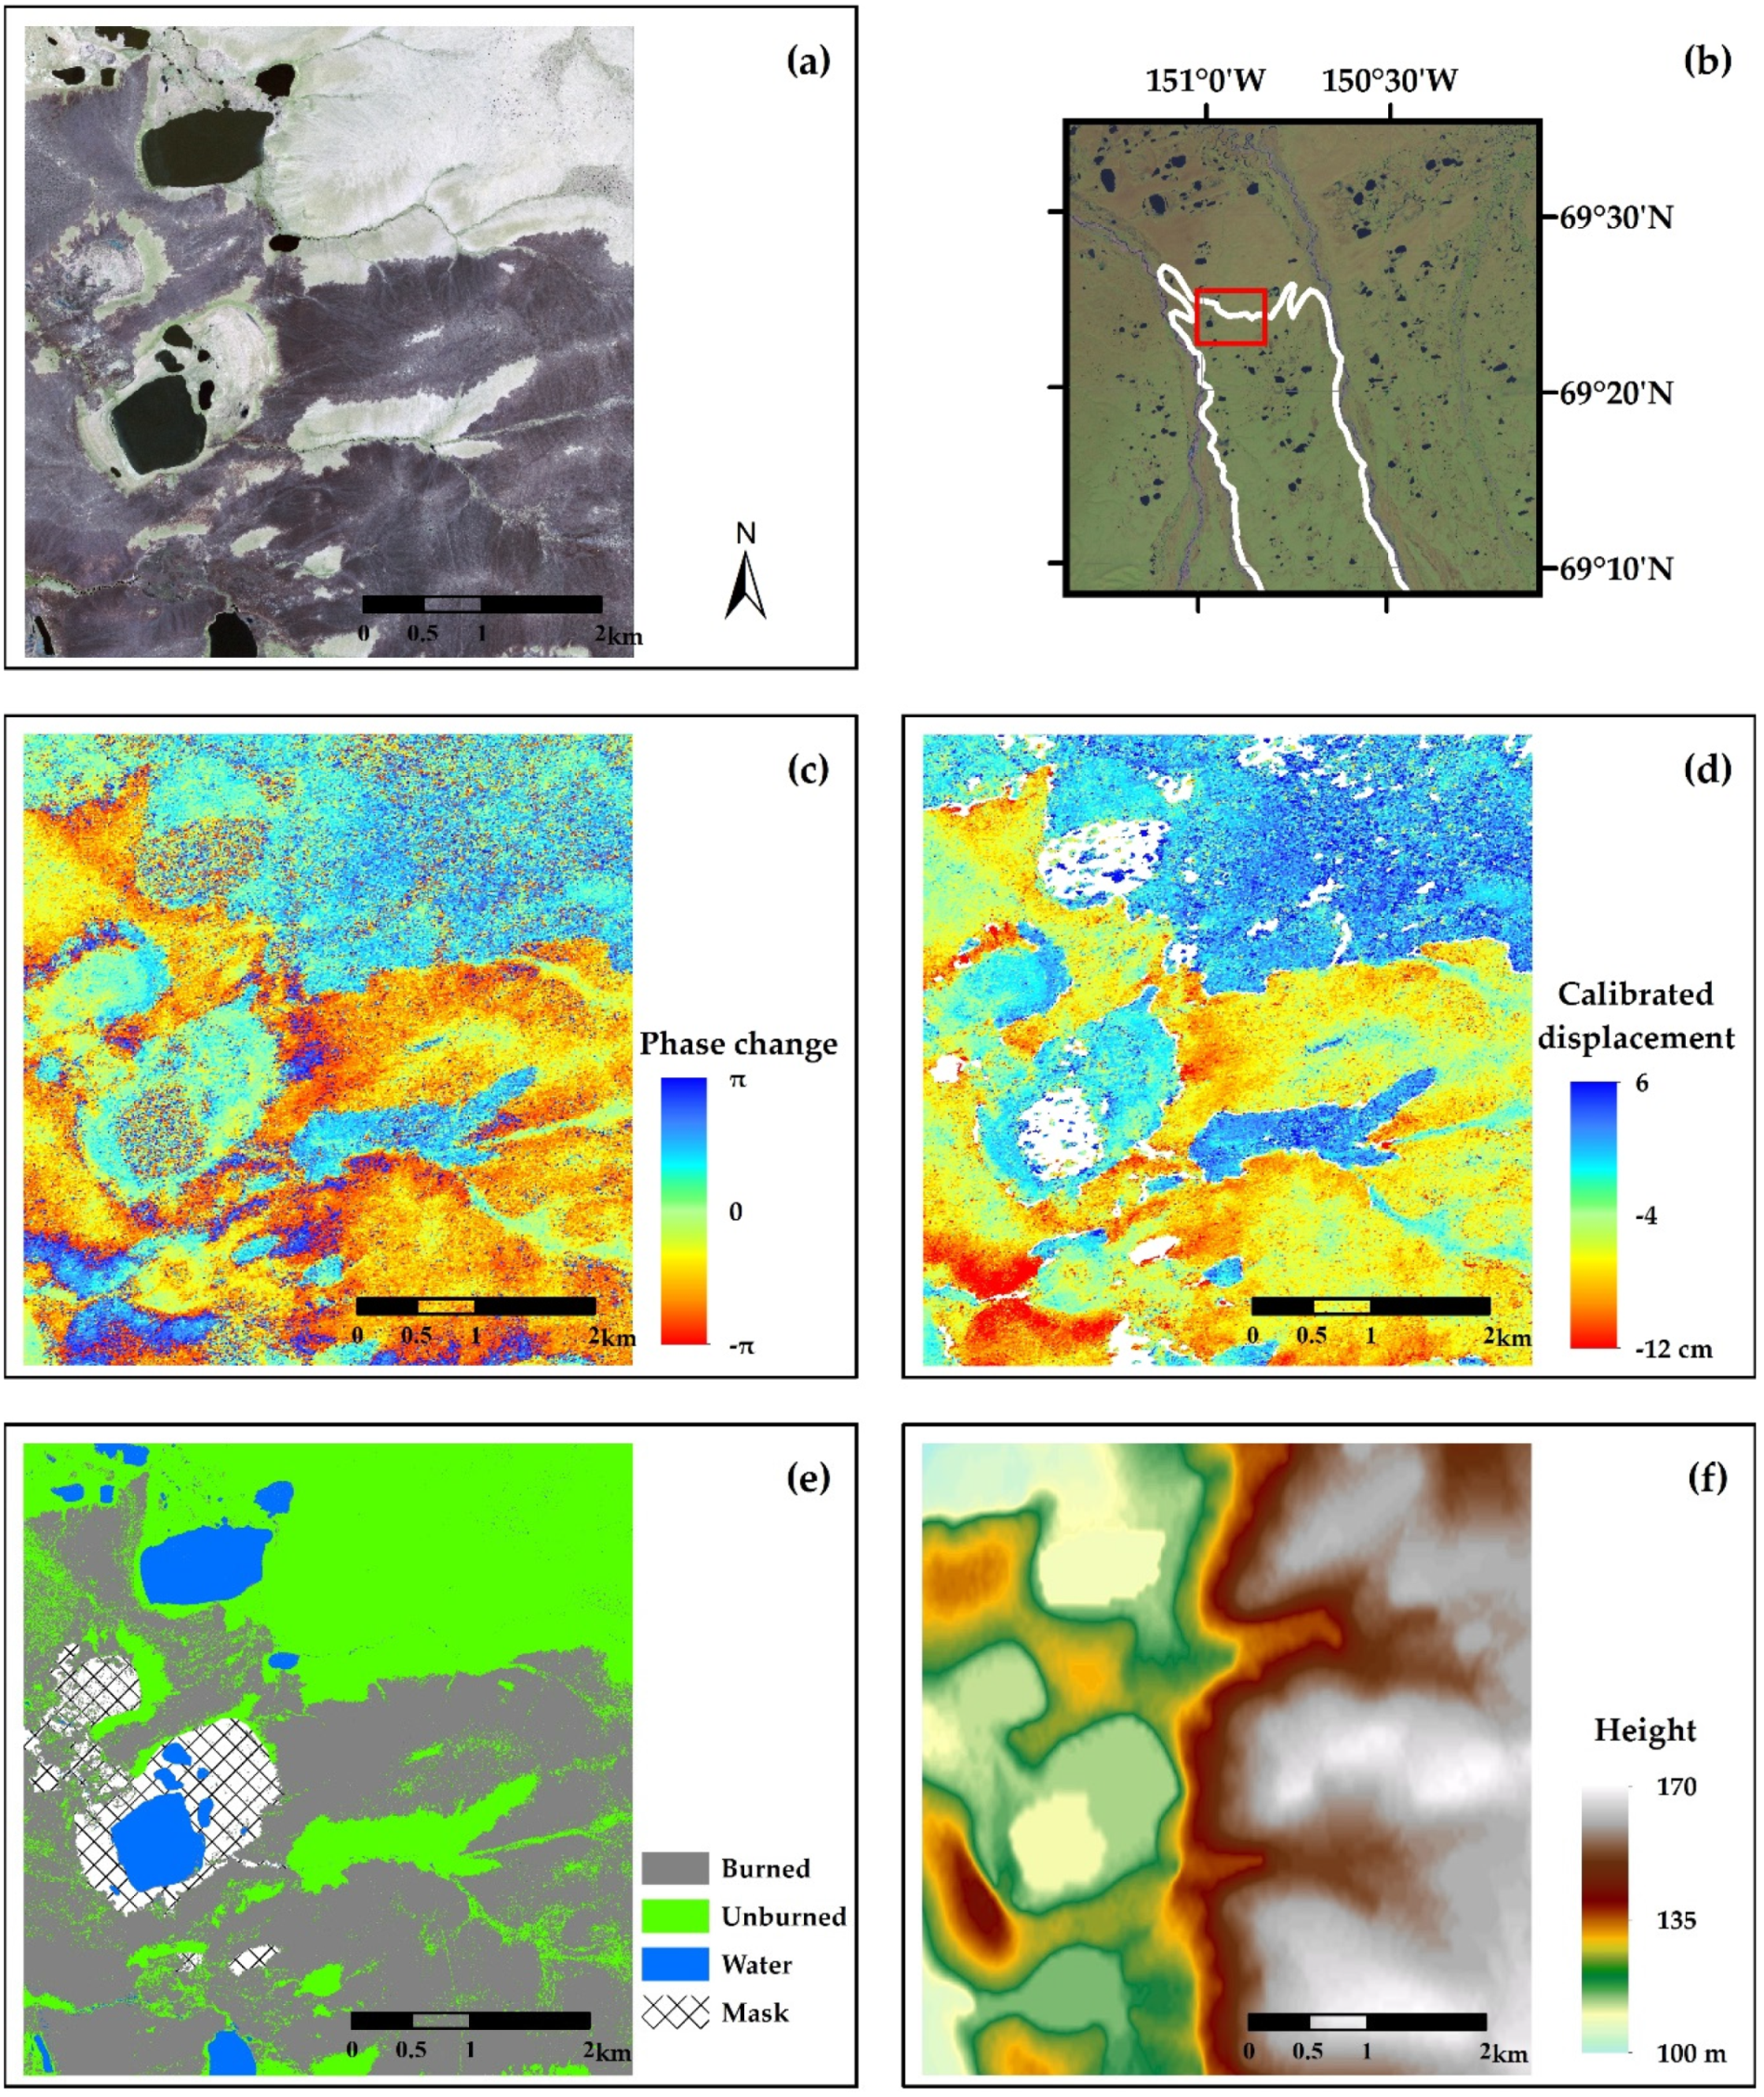
2.4. Optical Images and GIS Analysis for the Target Area

A rectangular area of 27.5 km2 (Figure 4b) containing both unburned and burned portions was chosen from the northern edge of the ARF scar to examine spatial patterns of InSAR signals in detail. Three sub-meter pan-sharpened optical images taken on 27 June 2006 (QuickBird), 3 July 2008 (QuickBird), and 4 July 2013 (Pleiades), representing pre-fire, post-fire, and six years after fire, respectively, were used to visually analyze thermokarst-related changes for cross validation of spatial subsidence patterns seen in the InSAR data.
Land cover was classified into burned, unburned, and water surfaces using a four-band post-fire (QuickBird) image based on an index ((B − NIR)/(B + NIR)) calculated from blue (B: 450–520 nm) and near infrared (NIR: 760–900 nm) bands. Some areas of drained thermokarst lake basins were masked because their burn status either could not be distinguished from the optical image or was likely incorrectly classified using the index applied. Two small unburned patches were also eliminated within these areas because unwrapping of phase changes from the interferogram was not successful (Figure 4e). Masked and water surface areas were removed from further analysis. Unburned areas were subdivided into unburned areas outside and inside of the ARF scar shown in Figure 4b,e, and unburned areas smaller than 2 ha were set as fragmented unburned.
The manipulation of remote sensing data and GIS analysis were conducted using ERDAS Imagine 2015 (Hexagon Geospatial) and ArcGIS 10.3 (Esri) software.

2.5. In Situ Measurements of Surface Micro-Relief and Estimation of Subsidence Volume

Ground truth data collection was conducted using differential GPS surveys to accurately measure micro-topography in the selected areas, including burned and unburned surfaces (Figure 5, Figure 6 and Figure 7) during late August of 2013. The GNSS RTK GPS system (Leica Viva) was deployed to map surface micro-reliefs with an accuracy of 10–20 mm in height. Three plots with dimensions of 30 × 30 or 60 × 60 m were established in the northern part of the fire scar for detailed and precise GPS survey. Plot A included both burned and unburned areas, and Plots B and C represent areas of stronger InSAR subsidence signal than the burned area of Plot A (Figure 4, Figure 5, Figure 6 and Figure 7). Thaw depths at the time of our fieldwork were measured by inserting a steel rod into the ground at 30 random points at burned and unburned areas around Plot A until it encountered resistance from frozen ground. Numerous points within the plots were measured to create Digital Terrain Models (DTMs) by interpolating between measured points (Figure 6b,d,f). The spatial interval of measurement points was approximately 0.5 m, so that the DTMs created represent detailed features of 3D deformation of the ground surface due to thermokarst. Spatially averaged subsidence rates at each plot were calculated as a first-order estimation by differentiating average heights of the DTMs based on fieldwork measurements from average heights of initial ground surface (before the thermokarst process). The average heights of the initial ground surface before the fire at each plot were determined from highest points in the central areas of high-centered polygons (for example, reddish-colored area in Figure 6f) developed by differential subsidence due to thermokarst. We further assumed the initial surface topography to be a smooth gentle slope, resembling adjacent unburned areas, with similarity in texture and surface relief between the burned and unburned areas before the fire, visually confirmed by analysis of optical satellite images with sub-meter resolution. However, it is clear this first-order estimation should be regarded as the minimum amount of volume loss due to thermokarst between the moment of our survey and before the fire. Considering the subsidence of the highest points in the burned areas, the actual volume loss due to thermokarst could be larger than our estimates.

3. Results

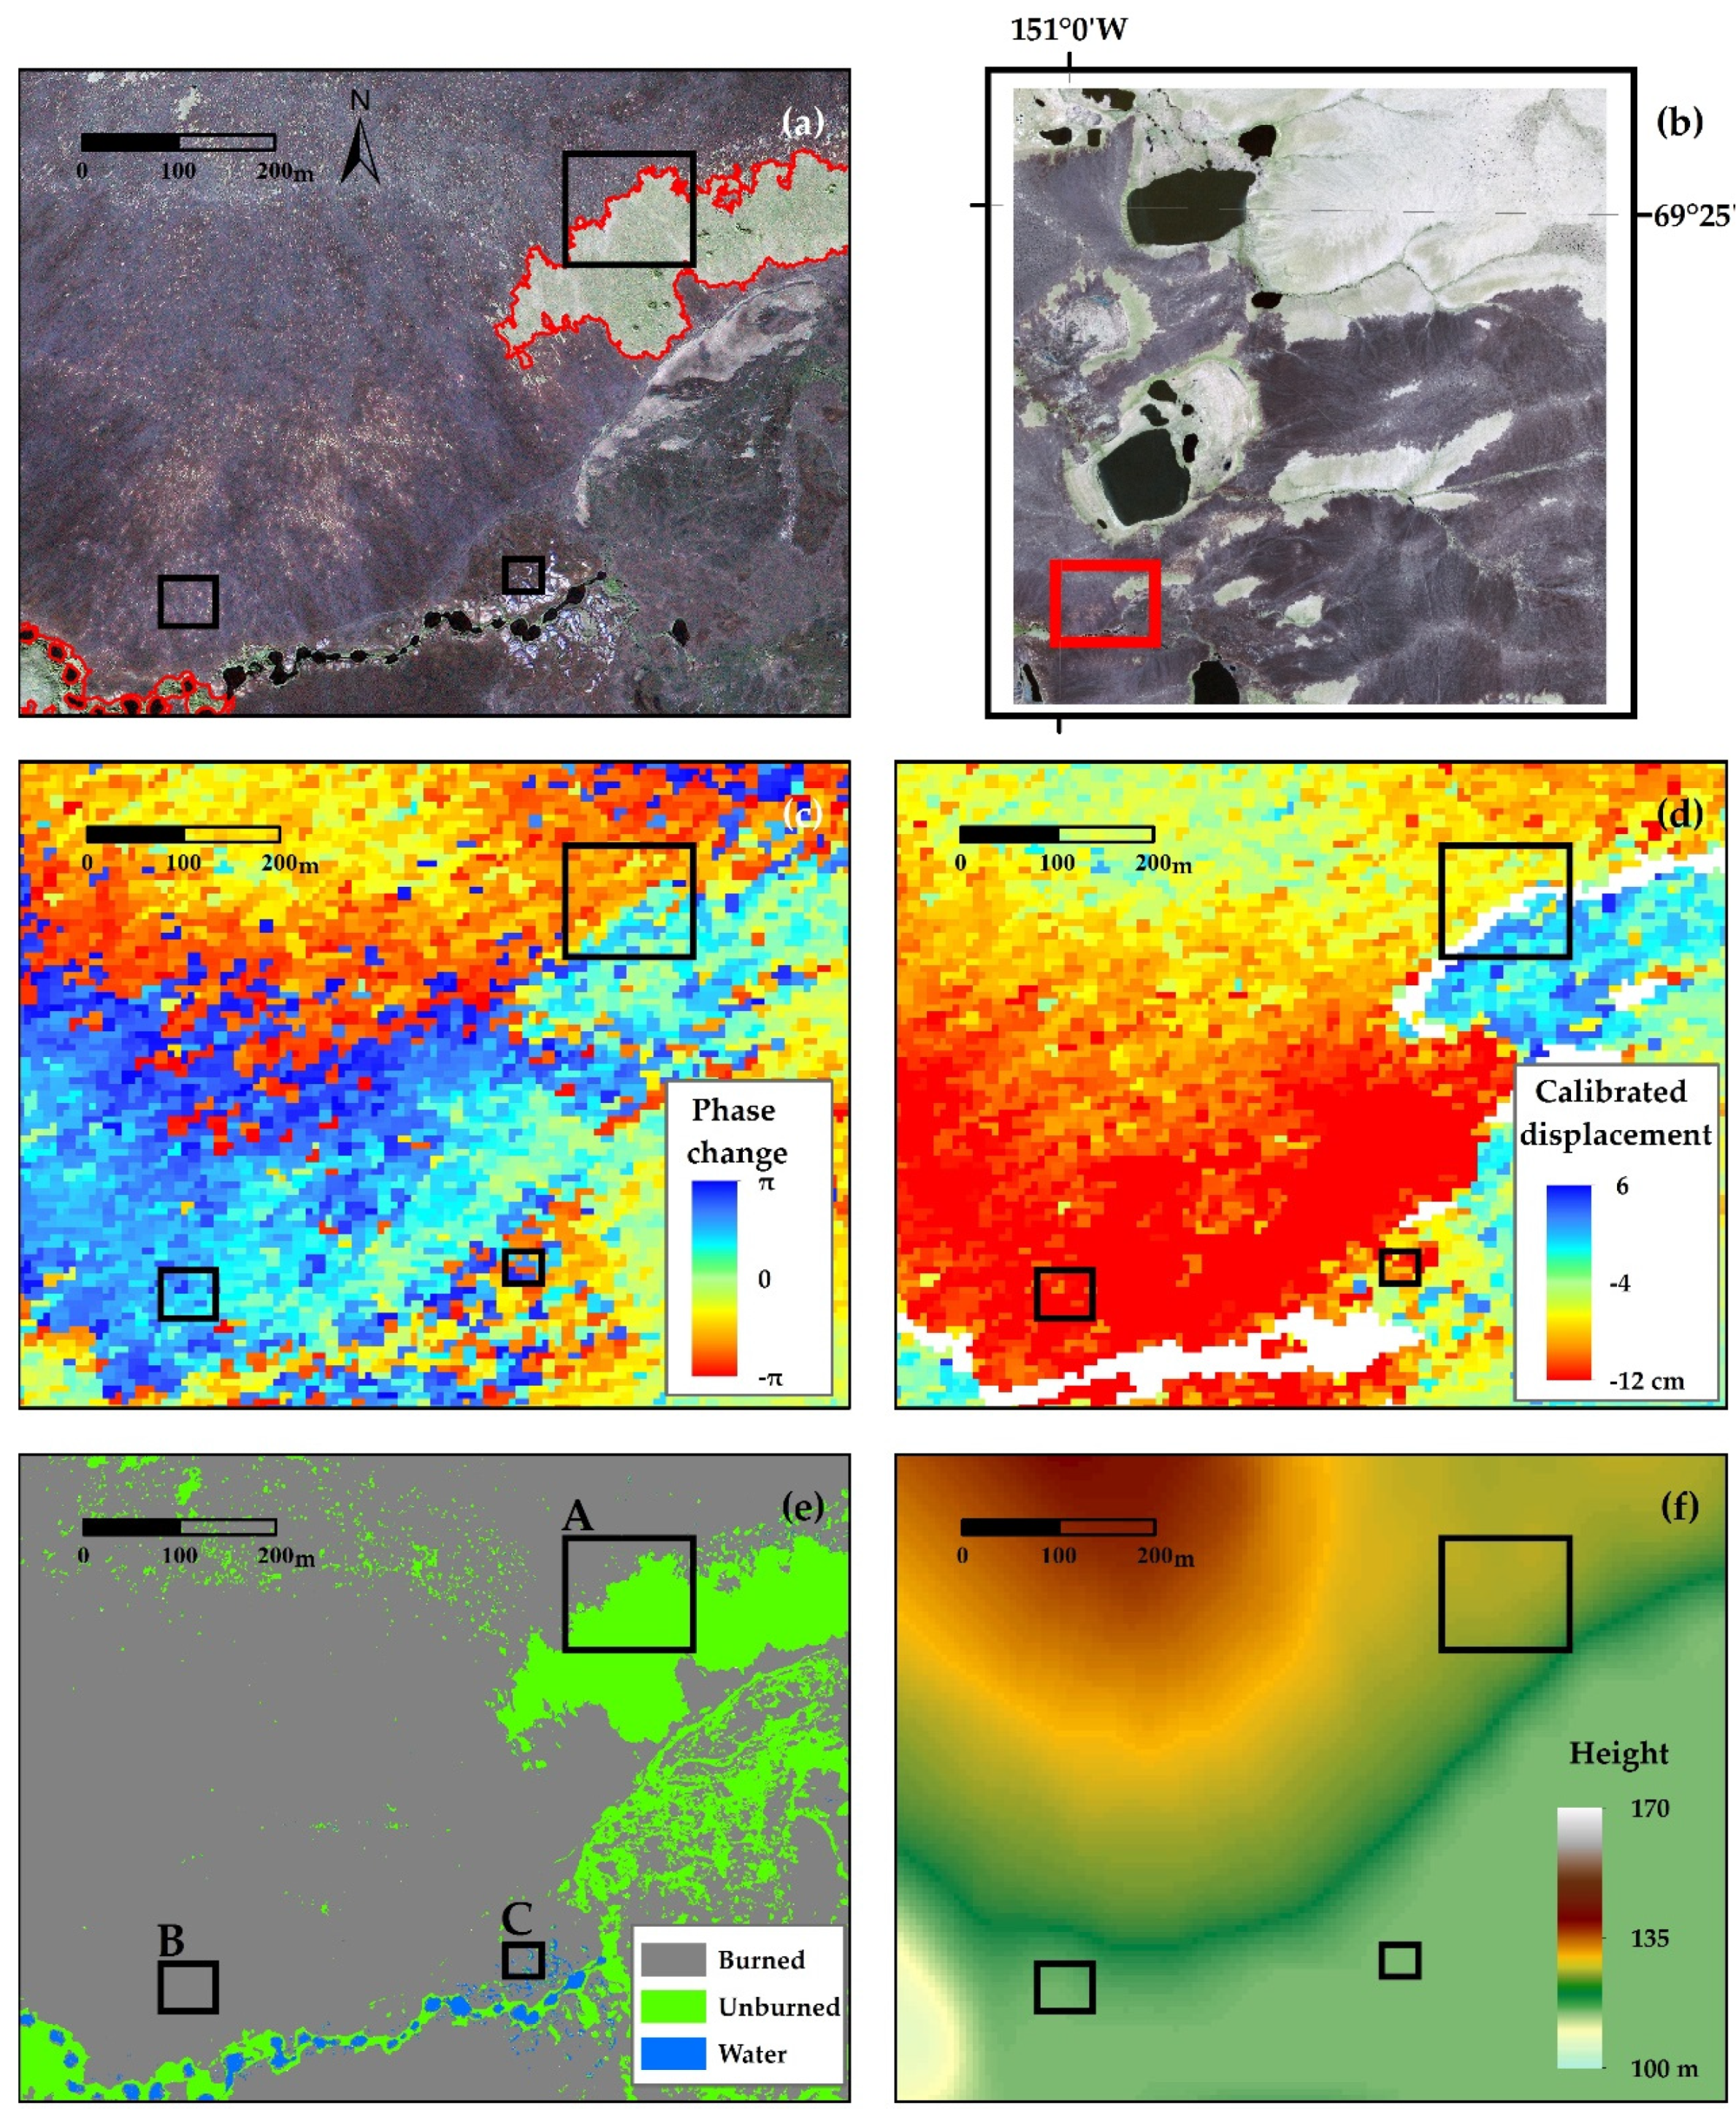
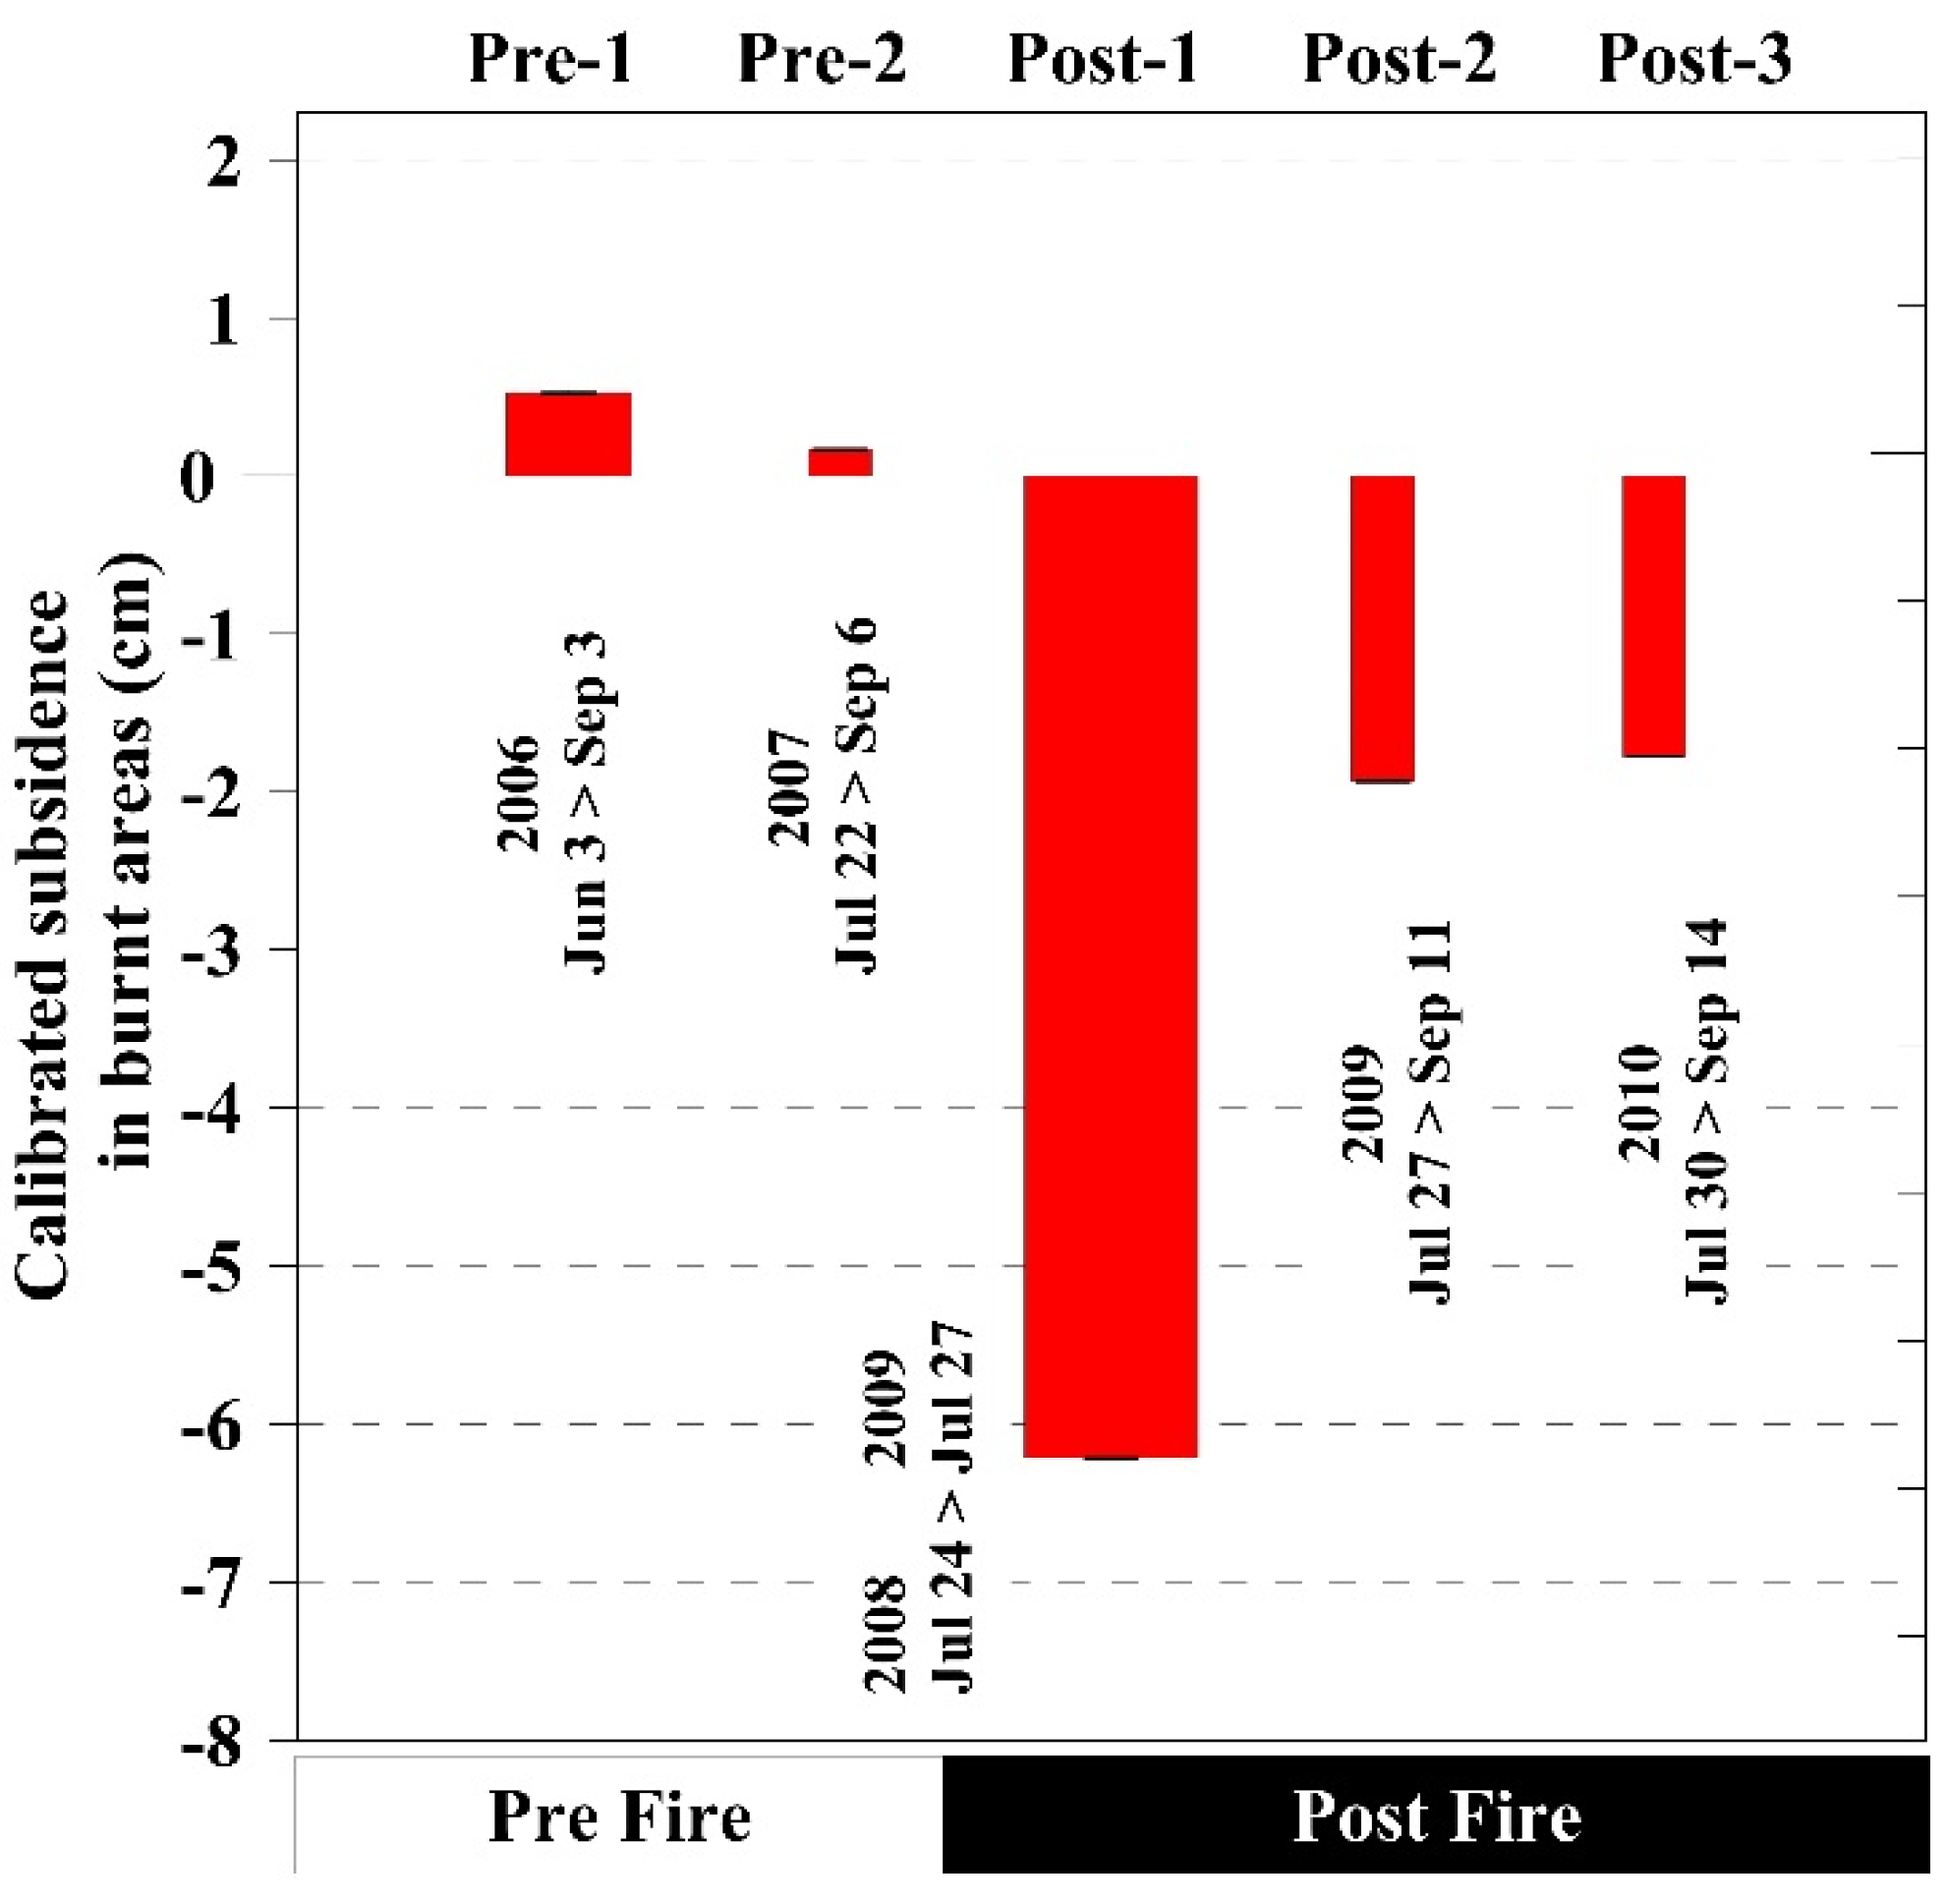
3.1. InSAR and GIS Analysis

Small and spatially uniform surface displacement patterns are observed in two InSAR pairs before the fire (Pre-1 and Pre-2 in Figure 3a,b, respectively), and the area of the future fire scar is not distinguishable from surrounding areas. On the other hand, the shape of the fire scar is clearly seen in other InSAR pairs (Figure 3c–e), with marked signals of surface displacement inside the fire scar. Large-scale ionospheric effects are prominent, especially for InSAR pairs Pre-2 and Post-3 (Figure 3b,e, respectively), but these effects were not strong enough to mask characteristics of spatial variation in InSAR signals within a smaller scale of the fire scar.
We found significant spatial variations in surface displacement captured down to the spatial resolution of an interferogram pixel (9.4 m), enabling us to distinguish burned and unburned patches at less than tens of meters scale. Figure 4 shows an example of surface conditions and interferometry analysis results for our target area, which is a subset of ARF, as shown in Figure 4b for the Post-1 time interval (24 July 2008–27 July 2009). In Figure 4d, strong signals of subsidence can be seen exclusively in the burned areas and spatial variation in the subsidence magnitude is displayed in detail within the burned areas. Interferogram phase values show discrete changes across the boundaries between burned and unburned areas, and fire boundaries often coincide with decorrelated areas, shown as white pixels in Figure 4d and Figure 5d (Water bodies were also decorrelated and appear as white pixels). Inside the burned areas, there are some gradual changes in phase values, especially on slopes, while there are relatively uniform phase values in unburned areas.
These characteristics of spatial variation in subsidence after the fire were observed repeatedly for the time intervals Post-2 and Post-3 as well, but with reduced magnitude of subsidence. Spatially-averaged, calibrated subsidence magnitudes for burned areas for studied time intervals were shown in Figure 8. Subsidence of −6.2, −1.9, and −1.8 cm for time intervals Post-1, Post-2, and Post-3, respectively, show significantly larger magnitudes than the values before the fire (0.5 and 0.2 cm for Pre-1 and Pre-2, respectively). Subsidence measured from the post-fire interferograms are all above the corresponding errors due to inaccurate DEM (Table 1). Further details on statistics for the subsidence for classified land units in the studied area are summarized in Table 2.
On the other hand, there were differences in calibrated subsidence values between unburned outside and inside (up to 1.6 cm) land units. These differences were larger for Pre-2 and Post-3 InSAR pairs (1.6 and 1.2 cm, respectively) compared to those for other pairs (0.2–0.9 cm). The Pre-2 and Post-3 InSAR pairs were clearly influenced by ionospheric effects, leading to systematic noise in the interferogram (Figure 3). In order to minimize ionospheric noise for our analysis, we chose unburned areas inside the ARF scar, geographically closer to burned areas.

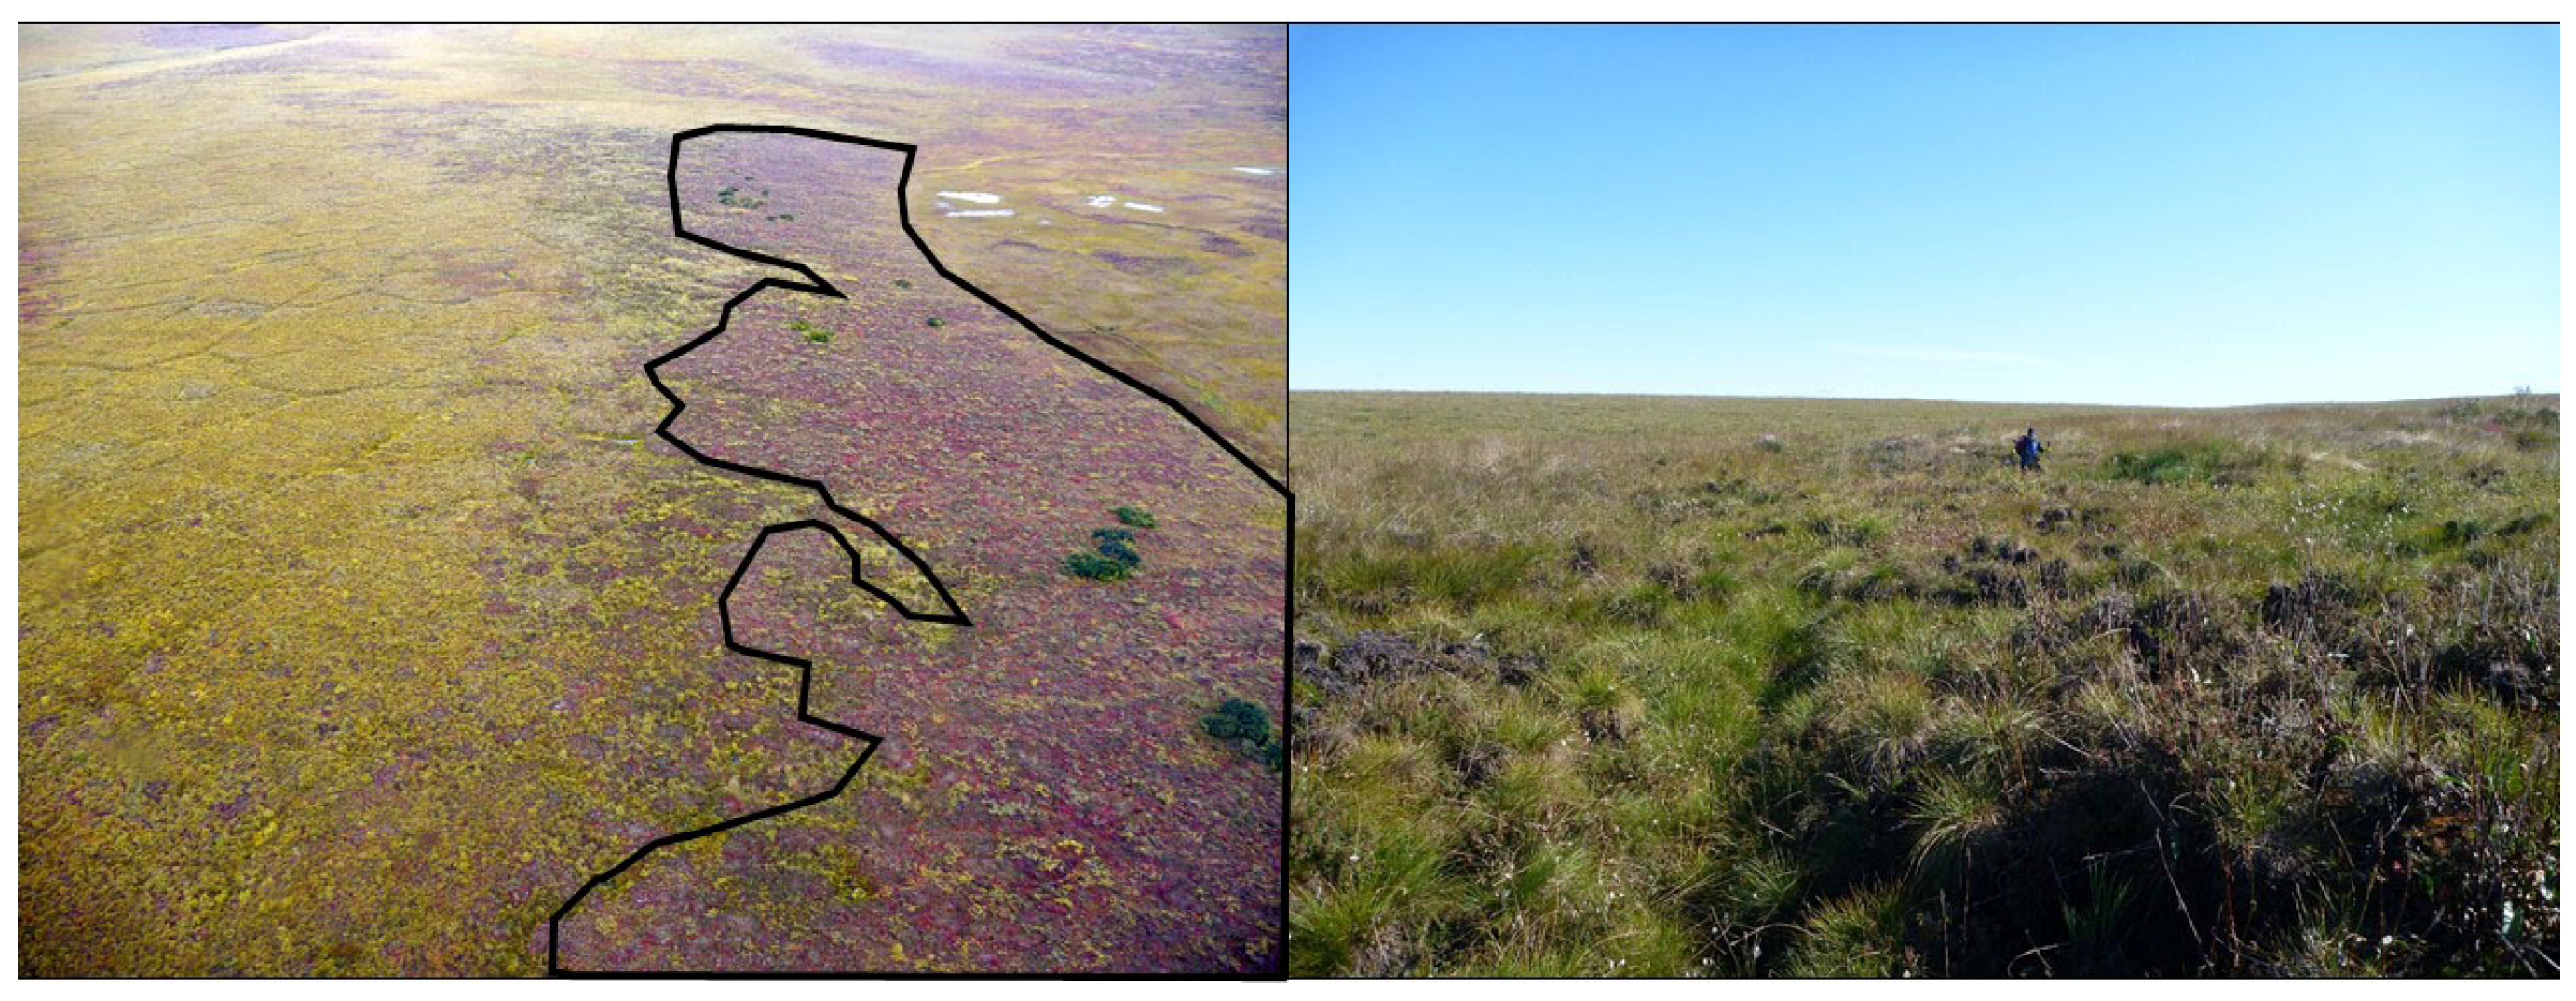
3.2. Thermokarst Evidence from Optical Imagery and Ground Truth Survey

From analysis of optical satellite images with sub-meter resolution, we found obvious development of polygonal networks after the fire, which is often found in areas of thermokarst (e.g., [28,29]). Although optical imagery cannot measure ground subsidence, it provides strong evidence of thermokarst development from changes in surface morphology. It is well known that ice wedges are three-dimensionally distributed underground in ice-rich permafrost regions (e.g., [30,31]). As spatial distribution of ground ice is not uniform, the surface experiencing thermokarst subsides differentially. The thermokarst process creates polygonal patterns in the surface with relatively lower elevation along network lines and higher within the polygons. We observed that the polygonal patterns emerged preferentially in burned areas, as shown in Figure 6a,c,e. While little change was observed within unburned patches, surface polygonal patterns became more pronounced or newly recognized after the fire in burned areas throughout the whole fire scar.
We also observed visible changes in surface conditions at our three ground survey plots. Visible changes were confirmed as ground subsidence due to permafrost degradation through field observations and differential GPS surveys (Figure 6). Smooth surfaces at the unburned patch of plot A (Figure 6b) were separated by a fire boundary line from the bumpy areas within the burned area with differential subsidence. The subsidence ratio was preliminarily estimated assuming original surface heights before the fire. Average subsidence was calculated to be 2.4, 2.0, and 10.2 cm/year from 2007 to 2013 for Plots A, B, and C, respectively. It must be noted that subsidence at Plot C had commenced before the fire in 2007, so the rate of 10.2 cm/year is overestimated to some extent. In addition, we confirmed the existence of ice wedges under some troughs in the burned area of plot A by boring into the permafrost.
The fire boundaries obtained by InSAR, recognized by sub-meter satellite optical sensors, and measured by in situ GPS survey agreed with one another. On the other hand, micro-reliefs created by thermokarst process after the fire were not obvious in the InSAR results. While actual thermokarst subsidence occurs heterogeneously—yet preferably along ice wedge lines—subsidence signals in InSAR results were smoothed out spatially. This is because of the difference in spatial resolutions between our InSAR (10 m) and ground truth (0.5 m). On the order of tens of meters spatial resolution, magnitudes in spatial average and overall locations of subsidence signals are in good accordance with our results from field measurements.

4. Discussion

4.1. Spatial Resolution and Variation of Captured Thermokarst Subsidence

Subsidence occurs preferentially along a network of ice wedges, establishing a connected trough. The obtained interferograms do not show sub-meter scale depressions along the trough, though they do show average overall subsidence. First-order estimation of subsidence within our ground truth plots ranged 12–61 cm (2–10 cm/year) during the six years after the fire (to late August of 2013). The total amount of subsidence observed in our interferograms (from 24 July 2008 to 14 September 2010) was 9.9 cm (3.3 cm/year). This subsidence rate for the first two-and-a-half years after the fire is comparable with the six-year average value for plots A and B (2.2 cm/year), though our InSAR observation was about 1.5 times higher for the first three thawing seasons after the fire. It is natural that rapid thermokarst for the first thawing season after fire stabilizes in following years, unless the disturbed surface has turned to water as thaw ponds or lakes, within which vegetation cannot recover. Induced subsidence gradually stabilized as surface vegetation recovered, acting as a modulator of surface energy exchange, which had been enhanced by the combustion of surface vegetation and organic mat. Regarding the following years after 2010, when ALOS observation was not obtained, Jones et al. [29] reported that LiDAR-derived subsidence between 2009 and 2014 was about 6 cm/year as a spatial average for burned Yedoma upland areas. They also reported that visual analysis of high-resolution satellite imagery indicated marked ice wedge degradation between 2011 and 2014, while there were subtle differences in image texture between 2008 and 2011.
Comparing the range of temporally averaged subsidence amounts (2–8 cm/year) due to permafrost thaw estimated by [18], our results showed a slightly lower subsidence rate (1–6 cm/year) for a post-fire three-year average, partly because our research area is a portion of the entire fire scar. On the other hand, it is unclear whether the subsidence measured by InSAR is reflected from spatial averages of surface subsidence (which is actually differential surface deformation in sub-pixel scale) or from the most active surface movements along the polygonal ice wedge troughs. The difference in surface height between trough bottoms and the central part of polygons was more than 50 cm. Having spatial resolution of 1 m, the LiDAR measurements of [29] also clearly showed much larger subsidence (up to 25 cm/year) along troughs of degrading ice wedge polygons than that in the central part of polygons. It will be a future challenge to understand how the combination of mixed subsidence around the centers of polygons at a slow rate and along the troughs at a rapid rate will be averaged in InSAR signals.
Most dynamic subsidence observed in the Post-1 interval was 6.2 cm on average and 95% of measured values ranging 0.9–11.5 cm. Our results demonstrated that if we choose appropriate interferogram pairs and carefully treat seasonal surface movement, conventional two-pass differential InSAR analysis is capable of detecting the spatial variation of subsidence at a tens of meters scale (Figure 4 and Figure 5), which clearly showed the difference between unburned stable areas and burned subsiding areas with various displacement rates. Although there was no observations of thaw slumps and active layer detachments in our study area, and we assumed only vertical displacement in our interpretation of observed InSAR results, it is likely that the larger subsidence rates on the steeper slopes were partly attributed to lateral displacement, about which we do not have evidence for discussion. Isotropic thaw subsidence, which is geographically uniform and is not apparent to observation at the surface [32], may also have influenced surface movement in our study areas, and further discussion about spatial variation in subsidence caused by fire should be focused on its geographical heterogeneity. This kind of InSAR application for permafrost regions with accurate field surveys has the potential to reveal how ice-rich permafrost terrains deform upon their degradation.
It is also worth noting that large subsidence was calculated for fragmented unburned areas (for example, −4.4 cm on average for Post-1), as they were small patches (most of them smaller than 1 m2) surrounded by burned surfaces in which thermokarst had been active (Table 2). This fact seems to show that thermokarst areas tend to propagate into adjacent areas by the lateral influence of thermal and/or hydrological regime shifts in the ground surface.

4.2. Effects of Surface Changes due to Wildfire on InSAR Signal

It is important to consider change in soil moisture in active layer and vegetation recovery, when thermokarst in a wildfire scar is studied. The InSAR pairs in this study only contain time intervals either pre- or post-fire, which did not cross the fire moment. This selection avoided the inclusion of decorrelated interferograms from significant surface roughness changes due to the loss of surface vegetation and organic layer, localized thermokarst, and change in hydrology. Despite the advantage of using L-band SAR, which penetrates surface vegetation, we observed total decorrelation in the fire scar in the interferograms with time intervals across the fire. Although the degree of influence from vegetation recovery after the fire is unknown, there was little change in vegetation during the time intervals for the selected interferograms, except for the Pre-1 pair that bridged an entire growing season.
Increase in surface soil moisture will cause an apparent phase shift in InSAR signal toward upheaval. For example, [33] estimated that an increase in surface soil moisture (5%–30%) could decrease penetration depth of SAR microwaves from 100 to 2 mm. In permafrost regions, surface disturbance induces a relative increase in soil moisture at disturbed sites, as loss of vegetation causes a predominant effect on the decrease in evapotranspiration at the surface. For example, relatively higher soil moisture in the active layer was observed at an early stage after clear-cutting of a larch forest stand in a continuous permafrost zone in Eastern Siberia [34], and at a burned area from tundra fire in a discontinuous permafrost zone on the Seward Peninsula of Alaska [35]. In the case of ARF, soil moisture increase within the fire scar was probable and a certain magnitude of subsidence signal could have been offset. The increase in soil moisture at the burned area, however, enhanced ice segregation in the active layer, resulting in greater frost heave.

4.3. Uncertainly in Our InSAR Subsidence Detection due to Active Layer Change

Although we have offset surface movement due to seasonal thaw settlement by subtracting interferometric phase changes for the reference unburned areas, spatial variation in the obtained subsidence contains errors associated with spatial variation in seasonal thaw settlement—caused by differences in soil moisture content, soil texture, and active layer thickness. Additionally, uncertainty remains regarding the increase in active layer thickness and frost heave due to increased soil moisture after fire.
Frost heaving occurs in frost-susceptible soil when the amount of soil moisture is sufficient for forming segregated ice lenses in the active layer (e.g., [36]). Ground heave occurs throughout the freezing period, whenever conditions for ice segregation are fulfilled. The degree of frost heave equals approximately the total thickness of segregated ice lenses in the active layer [37]. Thaw settlement, on the other hand, occurs along with the melting of ice lenses as the thaw front progresses, from the top down within the active layer. Assuming similar seasonal weather conditions, as well as negligible changes in the moisture condition and structure of soil particles, the ground surface will return to its initial elevation after one year. Ice lenses tend to form in the upper active layer and near the permafrost table in the case of two-directional freezing in permafrost regions (e.g., [38]), and we expect that total ice lens thickness is greater in the upper active layer because top-down freezing predominates freeze-up from the permafrost table. Therefore, the rate of thaw settlement is small in the later thawing seasons, as the progress rate of the thawing front is low in the late season. For instance, thaw front progress in Arctic tundra was dulled in early August, and then gradually reached maximum thaw depth in mid-September (e.g., [34,39]). Thaw settlement is therefore active in the early thawing season, as the thaw front rapidly progresses, and becomes significantly slower later in the season when there is only a small change in thaw depth.
In this study, interferograms were created using SAR images obtained only during thawing seasons. While Pre-1 nearly spanned an entire thawing season, Pre-2, Post-2, and Post-3 time intervals contain later portions of the thawing season. We can infer the extent of spatial variation in seasonal thaw settlement from Pre-1 and Pre-2. The difference in calibrated subsidence between burned and unburned areas inside of the future fire scar was within 0.7 cm (Table 2)—much smaller than the values of subsidence we observed in interferograms of post-fire periods. Additionally, Pre-2, Post-2, and Post-3 InSAR pairs covered only later thawing seasons (when thaw settlement is relatively inactive), while the time interval for Post-1 is the whole year (representing one total seasonal freeze-thaw cycle). Therefore, these interferograms showed small errors associated with spatial variation in seasonal thaw settlement.
Regarding the uncertainty that arises from increases in active layer thickness and frost heave due to increased soil moisture after fire, we concluded that this was insignificant for our conclusion as follows. We observed averaged thaw depths of 62 and 72 cm in the unburned and burned areas, respectively. Since these measurements were conducted at the end of August, they can also be treated as maximum thaw depth for 2013. Assuming a linear increase in active layer thickness in the burned area over the six years after the fire, the annual increase in the active layer was estimated as 1.7 cm/year. We also assumed progress of the thawing front during our InSAR observation, at the end of thawing, was about one fourth of the entire active layer for these years. For this increase in active layer thickness for burned areas, we can estimate an increase in thaw settlement by increasing the frost-heave strain (the ratio of total heave to active layer thickness minus the total heave), simulating the increase in soil moisture. Examples of frost-heave strain from field measurements are available in [40], in which values of frost-heave strain vary from 0.03 to 0.40, corresponding to 4 and 20 cm of maximum frost-heave for organic-rich tundra and highly frost-susceptible ground, respectively, while active layer thickness is 70 cm on the North Slope, Alaska. In our case, hypothetical increases in frost-heave strains from 0.03 to 0.06 (1.8–4.1 cm maximum frost heave) and from 0.3 to 0.4 (14.4–20.7 cm maximum frost heave) during these six years result in 0.1 and 0.3 cm seasonal thaw settlement on average, which may influence InSAR signals. As the soil in our targeted area consists mainly of peat, the error associated with active layer thickness and moisture should be close to 0.1 cm (or less, because the increase in frost-heave strain due to moisture increase in the active layer was also smaller if we consider only a single thawing season).

4.4. Limitations and Implications of this Study

From the above-mentioned considerations and calibration, we concluded that errors due to changes in active layer conditions and vegetation recovery were typically less than 0.1 cm, insufficient for masking thermokarst signals due to fire. However, in an extreme case, such that an increase in active layer thickness and moisture at burned areas occurs during a single thawing season, we note that the fraction of the error can be larger, especially for Post-2 and Post-3, with relatively small subsidence signals. On the other hand, the vertical displacement errors associated with the inaccurate DEM used in the InSAR analysis and caused by the height ambiguity (e.g., [41]) depend on the baseline lengths for interferogram pairs, shown in Table 1. Though errors ranged from 0.3 to 1.0 cm for individual pixel values of subsidence (depending on baseline lengths), as far as we consider average values in certain areas (including numerous pixels), errors in measured average subsidence values should be much smaller than those listed in Table 1. Considering every possible source of error affecting the subsidence signal, we can regard the overall uncertainty level for subsidence values reported in this study as less than the errors for individual interferograms, listed in Table 1.
InSAR capability for capturing spatial variation in thermokarst subsidence can be utilized for the quantification of permafrost degradation of large spatial extent, and will hereafter lead to a more accurate estimation of ground-ice loss upon permafrost thaw, in the past or near future. The quantitative assessment of permafrost degradation will provide fundamental information for estimating carbon release due to permafrost thaw, together with increasing knowledge about carbon contents in permafrost as greenhouse gases and organic matter. Archived ALOS-PALSAR data can be utilized to assess permafrost degradation in the past in wide permafrost regions, with the current ALOS2 mission expected to provide further information regarding the surface of changing permafrost with improved data quality.

5. Conclusions

The two-pass differential InSAR technique using ALOS-PALSAR (L-band microwave) has been shown capable of capturing thermokarst subsidence at a spatial resolution of tens of meters, with supporting evidence from field data and optical satellite images. Significantly large amounts of subsidence (up to 6.2 cm/year spatial average) were measured within burned areas relative to unburned nearby by three independent InSAR pairs after a tundra fire, while relatively small spatial variation (less than 0.5 cm in spatial average) was observed from two independent InSAR pairs during the pre-fire period. The obtained interferograms did not show sub-meter scale depressions along the troughs of the depression network developed by thermokarst, though they could distinguish small land areas with stable and subsiding land surface at smaller than tens of meters scale and could also display detailed spatial variation of thermokarst subsidence. Post-fire interferograms were decorrelated along fire boundaries, where rapid surface changes due to lateral erosion can be expected, and clearly separated subsiding burned areas from stable areas of intact environment. The mean rate of subsidence observed in our interferograms (from 24 July 2008 until 14 September 2010) was 3.3 cm/year, with this value comparable to the rate estimated from field surveys at two plots on average (2.2 cm/year) for the six years after the fire. We introduced a calibration procedure comparing burned and unburned areas for InSAR subsidence signals to remove the noise from seasonal surface movement. Changes in active layer thickness and soil moisture, and recovering vegetation after the fire were estimated as factors insignificant enough to not mask thermokarst signals due to the fire. InSAR’s capability of capturing detailed spatial variation in thermokarst subsidence can be utilized for further understanding of thermokarst processes and quantification of permafrost degradation at a large spatial extent, hereafter leading to more accurate estimation of ground ice loss upon permafrost thaw in the past or near future.

Acknowledgments

ALOS PALSAR data are copyrighted by the Japan Aerospace Exploration Agency (JAXA) and provided by Earth Observation Research Center (EORC), JAXA. This work was supported by the IARC-JAXA Information System (IJIS) with funding provided by JAXA under a grant to the International Arctic Research Center (IARC). Hinzman was supported by the Next Generation Ecosystem Experiment (NGEE-Arctic) project. NGEE-Arctic is supported by the Office of Biological and Environmental Research in the DOE Office of Science. Liu was supported by the Hong Kong Research Grant Council (grant CUHK14300815). We thank M. Koide, T. Nukui, and M. Hori of JAXA for overall assistance to our project. Technical support and constructive advice regarding analysis using satellite data were kindly provided by M. Watanabe and T. Tadono of JAXA. This study was also supported by the Environment Research and Technology Development Fund (A-1003, 2-1304) of the Ministry of the Environment, Japan (ERTDF). We thank M. Fukuda, S, Tsuyuzaki, M. Kondo and K. Kushida for supporting operation of the IJIS and ERTDF project.

Author Contributions

Go Iwahana conceived, designed, and conducted InSAR analysis. Go Iwahana and Masao Uchida designed the overall study, conducted fieldwork, and analyzed data. Lin Liu, Wenyu Gong, Franz Meyer, Richard Guritz, Tsutomu Yamanokuchi, and Larry Hinzman contributed to discussion and interpretation of the results.

Conflicts of Interest

The authors declare no conflict of interest.

Abbreviations

The following abbreviations are used in this manuscript:
ALOSAdvanced Land Observing Satellite
PALSARThe Phased Array type L-band Synthetic Aperture Radar
InSARInterferometric Synthetic Aperture Radar
ARFThe Anaktuvuk River Fire
DEMDigital Elevation Model
ALOS-PRISMThe Panchromatic Remote-sensing Instrument for Stereo Mapping on ALOS
NIRNear Infrared
DTMDigital Terrain Model
LiDARLaser Imaging Detection and Ranging

References

  1. Haeberli, W.; Burn, C.R. Natural Hazards in Forests: Glacier and Permafrost Effects as Related to Climate Change; CABI Publishing: Wallingford, UK; New York, NY, USA, 2002. [Google Scholar]
  2. Czudek, T.; Demek, J. Thermokarst in Siberia and its influence on the development of lowland relief. Quat. Res. 1970, 1, 103–120. [Google Scholar] [CrossRef]
  3. Kanevskiy, M.; Shur, Y.; Fortier, D.; Jorgenson, M.T.; Stephani, E. Cryostratigraphy of late Pleistocene syngenetic permafrost (yedoma) in northern Alaska, Itkillik River exposure. Quat. Res. 2011, 75, 584–596. [Google Scholar] [CrossRef]
  4. Schuur, E.A.G.; Bockheim, J.; Canadell, J.G.; Euskirchen, E.; Field, C.B.; Goryachkin, S.V.; Hagemann, S.; Kuhry, P.; Lafleur, P.M.; Lee, H.; et al. Vulnerability of permafrost carbon to climate change: Implications for the global carbon cycle. Bioscience 2008, 58, 701–714. [Google Scholar]
  5. Francis, J.A.; White, D.M.; Cassano, J.J.; Gutowski, W.J., Jr.; Hinzman, L.D.; Holland, M.M.; Steele, M.A.; Voeroesmarty, C.J. An Arctic hydrologic system in transition: Feedbacks and impacts on terrestrial, marine, and human life. J. Geophys. Res. Biogeosci. 2009, 114. [Google Scholar] [CrossRef]
  6. Jorgenson, M.T.; Romanovsky, V.; Harden, J.; Shur, Y.; O’Donnell, J.; Schuur, E.A.G.; Kanevskiy, M.; Marchenko, S. Resilience and vulnerability of permafrost to climate change. Can. J. For. Res. 2010, 40, 1219–1236. [Google Scholar] [CrossRef]
  7. Rowland, J.C.; Jones, C.E.; Altmann, G.; Bryan, R.; Crosby, B.T.; Hinzman, L.D.; Kane, D.L.; Lawrence, D.M.; Mancino, A.; Marsh, P.; et al. Arctic landscapes in transition: Responses to thawing permafrost. Eos Trans. AGU 2010, 91, 229–230. [Google Scholar]
  8. Grosse, G.; Romanovsky, V.; Jorgenson, T.; Anthony, K.W.; Brown, J.; Overduin, P.P. Vulnerability and feedbacks of permafrost to climate change. Eos Trans. AGU 2011, 92, 73–74. [Google Scholar] [CrossRef]
  9. Strauss, J.; Schirrmeister, L.; Wetterich, S.; Borchers, A.; Davydov, S.P. Grain-size properties and organic-carbon stock of yedoma ice complex permafrost from the Kolyma lowland, northeastern Siberia. Glob. Biogeochem. Cycles 2012, 26, GB004104. [Google Scholar] [CrossRef]
  10. Zimov, S.A.; Voropaev, Y.V.; Semiletov, I.P.; Davidov, S.P.; Prosiannikov, S.F.; Chapin, F.S., III; Chapin, M.C.; Trumbore, S.; Tyler, S. North siberian lakes: A methane source fueled by Pleistocene. Science 1997, 277, 800–802. [Google Scholar]
  11. Walter, K.M.; Zimov, S.A.; Chanton, J.P.; Verbyla, D.; Chapin, F.S., III. Methane bubbling from Siberian thaw lakes as a positive feedback to climate warming. Nature 2006, 443, 71–75. [Google Scholar] [CrossRef] [PubMed]
  12. Schuur, E.A.G.; McGuire, A.D.; Schadel, C.; Grosse, G.; Harden, J.W.; Hayes, D.J.; Hugelius, G.; Koven, C.D.; Kuhry, P.; Lawrence, D.M.; et al. Climate change and the permafrost carbon feedback. Nature 2015, 520, 171–179. [Google Scholar] [PubMed]
  13. Massonnet, D.; Rossi, M.; Carmona, C.; Adragna, F.; Peltzer, G.; Feigl, K.; Rabaute, T. The displacement field of the landers earthquake mapped by radar interferometry. Nature 1993, 364, 138–142. [Google Scholar] [CrossRef]
  14. Massonnet, D.; Feigl, K.; Rossi, M.; Adragna, F. Radar interferometric mapping of deformation in the year after the landers earthquake. Nature 1994, 369, 227–230. [Google Scholar] [CrossRef]
  15. Liu, L.; Zhang, T.; Wahr, J. InSAR measurements of surface deformation over permafrost on the North Slope of Alaska. J. Geophys. Res. Earth Surf. 2010, 115. [Google Scholar] [CrossRef]
  16. Short, N.; Brisco, B.; Couture, N.; Pollard, W.; Murnaghan, K.; Budkewitsch, P. A comparison of TerraSAR-X, RADARSAT-2 and ALOS-PALSAR interferometry for monitoring permafrost environments, case study from Herschel Island, Canada. Remote Sens. Environ. 2011, 115, 3491–3506. [Google Scholar] [CrossRef]
  17. Liu, L.; Schaefer, K.; Gusmeroli, A.; Grosse, G.; Jones, B.M.; Zhang, T.; Parsekian, A.D.; Zebker, H.A. Seasonal thaw settlement at drained thermokarst lake basins, Arctic Alaska. Cryosphere 2014, 8, 815–826. [Google Scholar] [CrossRef] [Green Version]
  18. Liu, L.; Jafarov, E.E.; Schaefer, K.M.; Jones, B.M.; Zebker, H.A.; Williams, C.A.; Rogan, J.; Zhang, T. InSAR detects increase in surface subsidence caused by an arctic tundra fire. Geophys. Res. Lett. 2014, 41, 3906–3913. [Google Scholar] [CrossRef]
  19. Heginbottom, J.A.; Brown, J.; Melnikov, E.S.; Ferrians, O.J., Jr. Circumarctic map of permafrost and ground ice conditions. In Proceedings of the Sixth International Conference on Permafrost, Beijing, China, 5–9 July 1993; pp. 1132–1136.
  20. Mack, M.C.; Bret-Harte, M.S.; Hollingsworth, T.N.; Jandt, R.R.; Schuur, E.A.G.; Shaver, G.R.; Verbyla, D.L. Carbon loss from an unprecedented Arctic tundra wildfire. Nature 2011, 475, 489–492. [Google Scholar] [CrossRef] [PubMed]
  21. Jones, B.M.; Grosse, G.; Arp, C.D.; Jones, M.C.; Anthony, K.M.W.; Romanovsky, V.E. Modern thermokarst lake dynamics in the continuous permafrost zone, northern Seward Peninsula, Alaska. J. Geophys. Res. Biogeosci. 2011, 116. [Google Scholar] [CrossRef]
  22. Rocha, A.V.; Shaver, G.R. Burn severity influences postfire CO2 exchange in Arctic tundra. Ecol. Appl. 2011, 21, 477–489. [Google Scholar] [CrossRef] [PubMed]
  23. Rocha, A.V.; Shaver, G.R. Postfire energy exchange in Arctic tundra: The importance and climatic implications of burn severity. Glob. Chang. Biol. 2011, 17, 2831–2841. [Google Scholar] [CrossRef]
  24. Bret-Harte, M.S.; Mack, M.C.; Shaver, G.R.; Huebner, D.C.; Johnston, M.; Mojica, C.A.; Pizano, C.; Reiskind, J.A. The response of arctic vegetation and soils following an unusually severe tundra fire. Philos. Trans. R. Soc. B Biol. Sci. 2013, 368. [Google Scholar] [CrossRef] [PubMed]
  25. Hooper, A.; Bekaert, D.; Spaans, K.; Arıkan, M. Recent advances in SAR interferometry time series analysis for measuring crustal deformation. Tectonophysics 2012, 514–517, 1–13. [Google Scholar] [CrossRef]
  26. Meyer, F.J.; Nicoll, J.B. Prediction, detection, and correction of Faraday rotation in full-polarimetric L-band SAR data. IEEE Trans. Geosci. Remote Sens. 2008, 46, 3076–3086. [Google Scholar] [CrossRef]
  27. Liu, L.; Schaefer, K.M.; Chen, A.C.; Gusmeroli, A.; Zebker, H.A.; Zhang, T. Remote sensing measurements of thermokarst subsidence using InSAR. J. Geophys. Res. Earth Surf. 2015, 120, 1935–1948. [Google Scholar] [CrossRef]
  28. Jones, B.M.; Breen, A.L.; Gaglioti, B.V.; Mann, D.H.; Rocha, A.V.; Grosse, G.; Arp, C.D.; Kunz, M.L.; Walker, D.A. Identification of unrecognized tundra fire events on the North Slope of Alaska. J. Geophys. Res. Biogeosci. 2013, 118, 1334–1344. [Google Scholar] [CrossRef]
  29. Jones, B.M.; Grosse, G.; Arp, C.D.; Miller, E.; Liu, L.; Hayes, D.J.; Larsen, C.F. Recent arctic tundra fire initiates widespread thermokarst development. Sci. Rep. 2015, 5. [Google Scholar] [CrossRef] [PubMed] [Green Version]
  30. French, H.M. The Periglacial Environment, 3rd ed.; Longman: Singapore, 2007. [Google Scholar]
  31. Dostovalov, B.N.; Popov, A.I. Polygonal systems of ice-wedge and conditions of their development. In Proceedings of the First International Conference on Permafrost, Lafayette, IN, USA; 1963; pp. 102–105. [Google Scholar]
  32. Shiklomanov, N.I.; Streletskiy, D.A.; Little, J.D.; Nelson, F.E. Isotropic thaw subsidence in undisturbed permafrost landscapes. Geophys. Res. Lett. 2013, 40, 6356–6361. [Google Scholar] [CrossRef]
  33. Nolan, M.; Fatland, D.R. Penetration depth as a DInSAR observable and proxy for soil moisture. IEEE Trans. Geosci. Remote Sens. 2003, 41, 532–537. [Google Scholar] [CrossRef]
  34. Iwahana, G.; Takano, S.; Petrov, R.E.; Tei, S.; Shingubara, R.; Maximov, T.C.; Fedorov, A.N.; Desyatkin, A.R.; Nikolaev, A.N.; Desyatkin, R.V.; et al. Geocryological characteristics of the upper permafrost in a tundra-forest transition of the Indigirka River Valley, Russia. Polar Sci. 2014, 8, 96–113. [Google Scholar]
  35. Liljedahl, A.; Hinzman, L.; Busey, R.; Yoshikawa, K. Physical short-term changes after a tussock tundra fire, Seward Peninsula, Alaska. J. Geophys. Res. Earth Surf. 2007, 112. [Google Scholar] [CrossRef]
  36. Dash, J.G.; Rempel, A.W.; Wettlaufer, J.S. The physics of premelted ice and its geophysical consequences. Rev. Mod. Phys. 2006, 78, 695–741. [Google Scholar] [CrossRef]
  37. Taber, S. The mechanics of frost heaving. J. Geol. 1930, 38, 303–317. [Google Scholar] [CrossRef]
  38. Cheng, G. The mechanism of repeated-segregation for the formation of thick layered ground ice. Cold Reg. Sci. Technol. 1983, 8, 57–66. [Google Scholar]
  39. Osterkamp, T.E.; Romanovsky, V.E. Freezing of the active layer on the coastal plain of the Alaskan Arctic. Permafr. Periglac. Process. 1997, 8, 23–44. [Google Scholar] [CrossRef]
  40. Walker, D.A.; Epstein, H.E.; Romanovsky, V.E.; Ping, C.L.; Michaelson, G.J.; Daanen, R.P.; Shur, Y.; Peterson, R.A.; Krantz, W.B.; Raynolds, M.K.; et al. Arctic patterned-ground ecosystems: A synthesis of field studies and models along a North American Arctic transect. J. Geophys. Res. Biogeosci. 2008, 113. [Google Scholar] [CrossRef]
  41. Hanssen, R.F. Radar Interferometry; Kluwer Academic Publishers: Dordrecht, The Netherlands, 2001; Volume 2. [Google Scholar]
Figure 1. Location map of the Anaktuvuk River Fire (ARF) scar. The area delineated by white lines burned from July until September 2007.
Remotesensing 08 00218 g001
Figure 2. Workflow for InSAR processing and interferograms analysis processes in our study.
Remotesensing 08 00218 g002
Figure 3. Vertical surface displacement calculated (after the deramp of large-scale phase changes) from unwrapped interferograms of time intervals (a) 3 September 2006–2 June 2006; (b) 6 September 2007–22 July 2007; (c) 27 July 2009–24 July 2008; (d) 11 September 2009–27 July 2009; (e) 14 September 2010–30 July 2010. Displacement is shown by color change cycle from a reference point (cross mark). One color cycle represents about 18 cm of vertical movement relative to the reference point.
Remotesensing 08 00218 g003
Figure 4. Surface conditions and interferometry analysis for the time interval 27 July 2009–24 July 2008. (a) True color image by high-resolution optical sensor (QuickBird) on 3 July 2008; (b) Overview of the area of interest in this study; (c) Interferogram for the Post-1 InSAR pair; (d) Spatial distribution of vertical surface movements calculated from unwrapped phases; (e) Land cover classification; and (f) Digital elevation model for the study area. For (c,d), negative change indicates ground subsidence.
Remotesensing 08 00218 g004
Figure 5. Close-up of the area of ground truth survey in Figure 3 (Surface conditions and interferometry analysis for the time interval 27 July 2009–24 July 2008). (a) True color image by high-resolution optical sensor (QuickBird) on 3 July 2008; (b) Overview of the area of survey grids in the area of interest in Figure 3. Location of the area of (a,cf) is indicated as a red rectangle; (c) Interferogram for the Post-1 InSAR pair; (d) Spatial distribution of vertical surface movements calculated from unwrapped phases; (e) Land cover classification; and (f) Digital elevation model for the study area. For (c,d), negative change indicates ground subsidence. Locations of survey grids in Figure 6 are shown as black rectangles.
Remotesensing 08 00218 g005
Figure 6. An example of ground surface changes before and after fire (af). (a,c,e) show pan-sharpened optical images taken on 27 June 2006 (QuickBird), 3 July 2008 (QuickBird), and 4 July 2013 (Pleiades), representing pre-fire, post-fire, and six years after fire, respectively. Red line indicates a boundary of burned and unburned areas. Digital terrain models created using heights measured by differential GPS for ground truth plots A–C are shown as (b,d,f) on the right. The locations of each plot are indicated in (a,c,e). Note that entire areas of B and C were burned.
Remotesensing 08 00218 g006
Figure 7. (Left) Aerial photography over plot A. The delineated area on the right side of the photo is unburned area. Diameters of tree patches in the unburned area are about 3 m; (Right) Landscape at plot B. Note the man (1.8 m tall) standing in a depressed trough showing 2/3 of this entire body in the middle of the photo.
Remotesensing 08 00218 g007
Figure 8. Change in calibrated subsidence amounts for analyzed time intervals of InSAR. Negative values indicate subsidence relative to the mean height of unburned areas. Relative widths of bars correspond to duration of time intervals in thawing season for each InSAR analysis. Error bars indicate two standard errors.
Remotesensing 08 00218 g008
Table 1. Configuration of InSAR pairs used in this study. Perpendicular baseline (Bperp), time interval between pair acquisitions (Time lag), subsidence error due to inaccurate DEM, and remarks on ionospheric effects of InSAR pairs.
Pair IDMaster DateSlave DateBperp (m)Time Lag (days)Subsidence Error Due to Inaccurate DEM (cm)Ionospheric Effects
Pre-12006/09/032006/06/03−1350921.0Not significant
Pre-22007/09/062007/07/22−498460.4Obvious trend in NE-SW direction
Post-12009/07/272008/07/24922368 (125*)0.7Not significant
Post-22009/09/112009/07/27−626460.5Not significant
Post-32010/09/142010/07/30−398460.3Obvious trend in N-S direction
* days in thawing season
Table 2. Statistics for subsidence in the studied area for classified land units of each InSAR pair. The analyzed area was classified into unburned areas outside (Unburned outside) and inside (Unburned inside) of the ARF scar perimeter shown in Figure 1, smaller fragmented unburned areas (Unburned fragmented), and burned areas. The subsidence values were calculated assuming all line-of-sight phase changes are attributed to vertical movement of the ground surface and subtracted by the value at unburned inside area for each InSAR pair (Note that all values for unburned inside are zero). Std and 2Ste indicate standard deviations and two standard errors, respectively.
Pair ID (Master_Slave)Land Cover UnitArea (ha)Subsidence Relative to Unburned Inside (cm)
MeanStd2Ste
Pre-1 (060903_060603)Unburned outside6.90.92.90.01
Unburned inside1.60.02.60.02
Unburned fragmented1.5−0.23.00.02
Burned13.60.52.60.01
Pre-2 (070906_070722)Unburned outside7.3−1.60.70.00
Unburned inside1.60.01.20.01
Unburned fragmented1.6−0.21.40.01
Burned13.80.21.40.00
Post-1 (090727_080724)Unburned outside6.80.72.80.01
Unburned inside1.50.03.10.02
Unburned fragmented1.6−4.42.70.02
Burned13.6−6.22.70.01
Post-2 (090911_090727)Unburned outside7.20.22.30.01
Unburned inside1.60.02.30.02
Unburned fragmented1.6−1.22.50.02
Burned13.8−1.92.10.01
Post-3 (100914_100730)Unburned outside6.3−1.23.00.01
Unburned inside1.30.03.50.02
Unburned fragmented1.5−1.63.20.02
Burned13.2−1.82.90.01

