Article

Comparison of Canopy Volume Measurements of Scattered Eucalypt Farm Trees Derived from High Spatial Resolution Imagery and LiDAR

1
Cooperative Research Centre for Spatial Information (CRCSI), University of New England, Armidale, NSW 2351, Australia
2
Precision Agriculture Research Group and School of Science and Technology, University of New England, Armidale, NSW 2351, Australia
3
Ecosystem Management, School of Environmental and Rural Science, University of New England, Armidale, NSW 2351, Australia
*
Author to whom correspondence should be addressed.
Submission received: 16 November 2015 / Revised: 21 April 2016 / Accepted: 25 April 2016 / Published: 5 May 2016
(This article belongs to the Special Issue Remote Sensing of Forest Health)

Abstract

:
Studies estimating canopy volume are mostly based on laborious and time-consuming field measurements; hence, there is a need for easier and convenient means of estimation. Accordingly, this study investigated the use of remotely sensed data (WorldView-2 and LiDAR) for estimating tree height, canopy height and crown diameter, which were then used to infer the canopy volume of remnant eucalypt trees at the Newholme/Kirby ‘SMART’ farm in north-east New South Wales. A regression model was developed with field measurements, which was then applied to remote-sensing-based measurements. LiDAR estimates of tree dimensions were generally lower than the field measurements (e.g., 6.5% for tree height) although some of the parameters (such as tree height) may also be overestimated by the clinometer/rangefinder protocols used. The WorldView-2 results showed both crown projected area and crown diameter to be strongly correlated to canopy volume, and that crown diameter yielded better results (Root Mean Square Error RMSE 31%) than crown projected area (RMSE 42%). Although the better performance of LiDAR in the vertical dimension cannot be dismissed, as suggested by results obtained from this study and also similar studies conducted with LiDAR data for tree parameter measurements, the high price and complexity associated with the acquisition and processing of LiDAR datasets mean that the technology is beyond the reach of many applications. Therefore, given the need for easier and convenient means of tree parameters estimation, this study filled a gap and successfully used 2D multispectral WorldView-2 data for 3D canopy volume estimation with satisfactory results compared to LiDAR-based estimation. The result obtained from this study highlights the usefulness of high resolution data for canopy volume estimations at different locations as a possible alternative to existing methods.

Graphical Abstract

1. Introduction

The measurement of volume is important in assessing the economic value of a tree [1]. Tree volume measurements may include stem volume (volume of trunk from ground to tip), canopy volume or total tree volume (the sum of the volume of the trunk and canopy). Canopy volume includes the entire live canopy of a tree from the base of the crown to the highest point and from the centre of the crown out to the furthest tips, but does not include dead branches. Canopy volume is an important parameter in the study of yield estimates in horticulture [2]. Tree canopy geometric characteristics are directly related to tree growth and productivity, and hence can be used to estimate tree biomass and growth, yield and water consumption, as well as assessing tree health and long-term productivity. Measurements of canopy volume are important for managing trees intermixed with crops or pastures in a farmscape. Canopy volume can be measured manually, but measuring canopy size can be a challenging and time consuming task due to the sometimes complicated growth structures and irregular shapes of trees.
The conventional estimation of canopy volume by manual measurement of crown diameter and canopy height assumes an appropriate 3D crown shape. Because of varying crown shape, and extent and positioning of branches, it is difficult to calculate the actual volume of a specific canopy outline [3], so most published models assume that the canopy is a solid geometric object [3,4,5]. Canopy volume is generally calculated using the following predefined volume formula [4].
Canopy Volume = Canopy Height × (Crown Diameter)2 × Multiplier
The choice of multiplier varies with crown shape which is typically approximated as a spheroid, ellipsoid, right circular cone or right circular cylinder [4,5]. The numerical value of the multiplier is the fractional volume (e.g., to 4 significant figures [4]) of the shape relative to that of a right cylinder of the same diameter and height. Hence crown shape is an important parameter to be assessed in canopy volume estimations. Troxel et al. [5] examined interactions between age (years from transplanting), bole size (diameter) and crown dimensions (tree height, crown diameter, crown volume) in young urban trees in New Haven, Connecticut, to identify allometric relationships, and to compare growth rates of the 10 most commonly planted species. In their study they estimated canopy volume using the above mentioned volume formula. Rautiainen et al. [6] addressed the importance of crown shape in understanding various stand features including crown shape and crown volume and modelled crown shape from remote sensing data in Finland. Results indicated that the basic dimensions of tree crowns were better predicted for pines. Tumbo et al. [7] investigated methods for rapid mapping of canopy volumes in citrus groves and correlated canopy volume measurements using manual methods, laser, and ultrasonic sensors. They concluded laser and ultrasonic systems to be valuable tools for automatic mapping of canopy volumes in citrus groves. Nelson [8] characterized the effects of the canopy shape assumption on laser measurements such as average canopy height and height variability, and on basal area, volume, and biomass estimates. The results for Costa Rican tropical forests indicated simulated laser measurements of average height, canopy profile area, and canopy volume increased 8%–10% when a parabolic rather than a conic shape was assumed. An elliptic canopy was 16%–18% taller, on average, than a conic canopy, and a spheric canopy was 23%–25% taller. However, the degree to which these estimates were affected was found to be dependent on study area.
The relationships between canopy volume and several tree dimensions such as diameter at breast height, tree height, and crown shape are often used for estimating canopy volume. Allometric equations are commonly developed that predict tree and canopy volume as well as the biomass of several tree components from either diameter at breast height (DBH), tree height or both [9,10]. Figure 1 represents the work flow for the calculation of canopy volume based on manual measurements of several tree dimensions (Figure 2) in the field.
As on-ground field measurements can be time-consuming and costly, numerous remote sensing techniques have been examined for estimating canopy volume. Like on-ground measurements, these methods are indirect and involve the remote measurement of various tree dimensions from which canopy volume may be inferred through predictive modelling (Figure 1, Equation (1)).
LiDAR (light detection and ranging) is an example of distance (ranging) measuring technology, which relies on the principle of ‘time of flight’. Laser pulses are directed from a source (e.g., mounted on an aircraft) and on striking the target, a portion of the incident beam is scattered back towards the source. High-speed detectors and electronics calculate the time of flight between the emission of the pulse and the return of the back-scattered component, from which the distance (range) between source and target is calculated. LiDAR captures elevation information from a forest canopy as well as the ground beneath and can be used to assess complex 3D patterns of canopy and forest stand structure (e.g., [11,12,13]). LiDAR-derived measurements such as tree height, trunk height (perpendicular distance between ground level and the lowest point of the canopy) and crown diameter can then be used to estimate canopy volume using formulae based on Equation (1). In addition to estimating individual tree canopy volume and biomass, LiDAR can be used to measure other forest structural characteristics such as crown diameter [14,15], percent canopy cover [12,16,17], stand volume [18].
Many studies have yielded promising results with LiDAR to assess single tree heights [19,20,21,22,23,24,25] and forest plot or stand height and have achieved good agreement between LiDAR derived parameters and a variety of height measures [13,26,27]. However, studies by Rönnholm et al. [28] and Huang et al. [29] have underestimated tree height using systems with a small footprint, due to differences in the density and coverage of laser pulses, the canopy height model, bare-ground elevation-extraction algorithms and the shape and species of trees. Hunter et al. [30] also showed that ground based measurements of height exceeded LiDAR measurements of height by an average of 1.4 m. However they concluded that it was unclear whether this was due to overestimation of field height or underestimation by LiDAR, or a combination of the two. The other tree attribute that can be directly measured with LiDAR is crown diameter. Popescu et al. [14] estimated tree crown diameter to estimate forest biomass and stand volume using multiple return, small-footprint LiDAR data. The study demonstrated that airborne laser provides the tool to reliably measure not only tree height but also crown dimensions, thus improving estimates of forest volume and biomass. Hyyppä et al. [31] estimated stem diameters using a correlation with crown diameters. Persson et al. [32] estimated tree height and crown diameter of detected trees with a RMSE of 0.63 m and 0.61 m, respectively. Lefsky et al. [33] measured the canopy structure of closed- Douglas-fir/western hemlock forests using SLICER surface LiDAR system and developed a novel technique to characterize the three-dimensional aspects of canopy structure. In Australia, numerous studies have examined LiDAR applications in plantations, riparian zones, open woodlands and tall eucalypt forests [34,35,36,37,38,39], mostly measuring tree characteristics (both individual tree dimensions and forest stand characteristics) [40,41]. Tickle et al. [42] investigated the use of LiDAR data and large scale (1:4000) photography (LSP) to quantify the floristics and structure of mixed-species forests near Injune, central-eastern Queensland. They observed a robust relationship between LiDAR and field measurements of individual tree and stand height (r2 = 0.84–0.91). Using these relationships, they estimated floristics, height and foliage projective cover distributions for forests contained within the PSU (primary sampling unit) grid, which were then extrapolated to the entire study area. The research demonstrated that sampling using LSP and/ or LiDAR can provide quantitative assessments of floristics and key structural attributes (height, cover) at landscape scale. Lee and Lucas [43] employed an alternative approach to develop canopy height models, which was only partially useful for mapping and measuring stem dimensions in complex, multi-layered forests. They developed a Height-Scaled Crown Openness Index (HSCOI) to maximize the amount of information retrieved from scanning LiDAR for mixed-species woodlands and open-forests near Injune, Queensland. They concluded that HSCOI should not replace the CHM (canopy height model) surface but could be useful as a complementary tool for assessing forests with a highly variable structure. Although several Australian studies have used LiDAR to measure tree dimensions, no substantial work has yet been done to measure canopy volume, which is important for estimating biomass.
Image data from both airborne and spaceborne remote sensing platforms have been used to determine the relationships between tree height, crown diameter and crown cover for open forests and scattered trees [44,45,46]. Verma et al. [46] used crown projected area and heights of individual and clustered eucalypt trees to infer DBH. Few studies have explored the feasibility of using 2D, remotely sensed, multispectral data for canopy volume estimation. Ozdemir [44] estimated tree volume from pan sharpened QuickBird imagery in Crimean juniper open-forests. Greenberg et al. [45] generated regional-scale, above-ground, biomass estimates using a novel approach with hyperspectral remotely sensed imagery. They related the area of vegetation shadow to individual tree dimensions by assuming that tree crowns were symmetrical, and concluded that the measurement of shadow was a promising technique for estimating DBH and crown area.
Numerous methods for estimating tree parameters from multispectral, remotely sensed data have been trialled with varying success. Verma et al. [46,47] demonstrated that it was possible to delineate tree canopies and infer projected crown area from multispectral, remotely sensed imagery. These studies involved 2D measurements of tree parameters and could not be used directly to estimate trunk height or canopy volume. The key question, then, is whether in the absence of remotely derived measures of trunk height, we can infer canopy volume based on crown projected area and crown diameter? Few studies have explored this possibility. Popescu and Wynne [23] used pan-sharpened QuickBird imagery in Crimean juniper open-forests to predict tree volume from projected crown area with a root-mean-square error of 15.2%. More studies are required to determine whether this approach is more generally applicable. The aim of this current study was to determine the usefulness of optical remote sensing data as an alternative to LiDAR for estimation of 3D derivatives like canopy volume, by minimizing field based measurements and complex and expensive LiDAR data processing.
This research aimed to directly compare the performance of two sensor systems (airborne LiDAR and spaceborne multispectral systems) and two approaches for estimating tree canopy volume of scattered Eucalyptus trees; one using regression relationships between crown diameter and crown projected area as derived from the image-based World View-2 remote sensing system, and the other from measurements of canopy height and diameter acquired using a LiDAR system. The primary objective was to investigate how well canopy volume of scattered eucalypt trees in pasture can be estimated using LiDAR and satellite imagery, using field-based measurements of canopy volume as the benchmark. Also, owing to the complexity associated with LiDAR data, the study explored the possibility of using multispectral imagery alone to estimate canopy volume given that canopy volume is a 3D parameter.

2. Materials and Methods
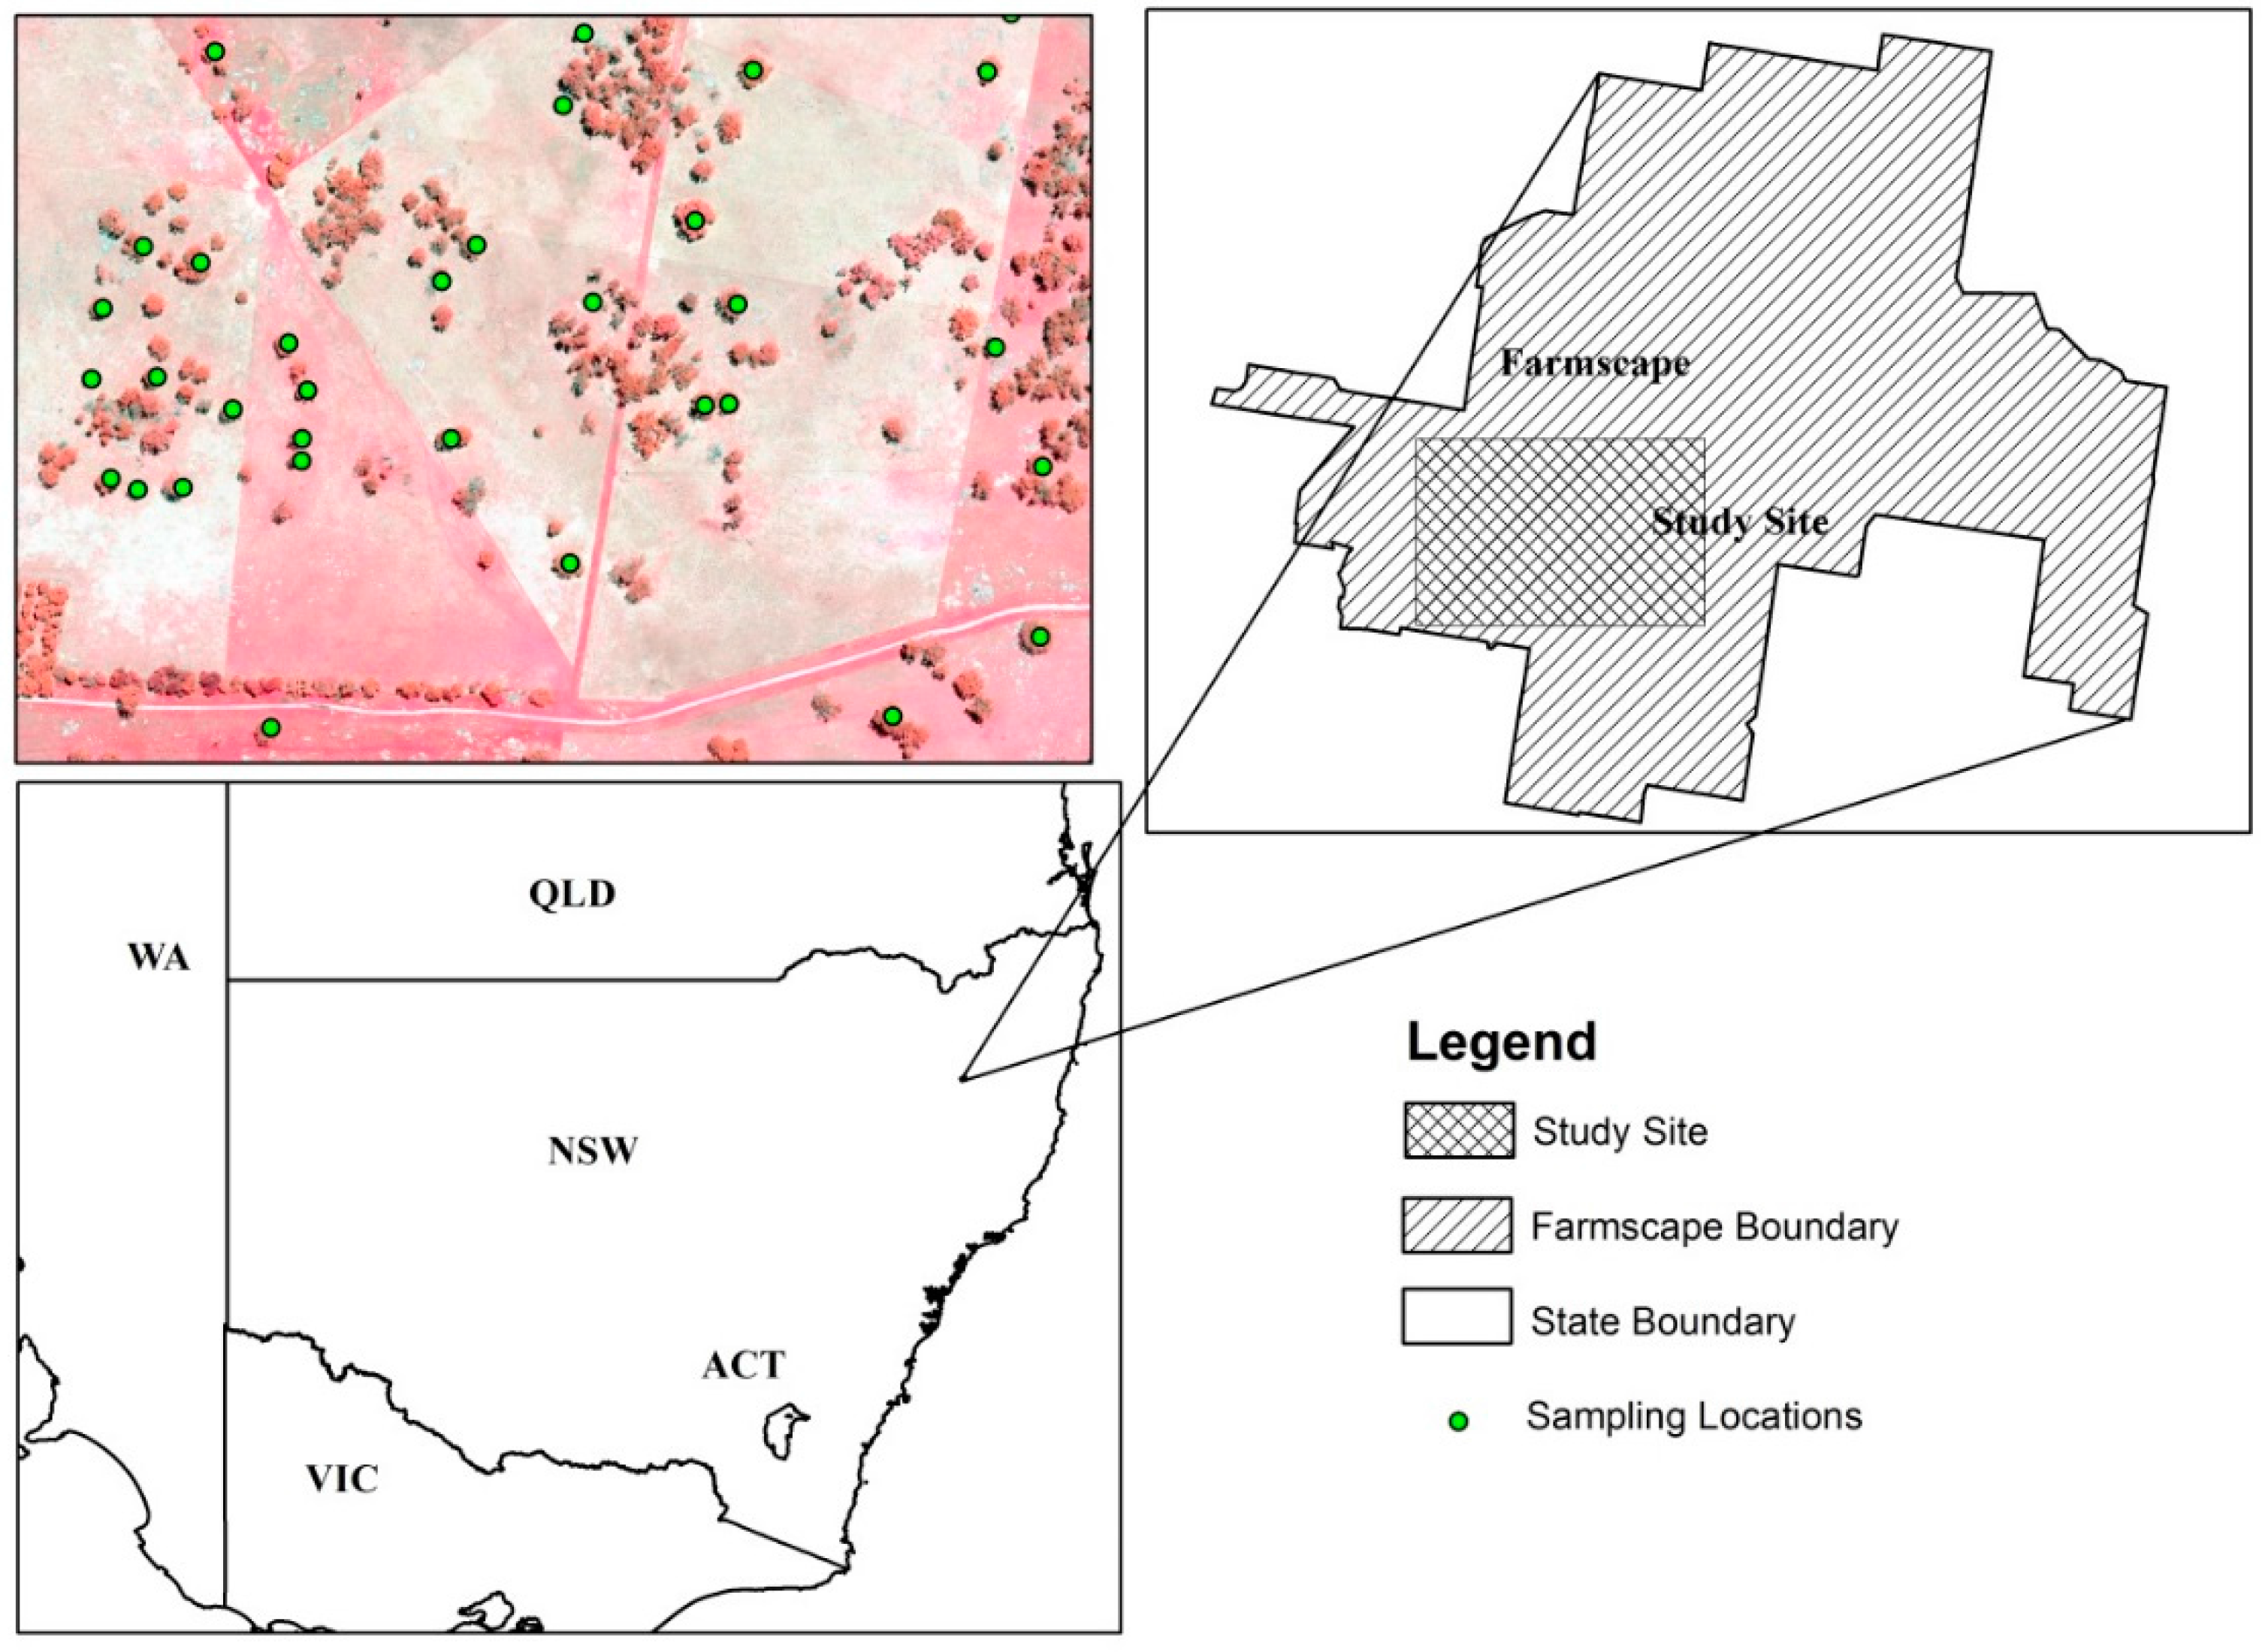
2.1. Study Area

The study area was the ‘SMART’ farm [48] owned and operated by the University of New England (UNE), Armidale, New South Wales, Australia (longitude 151°35′40′′E to 151°37′12′′E and latitude 30°26′09′′S to 30°25′12′′S; Figure 3). With a total area of 4837 ha, the farm includes large tracts of natural forest cover with several Eucalyptus species, namely Apple Box (Eucalyptus bridgesiana), Stringybark (Eucalyptus caliginosa), Red Gum (Eucalyptus blakelyi), White Gum (Eucalyptus viminalis) and Yellow Box (Eucalyptus melliodora), and is partitioned into grazed and ungrazed areas of woodland and open pasture. Approximately one third of the area is forested; a third is woodland, and the remainder native pasture. Most of the property is managed in an agriculturally unmanipulated manner other than grazing. Most of the study area is unfertilized or little fertilized natural pasture grazed by sheep. The portion of the study area chosen for the collection of laser and ground datasets was approximately 200 ha (study site, Figure 3), limited in size by the LiDAR data acquisition footprint.

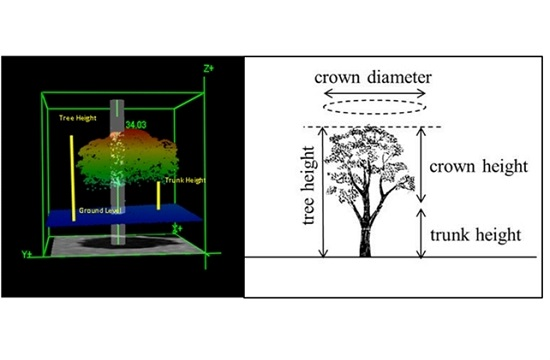
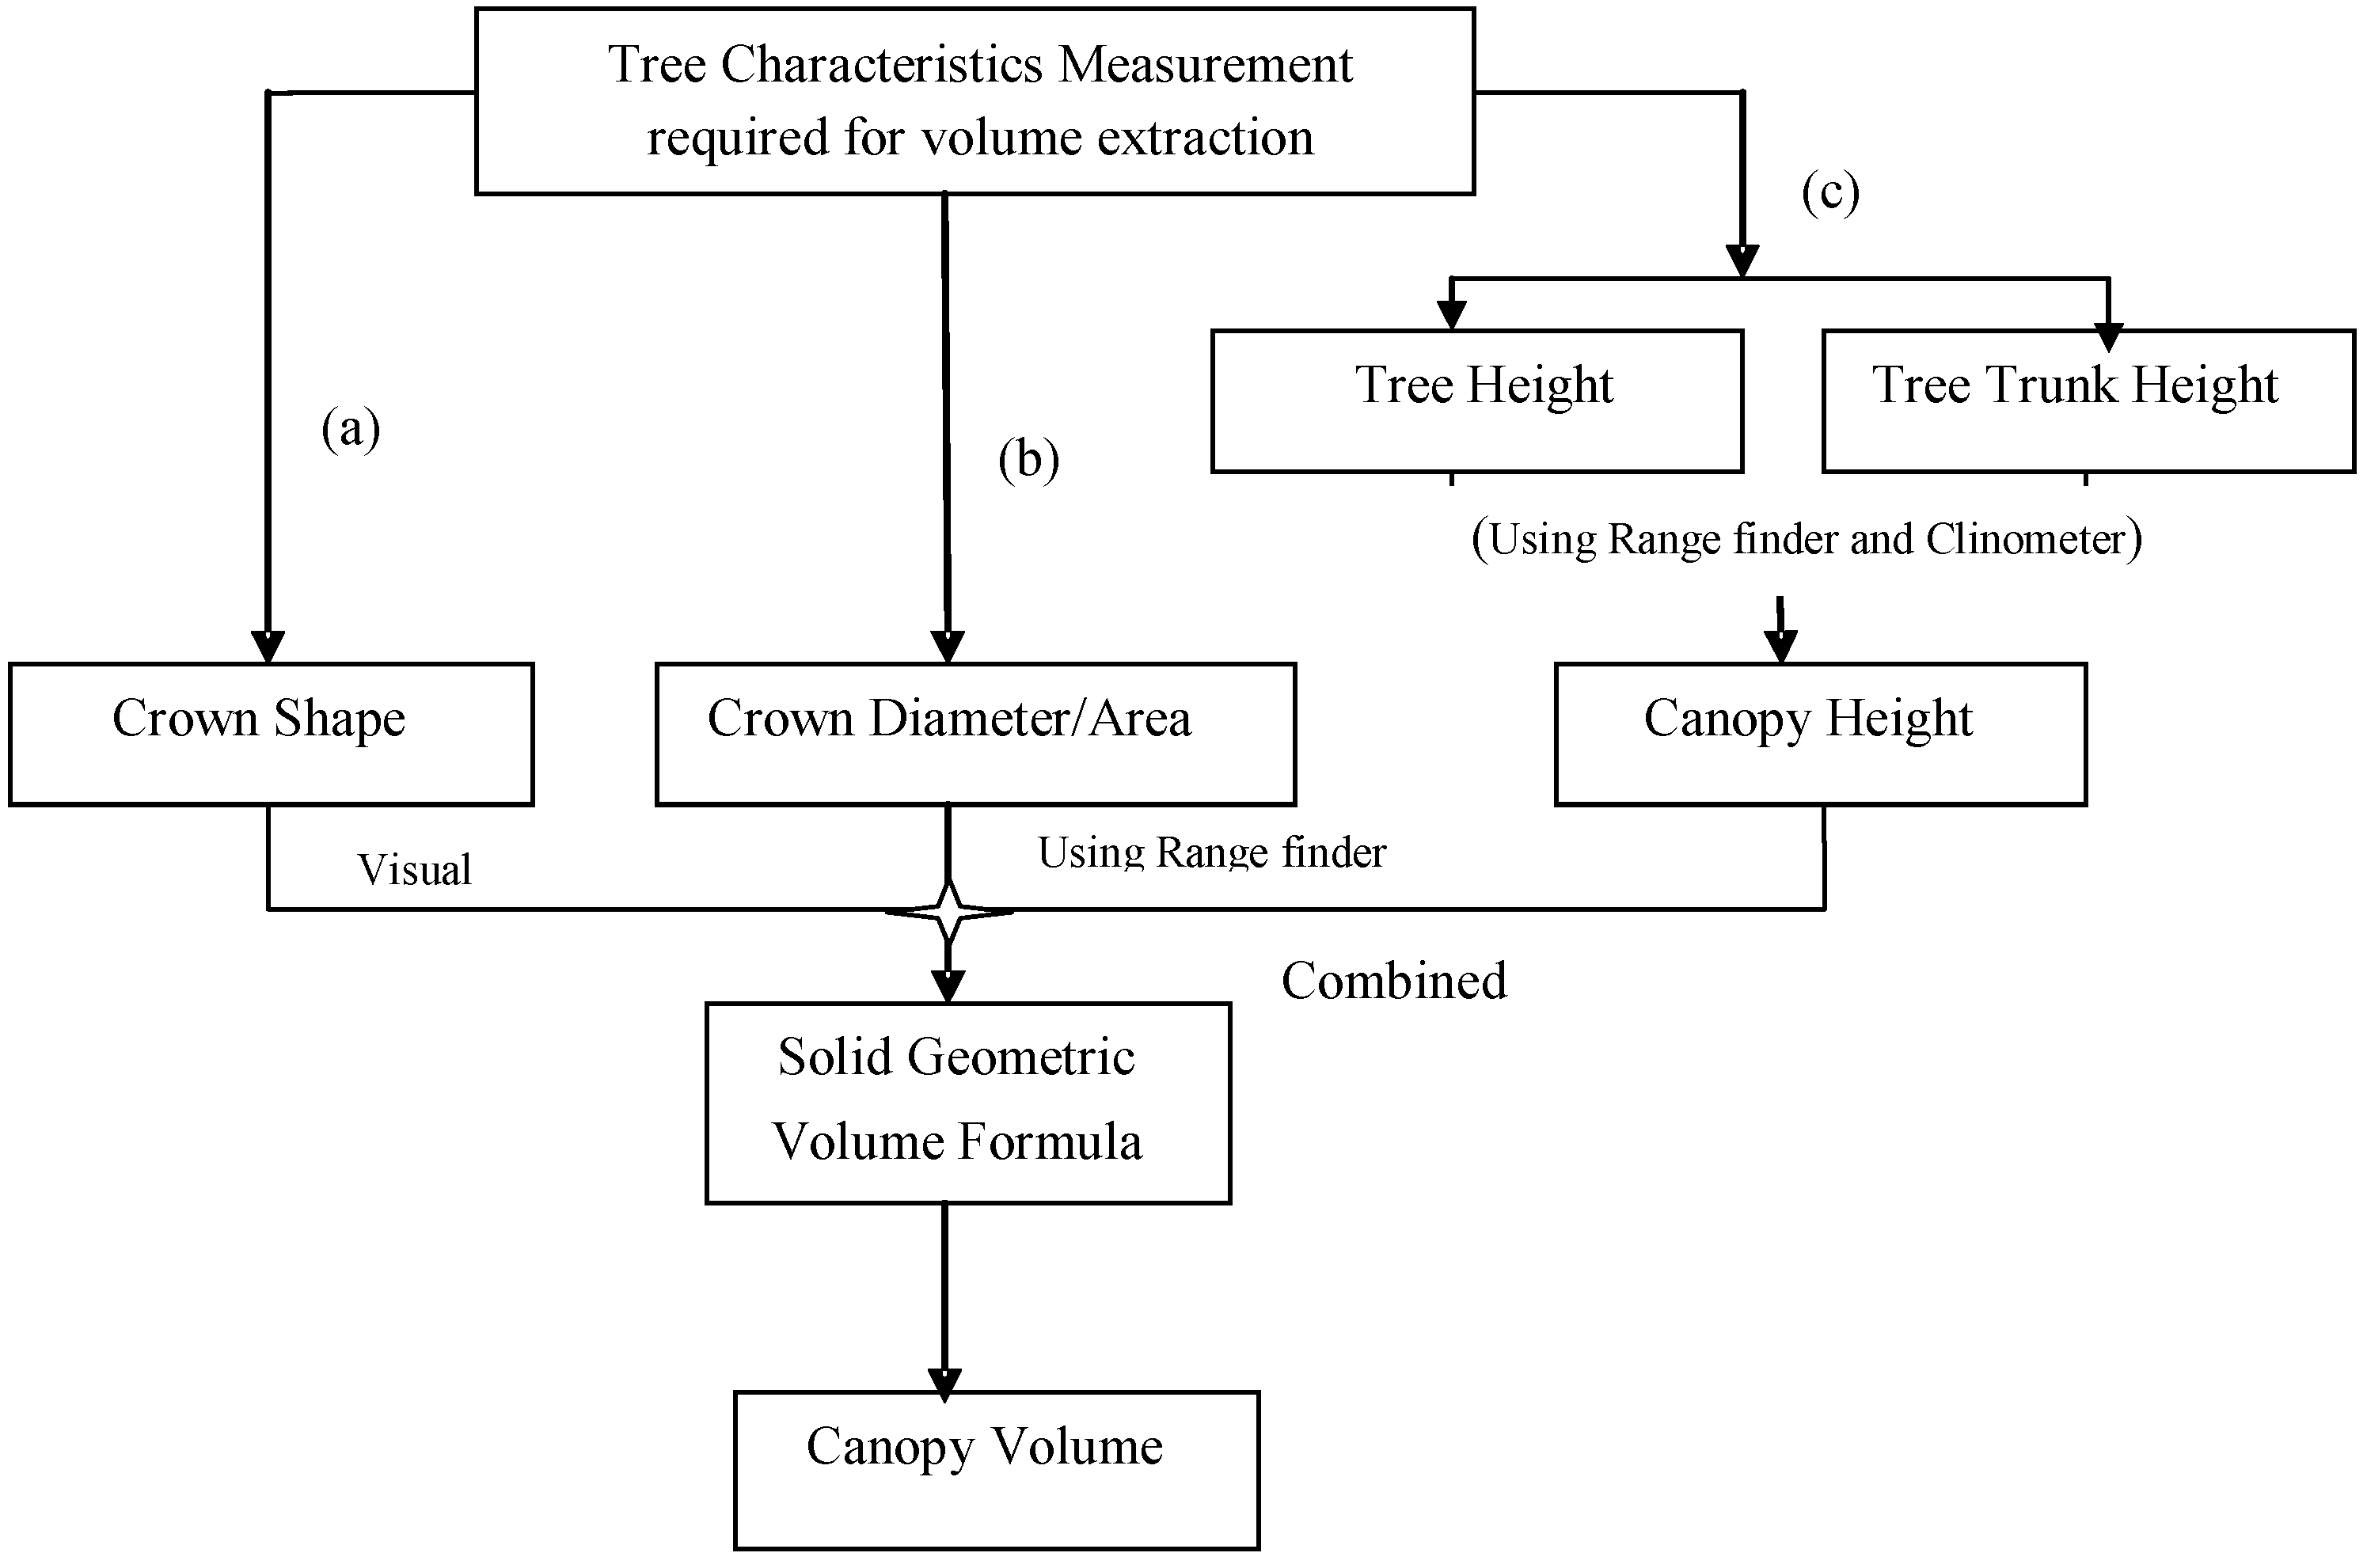
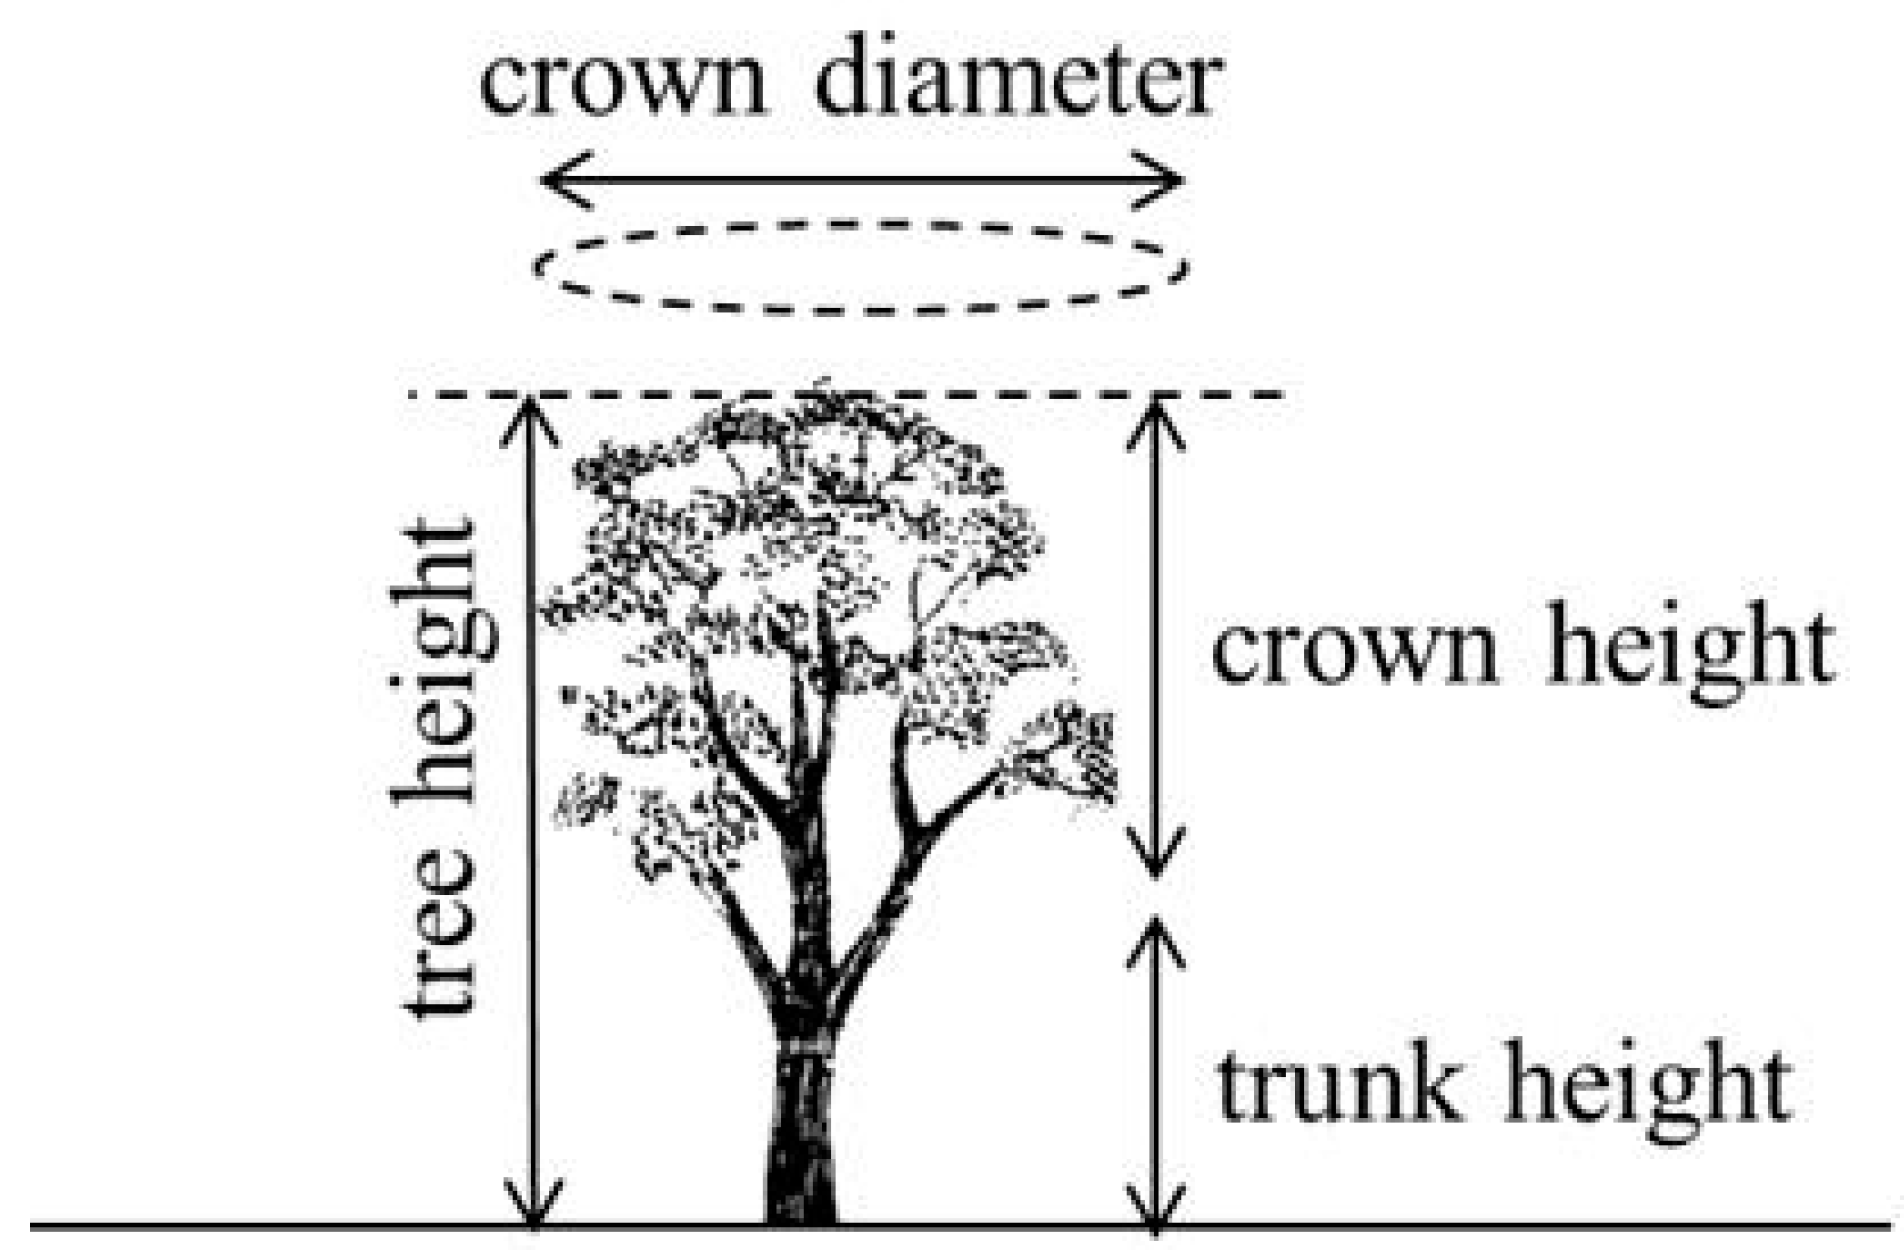
2.2. Field Measurements of Canopy Volume

High spatial resolution (15 cm), colour infrared (CIR) airborne imagery of the study area was first used to identify candidate trees in the study site, the coordinates of which were later used to identify trees in the field using GPS based positioning. Single eucalypt trees were selected randomly using the orthorectified imagery, and care was taken that the trees were well distributed across the study site. Field measurements were made between September and December 2012 (spring to summer, i.e., ‘leaf on’, as eucalypts are evergreen). In order to establish the relationship between crown variables, other tree dimensions and canopy volume, 79 trees of five Eucalyptus species were sampled. The number of each species varied depending on occurrence across the study area. Tree height (TH), crown diameter (CD) and canopy height (CH) were manually measured using a laser rangefinder (MDL LaserAce 300, Measurement Devices Ltd., Scotland, UK) and clinometer. Tree height was measured directly with the rangefinder by taking two measurements. Tree height measured using the clinometer was used to compare the performance of both instruments, which were very similar. Canopy height was measured by measuring trunk height, and subtracting it from total tree height (Figure 2). In order to measure crown projected area (CA), the crown diameter of individual trees was measured following the protocol described in Verma et al. [46]: firstly a pair of vertical range poles were placed in the ground to delineate the edges of the tree/cluster canopy along a cardinal axis, for example N-S, passing through the tree stem or the estimated centre of the cluster. The crown periphery for locating the pole positions was located using a clinometer set to ‘vertical view, in effect acting as a crown mirror. The crown diameter (d) along this direction was then measured using a laser range finder positioned at right-angles to, and a known distance well back from, the line between the poles. This measurement avoided errors that would otherwise be incurred by using tapes to measure the straight-line distance between the poles with tree stems in between. This measurement was undertaken for six cardinal directions namely N, ENE, ESE, S, WSW and WNW, respectively [46], and the average diameter, which is effectively the average crown spread, d, calculated [49]. The crown projected area was then calculated using:
C A = π d 2 / 4
Field-measured canopy volume (CVfield) of individual trees was calculated using Equation (1). A visual assessment of the canopies determined that the trees in the study area were parabolic in shape. According to the work of Coder [4] the volume can then be approximated as a paraboloid with a multiplier value (Equation (1)) of 0.3927. Regression equations were developed between canopy volume (CVfield), and crown diameter (CDfield) and projected crown area (CAfield), to determine canopy volume from the satellite data, which was able to provide estimates of CD and CA (Section 2.4) but unable to provide measurements of canopy height (discussed later).

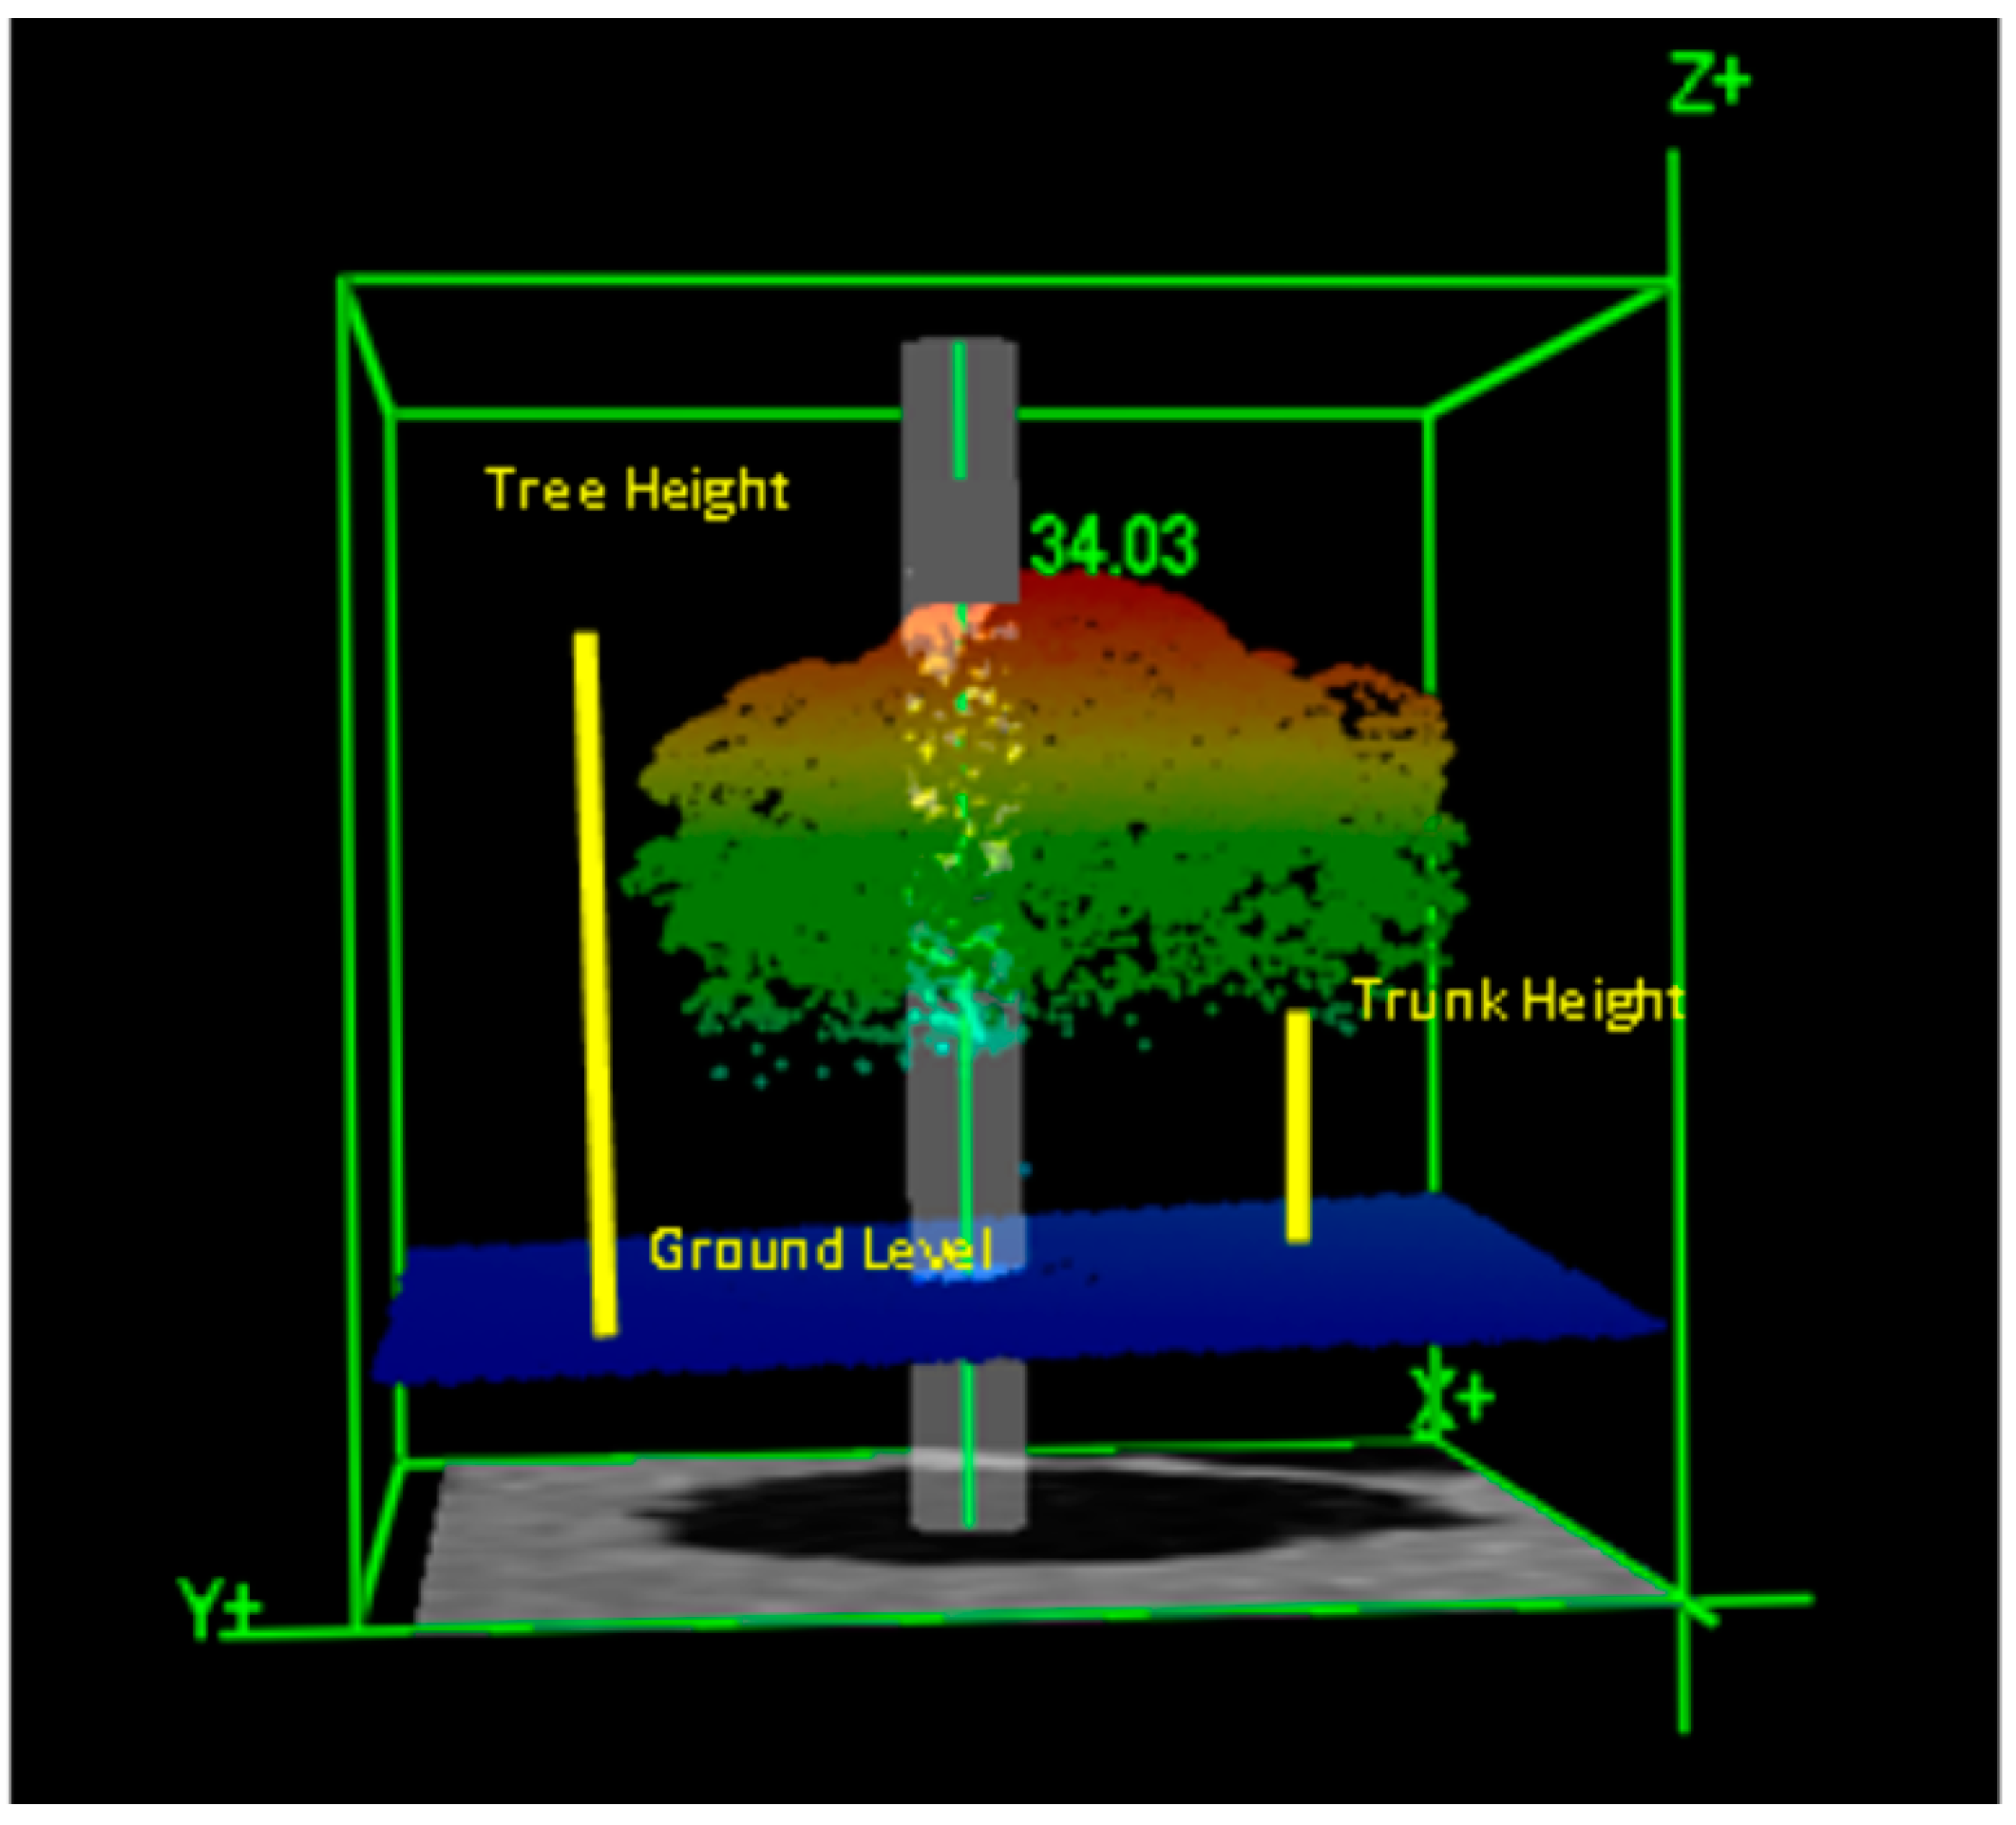
2.3. LiDAR Data Acquisition and Post-Processing

The Airborne Laser Scanning system used for the project was the Trimble Harrier 68i/G1 system flown on 1 June 2013. It consisted of a Riegl LiDAR scanning instrument, Applanix POS/AV 410 Inertial Motion System, with 12 channels and a dual frequency GPS receiver. The full waveform LiDAR dataset had the parameters in Table 1.
The LiDAR data were provided in LiDAR Exchange Format (LAS), having first been classified into ground and non-ground points by the data provider using proprietary software (Terrascan). An intensity image was created from the point clouds. The selected individual trees measured in the field were then identified in the point cloud data. The tree height and trunk height were measured for each tree using the software FUSION/LDV (Robert J. McGaughey, Pacific Northwest Research Station, Version 3.10, Build date 16 May 2012; Figure 4). Canopy height was calculated as the difference between tree height and trunk height. Tree crown parameters were extracted automatically by the method of image segmentation.
The automatic extraction of crown parameters from LiDAR was a two-step process involving (i) Canopy Height Model generation (CHM); and (ii) segmentation of the CHM image into homogeneous objects representing individual tree canopies. The CHM generation was carried out using interpolated two grid inputs, namely a Digital Terrain Model (DTM) and a Digital Surface Model (DSM) of 1 m spatial resolution. The DTM was a digital representation of the topographic surface where the height values in the terrain were known [50]. DSM was a representation of the features above ground level. A canopy height model, also referred to as a normalized digital surface model (nDSM), was created by subtracting the DTM from the DSM. The vertical resolution of the CHM was important as extraction of the tree height information largely depended on the accuracy of the CHM. The LiDAR data set for this study had a vertical accuracy better than ±30 cm (at 95% confidence level) and horizontal accuracy better than ±80 cm (at 95% confidence level). Since both the DTM and the DSM were created using interpolation, and given the additive nature of the vertical errors from a number of contributing processes in calculating the CHM, this yields a vertical error of approximately 1 m. The processing was done in ArcGIS version 10. The image segmentation (Object based classification) software used to extract trees from the CHM was eCognition (eCognition Developer 8, Munich, Germany, GmbH), which offers a wide range of segmentation algorithms. Segmentation is the critical first step in object based classification, and reduces the image into discrete regions or objects that are homogeneous with regard to spatial or spectral characteristics [51]. The image segmentation was carried out using the ‘fractal net evolution approach’ (FNEA), which relies on using a set of user-defined parameter settings, which affects the segmentation results [52,53]. The important outcome of the segmentation process is to identify objects that are representative of the features. The derived CHM was a grid in a single band image with the objects partitioned into lighter and darker areas. Therefore, a ‘contrast split’ segmentation algorithm in eCognition was employed for tree extraction. The algorithm splits bright and dark objects in image based on a threshold that maximizes the contrast between the resulting bright objects (pixel values above threshold) and dark objects (pixel values below the threshold). The algorithm evaluates the optimal threshold separately for each image object in the image object domain (set of image objects). Firstly, the algorithm executes a chessboard segmentation (splits the pixels domain into a square image object), and then performs the split on each square. Secondly, to optimize this separation, the algorithm considers different pixel values as a potential threshold, within the range provided by the user parameters and with values selected based on the input step size and stepping parameter. The test threshold causing the largest contrast is chosen as the best threshold and used for splitting. The test thresholds range from the minimum threshold to the maximum threshold, with intermediate values chosen according to the step size (the sizes of steps used by the algorithm to move from the minimum threshold to the maximum threshold), and step parameters calculate each step by addition or multiplication (the value is either added to the threshold or multiplied by the threshold). Finally, the mean of possible bright and dark border pixels is used to calculate either the edge ratio or edge difference, which is then used to define the contrast between two objects. The selection of segmentation parameters was highly subjective and determined through a combination of trial and error, and ultimately user experience [47]. For this study, a minimum and maximum threshold of 20 and 110, respectively, a step size of 5, and an add function for the stepping type parameter was found suitable and effective for tree extraction. Figure 5 shows the different steps of contrast split algorithm used in the study and Figure 6 shows the segmented objects.
The tree polygons were exported to ArcGIS 10 and the crown diameter (CDLiDAR) of each tree was estimated by measuring the lengths of the major and minor axes of the canopy polygon and averaging the two. Canopy heights were estimated by subtracting trunk height from tree height. The canopy volume (CVLiDAR) was then calculated using Equation (1) with the same multiplier used for the field-based measurements.

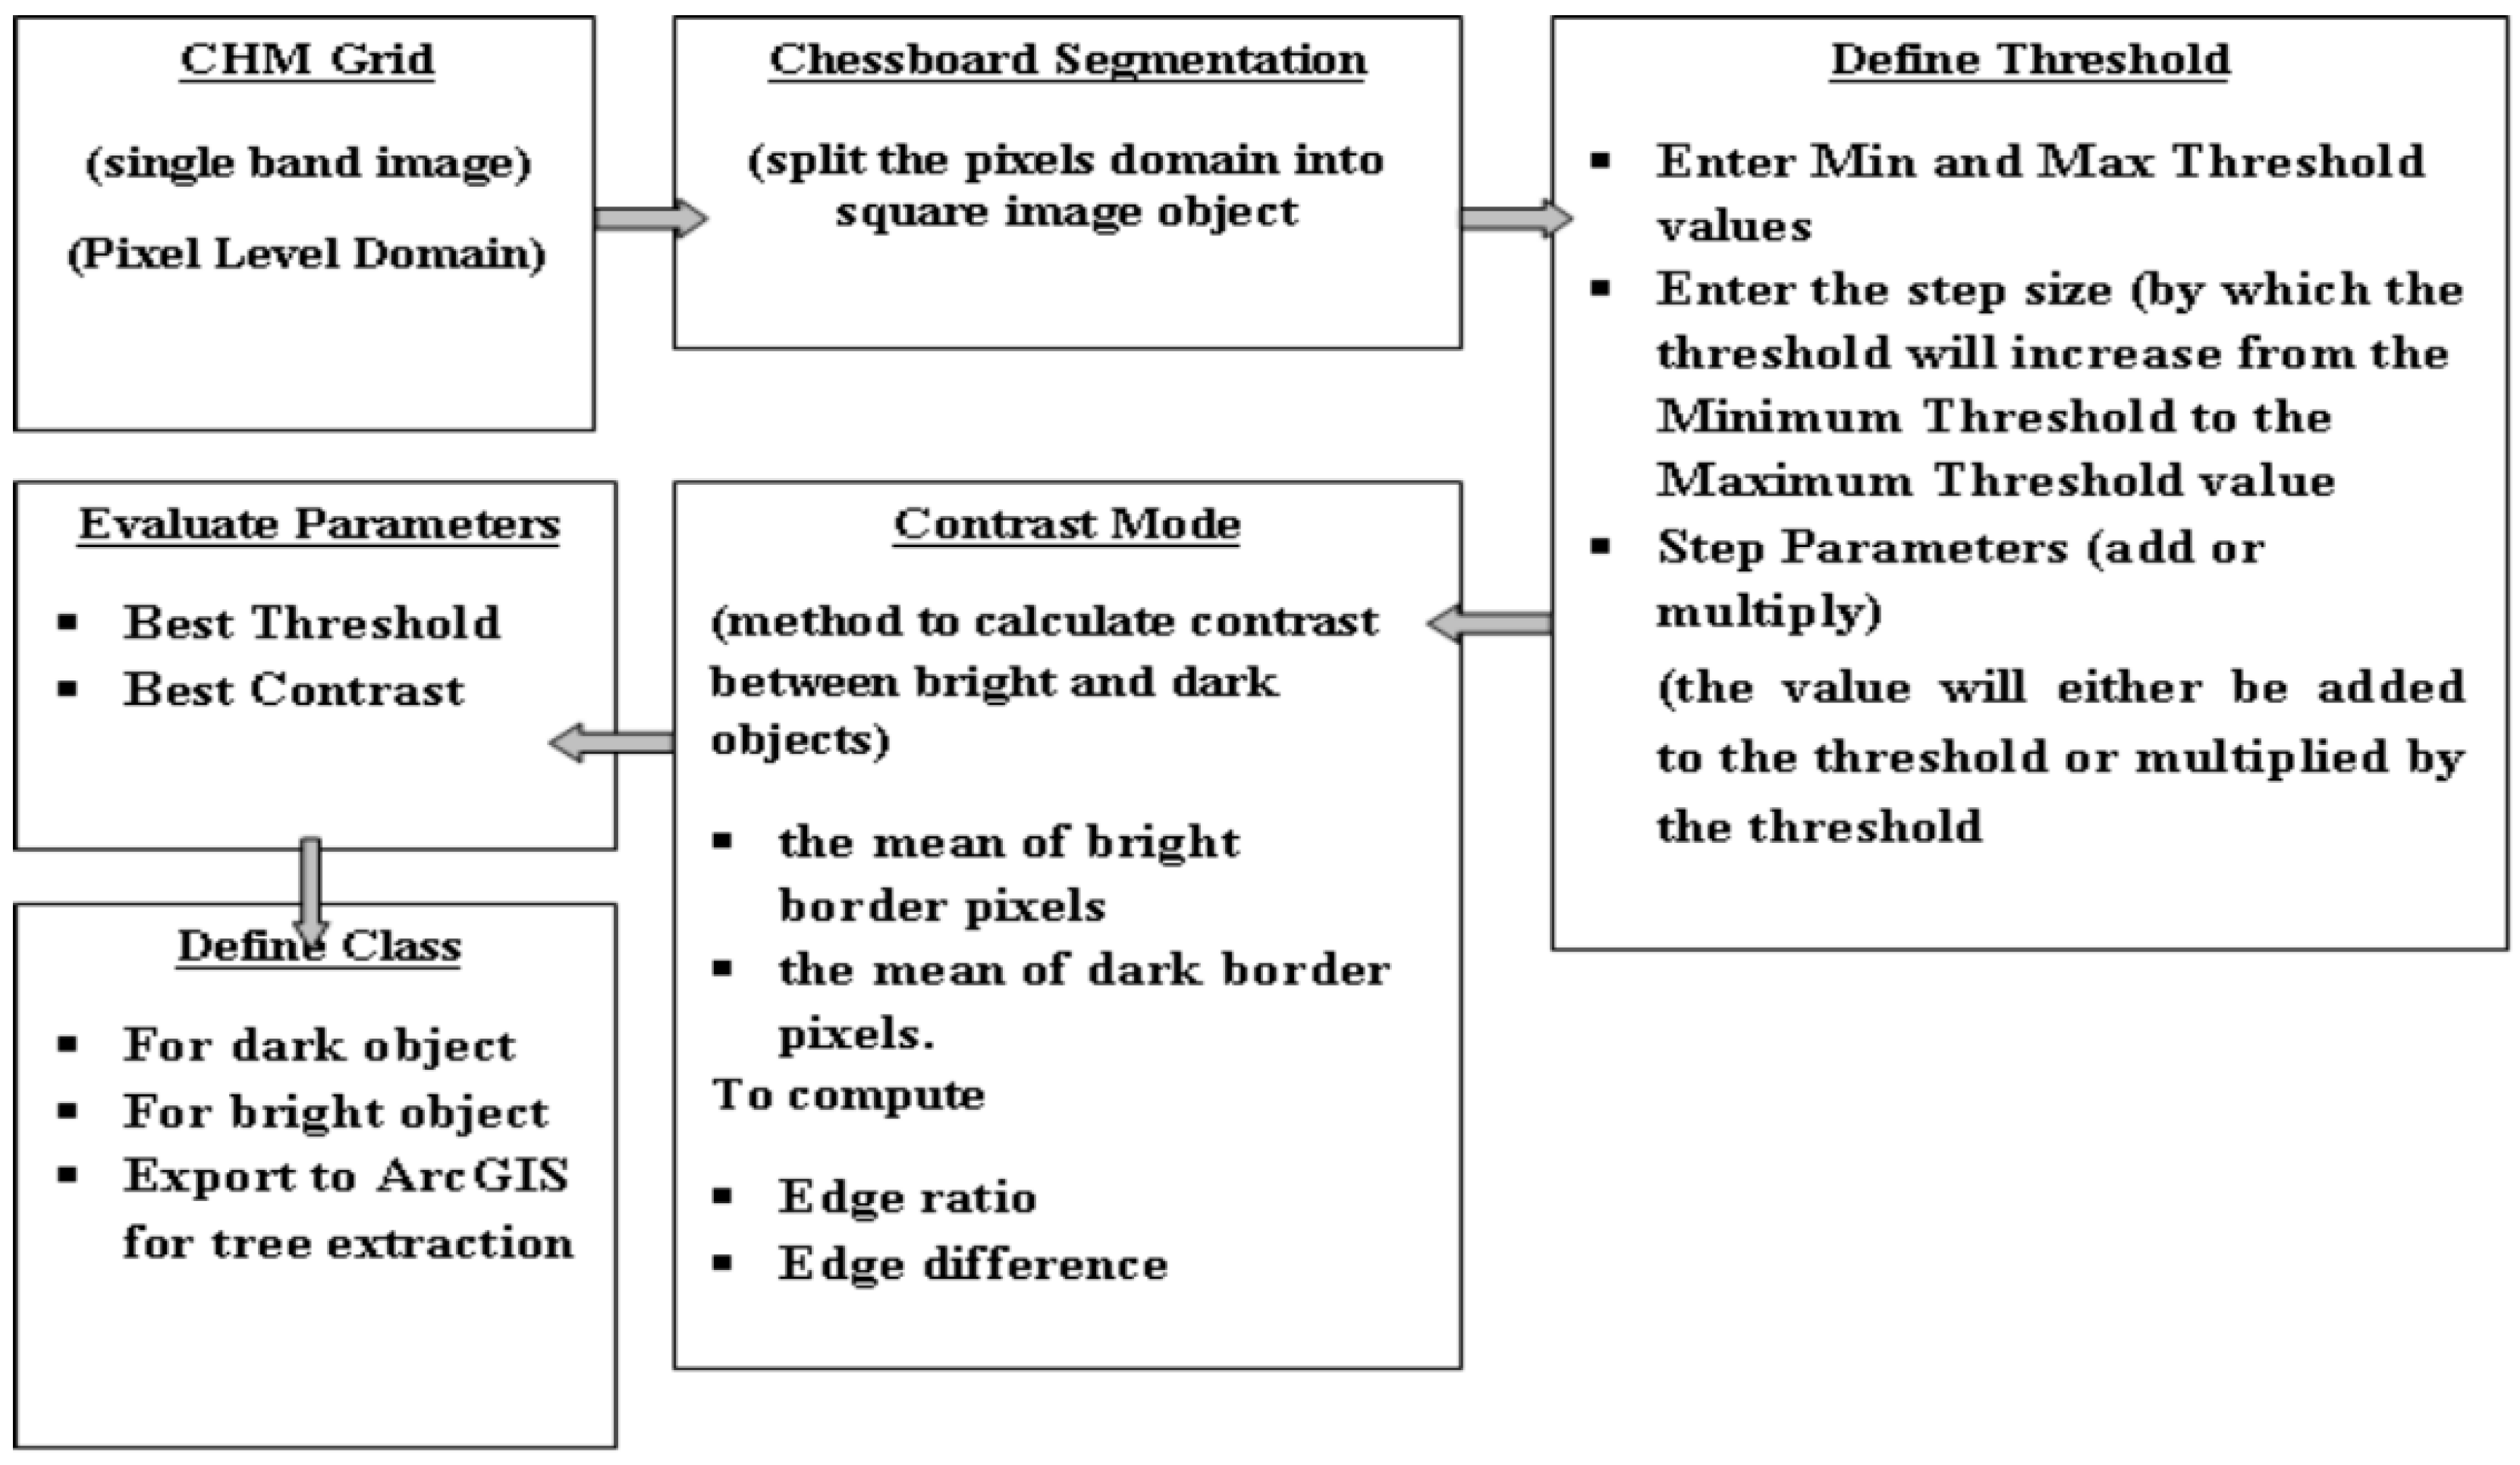
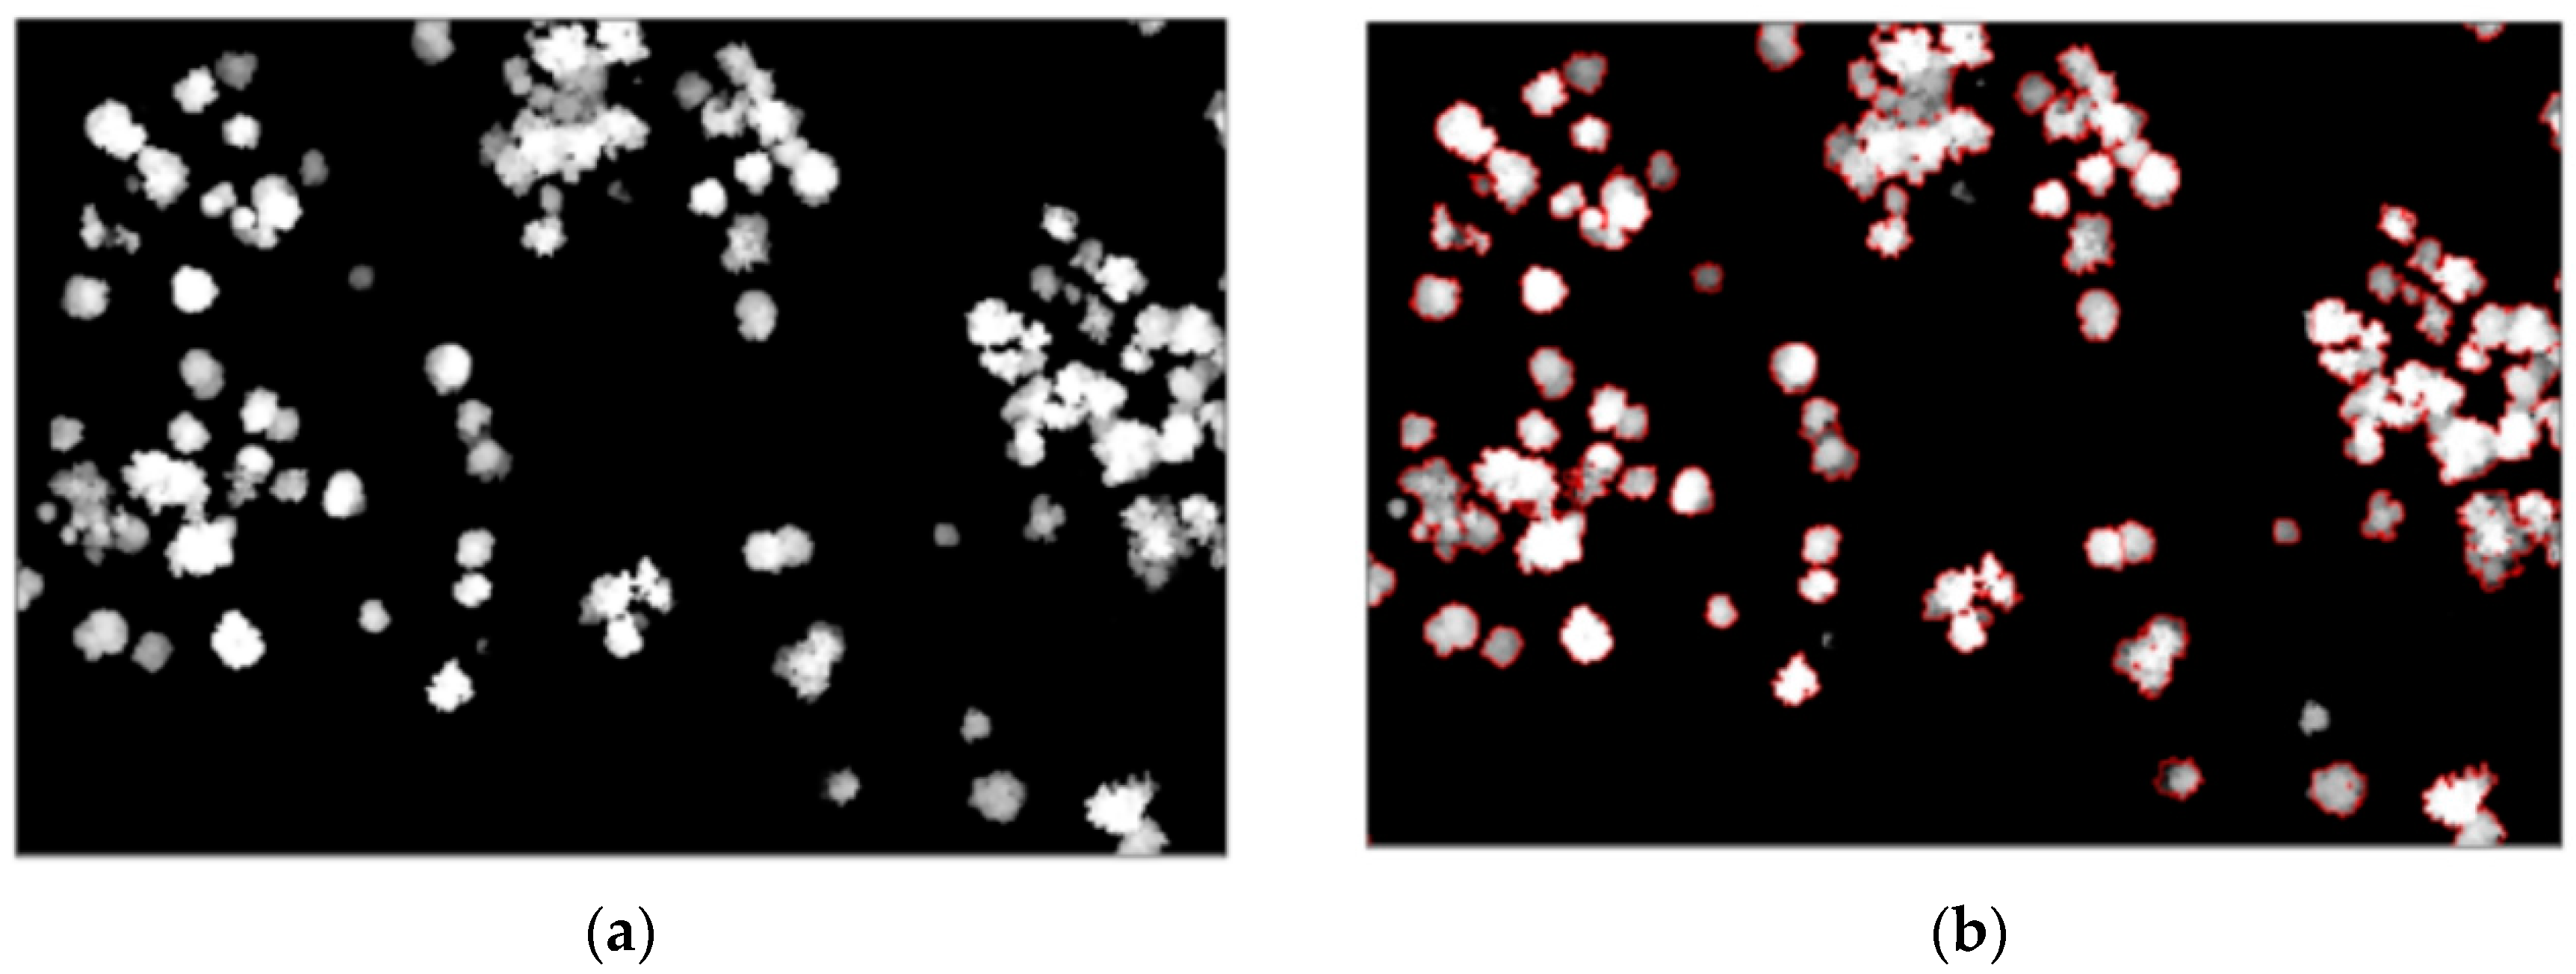
2.4. Delineation of Tree Attributes from WorldView2 Data

A multispectral, PAN-sharpened, WorldView2 image (8-bit, 1 January 2012) was acquired with a spatial resolution of approximately 50 cm in four spectral bands, Band 1 (NIR 0.7–1 μm), Band 2 (Red 0.6–0.7 μm), Band 3 (Green 0.5–0.6 μm) and Band 4 (0.4–0.5 μm). The image coordinate reference system was WGS 84 UTM Zone 56 S. The crown projected area of each tree (CAWV2) was determined manually by onscreen digitization/segmentation of the canopies (ArcGIS version 10) and counting the canopy pixels, assuming a pixel dimension of 50 cm × 50 cm. The crown diameter (CDWV2) of each tree was determined by measuring the lengths of the major and minor axes of the canopy polygon and averaging the two. In order to estimate canopy volume from the WorldView-2 imagery (CVWV2), the derived values of CDWV2 and CAWV2 were substituted into the regression equation developed between on-ground measurements of canopy volume (CVfield), and crown diameter (CDfield) and crown projected area (CAfield).

2.5. Evaluating the Performance of the Two Techniques

The derived canopy volumes for each remote sensing method (CVLiDAR, CVWV2) were compared to the field-measured values (CVfield) and a root mean squared prediction error, RMSE = ( CV predicted CV actual ) 2 , calculated. Analysis and model evaluation was done using the statistical software R (Studio Version 0.97.318).

3. Results

The analysis results of field and LiDAR measurements and canopy volume estimations are presented in this section.

3.1. Field Measurements of Tree Parameters

Summary statistics of the measured trees are given in Table 2. Due to the variability in tree species, and the irregular dimensions of the trees characteristics, tree height and trunk height (i.e., tree height − canopy height) exhibited significant variability (approx. 25% and 15%, respectively). Field measurements of tree height ranged from 12.7 m to 42.8 m with a SD of 5.3 m while trunk height measurements ranged from 3.6 m to 16.2 m with a SD of 2.6 m.
Noting that the diameter measurements of each canopy (CDfield) were acquired for 6 cardinal directions and the average calculated, the standard deviation of this average diameter value varied between 0.4% and 34%.

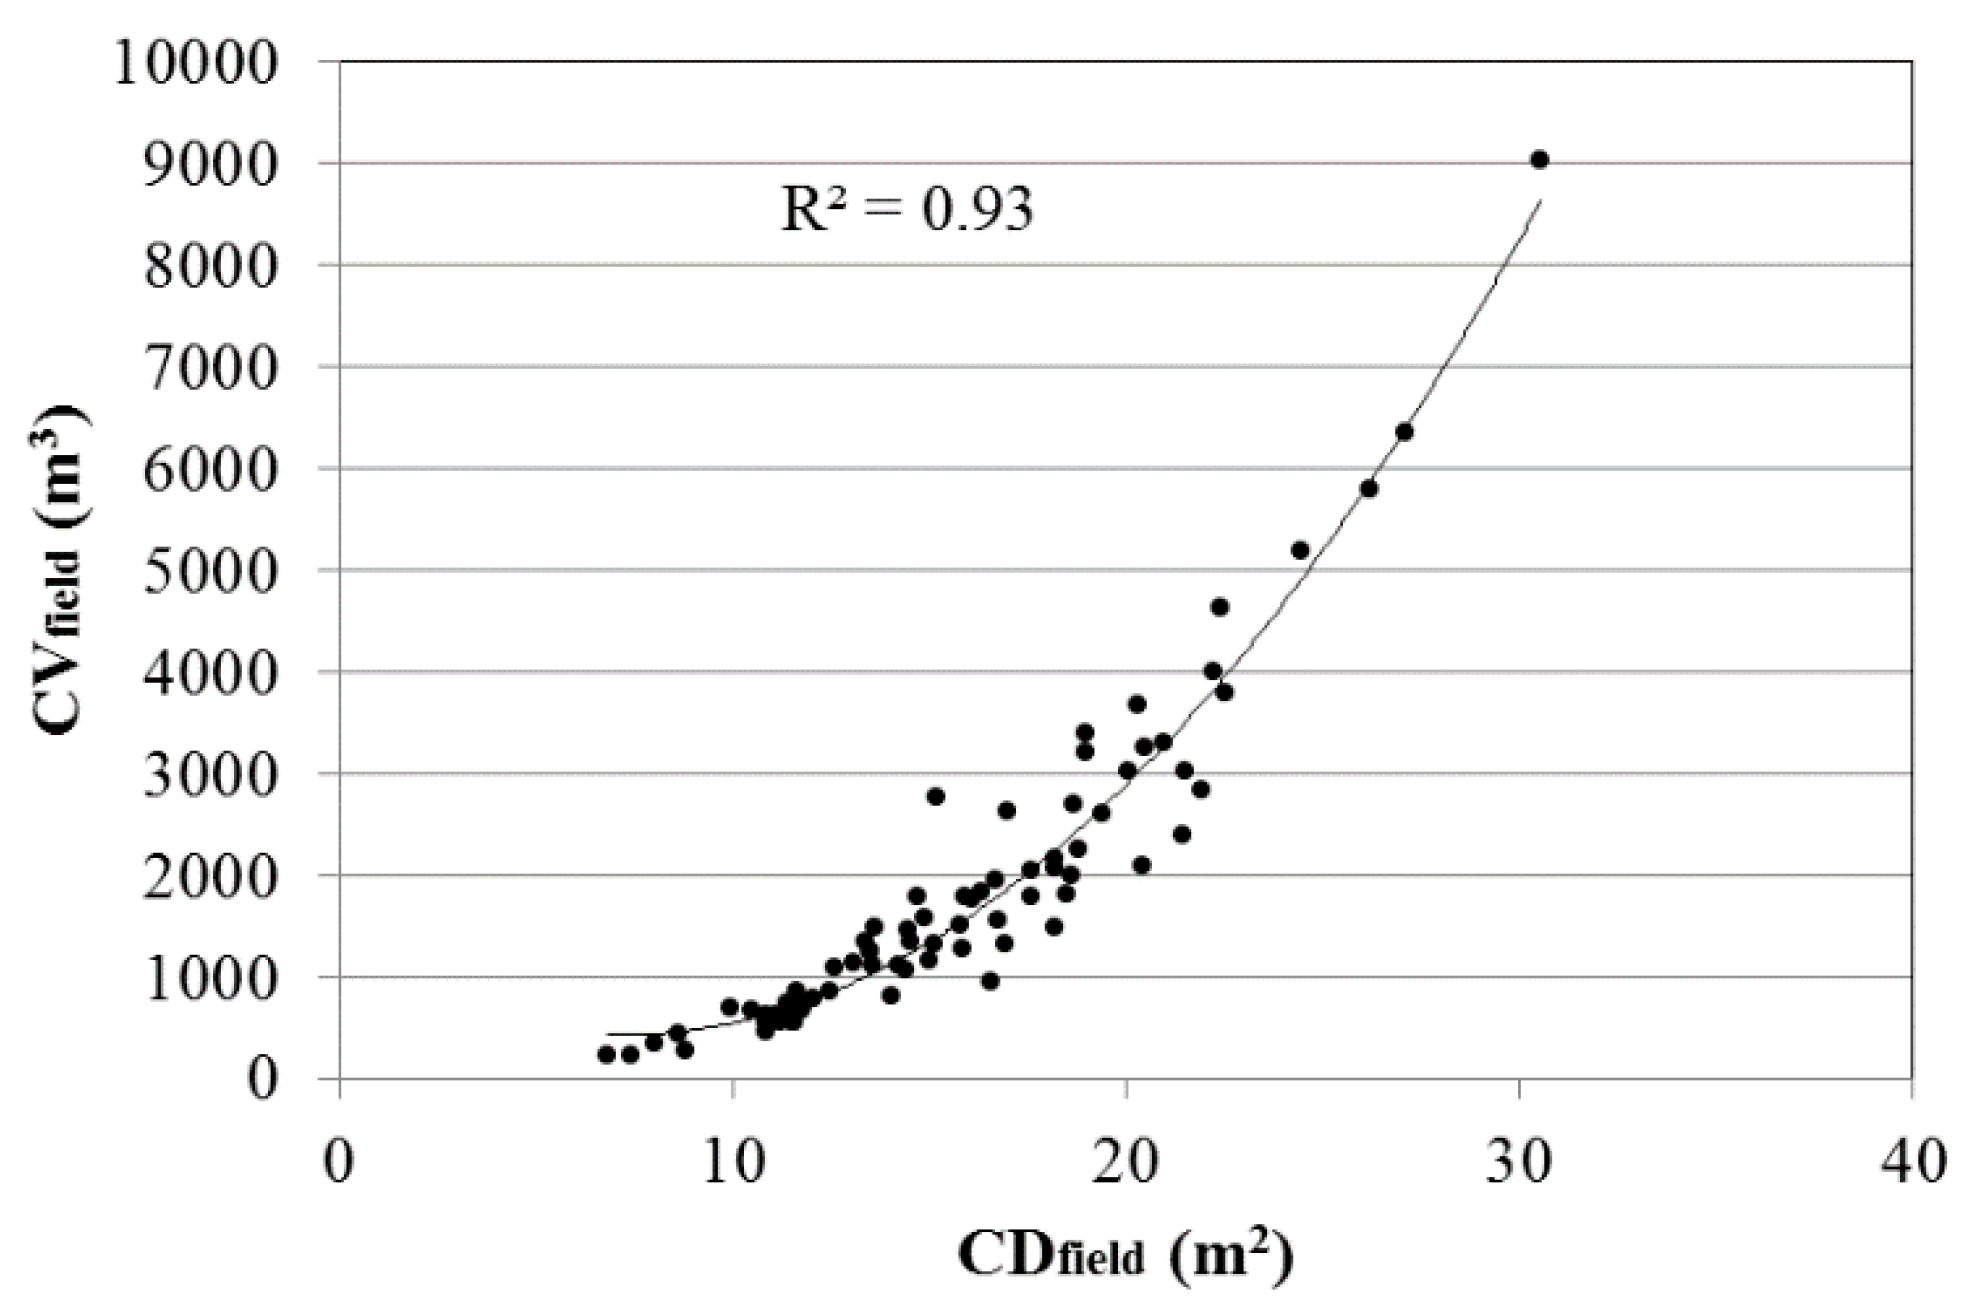
3.2. Canopy Volume Estimations

Scatter plots of canopy volume (CVfield) versus crown diameter (CDfield) and crown projected area (CAfield) are given in Figure 7 and Figure 8, respectively, along with the best-fit, polynomial regression curves. The derived regression equations corresponding to these curves are given in Table 3.
The two models represented in Table 3 indicated that CV can be estimated from optical remote sensing datasets using CA and CD as these are the variables which can directly be measured from optical remote sensing data. However, the CV estimates using CD (F = 415.6) is better than using CA (F = 993.0). The application of the two regression equations in Table 3 to estimate canopy volume is depicted in Figure 9, which compares the predicted canopy volumes (CVWV2) against the field measured values, the latter including the canopy height parameter from Equation (1). Both scatterplots include a 1:1 equivalence line (dashed line) and a best-fit regression curve. The accuracy of using WorldView-2 imagery to infer canopy volume from CA and CD differed, as shown in Figure 9a,b, respectively. An RMSE of 781.03 m3 (42%) was observed with CA as the predictor variable, compared to an RMSE of 575.5 m3 (31%) with CD as the predictor. The best-fit regression of CA-derived CVWV2 on CVfield was a power function and explained 65% of the variance, whereas a second-order polynomial regression of CD-derived CVWV2 on CVfield explained 76% of the variance.
Figure 10 shows the scatterplot of LiDAR-derived canopy volume versus field-measured CV. CVLiDAR was calculated from Equation (1) using both canopy height and crown diameter derived from the LiDAR data. Despite the lower RMSE for the LiDAR-derived canopy volume estimates (490.8 m3, 26% error), CVLiDAR systematically underestimated CVfield at larger canopy volumes (>4000 m3).
The individual parameters, CD and CH, extracted from the LiDAR data are plotted against the corresponding field measurements in Figure 11a,b. The LiDAR method estimated tree heights with an RMSE of 1.44 m (error of 6.5%) when compared to the field measurements.

4. Discussion

As the field measurements of canopy height were acquired using a digital clinometer and rangefinder, there was a potential error in overestimating the height associated with locating the very top of the tree canopy from ground level. It can be shown that for spherical canopies the relative error is proportional to the product of the height and radius of the (assumed spherical) canopy and inversely proportional to the baseline distance from the clinometer/rangefinder and the base of the tree. Given the dimensions of the trees in question and the baseline distances used, this can be as large as 40%. For parabolic canopies this overestimation can be significantly less. In this work, and given the parabolic nature of the canopies observed, we estimate the propensity for overestimating the height of the trees to be ~10%. The irregular shape of the crowns of the individual trees was also apparent in the calculation of the individual crown diameters.
Both Figure 7 and Figure 8 and the regression statistics in Table 3 indicated that the canopy volume of Eucalyptus trees can be inferred using crown diameter or crown projected area, without the need for measuring canopy height, which bodes well for using remotely sensed imaging systems. Both equations in Table 3 tended to overestimate canopy volume measured in the field, most likely due to the visual classification of mixed boundary pixels as canopy. As the imagery was orthorectified, it was often difficult to determine whether the canopy fringes observed in the imagery were parts of the crown or shadow cast upon the underlying ground surface. If shadow fringes were generally classified as tree canopy, both CA and CD would have been overestimated, yielding higher CV values. The CA-derived CVWV2 estimates were higher than the corresponding CD-derived CVWV2 values because of the additive effect of misclassified pixels in calculating CA. The crown diameter measure, on the other hand, was only an average of two canopy (major and minor) axes. Ideally, an objective classification procedure would apportion intermediate pixels according to the level of mixing, and this is recommended for further work. At higher canopy volumes (>4000 m3, i.e., trees with huge crowns), both techniques tended to underestimate CVfield (probably due to additional textural effect), although there was considerable spread in the predicted versus actual values for larger canopies.
Given the potential errors associated with the clinometer/rangefinder measurements, it is not surprising that the field values exceeded the LiDAR values for taller trees. Of course the LiDAR method may also be contributing to the progressively larger difference between the remote sensing and field based measurements owing to the fact that the larger trees tend to exhibit greater porosity (visual assessment only) and this may result in ‘pits’ in the LiDAR surface profiles. Studies by Rönnholm et al. and Huang et al. [28,29] have also showed that tree heights are typically underestimated by small footprint laser scanning systems for several reasons: (a) variability in the density and coverage of laser pulses; (b) differences in the algorithms used to obtain the canopy height model; (c) the amount and height of understory vegetation obscuring the ground surface; (d) differences in algorithms used to calculate the bare ground elevation; (e) the sensitivity of the laser system and the algorithms used for signal processing; and (f) lastly the tree shape and tree species.
The present study used full waveform LiDAR with a point density of 10 m−2, which should have been sufficient to generate accurate estimates of tree height and other tree dimensions [14]. The LiDAR contribution to the discrepancy (i.e., underestimation) was most likely due to the flying height. Other factors that influence the crown diameter and canopy height measurements may be the number of pulses hitting the canopy and understorey, which would fail to provide an accurate estimate of the trunk height, and due to confusion in estimating the lower limit of the canopy. Given the diameter value is squared in Equation (1), even a minor underestimation is exaggerated.

5. Conclusions

Field-based measurements provide the best estimate of the structural dimensions of forests but are often expensive, labour-intensive and time consuming to collect. Several studies have used LiDAR to measure tree dimensions with high accuracy, but the price and complexity associated with LiDAR acquisition and processing restrict its application. Therefore, in the quest for cheaper and more convenient means of tree parameter estimation, this study estimated the canopy volume of individual Eucalyptus trees using crown diameter and crown projected area derived from WorldView-2 (WV2) data. The results showed that WV2-derived crown projected area and crown diameter were strongly correlated with canopy volume, and that crown diameter yielded better results (RMSE 31%) than crown projected area (RMSE 42%). The results indicated the possible use of high-resolution optical data as an alternative to existing methods for measuring 3D attributes of scattered trees and spatially separated tree copses. The remote sensing advantages associated with the use of optical data include avoiding the high cost of LiDAR and associated complex data processing, as well as the ready availability of optical data compared to LiDAR. We note that our results may not be applicable to forests with closed canopies, as understorey is also an important component of forest ecosystems. Our approach could also perhaps be enhanced by incorporating terrain characteristics like slope, aspect, rainfall, etc., which affect volume estimates. In addition, this study used contrast split segmentation for LiDAR CHM data segmentation, which is relatively unexplored but could be more frequently used, based on our results, compared to the widely used multi-resolution rule-based segmentation. Future research should extend our study by testing remotely sensed datasets of varying resolution against volume estimates in other forest and savanna types.

Acknowledgments

This work was partially funded by the CRC for Spatial Information (CRCSI), established and supported under the Australian Government Cooperative Research Centres Programme. One of the authors (NKV) wishes to acknowledge the receipt of a Postgraduate ‘Top-up’ Scholarship from the CRCSI.

Author Contributions

Conceived and designed the experiments: Niva Kiran Verma and David Lamb. Performed the experiments: Niva Kiran Verma. Analysed the data: Niva Kiran Verma. Wrote the paper: Niva Kiran Verma, David Lamb, Nick Reid. Edited: Nick Reid, Brian Wilson.

Conflicts of Interest

The authors declare no conflict of interest.

References

  1. Zaman, Q.; Schuman, A.W. Performance of an ultrasonic tree volume measurement system in commercial citrus groves. Precis. Agric. 2005, 6, 467–480. [Google Scholar] [CrossRef]
  2. Usha, K.; Singh, B. Potential applications of remote sensing in horticulture—A review. Sci. Hortic. 2013, 153, 71–83. [Google Scholar] [CrossRef]
  3. Dubrasich, M.E.; Hann, D.W.; Tappeineer, J.C., II. Methods for evaluating crown area profiles of forest stands. Can. J. For. Res. 1997, 27, 385–392. [Google Scholar] [CrossRef]
  4. Coder, K.D. Tree Biomechanics Series: Crown Shape Factors & Volumes. Available online: http://www.forestry.uga.edu/warnell/service/library/for00–032/2000 (accessed on 27 January 2014).
  5. Troxel, B.; Piana, M.; Ashton, M.S.; Dunning, C.M. Relationships between bole and crown size for young urban trees in the northeastern USA. Urban For. Urban Green. 2013, 12, 144–153. [Google Scholar] [CrossRef]
  6. Rautiainen, M.; Mõttus, M.; Stenberg, P.; Ervasti, S. Crown envelope shape measurements and models. Silv. Fenn. 2007, 42, 19–33. [Google Scholar] [CrossRef]
  7. Tumbo, S.D.; Salyani, M.; Whitney, J.D.; Wheaton, T.A.; Miller, W.M. Investigation of laser and ultrasonic ranging sensors for measurements of citrus canopy volume. Appl. Eng. Agric. 2002, 18, 367–372. [Google Scholar] [CrossRef]
  8. Ross, N. Modeling forest canopy heights: The effects of canopy shape. Remote Sens. Environ. 1997, 60, 327–334. [Google Scholar]
  9. Eamus, D.; McGuinness, K.; Burrows, W. Review of Allometric Relationships for Estimating Woody Biomass for Queensland, the Northern Territory and Western Australia; National Carbon Accounting System Technical Report No. 5A; Australian Greenhouse Office: Canberra, Australia, 2000.
  10. Keith, H.; Barrett, D.; Keenan, R. Review of Allometric Relationships for Estimating Woody Biomass for New South Wales, The Australian Capital Territory, Victoria, Tasmania and South Australia; National Carbon Accounting System Technical Report No. 5B; Australian Greenhouse Office: Canberra, Australia, 2000.
  11. Kini, A.U.; Popescu, S.C. TreeVaW: A versatile tool for Analysing Forest Canopy LiDAR Data—A preview with an eye towards the future. In Proceedings of the ASPRS Fall Conference, Kansas City, MO, USA, 12–16 September 2004; pp. 1–10.
  12. Lefsky, M.A.; Cohen, W.B.; Parker, G.G.; Harding, D.J. LiDAR remote sensing for ecosystem studies. Bioscience 2002, 52, 19–30. [Google Scholar] [CrossRef]
  13. Naesset, E.; Okland, T. Estimating tree height and tree crown properties using airborne scanning laser in a Boreat nature reserve. Remote Sens. Environ. 2002, 79, 105–115. [Google Scholar] [CrossRef]
  14. Popescu, S.C.; Wynne, R.H.; Nelson, R.F. Measuring individual tree crown diameter with LiDAR and assessing its influence on estimating forest volume and biomass. Can. J. Remote Sens. 2003, 29, 564–577. [Google Scholar] [CrossRef]
  15. Hemery, G.E.; Savill, P.S.; Pryor, S.N. Applications of the crown diameter–stem diameter relationship for different species of broadleaved trees. For. Ecol. Manag. 2005, 215, 285–294. [Google Scholar] [CrossRef]
  16. Hyyppa, J.; Hyyppa, H.; Leckie, D.; Gougeon, F.; Yu, X.; Maltamo, M. Review of methods of small footprint airborne laser scanning for extracting forest inventory data in boreal forests. Int. J. Remote Sens. 2008, 29, 1339–1366. [Google Scholar] [CrossRef]
  17. Lim, K.; Hopkinson, C.; Treitz, P. Examining the effects of sampling point densities on laser canopy height and density metrics. For. Cron. 2008, 84, 876–885. [Google Scholar] [CrossRef]
  18. Segura, M.; Kanninen, M. Allometric models for tree volume and total aboveground biomass in a tropical humid forest in Costa Rica. Biotropica 2005, 37, 2–8. [Google Scholar] [CrossRef]
  19. Brandtberg, T.; Warner, T.; Landenberg, R.; McGraw, J. Detection and analysis of individual leaf-off tree crowns in small footprint, high sampling density LiDAR data from the eastern deciduous forest in North America. Remote Sens. Environ. 2003, 85, 290–303. [Google Scholar] [CrossRef]
  20. Holmgren, J.; Nilsson, M.; Olsson, H. Estimation of tree height and stem volume on plots using airborne laser scanning. For. Sci. 2003, 49, 419–428. [Google Scholar]
  21. McComb, J.W.; Roberts, S.D.; Evans, D.L. Influence of fusing LiDAR and multispectral imagery on remotely sensed estimates of stand density and mean tree height in a managed loblolly pine plantation. For. Sci. 2003, 49, 457–466. [Google Scholar]
  22. Holmgren, J.; Persson, A. Identifying species of individual trees using airborne laser scanner. Remote Sens. Environ. 2004, 90, 415–423. [Google Scholar] [CrossRef]
  23. Popescu, S.C.; Wynne, R.H. Seeing the trees in the forest: Using LiDAR and multispectral data fusion with local filtering and variable window size for estimating tree height. Photogramm. Eng. Remote Sens. 2004, 70, 589–604. [Google Scholar] [CrossRef]
  24. Yu, X.; Hyyppä, J.; Kaartinen, H.; Maltamo, M. Automatic detection of harvested trees and determination of forest growth using airborne laser scanning. Remote Sens. Environ. 2004, 90, 451–462. [Google Scholar] [CrossRef]
  25. Roberts, S.D.; Dean, T.J.; Evans, D.L.; McCombs, J.W.; Harrington, R.L.; Glass, P.A. Estimating individual tree leaf area in loblolly pine plantations using LiDAR-derived measurements of height and crown dimensions. For. Ecol. Manag. 2005, 213, 54–70. [Google Scholar] [CrossRef]
  26. Means, J.E.; Acker, S.A.; Fitt, B.J.; Renslow, M.; Emerson, L.; Hendrix, C.J. Predicting forest stand characteristics with airborne scanning LiDAR. Photogramm. Eng. Remote Sens. 2000, 66, 1367–1371. [Google Scholar]
  27. Næsset, E.; Bjerknes, K.-O. Estimating tree heights and number of stems in young forest stands using airborne laser scanner data. Remote Sens. Environ. 2001, 78, 328–340. [Google Scholar] [CrossRef]
  28. Rönnholm, P.; Hyyppä, J.; Hyyppä, H.; Haggrén, H.; Yu, X.; Kaartinen, H. Calibration of laser-derived tree height estimates by means of photogrammetric techniques. Scand. J. For. Res. 2004, 19, 524–528. [Google Scholar] [CrossRef]
  29. Huang, S.; Price, D.; Titus, S.J. Development of ecoregion-based height–diameter models for white spruce in boreal forests. For. Ecol. Manag. 2000, 129, 125–141. [Google Scholar] [CrossRef]
  30. Hunter, M.O.; Keller, M.; Victoria, D.; Morton, D.C. Tree height and tropical forest biomass estimation. Biogeosciences 2013, 10, 8385–8399. [Google Scholar] [CrossRef]
  31. Hyyppa, J.; Kelle, O.; Lehikoinen, M.; Inkinen, M. A segmentation-based method to retrieve stem volume estimates from 3-D tree height models produced by laser scanners. IEEE Trans. Geosci. Remote Sens. 2001, 39, 969–975. [Google Scholar] [CrossRef]
  32. Persson, A.; Holmgren, J.; Söderman, U. Detecting and measuring individual trees using an airborne laser scanner. Photogramm. Eng. Remote Sens. 2002, 68, 925–932. [Google Scholar]
  33. Lefsky, M.A.; Cohen, W.B.; Acker, S.A.; Parker, G.G.; Spies, T.A.; Harding, D. LiDAR remote sensing of the canopy structure and biophysical properties of Douglas-fir western hemlock forests. Remote Sens. Environ. 1999, 70, 339–361. [Google Scholar] [CrossRef]
  34. Dowling, R.; Accad, A. Vegetation classification of the riparian zone along the Brisbane River, Queensland, Australia using Light Detection and Ranging (LiDAR) data and forward looking digital video. Can. J. Remote Sens. 2003, 29, 556–563. [Google Scholar] [CrossRef]
  35. Lovell, J.L.; Jupp, D.L.B.; Culvenor, D.S.; Coops, N.C. Using airborne and ground-based ranging LIDAR to measure canopy structure in Australian forests. Can. J. Remote Sens. 2003, 29, 607–622. [Google Scholar] [CrossRef]
  36. Lucas, R.M.; Cronin, N.; Lee, A.; Moghaddam, M.; Witte, C.; Tickle, P. Empirical relationships between AIRSAR backscatter and LiDAR-derived forest biomass, Queensland, Australia. Remote Sens. Environ. 2006, 100, 407–425. [Google Scholar] [CrossRef]
  37. Moffiet, T.; Mengersen, K.; Witte, C.; Kinga, R.; Denham, R. Airborne laser scanning: Exploratory data analysis indicates potential variables for classification of individual trees or forest stands according to species. ISPRS J. Photogramm. Remote Sens. 2005, 59, 289–309. [Google Scholar]
  38. Witte, C.; Denham, R.; Turton, D.; Jonas, D.; Tickle, P.; Norman, P. Airborne laser scanning: A tool for monitoring and assessing the forests and woodlands of Australia. In Proceedings of the 10th Australasian Remote Sensing Conference, Adelaide, Australia, 21–25 August 2000; pp. 348–362.
  39. Weller, D.; Denham, R.; Witte, C.; Mackie, C.; Smith, D. Assessment and monitoring of foliage projected cover and canopy height across native vegetation in Queensland, Australia, using laser profiler data. Can. J. Remote Sens. 2003, 29, 578–591. [Google Scholar]
  40. Bunting, P.; Lucas, R.M. The delineation of tree crowns within CASI data of Australian mixed species woodlands. Remote Sens. Environ. 2006, 101, 230–248. [Google Scholar]
  41. Held, A.; Phinn, S.; Scarth, P.; Stanford, M.; Ticehurst, C.; Hartini, S.; Lymburnber, L. Hyperspectral mapping of rainforests and mangroves. In Proceedings of the International Geosciences and Remote Sensing Symposium, Sydney, Australia, 9–13 July 2001.
  42. Tickle, P.K.; Lee, A.; Lucas, R.M.; Austin, J.; Witte, C. Quantifying Australian forest floristics and structure using small footprint LiDAR and large scale aerial photography. For. Ecol. Manag. 2006, 223, 379–394. [Google Scholar]
  43. Lee, A.C.; Lucas, R.M. A LiDAR-derived canopy density model for tree stem and crown mapping in Australian forests. Remote Sens. Environ. 2007, 111, 493–518. [Google Scholar] [CrossRef]
  44. Ozdemir, I. Estimating stem volume by tree crown area and tree shadow area extracted from pan-sharpened Quickbird imagery in open Crimean juniper forests. Int. J Remote Sens. 2008, 29, 5643–5655. [Google Scholar] [CrossRef]
  45. Greenberg, J.A.; Dobrowski, S.Z.; Ustin, S.L. Shadow allometry: Estimating tree structural parameters using hyperspatial image analysis. Remote Sens. Environ. 2005, 97, 15–25. [Google Scholar] [CrossRef]
  46. Verma, N.K.; Lamb, D.W.; Reid, N.; Wilson, B. An allometric model for estimating DBH of isolated and clustered Eucalyptus trees from measurements of crown projection area. For. Manag. 2014, 326, 125–132. [Google Scholar] [CrossRef]
  47. Verma, N.; Lamb, D.W.; Reid, N.; Wilson, B. A comparative study of land cover classification techniques for ‘farmscapes’ using very high-resolution remotely sensed data. Photogramm. Eng. Remote Sens. 2014, 80, 461–470. [Google Scholar]
  48. Lamb, D.W.; Trotter, M.; Murphy, A.; Young, I. UNE SMART Farm: Showcasing the value of broadband connectivity in the business and lifestyle of farming. In Proceedings of the Digital Rural Futures Conference, University of New England, Australia, 26–28 June 2013.
  49. Sumida, A.; Komiyama, A. Crown spread patterns for five deciduous broad-leaved woody species: Ecological significance of the retention patterns of larger branches. Ann. Biol. 1997, 80, 759–766. [Google Scholar] [CrossRef]
  50. Dash, J.; Steinle, E.; Singh, R.P.; Bahr, H.P. Automatic building extraction from laser scanning data: An input tool for disaster management. Adv. Space Res. 2004, 33, 317–322. [Google Scholar] [CrossRef]
  51. Ryherd, S.; Woodcock, C. Combining spectral and texture data in the segmentation of remotely sensed images. Photogramm. Eng. Remote Sens. 1996, 62, 181–194. [Google Scholar]
  52. Baatz, M.; Schape, A. Multiresolution segmentation—An optimization approach for high quality multi-scale image segmentation. In Angewandte Geographische Informationsverarbeitung XII, Beitra¨ge zum AGIT-Symposium Salzburg; Wichmann: Heidelberg, Germany, 2000; pp. 12–23. [Google Scholar]
  53. Benz, U.C.; Hoffmann, P.; Willhauck, G.; Lingenfelder, I.; Heynen, M. Multi-resolution object-oriented fuzzy analysis of remote sensing data for GIS-ready information. ISPRS J. Photogramm. Remote Sens. 2004, 58, 239–258. [Google Scholar]
Figure 1. Flow diagram for canopy volume estimations.
Remotesensing 08 00388 g001
Figure 2. Schematic diagram indicating canopy dimensions required to estimate canopy volume.
Remotesensing 08 00388 g002
Figure 3. Location map of the study site in north-eastern NSW, Australia. Source: open access data.
Remotesensing 08 00388 g003
Figure 4. Tree dimensions (total tree height and trunk height) from FUSION/LDV software. The colours green, yellow and red represents the canopy at different heights. Blue represents ground level.
Remotesensing 08 00388 g004
Figure 5. Contrast split segmentation steps applied on single band canopy height model (CHM) image to splits bright and dark objects based on a threshold that maximized the contrast between the resulting bright and dark objects.
Remotesensing 08 00388 g005
Figure 6. An example of the (a) LiDAR-derived canopy height model; and (b) the segmentation results.
Remotesensing 08 00388 g006
Figure 7. Scatterplot between canopy volume (CVfield), calculated using Equation (1), and measured crown diameter (CDfield). The solid curve is the best-fit, polynomial regression equation.
Remotesensing 08 00388 g007
Figure 8. Scatterplot between canopy volume (CVfield), as calculated using Equation (1), and measured crown projected area (CAfield) derived from field measurements. The solid curve is the best-fit, polynomial regression equation.
Remotesensing 08 00388 g008
Figure 9. Scatterplots of canopy volume from WV2 using (a) crown projected area (CA); and (b) crown diameter (CD) with crown volume (CV) as the predictor variable from field measurements. The dashed lines are the 1:1 equivalence between measured and predicted values and the solid lines the best-fit regression curves (power and polynomial, respectively).
Remotesensing 08 00388 g009
Figure 10. Scatterplot between canopy volume predicted using the LiDAR-derived values of canopy height and crown diameter (Equation (1)) and the field measured values. The dashed line is the 1:1 equivalence between measured and predicted values and the solid line is the best-fit regression curve (polynomial).
Remotesensing 08 00388 g010
Figure 11. Scatterplots of (a) LiDAR-derived crown diameter and field measurements; and (b) LiDAR-derived canopy height and field measurements. The dashed lines are the 1:1 equivalence between measured and derived values and the solid lines the best-fit regression curves (liner and polynomial, respectively).
Remotesensing 08 00388 g011
Table 1. LiDAR data acquisition parameters.
ParameterValueUnit
Scanning angle60degrees
Flight speed216km∙h−1
Flight height375m
Scan rate192Hz
Pulse rate400kHz
Swath width433m
Swath overlap37%
Along track point spacing0.31m (along track)
Across track point spacing0.31m (across track)
Outgoing pulse density10.26m−2
Calculated spot footprint0.19metres
Table 2. Summary statistics for single trees from field measurements; n = 79 was the number of trees used in model development.
Tree CharacteristicsMinMaxMeanStd.Dev.
Crown diameter (CDfield, m)6.830.515.24.9
Crown projected area (CAfield, m2)36.3731.8210.4129.1
Tree height (m)12.742.821.35.3
Canopy height (m)8.830.616.14.1
Trunk Height (m)3.616.25.22.6
Canopy vol. (CVfield, m3) (Equation (1))217.99040.81840.21533.1
Table 3. Derived best-fit regression parameters for calculating canopy volume (CVfield) from Equation (1) using field measurements of crown projected area (CAfield) and crown diameter (CDfield). Multiplier value = 0.3927 (n = 79).
EquationR2F-statp
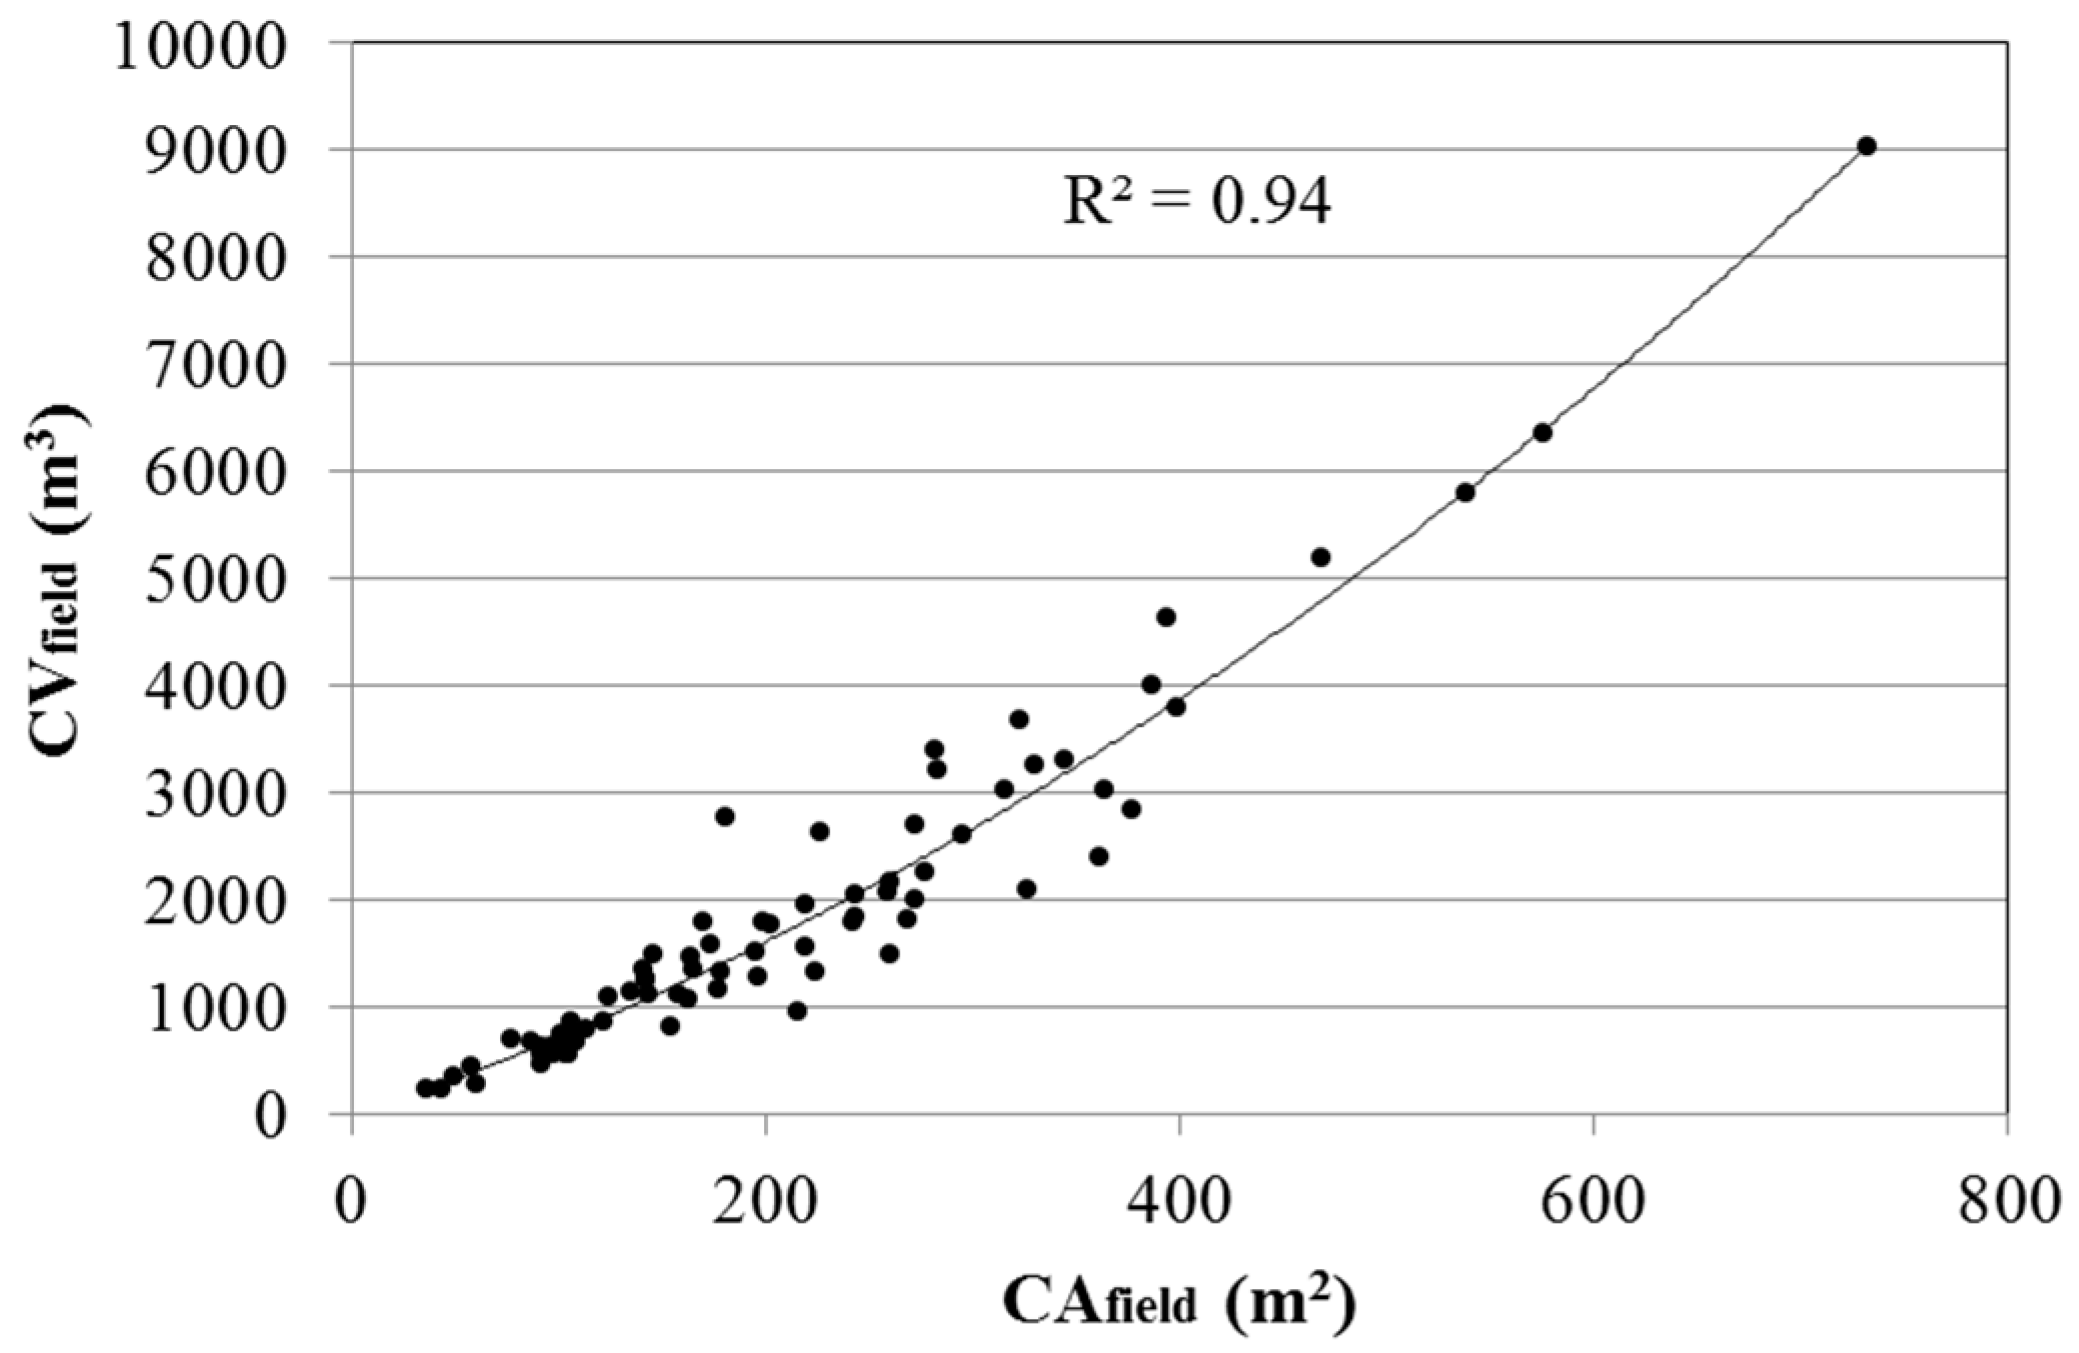
CVfield = 0.008 × (CAfield)2 + 6.5673 × CAfield – 25.1990.93993.0<0.0001
CVfield = 15.11 × (CDfield)2 – 218.58 × CDfield + 1222.60.94415.6<0.0001

