Technical Note

A Multi-Data Source and Multi-Sensor Approach for the 3D Reconstruction and Web Visualization of a Complex Archaelogical Site: The Case Study of “Tolmo De Minateda”

by
Jose Alberto Torres-Martínez
1,*,
Marcello Seddaiu
2,
Pablo Rodríguez-Gonzálvez
1,
David Hernández-López
3 and
Diego González-Aguilera
1
1
Department of Cartographic and Land Engineering, High School of Ávila, University of Salamanca, 37008 Salamanca, Spain
2
Dipartimento di Storia, Scienze dell’ Uomo e della Formazione, Università degli Studi di Sassari, 07100 Sassari, Italy
3
Regional Development Institute-IDR, University of Castilla-La Mancha, Albacete 02071, Spain
*
Author to whom correspondence should be addressed.
Submission received: 9 May 2016 / Revised: 6 June 2016 / Accepted: 24 June 2016 / Published: 29 June 2016

Abstract

:
The complexity of archaeological sites hinders creation of an integral model using the current Geomatic techniques (i.e., aerial, close-range photogrammetry and terrestrial laser scanner) individually. A multi-sensor approach is therefore proposed as the optimal solution to provide a 3D reconstruction and visualization of these complex sites. Sensor registration represents a riveting milestone when automation is required and when aerial and terrestrial datasets must be integrated. To this end, several problems must be solved: coordinate system definition, geo-referencing, co-registration of point clouds, geometric and radiometric homogeneity, etc. The proposed multi-data source and multi-sensor approach is applied to the study case of the “Tolmo de Minateda” archaeological site. A total extension of 9 ha is reconstructed, with an adapted level of detail, by an ultralight aerial platform (paratrike), an unmanned aerial vehicle, a terrestrial laser scanner and terrestrial photogrammetry. Finally, a mobile device (e.g., tablet or smartphone) has been used to integrate, optimize and visualize all this information, providing added value to archaeologists and heritage managers who want to use an efficient tool for their works at the site, and even for non-expert users who just want to know more about the archaeological settlement.

Graphical Abstract

1. Introduction

Several techniques have been applied thus far for the 3D reconstruction and visualization of archaeological settlements based on the use of close-range photogrammetry [1,2], terrestrial laser scanner (TLS) [3,4] or unmanned aerial vehicles (UAV) [5]. However, due to the inherent complexity of these sites, several problems arise when 3D reconstruction of these sites is mandatory and just one type of geotechnology is applied. For instance, aerial photogrammetry exhibits problems reconstructing vertical planes, common in archaeological sites, whereas terrestrial laser scanners or terrestrial photogrammetry could provide good results. However, these terrestrial techniques are subject to problems with horizontal surfaces or elevated areas. Other authors have explored multi-data and multi-sensor approaches to record and reconstruct complex archaeological sites. Recently in [6], the potential of this type of hybrid approach is shown for the analysis and interpretation of 3D/4D information applied to archaeological settlements. In order to guarantee geometric and radiometric quality, a combination of TLS and terrestrial photogrammetry is used and applied, enabling the monitoring of the settlement based on a volume analysis. However, this approach has problems related to the recording of more elevated areas. In order to solve this limitation, in [7], the authors use an aerial multi-sensor approach for the 3D reconstruction and visualization of archaeological settlements which provides a very good coverage of those elevated areas. The quality and precision of the TLS and UAV registration has been outlined in [8] where authors reconstruct the interior and exterior of the Church of Santa Barbara (Italy) after the earthquake it suffered in 2012. Trying to overcome the main UAV limitations, payload and autonomy, other authors have proved that low-cost manned platforms such as the paratrike can be an efficient solution for the recording of large sites [9], including archaeological sites [10], and allowing to put on board multiple sensors such as thermographic or multispectral cameras [11]. In those cases where the archeological site is complex and subterranean, other hybrid, dynamic and terrestrial approaches could be interesting. Unfortunately, there are not many mobile laser scanners, photogrammetric or hybrid systems for subterranean sites available in the market [12,13], even less specific for the field of archaeological recording. Some authors such as Canter et al. [14] have developed indoor mapping systems for the generation of indoor cartography from accurate geospatial information. The main advantage of these systems is that they integrate high-precision GNSS with advanced inertial technology (accelerometers and gyroscopes) for the geo-referencing of the site using measures from its exterior, apart from an Applanix POS system for positioning and orientation that provides uninterrupted measurements of the true position, roll, pitch and yaw of the vehicle moving indoors. Other authors have advanced more sophisticated systems based on a wheeled mobile robot and a multi-sensor global registration approach [15]. In particular, a geometric model to derive depth information is proposed based on a registration of heterogeneous 3D data arising from eight ultrasonic sonars, one TLS and three visual sensors.
It thus becomes clear that with the advances in multi-sensor and multi-data from different sources, data integration has become as a valuable tool in archaeological applications. The main objective of multi-sensor data integration is to register sensor data from different sources—with different characteristics, resolution, and quality in order to provide more reliable, accurate, and useful information required for diverse archaeological applications. In addition, this multi-data and multi-sensor integration can be improved through 3D geographical information systems (3DGIS) together with the final presentation of the products based on 3D Web.
The goal of this study is to propose a multi-data source and multi-sensor workflow in order to obtain high quality archaeological products, contributing to the robust interpretation of the observed objects/scenes and providing the basis of effective planning and decision making, essential in archaeology. To this end, terrestrial scans and images will be registered with aerial images acquired from a paratrike and an unmanned aerial vehicle (UAV). The methodology employed for data processing has been extensively tested by several authors. In [16], the authors employed computer vision algorithms for image-based modelling from aerial imagery and point cloud generation in urban environments, which are similar to those used in this work.
To carry out studies of characterization, measurement and analysis of the surface and the elements presented in the site, the geometrical information (acquired with geomatic sensors) is combined with other available thematic data such as photographs, sketches, restoration reports, schedules, etc. in a 3DGIS, Geoweb3D® [17]. In this way, a description of the site through time is possible. Also, the availability of the three-dimensional information of the settlement through the Web using mobile devices provides added value for archaeologists and heritage managers, simplifying the data acquisition, as well as its analysis in the field. Moreover, the centralization of the information and its external storage means it becomes available to different experts and organizations. Last but not least, the knowledge of the settlement is open to the general public based on an easy-to-use interface which integrates different 2D and 3D resources.
In this study, a specific simplification and optimization procedure was implemented to visualize the different 3D products through the Web using mobile devices and the Open Source library Cesium [18], developed by the company Analytical Graphics, Inc. (AGI, Greenbelt, MD, USA) [19]. Other authors [20] have developed similar works using their own system, SGIS3D, which uses VRML (Virtual Reality Modeling Language) format. However, one of the main limitations of this language is the mandatory use of plugins, as well as its lack of optimization through the graphical processing unit (GPU), crucial in those steps related to texture mapping. Another similar approach in the archaeological field is developed by [21], who implements a spatial data infrastructure known as QuaeryArch3D and applied it to the archaeological settlement of “Maya de Copan” in Honduras, a UNESCO World Heritage Site. In this case, they use the Open Source PostgreSQL and PostGIS for the integration and management of information in the database, whereas the 3D visualization is performed with Unity. However, one of the main limitations of Unity is dealing with huge 3D models coming from the point clouds. To overcome this problem, WebGL seems to provide an appropriate solution using similar developments to those presented in [22] or developing a new approach as the one presented in this paper. Furthermore, advancing a 3DGIS Web solution requires using different simplification and optimization processes, as well as different hierarchical (i.e., pyramidal) strategies for visualization which are not compatible with the Unity engine.
This paper is organized as follows: after this introduction, in Section 2, the different sensors employed and their characteristics are detailed. In Section 3, the proposed multi-data source and multi-sensor approach is described, as well as the simplification and optimization process. Experimental results are shown and discussed in Section 4. Conclusions and future directions are given in Section 5. Finally, two appendices are included; the first corresponding to the abbreviations used in the paper, whereas the second encompasses the explanation of the methodology employed for 3D Web visualization.

2. Materials

2.1. Paratrike

The main aerial platform employed to the documentation of the archaeological site was a paratrike (Figure 1a). It is a low-cost aircraft with more flexibility than conventional aircrafts, and more autonomy and payload capacity than the UAVs. This last characteristic allows the possibility of boarding better sensors than the UAVs, or even multiple sensors in a stabilized gimbal (MUSAS-MUltiSpectral Airborne Sensors). In particular, a tandem trike AIRGES (Table 1) was used to map the whole archaeological site following a vertical flight and using a full-frame reflex camera.
The use of the gyro-stabilized camera platform, MUSAS (Figure 1b), guarantees the accurate orientation of the camera according to the flight planning by two servomotors arranged on the x and y axes, controlled by an Arduino board, which incorporates an IMU with 6 degrees of freedom: three accelerometers, a double-shaft gyroscope (for pitch and roll) and an additional gyroscope for yaw.
For the paratrike, a full-frame reflex camera, Canon 5D MkII, with a fixed focal length to achieve a GSD of 3 cm, was used. This camera was also used for the terrestrial photogrammetry and photorealistic texture mapping due to its better image quality.
In contrast to the UAV platform which encloses an integrated navigation system (GPS, IMU and barometric altimeter), the paratrike requires an external set of sensors in order to provide navigation capabilities and thus fulfill photogrammetric constraints for data acquisition. In particular, the planimetric position is provided by a GPS antenna (Trimble Bullet III), installed in the camera platform close to the optical centre of the camera, connected to a mono-frequency receiver Ublox EVK-6T-0. This system yields an absolute precision of ±9 m on the horizontal axis for 95% of the time [23]. During data acquisition the pilot follows the planned photogrammetric mission in a rugged table connected to the GPS system, where the real-time track is contrasted with the planned flight. The final component in the navigation system, the altimetry, which affects the GSD, is controlled by an altimetric barometer (DigiFly VL100) with an absolute precision of ±8 m. This solution is chosen instead of GPS receiver, since the absolute altimetric GPS precision is just ±15 m.

2.2. Unmanned Aerial Vehicle

For the aerial photogrammetric acquisition in the “El Reguerón” site, the paratrike platform was rejected due to the morphological characteristics of the terrain and the height of flight required to reach the high spatial resolution (GSD of 1 cm). The main drawback was the need to vary the flying height to keep the same scale, due to the presence of high reliefs along the strips. As an additional disadvantage, the walled constructions were occluded between walls of natural rock. Therefore, in order to complete the archaeological site documentation, a UAV was employed. Specifically, a Microdrone md4-200 (Table 2) was used (Figure 1c) to map the most challenging area following vertical and oblique flights through use of a compact camera.
In spite of the manoeuvrability provided by this UAV, it has a limited payload required to employ a compact camera for the photogrammetric flight.
For the UAV, an ultra-compact camera, Canon IXUS 115 HS, was chosen allowing a GSD of 1 cm.
Basically, the multi-data obtained by UAV and paratrike is geometrical, i.e., two point clouds with metric properties and texture information (RGB) which are homogenized under a common reference system based on a network of control and check points.

2.3. Terrestrial Laser Scanner

In those complex zones, a phase shift terrestrial laser scanner, Faro Focus 3D, was employed (Table 3).
According to the archaeological settlement characteristics and the TLS technical specifications, laser stations were established in a network that guaranteed an average spatial resolution of 5 mm for the whole scenario. The mean distance acquisition was 15 m.

2.4. Geo-Referencing System

The establishment of the mapping frame in the study area is performed with two GNSS bi-frequency (L1, L2) receivers, Topcon manufacturer. The GNSS observation method was real-time kinematic (RTK) getting a relative and absolute precision of 1 cm and 3 cm, respectively.
The coordinate reference system was comprised of the official coordinate system established by Spanish law, a Compound Coordinate Reference System (CCRS) integrated by horizontal CRS referred to ETRS89 geodetic reference system and UTM Zone 30 mapping projection (EPSG: 25830), and vertical CRS with geoid´s origin defined in Alicante (Spain) (EPSG: 5782). This mapping frame was materialized by a GNSS surveyal using natural features for “El Reguerón” area, which could be clearly identified on aerial images (e.g., corners of well-defined objects, small features with excellent contrast, etc.). In this way, we avoid artificial targets appearing in those more emblematic parts of the archaeological settlement. On the contrary and due to the large extension area, artificial targets were used for the full recording of the archaeological settlement (with the paratrike) in order to establish a network of control and checkpoints.

3. Methodology

Given the complexity of the archaeological site and the archaeological documentation requirements, the aerial and terrestrial data acquisition was planned in order to provide an integral and integrated recording of the site.
All the data from the different sensors and plataforms were processed according to the workflow outlined in Figure 2 and explained in the following subsections.

3.1. Data Acquisition

Each technique (i.e., photogrammetry, laser scanning) requires different procedures and protocols for data acquisition.
In the case of aerial data acquisition, image projection centers and camera attitude must be previously defined according to the classical photogrammetric parameters. The flight planning was done using the in-house software, MFlip and PFlip, for the UAV and paratrike flights, respectively [24]. The main difference between both flights was the type of flight planning: for the paratrike, a standard stereoscopic photogrammetric flight was undertaken (Figure 3a), whereas for the case of UAV, oblique and vertical images were also considered. Therefore, data acquisition was completely planned in order to get better results. In particular, for the UAV, a script was prepared for an automatic photogrammetric flight; whereas for the paratrike, the flight axis and flight height were planned and followed by the pilot. Both flights were planned with higher overlaps in order to get better results in the dense matching process and both flights were planned considering the relief variation using a public digital terrain model (DTM) [24].
The result shown in Figure 3b corresponds to the UAV flight planning, which was complemented with oblique aerial images acquired manually. As can be seen through the image footprints, the relief effects make it difficult to maintain a constant GSD, so the data acquisition is complemented with terrestrial images. For its part, the paratrike was used for the whole recording of the settlement due to the autonomy and sensors limitations of the UAV.
For the “El Reguerón” area a more detailed flight with the UAV was designed using the ultra-compact camera.
An important issue for the aerial data acquisition was the image sharpness, which affects the final photogrammetric reconstruction. This issue is affected by the camera parameters (i.e., aperture, shutter time and sensibility), the platform performance (i.e., flight speed and efficiency of the stabilized gimbal to absorb the paratrike vibrations) and the scenario illumination conditions. The flight was executed on a cloudy day to avoid shadows being projected, and the camera sensibility and shutter time were set up for these conditions. The aperture and the focal length were fixed constant to avoid variations in the internal camera parameters.
As commented previously, the high vertical reliefs of the site and the level of detail required in some areas (e.g., those constructive elements that integrate the defensive system of the entrance, details of the walls, etc.) entailed that aerial images were not suitable; terrestrial images were thus acquired with the full-frame reflex camera. In addition, terrestrial laser scans were used in those complex areas where photogrammetry could entail problems requiring a lot of images to enclose the whole geometry or due to the presence of textureless objects or materials. A network of 13 TLS stations (Figure 4) was designed for an average distance of 15 m with an average spatial resolution of 5 mm.
From Figure 4, it can be observed that two laser scanning campaigns were planned for two different areas. The first campaign (orange colour) was designed for recording the existing constructions using six stations. The second campaign (blue colour) was designed for recording the walls of “El Reguerón” and the adjacent environment using seven stations.

3.2. Data Processing

Handling multiple sensors requires multi-data processing approaches that take the point cloud as the basic unit. However, since all data must be integrated to generate a single model, it is necessary to homogenize the information, establishing filtering, simplification and optimization algorithms. Thus, the result obtained by each method is the corresponding point cloud that will be registered, triangulated and textured for generating a single 3D model with metric and radiometric capabilities.

3.2.1. TLS Filtering and Alignment

Data acquired with TLS were processed with commercial software FARO SCENE 5.4 [25]. The raw TLS scans were filtered removing noise and undesired information which could affect the alignment process. Automatic filtering has been applied in those more conflictive areas. Firstly, each scan was filtered according to a distance threshold (20 m) in order to remove distant points. Afterwards, two specific filters (intense-based filter and outlier filter) were applied. The former applies a reflectance threshold to remove those points with the lowest intensity, whereas the latter analyses the point and its environment (3 × 3) using distances. For instance, if there is a distance variation of 1 cm between the point and its neighbourhood for more than the 50% of the neighbourhood, the point will be removed. These thresholds should be tested adaptively by the user depending on the type and geometry of the area. Finally, the more delicate areas (i.e., walls or vegetation) have been filtered manually. For instance, vegetation between the blocks of the wall was identified and removed manually.
Since artificial targets were not used, scan alignment was done by a solid rigid transformation of an iterative closest point (ICP) technique [26]. This iterative process was applied in pairwise stations, so the final a priori error was computed on the basis of the number of stations and the technical specifications of the TLS (Table 4) reaching 1.3 cm for the assumption of two consecutive overlapping point clouds. The reference system of the aligned TLS point cloud is defined through a local Cartesian system corresponding to the first scan station with coordinates (300,000, 4,000,000, 1000).

3.2.2. Photogrammetric Processing

The generation of the dense point cloud, from both aerial and terrestrial images, was automatized through the Photogrammetry Workbench (PW) in-house software [27], following a three step workflow: 1. Image registration; 2. Camera orientation and 3. Dense matching.
The aerial images, coming from the paratrike and UAV, were processed to generate a hybrid model, with a total of 293 images and two different cameras. The dataset was checked to assure the sharpness of the images, which could be decreased by the motion blur.
  • The feature extraction has been carried out by the ASIFT (Affine Scale-Invariant Feature Transform) algorithm [28]. As its most remarkable improvement, ASIFT includes the consideration of two additional parameters that control the presence of images with different scales and rotations. In this manner, the ASIFT algorithm can cope with images displaying a high scale and rotation difference, common in oblique images. The result is an invariant algorithm that considers the scale, rotation, and movement between images. The main contribution in the adaptation of the ASIFT algorithm is its integration with robust strategies that allow us to avoid erroneous correspondences. These strategies are the Euclidean distance [29] and the Moisan-Stival ORSA (Optimized Random Sampling Algorithm) [30]. This algorithm is a variant of Random Sample Consensus (RANSAC) [31] with an adaptive criterion to filter erroneous correspondences by the employment of the epipolar geometry constraints. Once the feature points have been extracted and described, the final matching points are assessed based on their spatial distribution on the CCD. An asymmetric distribution (radial and angular) of matching points regarding the principal point will affect the correct determination of internal camera parameters and also the image orientation. Therefore, if the matching points do not cover an area more than two-thirds of the CCD format, the user will be alerted in order to modify the detector (ASIFT) and descriptor (SIFT) parameters. Through this quality control we try to minimize problems associated with the weakness and common deficiencies in the photogrammetric network geometry of both aerial flights (UAV and paratrike).
This result provides the next expression:
A F = [ a b c d ] = H λ R 1 ( κ ) T 1 R 2 ( ϖ ) = λ [ cos κ sin κ sin κ cos κ ] [ t 0 0 1 ] [ cos ϖ sin ϖ sin ϖ cos ϖ ]
where AF is the affinity transformation that contains scale, λ, rotation, κ, around the optical axis (swing) and the perspective parameters that correspond to the inclination of the camera optical axis, φ (tilt) or the vertical angle between optical axis and the normal to the image plane; and ϖ (axis), the horizontal angle between the optical axis and the fixed vertical plan.
In order to accelerate the process, the overlapped aerial images were identified by their approximate camera orientations provided by the navigation system. In the case of terrestrial images, an all-to-all comparison was applied. This sub-step is a time-consuming process which increases exponentially with the number of images [32].
2.
The multi-image protocol acquisition will require robust orientation procedures. For this purpose, a combination between computer vision and photogrammetric strategies was used. This combination is fed by the resulting keypoints extracted previously. In a first step, an approximation of the external orientation of the cameras was calculated following a fundamental matrix approach [33]. Later, these spatial (X,Y,Z) and angular (ϖ-omega, φ-phi, and χ-kappa) positions are refined by a bundle adjustment complemented with the collinearity condition [34]. In this field, several open source tools have been developed such as Bundler [35] and Apero [36]. For the present case study, both were combined and integrated. In particular, a specific converter has been developed for reading Bundler orientation files (*.out) and computing the three rotation angles and three translation coordinates of the camera in Apero. In addition, a coordinate system transformation has been implemented for passing from the Bundler to the Apero coordinate system. It is remarkable that at the same time, thanks to the reliability of the photogrammetric procedures used, it is possible to integrate as unknowns several internal camera parameters (focal length, principal point, and radial distortions). This possibility allows the use of non-calibrated cameras and guarantees acceptable results. For the present case study, a self-calibration strategy supported by a basic calibration model which encloses five internal parameters (focal length, principal point, and two radial distortion parameters) was used [37,38]. In order to provide metric capabilities to the model, manual identification of ground control points (GCPs) in the images were accomplished. Including these as an input in the bundle adjustment, the model is oriented according to the global coordinate system.
( x - x 0 ) + Δ x = f r 11 ( X S X ) + r 21 ( Y S Y ) + r 31 ( Z S Z ) r 13 ( X S X ) + r 23 ( Y S Y ) + r 33 ( Z S Z ) ( y - y 0 ) + Δ y = f r 12 ( X S X ) + r 22 ( Y S Y ) + r 32 ( Z S Z ) r 13 ( X S X ) + r 23 ( Y S Y ) + r 33 ( Z S Z )
where x and y are the known image coordinates, Xi, Yi and Zi are the corresponding known GCPs, rij are the unknown 3 × 3 rotation matrix elements, SX, SY and SZ represent the unknown camera position, f is the principal distance, x0 and y0 are the principal point coordinates and ∆x and ∆y are the lens distortion parameters. These internal camera parameters may be known or unknown by the user and thus are introduced as equations or unknowns (self-calibration), respectively.
3.
One of the greatest breakthroughs in recent photogrammetry has been exploiting, from a geometric point of view, the image spatial resolution (size in pixels). This has made it possible to obtain a 3D object point of each of the image pixels. Different strategies have emerged in recent years, such as the Semi-Global Matching (SGM) approach [39] that allows the 3D reconstruction of the scene, in which an object point corresponds with a pixel in the image. These strategies, fed by the external and internal orientations and complemented by the epipolar geometry, are focused on the minimization of an energy function [39]. However, besides the classical SGM algorithm based on a stereo-matching strategy, multi-view approaches are incorporated in order to increase the reliability of the 3D results and to better cope with the case of complex archaeological sites (where the images are captured with different sensors). Considering the two types of flights performed (UAV and paratrike), two different multi-view algorithms were used. For the vertical flight (paratrike), the multi-view MicMac algorithm [40] was used. Meanwhile, for the oblique flight (UAV), the multi-view SURE algorithm [41] was used, which allows a complete reconstruction of the scene. Both strategies consist of minimizing an energy function throughout the eight basic directions that a pixel can take (each 45°). This function is composed of a function of cost, M (the pixel correspondence cost), that reflects the degree of the similarity of the pixels between two images, x and x’, together with the incorporation of two restrictions, P1 and P2, to show the possible presence of gross errors in the process of SGM. In addition, a third constraint has been added to the process of SGM; it consists of the epipolar geometry derived from the photogrammetry, and it can enclose the search space of each pixel in order to reduce the enormous computational cost. In that case, it will generate a dense model with multiple images, obtaining more optimal processing times.
E ( D ) = x ( M ( x , D x ) + x ' N x P 1 T [ | D x D x ' | = 1 ] + x ' N x P 2 T [ | D x D x ' | > 1 ] )
where E(D) is an energy function that must be minimized on the basis of the disparity (difference of correspondence) through the counterpart characteristics, the function M (the pixel correspondence cost) evaluates the levels of similarity between the pixel x and its counterpart x’ through its disparity Dx, while the terms P1 and P2 correspond with two restrictions that allow for avoiding gross errors in the dense matching process for the disparity of 1 pixel or a larger number of them, respectively.

3.2.3. Data Fusion

Data fusion has been performed homogenizing the data provided for each sensor and generating a common product, a point cloud, with metric properties’ multi-resolution and photorealistic texture. Concretely, in order to fuse data, both flights (UAV and paratrike) were solved under a combined photogrammetric bundle adjustment using common control points and two different cameras. Through this combined bundle adjustment, a better and more homogeneous aerial photogrammetric point cloud is obtained, avoiding errors that would be obtained and propagated using a solid rigid transformation. In particular, the combined bundle adjustment (UAV-uav and paratrike-pt) is solved through a least square adjustment based on collinearity condition Equation (2), as follows:
x = x ( c ¯ p t ,   c ¯ u a v , e o ¯ p t   i ,   e o ¯ u a v   j ,   X ¯ k ) y = y ( c ¯ p t ,   c ¯ u a v , e o ¯ p t   i ,   e o ¯ u a v   j   ,   X ¯ k )
where:
  • c ¯ p t   a n d   c ¯ u a v are the camera vectors used for paratrike and UAV, respectively, and which include the internal camera parameters (principal point and focal length) and lens distortion coefficients (radial-K, decentering-P and affinity parameters-b). A total of ten unknowns were used for each camera vector, c ¯ = ( x 0 ,   y 0 , f ,   K 1 ,   K 2 ,   K 3 , P 1 ,   P 2 , b 1 , ,   b 2 ) .
  • e o ¯ p t   i    a n d    e o ¯ u a v   j correspond with the six unknowns of the external orientation for paratrike and UAV images, respectively. Being the external orientation vector, e o ¯ = ( S x ,   S y ,   S z ,   ω ,   φ ,   χ ) .
  • X ¯ k represents the spatial coordinates vector (X,Y,Z) of the unknown object points.
Therefore, the equation system is defined as follows:
A x K = V
where A corresponds with the design matrix based on collinearity equations and linearized through a first-order Taylor series, K is the observations matrix, V is the residual vector and x is the unknown’s vector solved through a least squares adjustment as follows:
x = ( A T P A ) 1 A T P K  
P is the weight matrix which corresponds with the inverse cofactor matrix of the observations. The equation system is solved through a twofold step: first by computing the exterior orientation parameters, e o ¯ ,   and then computing the object points, X ¯ k , that represent the point cloud.
Next, the remaining step is the registration of the aerial point clouds derived from the different sensors under a global coordinate system. To this end, a GNSS campaign of 3 h based on three permanent ERGNSS stations was performed in order to provide precise coordinates to the GNSS base station used in the archaeological settlement. GNSS observations were processed guaranteeing an absolute error of 3 cm. The RTK surveying of the GCPs allowed us to obtain the aerial point cloud (i.e., coming from UAV and paratrike) under a global coordinate system (EPSG: 25830 and height EPSG: 5782), reaching a final relative precision of 1 cm.
Finally, regarding terrestrial laser scanner (TLS), the different scans were aligned and then co-registered with the photogrammetric point cloud coming from UAV and paratrike, using matching points defined manually as initial approximations. This was carried out using each dataset of coordinates in its coordinate system, that is, the local system in the case of the aligned TLS point cloud and the absolute system for the photogrammetric point cloud, and then applying a variation of the ICP technique, Least Squares Matching (LSM). A figure (Figure 5) to visually illustrate how this fusion has been done is included. A is the function that represents the point cloud coming from the aerial photogrammetry (UAV and paratrike) and B is the function that represents the aligned TLS point cloud, the registration of both point clouds will be obtained as follows:
A i ( x , y , z )   e i ( x , y , z ) = B j ( x , y , z )   i , j = 1 , , n   , i j
The equation that relates both models is a solid rigid transformation with seven parameters:
[ X A Y A Z A ] =   R [ X B Y B Z B ] + [ T x T y T z ]
where R represents the rotation matrix and T the translation vector. The correspondence between both point clouds is obtained through a minimisation, based on least squares adjustment, of the Euclidean distances between both point clouds. Since the rotation matrix is composed of non-linear functions, first-order Taylor series were used for the linearization of the Equation (8) as follows:
e i ( x , y , z ) = B j 0   ( x , y , z ) + B j 0 ( x , y , z ) x j d x j +   B j 0 ( x , y , z ) y j d y j +   B j 0 ( x , y , z ) z j d z j   A i 0   ( x , y , z ) A i 0 ( x , y , z ) x i d x i   A i 0 ( x , y , z ) y i d y i   A i 0 ( x , y , z ) z i d z i
where:
d x = d t x +   a 10 d m +   a 11 d ω +   a 12 d φ +   a 13 d κ d y = d t y +   a 20 d m +   a 21 d ω +   a 22 d φ +   a 23 d κ d z = d t z +   a 30 d m +   a 31 d ω +   a 32 d φ +   a 33 d κ
Through an iterative process, the linear system e = A x l is solved, x being the unknown’s vector encompassing the transformation parameters ( d t x , d t y , d t z ,   d m ,   d ω ,   d φ ,   d κ ), whereas l is the observation vector enveloping the discrepancies of Euclidean distances between both point clouds, and e is the residual vector.
Figure 5 graphically outlines the process followed for data fusion. An example of the aligned TLS point clouds for two scans of the wall (yellow and blue point clouds) in a local coordinate system is outlined to the left side of the image. Subsequently, the aligned TLS point clouds are fused with the photogrammetric point cloud in a global coordinate system (green point cloud) by means of LSM.

3.2.4. Post-Processing

Once a metric and geo-referenced point cloud was generated, a mesh strategy was applied to generate the digital surface model (DSM). In this case, the incremental Delaunay triangulation algorithm was applied [42].
To improve the model quality, break lines were incorporated as geometric constraints. Break lines were manually restituted by the operator. Its use is relevant for the accurate representation of significant slope changes, as well as for correctly defining the defensive walls of the site.
In those cases where images come from different methodologies or acquisition time, a radiometric adjustment was necessary to improve the final model visualization and avoid abrupt radiometric changes in the texture.
Once the DSM was obtained, it was possible to generate a true orthoimage from the oriented images. Since the multi-data source and multi-sensor approach provide different DSM resolutions, it was possible to generate true orthoimages with different spatial resolutions. For instance, a true orthoimage that depicts the complete archaeological site was generated with a resolution of 10 cm; whereas a 2 cm spatial resolution was employed for the settlement entrance area in order to appreciate the construction features.

3.2.5. Simplification and Optimization

Different simplification and optimization strategies were applied to the different geomatics products (DSM and orthoimages) in order to access and analyse 2D and 3D information through a Web service using mobile devices such as tablets or smartphones. In particular, a pyramidal structure was generated for the Web visualization of the 2D orthoimages and 3D models, including “El Reguerón” as the area with the most resolution. The methodology used for simplifying the 3D models is based on the strategy “smooth looking” [43] which consists in a straightforward mesh generation procedure applying the Poisson algorithm [44] to the hybrid point cloud. The mesh resolution is determined by the octree level, chosen according to the user-defined spatial resolution. Unlike a direct mesh generation process, which usually requires mesh editing operations such as filtering and refinement [45,46], Poisson algorithm directly encloses a smoothing step and provides a continuous geometry. This process could be controlled by some computation parameters as the minimum number of sample points that should fall within a node of the resulting octree. This parameter controls the loss of detail by the smoothing process. Although a high number of sample points implies a decrease of the number of mesh vertices, its geometry could be affected, being the final mesh mildly shrunk. For this reason, and as the noise level of the hybrid point cloud is low, the threshold value was kept low in order to avoid redundant smoothing processes. Then, a mesh optimization strategy, based on reducing the final number of triangles through the “collapse” of non-relevant areas without losing significant level of detail, is performed. For this purpose, an iterative process is proposed where the mesh derived from the previous procedure (smooth-looking) is “collapsed” by 5% of the total number of triangles using the quadratic edge collapse algorithm [47]. The algorithm essentially removes edges by merging and regrouping nearby vertices. With the aim of minimising the distortion of the surface geometry, it is necessary to establish a precision threshold to stop the iterative process. So that, if the resulted mesh error against the original input point cloud remains unchanged (with respect to the previous iteration), the collapse process continues. An iterative procedure is required since the quadratic edge collapse algorithm implementation does not allow decimation at fixed spatial resolution. Although our approach is based on an edge-collapse algorithm for the mesh optimisation, others approaches could be applied, such as the remeshing with recursive resampling as shown in [48] based on the Marching Cubes algorithm [49]. However, this remeshing approach exhibits higher deviations from the original model, up to 20 times higher than the quadratic edge collapse algorithm [48], and is therefore inadequate for our final archaeological products.
Finally, a texture mapping of the simplified and optimised mesh was performed using the commercial software Agisoft Photoscan®.

4. Experimental Results

4.1. Area of Study

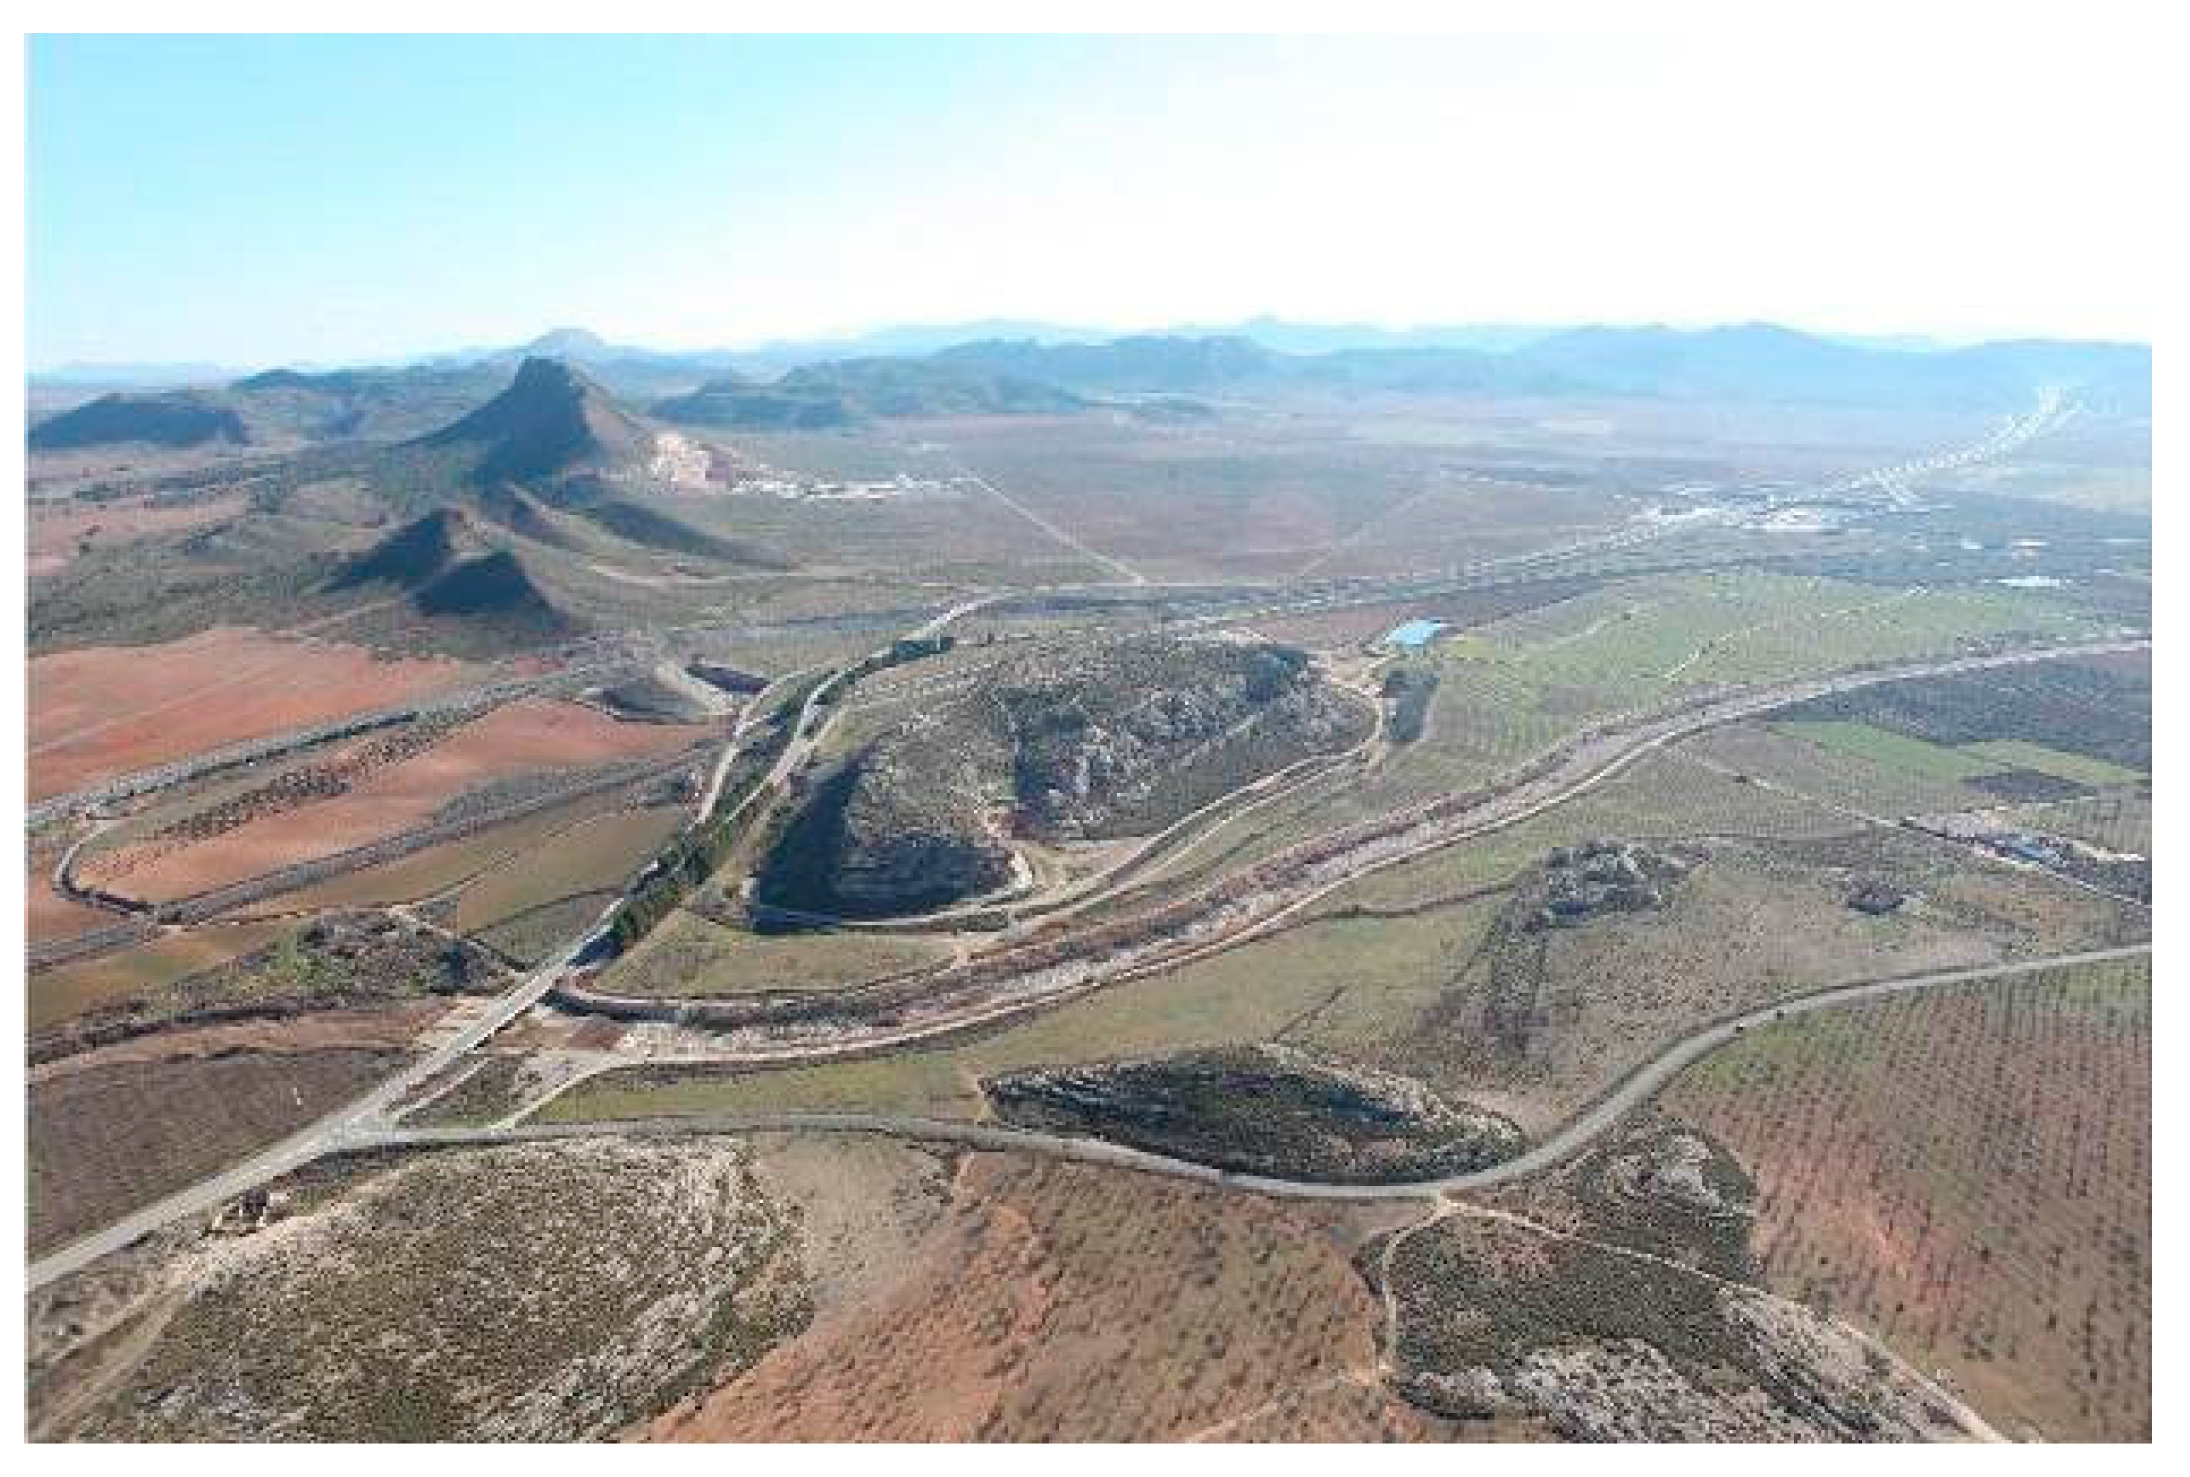
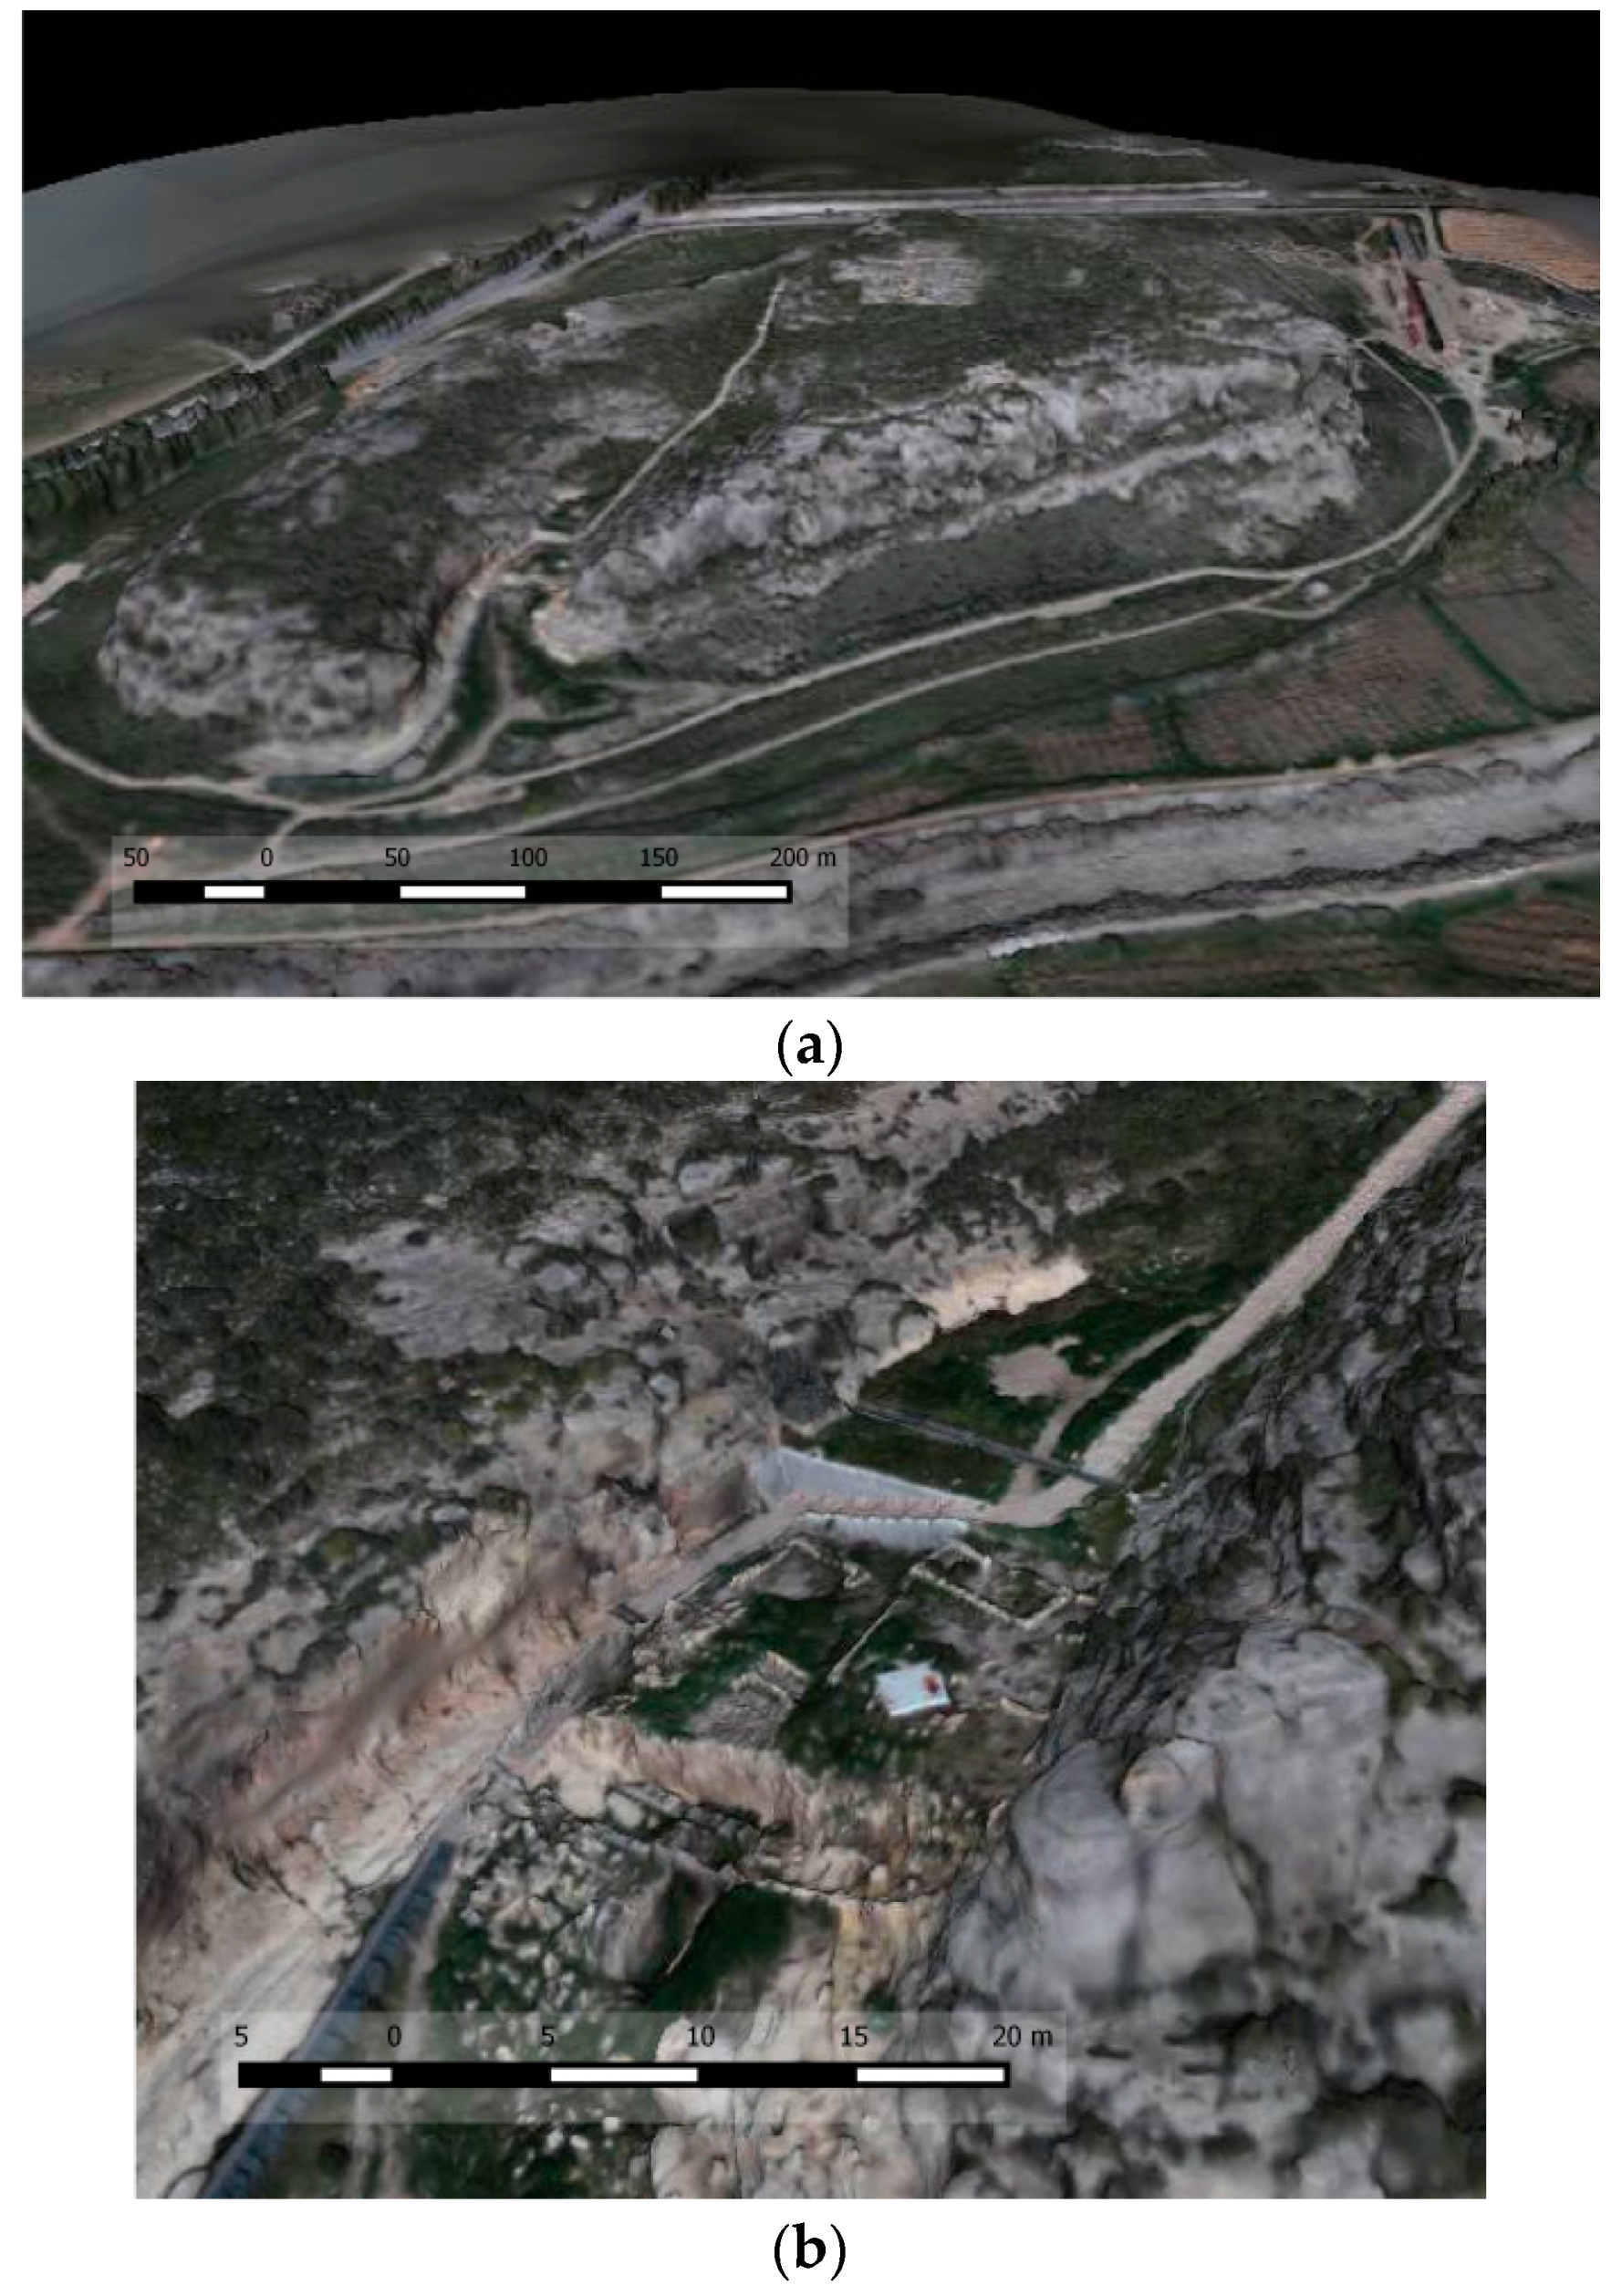
The city of “Tolmo de Minateda” (Figure 6) was a strategic settlement of great importance for several centuries, largely because of its peculiar topography and geographical location. It is placed on a plateau hill of about 50 m of height, located at the junction of the route from Complutum to Carthago Nova, one of the principal Roman routes connecting the interior of the plateau with the southeast coast, and a road connecting Castulo with Saetabis.
The archaeological research from the last 30 years has highlighted the importance of this site, revealing a history from the Middle Bronze Age, through the Iberian era, the Roman period, and the Middle Ages to the twentieth century. The Middle Age period provided most of the information by an important Visigoth settlement located in the upper part of the “El Tolmo”, where an important Christian basilica was found between houses and cemeteries.
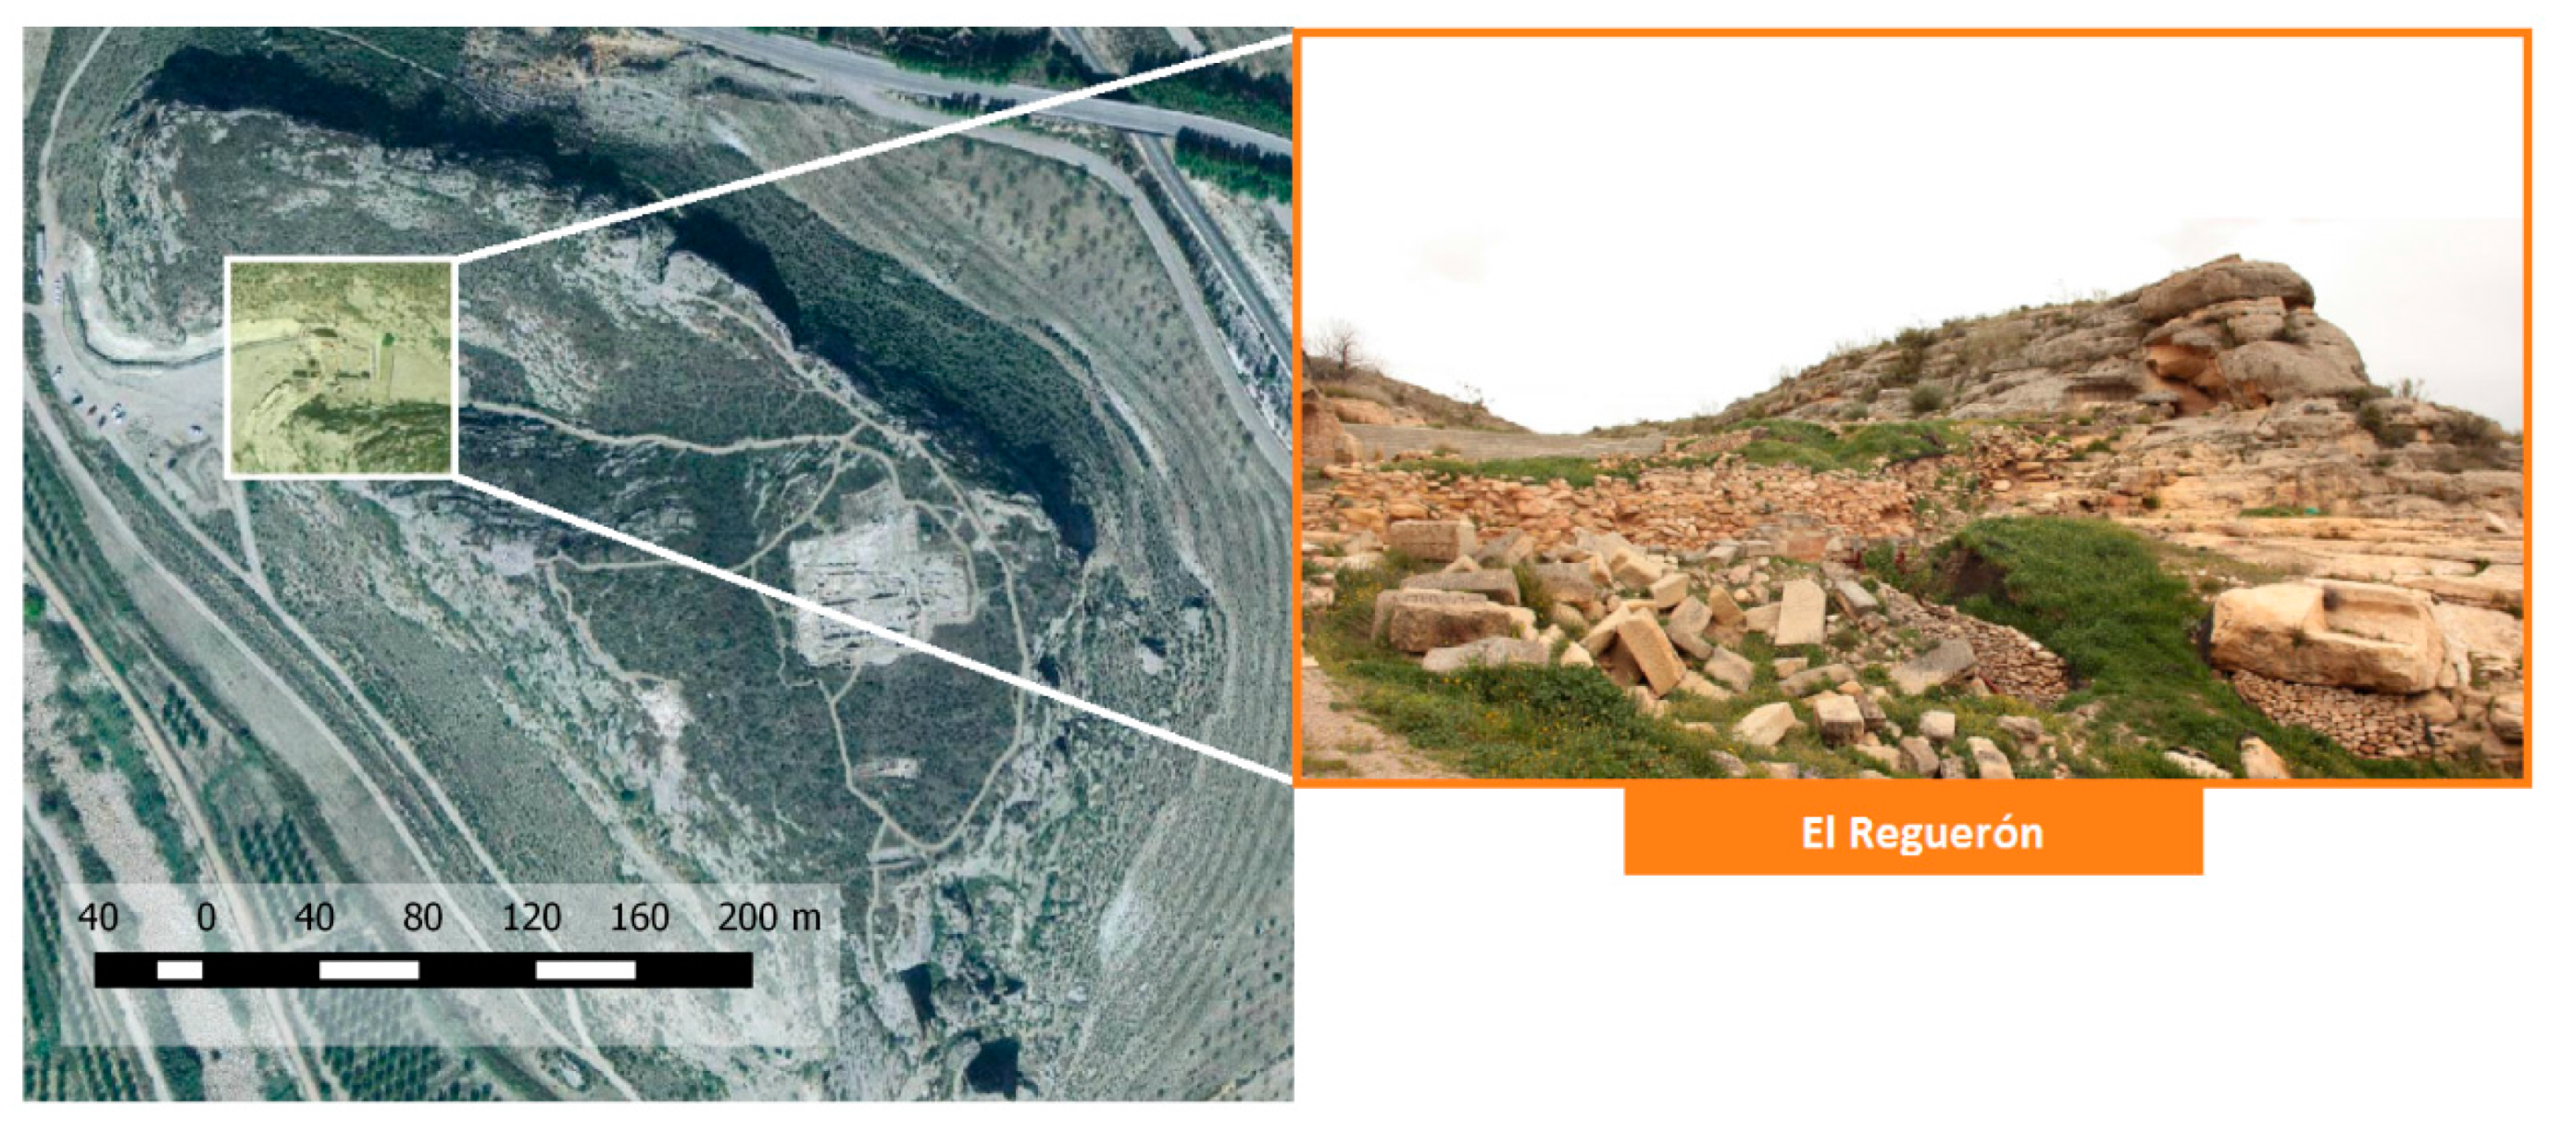
One of the most interesting areas of the archaeological site is “El Reguerón” (Figure 6), an area of natural drainage 12 m in width, with a main entrance at the top of the hill where the city was located. In the settlement, an important fortification system consisting of three walls of different chronology and architectural typologies has been documented [51]. The oldest fortification is represented by the so-called “embanked” wall and was built during the final phase of the Iberian period (4th−2nd century B.C.). Currently, only the remains of a wall 6 m high and 10 m wide at the top, embanked in the external front and built in irregular masonry work, was preserved in the soil. During the archaeological excavation of this ancient wall, an earlier phase, which dates back to the Middle Bronze Age, was discovered. The Iberian wall was successively used as a retaining wall for a new fortification building during Roman times when the “Tolmo de Minateda” probably received the title of municipality.
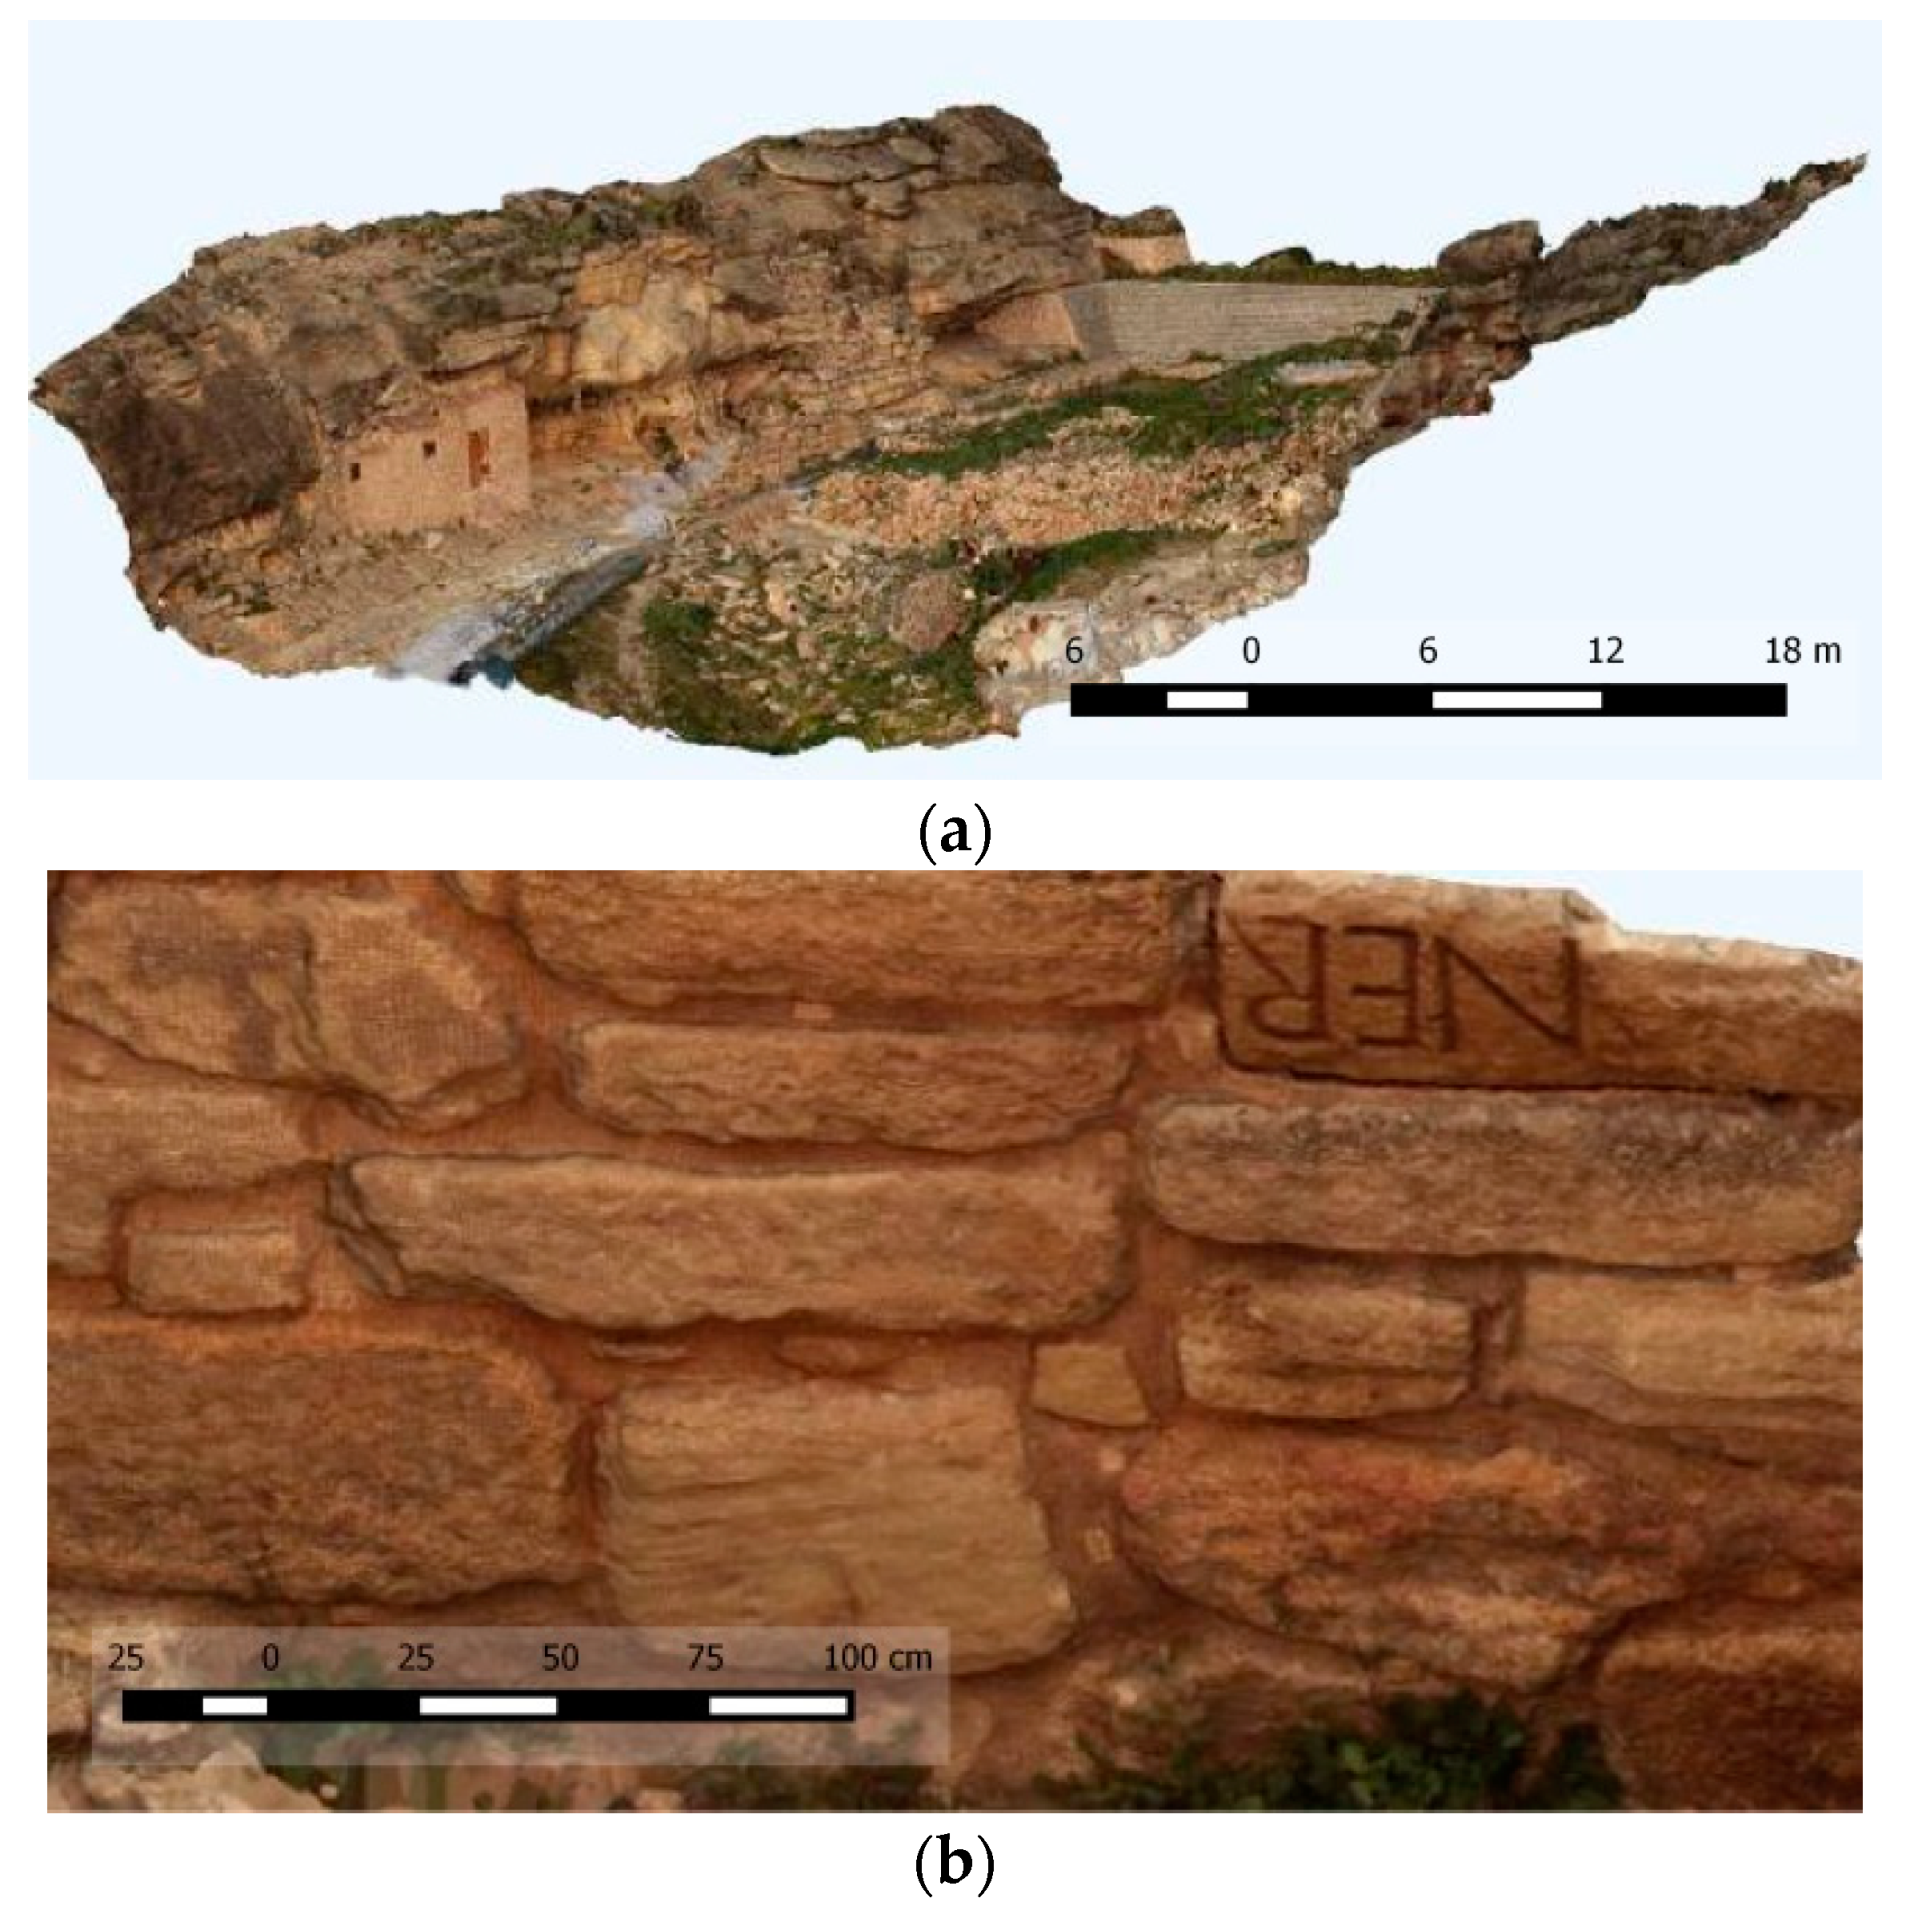
The last fortification found in “El Reguerón” comes from the period of peninsula occupation by the Visigoths (5th–6th century A.D.). This wall is presented as a solid, L-shaped bulwark that encloses the valley and flanks the main road access to the city. It is here at this point that a monumental gate, probably formed by two solid towers of blocks, was once located. Only partial remains have been preserved. The wall is formed by a line of blocks with inscriptions and architectural elements from older constructions (among which are examples from the Roman period).
The relevant archaeological stratification of this area with different structures and building types requires of a multi-data source and multi-sensor approach that allows us to properly record and classify archaeological surfaces, thereby establishing an integration of topographic data with documents of archaeological excavations.
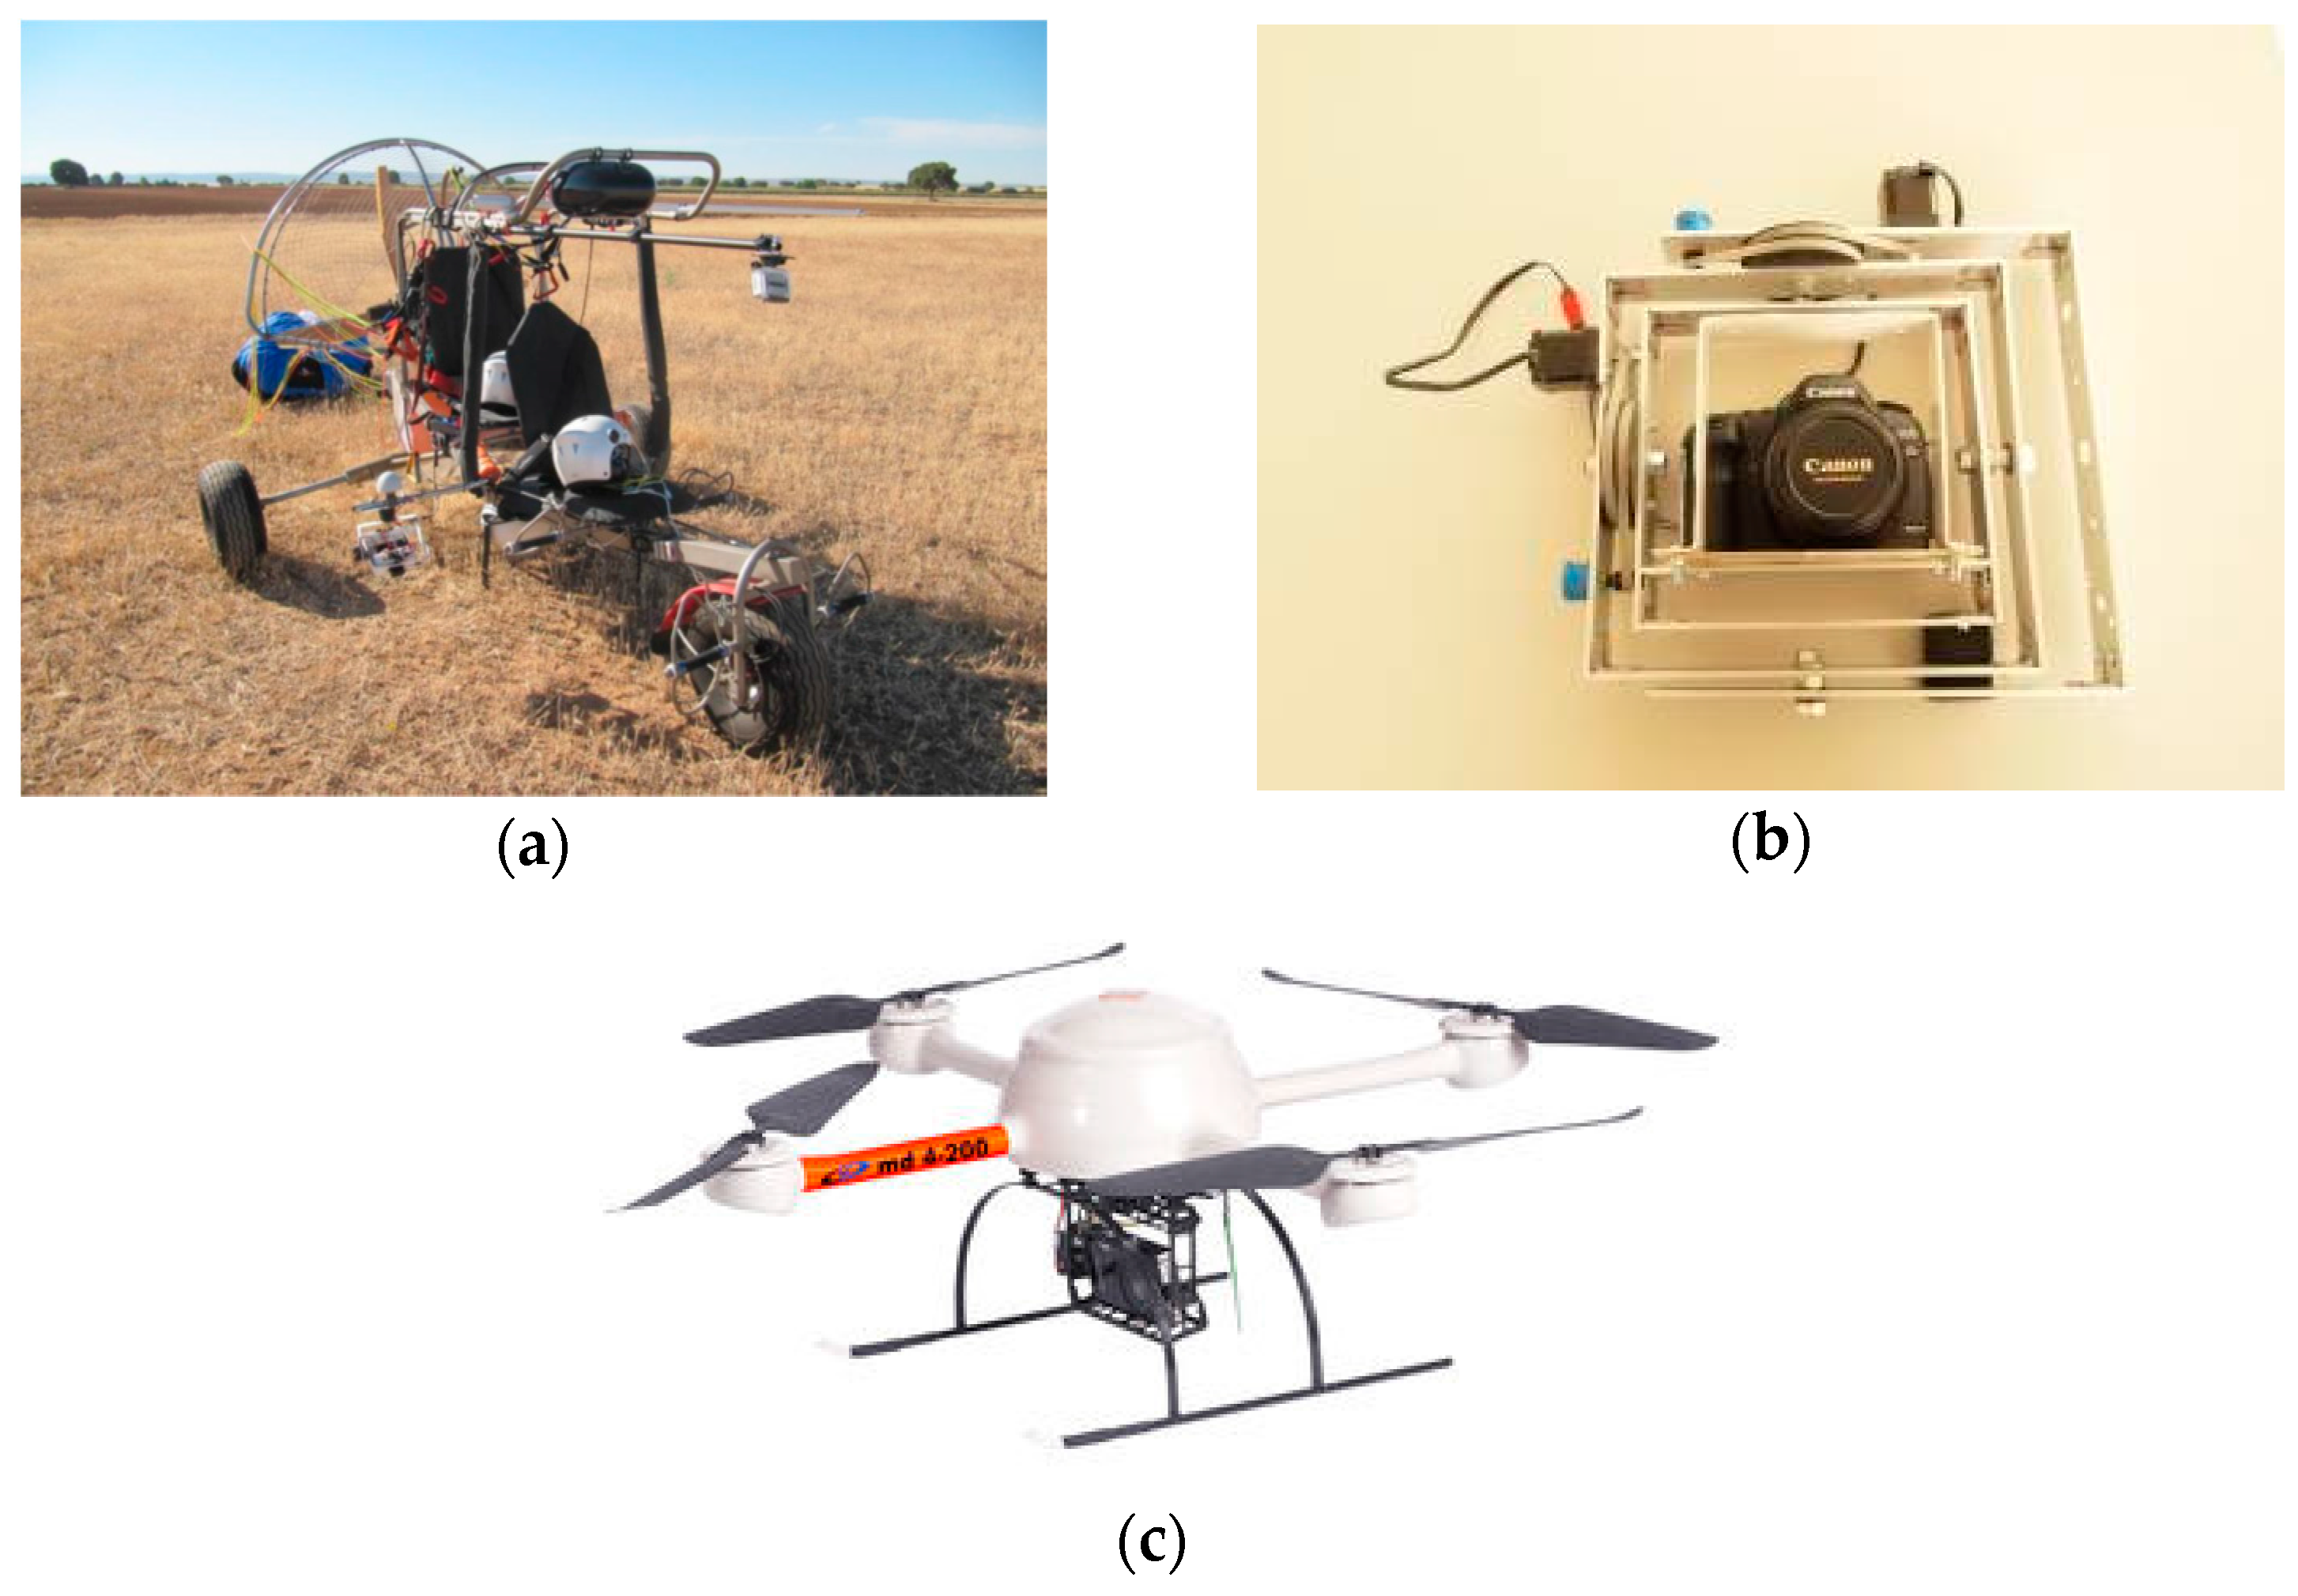
In order to fulfill the archaeological documentation requirements, the aerial data gathering was performed with a paratrike which allows us to enclose the whole extension of the archaeological site using a full-frame reflex camera, assisted by a specific gyrostabilized platform (MUSAS-MUltiSpectral Airborne Sensors) with a ground sample distance (GSD) of 3 cm. According to the GSD desired for the whole archaeological site and considering the camera specifications, a maximum flight height of 224 m was established. As a result, a total of 268 images along seven strips (NW-SE direction) were required for guaranteeing a side overlap of >30% and a forward overlap of >70%.
To record with higher spatial resolution the area of interest of the “El Regueron” site (Figure 7), an UAV with an ultra-compact camera (Table 5) acquired the fortified walls with a GSD of 1 cm. Finally, 25 images and a flight height of 32 m guaranteed the desired spatial resolution. The overlap parameters were the same.
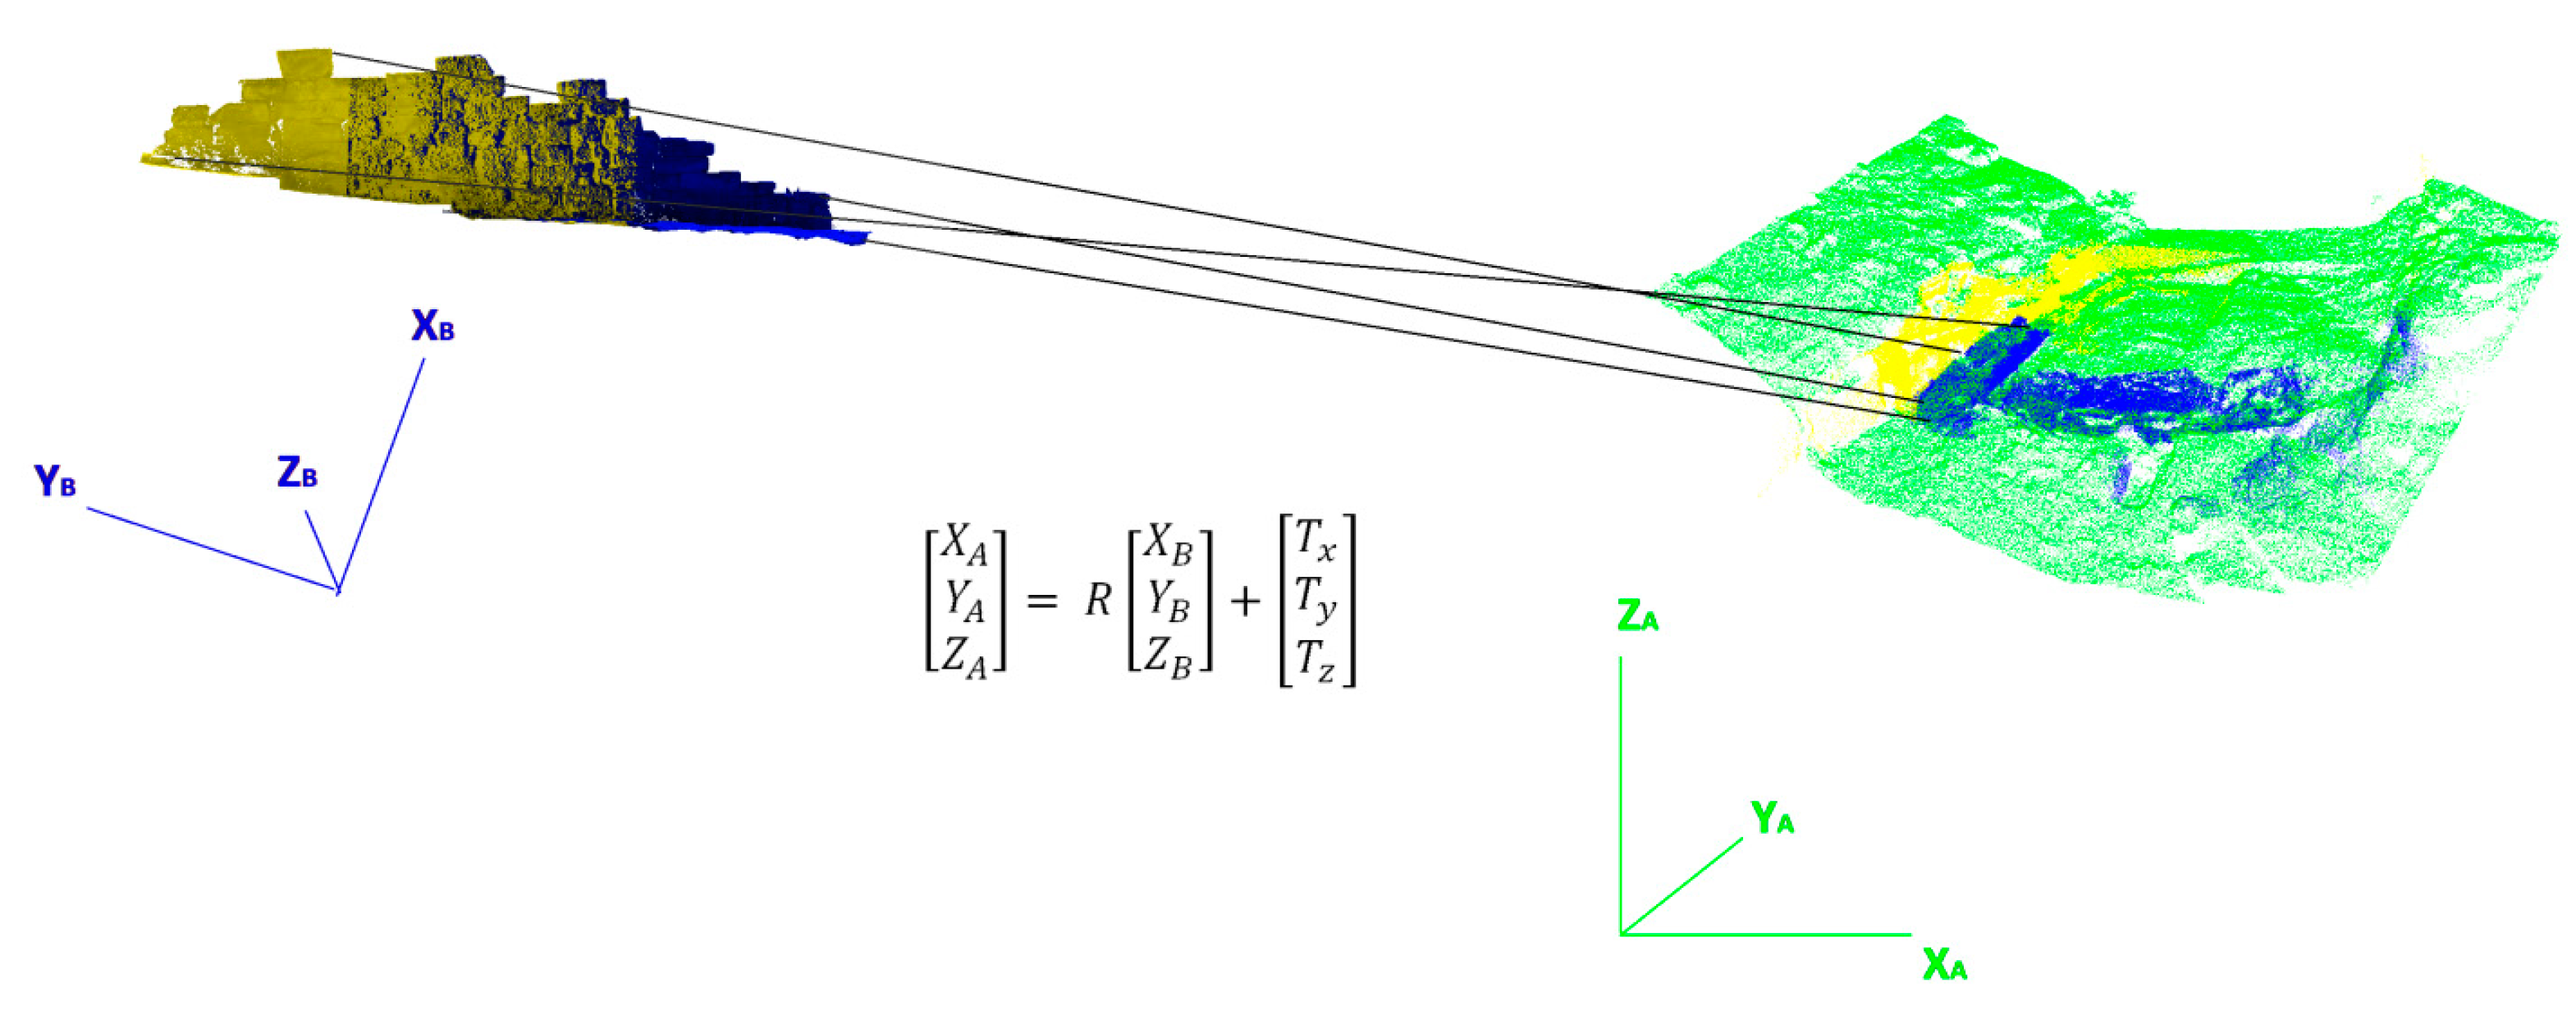
In addition, to increase the level of detail in the fortification walls and thus avoid the occlusions due to the effects of terrain relief (i.e., areas occluded or without information in the model generated by aerial photogrammetry), a combination of terrestrial photogrammetry and terrestrial laser scanner (TLS) was employed for improving the final 3D hybrid model. As a result, a total of 36 terrestrial oblique images and 13 TLS point clouds were acquired in order to avoid areas without information, guaranteeing a subcentimeter resolution.

4.2. Workflow

The application of the multi-data source and multi-sensor fusion workflow was tested in the study area of “Tolmo de Minateda,” which includes a total of 9 ha.
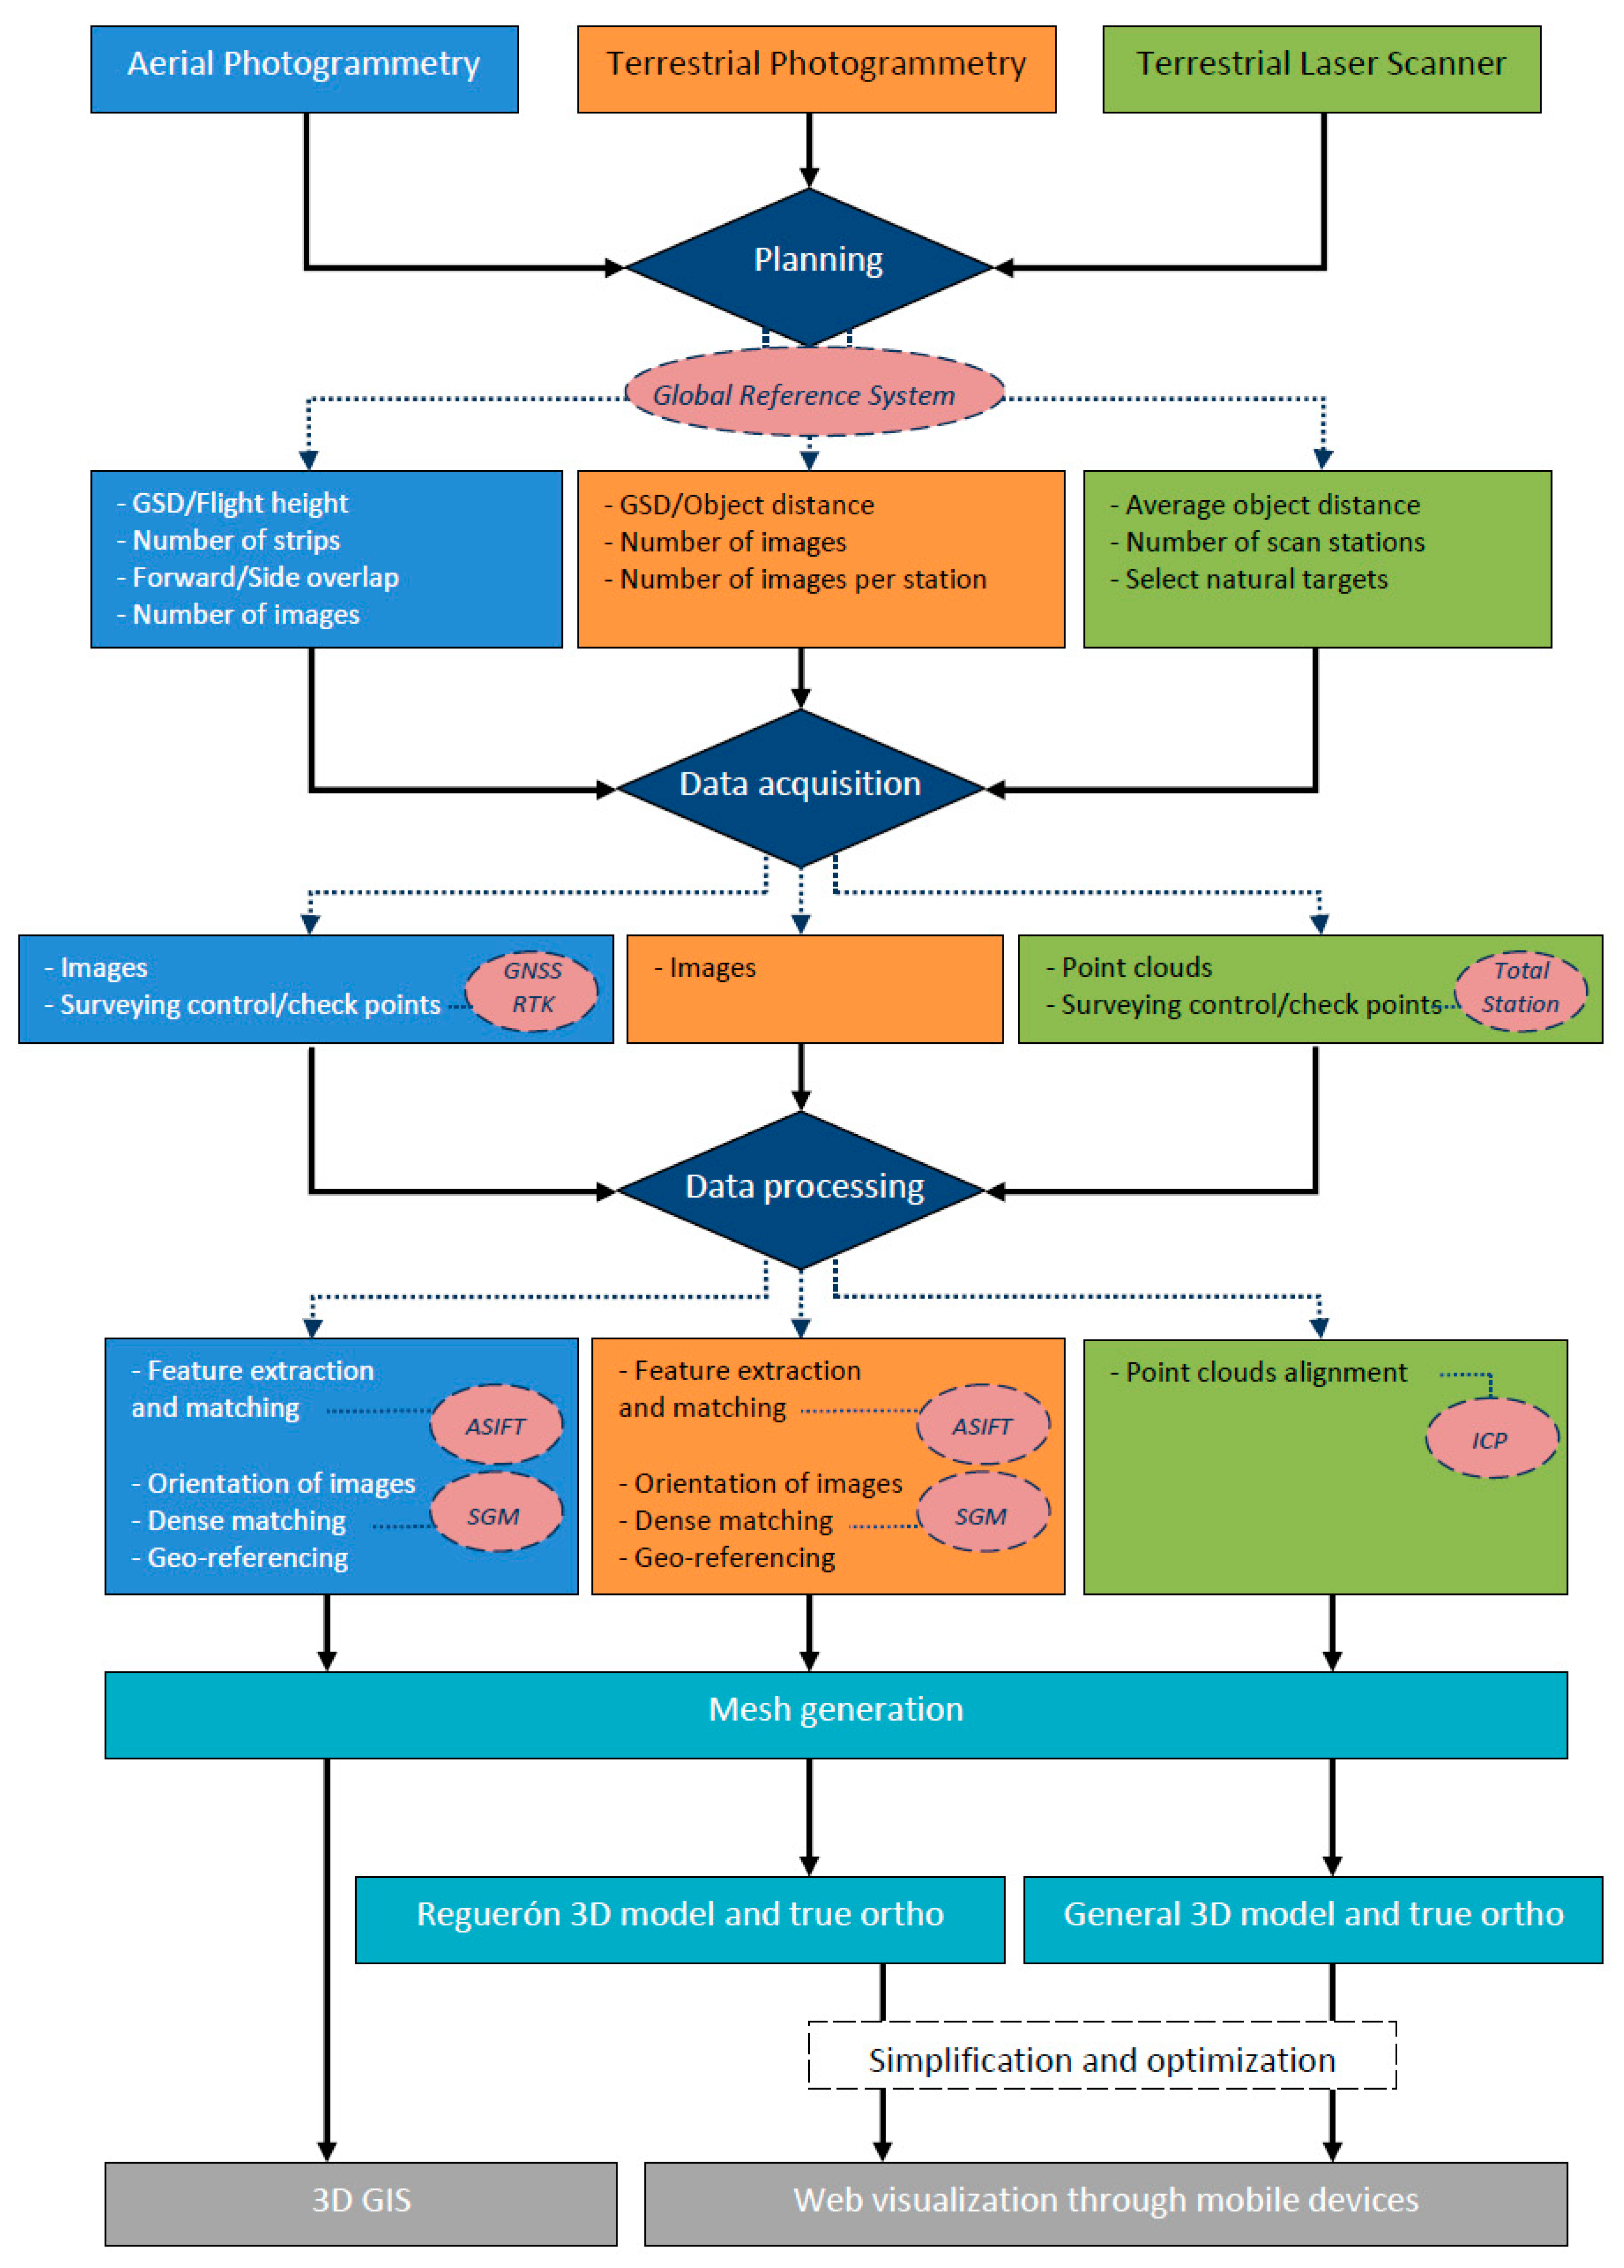
Firstly, the aerial images were processed by the automated photogrammetric approach and the cameras were self-calibrated according to 
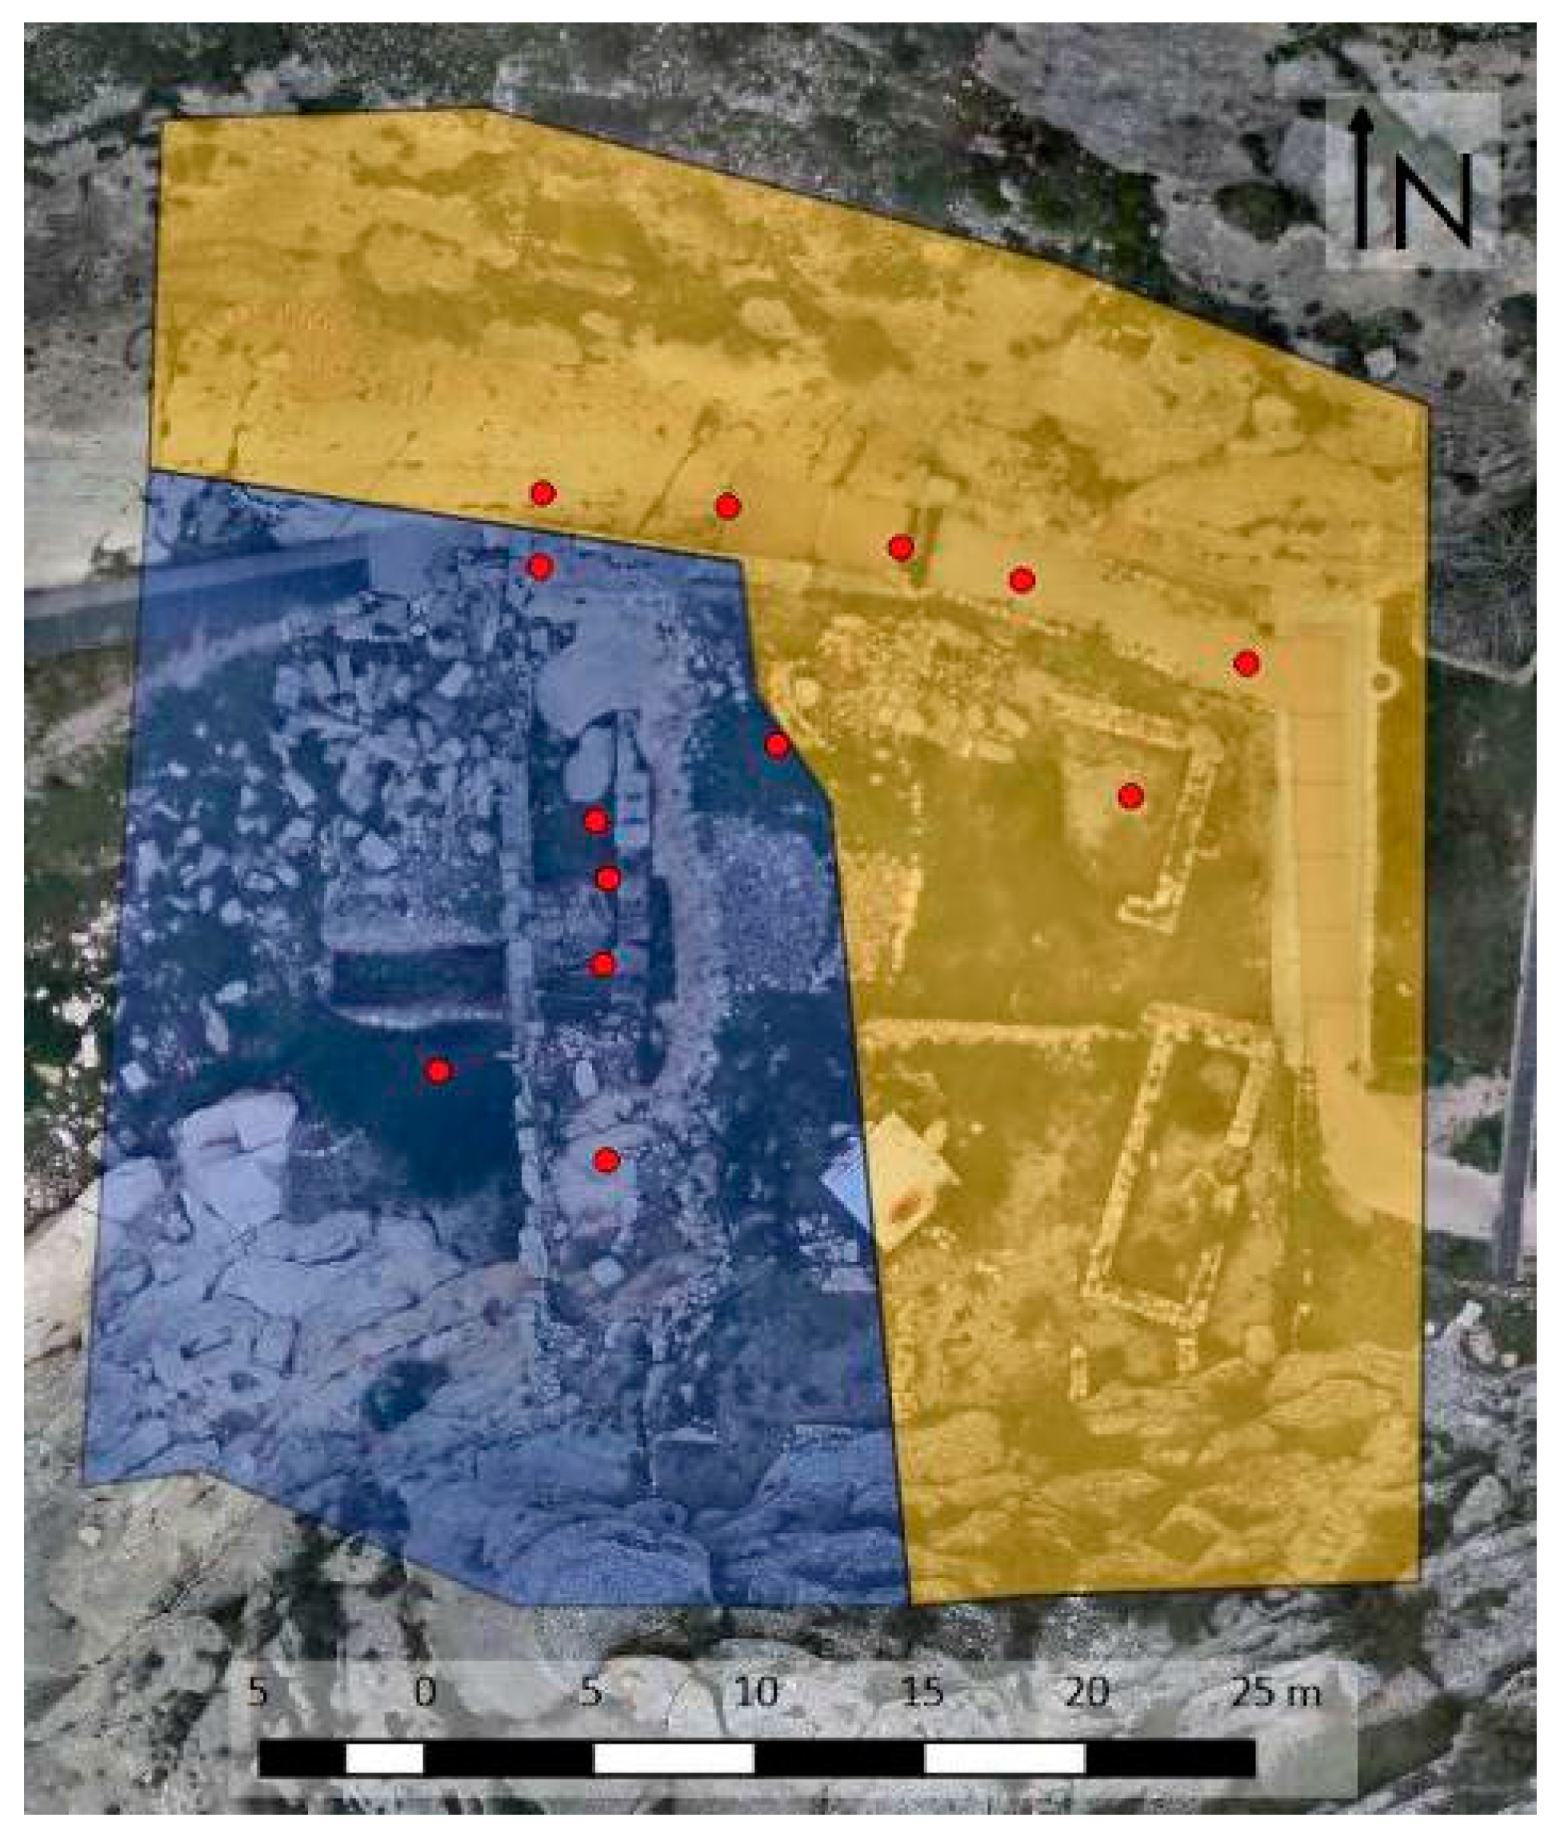
Section 3.2.2. As a result of this process, the raw reconstructed point cloud is obtained which contains 4,271,354 points, while the TLS integrated point cloud reaches up to 1,314,136 points. Secondly, the geo-referencing of the 3D model was solved by the employment of 28 control points homogeneously distributed across the site (but with higher density in the interest area), while ten were used as checkpoints. Finally, the final multi-resolution 3D model after triangulation is obtained (Figure 8), encompassing the whole study area with a spatial resolution of 3 cm. A total of 10,542,505 triangles were obtained.
For the detailed area which integrates different data sources (i.e., terrestrial laser scanner and photogrammetry), a spatial filtering of 0.5 cm was applied to avoid areas with excessive point density caused by the different overlaps.
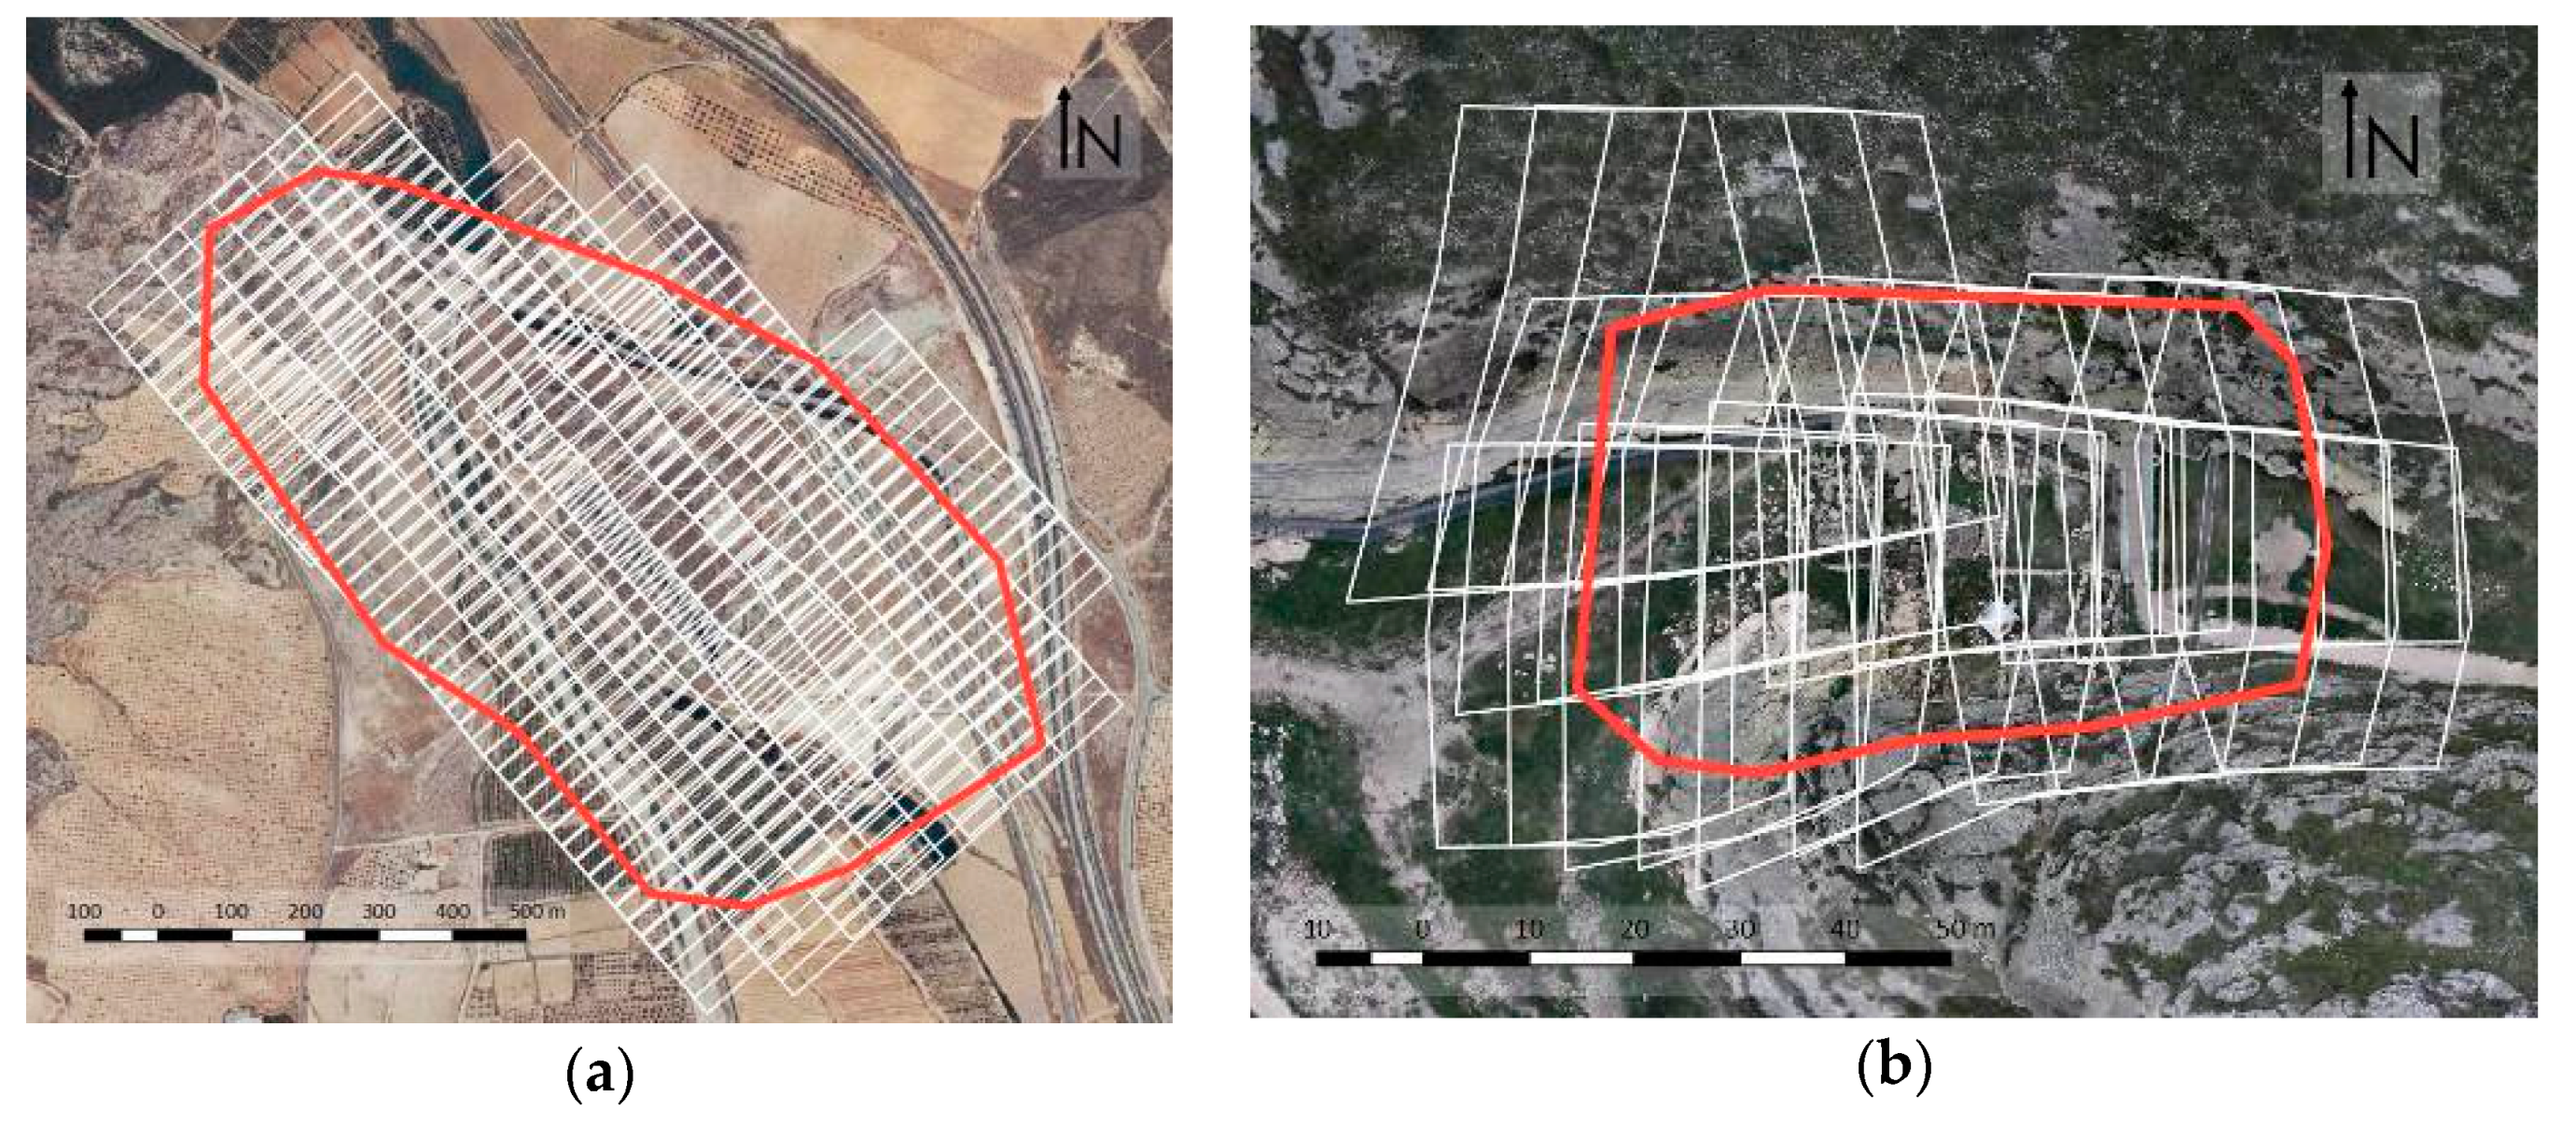
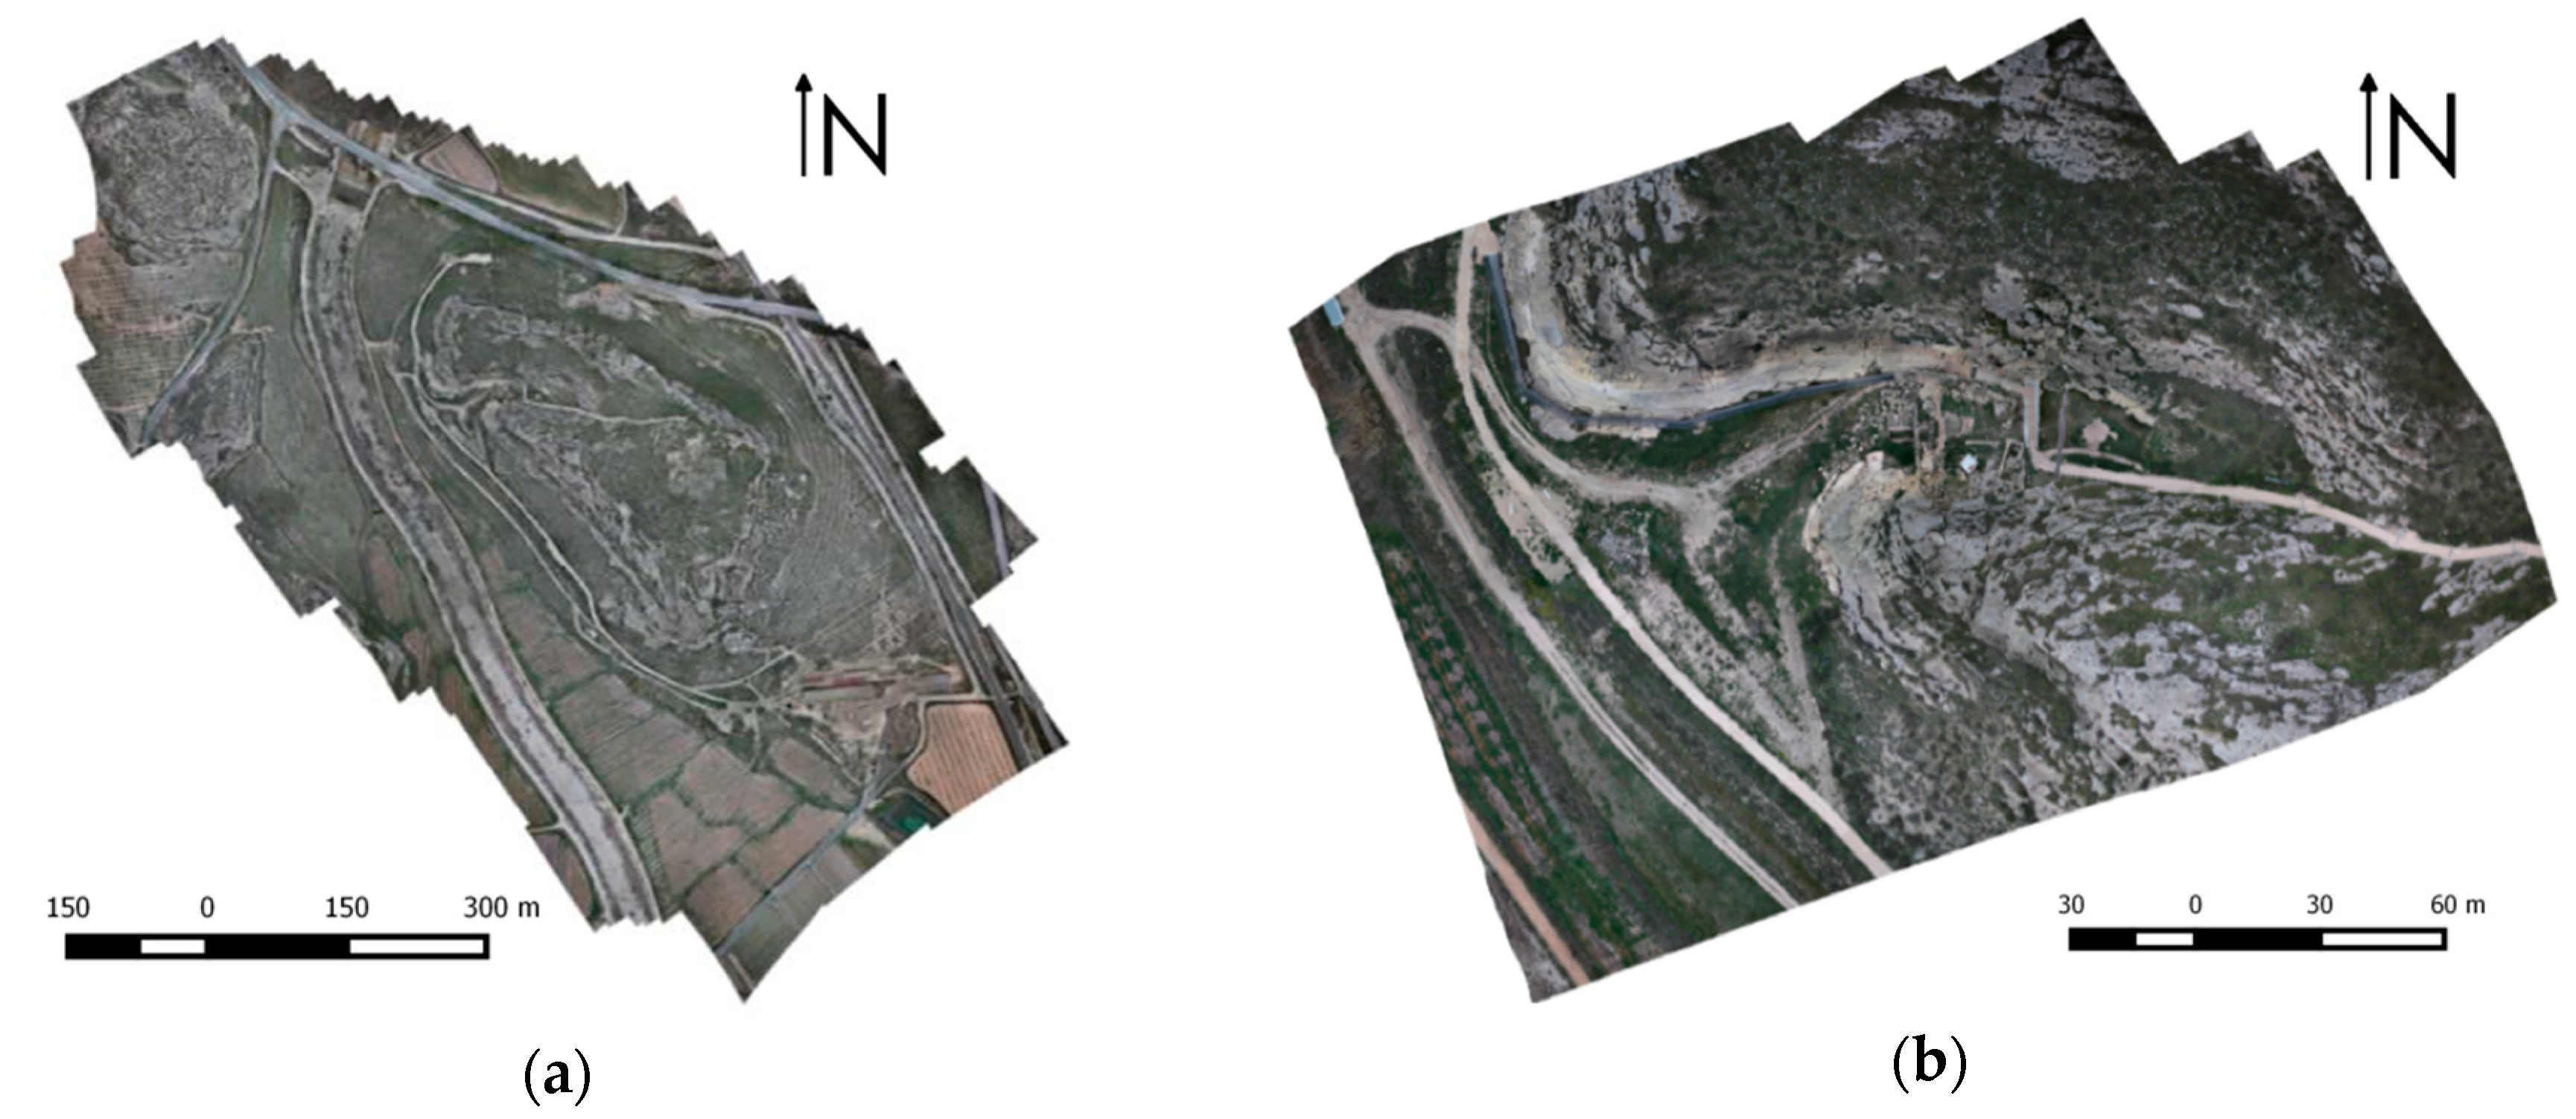
By this multi-resolution approach, the final inspection of the archaeological site could be adapted to any area, as illustrated with “El Reguerón”, where the subcentimete resolution achieved for the walls and construction (Figure 9b) was integrated with the rest of the archaeological site (Figure 9a). This multi-resolution capability opens a range of possibilities for a spatial analysis, settlement interpretation, pattern recognition, and the establishing of relationships among the elements (sites, artefacts locations, etc.).
In order to validate the final integration of the different data sources, a series of checkpoints were used. The different error components are shown in Table 4. The average vertical error (2.6 cm) was higher than the horizontal error (1.4 cm), as was expected for the GNSS technique. An average precision of 3 cm for the 3D vector error was obtained, which is statistical compatible with the expected a priori error of 3.1 cm composed by the model and GNSS check point errors.
To manage more efficiently the available information of the archaeological settlement, true orthoimages were generated as derived products (Figure 10), since they combined the photorealistic texture with the metric properties in an easy-to-use document for non-experts.
However, to allow a more complete interpretation and to make use of the potential of the generated 3D product, an integration with a 3DGIS tool, GeoWeb3D, was performed. In particular, the 3D geometry provided by the multi-sensor approach has been integrated with 2D archaeological archives such as sketches, pictures, part details, etc., thus enhancing the subsequent analysis and providing problem solving and decision-making capabilities. 
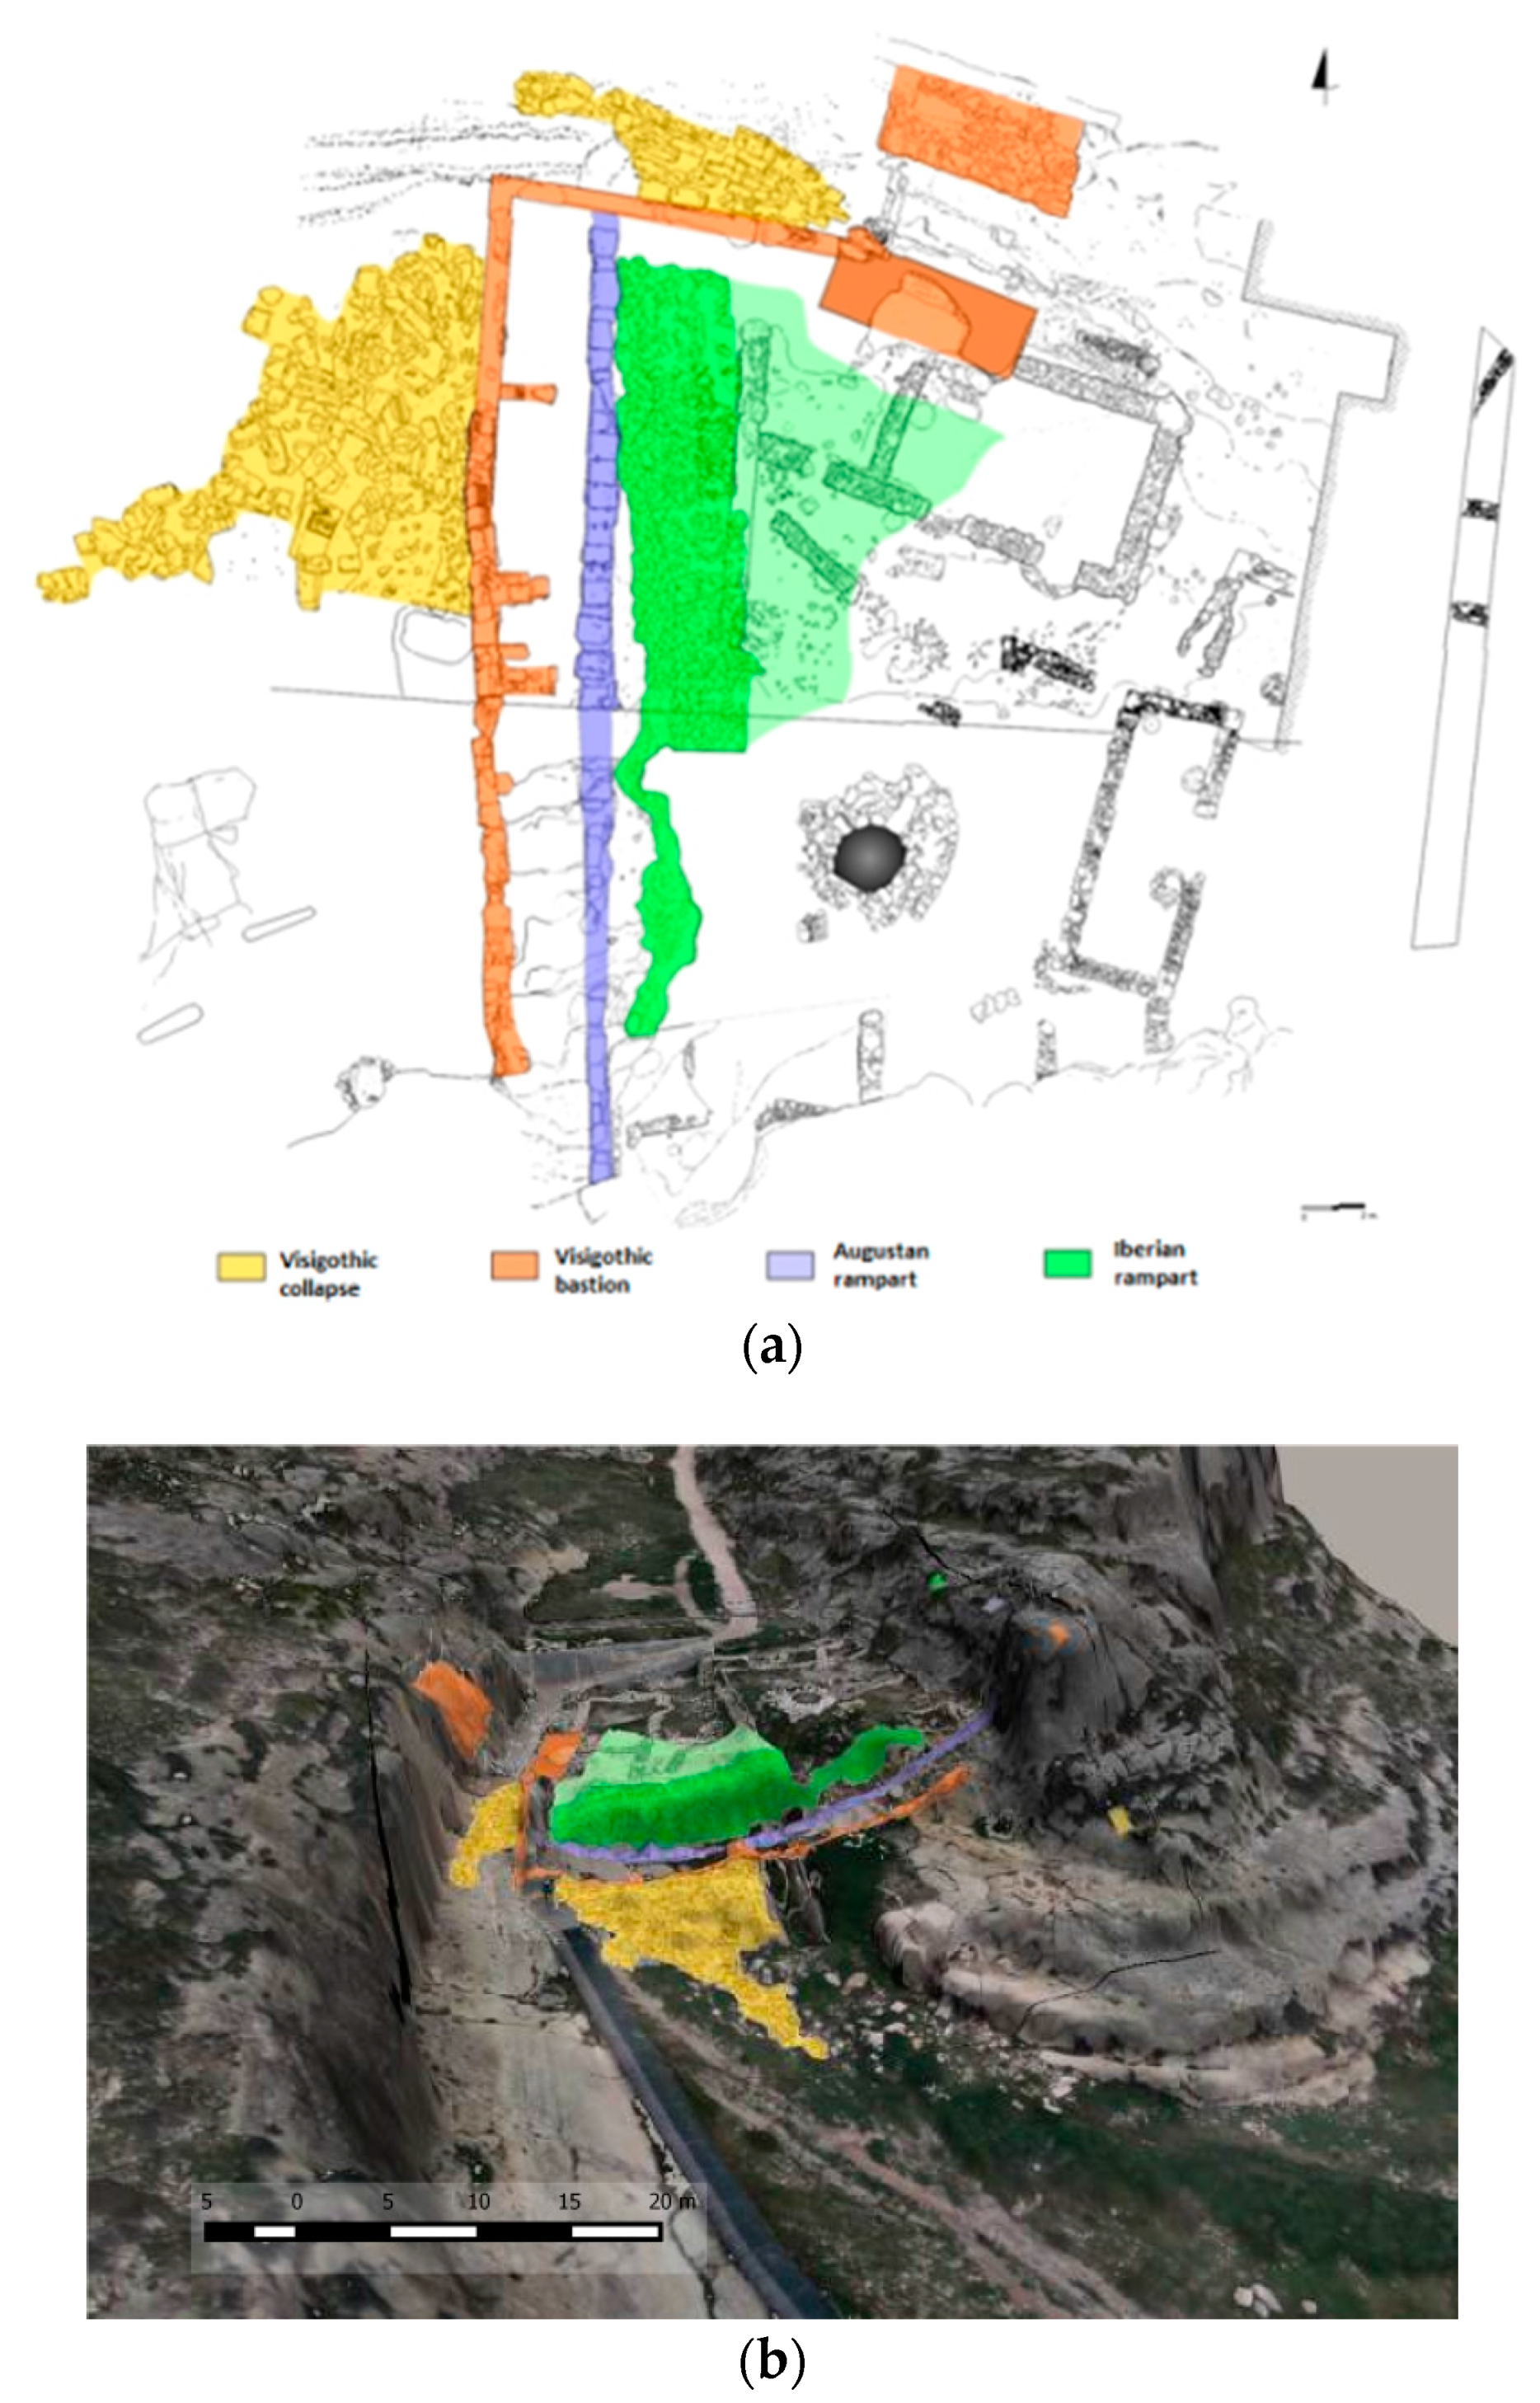
Figure 11 shows the integration of different historical events in the reconstructed 3D model.
The integration of 2D information and 3D models allows us to extract intangible information that improves the analysis capabilities of the archaeological settlement. For instance, Figure 11 integrates an archaeological sketch of defensive constructions (2012) with the generated hybrid 3D model (2015). It should be noted that the high accuracy and proportion of the sketch is a perfect coincidence of the main homologous entities. However, some detached blocks belonging to the wall of the 3D model do not appear in the sketch. Analysing the position of blocks in the 3D model, it seems that they were spread along the natural drainage bed of the Tolmo, possibly suggesting that a runoff flow took place from the upper part of the Tolmo, providing this current block distribution.
Next, with the aim of showing the potential of analysing in situ the archaeological settlement, “El Reguerón” was tested using a mobile device (smartphone). The simplification and optimisation level was fixed considering different aspects: (i) the amount of 2D information which should be integrated; (ii) the minimum size of the interest elements and (iii) the level of reduction. A minimum resolution of 10 cm was established for the “El Reguerón” area.
Looking to the smallest and most emblematic elements of “El Reguerón,” it can be confirmed that these correspond to the blocks of the wall, which are bigger than the minimum resolution, meaning that they should be correctly represented. Subsequently, an iterative optimization process of the mesh was performed maintaining relevant information and stopping when the threshold of resolution (10 cm) was surpassed. As we can see in Table 5, the simplified and optimised models maintain the initial resolution (10 cm), with a level of reduction of 75% in comparison with the simplified model (without optimisation).
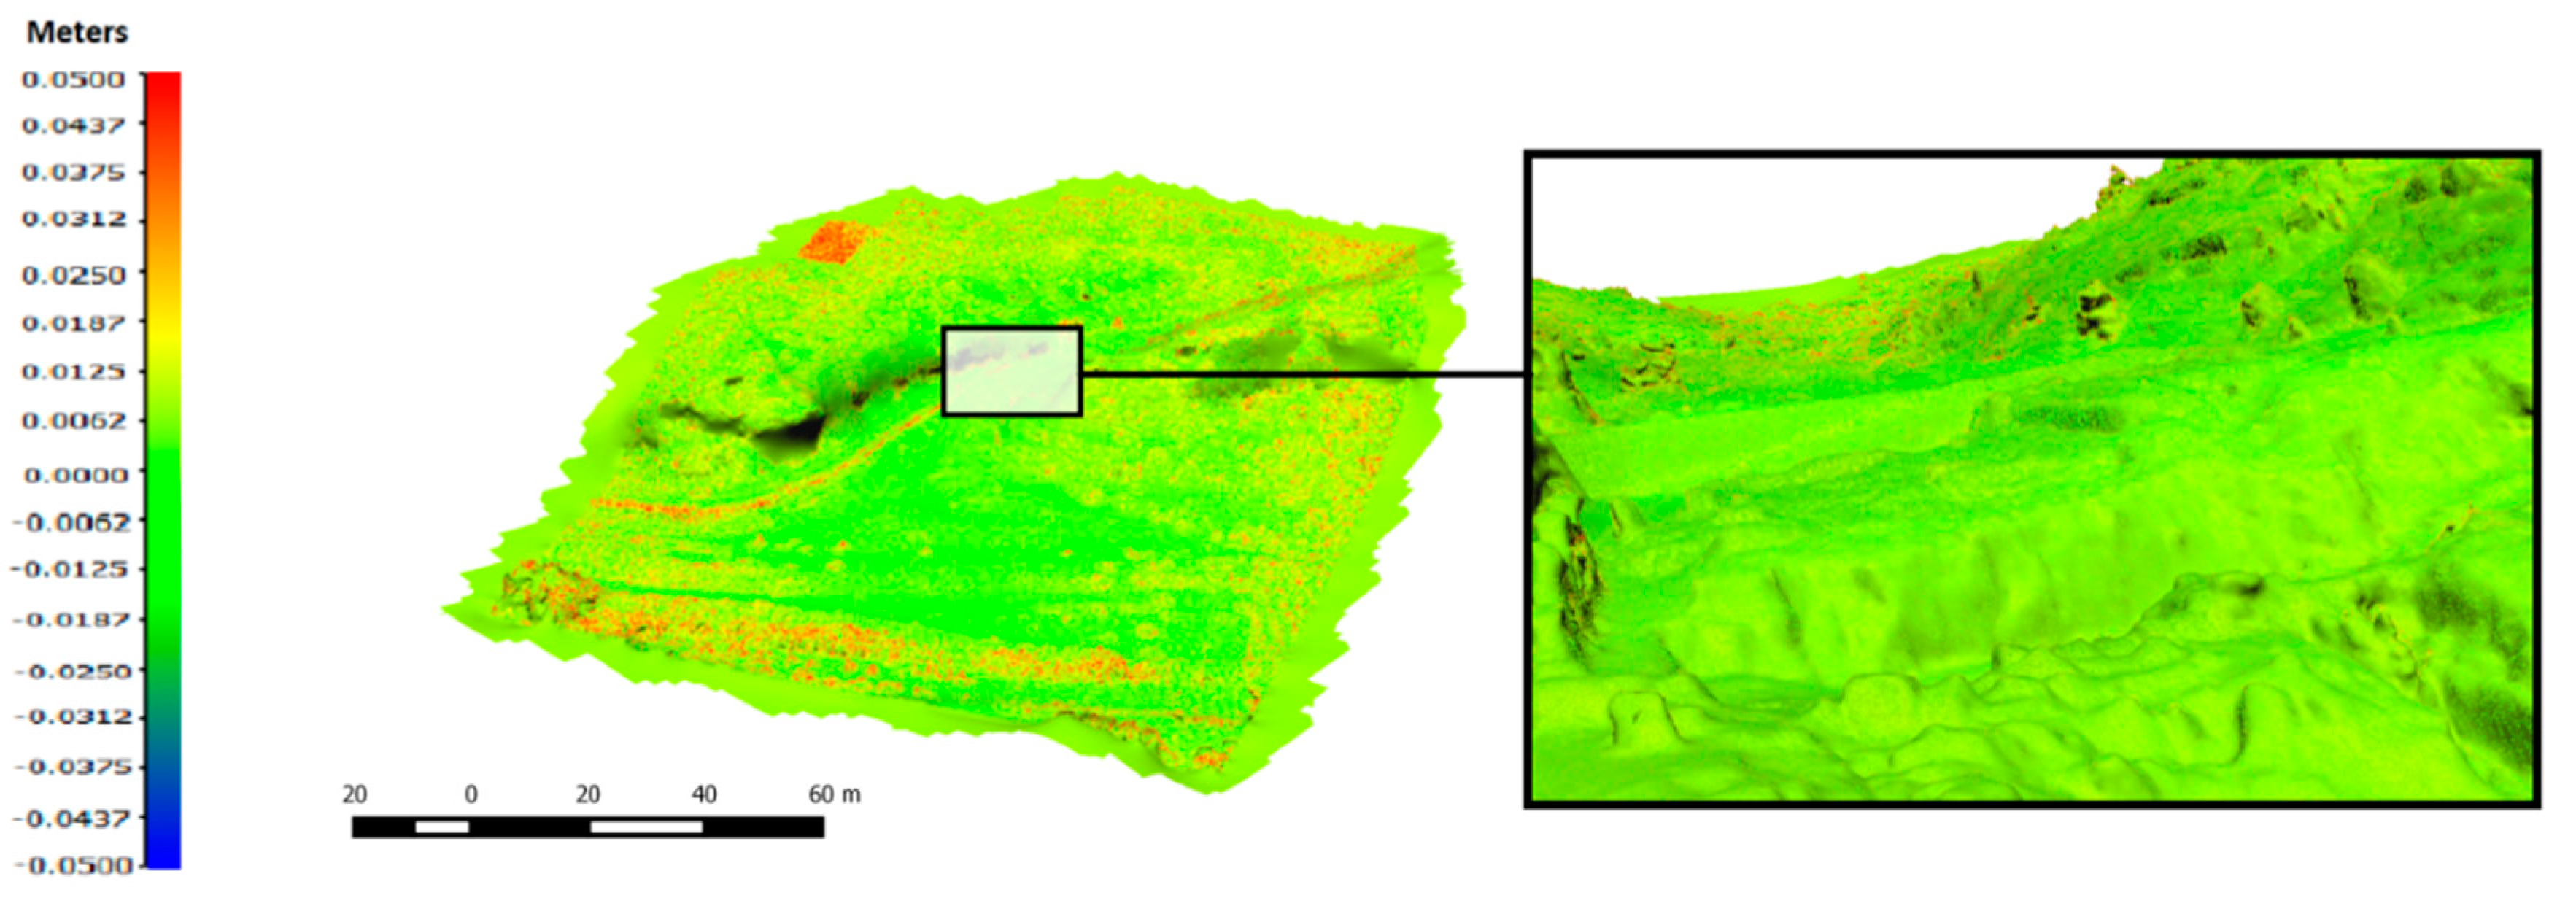
The simplification and optimisation procedures have removed 31,039,445 points of the 33,856,298 initial points. However, in order to assess the final error of the simplification and optimisation strategy, we have compared the simplified and optimised model with the original point cloud, obtaining an average error of 0.2 mm and a standard deviation of ±22 mm.
As we can see in Figure 12, higher discrepancies are located in peripheral areas due to the presence of vegetation with an irregular typology. Conversely, the walled area exhibits minimum discrepancies always less than ±5 mm.
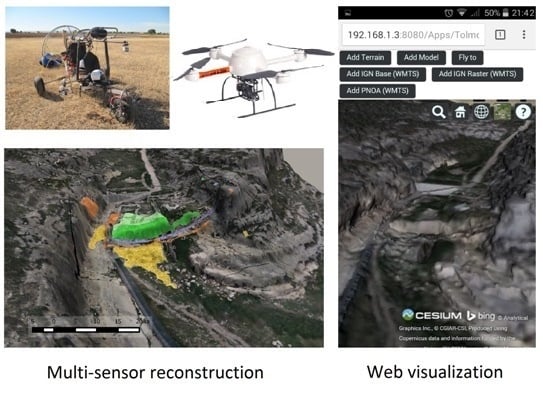
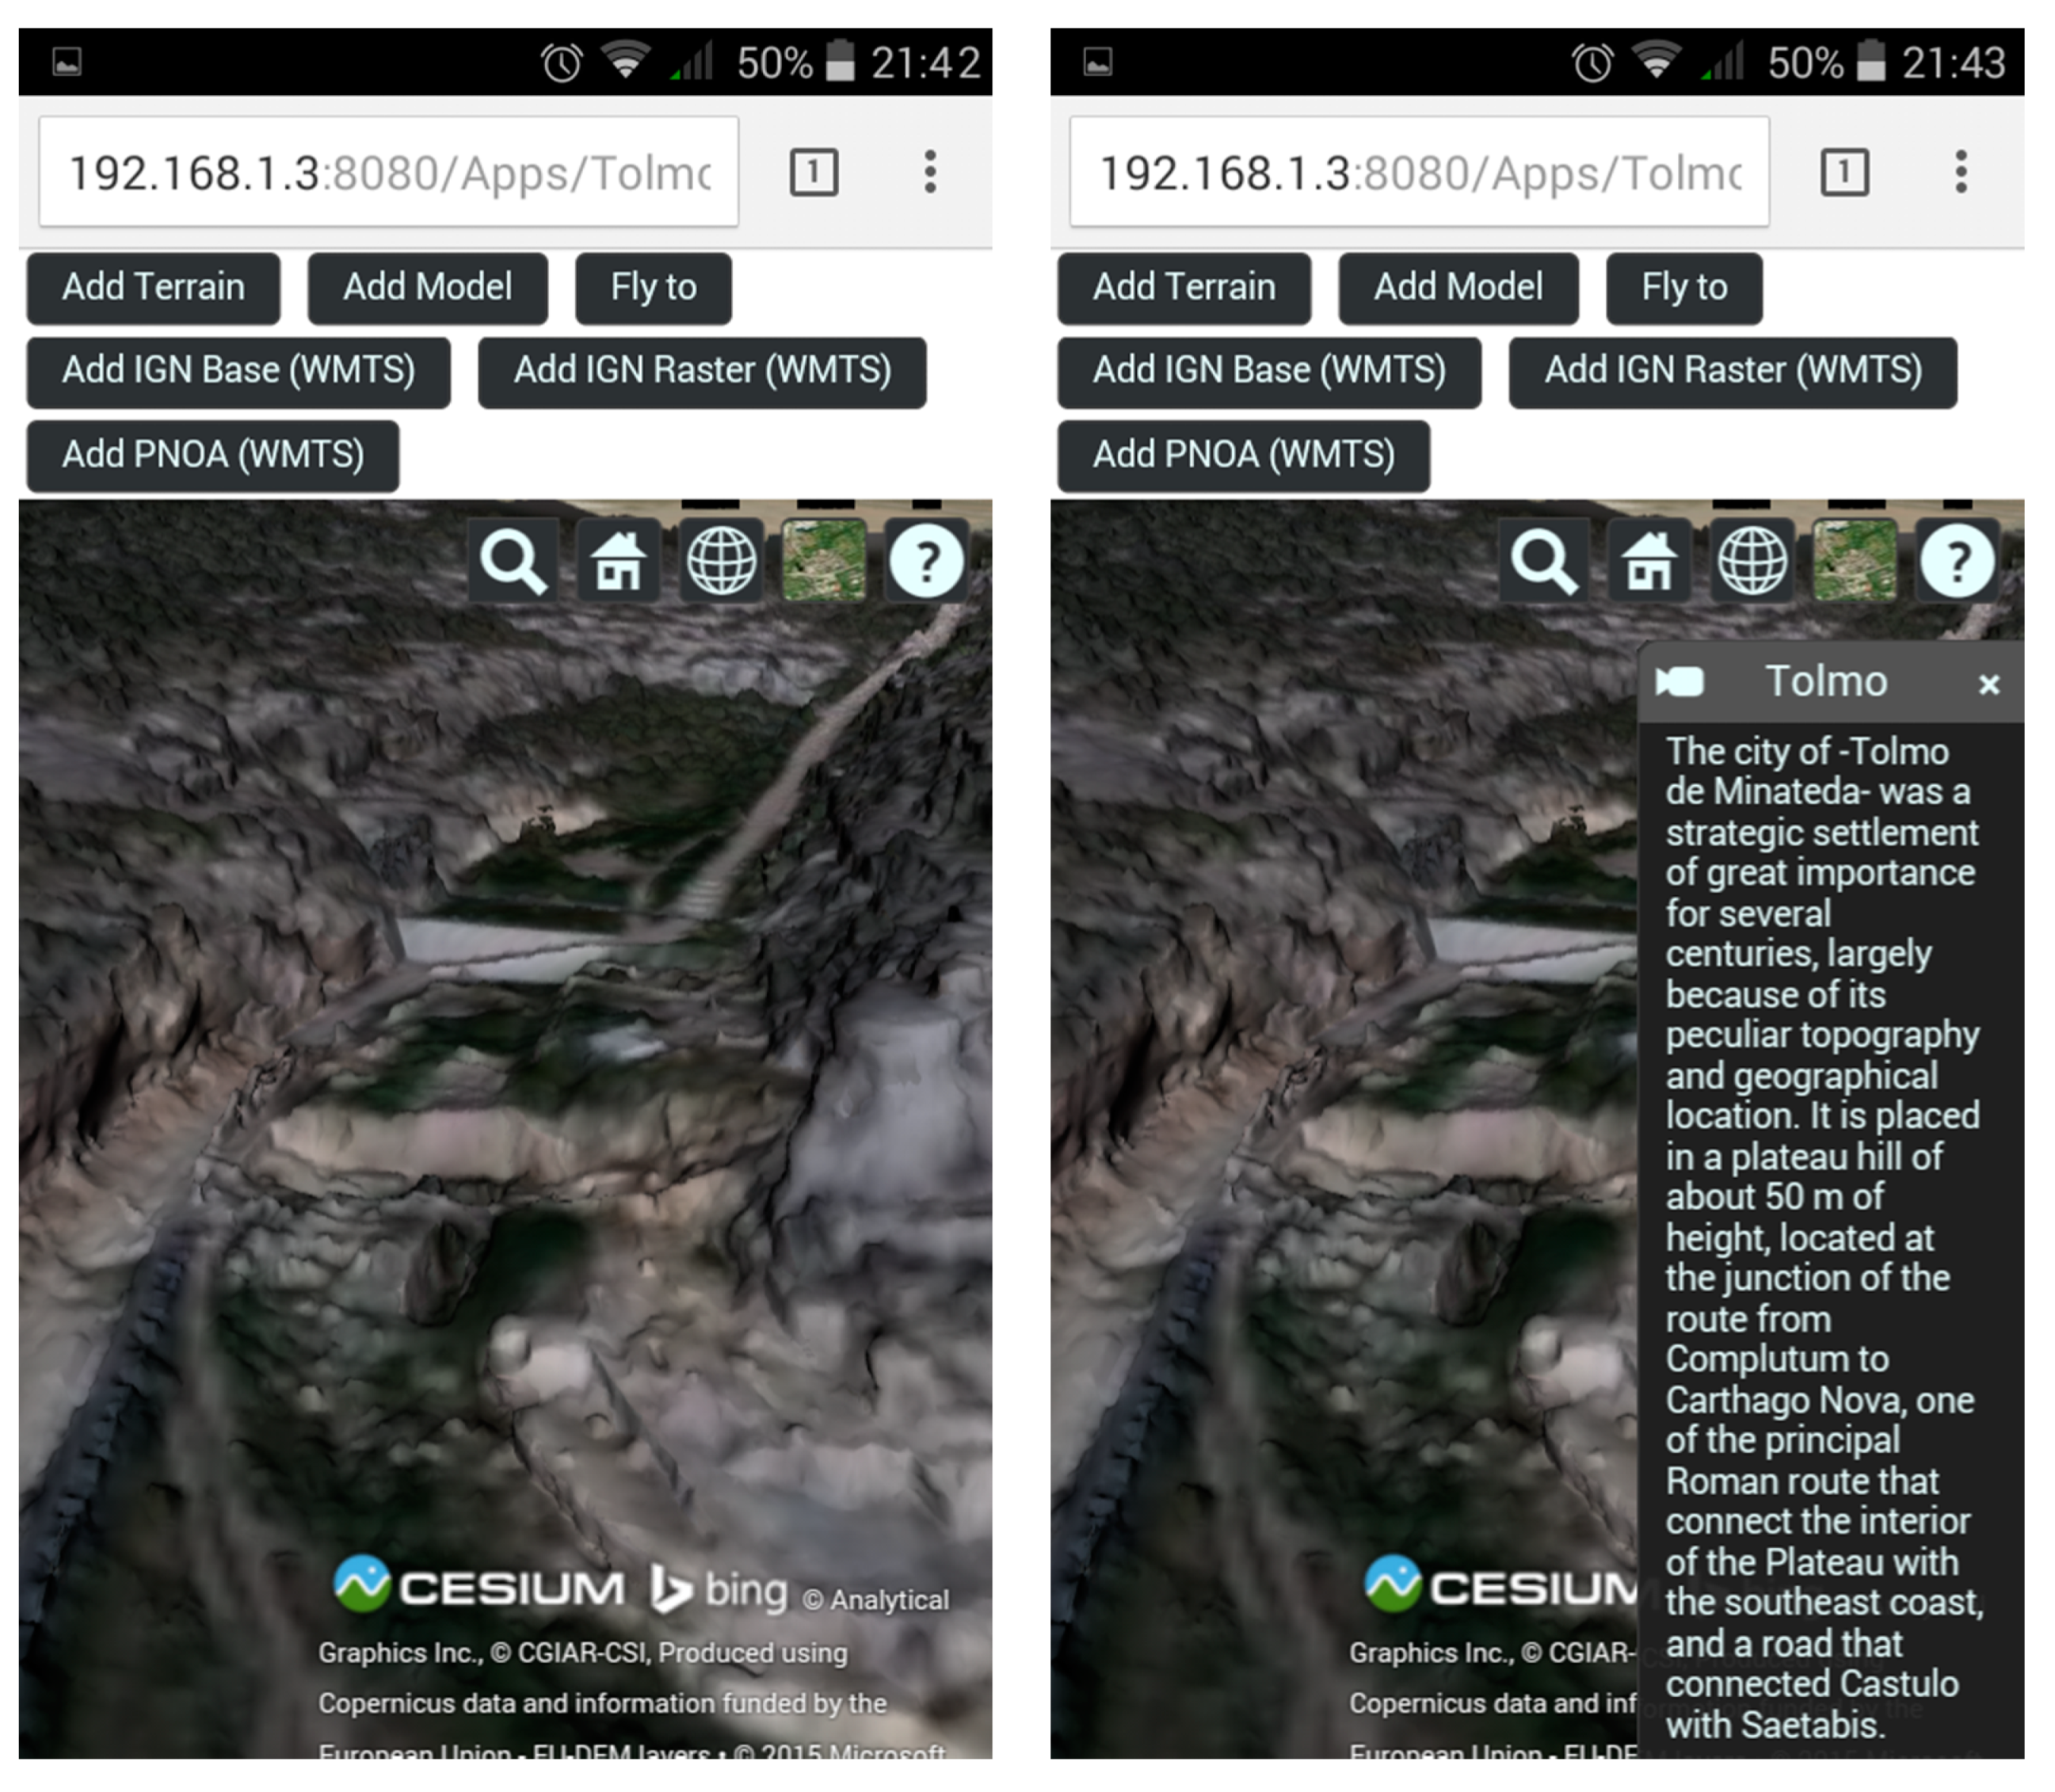
Finally, results were presented through the Web based on the Open Source library Cesium. A specific template based on HTML language was prepared to show the 3D models and additional information using external geospatial services such as WMS, MapServer, Google Earth or Bing, among others. Thanks to the flexibility and portability of the mobile devices, it was possible for the archaeologist to interact directly with the platform at the field: recording data and adding new information with corresponding attributes and descriptions. An example is outlined in Figure 13, where the application is loaded in a smartphone BQ Aquaris E4.5 using Android 4.4.2 and Google Chrome 45. Results were incorporated to the archaeological information system and the spatial data infrastructure of the archaeological cultural heritage of Castilla La Mancha (ideARQ + SIA) [50].
Additionally, the optimal value of points and triangles for the proper management of 3D models in smartphones was examined. For this aim, three levels of simplification were analysed using three, two and one million(s) triangles, respectively. Afterwards, loading and operation times together with RAM were monitored in order to see the best simplification level for a conventional smartphone. Table 6 outlines the results obtained.
As we can see, with less than one million triangles, very good loading and operation times (instantaneous) are obtained, as well as an affordable RAM consumption for the majority of smartphones. Therefore, for optimal user experience and navigation for each visualization level (defined in terms of spatial resolution; see Section 3.2.5), the maximum display area is cropped accordingly to this empirical number of triangles.

5. Conclusions

This paper presents a methodology based on a combination of multiple sensors, platforms and techniques, which has been tested in a complex archaeological site. As is shown in the experimental results, the automation provided by the photogrammetric and laser techniques, along with the versatility of the aerial platforms (paratrike and Unmanned Aerial Vehicle UAV), provide the suitability of this methodology for complex archaeological sites.
The potential of ultralight aerial platforms (paratrike) is highlighted, due to its payload and flight autonomy, which overpasses the UAVs capabilities. Regarding the usual archaeological surveys, one of the main differential factors in this work has been the integration of aerial images at different resolutions, terrestrial images and terrestrial laser scans.
The generation of high resolution products based on photogrammetry requires high computational costs. To this end, the presented algorithms, such as Affine Scale Invariant Feature Transform ASIFT, have been developed to take advantage of Graphical Processing Unit GPU capabilities, reduce time operations and consequently improve workflow efficiency.
The management of the final models through a 3DGIS tool opens new analysis capabilities for the archaeologist (e.g., analysis though time, archaeological investigations, integration of historical and geometric models).
Finally, it has been demonstrated that through the simplification and optimization strategies, complex hybrid 3D modes which enclose 2D information can be flexibly shown through the Web and even embedded in smartphones. As a result, we can interact directly with hybrid 3D models using mobile devices, allowing the recording, storage and analysis of data in situ. The implemented methodology to optimize the visualization and interaction of geomatics products has proven to be effective. However, it lacks a fully complete user interaction, since the final navigation is constrained by the definition of the visualization level. To overcome this limitation, a future work line is aimed to a more efficient visualization management by the 3DGIS tool, avoiding the definition of level of visualization by the final user.
The technical case outlined in this paper could be of great interest for different stakeholders:
  • Researchers for the interpretation, spatial and temporal analysis of the archeological settlement thanks to the integration capabilities and portability of the system.
  • Managers through the monitoring of the archaeological settlement through time, the diffusion of the site using videos, documents, etc.
  • Students who could exploit the didactical possibilities of the 3D inspection, interaction and superposition of thematic information.
  • General public allowing a flexible and enjoyable accessibility to the archaeological settlement which complements and provides added value to a visit to an historical site.
The data acquisition and processing methodologies from Geomatic science broaden the possibilities of sensors, configurations and/or combination as future perspectives. Concretely, the resolution of the external orientation of the images directly, just using the integrated Global Navigation Satellites System GNSS/IMU Inertial Measurement Unit of the aerial platform, would allow us to speed up the field work and processing time. Furthermore, in order to obtain realistic textured models and orthoimages, the use of techniques such BRDF (Bidirectional Reflectance Distribution Function) to improve the radiometric parameters will be studied.

Acknowledgments

This research has been developed in the framework of the research project “Infraestructura de datos espaciales de patrimonio arqueológico de Castilla-La Mancha” (POII-2014-004-P) of the 2014-2017 Scientific Research Projects cofounded by the European Regional Development Fund. The authors would like to thank the Ministry of Education, Culture and Sport of Castilla-La Mancha, especially to the Directorate-General for Universities, Research and Innovation, the Directorate-General for Cultural and the Museum of Albacete. We also specially thank Lorenzo Abad Casal (University of Alicante), Sonia Gutiérrez Lloret (University of Alicante), Rubí Sanz Gamo (Museum of Albacete) and Blanca Gamo Parras (Museum of Albacete) for their support during the course of this study.

Author Contributions

All authors conceived, designed and performed the experimental campaign and the implemented methodology. José Alberto Torres processed and analysed the results. All authors wrote the manuscript.

Conflicts of Interest

The authors declare no conflict of interest.

Abbreviations

AGIAnalytical Graphics, Inc.
ASIFTAffine Scale Invariant Feature Transform
BRDFBidirectional Reflectance Distribution Function
CCRSCompound Coordinate Reference System
CRSCoordinate Reference System
DSMDigital Surface Model
DTMDigital Terrain Model
ETRS89European Terrestrial Reference System 1989
EPSGEuropean Petroleum Survey Group
GISGeographical Information System
GNSSGlobal Navigation Satellites System
GPSGlobal Positioning System
GPUGraphical Processing Unit
GSDGround Sample Distance
HTMLHyperText Markup Language
ICPIterative Closest Point
IMUInertial Measurement Unit
LSMLeast Squares Matching
MIMutual Information
MUSASMUltiSpectral Airborne Sensors
ORSAOptimized Random Sampling Algorithm
RAMRandom Access Memory
RANSACRandom Sample Consensus
RTKReal-Time Kinematic
SGMSemi-Global Matching
SIFTScale Invariant Feature Transform
TLSTerrestrial Laser Scanner
UAVUnmanned Aerial Vehicle
UTMUniversal Transverse Mercator
VRMLVirtual Reality Modeling Language
WMSWeb Map Service

Appendix: 3D Web Visualization

The management of a 3D textured model is a key part of any spatial data infrastructure. However, it requires an efficient visualization system to visualize the geometric and semantic information. In spite of the mesh simplification and optimization process mentioned in Section 3.2.5, it is possible to optimize the visualization of 3D models in terms of WebGL framework Cesium. Some authors [52] propose an approach based on a custom geometry loader implemented in the Cesium APIs. By this approach any 3D element is rendered and handled by the Cesium rendering code. However, these authors remark some drawbacks in terms of memory and performance. Another alternative is the employment of the GL Transmission Format (glTF) proposed in [53] which allows directly loading the data to the WebGL buffers. This format aims to be a standard for data exchange and rendering. Although this glTF format is able to deliver an arbitrary number of mesh data buffers within a single file, it completely lacks any mechanism for progressive data transmission. Trying to overcome this limitation, new file formats are being developed [54]. The basic idea would be to improve the data streaming by means of a Level of Detail (LoD) visualization in order to reduce the number of WebGL draw calls.
Following this line, the implemented solution is based on the optimization of visualization levels. For each user call, a specific 3D sub-model is loaded accordingly to the user position, view orientation and zoom level. This is a trade-off between the visualized area and the model resolution, keeping an optimal number of mesh triangles for an easy navigation in terms of loading time and user experience. The main drawback is that the final user navigation has to be constrained into a set of positions to avoid the movement outside the active visualization level. The generation of the 3D sub-models for visualization purposes implies a spatial resolution simplification, where the visualization areas are extracted according to the optimal number of triangles mentioned above. The 3D sub-models are created in a discrete number of levels, where the minimum allowed resolution change is established at 5%.

References

  1. Gomez-Lahoz, J.; Gonzalez-Aguilera, D. Recovering traditions in the digital era: The use of blimps for modelling the archaeological cultural heritage. J. Archaeol. Sci. 2009, 36, 100–109. [Google Scholar] [CrossRef]
  2. Bevan, A.; Li, X.; Martinón-Torres, M.; Green, S.; Xia, Y.; Zhao, K.; Zhao, Z.; Ma, S.; Cao, W.; Rehren, T. Computer vision, archaeological classification and China’s Terracotta Warriors. J. Archaeol. Sci. 2014, 49, 249–254. [Google Scholar] [CrossRef]
  3. González-Aguilera, D.; Muñoz-Nieto, Á.; Rodríguez-Gonzálvez, P.; Menéndez, M. New tools for rock art modelling: Automated sensor integration in Pindal Cave. J. Archaeol. Sci. 2011, 38, 120–128. [Google Scholar] [CrossRef]
  4. Hakonen, A.; Kuusela, J.-M.; Okkonen, J. Assessing the application of laser scanning and 3D inspection in the study of prehistoric cairn sites: The case study of Tahkokangas, Northern Finland. J. Archaeol. Sci. 2015, 2, 227–234. [Google Scholar] [CrossRef]
  5. Themistocleous, K.; Ioannides, M.; Agapiou, A.; Hadjimitsis, D.G. The methodology of documenting cultural heritage sites using photogrammetry, UAV and 3D printing techniques: The case study of Asinou Church in Cyprus. In Proceedings of the Third International Conference on Remote Sensing and Geoinformation of Environment, Cyprus, Nicosia, 16 March 2015; pp. 16–19.
  6. Lai, L.; Sordini, M.; Campana, S.; Usai, L.; Condò, F. 4D recording and analysis: The case study of Nuraghe Oes (Giave, Sardinia). Digit. Appl. Archaeol. Cult. Herit. 2015, 2, 233–239. [Google Scholar] [CrossRef]
  7. Torres, J.A.; Hernandez-Lopez, D.; Gonzalez-Aguilera, D.; Moreno Hidalgo, M.A. A hybrid measurement approach for archaeological site modelling and monitoring: The case study of Mas D’is, Penàguila. J. Archaeol. Sci. 2014, 50, 475–483. [Google Scholar] [CrossRef]
  8. Achille, C.; Adami, A.; Chiarini, S.; Cremonesi, S.; Fassi, F.; Fregonese, L.; Taffurelli, L. UAV-based photogrammetry and integrated technologies for architectural applications—Methodological strategies for the after-quake survey of vertical structures in Mantua (Italy). Sensors 2015, 15, 15520–15539. [Google Scholar] [CrossRef] [PubMed] [Green Version]
  9. Ortega-Terol, D.; Moreno, M.A.; Hernández-López, D.; Rodríguez-Gonzálvez, P. Survey and classification of Large Woody Debris (LWD) in streams using generated low-cost geomatic products. Remote Sens. 2014, 6, 11770–11790. [Google Scholar] [CrossRef]
  10. Hailey, T. The powered parachute as an archaeological reconnaissance vehicle. Archaeol. Prospect. 2005, 12, 69–78. [Google Scholar] [CrossRef]
  11. Herrero-Huerta, M.; Hernández-López, D.; Rodriguez-Gonzalvez, P.; González-Aguilera, D.; González-Piqueras, J. Vicarious radiometric calibration of a multispectral sensor from an aerial trike applied to precision agriculture. Comput. Electron. Agric. 2014, 108, 28–38. [Google Scholar] [CrossRef]
  12. Trimble Indoor Mobile Mapping Solution, TIMMS. Available online: http://www.applanix.com/solutions/land/timms.html (accesed on 15 February 2016).
  13. Viametris, Indoor Mobile Mapping System. Available online: http://viametris.fr/Produits_IMMS.php (accesses on 15 February 2016).
  14. Canter, P.; Stott, A.; Rich, S.; Querry, J. Creating georeferenced indoor maps, images and 3D models: Indoor mapping for high accuracy and productivity. J. Chart. Instit. Civ. Eng. Surv. 2010, 1, 20–22. [Google Scholar]
  15. Rivero-Juárez, J.; Martínez-García, E.A.; Torres-Mendez, A.; Mohan, R.E. 3D heterogeneous multi-sensor global registration. Procedia Eng. 2013, 64, 1552–1561. [Google Scholar] [CrossRef]
  16. Nilosek, D.; Sun, S.; Salvaggio, C. Geo-Accurate model extraction from three-dimensional image-derived point clouds. In Proceedings of the Algorithms and Technologies for Multispectral, Hyperspectral, and Ultraspectral Imagery XVIII, Baltimore, MD, USA, 23 Aril 2012.
  17. Geoweb3d—3D GIS Visualization. Available online: http://www.geoweb3d.com/ (accessed on 15 February 2016).
  18. WebGL Virtual Globe and Map Engine. Available online: http://cesiumjs.org/ (accessed on 15 February 2016).
  19. AGI—Software to Model, Analyze and Visualize Space, Defense and Intelligence Systems. Available online: http://www.agi.com/ (accessed on 15 February 2016).
  20. Le, H.S. An approach to construct SGIS-3D: A three dimensional WebGIS system based on DEM, GeoVRML and spatial analysis operations. In Proceedings of the 2nd IADIS International Conference Web Virtual Reality and Three-Dimensional Worlds, Freiburg, Germany, 27–29 July 2010; pp. 317–326.
  21. Von Schwerin, J.; Richards-Rissetto, H.; Remondino, F.; Agugiaro, G.; Girardi, G. The MayaArch3D project: A 3D WebGIS for analyzing ancient architecture and landscapes. Lit. Linguist. Comput. 2013, 28, 736–753. [Google Scholar] [CrossRef]
  22. Auer, M.; Agugiaro, G.; Billen, N.; Loos, L.; Zipf, A. Web-based visualization and query of semantically segmented multiresolution 3D models in the field of cultural heritage. Proc. ISPRS 2014, II-5, 33–39. [Google Scholar] [CrossRef]
  23. Takasu, T. RTKLIB: Open source program package for RTK-GPS. In Proceedings of the Free and Open Source Software for Geospatial (FOSS4G), Tokyo, Japan, 1–2 November 2009.
  24. Hernandez-Lopez, D.; Felipe-Garcia, B.; Gonzalez-Aguilera, D.; Arias-Perez, B. An automatic approach to UAV flight planning and control for photogrammetric applications: A test case in the Asturias region (Spain). Photogramm. Eng. Remote Sens. 2013, 79, 87–98. [Google Scholar] [CrossRef]
  25. 3D Measurement Technology from FARO. Available online: http://www.faro.com/ (accessed on 15 February 2016).
  26. Besl, P.; McKay, N. A method for registration of 3-D Shapes. IEEE Trans. Pattern Anal. Mach. Intell. 1992, 14, 239–256. [Google Scholar] [CrossRef]
  27. Fernández-Hernandez, J.; González-Aguilera, D.; Rodríguez-Gonzálvez, P.; Mancera-Taboada, J. Image-based modelling from Unmanned Aerial Vehicle (UAV) photogrammetry: An effective, low-cost tool for archaeological applications. Archaeometry 2015, 57, 128–145. [Google Scholar] [CrossRef]
  28. Morel, J.M.; Yu, G. ASIFT: A new framework for fully affine invariant image comparison. SIAM J. Imaging Sci. 2009, 2, 438–469. [Google Scholar] [CrossRef]
  29. Gruen, A. Adaptive least squares correlation: A powerful image matching technique. S. Afr. J. Photogramm. Remote Sens. Cartogr. 1985, 14, 175–187. [Google Scholar]
  30. Moisan, L.; Stival, B. A probabilistic criterion to detect rigid point matches between two images and estimate the fundamental matrix. Int. J. Comput. Vis. 2004, 57, 201–218. [Google Scholar] [CrossRef]
  31. Fischler, M.A.; Bolles, R.C. Random sample consensus: A paradigm for model fitting with applications to image analysis and automated cartography. Commun. ACM 1981, 24, 381–395. [Google Scholar] [CrossRef]
  32. Rieke-Zapp, D.H.; Nearing, M.A. Digital close range photogrammetry for measurement of soil erosion. Photogramm. Rec. 2005, 20, 69–87. [Google Scholar] [CrossRef]
  33. Hartley, R.; Zisserman, A. Multiple View Geometry in Computer Vision; Cambridge University Press: New York, NY, USA, 2003. [Google Scholar]
  34. Kraus, K.; Jansa, J.; Kager, H. Advanced Methods and Applications Volume 2. Fundamentals and Standard Processes Volume 1; Institute for Photogrammetry Vienna University of Technology: Bonn, Germany, 1997. [Google Scholar]
  35. Snavely, N.; Seitz, S.M.; Szeliski, R. Modeling the world from Internet photo collections. Int. J. Comput. Vis. 2008, 80, 189–210. [Google Scholar] [CrossRef]
  36. Deseilligny, M.P.; Clery, I. Apero, an open source bundle adjustment software for automatic calibration and orientation of set of images. ISPRS Int. Arch. Photogramm. Remote Sens. Spat. Inf. Sci. 2011, 38, 269–277. [Google Scholar]
  37. Kukelova, Z.; Pajdla, T. A minimal solution to the autocalibration of radial distortion. In Proceedings of the IEEE Conference on Computer Vision and Pattern Recognition, Minneapolis, MN, USA, 17–22 June 2007.
  38. Sturm, P.; Ramalingam, S.; Tardif, J.P.; Gasparini, S.; Barreto, J. Camera models and fundamental concepts used in geometric computer vision. Found. Trends® Comput. Graph. Vis. 2011, 6, 1–183. [Google Scholar] [CrossRef]
  39. Hirschmuller, H. Stereo processing by semiglobal matching and mutual information. IEEE Trans. Pattern Anal. Mach. Intell. 2008, 30, 328–341. [Google Scholar] [CrossRef] [PubMed]
  40. Micmac Website. Available online: http://www.tapenade.gamsau.archi.fr/TAPEnADe/Tools.html (accessed on 15 February 2016).
  41. Rothermel, M.; Wenzel, K.; Fritsch, D.; Haala, N. SURE: Photogrammetric surface reconstruction from imagery. In Proceedings of the LC3D Workshop, Berlin, Germany, 4–5 December 2012; pp. 1–9.
  42. Bourke, P. An algorithm for interpolating irregularly-spaced data with applications in terrain modelling. In Proceedings of the Pan Pacific Computer Conference, Beijing, China, 1 January 1989.
  43. Rodríguez-Gonzálvez, P.; Nocerino, E.; Menna, F.; Minto, S.; Remondino, F. 3D surveying & modeling of underground passages in WWI fortifications. Int. Arch. Photogramm. Remote Sens. Spat. Inf. Sci. 2015. [Google Scholar] [CrossRef]
  44. Kazhdan, M.; Bolitho, M.; Hoppe, H. Poisson surface reconstruction. In Proceedings of the 4th Eurographics Symposium on Geometry, Sardinia, Italy, 26–28 June 2006; pp. 61–70.
  45. Attene, M. A lightweight approach to repairing digitalized polygon meshes. Vis. Comput. 2010, 26, 1393–1406. [Google Scholar] [CrossRef]
  46. Varnuška, M.; Parus, J.; Kolingerová, I. Simple holes triangulation in surface reconstruction. In Proceedings of the ALGORITMY 2005, Vysoke Tatry, Podbanske, 13–18 March 2005.
  47. Garland, M.; Heckbert, P. Surface simplification using quadric error metrics. In Proceedings of the Special Interest Group on Computer Graphics and Interactive Techniques (SIGGRAPH), Los Angeles, CA, USA, 3 August 1997; pp. 209–216.
  48. Minto, S.; Remondino, F. Online access and sharing of reality-based 3D models. Sci. Res. Inf. Technol. 2014, 4, 17–28. [Google Scholar]
  49. Lorensen, W.E.; Cline, H.E. Marching cubes: A high resolution 3D surface construction algorithm. ACM Siggraph Comput. Graph. 1987, 21, 163–169. [Google Scholar] [CrossRef]
  50. Abad Casal, L.; Lloret, S.G.; Parras, B.G.; Guillen, P.C. El Tolmo de Minateda (Hellín, Albacete, España): Un proyecto de investigación y puesta en valor del patrimonio. Debates Arqueol. Mediev. 2012, 2, 351–381. [Google Scholar]
  51. IdeARQ + SIA. Available online: http://161.67.130.146/test/potree/puntos_fot_tolmo_2015/examples/puntos_fot_tolmo_2015.html (accessed on 15 February 2016).
  52. Prandi, F.; Devigili, F.; Soave, M.; Di Staso, U.; De Amicis, R. 3D web visualization of huge CityGML models. Proc. ISPRS 2015, 40, 601–603. [Google Scholar] [CrossRef]
  53. Robinet, F.; Cozzi, P. Gltf—The Runtime Asset Format for WebGL, OpenGL ES, and OpenGL. Available online: https://github.com/KhronosGroup/glTF/blob/master/README.md (accessed on 30 May 2016).
  54. Limper, M.; Thöner, M.; Behr, J.; Fellner, D.W. SRC-a streamable format for generalized web-based 3D data transmission. In Proceedings of the 19th International ACM Conference on 3D Web Technologies, Vancouver, BC, Canada, 8–10 August 2014; pp. 35–43.
Figure 1. Paratrike employed (a); detail of the stabilization platform “MUSAS” (b) and UAV used in complex areas (c).
Remotesensing 08 00550 g001
Figure 2. Multi-sensor and multi-data source workflow for the 3D reconstruction of complex archaeological sites.
Remotesensing 08 00550 g002
Figure 3. Example of image footprints projected over terrain (white line) and the different workspaces (red line). (a) Paratrike flight planned over the whole area and (b) UAV flight planned over “El Reguerón” area.
Remotesensing 08 00550 g003
Figure 4. TLS stations distribution (red circles), including the area surveyed with TLS during the different campaigns performed (first campaign in orange colour and second campaign in blue colour).
Remotesensing 08 00550 g004
Figure 5. An example of data fusion using Least Squares Matching (LSM) between the laser (Left) and photogrammetric (Right) point clouds.
Remotesensing 08 00550 g005
Figure 6. Aerial view of the study area “Tolmo de Minateda” (from [50]).
Remotesensing 08 00550 g006
Figure 7. Location of the defensive area “El Reguerón”.
Remotesensing 08 00550 g007
Figure 8. Multi-resolution 3D model of the archaeological settlement (a). Detailed 3D model of “El Reguerón” (b).
Remotesensing 08 00550 g008
Figure 9. Multi-resolution model of “El Reguerón” area (a) and detail for the wall (b).
Remotesensing 08 00550 g009
Figure 10. True orthoimages of the whole settlement (a) and defensive area “El Reguerón” (b).
Remotesensing 08 00550 g010
Figure 11. Archaeological sketch (a) overlapped with the 3D model (b).
Remotesensing 08 00550 g011
Figure 12. Analysis of discrepancies between the simplified-optimised 3D model and the original point cloud (Left) and a detailed comparison over the walled area (Right).
Remotesensing 08 00550 g012
Figure 13. “El Regueron” 3D model and its additional information loaded in a smartphone (Base model from: © Analytical Graphics, Inc., © CGIAR-CSI, Produced using Copernicus data and information funded by the European Union—EU-DEM layers, © Commonwealth of Australia (Geoscience Australia) 2012) [19].
Remotesensing 08 00550 g013
Table 1. Technical specifications of the paratrike.
MotorRotax 503 Two-Stroke Motor
TrikeTandem Trike AIRGES
Tandem paraglideMAC PARA Pasha 4 Trike 39 ó 42
Emergency systemBallistic parachutes GRS 350
Weight110 kg
Weight capability165–250 Kg
Air velocity range30–60 km/h
Table 2. Technical specifications of the Microdrone md4-200 platform.
UAV Weight900 g
Payloadup to 200 g
Size54 cm between rotors
Flight time10 to 20 min
Operating temperature−10 to 50 °C
Max. height flight500 m
Max. wind5 m/s
Table 3. Technical specifications of the terrestrial laser scanner (TLS), Faro Focus 3D.
ModelFaro Focus 3D
PrinciplePhase Shift
Wavelength905 nm (Near infrared)
Field of view360° H × 320° V
Range std. deviation2 mm at 25 m
Measurement range0.19 mrad
Beam divergence8 mm at 50 m
Scanning speed976,000 points/s
Table 4. Simplification and optimization results for “El Reguerón” area.
SimplifiedSimplified and Optimized
Number of points11,267,1222,816,853
Number of triangles22,532,7545,635,313
Spatial resolution * (Min, Avg, Max) (60.5, 64.3, 69.1) mm(69.2, 81.1, 98.9) mm
* Confidence Interval = 1σ.
Table 5. Geo-referencing errors.
Check PointsDiscrepancies with 3D Model Coordinates
X (m)Y (m)H (m)∆X (m)∆Y (m)∆XY (m)∆H (m)
621,321.4524,259,638.120448.6720.0050.0010.005−0.013
621,375.9334,259,646.226454.775−0.0090.0040.0090.032
621,416.2584,259,667.686463.6610.007−0.0110.0130.030
621,419.0224,259,658.232464.6180.0010.0080.0080.046
621,345.1854,259,659.272454.2670.0020.0180.0060.024
621,321.2984,259,660.311452.106−0.010−0.0260.0280.036
Table 6. Times and resources required with lighter models using mobile devices.
ModelNumber of PointsNumber of Triangles
3M1,408,6362,816,156
LoadOperationRAM consumption
10 s2–4 s2.39 GB
2M986,1501,971,309
LoadOperationRAM consumption
8 s1–3 s2.24 GB
1M493,198985,653
LoadOperationRAM consumption
3 sInstantaneous1.79 GB

