1. Introduction
Wildfire is an important environmental driver influencing ecosystem processes including the regeneration and diversification of plants and habitat. However, wildfires near semi-urban areas pose a significant risk to both life and property. Effective wildfire management and early warning systems are of key importance in saving lives and property. Wildfires are highly unpredictable making them difficult to predict and control. Firefighters depend on fire behaviour information to plan and carry out control measures. For example, fire front velocity is key when planning firebreaks, which typically involves clearing strips of vegetation in front of the fire to prevent the fire spreading. Fire surveillance data can provide the necessary information such as fire front speed and direction.
Several techniques are routinely used for wildfire surveillance such as ground sensor networks, aerial line-scans and satellite remote sensing [
1,
2]. Ground based sensors are often deployed in small-localized high-risk areas, but are costly to install and maintain. Aerial imagery provides more flexibility in terms of coverage, with a high initial investment. Satellite based remote sensing provides an ideal platform for wildfire surveillance in terms of both cost and coverage. Satellite based sensors can provide large area coverage, capturing a complete and comprehensive view of the fire. Depending on the sensor platform, observations range from once or twice daily observations to every 10 min. Moderate Resolution Imaging Spectroradiometer (MODIS) and Visible Infrared Imaging Radiometer Suite (VIIRS) are two widely used fire detection sensors. These polar orbiting sensors provide
and
spatial resolution detection capabilities, respectively, with four time daily and two time daily observations [
3,
4,
5,
6,
7,
8]. Geo-stationary sensors, on the other hand, can provide observations every 10–30 min, making them ideal for near real-time fire surveillance. The main drawback of these sensors is that they are designed as weather satellites with coarse spatial resolutions of around 2–4
.
Himawari-8 is a new geo-stationary weather satellite launched in October 2015 by Japan Meteorological Agency (JMA). On board is the Advance Himawari Imager (AHI) (Mitsubishi Electric for JMA, Tokyo, Japan) 16 channel mutli-spectral sensor with a
RED channel,
GREEN, BLUE and NIR (Near Infrared) channels. The remaining 12 channels are in the MIR (Middle Infrared) and TIR (Thermal infrared) region ranging from 1.6–13.3
with a
spatial resolution. In terms of coverage, AHI currently captures an entire hemisphere every 10 min covering the East Asia region [
9]. This paper investigates the use of the AHI sensor for near real-time wildfire surveillance. A new algorithm, AHI Fire Surveillance Algorithm (AHI-FSA), is proposed to map fire lines at
spatial resolutions every 10 min. The algorithm is based on utilizing three different spatial resolutions provided by the MIR, NIR and RED channels. Initial case studies of three fires shows the algorithm can effectively and accurately track the fire line at
resolution, demonstrating the viable applications of AHI-FSA algorithm for near-real time wildfire surveillance. The algorithm also shows potential for detecting small, low intensity fire compared to existing MODIS thermal anomalies data products.
Remote Sensing Fire Detection
The concept of assessment of fire at sub-pixel level for sensors with more than one channel in the thermal infrared region was originally introduced by Dozier [
10]. This bi-spectral method is based on the idea that
“If one part of a pixel is much warmer than the remainder, for example, that warm part will contribute proportionally more radiance to the signal in shorter wavelengths in the thermal Infrared than in longer wavelengths” [
10]. Taking forward the bi-spectral sub-pixel assessment technique Kaufman et al. [
11] introduced a contextual threshold based detection algorithm, which is currently used in the MODIS active fire algorithm [
3]. Contextual thresholds enable the algorithm to more effectively distinguish thermal variation due to fire from the background pixels that are non-fire or smoldering [
4,
5,
6]. The Current MODIS active fire algorithm “version 4” [
12] is the latest version of the initial algorithm with improvements made to detect smaller fires and reduce false detection.
The Automated Biomass Burning Algorithm (ABBA) is another algorithm derived from the same bi-spectral, sub-pixel detection technique. This algorithm was primarily developed for Geostationary Environmental Operational Satellite (GEOS) sensors [
13]. The algorithm uses visible channels to correct for surface albedo value, which aids in reducing the effects of solar contamination in the thermal channels. It has been demonstrated that the GEOS sensor with
thermal channels can detect fires as small as
at
(Kelvin) near the equator using ABBA algorithm [
13]. Several authors [
13,
14,
15] have further demonstrated the use of ABBA with the Spinning Enhanced Visible and Infrared Imager (SEVIRI) on board European Meteosat Second Generation (MSG) with 3 km thermal channels. Showing the possibility to detect fires as small as
at
near the equator using ABBA. Even though the discussed techniques have improved sub-pixel level fire detection, the reliability of the minimum fire size and intensity limits the use of geostationary sensor for fire monitoring [
7].
Based on the literature, it is assumed that by using existing sub-pixel thermal detection algorithms with the AHI sensor, fires as small as 0.5–0.2 ha could potentially be detected. Even though it is possible to detect much smaller fires at the sub-pixel level, the detection result can only point to the area of a 2 × 2 pixel (), which is not ideal for active fire surveillance operations. To effectively utilize the sensor for wildfire surveillance, it is vital that the location of the actual fire within the thermal channel be mapped at higher resolution. Thus, the new algorithm, AHI-FSA, introduced in this paper adopts a multi-spatial resolution approach to map the fire line at resolution. This is achieved via the NIR channels to detect burnt and unburnt vegetation and the RED channel to detect the edge between smoke and non-smoke areas.
2. Algorithm Development
The AHI-FSA algorithm takes advantage of the multi-spatial resolution data available via the AHI to map a burning fire line i.e., fire front at a resolution every 10 min. A condition of the algorithm is that wind is present throughout the duration of the fire. This implies that the fire line is also moving in the direction of the wind, thus, there is minimal or no smoke over the burnt area and dense smoke can be observed at the leading edge of the fire due to smoldering and burning. The algorithm also requires cloud free imagery, and also the dependence on NIR and RED channels to limit the algorithm to daytime surveillance only.
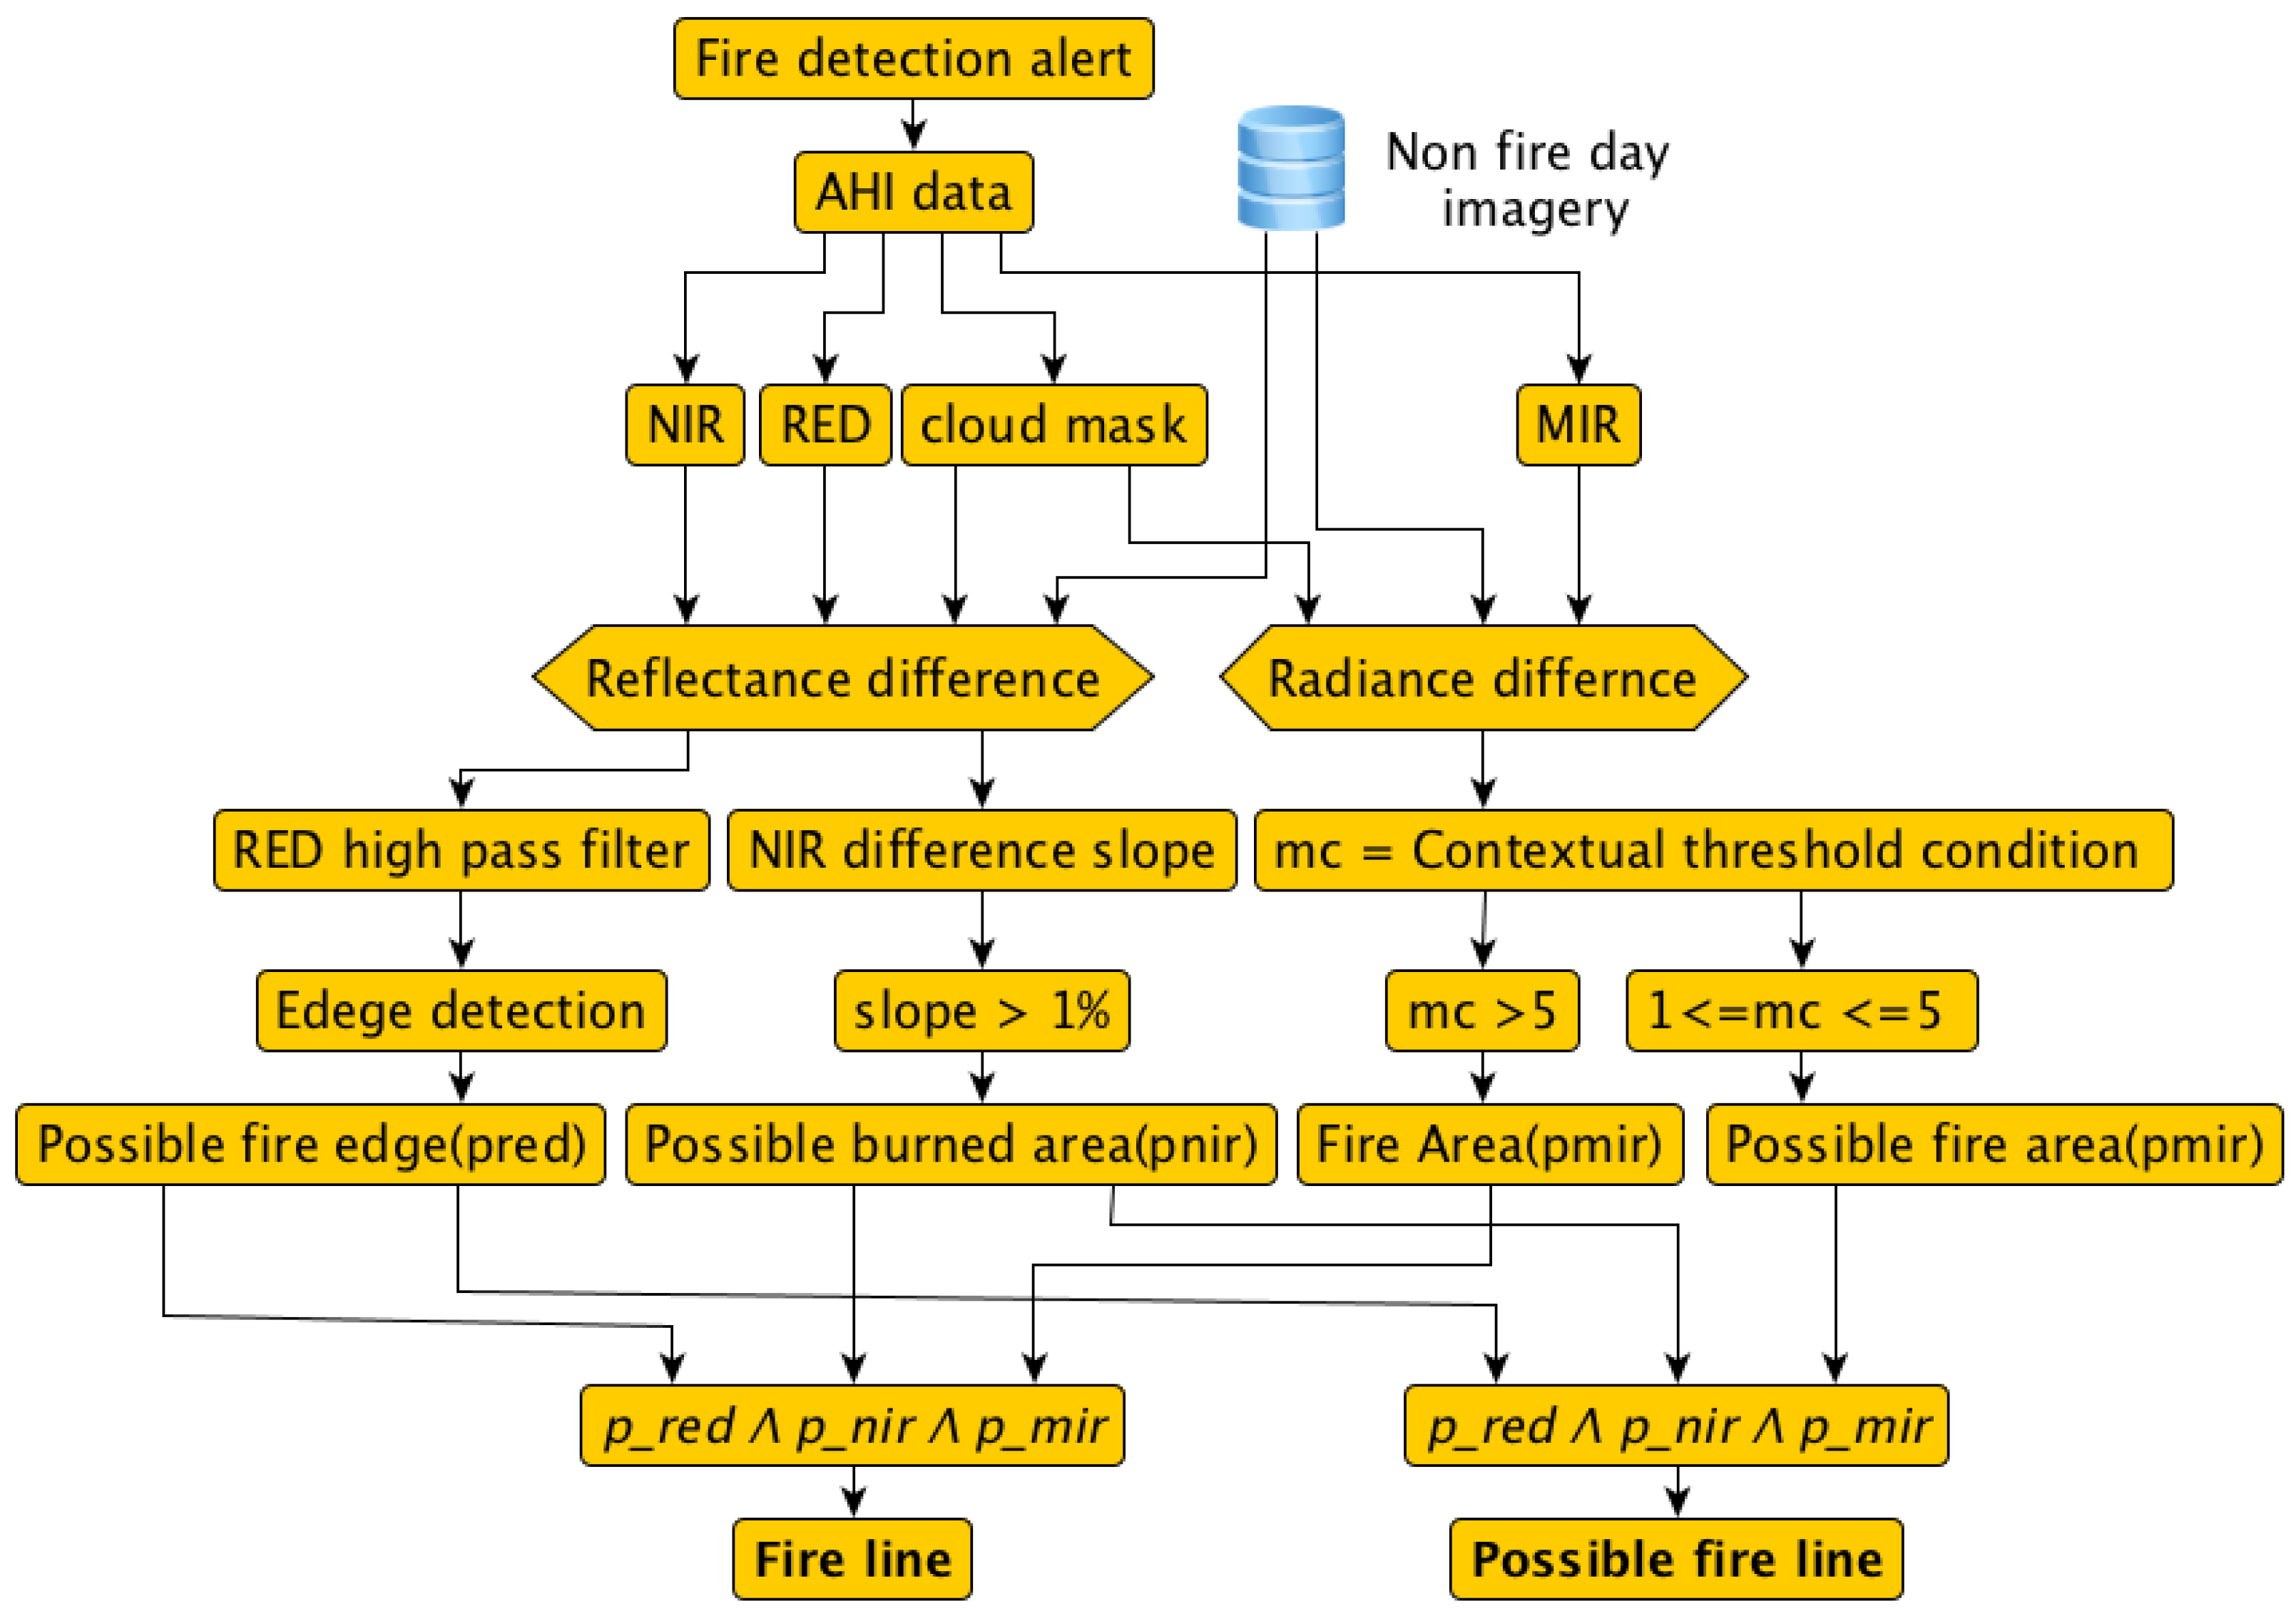
The algorithm is implemented using a four-step process. The first step is for the algorithm to reference the MIR channel to detect thermal anomalies at a sub-pixel level. A contextual filter is applied to MIR radiance difference between fire and non-fire imagery to identify anomalous pixels, and this is discussed in more detail in
Section 2.3. This will bound the fire to within a 2 × 2
(
) area. The second step utilises the NIR channel to distinguish between the burnt/partially-burnt and unburnt vegetation within the detected MIR pixel, improving the resolution to
. Once burning and partially burning areas have been identified, the RED channel is used in the third step to detect the edge between high smoke density and non-smoking pixels. The final step is to flag edge pixels as non fire pixels, possible active fire line pixels and fire line pixels. This improves the spatial resolution of active fire mapping from
to
.
Figure 1 shows a flow diagram of the algorithm and
Table 1 summarizes the AHI channels used. The algorithm is discussed in more detail in the following sections of this paper. In
Section 2.1, the daily behavior of the radiance/reflectance in MIR, NIR and RED channels is presented. In
Section 2.2, input data for the algorithm are discussed.
Section 2.3,
Section 2.4 and
Section 2.5 describe the threshold conditions used in the algorithm.
2.1. AHI Data
It is important to understand the diurnal cycle of land surface temperature observed by the AHI MIR channel to eliminate false detection of thermal anomalies. During a typical day, the earth’s surface temperature rises reaching a maximum around mid-day, before falling in the afternoon. Monitoring MIR radiance observations demonstrates this behavior. This is also true for NIR and RED channels, where increasing and decreasing illumination conditions during the day result in variation in the reflectance observed by the sensor. Variations between observations taken at the same time in two consecutive days may also be observed due to changes in atmospheric conditions. Much larger variation can be observed when looking at monthly/annual variations in the data. To illustrate this,
Table 2 shows the variation in differences in sensor observed MIR radiance and RED and NIR reflectance for five different landcover types urban, vegetation, grassland, bare earth and burnt areas. These values were calculated using data from 5 to 11 September 2015, for case study areas in Western Australia. The reflectance/radiance difference between two days from 9:00 a.m. to 4.00 p.m. (every 10 min) is calculated and averaged based on Equation (
1) to derive the daily variation, where
is the daily average in reflectance/radiance between the selected
and
days,
t is the time and
n is the number of observations for the particular day. The gap between the two days,
and
is increased sequentially from one to six days. Land cover based daily averages
are calculated for one week of data, and weekly average and standard deviation values are calculated as shown in
Table 2:
The results show considerable variation in surface reflectance and radiance within the same land cover, due to the daily variation in surface temperature and reflectance during the day. However, variation between land cover classes were small except when comparing burnt area to all other land covers. Thus, for the area under investigation, when determining reflectance/radiance differences, there appears to be little influence due to land cover. As shown in
Table 2, the maximum NIR reflectance difference between two land cover classes was 0.013 between urban and grass land (where burnt area is ignored), which is below the value for normal daily variation within a land cover type. Large drops in NIR and RED reflectance are observed due to removal/modification of the top vegetation layer in the burnt area. An increase in the difference of MIR radiance is observed, and this could be due smoldering or blackish surface heating up unevenly during the day.
2.2. Data Preparation
The input data for the algorithm include radiance/reflectance difference images computed using fire and non-fire day imagery with the same time stamp. To remove the impact of cloud cover, the non-fire day image is derived as an eight-day composite image. Existing cloud free procedures, such as the MODIS eight-day composite, have been shown to produce cloud free images using less than eight days of observation [
16]. When available, Himawari-8 cloud mask data products may be used to remove clouds from the fire day image [
17]. However, the current implementation of the algorithm requires the manual identification of cloud due to inaccuracy of the Himawari-8 cloud mask product as observed during the case study. The algorithm limits non-fire day imagery to be not earlier than eight days before the fire. This time constraint on the non-fire day imagery is to avoid the influence of seasonal changes that may affect the threshold conditions in the algorithm. For example, MIR radiance will be lower in winter compared to summer.
2.3. MIR Condition
The MIR
channel is close to the spectral maximum for radiative emissions observed for objects radiating at temperatures found in fires, and in regions of low solar and terrestrial radiation [
18,
19]. Wooster et al. [
19] demonstrated that MIR can be used to estimate the entire radiant energy from fire, while Calle et al. [
20] showed that a multi-temporal fire radiant energy calculation based on MIR radiance can be used to detect fires at sub-pixel level. Based on the above, the proposed algorithm depends only on the MIR channel to detect thermal anomalies. The proposed algorithm uses the MIR radiance difference image, produced from fire and non-fire day imagery to detect the fire. To increase the chances of detection of a small fire, a contextual threshold approach is adopted. Initially, a 3 × 3 pixel kernel is used, which is incrementally expanded up to a 15 × 15 pixel kernel stopping when
of pixels are classified as background pixels. Background pixels are then used to calculate the background mean and standard deviation using the radiance differences image computed from fire and non-fire day images. Once background pixel statistics are computed, Equation (
2) is applied to derive a contextual-based value (
f) for each pixel. Based on this (
f) value, the pixels are then classified as non-fire, possible-fire and fire as shown below.
2.4. NIR Conditions
The NIR is used by the algorithm to look at changes in vegetation cover in order to identify the burning edge at an improved spatial resolution of
. There are a number of techniques that have been developed to identify changes in vegetation from remotely sensed imagery [
21,
22,
23], most of which depend on using vegetation indices such as NDVI (Normalized Difference Vegetation Index). AHI can also be used to calculate NDVI at
by resampling the RED channel to this resolution. However, the proposed algorithm takes an alternative approach and does not use NDVI for vegetation change mapping for two reasons. Firstly, NDVI is sensitive to aerosols mainly due to high sensitivity of RED channel to aerosols [
24]. Secondly, the algorithm is not looking to quantify the vegetation changes but rather to identify the edge between burning and unburnt areas.
The NIR channel has a relatively higher reflectance over vegetation in comparison to the Red, Green and Blue channels. This suggests that a greater reduction in reflectance will be observed as a result of the burning of vegetation. The NIR also has the lowest influence of smoke out of the four channels [
25]. The algorithm calculates the gradient of change (expressed as a percentage) [
26] using the reflectance difference image from fire and non-fire day. By taking the slope, changes in the neighbouring pixels are also taken into account. High slope value means a higher drop in NIR compared to neighbouring pixels. The importance of calculating slope is that there is a positive and negative slope. A positive slope can be caused by smoke and a negative slope can only happen when vegetation cover is removed, in this case due to fire. Based on the three case studies, we have identified a slope value of –1% or lower as the threshold condition to flag NIR pixels as burning. This slope value is subject to change based on landcover type:
where
is difference NIR reflectance between fire and non-fire day imagery.
2.5. RED Conditions
In this step, the algorithm takes advantage of the RED channel to detect the edge of smoke affected areas within burning NIR pixels flagged using the NIR threshold condition. The RED channel is chosen because of its enhanced spatial (500 m) resolution and sensitivity to smoke. The RED channel typically shows higher reflectance over smoke [
25]. To further increase the detection of reflectance differences, a 3 × 3 high pass filter is applied to the RED reflectance difference (
) image [
27]. When considering only a fire event, observed RED reflectance will change due to smoke in the pixels or when pixels are burnt or are burning. It is easier to identify the boundary of these changes using an edge detection technique compared to using a threshold value to identify the edge of smoking pixels. These boundaries or edges can fall into one of three types: (a) smoke/burnt; (b) smoke/unburnt; and (c) burnt/unburnt. The results for all three types of edges are carried over to the final fire line classification stage, where (c) will be eliminated using MIR flagged fire pixels and (b) will be eliminated using NIR and MIR flagged pixels:
2.6. Fire Line and Hotspot Classification
The fire line or hotspot pixels (that is, pixels identified as fire boundaries) are identified by eliminating (b) and (c) type edges detected in the RED condition. Simple intersection is applied as shown in Equation (
6) to eliminate (b) and (c) edges; only flagged RED pixels that falls inside a flagged MIR and flagged NIR pixels will be identified as a fire line pixel, which leaves only the ‘smoke-burnt’ edges that can satisfy all three conditions. Based on the two confidence levels in MIR pixel, final fire line and hotspots are classified as either ‘fire’ or ‘possible fire’:
3. Case Study Method
3.1. Case Study Fires
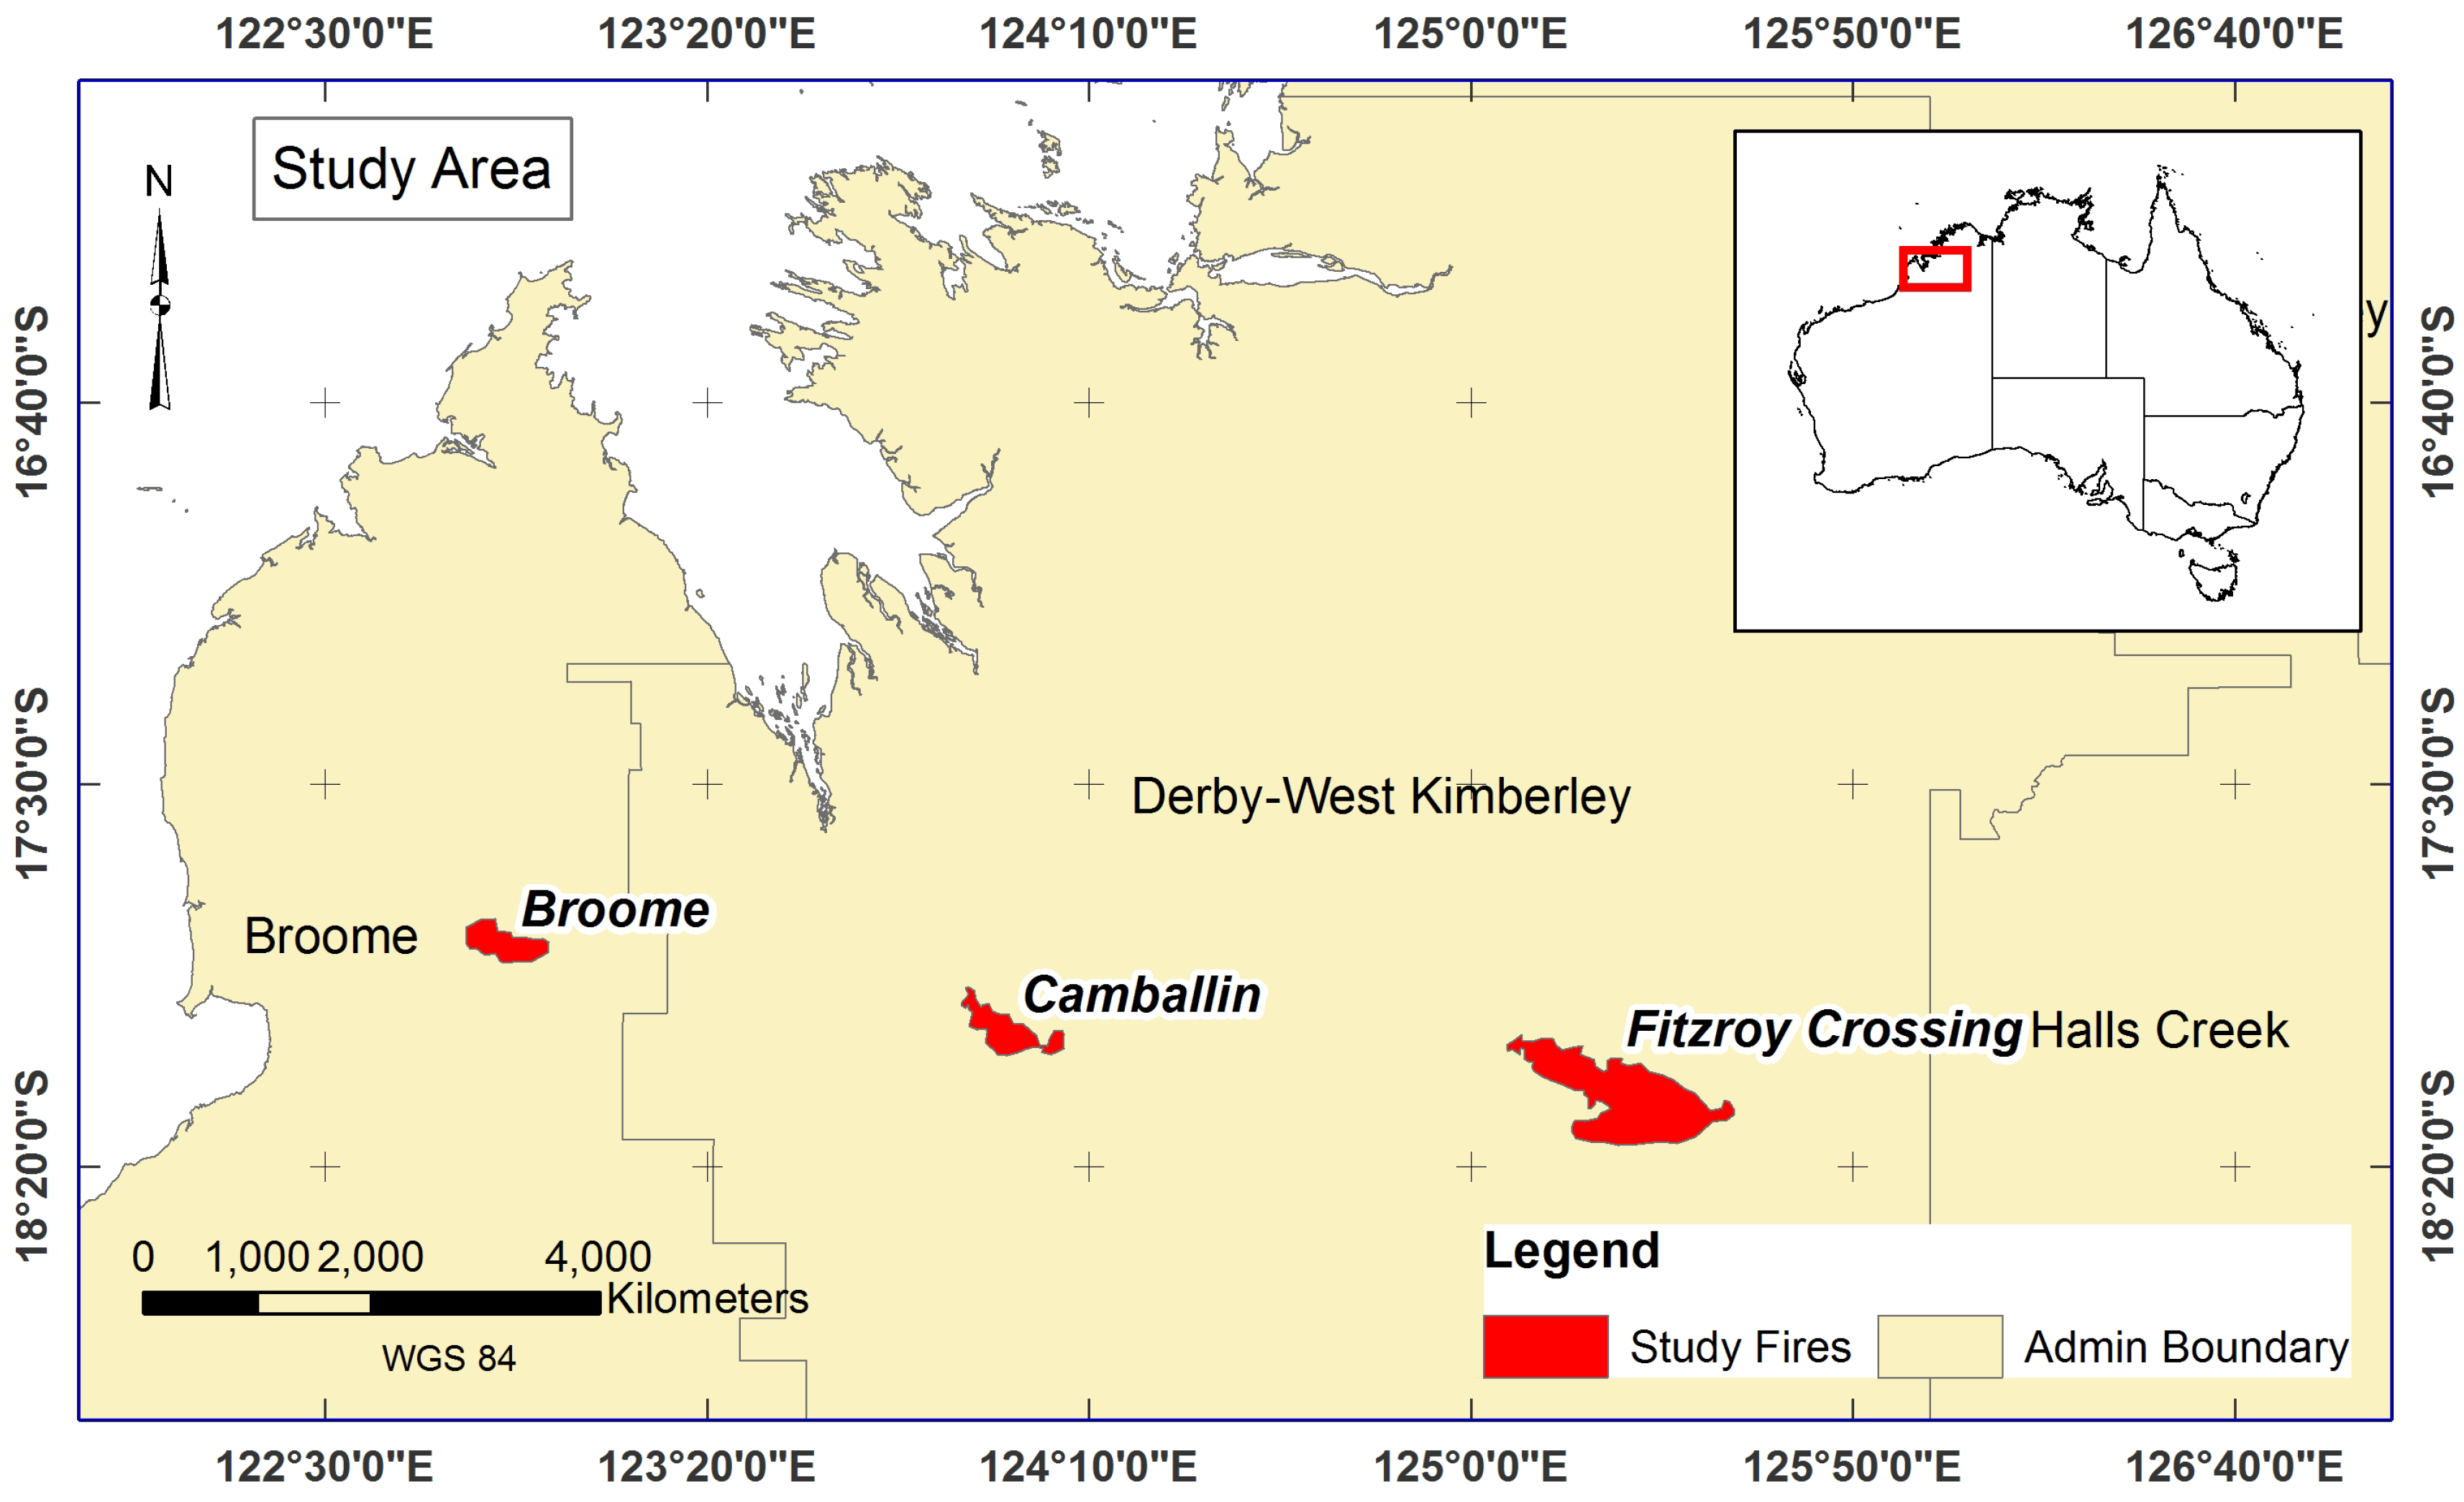
Three fires were chosen for preliminary evaluation of the AHI-FSA algorithm. These fires were near Camballin, Fitzroy Crossing and Broome in West Australia occurring on 9 to 14, 9 to 17 and 7 to 11 September 2015, respectively. The case study area
Figure 2, in which all fires occurred, are covered with sparse hummock grasses and saltbush. A single fire day was chosen for detailed investigation. The study fire day was picked as 10 September to avoid cloud throughout the day. Non-fire, cloud-free images were generated by creating a composite image for every 10 min time stamp using imagery from 1 to 8 September 2015. The AHI-FSA was run from 01:00 to 06:30 UTC (Universal Time Coordinated), which also covers the two MODIS day time passes over the fires.
3.2. Cross-Comparison Evaluation Method
The AHI-FSA algorithm results are compared with MODIS active fire products, which provides thermal anomalies at ground resolution. MODIS on board Terra and Aqua provides twice daily observations four hours apart. In this case, Terra observes at 01:40 UTC and Aqua at 06:00 UTC. MODIS active fire products provide the location of thermal anomalies typically associated with fires, including burning and smouldering/cooling-down areas. AHI-FSA, on the other hand, provides a detailed spatial definition of the burning edge or line of the fire. Thus, a direct comparison of the two different products is not possible. However, a visual inspection can be carried out by comparing the location of the fire line hotspots from the algorithm and the MODIS thermal anomalies. Comparison to the burnt area from 01:40 to 06:00 UTC (260 min) allows errors of commission to be determined. In this case, we considered any fire line pixels in the entire period, which occurred within the burnt area boundary to be true detections, and those outside of the boundary to be errors of commission. Errors of omission could not be determined using this method as the burnt area includes the area burnt outside of the case study time period. The burnt area was digitized, via visual inspection of changes in MODIS 7-2-1 false colour images from Terra and Aqua. AHI-FSA fire line hotspots results from 01:40–06:00 UTC were stacked to create a composite burnt area from AHI-FSA results. Visual inspection was also carried out based on Landsat-8 post fire image. Landsat-8 imagery was not used to calculate the commission error as Landsat image was observed eight days after the fire day.
4. Results
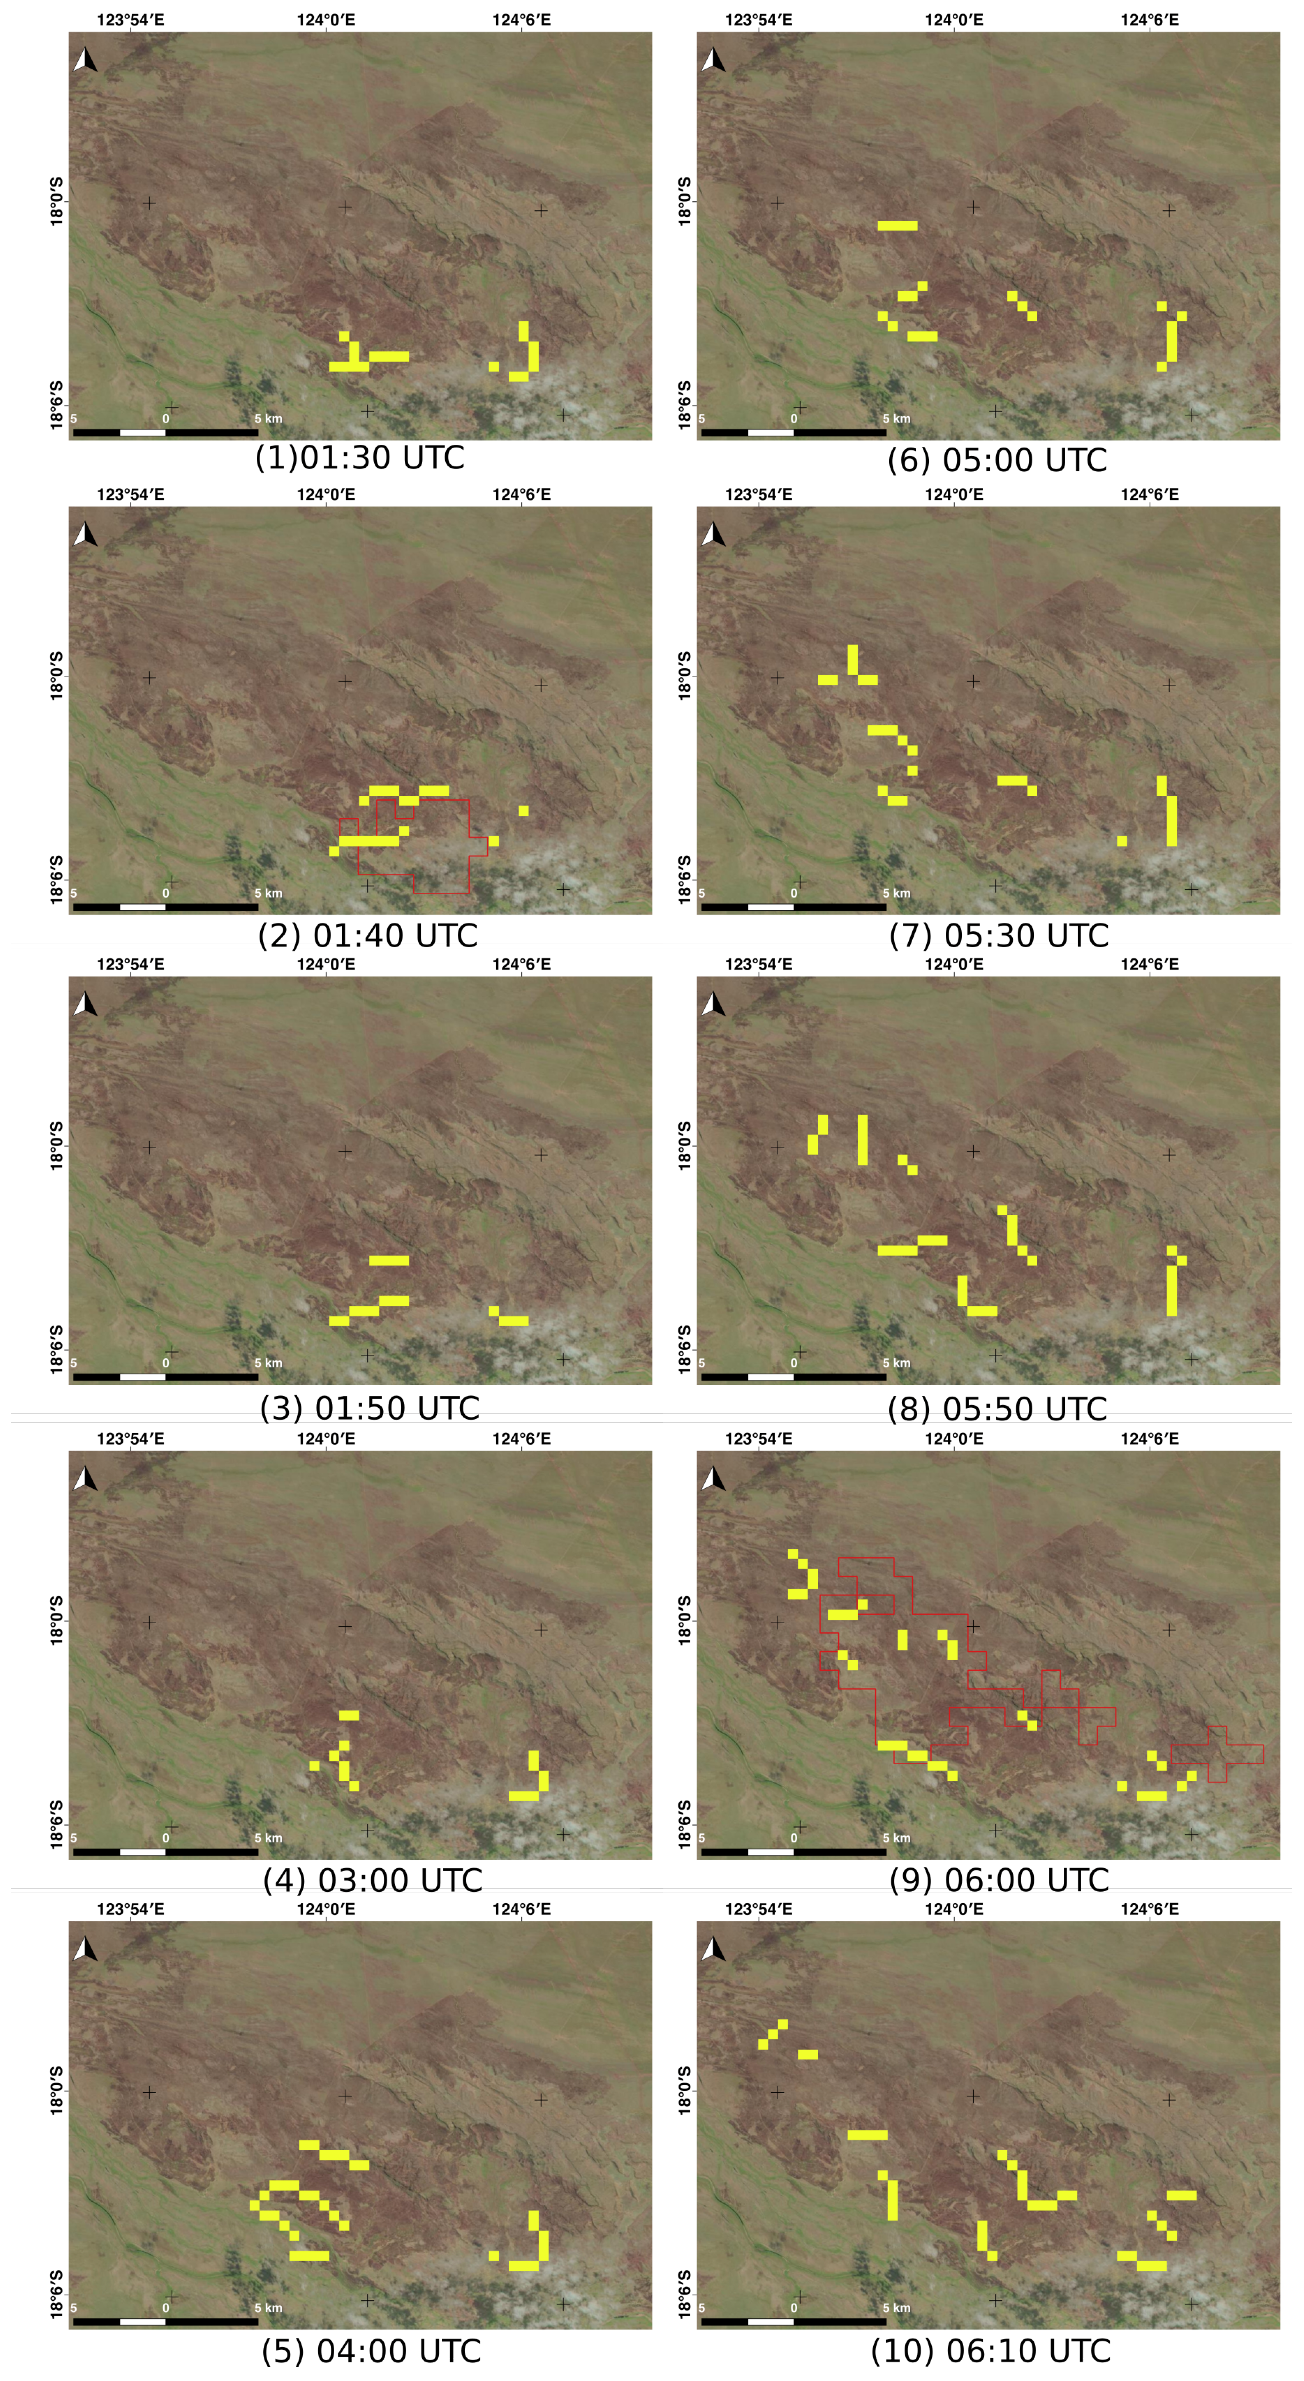
Time sequences of fire line hotspots derived from the algorithm for the 10 September 2015 for the Camballin fire are shown in
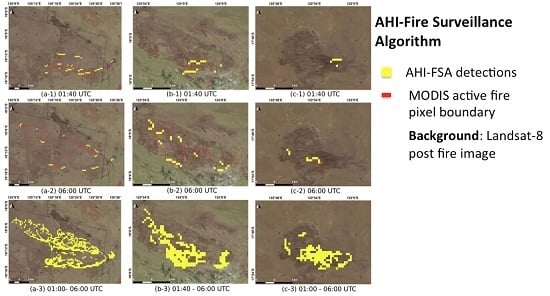
Figure 3. The sequential progression of the fire is clearly visible from the algorithm results. From the sequence of images, it is clearly visible that the main fire front is progressing in a north-westerly direction, with a smaller fire to the east progressing in an easterly direction. At 01:40 UTC, the MODIS data shows a single fire, however, at 06:00 UTC, and two fire fronts are visible in the MODIS product. This strongly supports the algorithm results during the MODIS observation gap to be accurate. Similar findings can be shown for other case study fires. Two separate fires at Fitzroy Crossing and Broome on the same day are shown in
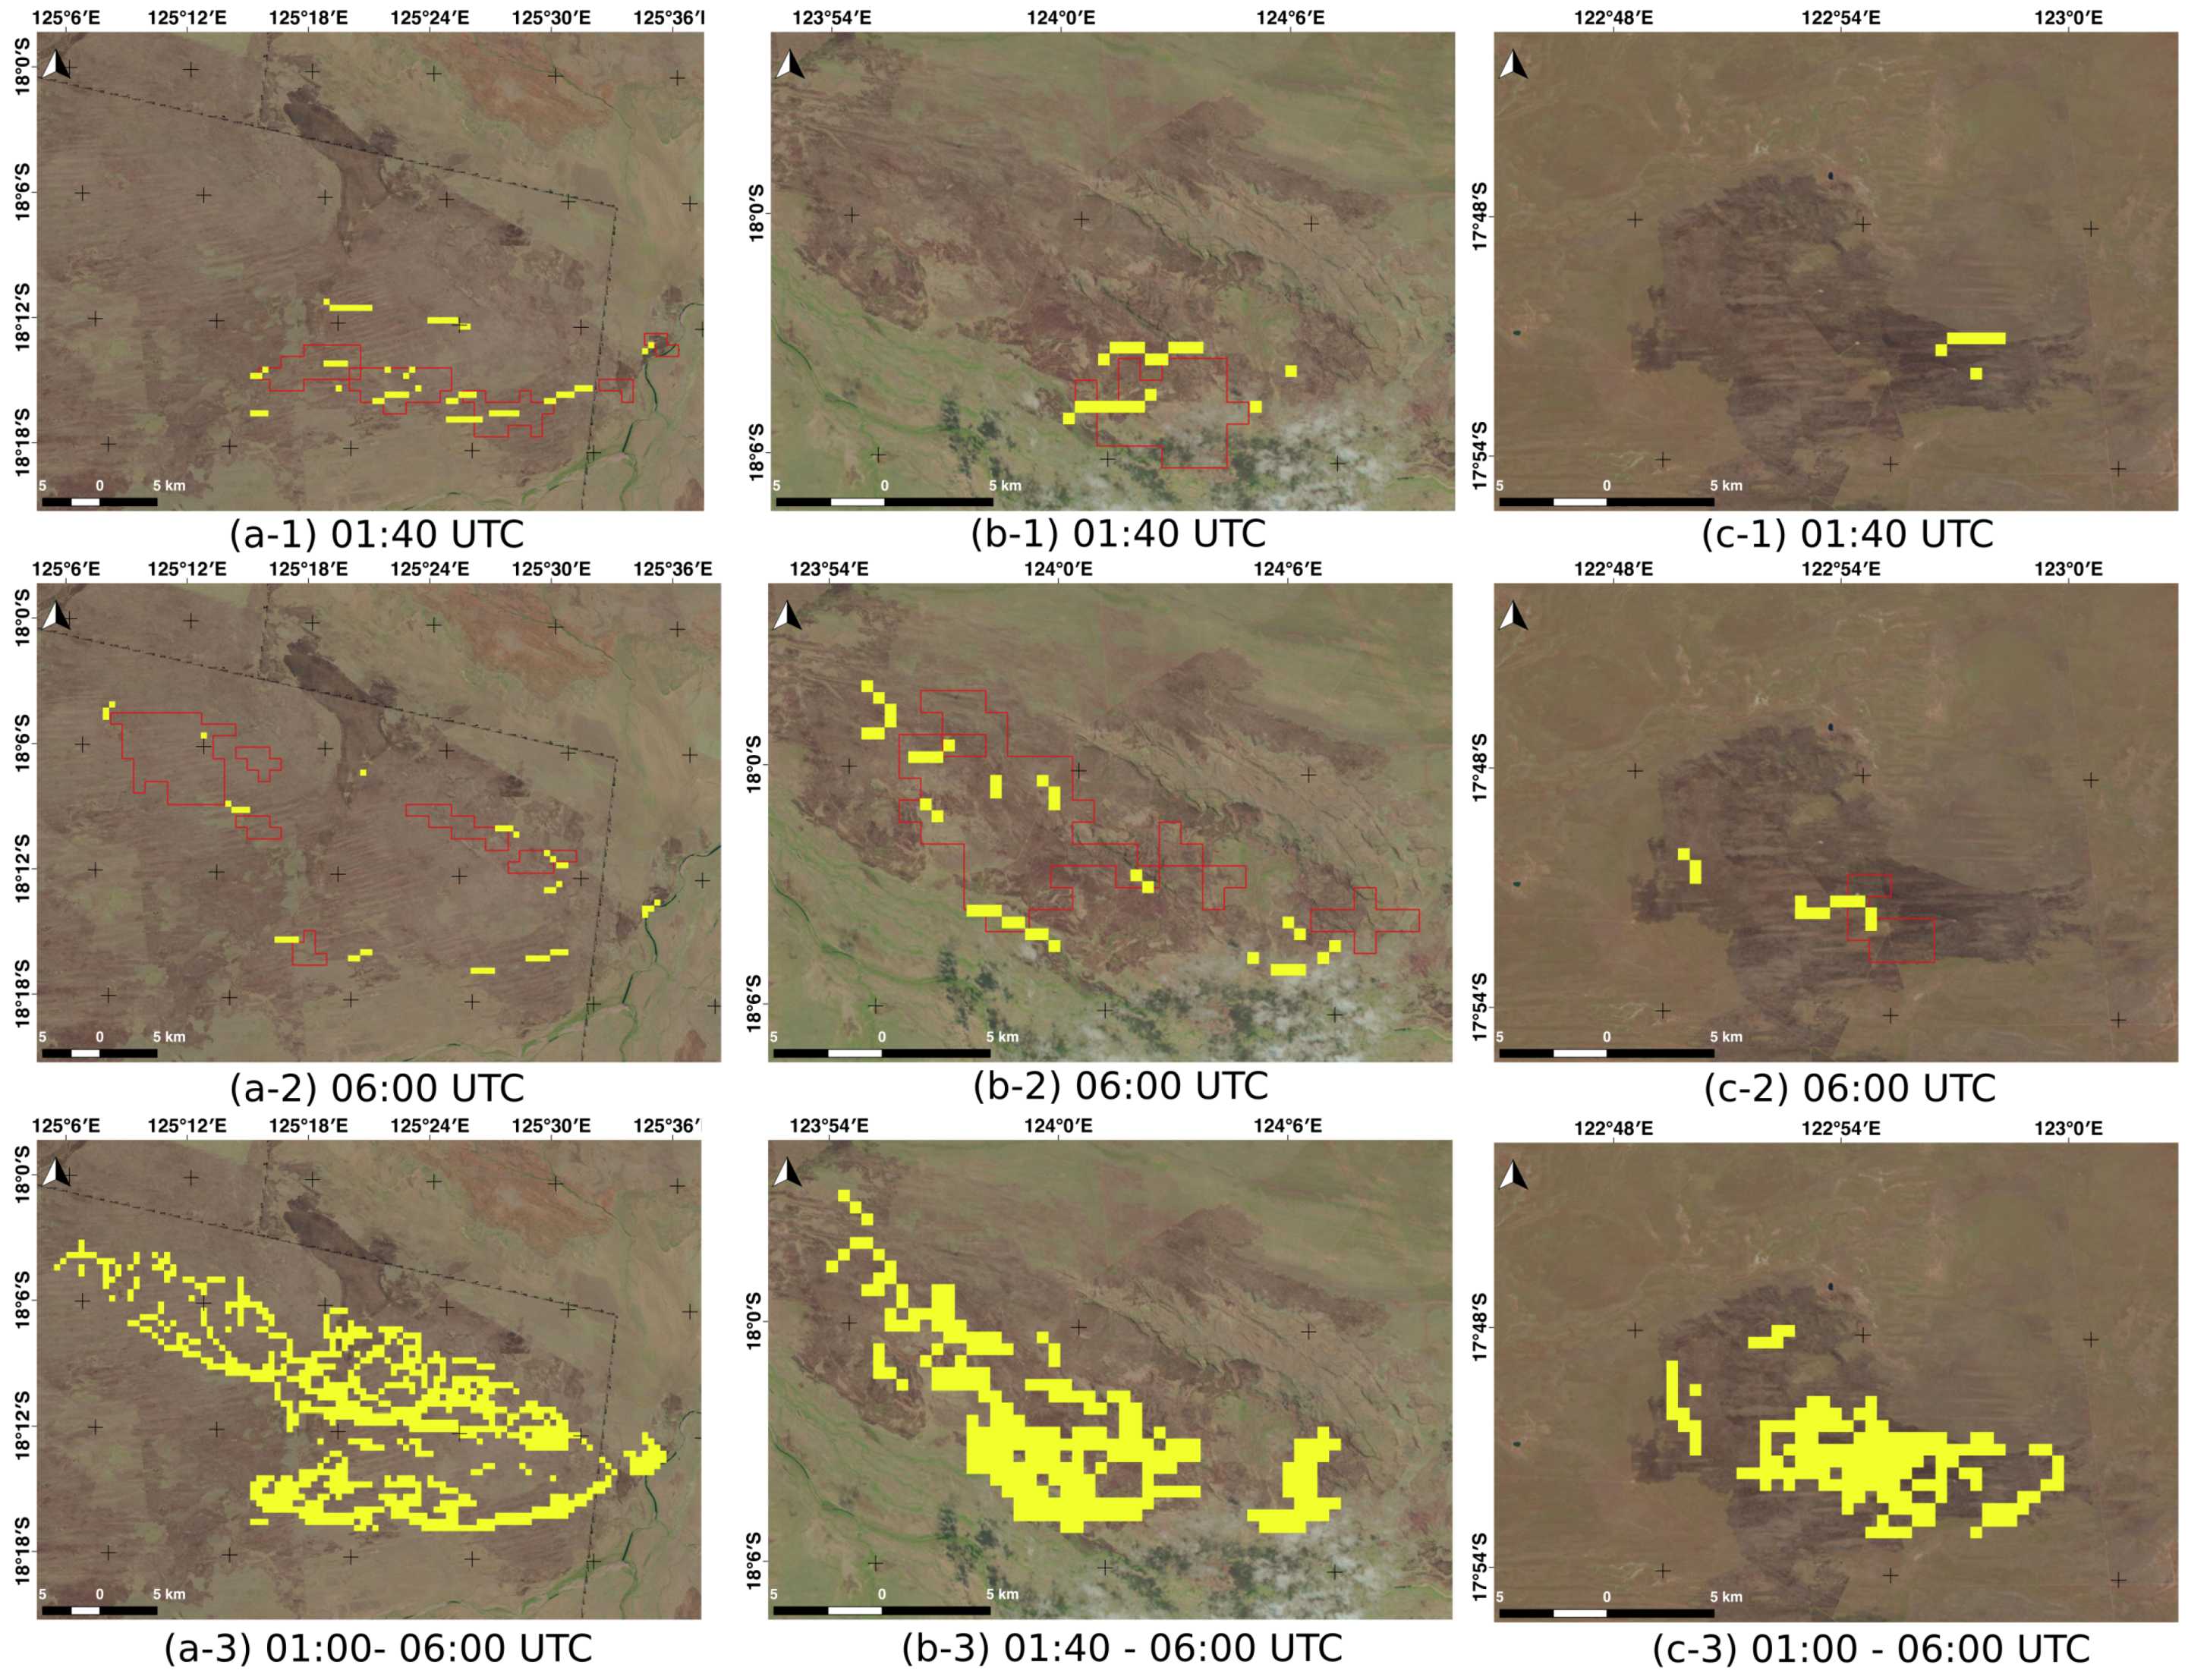
Figure 4. Both show early detection and fire progression by the AHI-FSA algorithm. In particular,
Figure 4 image c-1 shows that the Broome fire was detected only by the AHI-FSA at 01:40 UTC. Visual inspection with the background Landsat-8 post fire image shows most of the detected pixels fall within the actual burnt area. This indicates that the agreement between AHI-FSA fire lines and final burnt area. In comparison with MODIS data on
Figure 4, images a-1 and a-2, it is clear that around 01:40 UTC, the fire was moving in a south-westerly direction but had changed direction by almost 90 degrees by 06:00 UTC. The algorithm was able to show the fire line in the northern section of the fire beginning to burn with the changing wind direction, taking the fire in a north westerly direction. Demonstrating the importance of the high temporal information that is provided through the algorithm. Results of the cross-comparison evaluation are reported in
Table 3. Overall, the algorithm showed less than 20% commission error for the three case study fires.
5. Discussion
Wildfire surveillance is an important aspect of fire management, as such near real-time satellite monitoring systems will provide great benefits to fire agencies for wildfire management and response. The current MODIS thermal anomalies product provides a very low temporal resolution in terms of wildfire monitoring. In contrast, Himawari-8 AHI provides high temporal resolution (10 min) imagery, making it ideal for wildfire surveillance. Additionaly, spatial resolution in the MIR and TIR channels limits the use of existing fire detection algorithms, such as the MODIS active fire algorithm and WFABBA (Wildfire Automated Biomass Burning Algorithm), due to coarse resolution in these channels. In terms of wildfire monitoring applications, a resolution will not be sufficient to map the spatial detail of the fire, thus limiting the usability of AHI as a wildfire surveillance sensor. To address this challenge, the new AHI-FSA adopted the 1 km NIR and 500 m RED channel to improve the detection of fire line to 500 m. AHI-FSA tracks the boundary of the burning fire line at the time of observation. Thus, at a single time stamp, the algorithm captures only the edge fire pixels that fall in the direction of the spreading fire. The frequent mapping of fire edge detections can provide useful information relating to the behaviour of the fire, such as the speed and direction of travel at temporal and spatial resolution that improves upon current satellite based systems.
The validation method adopted herein provides cross validation with MODIS active fire products. Algorithm fire line detections are MODIS active fire products that are compared at similar time stamps and over all performances of the algorithm during four hours of observation, which are also validated. Initial results suggest AHI-FSA is able to track wildfire at 500 m resolution. The algorithm is shown to continuously track the case study fires, which occurred in scrub/grass land cover. In the study, AHI-FSA was also able to detect sudden changes in the fire with changing weather conditions, as shown in the Fitzroy Crossing fire. AHI-FSA detected a small fire line to the north of the MODIS hot spot at 01:40 UTC (
Figure 4 image a-1) and tracked the gradual progression of the fire in the north-west direction; this was confirmed by the 06:00 UTC hot spots detected by MODIS Aqua observation. During the case studies, AHI-FSA was able to track the fire with less than 20% commission error, sufficient for fire surveillance activities. Results also demonstrate the effectiveness of the MIR threshold condition to identify thermal variation comparable to MODIS even though MODIS MIR pixels are four times smaller than the AHI pixels. For example,
Figure 4(c-1) shows only AHI-FSA detected the fire at 01:40, which is later confirmed by the MODIS Aqua hotspots. This could be due to the fact that the AHI-FSA is looking at radiance difference between fire and non-fire day images, compared to MODIS active fire products using only the fire day image. Further studies are needed to identify the minimum changes in fire temperature that could be detected by the MIR contextual threshold method presented in this paper.
The RED channel based edge detection was also showed to be effective in mapping the edge between the smoking and burnt area. However, the dependence on wind to blow the smoke away from the burnt area means that low wind condition could affect the performance of the algorithm. The algorithm could also be affected by the burning material itself—for example, forests with thick undergrowth and dense canopies that can burn and smoulder continuously for a considerable length of time, thereby producing smoke long after the actual fire front has passed through, which could effect the edge detection. Thus, further studies must be carried out to test the performance of the algorithm in such different conditions.
To our knowledge, this is the first time three channels MIR, NIR and RED have been used in a fire surveillance algorithm. The algorithm has the potential to be used with other high temporal sensors such as Geostationary Operational Environmental Satellite (GEOS) with visible bands and thermal bands. Furthermore, the algorithm can easily be adopted to pick up continuously smouldering pixels by tracking non-moving pixels. Fire duration data can also be used in fire severity mapping, where fire intensity as well as duration is of importance.
6. Conclusions
This paper proposes a new algorithm that takes advantage of high temporal imagery provided by AHI for near real-time fire surveillance. The AHI-FSA algorithm overcomes the limitations of course resolution thermal channels in AHI by adopting a multi-spatial resolution approach. The AHI-FSA performed well in the Western Australian case study fires. Results showed the fire line continuously tracked at a 500 m resolution for the duration of the study period for all three case study fires, filling in the gap between MODIS Terra and MODIS Aqua observations and showing the progression of the fire quite accurately. Over 80% accurate detection was achieved in the case study application, indicating that the multi-resolution approach has been effective in bringing the initial 2 × 2 detection in thermal band to . Due to the high temporal resolution, it is possible to improve the timeliness and spatial accuracy of fire behavioral data, such as speed and direction of the fire, every 10 min. Initial validation shows that the algorithm can perform well in tracking fire using the multi resolution approach. However, further detailed validation must be carried out comparing with more MODIS active fire products and other remote sensing data. Tests must also be carried out to identify AHI MIR and RED channel sensitivity to thermal anomalies and smoke, respectively. AHI-FSA must also be validated in different land-cover conditions. Further development in terms of the algorithm would be to add temporal contextual awareness to the algorithm such as the state of the pixel in the previous time stamp. This would enable the algorithm to track status of the pixels such as non-fire, fire, and burnt area, and could reduce the false detection in the already burnt area.
Acknowledgments
International Postgraduate Research Scholarships (IPRS), an Australian Government scholarship program, is gratefully acknowledged for providing the study opportunity. The authors would also like to acknowledge the support of the Commonwealth of Australia through the Bushfire and Natural Hazards Cooperative Research Centre program, the Australian Bureau of Meteorology, Geoscience Australia, and the Japanese Meteorological Agency for use of AHI imagery associated with this research, along with the Australian National Computational Infrastructure for their advice and support with data access and services.
Author Contributions
Wickramasinghe conceived the initial algorithm concept. Wickramasinghe, Jones, Reinke and Wallace contributed to the development of the algorithm Wickramasinghe analyzed the case study fire results. Wickramasinghe prepared the manuscript. All authors provided editorial advice.
Conflicts of Interest
The authors declare no conflict of interest.
Abbreviations
The following abbreviatFmanuions are used in this manuscript:
| MODIS | Moderate Resolution Imaging Spectroradiometer |
| AHI | Advanced Himawari Imaginer |
| AHI-FSA | AHI-Fire Surveillance Algorithm |
| ABBA | Automated Biomass Burning Algorithm |
| MIR | Middle Infrared |
| NIR | Near Infrared |
| JMA | Japan Meteorological Agency |
| NDVI | Normalized Difference Vegetation Index |
| UTC | Universal Time Coordinated |
| SEVIRI | Spinning Enhanced Visible and Infrared Imager |
References
- Mengod, P.C. The influence of external factors on false alarms in an infrared fire detection system. Int. J. Wildland Fire 2015, 24, 261–266. [Google Scholar] [CrossRef]
- San-Miguel-Ayanz, J.; Ravail, N.; Kelha, V.; Ollero, A. Active fire detection for fire emergency management: Potential and limitations for the operational use of remote sensing. Nat. Hazard. 2005, 35, 361–376. [Google Scholar] [CrossRef]
- Giglio, L.; Descloitres, J.; Justice, C.O.; Kaufman, Y.J. An enhanced contextual fire detection algorithm for MODIS. Remote Sens. Environ. 2003, 87, 273–282. [Google Scholar] [CrossRef]
- Justice, C.O.; Giglio, L.; Korontzi, S.; Owens, J.; Morisette, J.T.; Roy, D.; Descloitres, J.; Alleaume, S.; Petitcolin, F.; Kaufman, Y. The MODIS fire products. Remote Sens. Environ. 2002, 83, 244–262. [Google Scholar] [CrossRef]
- Morgan, P.; Hardy, C.C.; Swetnam, T.W.; Rollins, M.G.; Long, D.G. Mapping fire regimes across time and space: Understanding coarse and fine-scale fire patterns. Int. J. Wildland Fire 2001, 10, 329–342. [Google Scholar] [CrossRef]
- Roberts, G.G.J.; Wooster, M.M.J. Fire detection and fire characterization over Africa using Meteosat SEVIRI. IEEE Trans. Geosci. Remote Sens. 2008, 46, 1200–1218. [Google Scholar] [CrossRef]
- Laneve, G.; Castronuovo, M.; Cadau, E. Assessment of the fire detection limit using SEVIRI/MSG sensor. In Proceedings of the 2006 IEEE International Symposium on Geoscience and Remote Sensing, Denver, CO, USA, 31 July–4 August 2006; pp. 4157–4160.
- Schroeder, W.; Oliva, P.; Giglio, L.; Csiszar, I.A. The New VIIRS 375m active fire detection data product: Algorithm description and initial assessment. Remote Sens. Environ. 2014, 143, 85–96. [Google Scholar] [CrossRef]
- Da, C. Preliminary assessment of the Advanced Himawari Imager (AHI) measurement onboard Himawari-8 geostationary satellite. Remote Sens. Lett. 2015, 6, 637–646. [Google Scholar] [CrossRef]
- Dozier, J. A method for satellite identification of surface temperature fields of subpixel resolution. Remote Sens. Environ. 1981, 11, 221–229. [Google Scholar] [CrossRef]
- Kaufman, Y.J.; Justice, C.O.; Flynn, L.P.; Kendall, J.D.; Prins, E.M.; Giglio, L.; Ward, D.E.; Menzel, W.P.; Setzer, A.W. Potential global fire monitoring from EOS-MODIS. J. Geophys. Res. Atmos. 1998, 103, 32215–32238. [Google Scholar] [CrossRef]
- Giglio, L.; Csiszar, I.; Restás, Á.; Morisette, J.T.; Schroeder, W.; Morton, D.; Justice, C.O. Active fire detection and characterization with the advanced spaceborne thermal emission and reflection radiometer (ASTER). Remote Sens. Environ. 2008, 112, 3055–3063. [Google Scholar] [CrossRef]
- Prins, E.M.; Feltz, J.M.; Menzel, W.P.; Ward, D.E. An overview of GOES-8 diurnal fire and smoke results for SCAR-B and 1995 fire season in South America. J. Geophys. Res. Atmos. 1998, 103, 31821–31835. [Google Scholar] [CrossRef]
- Koltunov, A.; Ustin, S.L.; Prins, E.M. On timeliness and accuracy of wildfire detection by the GOES WF-ABBA algorithm over California during the 2006 fire season. Remote Sens. Environ. 2012, 127, 194–209. [Google Scholar] [CrossRef]
- Prins, E.M.; Schmetz, J.; Flynn, L.; Hillger, D.; Feltz, J. An overview of diurnal active fire monitoring using a suite of international geostationary satellites. In Global and Regional Vegetation Monitoring from Space: Planning a Coordinated International Effort; SPB Academic Publishing bv: The Hague, The Netherlands, 2001; pp. 145–170. [Google Scholar]
- Roy, D.; Lewis, P.; Schaaf, C.; Devadiga, S.; Boschetti, L. The global impact of clouds on the production of MODIS bidirectional reflectance model-based composites for terrestrial monitoring. IEEE Geosci. Remote Sens. Lett. 2006, 3, 452–456. [Google Scholar] [CrossRef]
- Imai, T.; Yoshida, R. Algorithm theoretical basis for Himawari-8 Cloud Mask Product. Meteorol. Satell. Center Tech. Note 2016, 61, 1–17. [Google Scholar]
- Robinson, J.M. Fire from space: Global fire evaluation using infrared remote sensing. Int. J. Remote Sens. 1991, 12, 3–24. [Google Scholar] [CrossRef]
- Wooster, M.J.; Zhukov, B.; Oertel, D. Fire radiative energy for quantitative study of biomass burning: Derivation from the BIRD experimental satellite and comparison to MODIS fire products. Remote Sens. Environ. 2003, 86, 83–107. [Google Scholar] [CrossRef]
- Calle, A.; Casanova, J.L.; Moclan, C.; Romo, A.J.; Cisbani, E.; Costantini, M.; Zavagli, M.; Greco, B. Latest algorithms and cientific developments for forest fire detection and monitoring using MSG/SEVIRI and MODIS sensors. In Proceedings of the 2nd International Conference on Recent Advances in Space Technologies, RAST 2005, Istanbul, Turkey, 9–11 June 2005; pp. 118–123.
- Hayes, D.J.; Sader, S.A. Comparison of change detection techniques for monitoring tropical forest clearing and vegetation regrowth in a time series. Photogramm. Eng. Remote Sens. 2001, 67, 1067–1075. [Google Scholar]
- Lyon, J.G.; Yuan, D.; Lunetta, R.S.; Elvidge, C.D. A change detection experiment using vegetation indices. Photogramm. Eng. Remote Sens. 1998, 64, 143–150. [Google Scholar]
- Colditz, R.R.; Llamas, R.M.; Gebhardt, S.; Wehrmann, T.; Equihua, J. Comparison of change detection techniques for the Yucatan Peninsula using Landsat image time series. In Proceedings of the 2015 IEEE International Geoscience and Remote Sensing Symposium (IGARSS), Milan, Italy, 26–31 July 2015; pp. 1650–1653.
- Kaufman, Y.J.; Remer, L.A. Detection of forests using mid-IR reflectance: An application for aerosol studies. IEEE Trans. Geosci. Remote Sens. 1994, 32, 672–683. [Google Scholar] [CrossRef]
- Kaufman, Y.J.; Tanré, D.; Remer, L.A.; Vermote, E.F.; Chu, A.; Holben, B.N. Operational remote sensing of tropospheric aerosol over land from EOS moderate resolution imaging spectroradiometer. J. Geophys. Res. 1997, 102, 17051–17067. [Google Scholar] [CrossRef]
- Longley, P.; Maguire, D.J.; Rhind, D.W. Geographical Information Systems and Science, 2nd ed.; Wiley: Hoboken, NJ, USA, 2005; p. 328. [Google Scholar]
- Liu, J.G.; Mason, P.J. Essential Image Processing and GIS for Remote Sensing, 1st ed.; Wiley-Blackwell: Hoboken, NJ, USA, 2009; p. 44. [Google Scholar]
© 2016 by the authors; licensee MDPI, Basel, Switzerland. This article is an open access article distributed under the terms and conditions of the Creative Commons Attribution (CC-BY) license (http://creativecommons.org/licenses/by/4.0/).


