Article

Development of an NDIR CO2 Sensor-Based System for Assessing Soil Toxicity Using Substrate-Induced Respiration

1
Department of Bioresource Engineering, McGill University, 21111 Lakeshore Road, Ste-Anne-de-Bellevue, QC H9X 3V9, Canada
2
Department of Natural Resource Sciences, McGill University, 21111 Lakeshore Road, Ste-Anne-de-Bellevue, QC H9X 3V9, Canada
3
Department of Food Science and Agricultural Chemistry, McGill University, 21111 Lakeshore Road, Ste-Anne-de-Bellevue, QC H9X 3V9, Canada
*
Author to whom correspondence should be addressed.
Submission received: 22 December 2014 / Revised: 14 January 2015 / Accepted: 9 February 2015 / Published: 26 February 2015
(This article belongs to the Section Biosensors)

Abstract

:
The eco-toxicological indicators used to evaluate soil quality complement the physico-chemical criteria employed in contaminated site remediation, but their cost, time, sophisticated analytical methods and in-situ inapplicability pose a major challenge to rapidly detect and map the extent of soil contamination. This paper describes a sensor-based approach for measuring potential (substrate-induced) microbial respiration in diesel-contaminated and non-contaminated soil and hence, indirectly evaluates their microbial activity. A simple CO2 sensing system was developed using an inexpensive non-dispersive infrared (NDIR) CO2 sensor and was successfully deployed to differentiate the control and diesel-contaminated soils in terms of CO2 emission after glucose addition. Also, the sensor system distinguished glucose-induced CO2 emission from sterile and control soil samples (p ≤ 0.0001). Significant effects of diesel contamination (p ≤ 0.0001) and soil type (p ≤ 0.0001) on glucose-induced CO2 emission were also found. The developed sensing system can provide in-situ evaluation of soil microbial activity, an indicator of soil quality. The system can be a promising tool for the initial screening of contaminated environmental sites to create high spatial density maps at a relatively low cost.

1. Introduction

Soil pollution due to anthropogenic petroleum hydrocarbon (PHC) spills has become a major environmental hazard. Soil may become contaminated with these hydrocarbons due to their accidental discharge during transportation, leakage from storage tanks and pipeline ruptures [1]. Crude oil spillage has a significant effect on soil properties (e.g., soil pH, hydraulic conductivity, total nitrogen (N), available phosphorus (P)) that reduce the fertility of agricultural soils [2]. In addition, crude oil contaminated soils are proven to be toxic to both flora and fauna [3] and dangerous to human health [4]. Diesel oil is a complex petroleum hydrocarbon derived from crude oil distillation and is made up of low molecular weight alkanes and polycyclic aromatic hydrocarbons (PAHs) [5]. PAHs constitute 5%–30% of diesel oil [6]. In case of an uncontrolled industrial leakage of diesel oil in soil, the fate of PAHs poses a huge impact as they are toxic, carcinogenic and/or mutagenic priority micro-pollutants listed by the U.S. Environmental Protection Agency (U.S. EPA) [7]. Development of technologies to rapidly assess the scope and level of PHC pollution at a relatively low cost and within a short time provides a means of improving management decisions for site remediation.
Common approaches to determine the total concentration of hydrocarbon pollutants in soil focus on sophisticated, time consuming, laboratory-based gas chromatography techniques such as GC/FID, GC/MS and GC/FTIR. However, these methods involve lengthy extraction processes for target contaminants, large volumes of extraction solvents and require instruments with high infrastructure and operating costs [8]. Moreover, the toxic effect of a pollutant in the soil depends not only on its chemical properties and the quantity present, but also upon the amount that is bioavailable, to be absorbed or uptaken by biota [9]. Bioavailability of petroleum hydrocarbons is markedly affected by the soil properties, e.g., soil organic matter content (SOM) and the clay content [10]. Hence, the physico-chemical properties cannot replace biological assessments, which provide insight into the toxicity, synergistic or antagonistic effects of given pollutants [11]. Consequently, a battery of tests on soil biota [12] are used to determine the possible hazards of pollutants on soil ecology and are termed as eco-toxicological tests.
In eco-toxicology testing, the two most frequently used acute toxicity bioassays are the luminescence-based Vibrio fischeri test and the immobilization-based Daphnia magna test [13]. The extraction of the pollutant into soil leachate is an important step in these tests. Other standard methods include eco-toxicology tests for plants and earthworms developed to measure acute and chronic soil toxicity [14]. Although these tests are useful to identify the bioavailability of pollutants and involve a simple methodology and moderate sensitivity, they require considerable time, cost and expertise and have limited in-situ applicability. Hence, the focus of this study was to overcome the limitations of existing methods for soil eco-toxicity assessments.
Petroleum hydrocarbons have a significant impact on microbial community abundance [15], composition and diversity in soil depending upon the degree of hydrocarbon contamination [16]. Bacteria and fungi are susceptible to the toxic effects of such contaminants and once affected disturb the proper functioning of the soil [17]. Thus, the soil microbial activity in a hydrocarbon-contaminated soil can be used as an indicator of the level of the hydrocarbon contamination present in the soil. Assessment of soil respiration by measuring the soil CO2 production or O2 consumption allows the metabolic activity of soil micro-organisms to be quantified. [18]. Basal respiration (BR) is defined as respiration without adding any organic substrate to soil. The substrate-induced respiration (SIR) involves the measurement of microbial respiration of soil after adding an excess of a readily available nutrient source, usually glucose, to trigger microbial activity [19]. Anderson and Domsch [19] suggested that the respiration rate induced by glucose is proportional to the size of the original soil microbial biomass and hence, can be used as an indicator to determine the microbial biomass in the sample.
The quotient of the actual (basal) and potential (substrate-induced) respiration rate was correlated with PAH concentration at a contaminated site [20]. Margesin et al. [21] used SIR as one of the monitoring parameters during the decontamination of a mineral-oil-contaminated soil. Currently, CO2 evolved by microbial respiration from soil samples is determined by a simple colorimetric reaction in gas absorbent alkali [22]. This method is cost ineffective when a large number of samples are tested as it involves replacement of the CO2 probe with each sample [23].
The reason that SIR could be adapted to a rapid, sensor-based detection method is due to the short time-frame of microbial response. Upon the addition of the substrate, respiration rapidly increases to a maximum and remains at a constant rate for more than 4 h [24]. Anderson and Domsch [19] made CO2 emission measurements after 1 h incubation with glucose and correlated them with absolute soil microbial biomass. Lin and Brookes [25] chose 0.5–2.5 h after the glucose addition as the best estimator of the SIR rate. Ananyeva et al. [26] recorded CO2 emissions within 2–5 h after the application of glucose to evaluate respiration differences between unamended and amended soil samples with added solid and aqueous glucose. Dilly [27] measured CO2 emission within 4–24 h after the addition of glucose and targeted the calculation of microbial respiration quotients. The recent studies support a time span of 8–24 h [23,28] to estimate soil carbon (C), N and P mineralization and to correlate soil biological activity with potentially mineralizable N. The other consideration is the soil water content (SWC), which affects substrate diffusion throughout the soil sample and therefore, the reliability of the SIR measurement [29]. Adding a substrate solution instead of a powder gives the best distribution of substrate in soil and is analytically convenient. However, using a substrate solution might cause underestimation of CO2 due to its retention in solution [30]. The quantity of substrate needed to achieve a saturated respiration response also needs to be determined for each soil and depends upon the physical and chemical properties of the soil [19].
To improve the efficiency of soil microbial respiration-based methods, a number of simplified CO2 sensors are available now [31]. Based on the sensing mechanism, these CO2 sensors can be broadly classified as electrochemical (or solid state) and optical sensors [32]. Electrochemical CO2 sensors are based on a variety of principles (amperi-, conducto-, and potentiometry) and materials (metal oxides, polymers, ceramics, or sol-gel) [33,34]. They can be further divided into metal oxide [35], NASICON [36] and polymer-based CO2 sensors [37]. They make use of micro-electro-mechanical systems (MEMS) and nanotechnologies and are highly sensitive, but suffer from problems of limited measurement accuracy and short-time stability [32]. The most common commercially available CO2 sensors are non-dispersive infrared (NDIR) detectors because of their low cost, compact size, easy process control, mass production, and continuous measurement [38].
NDIR CO2 sensors (Figure 1) consist of a pulse-driven IR lamp (i.e., light source), a perforated sampling tube (or chamber), two optical filters, and two IR detectors (thermopiles) [39]. A reflection mirror is attached behind the IR lamp, and an inner wall of the pipe is plated to make emitted IR reach the thermopiles. One thermopile monitors the intensity of light through an optical bandpass filter with 4.0 µm center wavelength, and the other measures the IR absorption due to CO2 concentration through an optical bandpass filter with a 4.26 µm center wavelength. The difference of these two raw signals provides the sensor output [40].
Figure 1. Internal structure of an NDIR CO2 sensor, adapted from [40].
Sensors 15 04734 g001
The basic principle of NDIR CO2 sensors is the energy absorption characteristics of CO2 in the infrared region [41]. CO2 is known to absorb infrared radiation at wavelengths of 2.7, 4.3 and 15 µm [42]. Generally, the wavelength of the near 4.3 µm region is preferred because of maximum absorption and insignificant interference at this band. The radiation emitted at this wavelength is associated with the carbon dioxide by the Lambert-Beer law [43,44] given by:
I d I 0 = e α c l
where Id is the intensity of the radiation detected at a wavelength of 4.26 µm, I0 is the intensity if the incident radiation, α is the absorption coefficient of the CO2, c is the CO2 concentration and l is the optical path length from the source to the detector.
The availability of these low cost NDIR CO2 sensors can be harnessed to measure soil respiration by integrating these sensors into different chamber techniques developed to measure soil CO2 efflux in-situ due to their small size, low cost, easy maintenance and suitable measurement range. The objectives of this study were (1) to develop and evaluate an NDIR-based CO2 sensor system suitable for in-situ deployment to measure soil CO2 emission in response to the added glucose, based on the SIR method; and (2) to investigate its suitability for toxicity assessment of diesel-contaminated soils.

2. Experimental Section

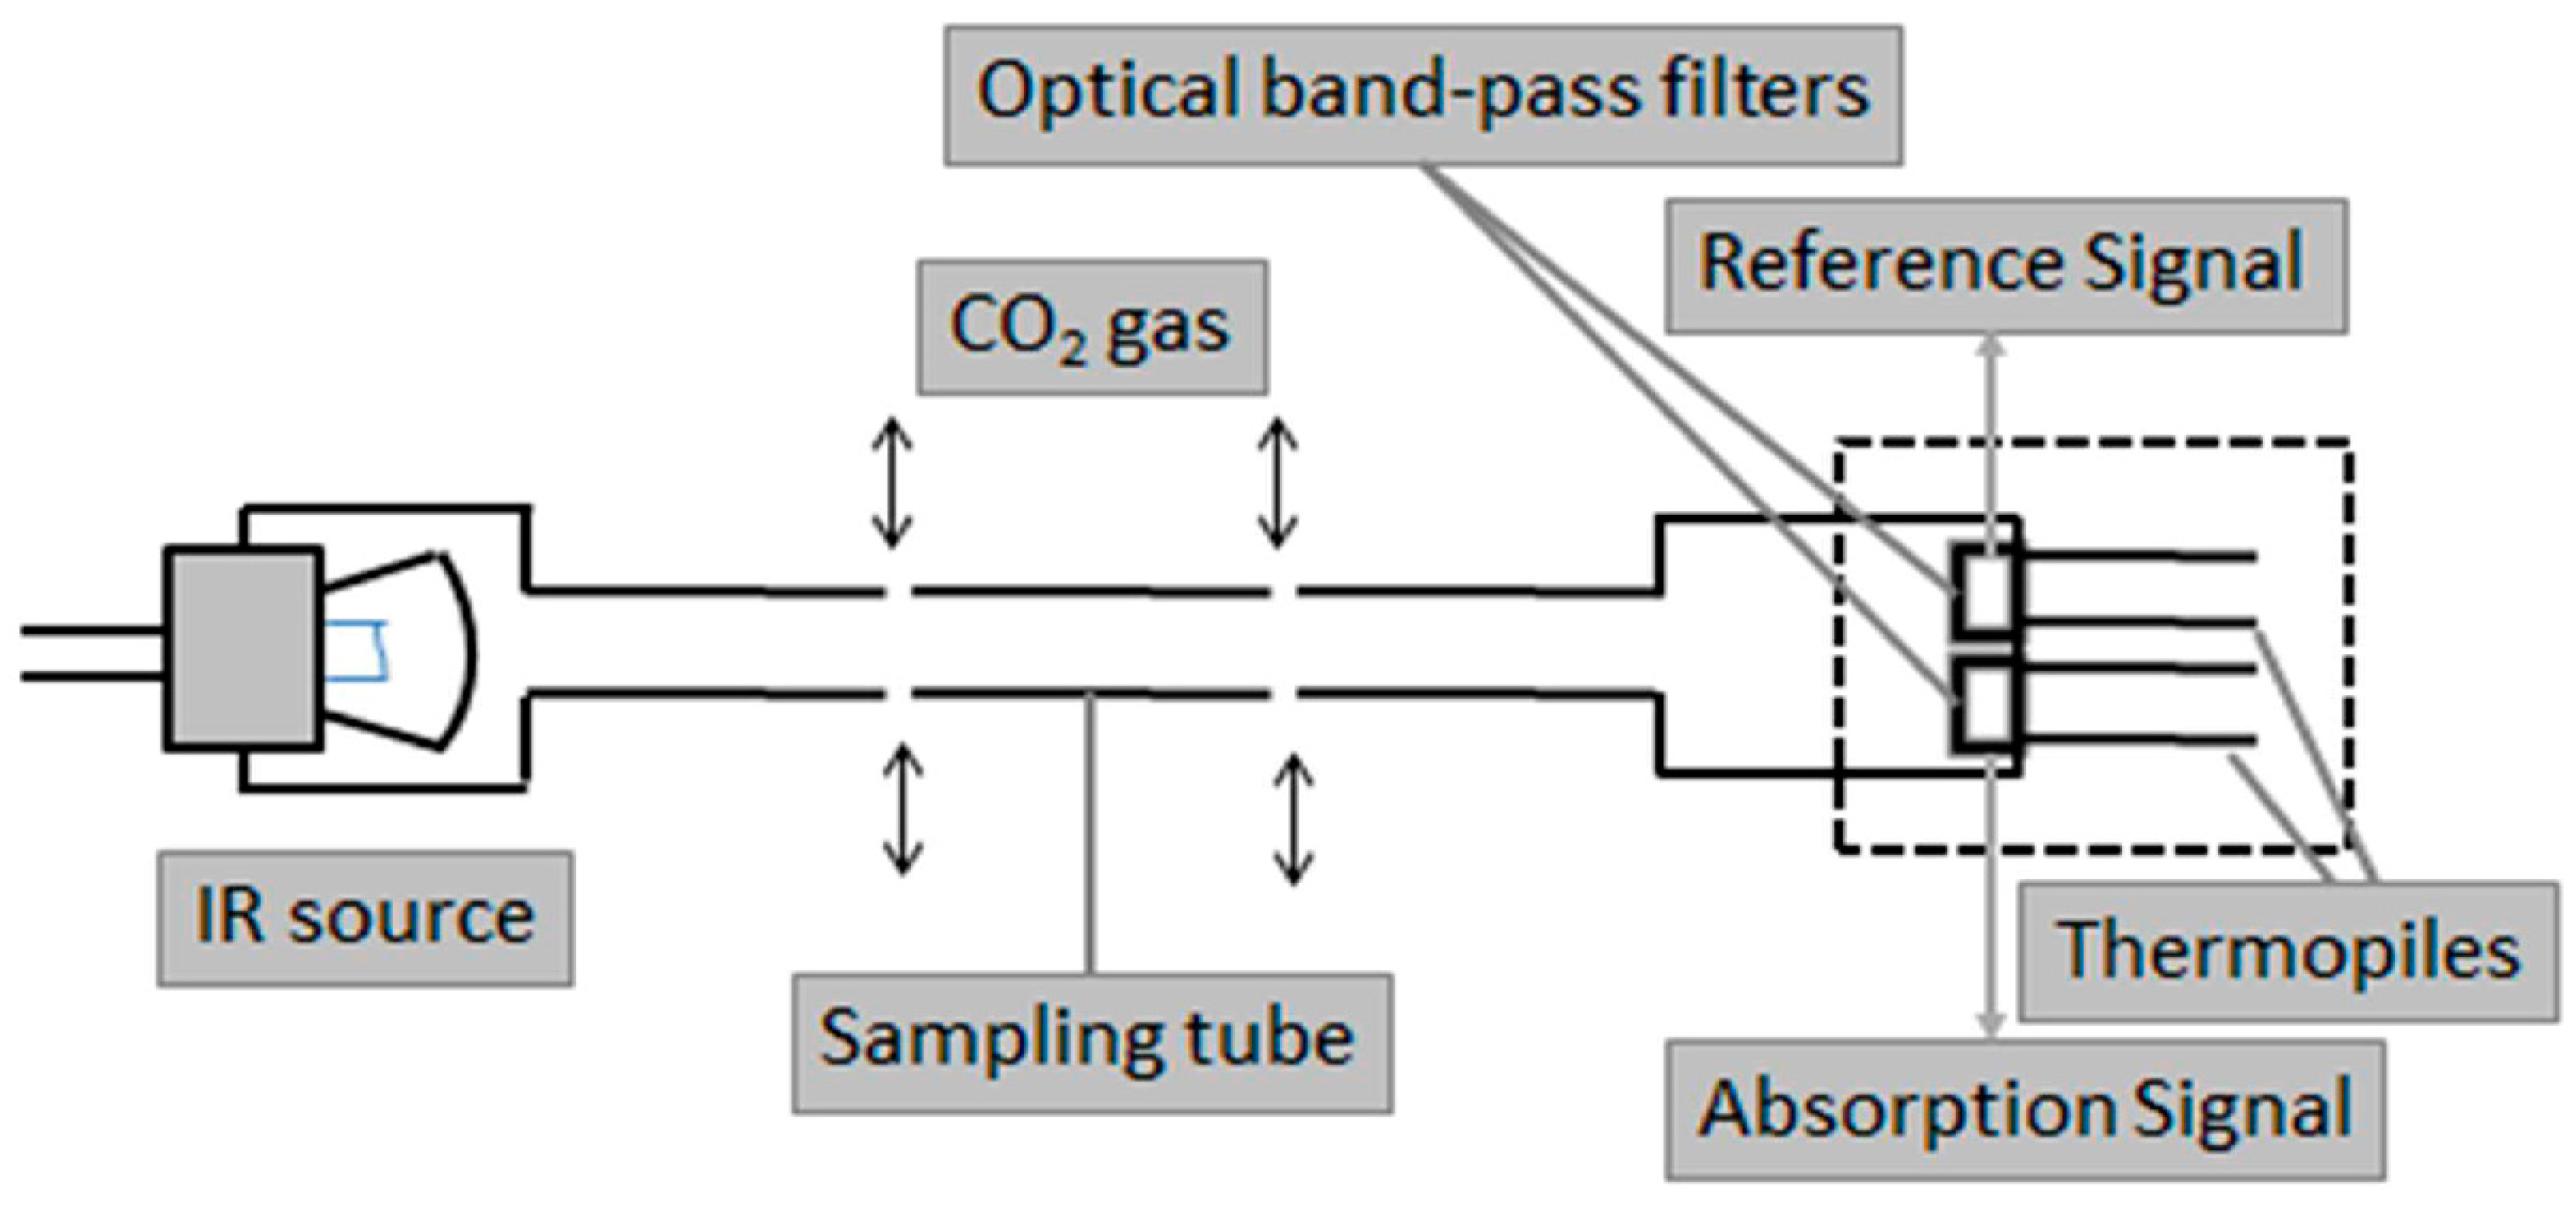
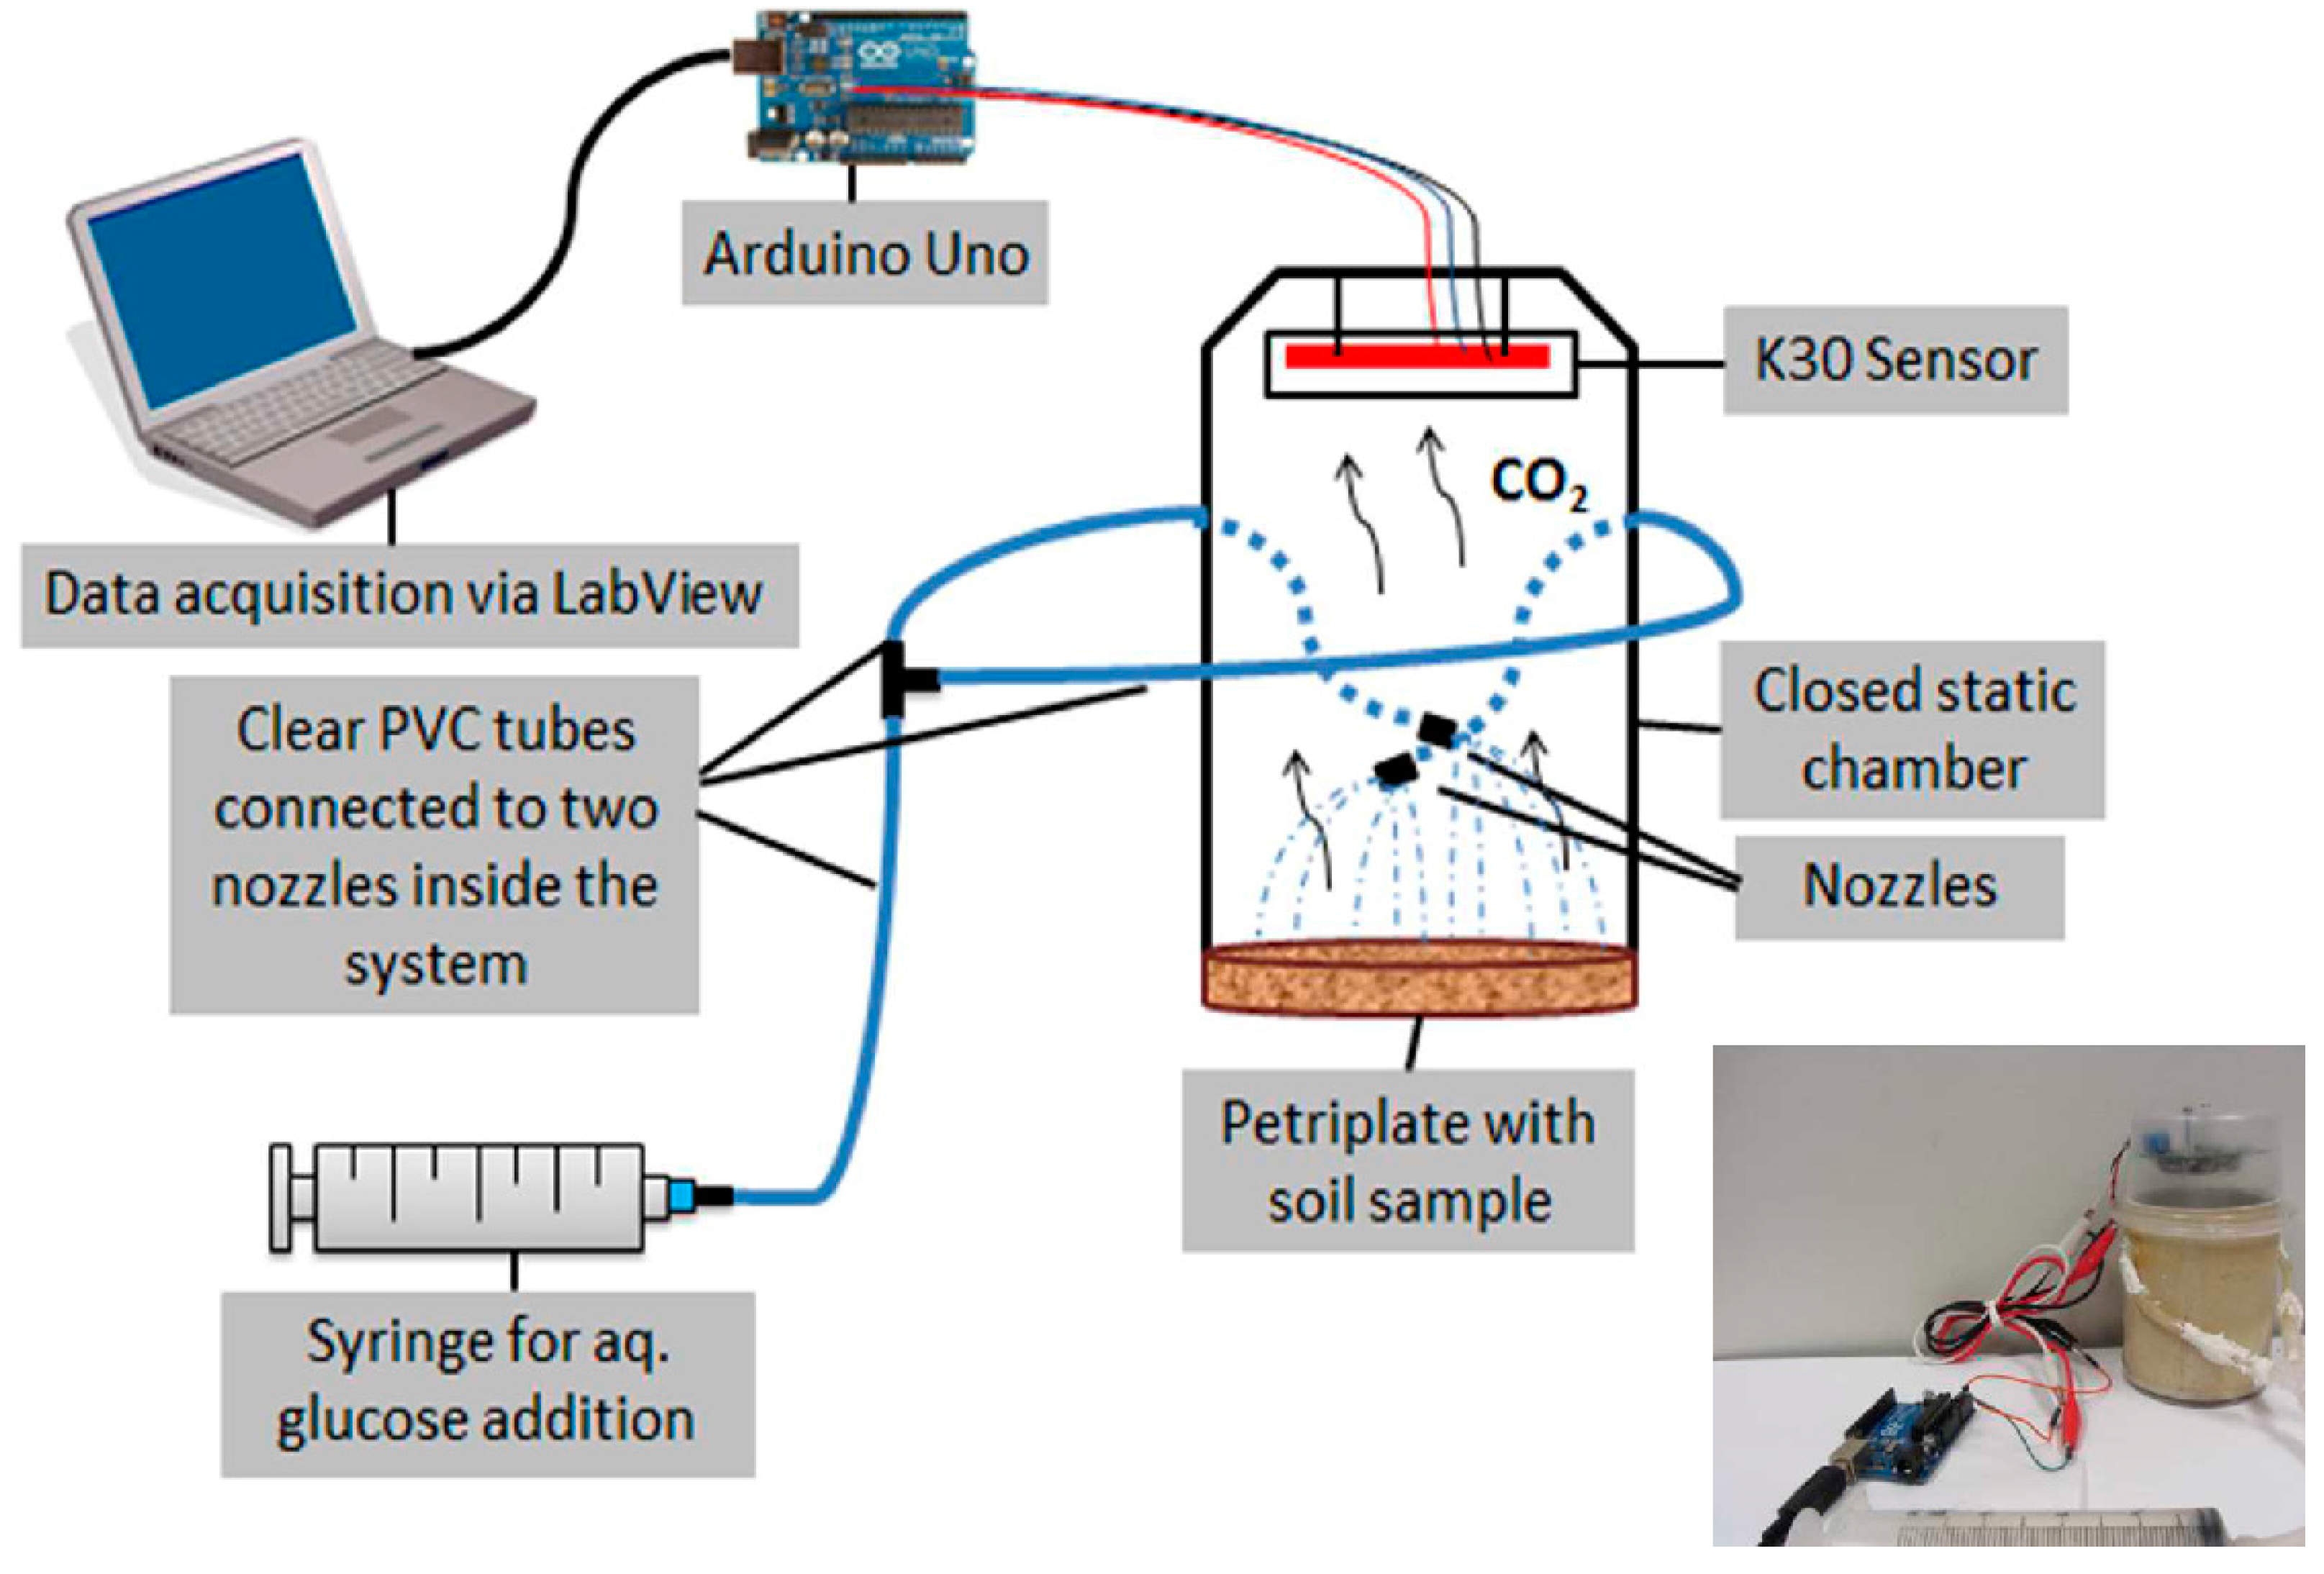
2.1. Sensor System Development

The CO2 Engine® K30 CO2 Sensor (SenseAir, Delsbo, Gävleborg, Sweden) (Disclaimer: mention of a trade name, proprietary product, or company name is for presentation clarity and does not imply endorsement by the authors or McGill University, nor does it imply exclusion of other products that may also be suitable) was used for this study. It is inexpensive (under $100 USD) and has a measurement range from 0 to 5000 ppm with an accuracy of ±30 ppm and ±3% of measured value. Its small size (51 × 57 × 14 mm) enabled integration into a small, closed CO2 system to be used for the study. Its sampling chamber is a gold-plated labyrinth. No calibration is required during testing because of the built-in self-correcting automatic baseline correction (ABC) algorithm. Infrared CO2 sensors are prone to drift of the zero baseline of the calibration curve, which is set by default at the fresh air value of 400 ppm CO2. The ABC algorithm is a “low pass filter” that takes advantage of the fact that the CO2 level nearly falls to outside fresh air in buildings when unoccupied. It constantly keeps track of the sensor’s lowest reading over a 7.5 day interval (by default) and slowly rescales the sensor probe for any long-term drift detected as compared to the expected 400 ppm CO2, hence, updating the sensor calibration regularly.
A small closed static system (non-steady-state non-thorough-flow system) for CO2 gas collection and quantification from soil samples was constructed (Figure 2). The K30 CO2 sensor was placed on top of the system. To spray glucose solution over the soil sample uniformly, two nozzles attached to two clear PVC (polyvinyl chloride) tubes were integrated into the system. These pipes were attached to a syringe that aided the introduction of the glucose solution into the pipes that fed the glucose to the nozzles. An external fan was used to “cleanse” the sensor between measurements.
Figure 2. Glucose-induced CO2 emission sensing system for soils integrated with NDIR-based K30 CO2 sensor.
Sensors 15 04734 g002
Data acquisition software for the K30 sensor was developed using LabView (National Instruments Corporation, Austin, TX, USA) software. An Arduino UNO (Smart Projects, Strambino, Turin, Italy) was used as a microcontroller to power the sensor and receive analog output and was connected to a laptop computer via a USB serial port. Analog voltage data output received from the sensor at 1 Hz was logged in a tab delimited text file. The collected data were analyzed using the Statistical Analysis System (SAS) 9.4 (SAS Institute Inc., Cary, NC, USA) software suite.
An illustration of the sensor response for sterile and control samples of organic soil over an extended period of 15 min is shown in Figure 3. For data acquisition, the system was placed over the petriplate containing 20 g of the soil sample, the glucose solution was sprayed 6 min after the start of experiment and the CO2 emission data were collected for another 9 min. The data collected between 8 and 11 min (3 min in total), after glucose addition, were used for the calculation of CO2 emission∙min−1. For regular experiments, glucose was added 1 min after the start of the experiment and hence, the experiment spanned 6 min.
Figure 3. Illustration of the NDIR CO2 sensor-based system response for sterile and control samples of organic soil. The glucose solution was added 6 min after placing the system over a petriplate containing soil sample and the CO2 concentration data collected between 8 and 11 min (3 min in total) were used to calculate CO2 emission.
Sensors 15 04734 g003

2.2. Sensor System Evaluation: Determining the Optimal Glucose Concentration and Soil Moisture Content

Three soil samples (1: organic, classified as histosol, 2: sandy loam, classified as gleysol and 3: sandy clay loam, classified as gleysol [45]) were collected from Field 26 (Figure 4) of the Macdonald Campus Farm, McGill University, Ste-Anne-de-Bellevue, QC, Canada (45°25′N, 73°56′W) on the basis of variability of the total count derived from gamma-ray spectrometry using SoilOptixTM (Practical Precision Inc., Tavistock, ON, Canada). Key physical and chemical properties of these soil samples are summarized in Table 1. The samples were air dried for 7 days prior to analysis to reduce the contribution of roots to the total SIR response [30], but the moisture content was maintained between 10% and 12% (gravimetric moisture content) to sustain the activity of the soil microbial community. No grinding or sieving of the soils was done, so that the soil aggregate structure was maintained to simulate in-situ conditions.
Figure 4. Three sampling locations on the gamma ray count map of Field 26 of the Macdonald Campus Farm, McGill University.
Sensors 15 04734 g004
Table 1. Physical and chemical properties of collected soil samples.
Sample No.SandSiltClayOMpHPKCaMgAl
g∙kgmineral soil−1g∙kg−1mg∙kg−1
13654022336336.97810810,7001700206
2624246130785.91045614601901082
3465280255757.41001243600622461
Glucose was chosen as a substrate for the study because it can be utilized as a carbon source by most soil microorganisms [46] and was purchased from Sigma-Aldrich Canada Co. (Oakville, ON, Canada). For each soil, five replicates of 20 g air-dry (a.d.) soil were amended with a series of glucose concentrations (0, 5, 10, 15, 20 and 25 mg∙g−1 soil) in solution (to adjust soil moisture to 80% of water holding capacity (WHC) of each soil) and CO2 concentration was recorded for 5 min with the sensor described in Figure 2, to determine the optimal glucose concentration.
Next, an initial experiment was performed to check the applicability of the designed system towards the soils, with and without microbial activity. All three soils were divided into four sub-samples, consisting of untreated soil for optimal glucose solution addition (control-glucose, CG), untreated soil for deionized water addition (control-deionized water, CD), autoclaved soil for glucose solution addition (sterile-glucose, SG) and autoclaved soil for deionized water addition (sterile-deionized water, SD). Sterilization of soil samples was done by autoclaving the samples 3 times at 121 °C and 15 psi for 1 h on alternate days [47].

2.3. Sensor System Evaluation: Toxicity Assessment of Diesel-Contaminated Soil

Five diesel treatments (0, 5, 20, 60 and 150 mg∙g−1 of soil) were applied to each soil. Soil samples (500 g each) were spread on aluminum trays to a depth of 1 cm. Diesel fuel (density 836 g∙L−1 at 15 °C) was applied over the soil surface by spraying uniformly from a spray bottle, so that it completely covered the surface of the soil with a thin layer of diesel. It was then allowed to penetrate the soil for 5 to 10 min, after that it was mixed thoroughly by hand several times [48]. Soil moisture was then adjusted to 10%–12% (gravimetric moisture content) for all the treatments, including control and diesel-contaminated soils were transferred to 1 kg plastic containers. The pots were covered with loosely fitted perforated lids and were incubated at 22 °C for 7 days.
After incubation, triplicate subsamples (20 g of moist soil) were taken from each control and diesel-contaminated soil and transferred onto Petri plates, for a total of 45 Petri plates (3 replicate subsamples × 5 diesel treatments × 3 soil types). For each soil type, an optimal concentration of glucose (described above) was added into the volume of water required to reach the 80% of WHC of each soil and was sprayed uniformly over the soil sample in the Petri plate. The CO2 concentration was determined for five minutes with the sensor system shown in Figure 2, to determine toxicity response.

3. Results and Discussion

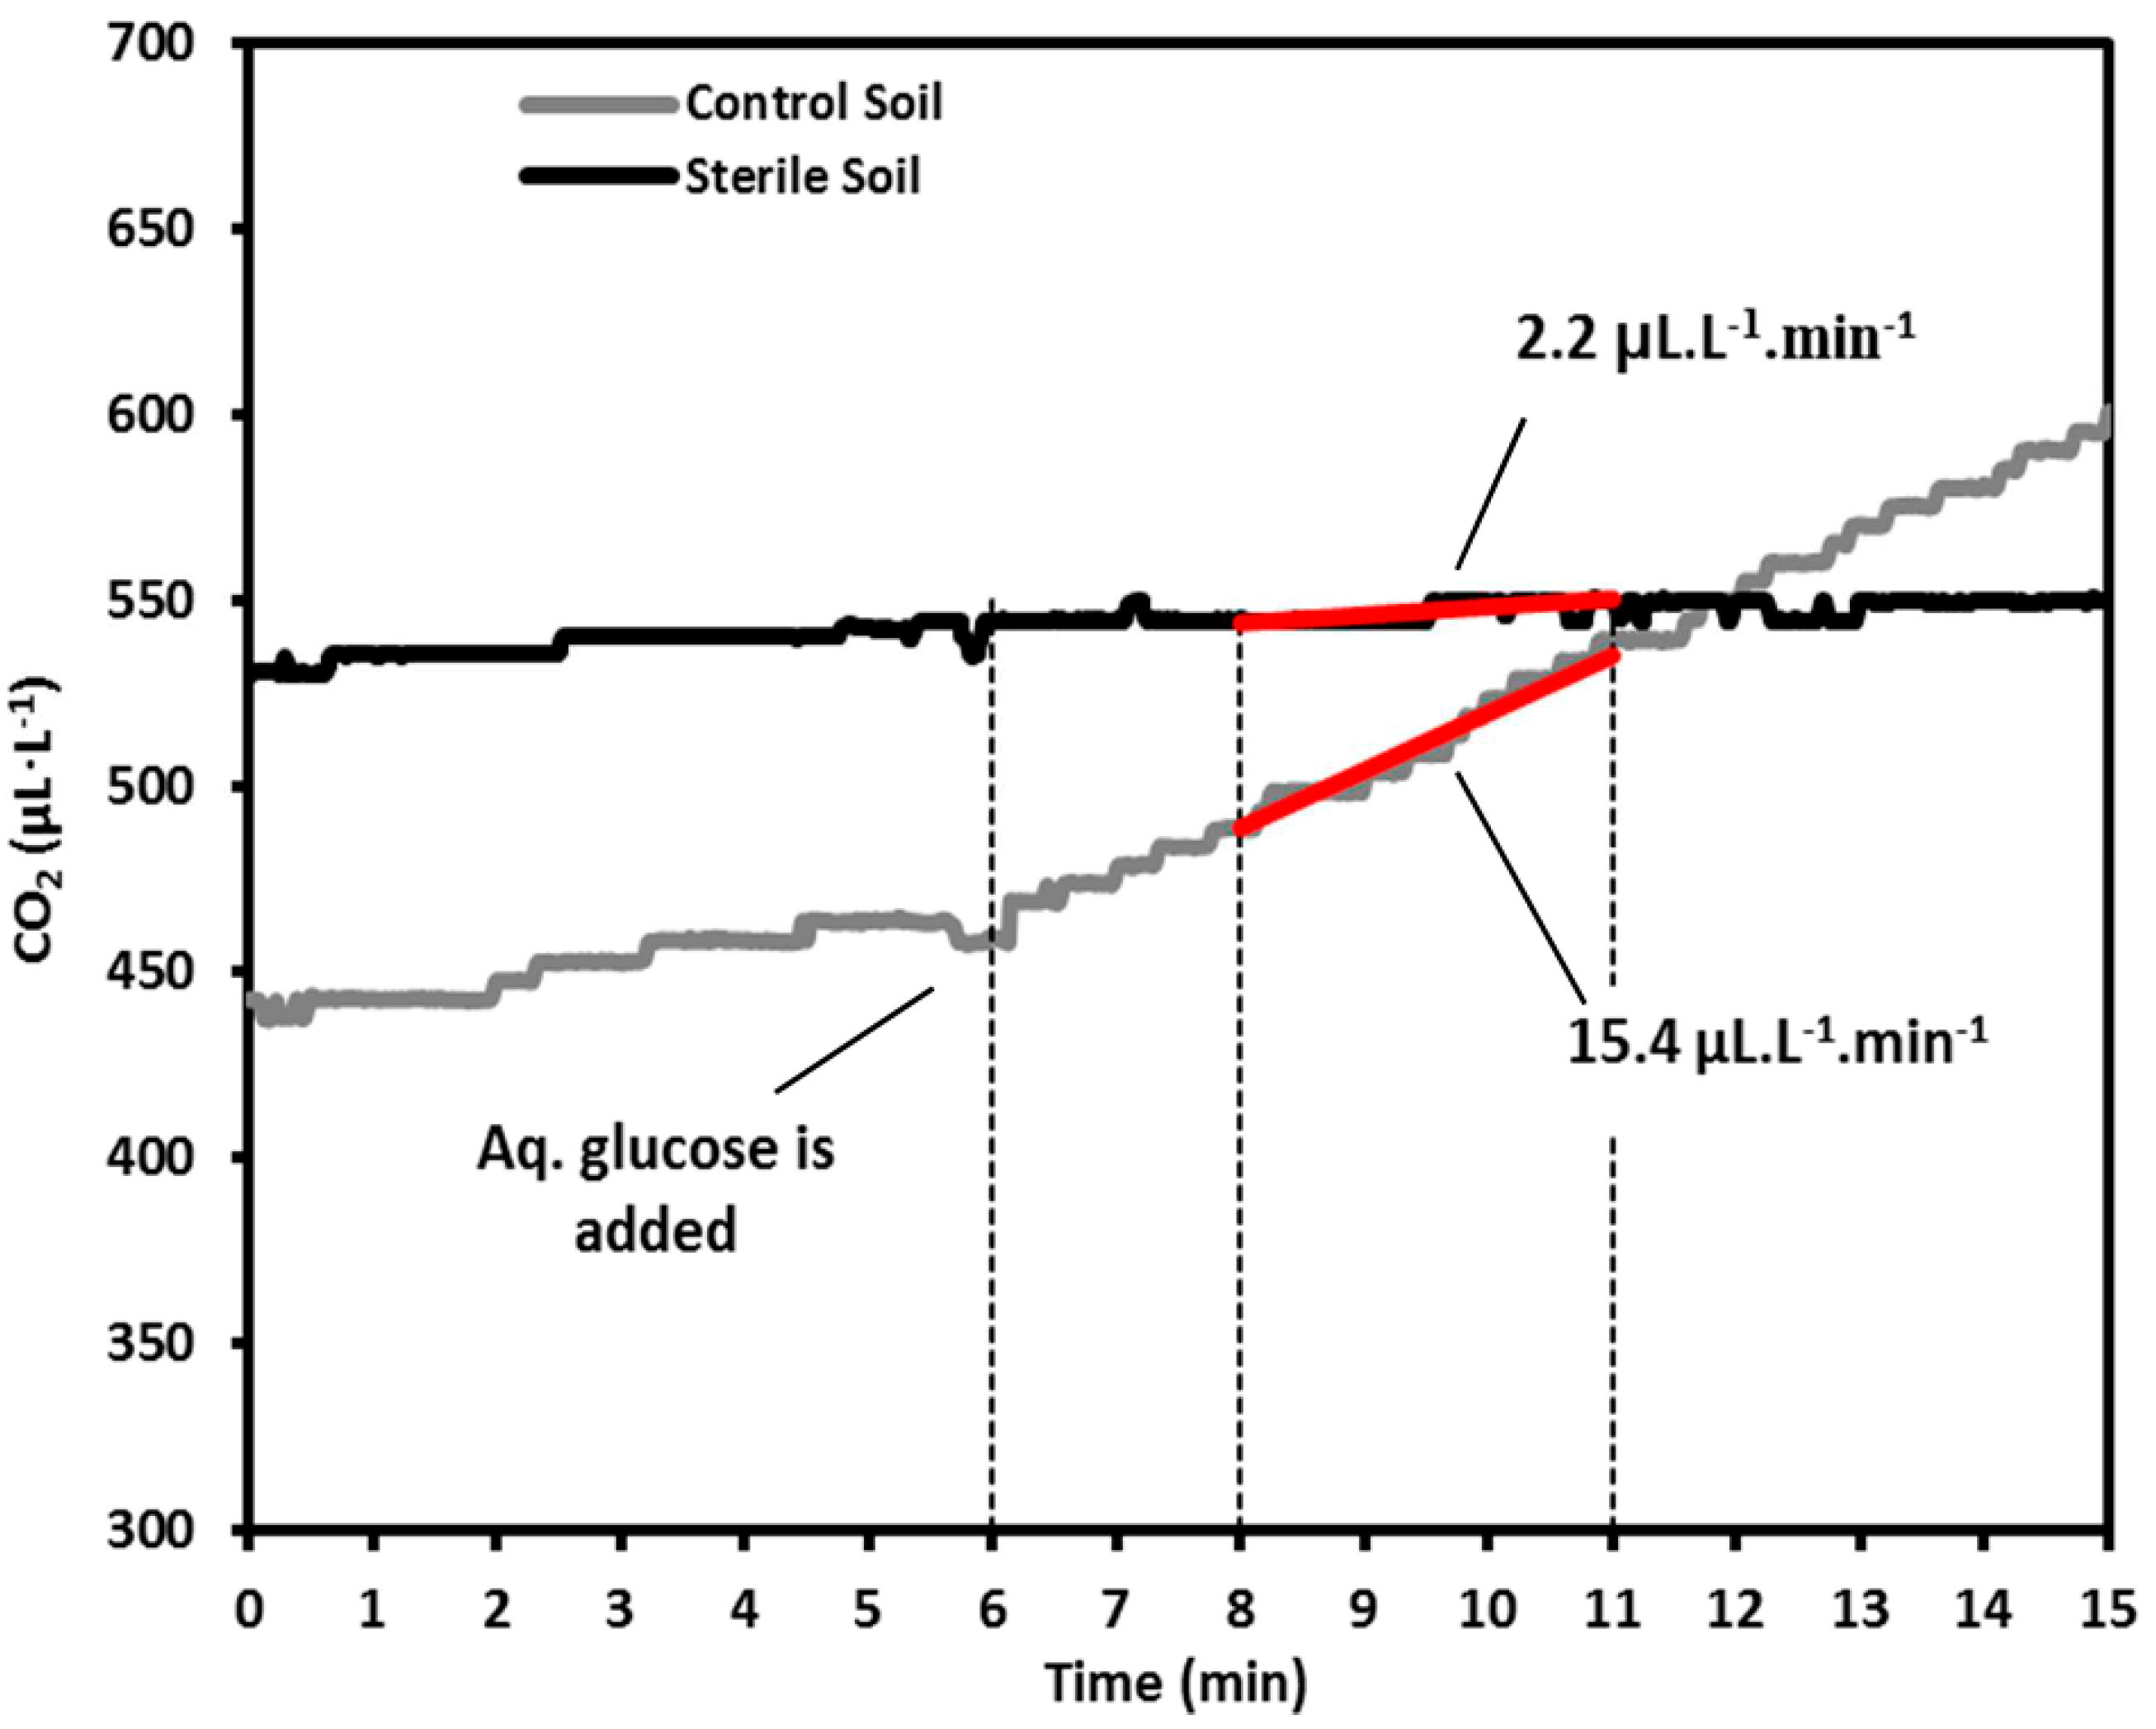
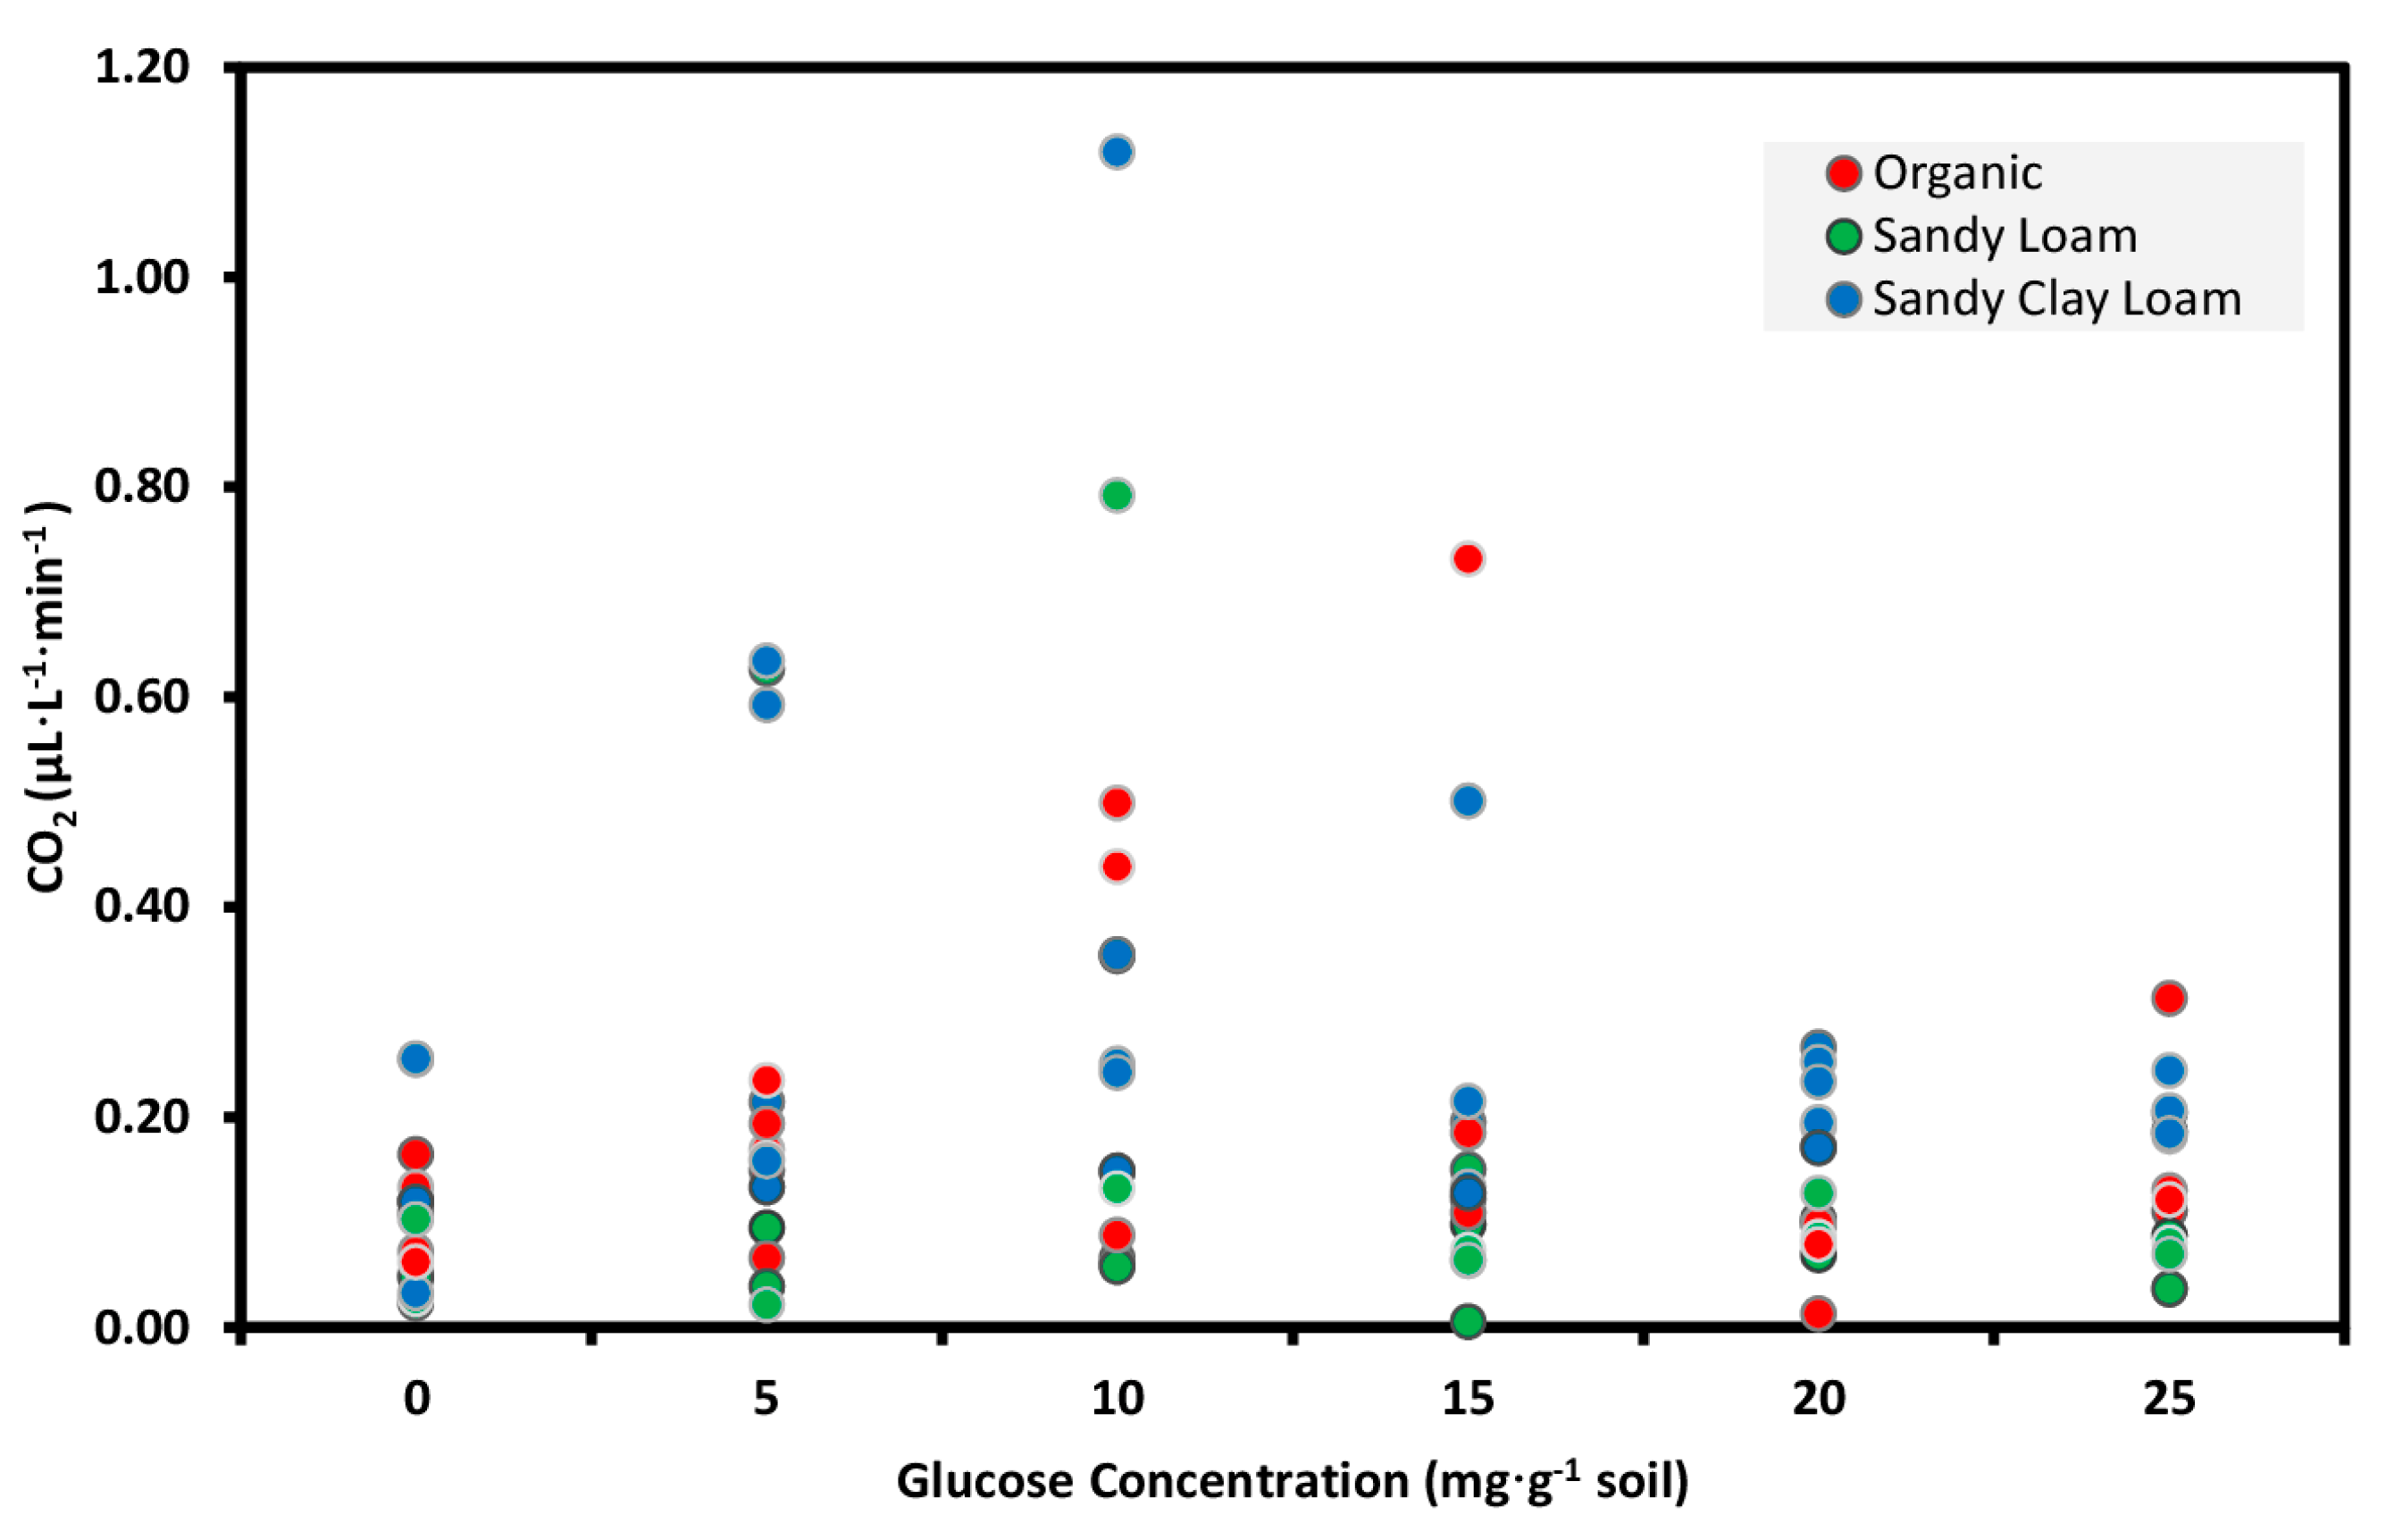
3.1. Glucose Optimization

Optimizing the glucose concentration for the SIR test with the NDIR CO2 sensor-based system showed that the mean score for the 10 mg∙g−1 glucose addition was significantly greater (Tukey’s HSD test, p < 0.05) than the no sugar control, but no other glucose addition rates were different from the control among the soil types (Figure 5).
The CO2 emission rates increased by 2.5-fold, 4.6-fold and 2.8-fold for soil 1, 2 and 3, respectively, when the glucose concentration in solution was increased from 0 to 10 mg∙g−1 soil, and decreased with higher glucose concentrations. These findings are consistent with other reports, such as Anderson and Domsch [19], who found that 5 to 50 µMglucose∙gsoil solution−1 soil to be optimal for SIR in 12 soils and Ananyeva et al. [26] reported 2–15 mg∙g−1 induced an optimal respiration response. Further, West and Sparling [30] found optimal respiration rates at 10 mgglucose∙g−1 soil (60 mg∙mL−1 soil water) for three soils and reported a significant decrease in CO2 emission after the glucose addition exceeded 10 mg∙mL−1 soil water since greater water osmotic potential inhibited respiration. Hence, a glucose concentration of 10 mg∙g−1 soil was used to induce SIR for all soils in subsequent tests.
Figure 5. Emission of CO2 measured with the NDIR CO2 sensor-based system from three soils amended with aq. glucose at concentrations from 0 to 25 mg∙g−1 soil. Data represent 20 g of soil samples and five replicates.
Sensors 15 04734 g005

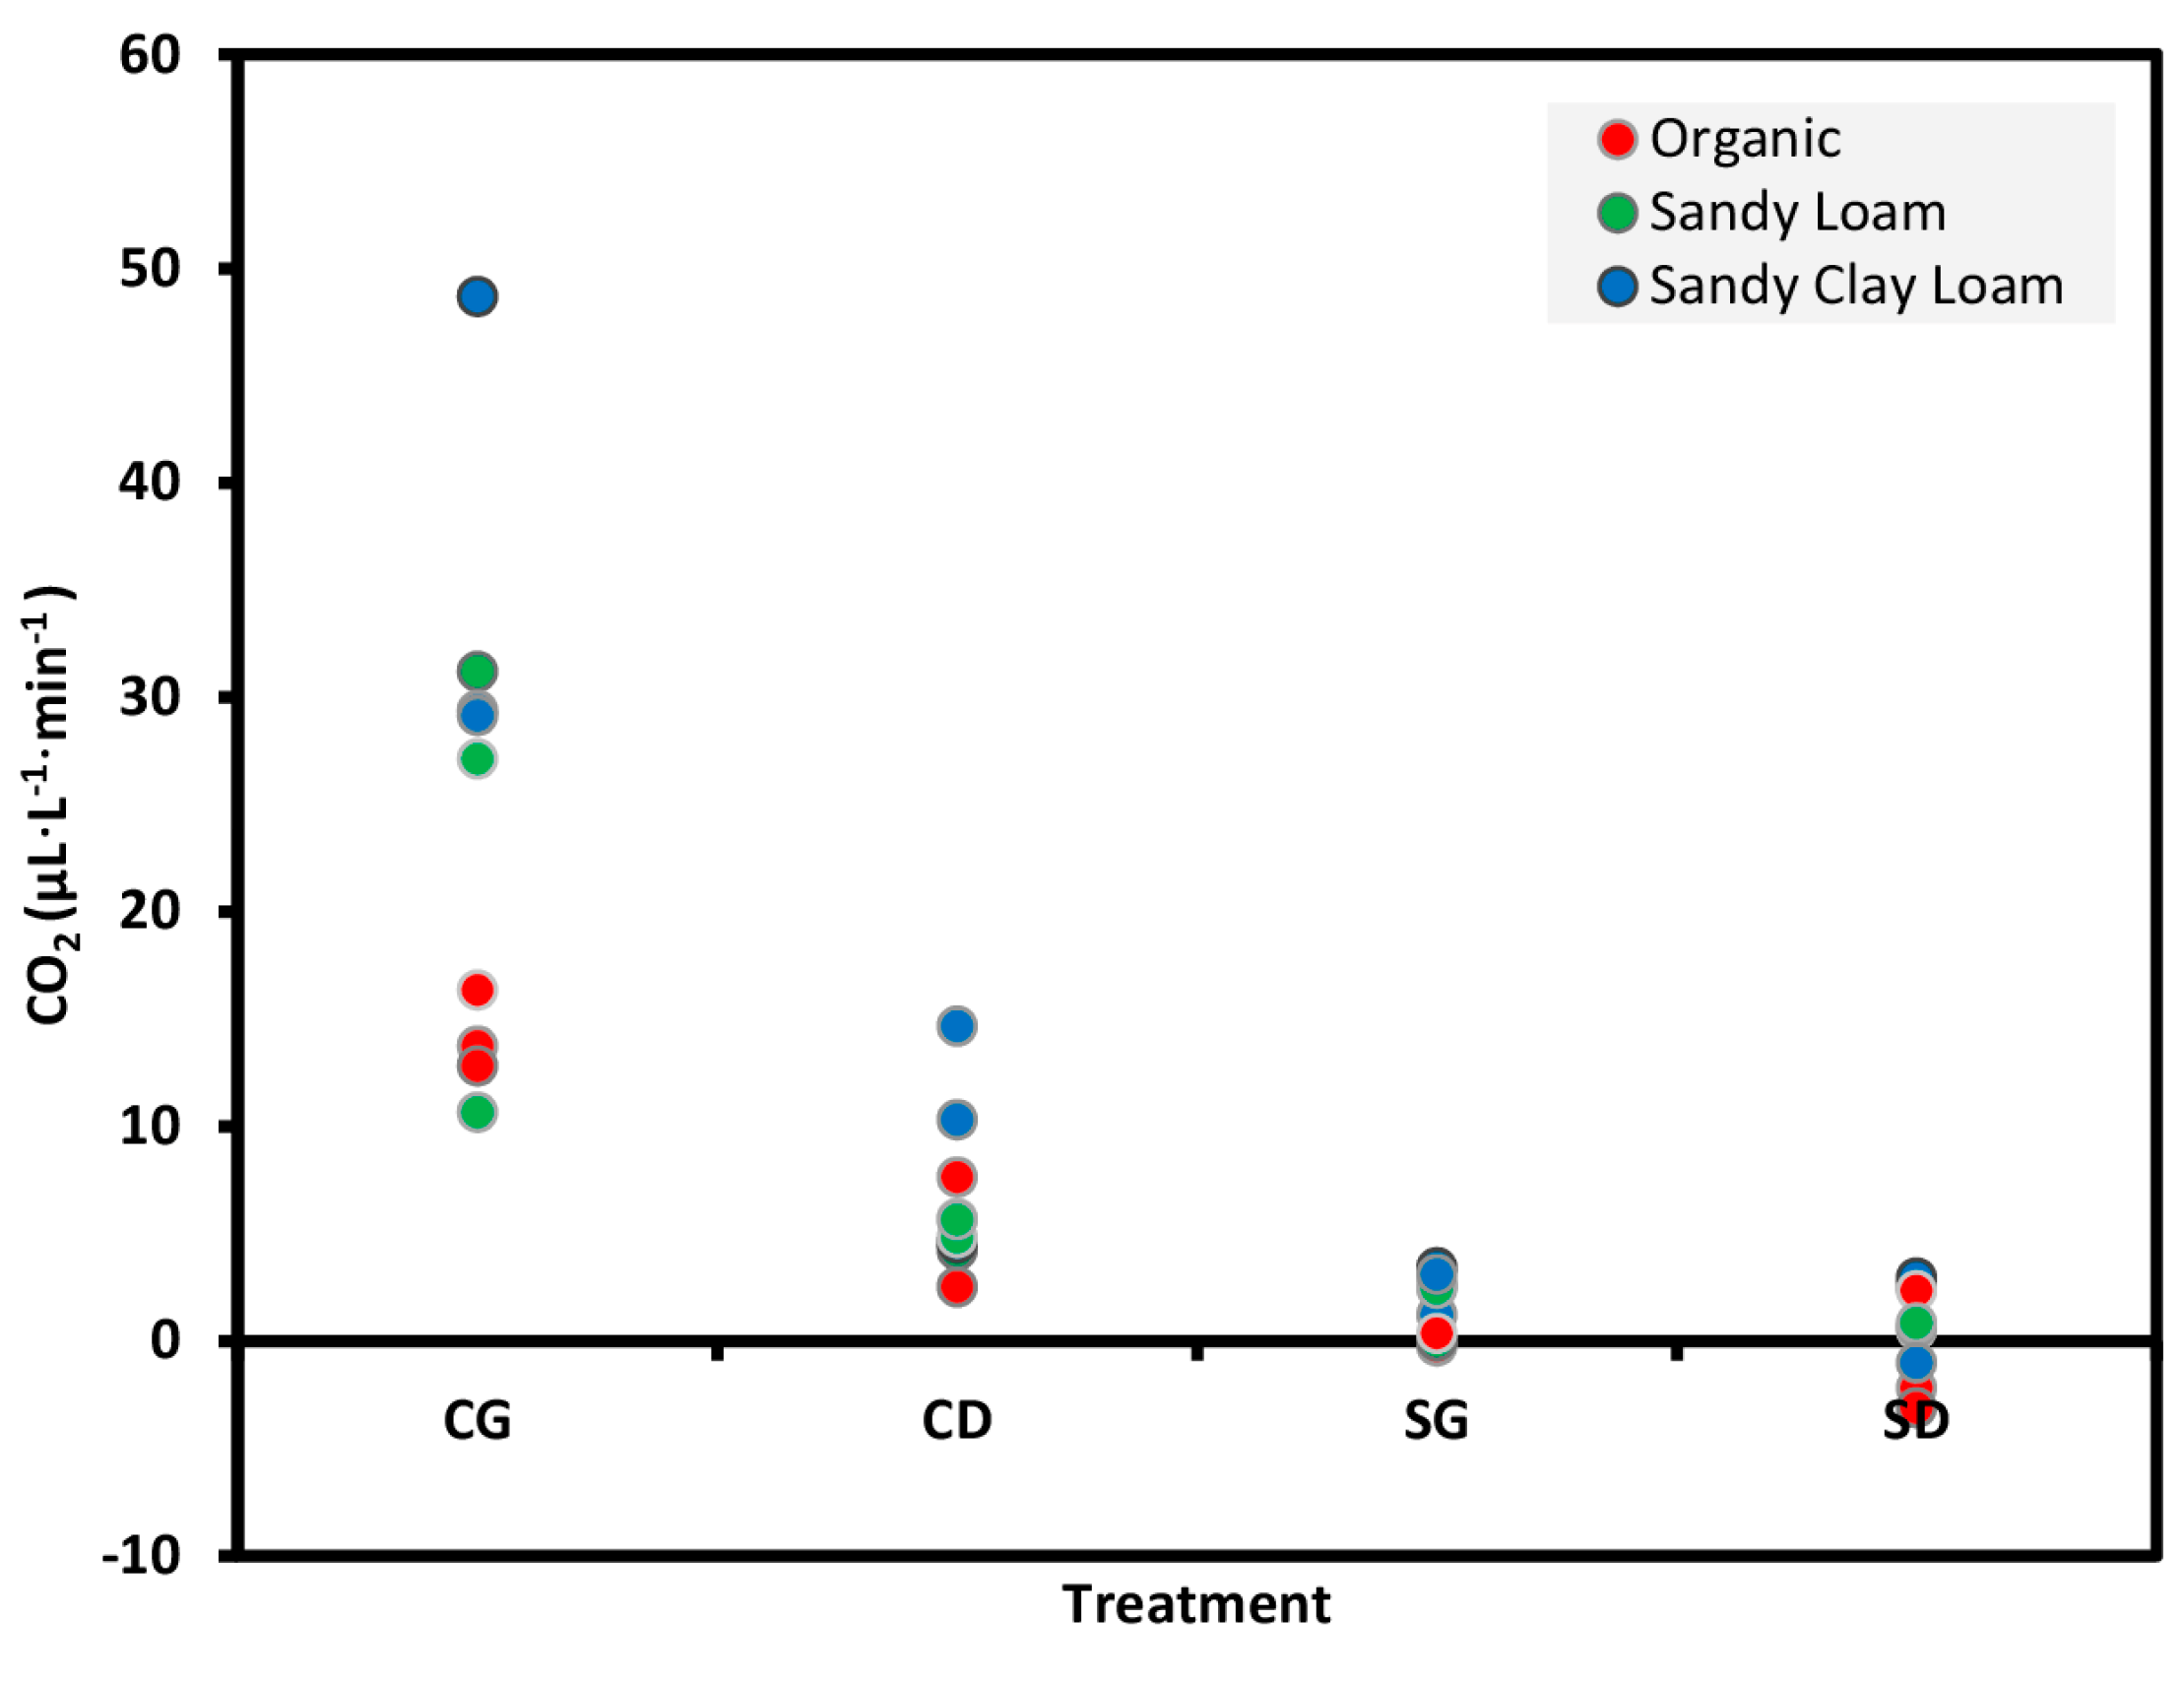
3.2. Preliminary Evaluation

CO2 emission measured with the NDIR CO2 sensor-based system from the control soils added with aq. glucose (CG) was significantly greater (Tukey’s HSD test, p < 0.05) than sterile soil samples added with aq. glucose (SG) for all three soil types (Figure 6; Table 2). Hence, the sensor is able to distinguish CO2 emission from soils with variable amounts of microbial activity and the glucose solution incorporation significantly increases the microbial respiration in soils under toxicity stress. The latter proves that the respiration rate of microorganisms increases within a few minutes after adding glucose.
Figure 6. Emission of CO2 from three soils measured with the NDIR CO2 sensor-based system for the treatments CG: control soil sample added with aq. glucose, CD: control soil sample added with deionized water, SG: sterile soil sample added with aq. Glucose, and SD: sterile soil sample added with deionized water. Data represent 20 g of soil samples and three replicates.
Sensors 15 04734 g006
Table 2. Analysis of variance of the CO2 emission (μL∙L∙min1) from sterile and control soil samples.
SourceDegree of FreedomSum of SquaresMean SquaresF valuePr > F
Treatment (between groups)111.130.1115.16<0.0001
Error (within groups)240.160.01
Total351.29
Zero to six hours following the addition of substrate is usually considered as representative of the initial microbial response before biomass growth [49]. Our purpose is to investigate the in-situ applicability of an NDIR CO2 sensor-based system for evaluation of soil toxicity in terms of diesel amendment. We assumed that the microbes in the toxic soil do not need a long time to metabolize the glucose and their respiration will be triggered quickly. Hence, the CO2 emission data between 2 and 5 min after the addition of aq. glucose were used for the measurement of CO2 emission from the soil samples.

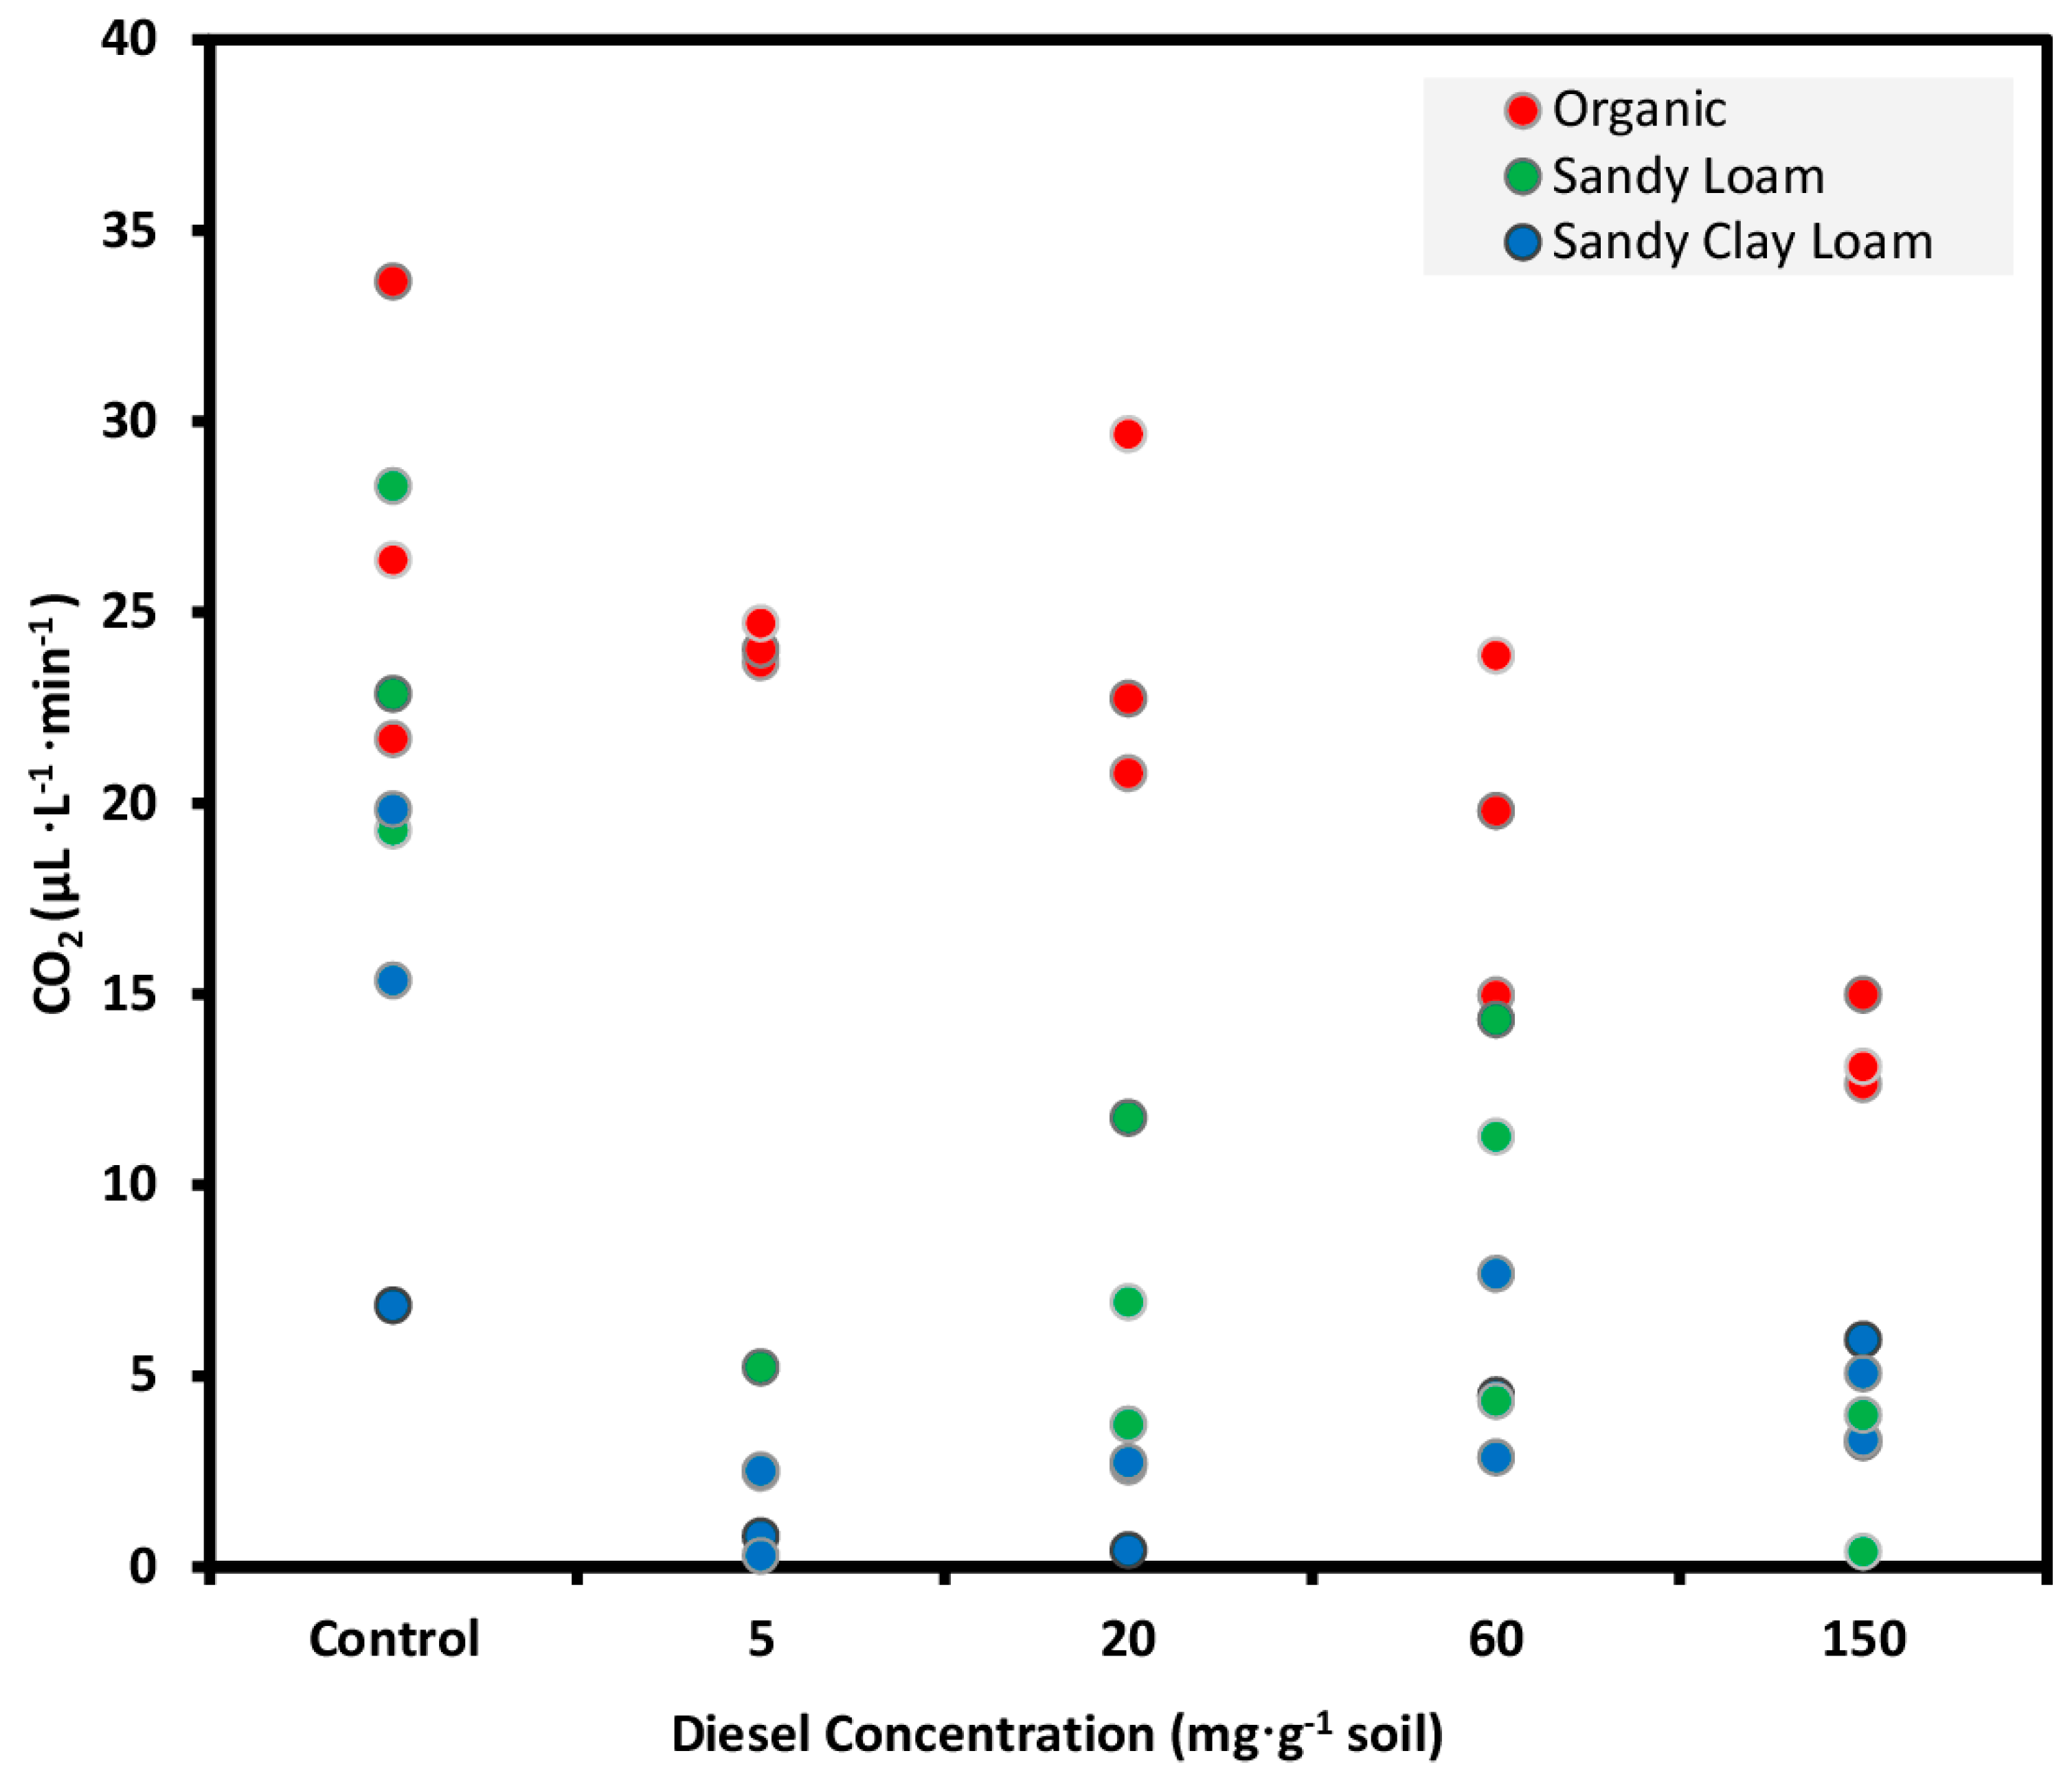
3.3. Diesel Treated Soils Experiment

The diesel treatment at different rates indicated different CO2 emission patterns, in terms of the level of SOM. The mean score of CO2 emission measured with the NDIR CO2 sensor-based system from control soils was significantly greater (Tukey’s HSD test, p < 0.05) from diesel-contaminated soils after incubation period of 7 days (Figure 7; Table 3).
Figure 7. Emission of CO2 measured with the NDIR CO2 sensor-based system from three soils incubated with water (control) or diesel-contamination for 7 days, prior to the glucose addition. Data represent 20 g of soil samples and three replicates.
Sensors 15 04734 g007
Table 3. Analysis of variance of diesel treatment on CO2 emission (μL∙L∙min−1) from three soil types.
SourceDegree of FreedomSum of SquaresMean SquaresF valuePr > F
Diesel treatment (between groups)141.030.0719.13<0.0001
Error (within groups)300.110.01
Total441.13
Soil 1, organic soil containing 63.3% SOM, showed the microbial SIR rate similar to that of control when diesel contamination was done, showing a slight decrease in respiration with increasing diesel concentration. The presence of high rates of SOM may decrease the accessibility of pollutant to micro-organisms. In such a case, the hydrophobic compounds get partitioned into the organic fraction of the soil and their bioavailability is reduced due to their entrapment in the solid phase of the organic matter [10], hence, decreasing their toxicity towards microbial populations [50].
The soils 2 and 3 (mineral soils) contained 7.8% and 7.5% of organic matter, which implied the soil has a major amount of mineral matter, which acts as an adsorbent [51]. Thus, most of the diesel hydrocarbon was adsorbed on the soil solid; it was bioavailable to micro-organisms and proved detrimental to their survival and activity. Significantly low SIR rates in diesel-contaminated samples of soils 2 and 3 as compared to control samples indicated the inability of the microorganisms to metabolize added petroleum hydrocarbon as a substrate during the first week after the addition. An initial lag phase, during which microbial respiration was inhibited, has also been reported in polluted soil samples with low SOM in previous studies [48,52]. This lag phase suggests that microorganisms need an initial time period to adapt to the presence of hydrocarbons in the medium before using them as substrates; microbial respiration hits a lag phase immediately after the addition of diesel, before its expected increase [16].
The results noted above and the previous literature favor the usage of the SIR and the proposed NDIR CO2 sensor-based system for toxicity evaluation of hydrocarbon contaminated soils. Bauer et al. [53] found SIR to be inappropriate for the determination of microbial activity of contaminated and non-contaminated soils, but cited low sensitivity of the method used as one of the probable reasons. Many remediation studies have been reported that correlated SIR to the level of organic toxicity present in soil, in addition to other biological indicators. Shi et al. [54] found that there were characteristic differences of glucose-induced microbial respirations in the response of contaminated and non-contaminated soils. Pietravalle and Aspray [55] found distinct catabolic diversity between hydrocarbon contaminated soils using multiple SIR assays. Degens and Harris [49] also utilized differences between the SIR responses of microbial communities to simple organic compounds to quantify catabolic diversity of soil microbial communities.
However, the integration of the SIR approach with a NDIR CO2 sensor-based system for soil respiration measurements has not been reported yet. Currently, portable infrared gas analyzers (IRGAs) [56] have been integrated in open and closed chambers to develop commercially open (e.g., CFX-1, PP-Systems, Amesbury, MA, USA) and closed chambers (e.g., Li-8100, Li-Cor, Lincoln, NE, USA) to measure soil CO2 efflux in-situ. The cost of these systems is a major setback as compared to the proposed NDIR CO2 sensor-based system.
To put this in further perspective, a longitudinal study on a contaminated site can be done using the sensor system and the correlation of CO2 emission data collected with physicochemical parameters can be evaluated over time.

4. Conclusions

The application of eco-toxicological indicators to evaluate soil quality is preferable to arbitrary chemical criteria for contaminated soil clean-up initiatives. But the high cost, sophistication and in-situ inapplicability of such biological indicators are major setbacks. This paper presented a sensor based approach that indirectly measures potential (induced) biological activity in the soil and hence, could be used to support the physiochemical criteria for site assessment and remediation. The performance of a simple CO2 sensing system integrated with an inexpensive NDIR CO2 sensor was successfully evaluated to distinguish three different diesel-contaminated and non-contaminated soils. The current design can be modified easily for in-situ applicability. The outlook for such research is promising as it eliminates the barriers of in-situ evaluation of biological activity of environmental sites. Such methods can serve as promising tools for the initial assessment of the level of contamination and for the determination of highly contaminated areas to be the focus of the final physiochemical evaluation.

Author Contributions

Jasmeen Kaur, the lead author, developed and evaluated the system. Viacheslav Adamchuk, the corresponding author, created the idea of the system and offered scientific guidance throughout the research. Joann Whalen assisted with the experimental design for system evaluation. Ashraf Ismail helped with the development of the system with his insight on soil toxicity.

Conflicts of Interest

The authors declare no conflict of interest.

References

  1. Nicolotti, G.; Egli, S. Soil contamination by crude oil: Impact on the mycorrhizosphere and on the revegetation potential of forest trees. Environ. Pollut. 1998, 99, 37–43. [Google Scholar] [CrossRef] [PubMed]
  2. Essien, O.E.; John, I.A. Impact of crude oil spillage pollution and chemical remediation on agricultural soil properties and crop growth. J. Appl. Sci. Environ. Manag. 2010, 14, 147–154. [Google Scholar]
  3. Dorn, P.B.; Vipond, T.E.; Salanitro, J.P.; Wisniewski, H.L. Assessment of the acute toxicity of crude oils in soils using earthworms, microtox®, and plants. Chemosphere 1998, 37, 845–860. [Google Scholar] [CrossRef]
  4. Ordinioha, B.; Brisibe, S. The human health implications of crude oil spills in the Niger delta, Nigeria: An interpretation of published studies. Niger. Med. J. J. Niger. Med. Assoc. 2013, 54, 10–16. [Google Scholar] [CrossRef]
  5. Adam, G.; Duncan, H.J. Effect of Diesel Fuel on Growth of Selected Plant Species. Environ. Geochem. Health 1999, 21, 353–357. [Google Scholar] [CrossRef]
  6. The Installation Restoration Program Toxicology Guide: Volume 4. Available online: http://www.dtic.mil/dtic/tr/fulltext/u2/a215002.pdf (accessed on 15 February 2015).
  7. Keith, L.; Telliard, W. ES&T Special Report: Priority Pollutants: I-a Perspective View. Environ. Sci. Technol. 1979, 13, 416–423. [Google Scholar] [CrossRef]
  8. Sporring, S.; Bøwadt, S.; Svensmark, B.; Björklund, E. Comprehensive comparison of classic Soxhlet extraction with Soxtec extraction, ultrasonication extraction, supercritical fluid extraction, microwave assisted extraction and accelerated solvent extraction for the determination of polychlorinated biphenyls in soil. J. Chromatogr. A 2005, 1090, 1–9. [Google Scholar] [CrossRef] [PubMed]
  9. Peijnenburg, W.; Sneller, E.; Sijm, D.; Lijzen, J.; Traas, T.; Verbruggen, E. Implementation of bioavailability in standard setting and risk assessment: Suggestions based on a workshop with emphasis on metals. Arh. Hig. Rada Toksikol. 2004, 55, 273–278. [Google Scholar] [PubMed]
  10. Nam, K.; Chung, N.; Alexander, M. Relationship between Organic Matter Content of Soil and the Sequestration of Phenanthrene. Environ. Sci. Technol. 1998, 32, 3785–3788. [Google Scholar] [CrossRef]
  11. Juvonen, R.; Martikainen, E.; Schultz, E.; Joutti, A.; Ahtiainen, J.; Lehtokari, M. A battery of toxicity tests as indicators of decontamination in composting oily waste. Ecotoxicol. Environ. Saf. 2000, 47, 156–166. [Google Scholar] [CrossRef] [PubMed]
  12. Greene, J.C.; Bartels, C.L.; Warren-Jicks, W.J.; Parkhurst, B.R.; Linder, G.L.; Peterson, S.; Miller, W.E. Protocols for Short Term Toxicity Screening of Hazardous Waste Sites; US EPA: Corvallis, OR, USA, 1988. [Google Scholar]
  13. Bispo, A.; Jourdain, M.J.; Jauzein, M. Toxicity and genotoxicity of industrial soils polluted by polycyclic aromatic hydrocarbons (PAHs). Org. Geochem. 1999, 30, 947–952. [Google Scholar] [CrossRef]
  14. Van Gestel, C.A.; van der Waarde, J.J.; Derksen, J.G.; van der Hoek, E.E.; Veul, M.F.; Bouwens, S.; Rusch, B.; Kronenburg, R.; Stokman, G.N. The use of acute and chronic bioassays to determine the ecological risk and bioremediation efficiency of oil-polluted soils. Environ. Toxicol. Chem. 2001, 20, 1438–1449. [Google Scholar] [CrossRef] [PubMed]
  15. Chen, J.; He, F.; Zhang, X.; Sun, X.; Zheng, J.; Zheng, J. Heavy metal pollution decreases microbial abundance, diversity and activity within particle-size fractions of a paddy soil. FEMS Microbiol. Ecol. 2014, 87, 164–181. [Google Scholar] [CrossRef] [PubMed]
  16. Hawrot-Paw, M. Influence of diesel fuel on the number of selected soil microorganisms group. Rocz. Państw. Zakładu Hig. 2012, 63, 367–372. [Google Scholar]
  17. Cébron, A.; Cortet, J.; Criquet, S.; Biaz, A.; Calvert, V.; Caupert, C.; Pernin, C.; Leyval, C. Biological functioning of PAH-polluted and thermal desorption-treated soils assessed by fauna and microbial bioindicators. Spec. Issue Environ. Microbiol. 2011, 162, 896–907. [Google Scholar]
  18. Nannipieri, P.; Grego, S.; Ceccanti, B. Ecological significance of biological activity in soil. In Soil Biochemistry; Marcel Dekker: New York, NY, USA, 1990; Volume 6, pp. 293–355. [Google Scholar]
  19. Anderson, J.P.E.; Domsch, K.H. A physiological method for the quantitative measurement of microbial biomass in soils. Soil Biol. Biochem. 1978, 10, 215–221. [Google Scholar] [CrossRef]
  20. Hund, K.; Schenk, B. The microbial respiration quotient as indicator for bioremediation processes. Chemosphere 1994, 28, 477–490. [Google Scholar] [CrossRef]
  21. Margesin, R.; Zimmerbauer, A.; Schinner, F. Monitoring of bioremediation by soil biological activities. Chemosphere 2000, 40, 339–346. [Google Scholar] [CrossRef] [PubMed]
  22. Campbell, C.D.; Chapman, S.J.; Cameron, C.M.; Davidson, M.S.; Potts, J.M. A Rapid Microtiter Plate Method To Measure Carbon Dioxide Evolved from Carbon Substrate Amendments so as to Determine the Physiological Profiles of Soil Microbial Communities by Using Whole Soil. Appl. Environ. Microbiol. 2003, 69, 3593–3599. [Google Scholar] [CrossRef] [PubMed]
  23. Brinton, W.; Haney, R. Solvita CO2-Burst Respiration: A Rapid Means to Gauge Soil Biological Activity and Potentially Mineralizable Nitrogen. In New Zealand, 2013. Available online: http://solvita.com/wp-content/uploads/2013/11/ISSPA2013_solvita_web2.jpg (accessed on 15 February 2015).
  24. Drobník, J. Primary oxidation of organic matter in the soil. Plant Soil 1960, 12, 199–211. [Google Scholar] [CrossRef]
  25. Lin, Q.; Brookes, P.C. An evaluation of the substrate-induced respiration method. Soil Biol. Biochem. 1999, 31, 1969–1983. [Google Scholar] [CrossRef]
  26. Ananyeva, N.D.; Susyan, E.A.; Gavrilenko, E.G. Determination of the soil microbial biomass carbon using the method of substrate-induced respiration. Eurasian Soil Sci. 2011, 44, 1215–1221. [Google Scholar] [CrossRef]
  27. Dilly, O. Microbial respiratory quotient during basal metabolism and after glucose amendment in soils and litter. Soil Biol. Biochem. 2001, 33, 117–127. [Google Scholar] [CrossRef]
  28. Haney, R.L.; Brinton, W.H.; Evans, E. Estimating Soil Carbon, Nitrogen, and Phosphorus Mineralization from Short-Term Carbon Dioxide Respiration. Commun. Soil Sci. Plant Anal. 2008, 39, 2706–2720. [Google Scholar] [CrossRef]
  29. Wardle, D.A.; Parkinson, D. Response of the soil microbial biomass to glucose, and selective inhibitors, across a soil moisture gradient. Soil Biol. Biochem. 1990, 22, 825–834. [Google Scholar] [CrossRef]
  30. West, A.W.; Sparling, G.P. Modifications to the substrate-induced respiration method to permit measurement of microbial biomass in soils of differing water contents. J. Microbiol. Methods 1986, 5, 177–189. [Google Scholar] [CrossRef]
  31. Yasuda, T.; Yonemura, S.; Tani, A. Comparison of the characteristics of small commercial NDIR CO2 sensor models and development of a portable CO2 measurement device. Sensors 2012, 12, 3641–3655. [Google Scholar] [CrossRef]
  32. Neethirajan, S.; Jayas, D.S.; Sadistap, S. Carbon Dioxide (CO2) Sensors for the Agri-Food Industry—A Review. Food Bioprocess. Technol. 2009, 2, 115–121. [Google Scholar] [CrossRef]
  33. Capone, S.; Forleo, A.; Francioso, L.; Rella, R.; Siciliano, P.; Spadavecchia, J.; Presicce, D.S.; Taurino, A.M. Solid State Gas Sensors: State of the Art and Future Activities. ChemInform 2004, 35. [Google Scholar] [CrossRef]
  34. Moseley, P.T. Solid state gas sensors. Meas. Sci. Technol. 1997, 8, 223. [Google Scholar] [CrossRef]
  35. Barsan, N.; Weimar, U. Conduction Model of Metal Oxide Gas Sensors. J. Electroceramics 2001, 7, 143–167. [Google Scholar] [CrossRef]
  36. Zhu, Q.; Qiu, F.; Quan, Y.; Sun, Y.; Liu, S.; Zou, Z. Solid-electrolyte NASICON thick film CO2 sensor prepared on small-volume ceramic tube substrate. Mater. Chem. Phys. 2005, 91, 338–342. [Google Scholar] [CrossRef]
  37. Tongol, B.J.V.; Binag, C.A.; Sevilla, F.B., III. Surface and electrochemical studies of a carbon dioxide probe based on conducting polypyrrole. Sens. Actuators B Chem. 2003, 93, 187–196. [Google Scholar] [CrossRef]
  38. Lee, D.-D.; Lee, D.-S. Environmental gas sensors. IEEE Sens. J. 2001, 1, 214–224. [Google Scholar] [CrossRef]
  39. Pandey, S.K.; Kim, K.-H. The Relative Performance of NDIR-Based Sensors in the Near Real-time Analysis of CO2 in Air. Sensors 2007, 7, 1683–1696. [Google Scholar]
  40. Wang, Y.; Nakayama, M.; Yagi, M.; Nishikawa, M.; Fukunaga, M.; Watanabe, K. The NDIR CO2 monitor with smart interface for global networking. IEEE Trans. Instrum. Meas. 2005, 54, 1634–1639. [Google Scholar] [CrossRef]
  41. Adachi, M.; Yamagishi, Y.; Inoue, K.; Ishida, K. Automotive Emission Analyses Using FTIR Spectrophotometer; SAE International: Warrendale, PA, USA, 1992. [Google Scholar]
  42. Skoog, D.A.; Holler, F.J.; Crouch, S.R. Principles of Instrumental Analysis, 6th ed.; Brooks Cole: Belmont, CA, USA, 2006. [Google Scholar]
  43. Göpel, W.; Hesse, J.; Zemel, J. N. Optical Sensors. In Sensors: A Comprehensive Survey; Wagner, E., Dändliker, R., Spenner, K., Eds.; VCH: New York, NY, USA, 1991; Volume 6, pp. 173–200. [Google Scholar]
  44. Kwon, J.; Ahn, G.; Kim, G.; Kim, J.C.; Kim, H. tudy on NDIR-based CO2 sensor to apply remote air quality monitoring system. In Proceedings of the ICCAS-SICE, Fukuoka, Japan, 18–21 August 2009; pp. 1683–1687.
  45. World Reference Base for Soil Resources 2006: A Framework for International Classification, Correlation and Communication. Available online: ftp://ftp.fao.org/agl/agll/docs/wsrr103e.pdf (accessed on 15 February 2015).
  46. Stotzky, G.; Norman, A.G. Factors limiting microbial activities in soil. Arch. Für Mikrobiol. 1961, 40, 341–369. [Google Scholar] [CrossRef]
  47. Greene, E.A.; Kay, J.G.; Jaber, K.; Stehmeier, L.G.; Voordouw, G. Composition of soil microbial communities enriched on a mixture of aromatic hydrocarbons. Appl. Environ. Microbiol. 2000, 66, 5282–5289. [Google Scholar] [CrossRef] [PubMed]
  48. Siddiqui, S.; Adams, W.A. The fate of diesel hydrocarbons in soils and their effect on the germination of perennial ryegrass. Environ. Toxicol. 2002, 17, 49–62. [Google Scholar] [CrossRef] [PubMed]
  49. Degens, B.P.; Harris, J.A. Development of a physiological approach to measuring the catabolic diversity of soil microbial communities. Soil Biol. Biochem. 1997, 29, 1309–1320. [Google Scholar] [CrossRef]
  50. Liu, P.-W.G.; Wang, S.-Y.; Huang, S.-G.; Wang, M.-Z. Effects of soil organic matter and ageing on remediation of diesel-contaminated soil. Environ. Technol. 2012, 33, 2661–2672. [Google Scholar] [CrossRef] [PubMed]
  51. Bosma, T.N. P.; Middeldorp, P.J. M.; Schraa, G.; Zehnder, A.J.B. Mass Transfer Limitation of Biotransformation: Quantifying Bioavailability. Environ. Sci. Technol. 1997, 31, 248–252. [Google Scholar] [CrossRef]
  52. Labud, V.; Garcia, C.; Hernandez, T. Effect of hydrocarbon pollution on the microbial properties of a sandy and a clay soil. Chemosphere 2007, 66, 1863–1871. [Google Scholar] [CrossRef] [PubMed]
  53. Bauer, E.; Pennerstorfer, C.; Holubar, P.; Plas, C.; Braun, R. Microbial activity measurement in soil—A comparison of methods. J. Microbiol. Methods 1991, 14, 109–117. [Google Scholar] [CrossRef]
  54. Shi, W.; Bischoff, M.; Turco, R.; Konopka, A. Microbial catabolic diversity in soils contaminated with hydrocarbons and heavy metals. Environ. Sci. Technol. 2005, 39, 1974–1979. [Google Scholar] [CrossRef] [PubMed]
  55. Pietravalle, S.; Aspray, T.J. CO2 and O2 respiration kinetics in hydrocarbon contaminated soils amended with organic carbon sources used to determine catabolic diversity. Environ. Pollut. 2013, 176, 42–47. [Google Scholar] [CrossRef] [PubMed]
  56. Koepf, H. Die biologische Aktivität des Bodens und ihre experimentelle Kennzeichnung. Z. Für Pflanzenernähr. Düng. Bodenkd. 1954, 64, 138–146. (In German) [Google Scholar] [CrossRef]

