
Development of Lateral Flow Assay Based on Size-Controlled Gold Nanoparticles for Detection of Hepatitis B Surface Antigen

 and
and 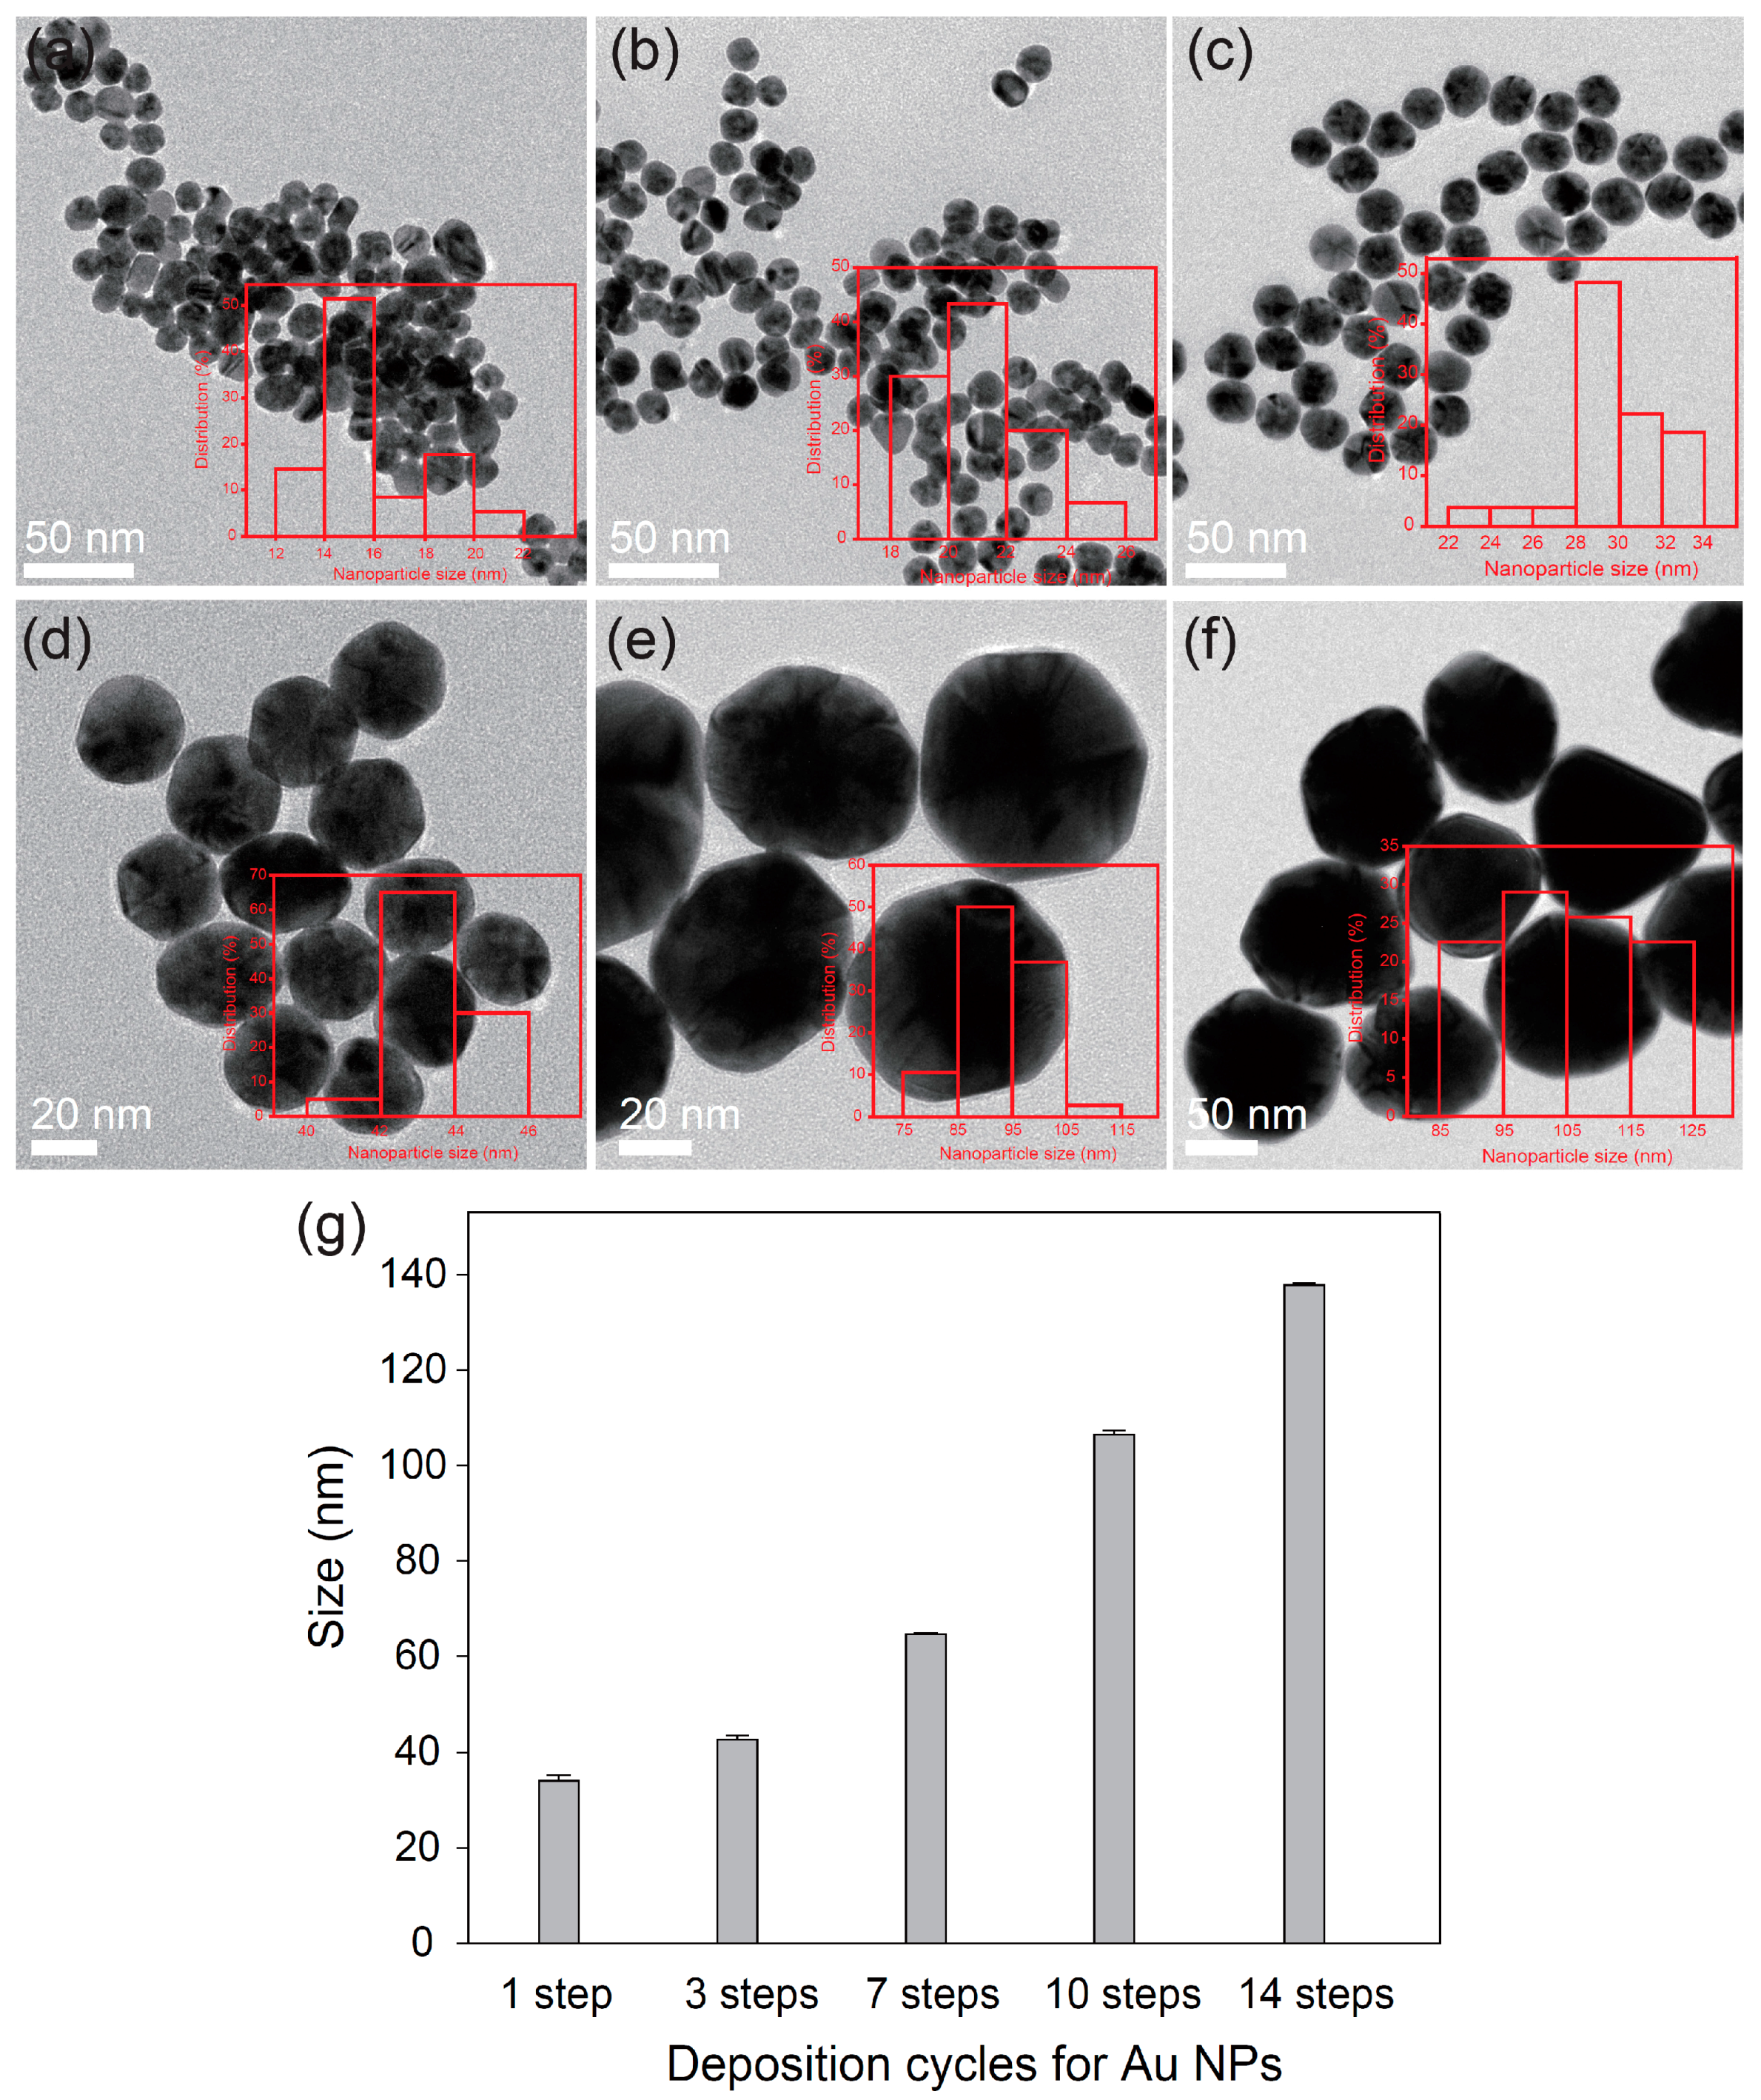
Abstract
:1. Introduction
2. Materials and Methods
2.1. Materials
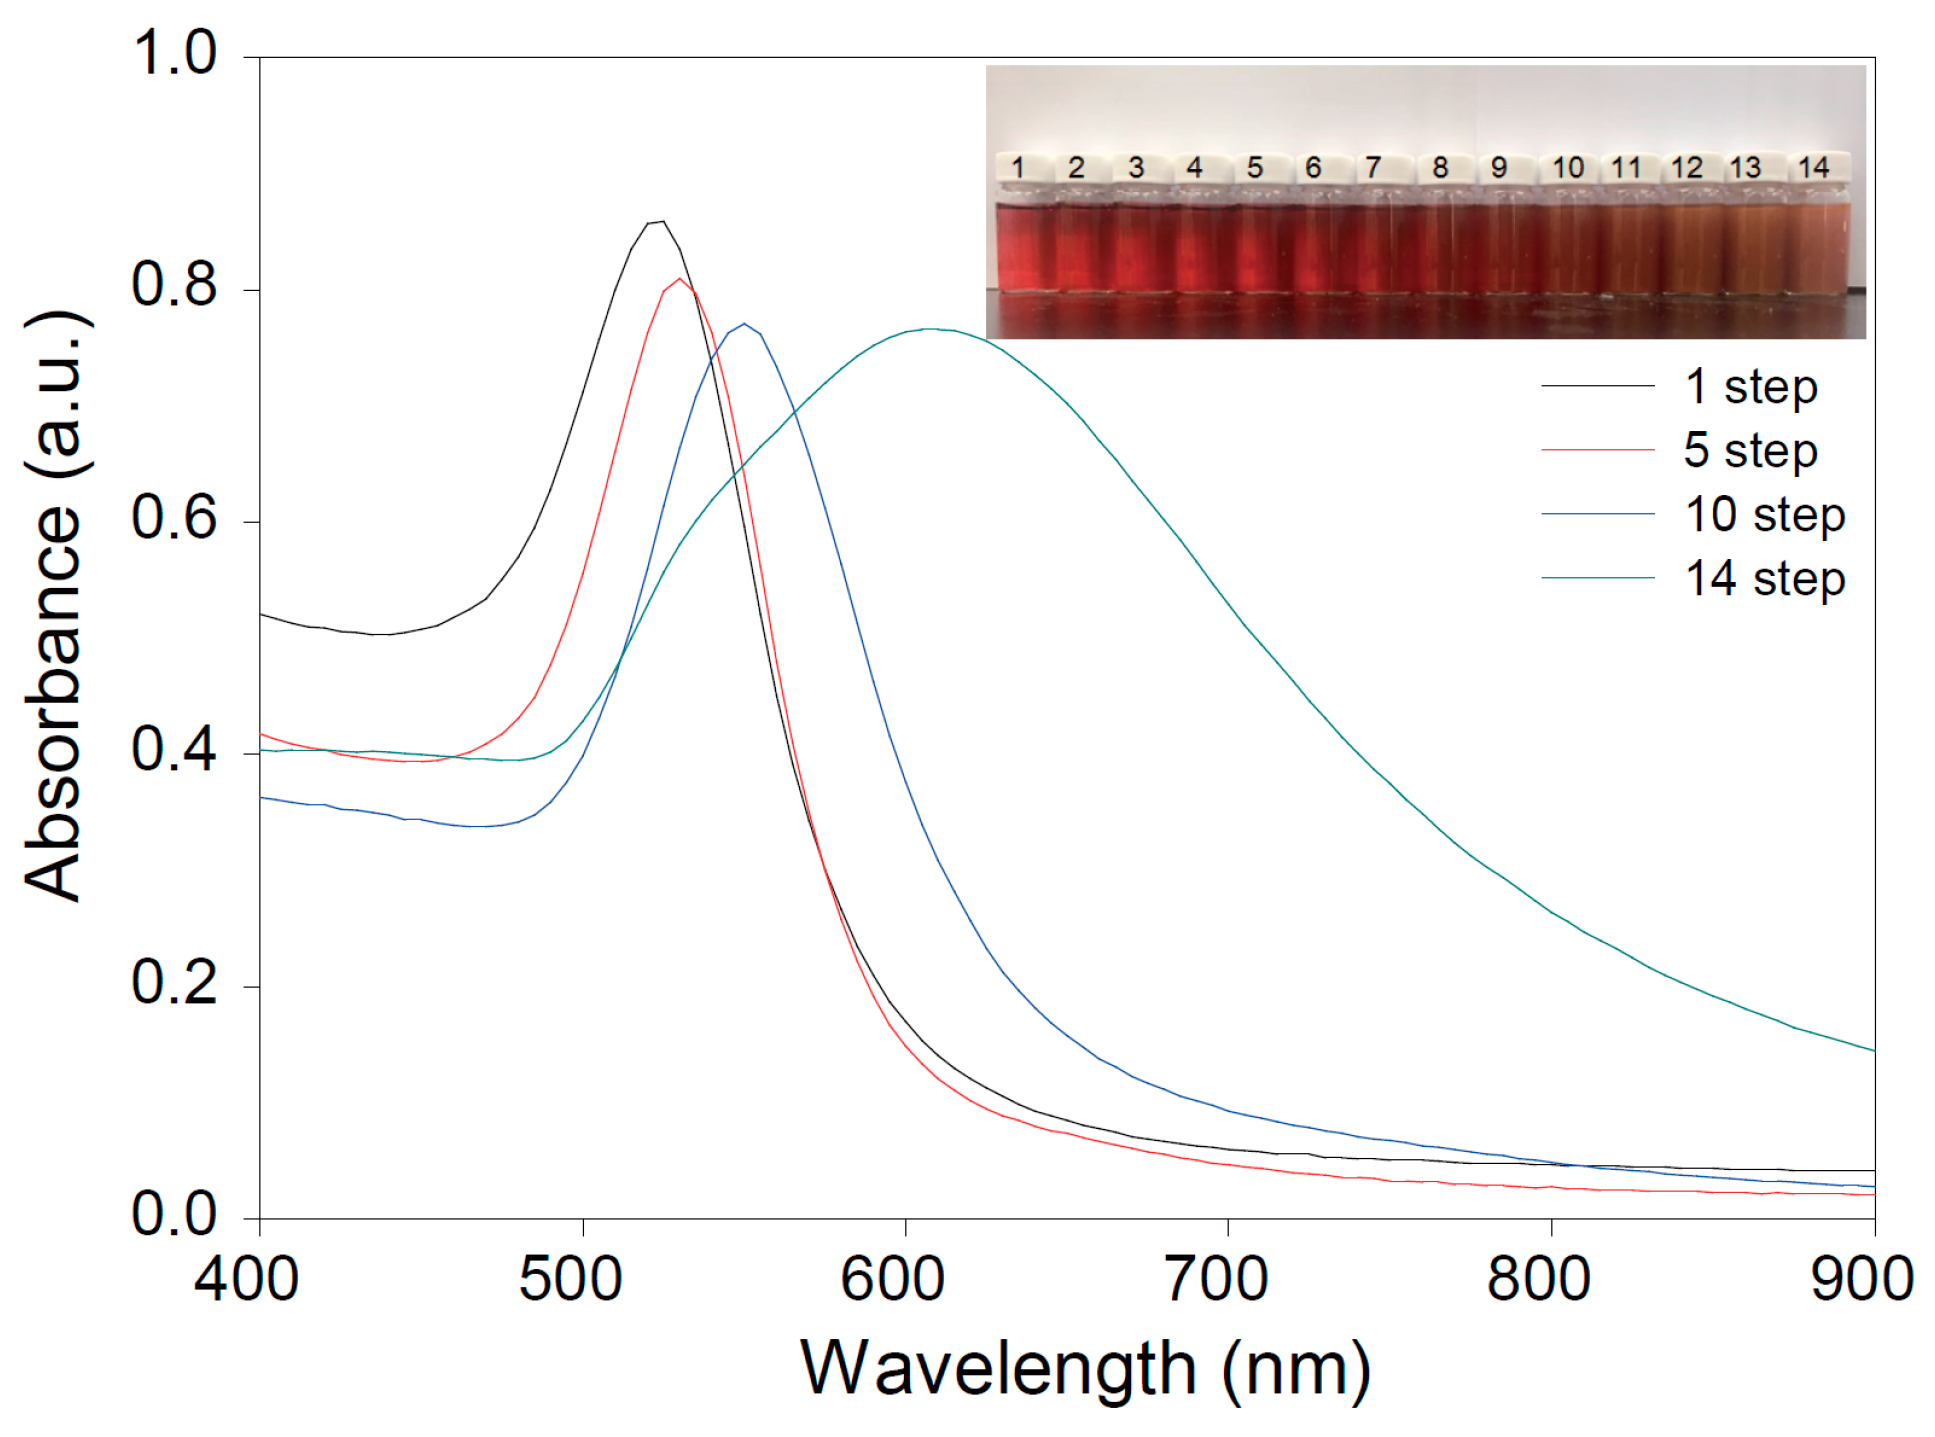
2.2. Preparation of AuNPs
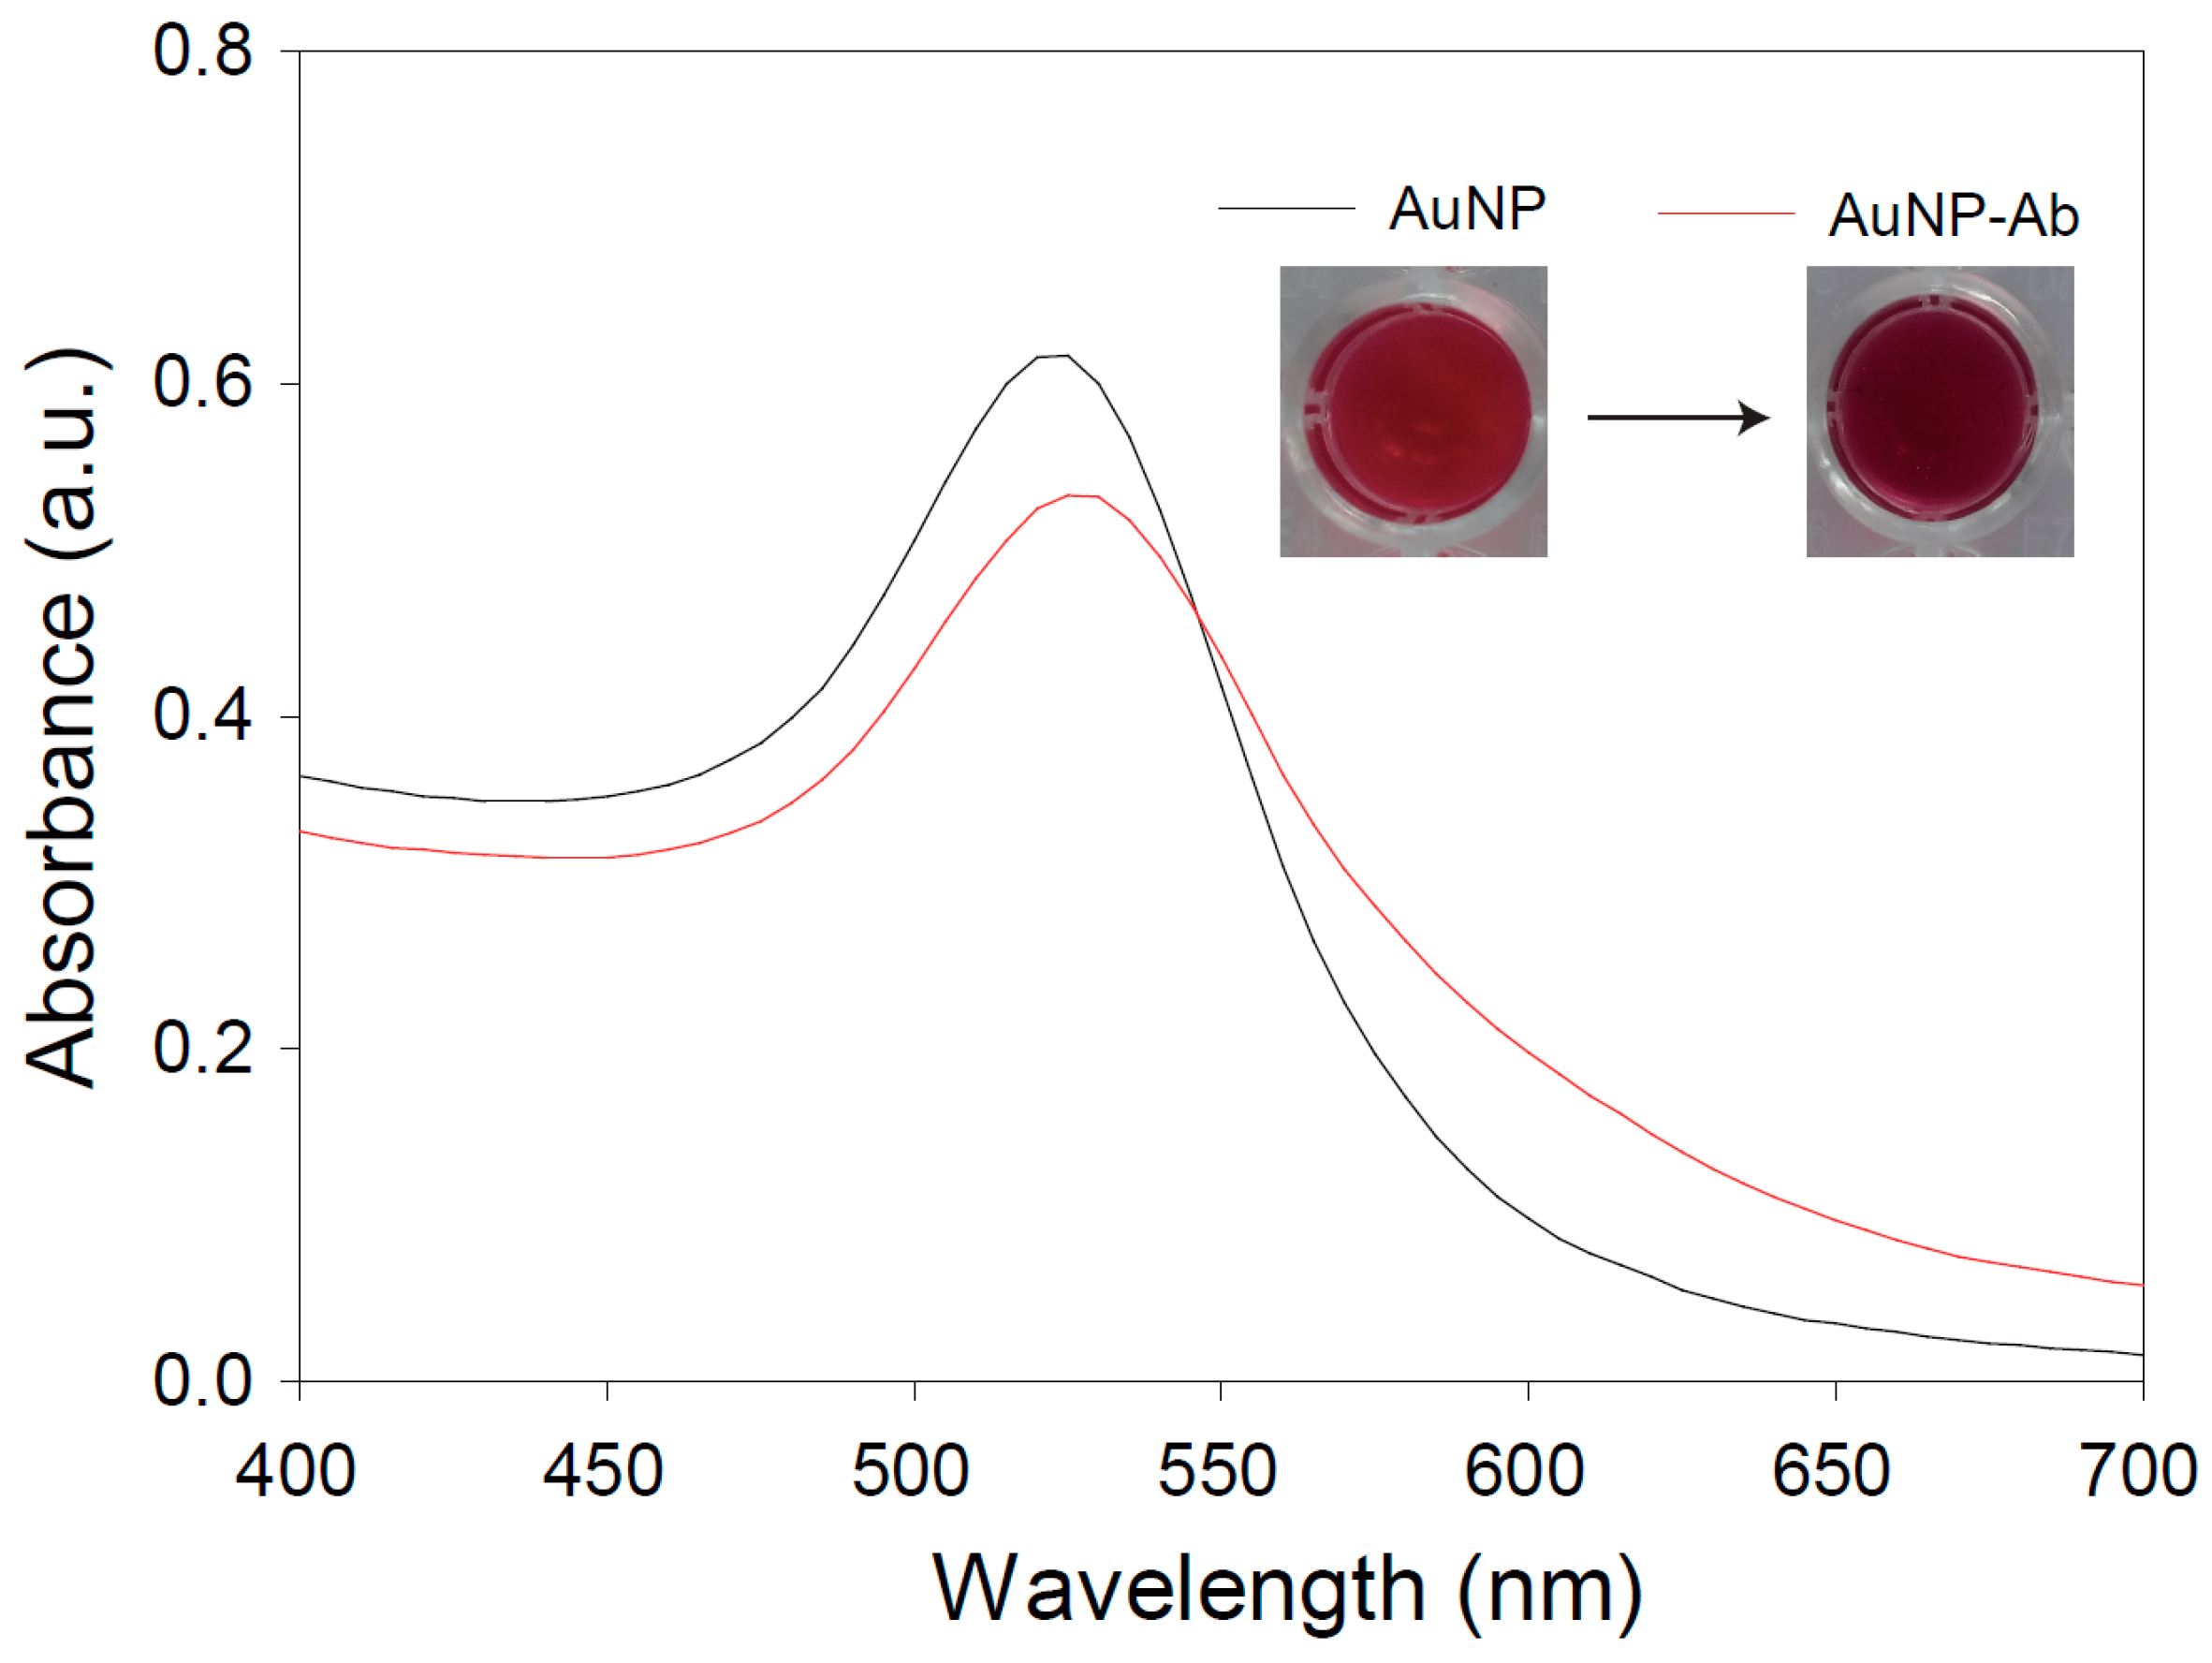
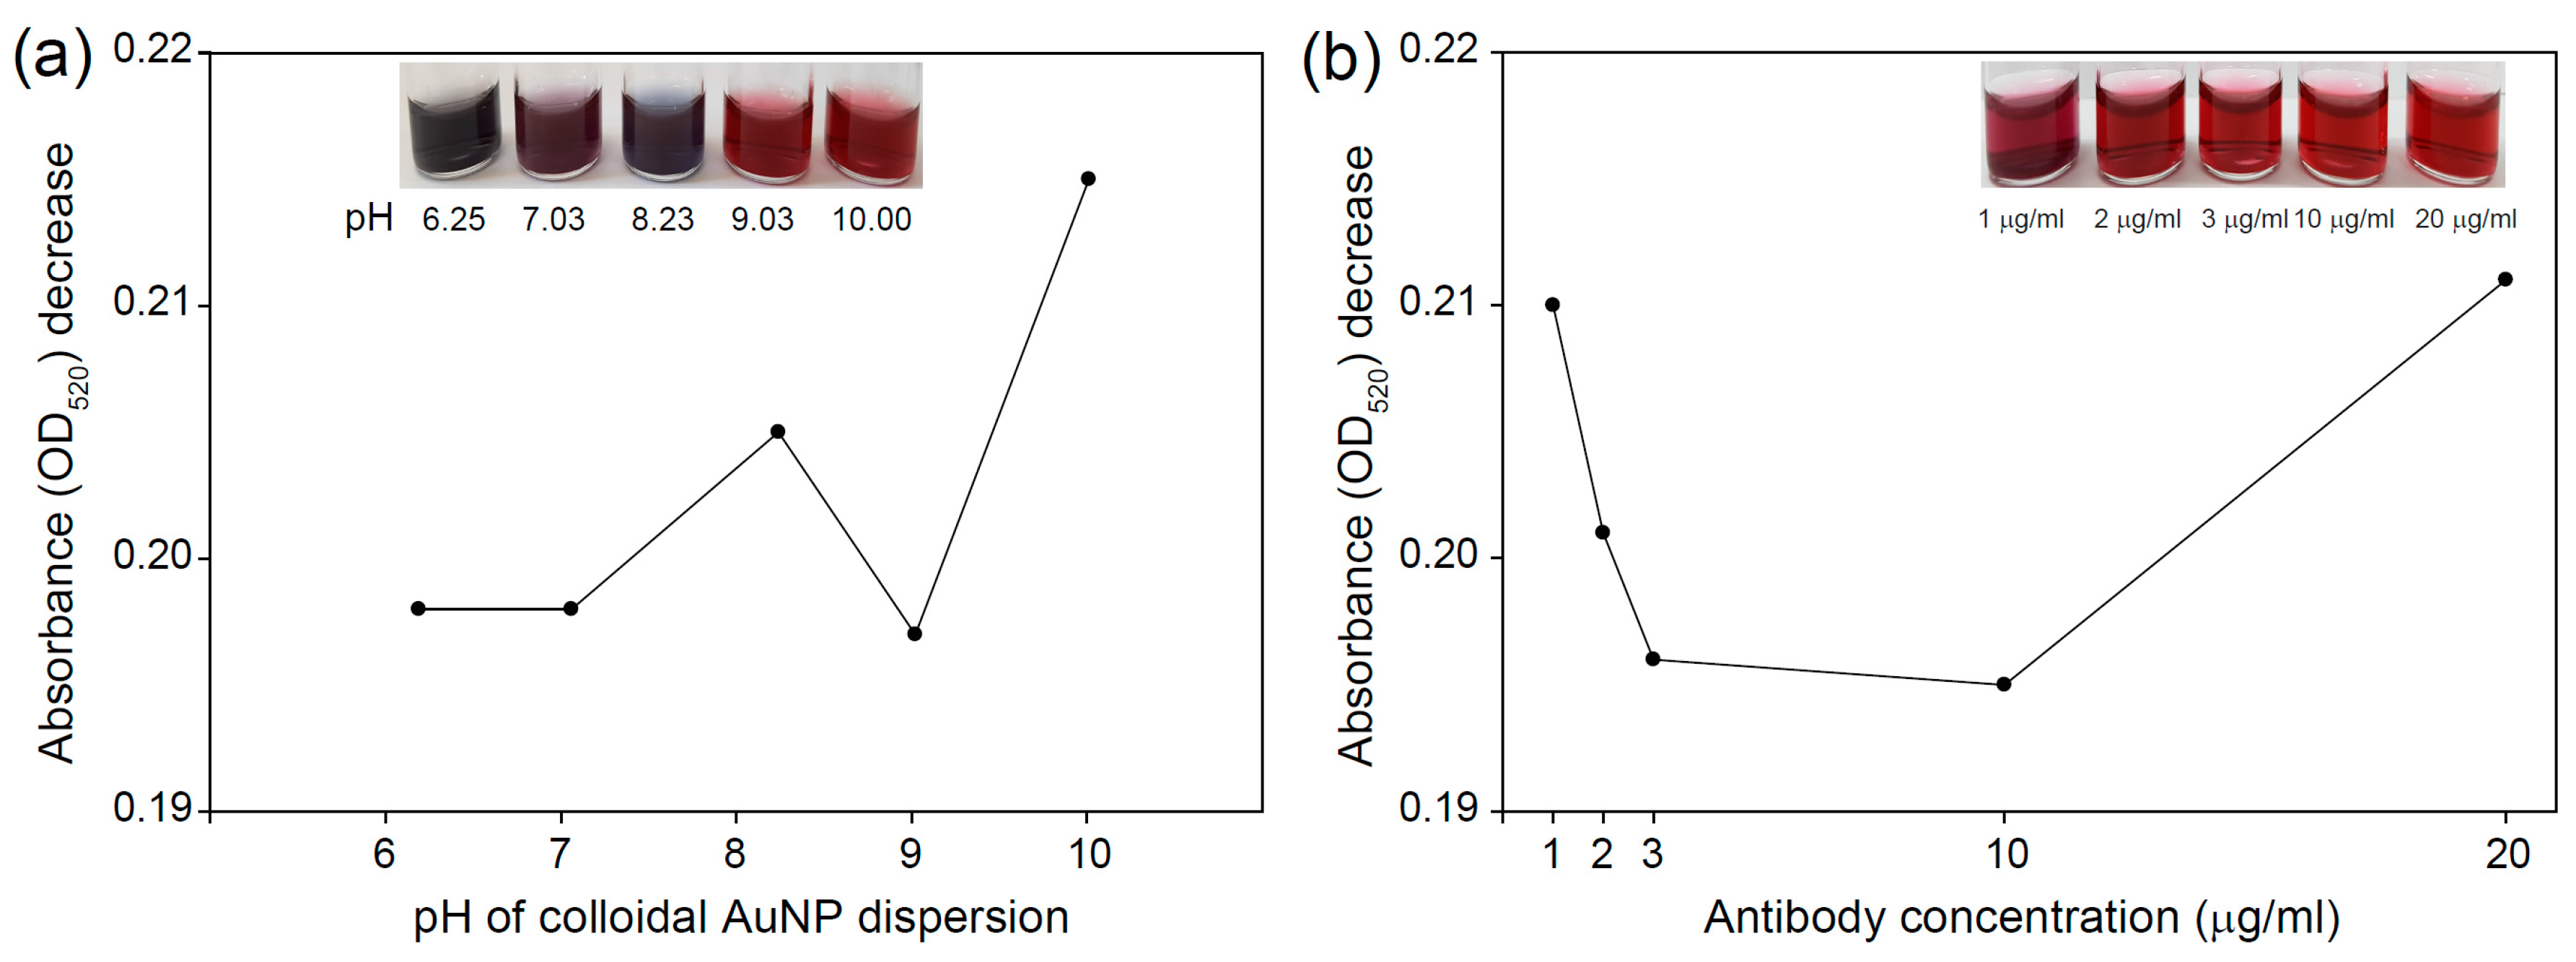
2.3. Preparation of Antibody-Conjugated AuNPs
2.4. Fabrication of Immunochromatographic Test Strip
2.5. Measurement of Colorimetric Signal Intensity
3. Results and Discussion
4. Conclusions
Acknowledgments
Author Contributions
Conflicts of Interest
References
- Draz, M.S.; Fang, B.A.; Li, L.; Chen, Z.; Wang, Y.; Xu, Y.; Yang, J.; Killeen, K.; Chen, F.F. Hybrid nanocluster plasmonic resonator for immunological detection of hepatitis B virus. ACS Nano 2012, 6, 7634–7643. [Google Scholar] [CrossRef] [PubMed]
- Song, L.W.; Wang, Y.B.; Fang, L.L.; Wu, Y.; Yang, L.; Chen, J.Y.; Ge, S.X.; Zhang, J.; Xiong, Y.Z.; Deng, X.M.; et al. Rapid fluorescent lateral-flow immunoassay for hepatitis B virus genotyping. Anal. Chem. 2015, 87, 5173–5180. [Google Scholar] [CrossRef] [PubMed]
- Sabouri, S.; Ghourchian, H.; Shourian, M.; Boutorabi, M. A gold nanoparticle-based immunosensor for the chemiluminescence detection of the hepatitis B surface antigen. Anal. Methods 2014, 6, 5059–5066. [Google Scholar] [CrossRef]
- Krajden, M.; McNabb, G.; Petric, M. The laboratory diagnosis of hepatitis B virus. Can. J. Infect. Dis. Med. Microbiol. 2005, 16, 65–72. [Google Scholar] [CrossRef] [PubMed]
- Yu, W.; Goddard, C.; Clearfield, E.; Mills, C.; Xiao, T.; Guo, H.; Morrey, J.D.; Motter, N.E.; Zhao, K.; Block, T.M.; et al. Design, synthesis, and biological evaluation of triazolo-pyrimidine derivatives as novel inhibitors of hepatitis B virus surface antigen (HBsAg) secretion. J. Med. Chem. 2011, 54, 5660–5670. [Google Scholar] [CrossRef] [PubMed]
- Zhou, L.; Ding, L.; Yin, P.; Lu, X.; Wang, X.; Niu, J.; Gao, P.; Xu, G. Serum metabolic profiling study of hepatocellular carcinoma infected with hepatitis B or hepatitis C virus by using liquid chromatography-mass spectrometry. J. Proteome Res. 2012, 11, 5433–5442. [Google Scholar] [CrossRef] [PubMed]
- Narayan, R.; Gangadharan, B.; Hantz, O.; Antrobus, R.; García, Á.; Dwek, R.A.; Zitzmann, N. Proteomic analysis of hepaRG cells: A novel cell line that supports hepatitis B virus infection. J. Proteome Res. 2009, 8, 118–122. [Google Scholar] [CrossRef] [PubMed]
- Liu, H.; Yuan, Y.; Guo, H.; Mitchelson, K.; Zhang, K.; Xie, L.; Qin, W.; Lu, Y.; Wang, J.; Guo, Y.; et al. Hepatitis B virus encoded X protein suppresses apoptosis by inhibition of the caspase-independent pathway. J. Proteome Res. 2012, 11, 4803–4813. [Google Scholar] [CrossRef] [PubMed]
- Zhou, K.; Li, L.; Tan, Z.; Zlotnick, A.; Jacobson, S.C. Characterization of hepatitis B virus capsids by resistive-pulse sensing. J. Am. Chem. Soc. 2011, 133, 1618–1621. [Google Scholar] [CrossRef] [PubMed]
- Abe, A.; Inoue, K.; Tanaka, T.; Kato, J.; Kajiyama, N.; Kawaguchi, R.; Tanaka, S.; Yoshiba, M.; Kohara, M. Quantitation of hepatitis B virus genomic DNA by real-time detection PCR. J. Clin. Microbiol. 1999, 37, 2899–2903. [Google Scholar] [PubMed]
- Song, J.; Mauk, M.G.; Hackett, B.A.; Cherry, S.; Bau, H.H.; Liu, C. Instrument-free point-of-care molecular detection of zika virus. Anal. Chem. 2016, 88, 7289–7294. [Google Scholar] [CrossRef] [PubMed]
- Ahrberg, C.D.; Manz, A.; Neužil, P. Palm-sized device for point-of-care ebola detection. Anal. Chem. 2016, 88, 4803–4807. [Google Scholar] [CrossRef] [PubMed]
- Chung, J.F.; Yoon, C.J.; Cheon, S.A.; Seo, E.S.; Park, S.H.; Yang, J.S.; Kim, B.; Joo, M.Y.; Park, T.J.; Kim, K.H.; et al. NO-dependent attenuation of TPA-induced immunoinflammatory skin changes in Balb/c mice by pindolol, heptaminol or ATRA, but not by verapamil. Oncotarget 2016, 7, 47576–47585. [Google Scholar] [CrossRef] [PubMed]
- Choi, S. Powering point-of-care diagnostic devices. Biotechnol. Adv. 2016, 34, 321–330. [Google Scholar] [CrossRef] [PubMed]
- Choi, D.H.; Lee, S.K.; Oh, Y.K.; Bae, B.W.; Lee, S.D.; Kim, S.; Shin, Y.B.; Kim, M.G. A dual gold nanoparticle conjugate-based lateral flow assay (LFA) method for the analysis of troponin I. Biosens. Bioelectron. 2010, 25, 1999–2002. [Google Scholar] [CrossRef] [PubMed]
- Lou, S.; Ye, J.; Li, K.; Wu, A. A gold nanoparticle-based immunochromatographic assay: The influence of nanoparticulate size. Analyst 2012, 137, 1174–1181. [Google Scholar] [CrossRef] [PubMed]
- Singh, J.; Sharma, S.; Nara, S. Nanogold based lateral flow assay for the detection of Salmonella typhi in environmental water samples. Anal. Methods 2015, 7, 9281–9288. [Google Scholar] [CrossRef]
- Alipour, E.; Ghourchian, H.; Boutorabi, S.M. Gold nanoparticle based capacitive immunosensor for detection of hepatitis B surface antigen. Anal. Methods 2013, 5, 4448–4453. [Google Scholar] [CrossRef]
- Posthuma-Trumpie, G.A.; Korf, J.; Amerongen, A. Lateral flow (immune) assay: Its strengths, weaknesses, opportunities and threats. A literature survey. Anal. Bioanal. Chem. 2009, 393, 569–582. [Google Scholar] [CrossRef] [PubMed]
- Shan, S.; Lai, W.; Xiong, Y.; Wei, H.; Xu, H. Novel strategies to enhance lateral flow immunoassay sensitivity for detecting foodborne pathogens. J. Agric. Food Chem. 2015, 63, 745–753. [Google Scholar] [CrossRef] [PubMed]
- Wang, K.; Qin, W.; Hou, Y.; Xiao, K.; Yan, W. The application of lateral flow immunoassay in point of care testing: A review. Nano Biomed. Eng. 2016, 8, 172–183. [Google Scholar] [CrossRef]
- Rivas, L.; Medina-Sánchez, M.; Escosura-Muñiz, A.; Merkoçi, A. Improving sensitivity of gold nanoparticle-based lateral flow assays by using wax-printed pillars as delay barriers of microfluidics. Lab Chip 2014, 14, 4406–4414. [Google Scholar] [CrossRef] [PubMed]
- Bahadir, E.B.; Sezgintürk, M.K. Lateral flow assays: Principles, designs and labels. Trends Anal. Chem. 2016, 82, 286–306. [Google Scholar] [CrossRef]
- Chen, A.; Yang, S. Replacing antibodies with aptamers in lateral flow immunoassay. Biosens. Bioelectron. 2015, 71, 230–242. [Google Scholar] [CrossRef] [PubMed]
- Bastús, N.G.; Comenge, J.; Puntes, V. Kinetically controlled seeded growth synthesis of citrate-stabilized gold nanoparticles of up to 200 nm: Size focusing versus Ostwald ripening. Langmuir 2011, 27, 11098–11105. [Google Scholar] [CrossRef] [PubMed]
- Aveyard, J.; Mehrabi, M.; Cossins, A.; Braven, H.; Wilson, R. One step visual detection of PCR products with gold nanoparticles and a nucleic acid lateral flow (NALF) device. Chem. Commun. 2007, 41, 4251–4253. [Google Scholar] [CrossRef]
- Henderson, K.; Stewart, J. Factors influencing the measurement of oestrone sulphate by dipstick particle capture immunoassay. J. Immunol. Methods 2002, 270, 77–84. [Google Scholar] [CrossRef]


© 2016 by the authors; licensee MDPI, Basel, Switzerland. This article is an open access article distributed under the terms and conditions of the Creative Commons Attribution (CC-BY) license (http://creativecommons.org/licenses/by/4.0/).
Share and Cite
Kim, D.S.; Kim, Y.T.; Hong, S.B.; Kim, J.; Heo, N.S.; Lee, M.-K.; Lee, S.J.; Kim, B.I.; Kim, I.S.; Huh, Y.S.; et al. Development of Lateral Flow Assay Based on Size-Controlled Gold Nanoparticles for Detection of Hepatitis B Surface Antigen. Sensors 2016, 16, 2154. https://0-doi-org.brum.beds.ac.uk/10.3390/s16122154
Kim DS, Kim YT, Hong SB, Kim J, Heo NS, Lee M-K, Lee SJ, Kim BI, Kim IS, Huh YS, et al. Development of Lateral Flow Assay Based on Size-Controlled Gold Nanoparticles for Detection of Hepatitis B Surface Antigen. Sensors. 2016; 16(12):2154. https://0-doi-org.brum.beds.ac.uk/10.3390/s16122154
Chicago/Turabian StyleKim, Dong Seok, Yong Tae Kim, Seok Bok Hong, Jinwoon Kim, Nam Su Heo, Moon-Keun Lee, Seok Jae Lee, Byeong Il Kim, In Soo Kim, Yun Suk Huh, and et al. 2016. "Development of Lateral Flow Assay Based on Size-Controlled Gold Nanoparticles for Detection of Hepatitis B Surface Antigen" Sensors 16, no. 12: 2154. https://0-doi-org.brum.beds.ac.uk/10.3390/s16122154