Electrochemical Determination of Nitrite by Au Nanoparticle/Graphene-Chitosan Modified Electrode


Abstract
:1. Introduction
2. Materials and Methods
2.1. Reagents and Materials
2.2. Preparation of GO
2.3. Preparation of GO-CS Solution
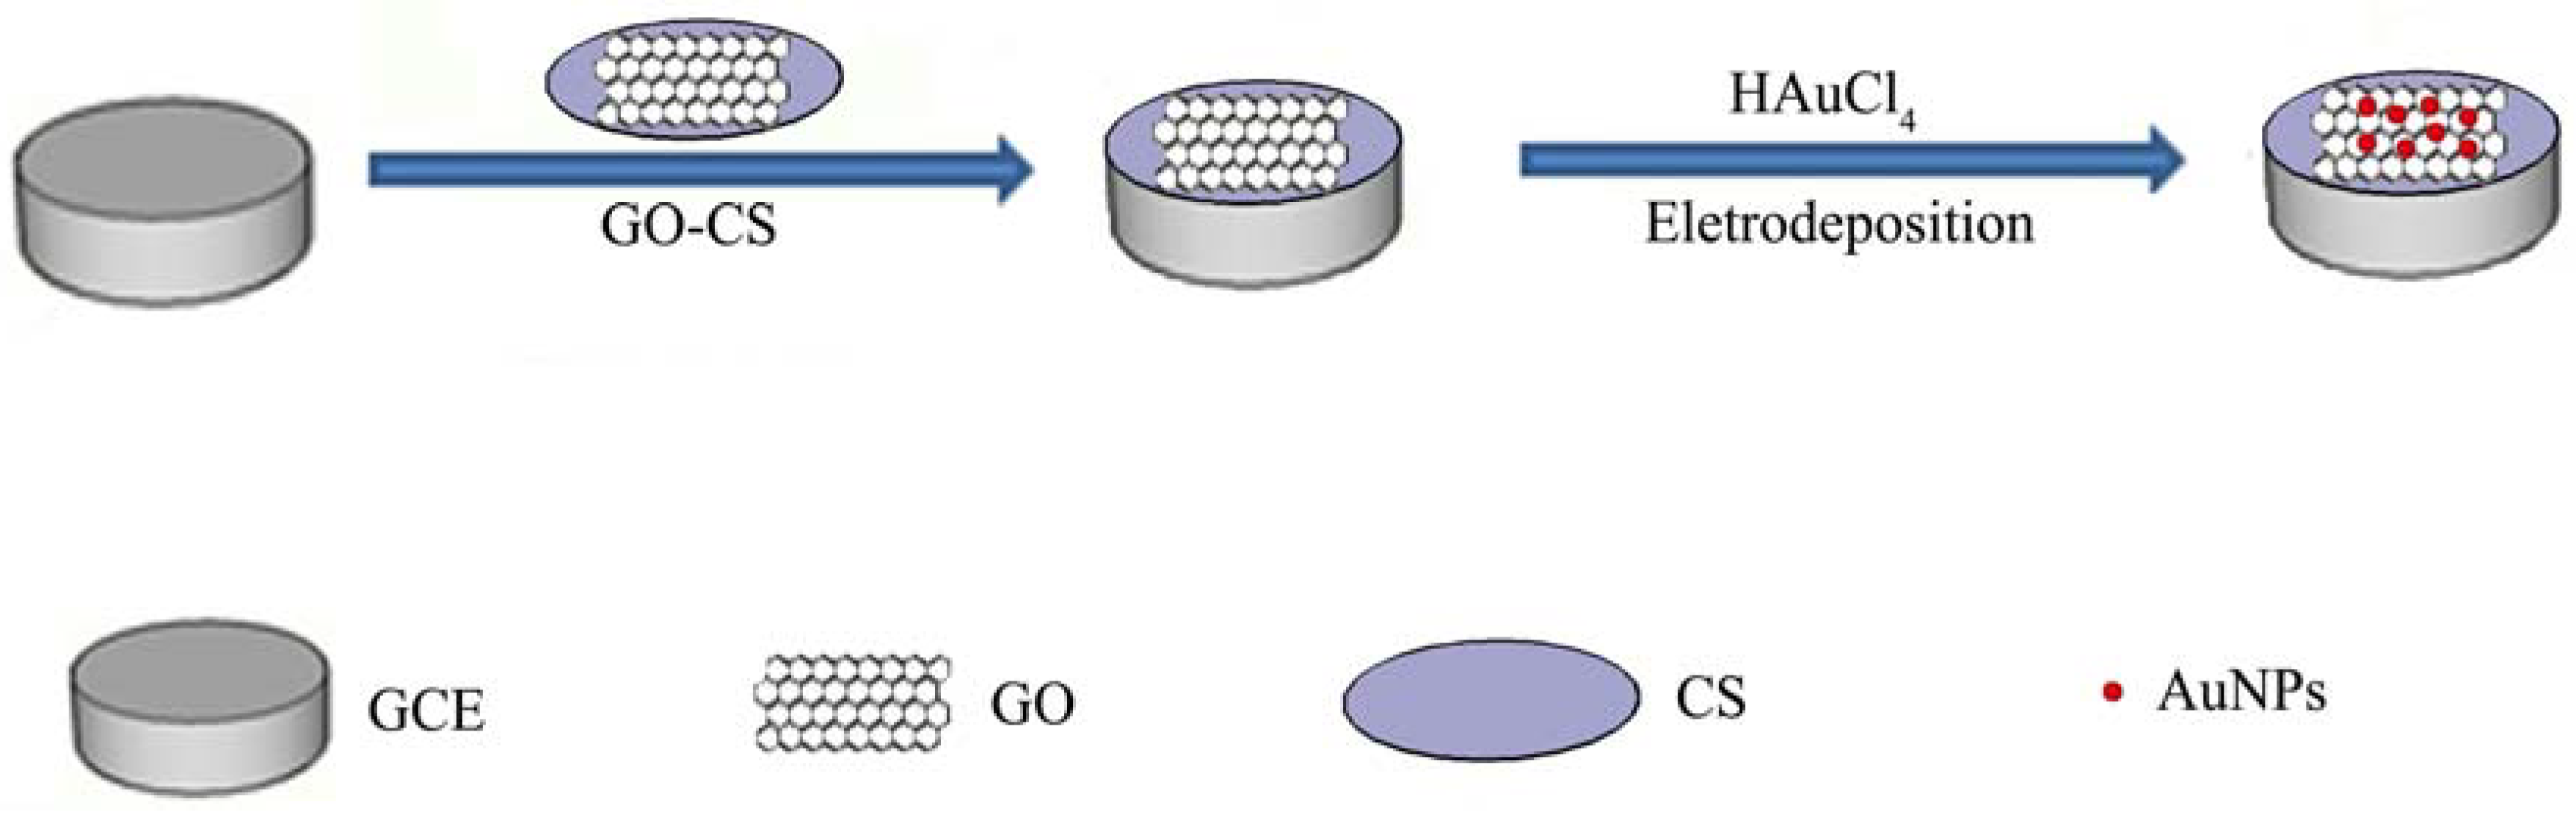
2.4. The Preparation and Modification of Electrode
2.5. Ion Interference Experiment of Amperometric i-t Curve
2.6. Instrumentation
3. Results and Discussion
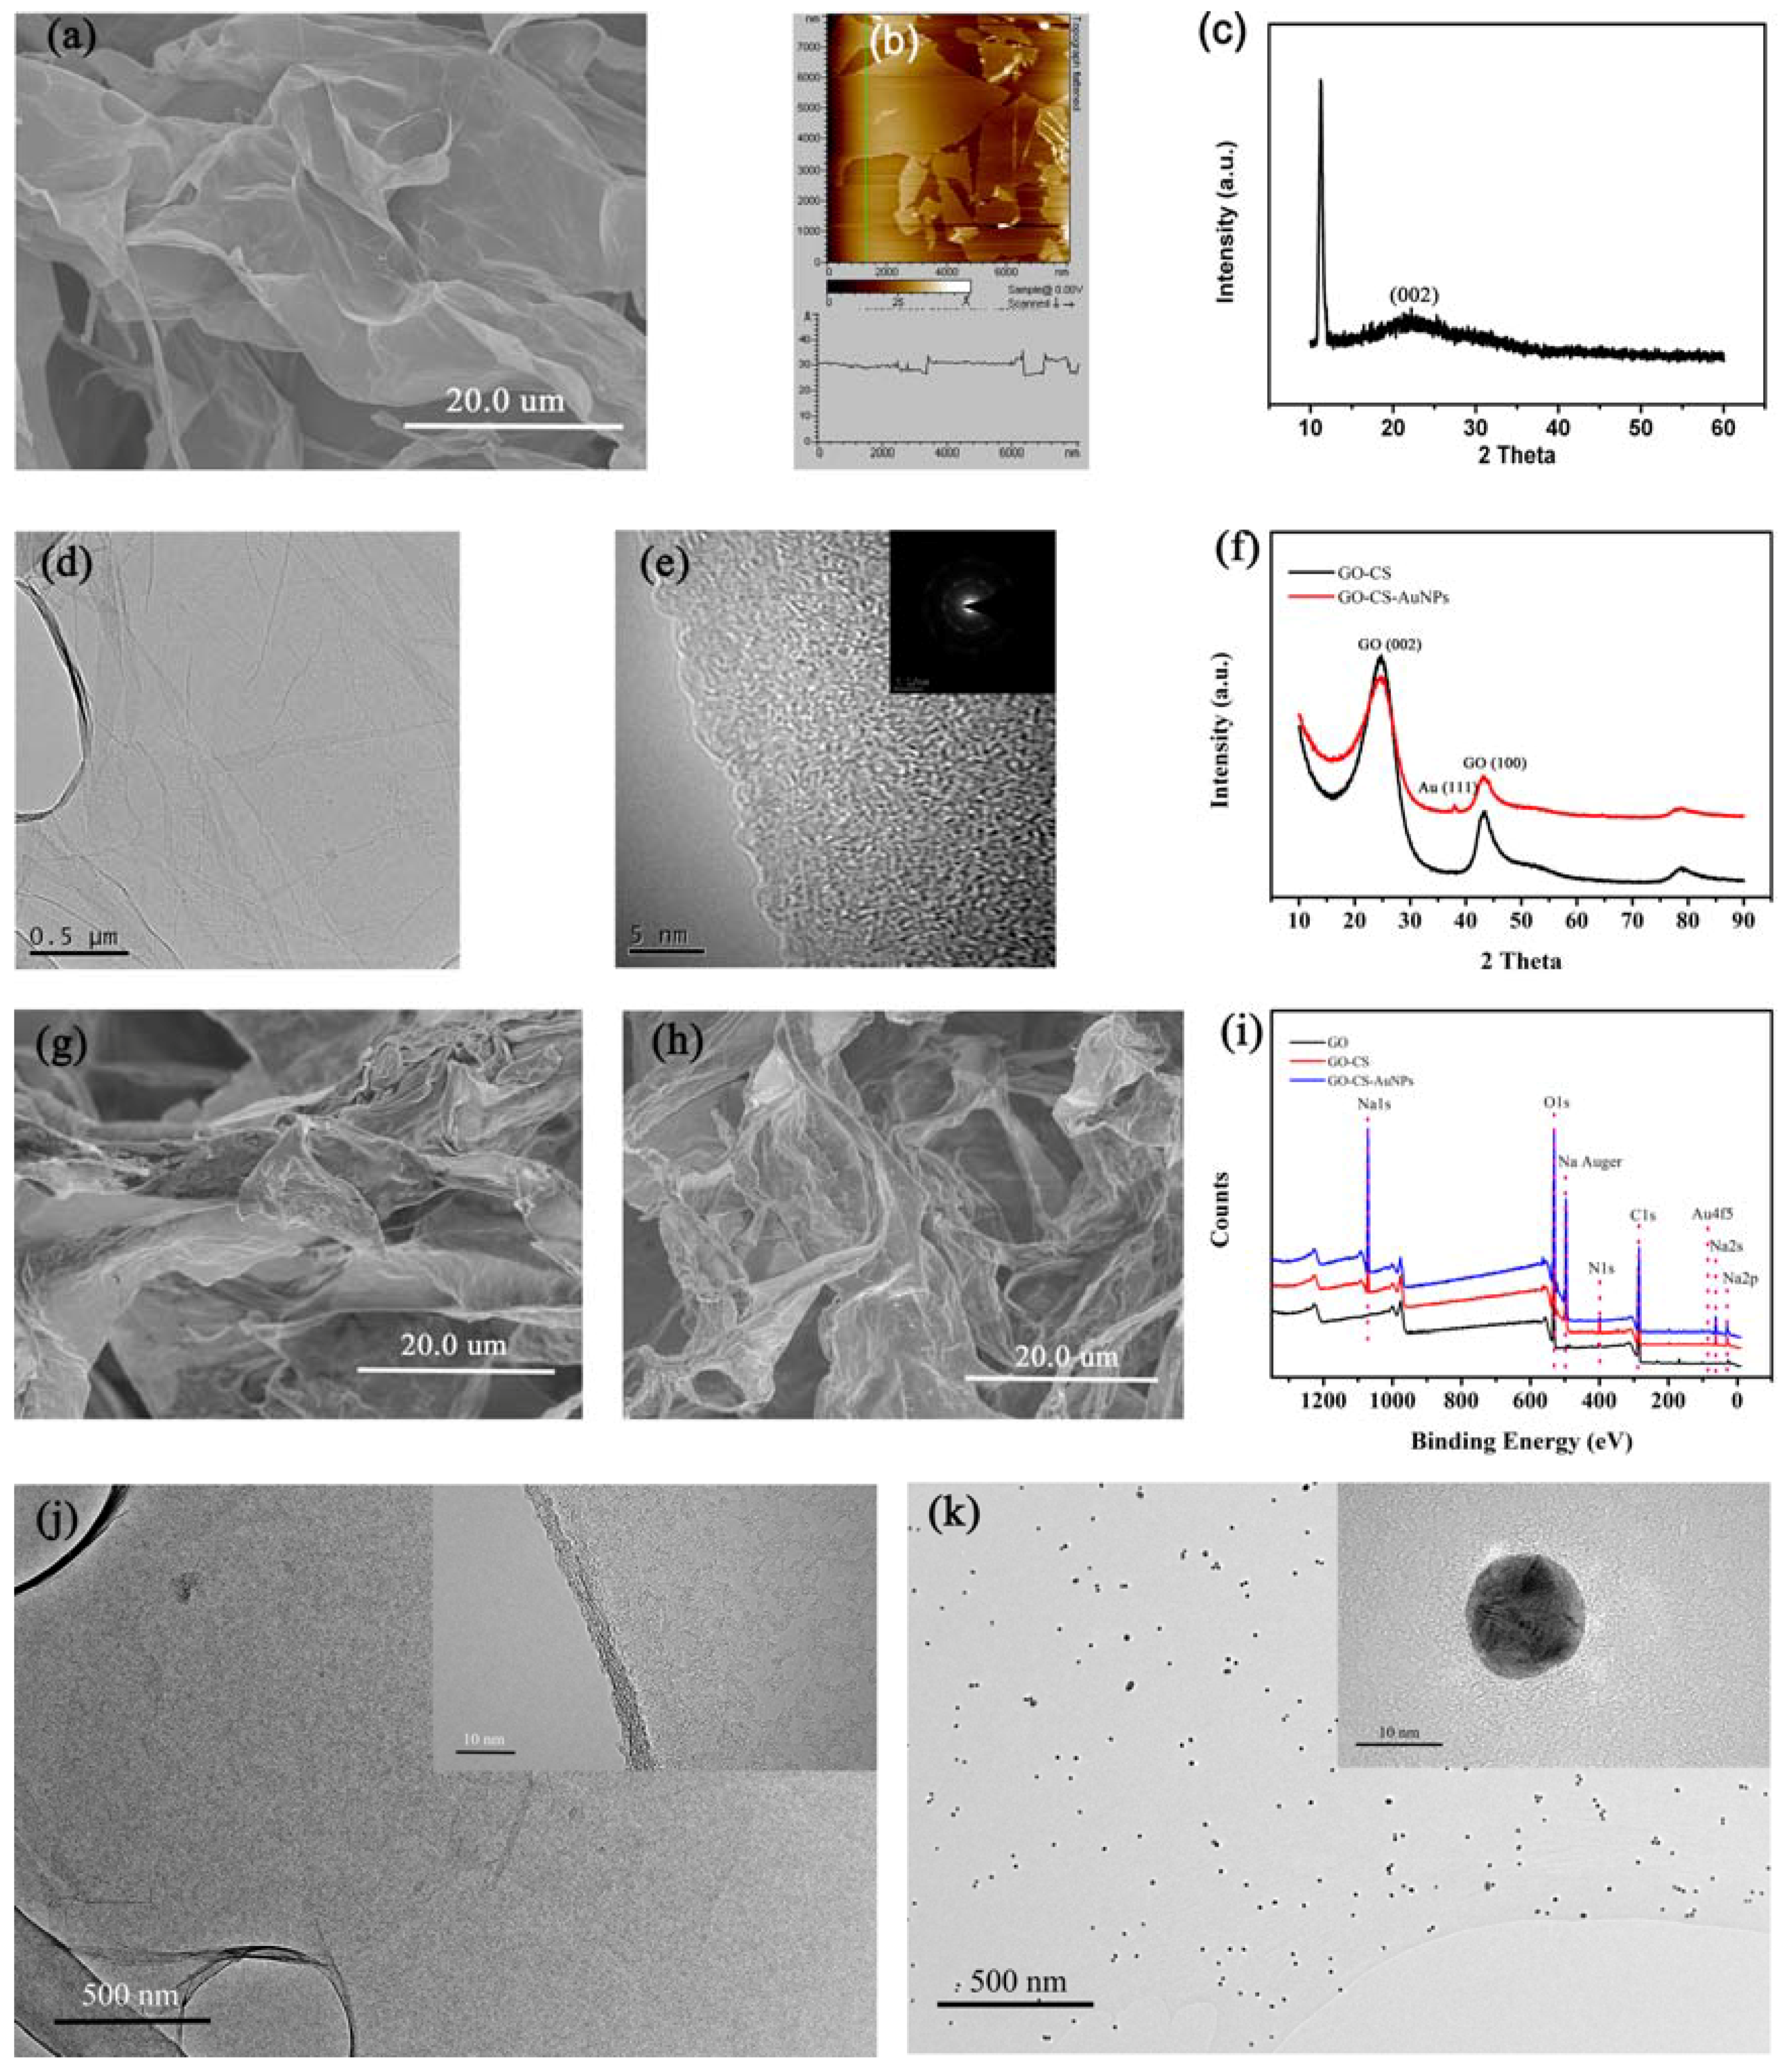
3.1. Characterization of GO, GO-CS and GO-CS-AuNPs
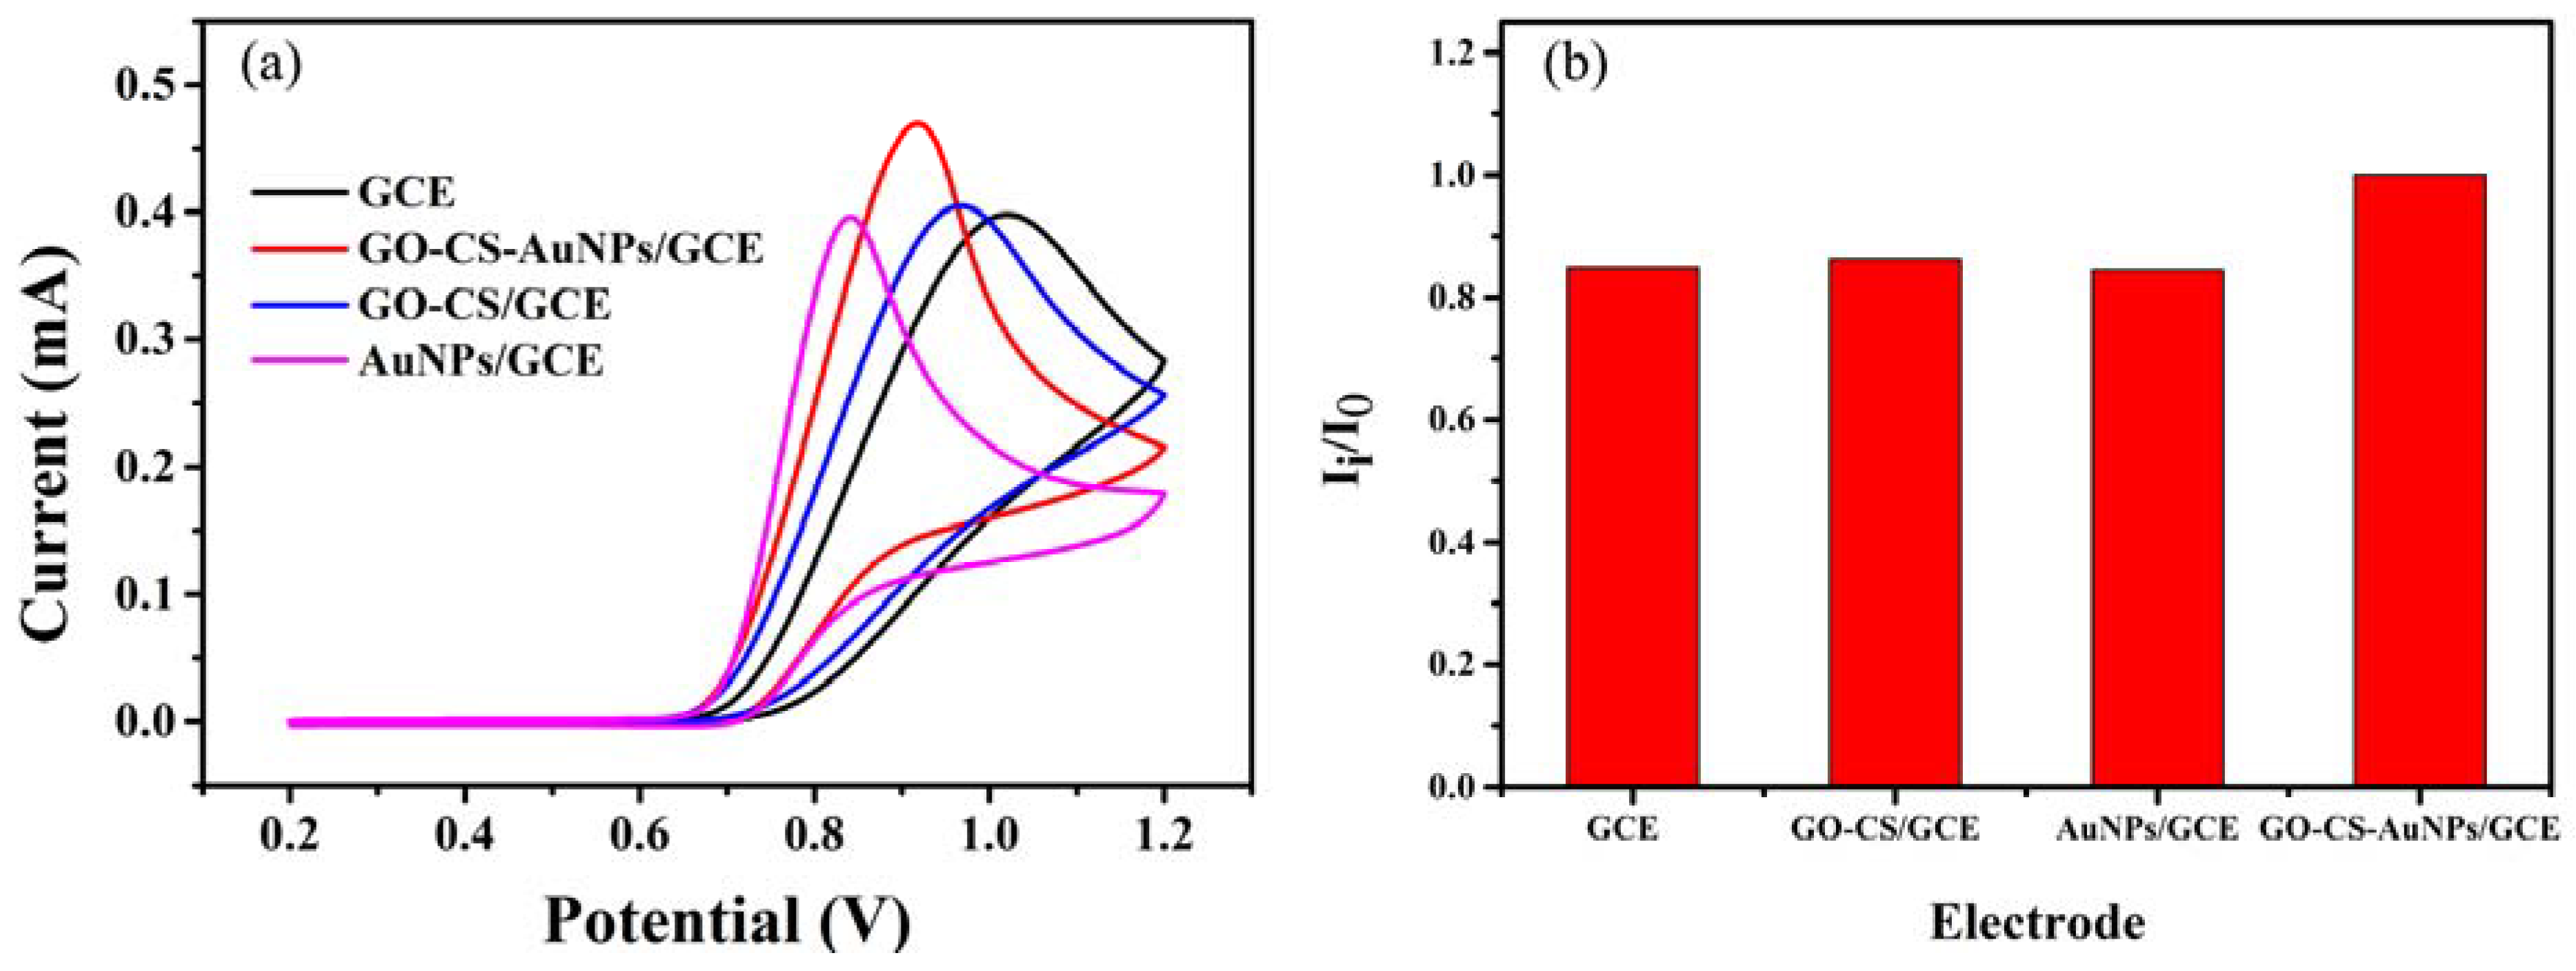
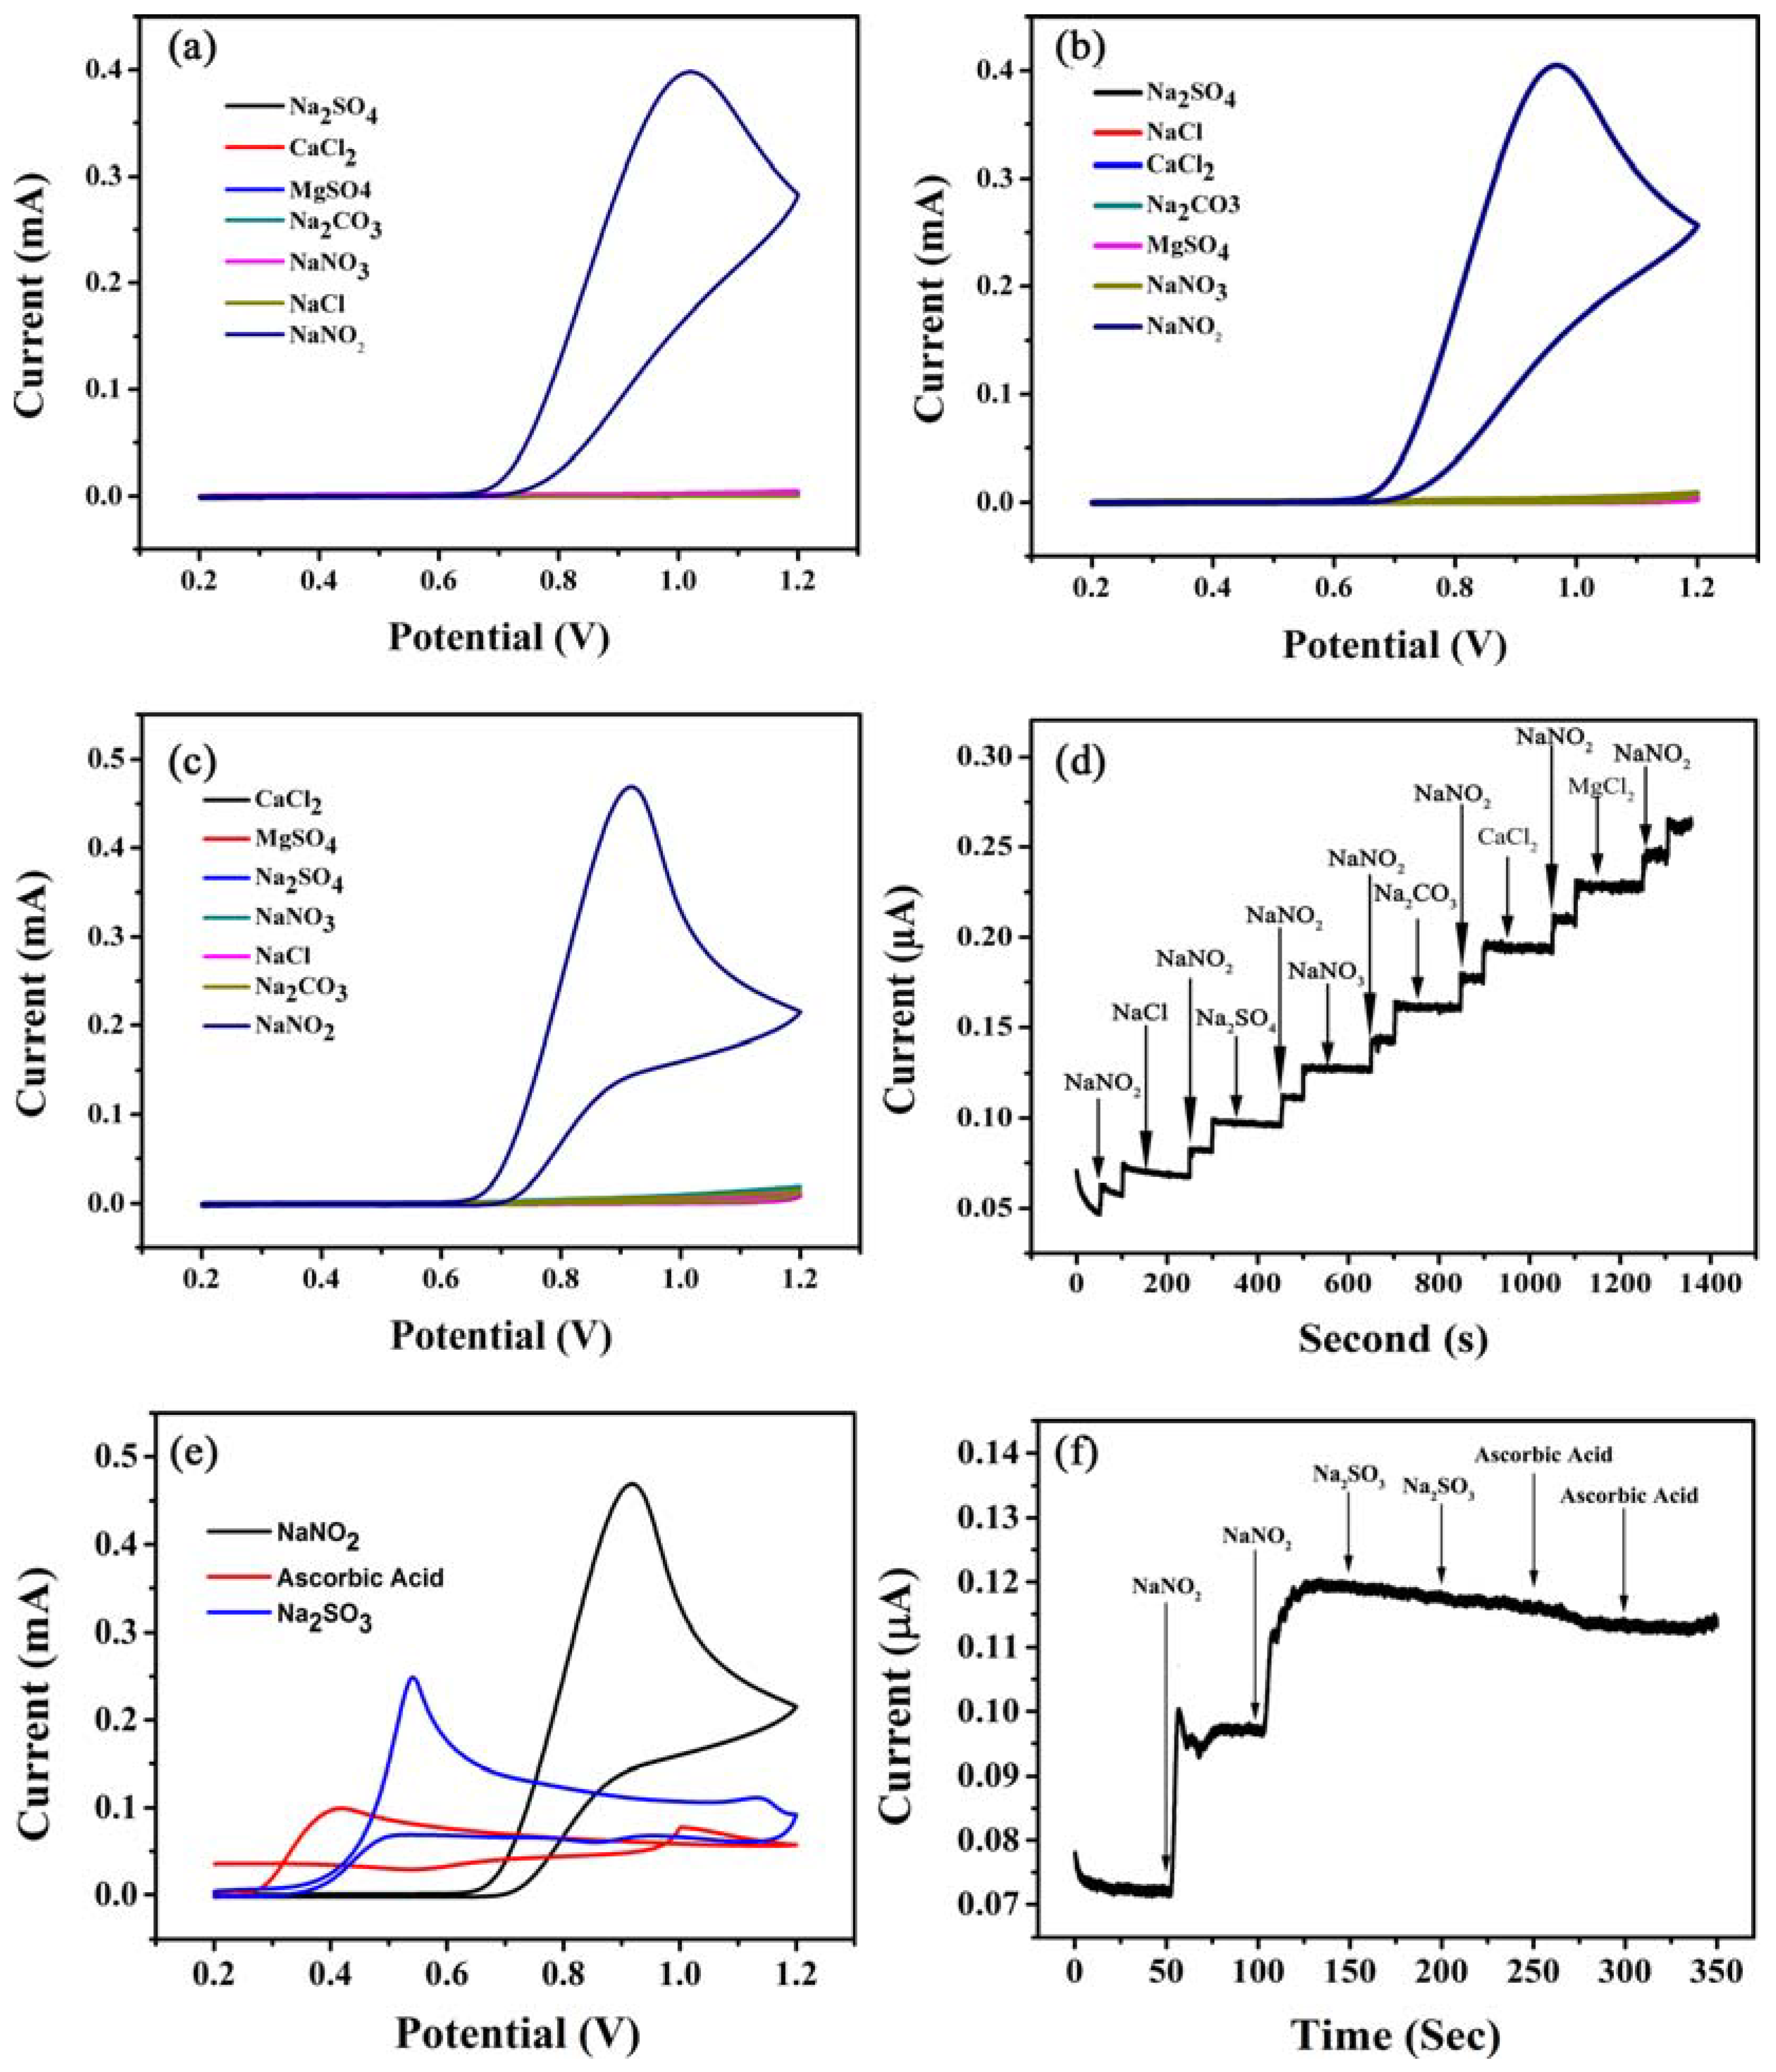
3.2. Electrochemical Behavior of NO2− on the Electrode
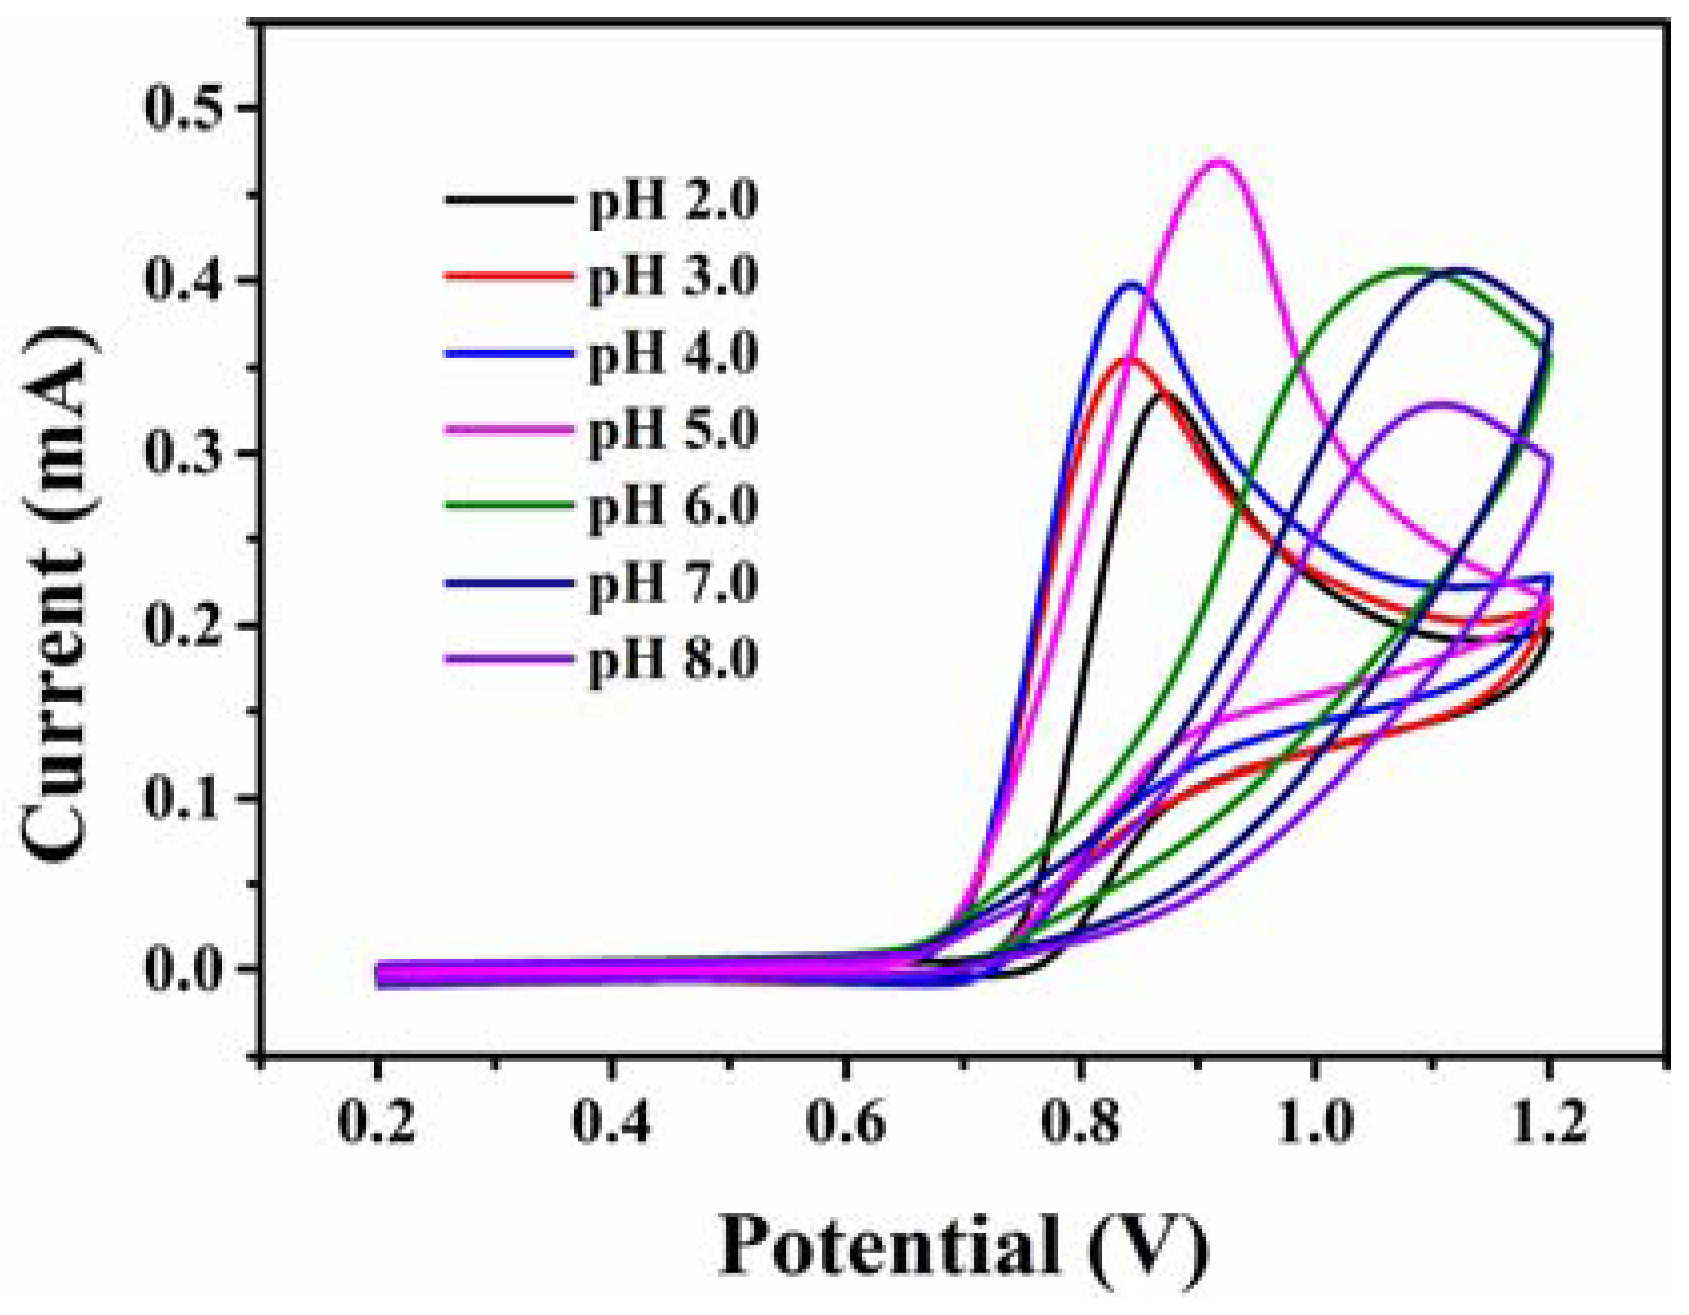
3.3. The Effect of pH on NO2− Detection
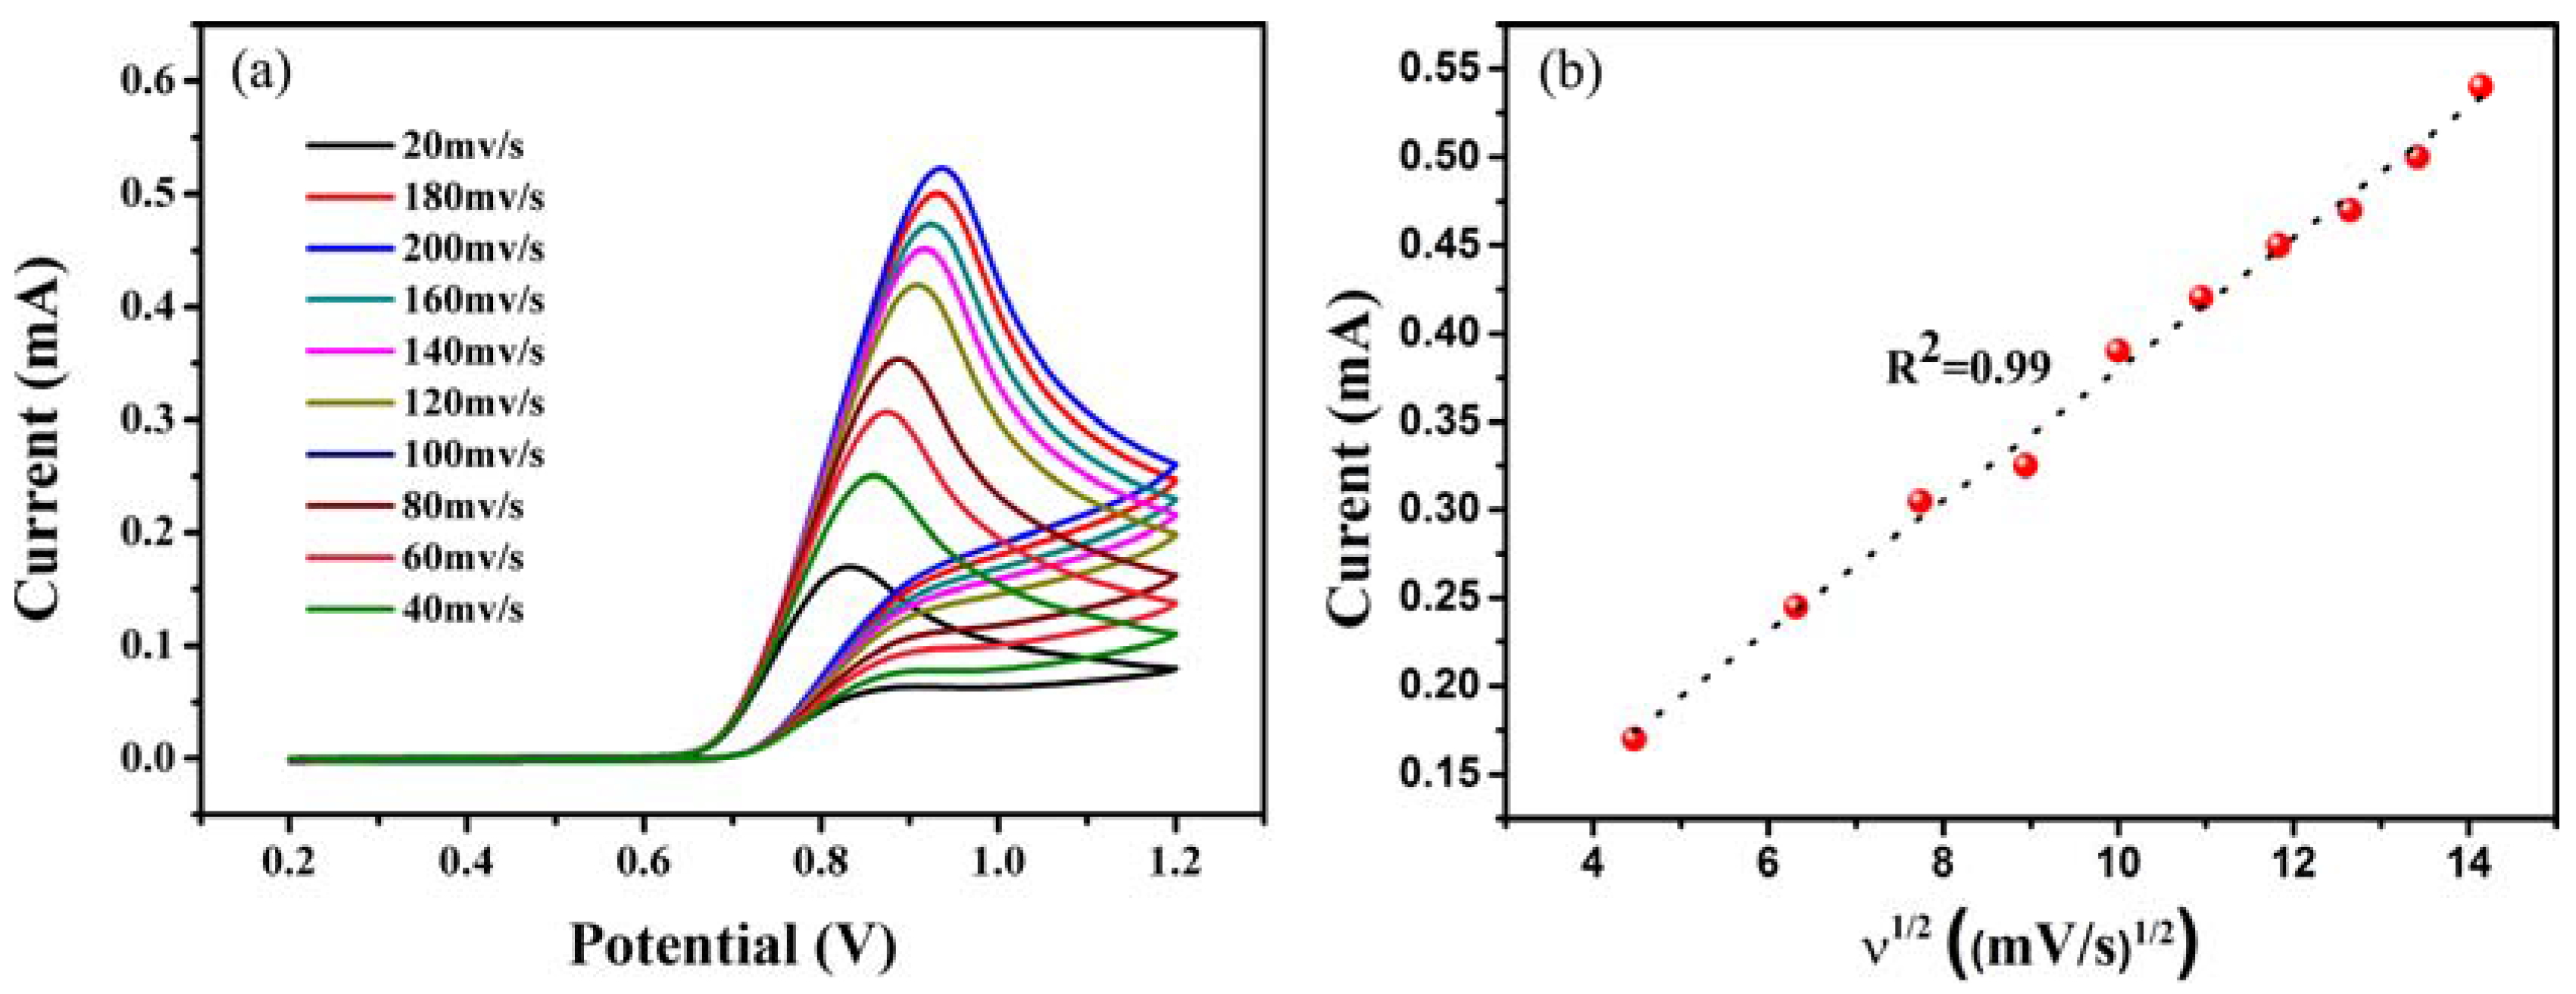
3.4. The Effect of Scan Rate on NO2− Detection
3.5. Interference Study
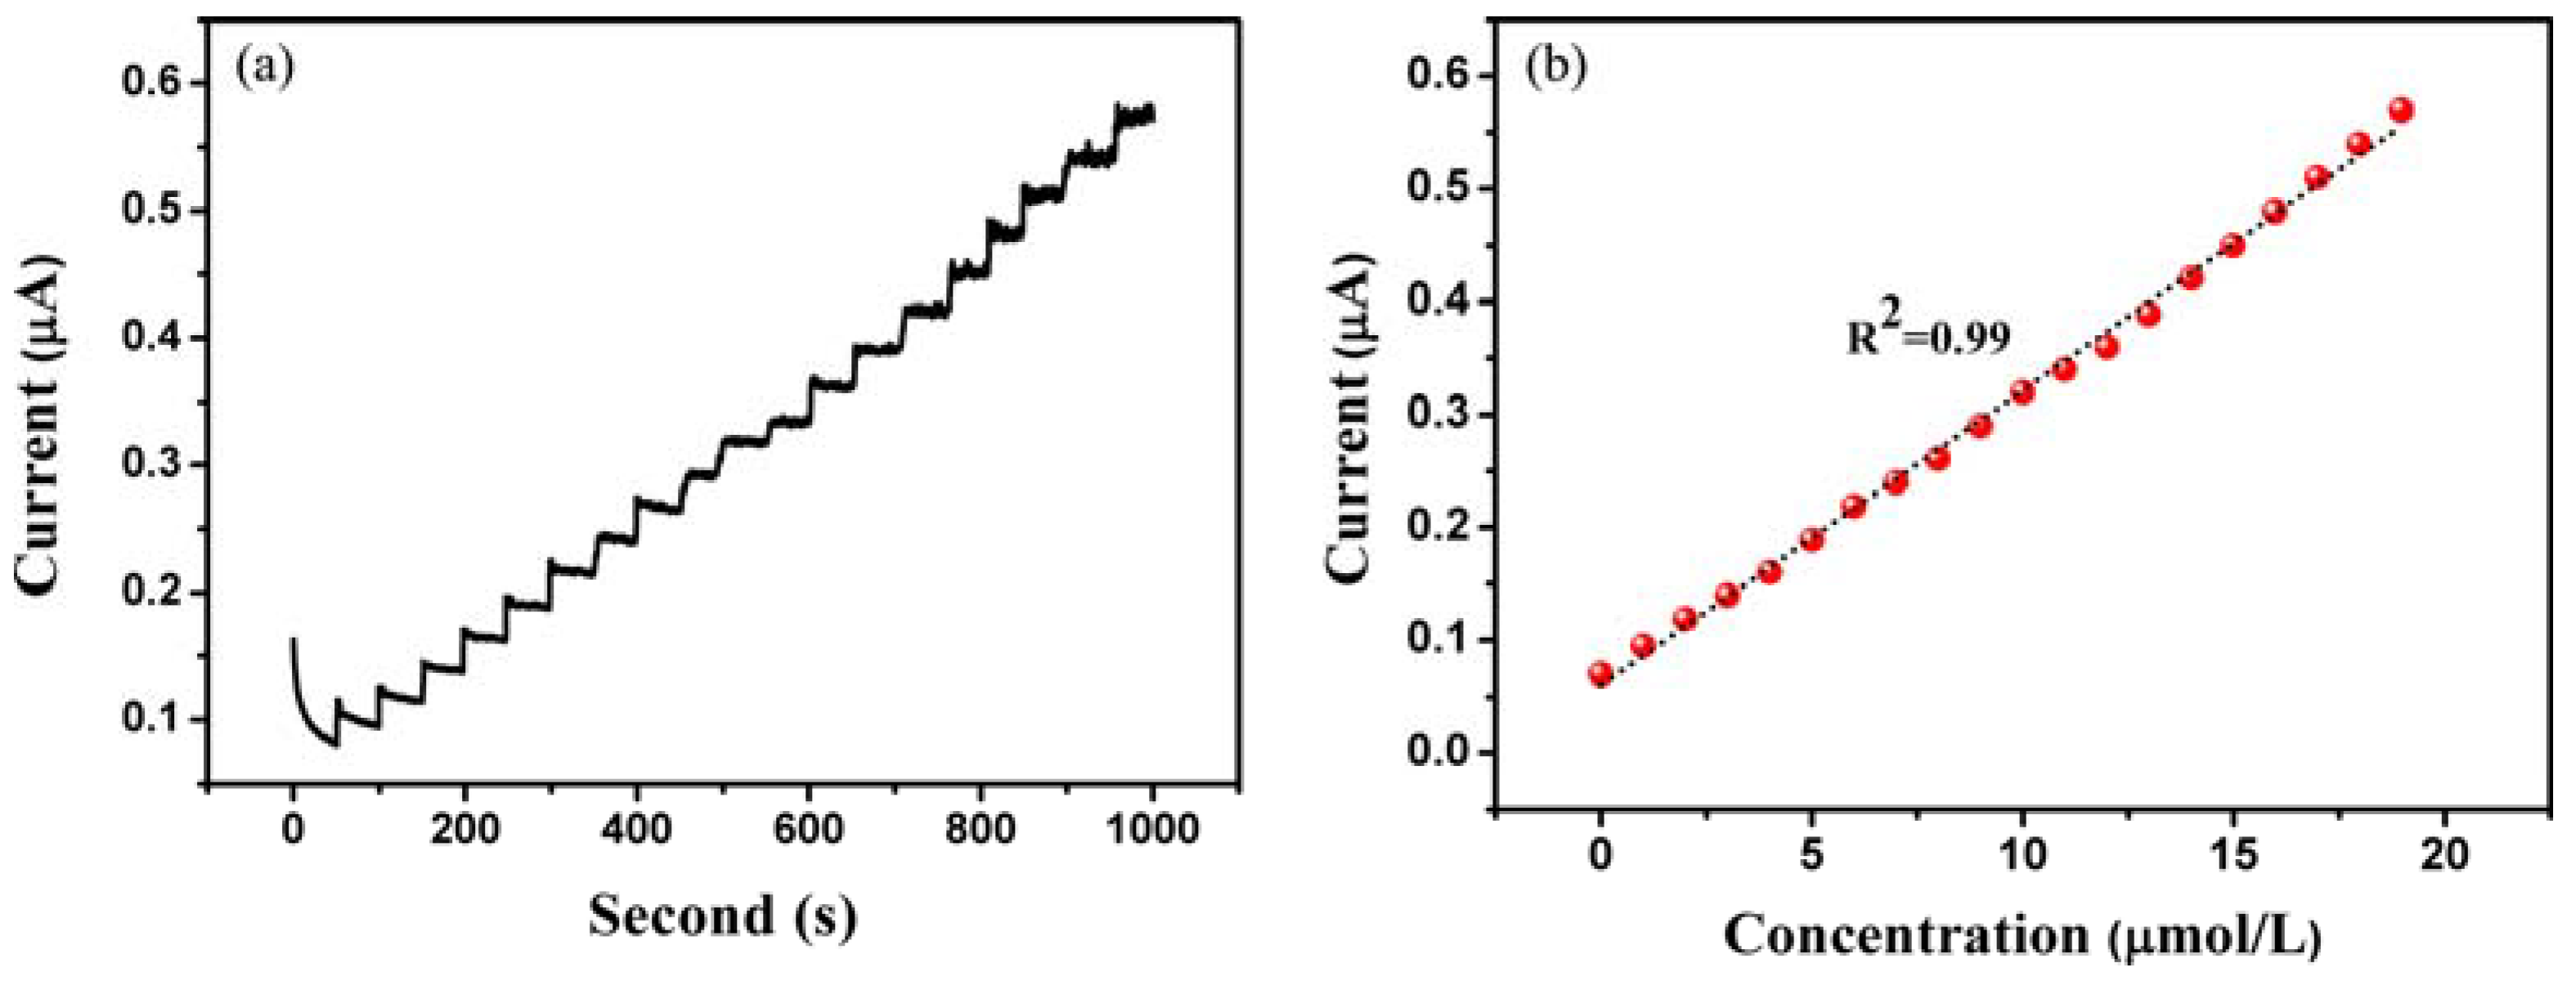
3.6. The Detection of NO2−
4. Conclusions
Author Contributions
Funding
Acknowledgments
Conflicts of Interest
References
- Rao, D.J.; Zhang, J.; Zheng, J.B. A novel electrochemical sensor based on gold nanorods and Nafion-modified GCE for the electrocatalytic oxidation of nitrite. J. Iran. Chem. Soc. 2016, 13, 2257–2266. [Google Scholar] [CrossRef]
- Shen, Y.; Rao, D.J.; Bai, W.S.; Sheng, Q.L.; Zheng, J.B. Preparation of high-quality palladium nanocubes heavily deposited on nitrogen-doped graphene nanocomposites and their application for enhanced electrochemical sensing. Talanta 2017, 165, 304–312. [Google Scholar] [CrossRef] [PubMed]
- Liu, H.; Guo, K.; Lv, J.; Gao, Y.; Duan, C.Y.; Deng, L.; Zhu, Z.F. A novel nitrite biosensor based on the direct electrochemistry of horseradish peroxidase immobilized on porous Co3O4 nanosheets and reduced graphene oxide composite modified electrode. Sens. Actuators B-Chem. 2017, 238, 249–256. [Google Scholar] [CrossRef]
- Huang, S.-S.; Liu, L.; Mei, L.-P.; Zhou, J.-Y.; Guo, F.-Y.; Wang, A.-J.; Feng, J.-J. Electrochemical sensor for nitrite using a glassy carbon electrode modified with gold-copper nanochain networks. Microchim. Acta 2016, 183, 791–797. [Google Scholar] [CrossRef]
- Zou, C.; Yang, B.B.; Bin, D.; Wang, J.; Li, S.M.; Yang, P.; Wang, C.Q.; Shiraishi, Y.; Du, Y.K. Electrochemical synthesis of gold nanoparticles decorated flower-like graphene for high sensitivity detection of nitrite. J. Colloid Interface Sci. 2017, 488, 135–141. [Google Scholar] [CrossRef] [PubMed]
- Yue, R.; Lu, Q.; Zhou, Y.K. A novel nitrite biosensor based on single-layer graphene nanoplatelet-protein composite film. Biosens. Bioelectron. 2011, 26, 4436–4441. [Google Scholar] [CrossRef] [PubMed]
- Seo, Y.; Manivannan, S.; Kang, I.; Lee, S.-W.; Kim, K. Gold dendrites Co-deposited with M13 virus as a biosensor platform for nitrite ions. Biosens. Bioelectron. 2017, 94, 87–93. [Google Scholar] [CrossRef] [PubMed]
- Rajkumar, C.; Thirumalraj, B.; Chen, S.-M.; Palanisamy, S. Novel electrochemical preparation of gold nanoparticles decorated on a reduced graphene oxide-fullerene composite for the highly sensitive electrochemical detection of nitrite. RSC Adv. 2016, 6, 68798–68805. [Google Scholar] [CrossRef]
- Shaikh, T.; Ibupoto, Z.H.; Talpur, F.N.; Sirajuddin; Khaskheli, A.R.; Agheem, M.H.; Siddiqui, S.; Tahira, A.; Willander, M.; Yu, C. Selective and sensitive nitrite sensor based on glassy carbon electrode modified by silver nanochains. Electroanalysis 2017, 29, 415–422. [Google Scholar] [CrossRef]
- Lin, Z.; Xue, W.; Chen, H.; Lin, J.-M. Peroxynitrous-acid-induced chemiluminescence of fluorescent carbon dots for nitrite sensing. Anal. Chem. 2011, 83, 8245–8251. [Google Scholar] [CrossRef] [PubMed]
- Lin, Z.; Dou, X.N.; Li, H.F.; Ma, Y.; Lin, J.-M. Nitrite sensing based on the carbon dots-enhanced chemiluminescence from peroxynitrous acid and carbonate. Talanta 2015, 132, 457–462. [Google Scholar] [CrossRef] [PubMed]
- Wang, X.; Adams, E.; Van Schepdael, A. A fast and sensitive method for the determination of nitrite in human plasma by capillary electrophoresis with fluorescence detection. Talanta 2012, 97, 142–144. [Google Scholar] [CrossRef] [PubMed]
- Kodamatani, H.; Yamazaki, S.; Saito, K.; Tomiyasu, T.; Komatsu, Y. Selective determination method for measurement of nitrite and nitrate in water samples using high-performance liquid chromatography with post-column photochemical reaction and chemiluminescence detection. J. Chromatogr. A 2009, 1216, 3163–3167. [Google Scholar] [CrossRef] [PubMed]
- Masic, A.; Santos, A.T.L.; Etter, B.; Udert, K.M.; Villez, K. Estimation of nitrite in source-separated nitrified urine with UV spectrophotometry. Water Res. 2015, 85, 244–254. [Google Scholar] [CrossRef] [PubMed]
- Pourreza, N.; Fat’hi, M.R.; Hatami, A. Indirect cloud point extraction and spectrophotometric determination of nitrite in water and meat products. Microchem. J. 2012, 104, 22–25. [Google Scholar] [CrossRef]
- Wang, H.W.; Wang, C.Q.; Yang, B.B.; Zhai, C.Y.; Bin, D.; Zhang, K.; Yang, P.; Du, Y.K. A facile fabrication of copper particle-decorated novel graphene flower composites for enhanced detecting of nitrite. Analyst 2015, 140, 1291–1297. [Google Scholar] [CrossRef] [PubMed]
- Song, X.Y.; Gao, L.; Li, Y.M.; Mao, L.Q.; Yang, J.-H. A sensitive and selective electrochemical nitrite sensor based on a glassy carbon electrode modified with cobalt phthalocyanine-supported Pd nanoparticles. Anal. Methods 2017, 9, 3166–3171. [Google Scholar] [CrossRef]
- Badea, M.; Amine, A.; Palleschi, G.; Moscone, D.; Volpe, G.; Curulli, A. New electrochemical sensors for detection of nitrites and nitrates. J. Electroanal. Chem. 2001, 509, 66–72. [Google Scholar] [CrossRef] [Green Version]
- Shan, C.S.; Yang, H.F.; Han, D.X.; Zhang, Q.X.; Ivaska, A.; Niu, L. Graphene/AuNPs/chitosan nanocomposites film for glucose biosensing. Biosens. Bioelectron. 2010, 25, 1070–1074. [Google Scholar] [CrossRef] [PubMed]
- Wang, X.; Li, H.; Wu, M.; Ge, S.-L.; Zhu, Y.; Wang, Q.-J.; He, P.-G.; Fang, Y.-Z. Simultaneous electrochemical determination of sulphite and nitrite using a gold nanoparticle/graphene-chitosan modified electrode. Chin. J. Anal. Chem. 2013, 41, 1232–1237. [Google Scholar] [CrossRef]
- Jia, N.M.; Huang, B.Z.; Chen, L.N.; Tan, L.; Yao, S.Z. A simple non-enzymatic hydrogen peroxide sensor using gold nanoparticles-graphene-chitosan modified electrode. Sens. Actuators B-Chem. 2014, 195, 165–170. [Google Scholar] [CrossRef]
- Fu, L.; Yu, S.; Thompson, L.; Yu, A. Development of a novel nitrite electrochemical sensor by stepwise in situ formation of palladium and reduced graphene oxide nanocomposites. RSC Adv. 2015, 5, 40111–40116. [Google Scholar] [CrossRef]
- Wan, Y.; Zheng, Y.F.; Yin, H.Y.; Song, X.C. Au nanoparticle modified carbon paper electrode for an electrocatalytic oxidation nitrite sensor. New J. Chem. 2016, 40, 3635–3641. [Google Scholar] [CrossRef]
- Jiang, J.J.; Fan, W.J.; Du, X.Z. Nitrite electrochemical biosensing based on coupled graphene and gold nanoparticles. Biosens. Bioelectron. 2014, 51, 343–348. [Google Scholar] [CrossRef] [PubMed]
- Li, S.-J.; Zhao, G.-Y.; Zhang, R.-X.; Hou, Y.-L.; Liu, L.; Pang, H. A sensitive and selective nitrite sensor based on a glassy carbon electrode modified with gold nanoparticles and sulfonated graphene. Microchim. Acta 2013, 180, 821–827. [Google Scholar] [CrossRef]
- Zhou, N.; Li, C.Y.; Mo, R.J.; Zhang, P.; He, L.; Nie, F.H.; Su, W.M.; Liu, S.C.; Gao, J.; Shao, H.Y.; et al. A graphene/enzyme-based electrochemical sensor for sensitive detection of organophosphorus pesticides. Surf. Rev. Lett. 2016, 23, 1550103. [Google Scholar] [CrossRef]
- Dai, Z.Q.; Lu, Q.F.; Quan, Q.G.; Mo, R.J.; Zhou, C.X.; Hong, P.Z.; Li, C.Y. Novel low temperature (<37 °C) chitosan hydrogel fabrication under the synergistic effect of graphene oxide. New J. Chem. 2017, 41, 671–676. [Google Scholar] [CrossRef]
- Ye, D.X.; Luo, L.Q.; Ding, Y.P.; Chen, Q.; Liu, X. A novel nitrite sensor based on graphene/polypyrrole/chitosan nanocomposite modified glassy carbon electrode. Analyst 2011, 136, 4563–4569. [Google Scholar] [CrossRef] [PubMed]
- Lin, A.-J.; Wen, Y.; Zhang, L.-J.; Lu, B.; Li, Y.; Jiao, Y.-Z.; Yang, H.-F. Layer-by-layer construction of multi-walled carbon nanotubes, zinc oxide, and gold nanoparticles integrated composite electrode for nitrite detection. Electrochim. Acta 2011, 56, 1030–1036. [Google Scholar] [CrossRef]
- Haldorai, Y.; Kim, J.Y.; Vilian, A.T.E.; Heo, N.S.; Huh, Y.S.; Han, Y.K. An enzyme-free electrochemical sensor based on reduced graphene oxide/Co3O4 nanospindle composite for sensitive detection of nitrite. Sens. Actuators B-Chem. 2016, 227, 92–99. [Google Scholar] [CrossRef]
- Afkhami, A.; Soltani-Felehgari, F.; Madrakian, T.; Ghaedi, H. Surface decoration of multi-walled carbon nanotubes modified carbon paste electrode with gold nanoparticles for electro-oxidation and sensitive determination of nitrite. Biosens. Bioelectron. 2014, 51, 379–385. [Google Scholar] [CrossRef] [PubMed]
- Liu, T.S.; Kang, T.F.; Lu, L.P.; Zhang, Y.; Cheng, S.Y. Au-Fe(III) nanoparticle modified glassy carbon electrode for electrochemical nitrite sensor. J. Electroanal. Chem. 2009, 632, 197–200. [Google Scholar] [CrossRef]
- Ghanei-Motlagh, M.; Taher, M.A. A novel electrochemical sensor based on silver/halloysite nanotube/molybdenum disulfide nanocomposite for efficient nitrite sensing. Biosens. Bioelectron. 2018, 109, 279–285. [Google Scholar] [CrossRef] [PubMed]
- Mani, V.; Periasamy, A.P.; Chen, S.M. Highly selective amperometric nitrite sensor based on chemically reduced graphene oxide modified electrode. Electrochem. Commun. 2012, 17, 75–78. [Google Scholar] [CrossRef]
- Zhang, D.; Fang, Y.X.; Miao, Z.Y.; Ma, M.; Du, X.; Takahashi, S.; Anzai, J.; Chen, Q. Direct electrodeposion of reduced graphene oxide and dendritic copper nanoclusters on glassy carbon electrode for electrochemical detection of nitrite. Electrochim. Acta 2013, 107, 656–663. [Google Scholar] [CrossRef]
- Ning, D.L.; Zhang, H.F.; Zheng, J.B. Electrochemical sensor for sensitive determination of nitrite based on the PAMAM dendrimer-stabilized silver nanoparticles. J. Electroanal. Chem. 2014, 717, 29–33. [Google Scholar] [CrossRef]
- Wang, Z.F.; Liao, F.; Guo, T.T.; Yang, S.W.; Zeng, C.M. Synthesis of crystalline silver nanoplates and their application for detection of nitrite in foods. J. Electroanal. Chem. 2012, 664, 135–138. [Google Scholar] [CrossRef]
- Ojani, R.; Raoof, J.B.; Zamani, S. A novel and simple electrochemical sensor for electrocatalytic reduction of nitrite and oxidation of phenylhydrazine based on poly (o-anisidine) film using ionic liquid carbon paste electrode. Appl. Surf. Sci. 2013, 271, 98–104. [Google Scholar] [CrossRef]


| Biosensors | Linear Range (μM) | Detection Limit (µM) | References |
|---|---|---|---|
| GO-CS-AuNPs/GCE | 0.9–18.9 | 0.3 | This study |
| Pd/RGO/GCE | 1–1000 | 0.23 | [22] |
| Ag/HNTs/MoS2-CPE | 2–425 | 0.7 | [33] |
| Hb/Au/GACS/GCE | 0.05–1000 | 0.01 | [24] |
| NGE/PdNC/GCE | 0.5–1510 | 0.11 | [2] |
| CR-GO/GCE | 8.9–167 | 1 | [34] |
| Co3O4/RGO/GCE | 1–380 | 0.14 | [30] |
| AgNP/GC | 10–1000 | 1.2 | [37] |
| GNPs/MWCPE | 0.05–250.0 | 0.01 | [31] |
| Cu-NDs/RGO/GCE | 1.25–13,000 | 0.4 | [35] |
| Ag-PAMAM nanocomposite/GCE | 4–1400 | 0.4 | [36] |
| Au-Fe(III) nanoparticle/GCE | 0.3–150 | 0.2 | [32] |
| poly(o-anisidine) ionic liquid carbon paste electrode | 2–50 | 1.05 | [38] |
© 2018 by the authors. Licensee MDPI, Basel, Switzerland. This article is an open access article distributed under the terms and conditions of the Creative Commons Attribution (CC BY) license (http://creativecommons.org/licenses/by/4.0/).
Share and Cite
Mo, R.; Wang, X.; Yuan, Q.; Yan, X.; Su, T.; Feng, Y.; Lv, L.; Zhou, C.; Hong, P.; Sun, S.; et al. Electrochemical Determination of Nitrite by Au Nanoparticle/Graphene-Chitosan Modified Electrode. Sensors 2018, 18, 1986. https://0-doi-org.brum.beds.ac.uk/10.3390/s18071986
Mo R, Wang X, Yuan Q, Yan X, Su T, Feng Y, Lv L, Zhou C, Hong P, Sun S, et al. Electrochemical Determination of Nitrite by Au Nanoparticle/Graphene-Chitosan Modified Electrode. Sensors. 2018; 18(7):1986. https://0-doi-org.brum.beds.ac.uk/10.3390/s18071986
Chicago/Turabian StyleMo, Rijian, Xuehua Wang, Qiong Yuan, Xiemin Yan, Tiantian Su, Yanting Feng, Lulu Lv, Chunxia Zhou, Pengzhi Hong, Shengli Sun, and et al. 2018. "Electrochemical Determination of Nitrite by Au Nanoparticle/Graphene-Chitosan Modified Electrode" Sensors 18, no. 7: 1986. https://0-doi-org.brum.beds.ac.uk/10.3390/s18071986