A Low-Cost, Stand-Alone Sensory Platform for Monitoring Extreme Solar Overirradiance Events

 ,
,
Abstract
:1. Introduction
2. Sensory Platform Architecture
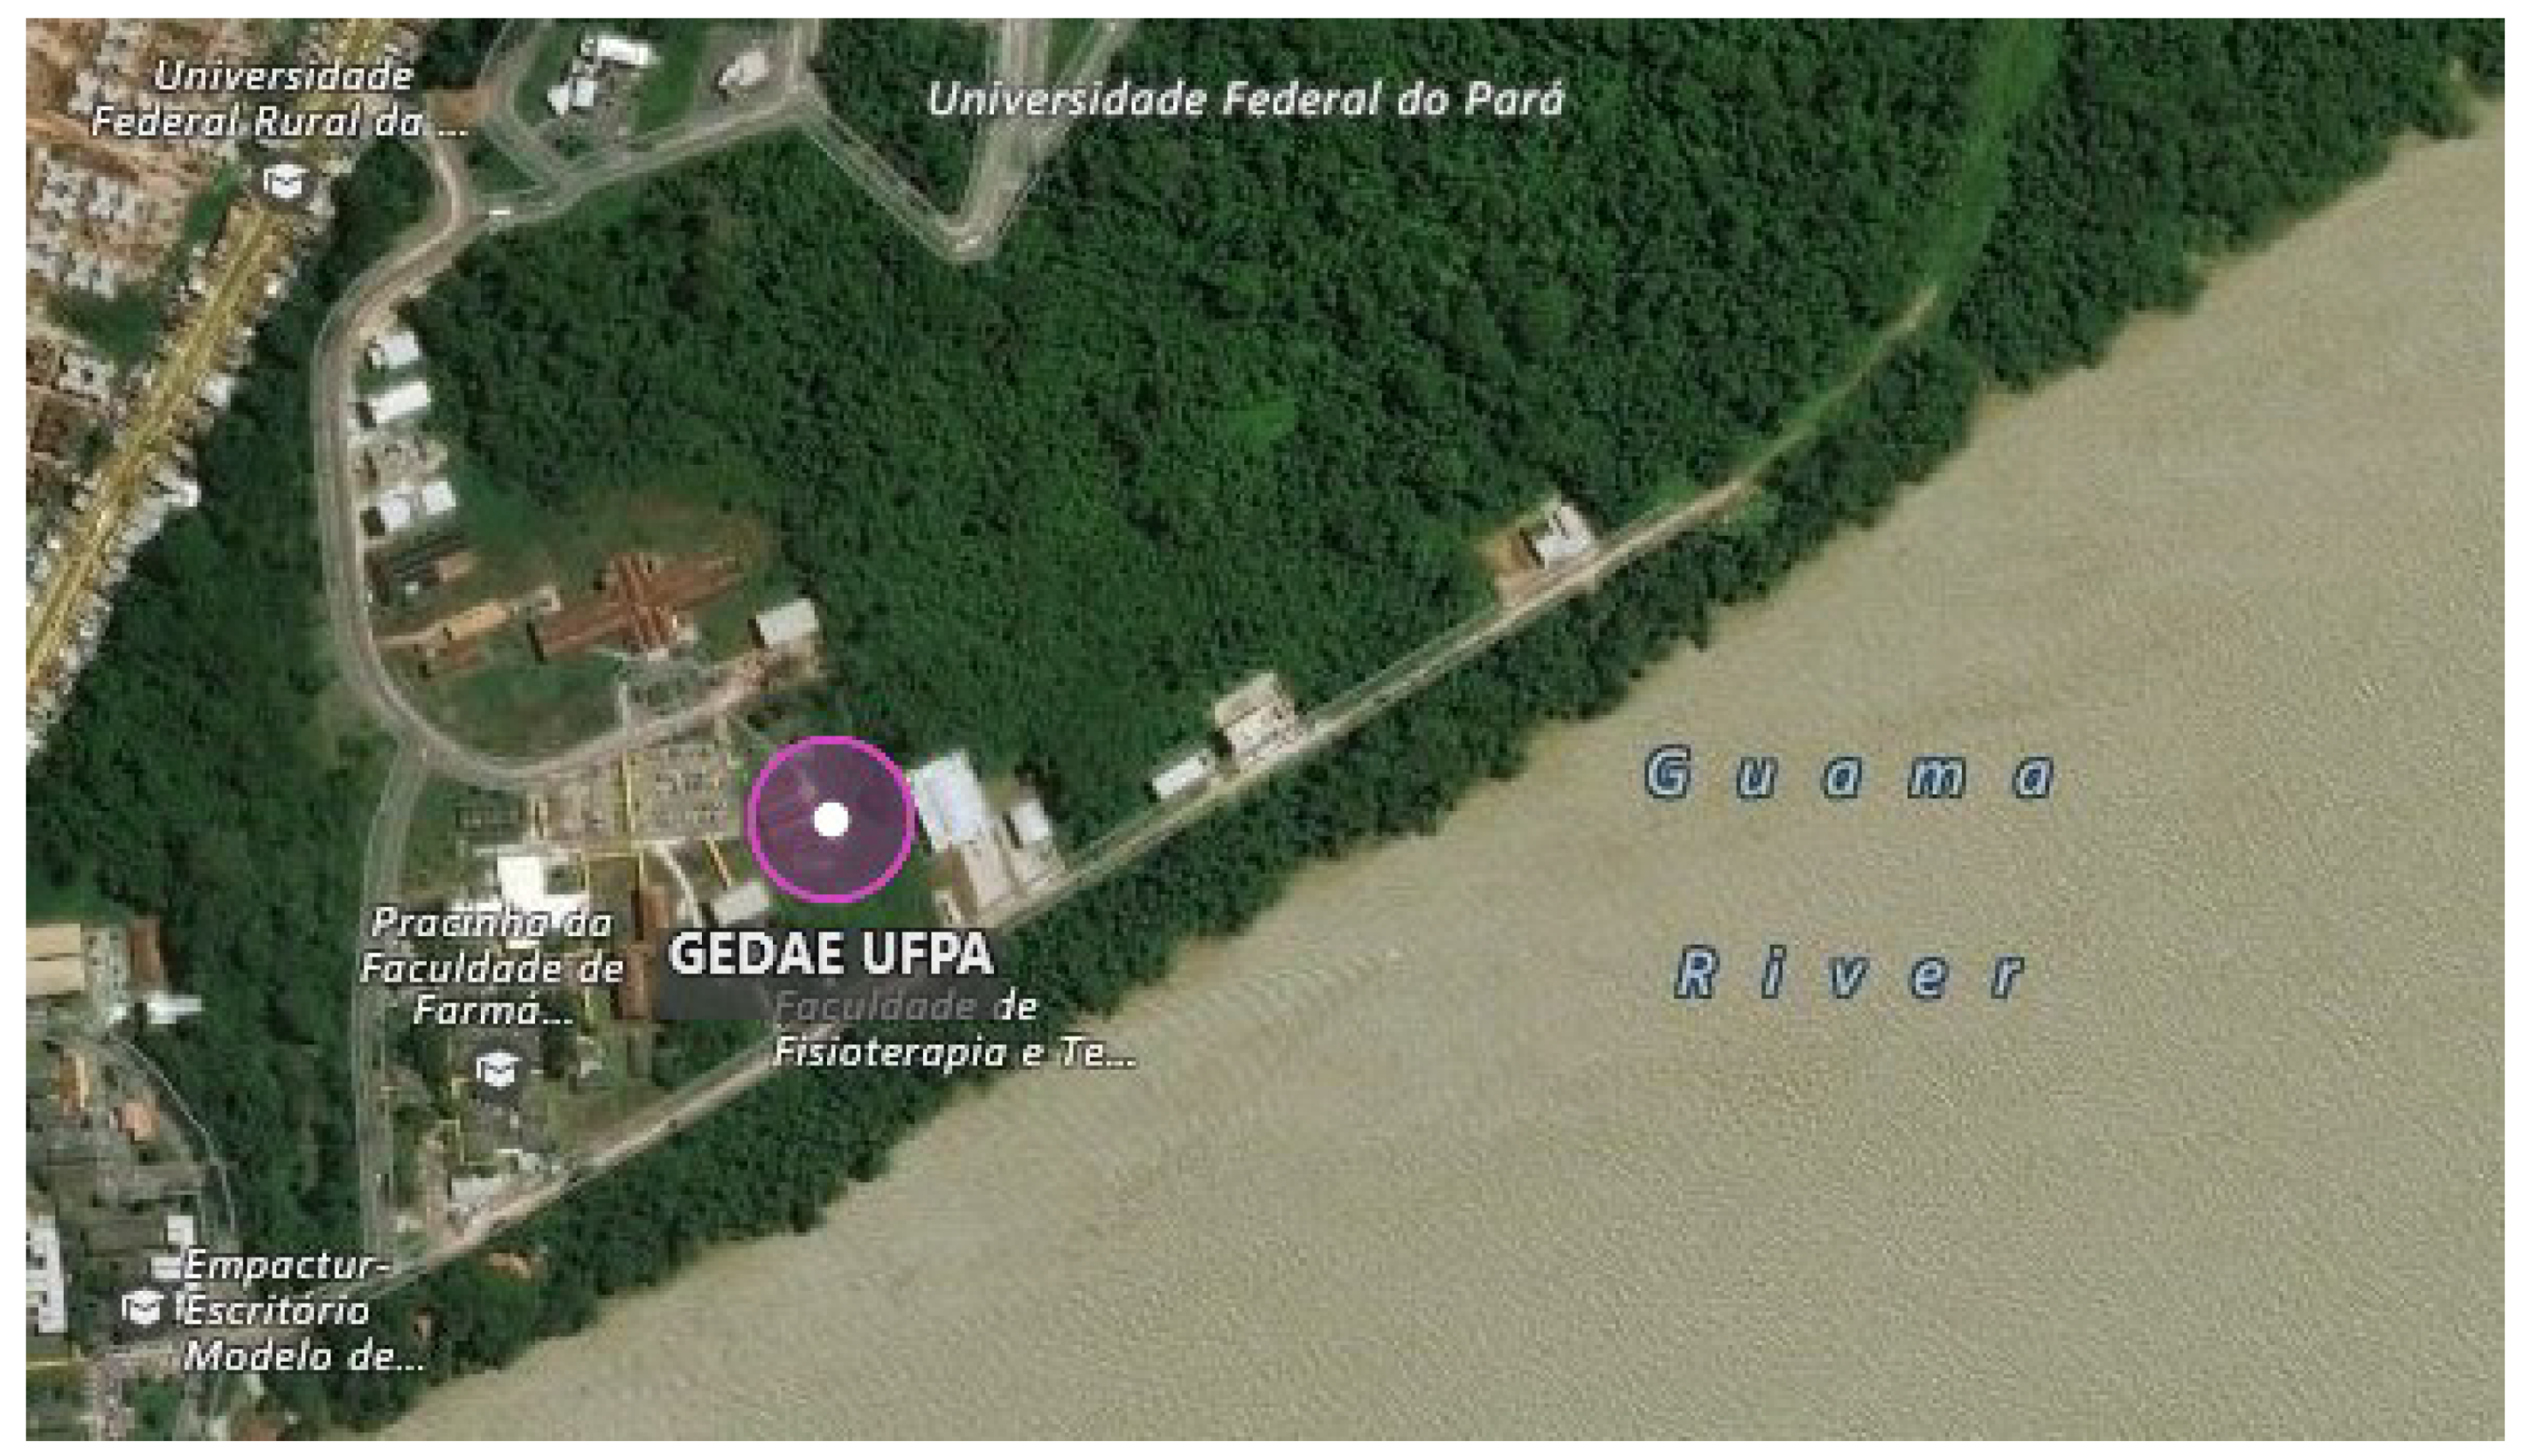
3. Test Site
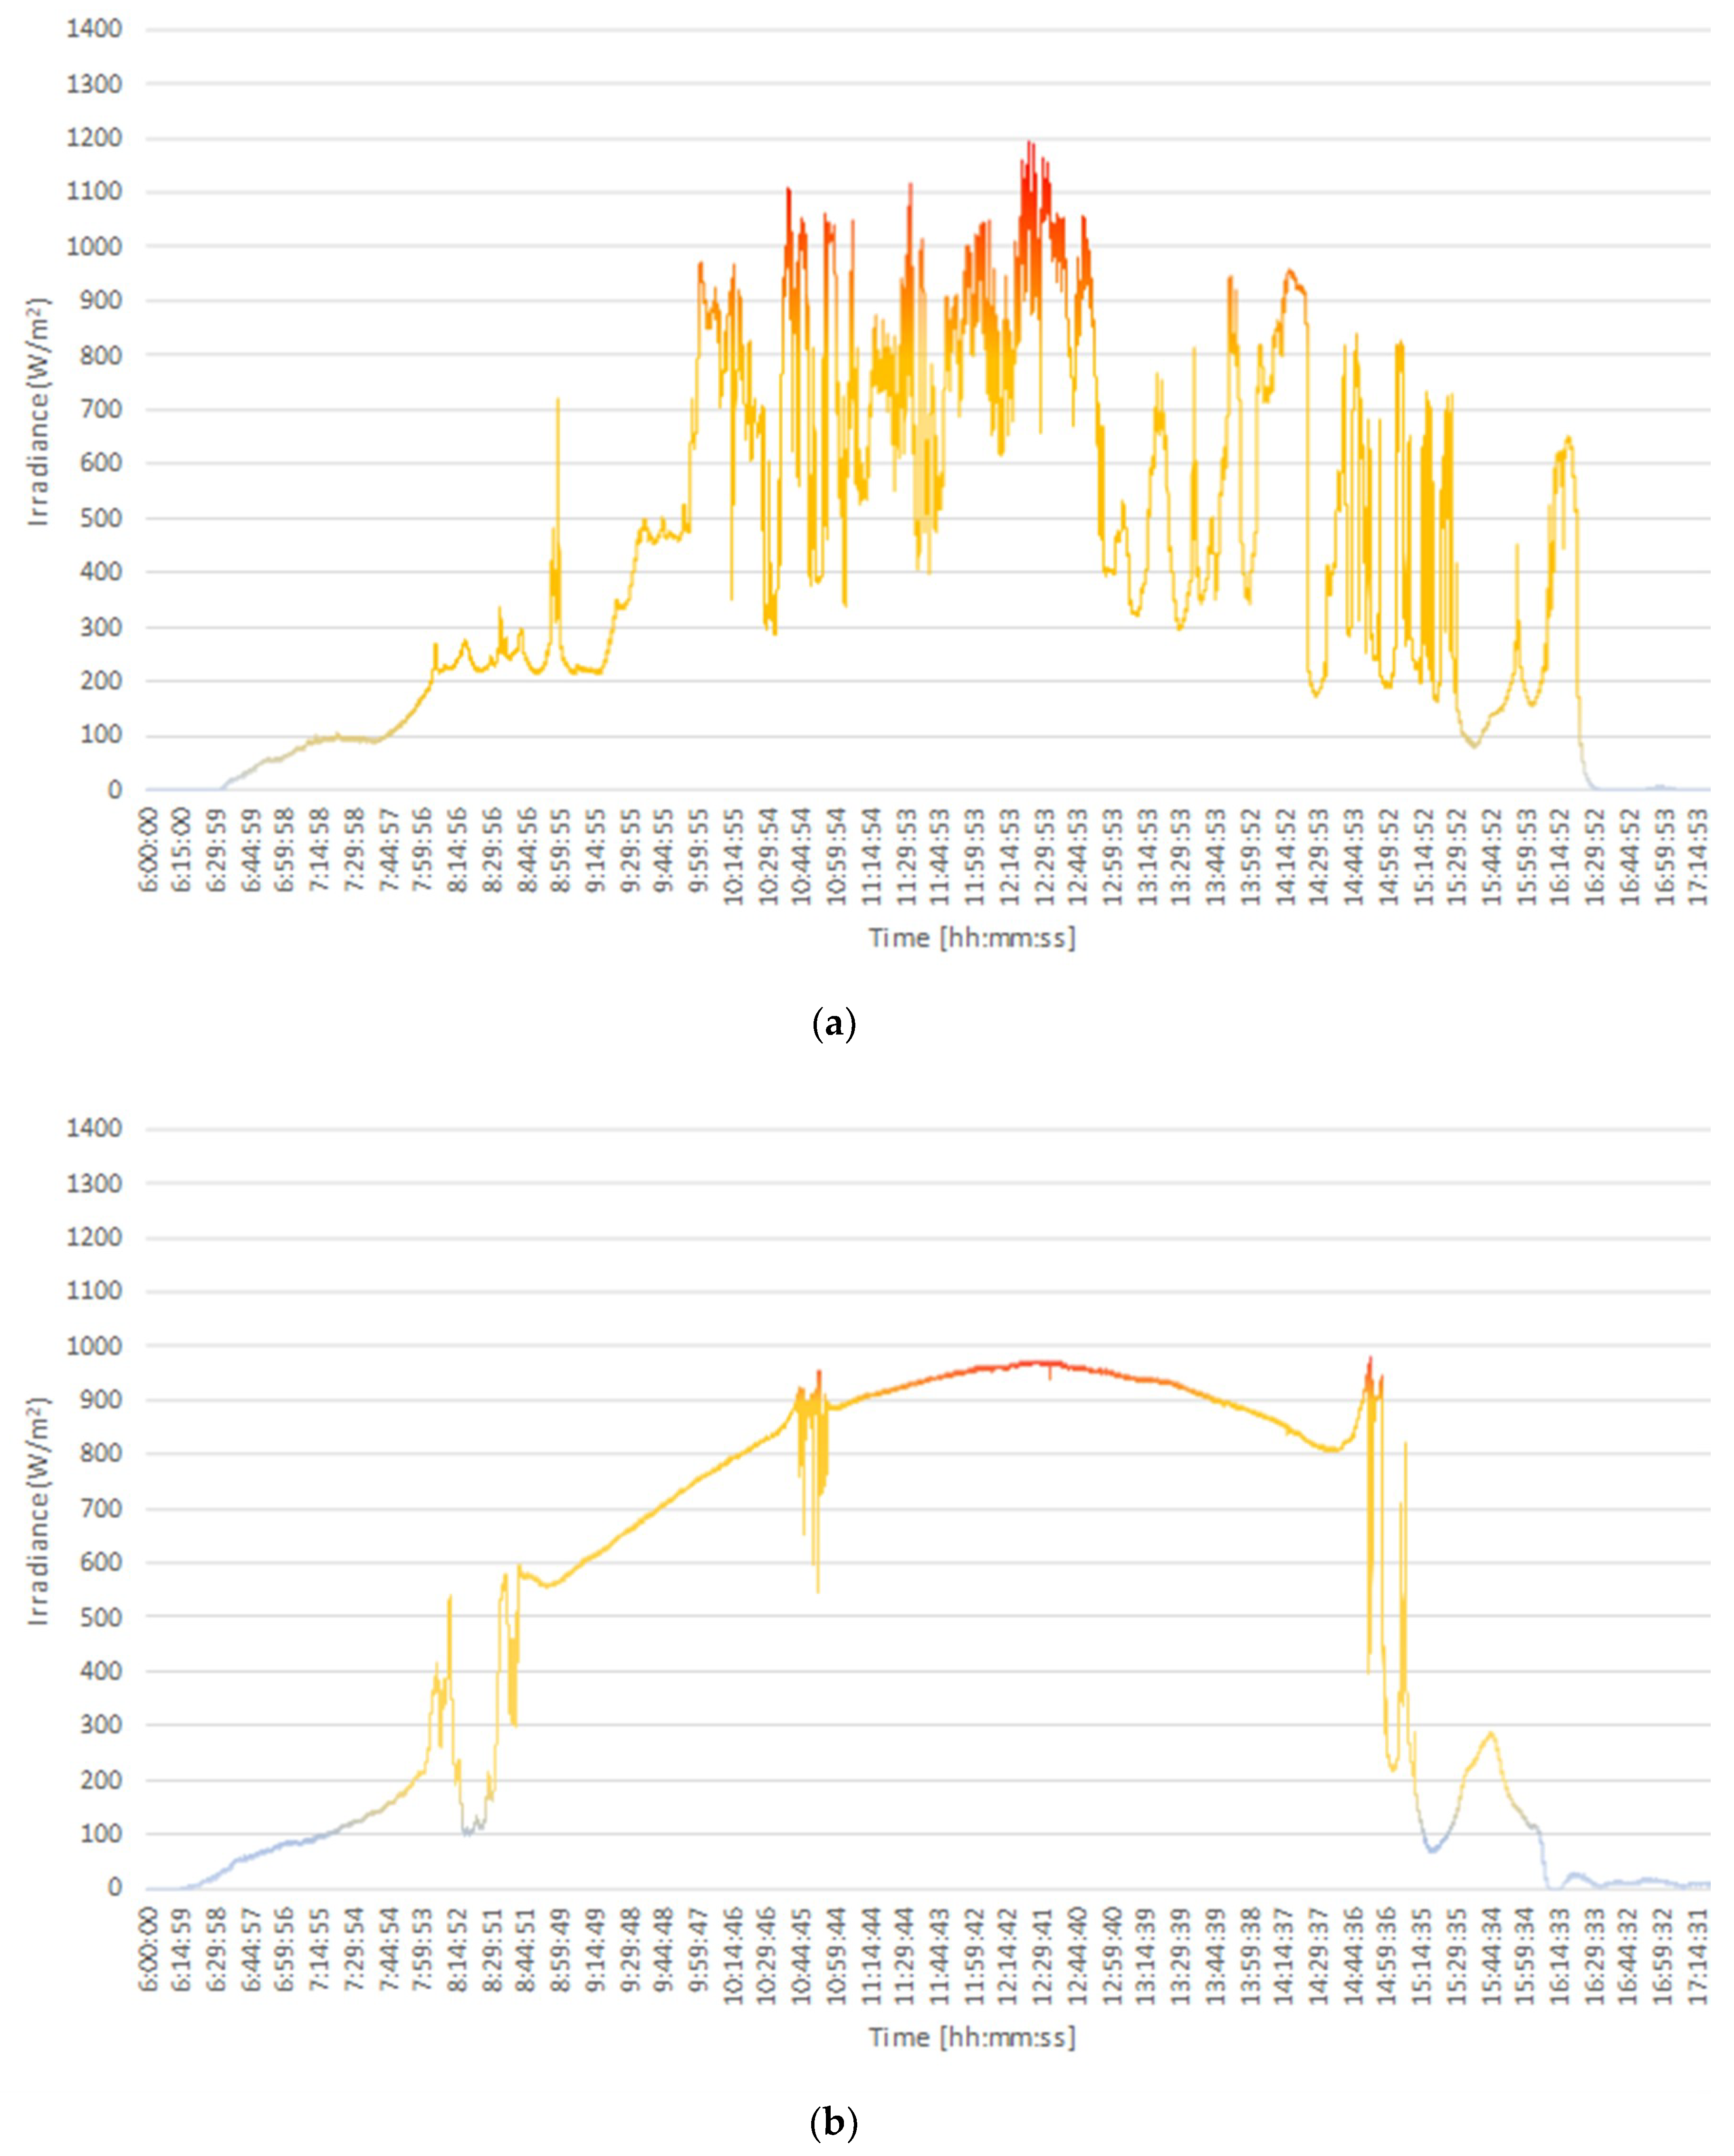
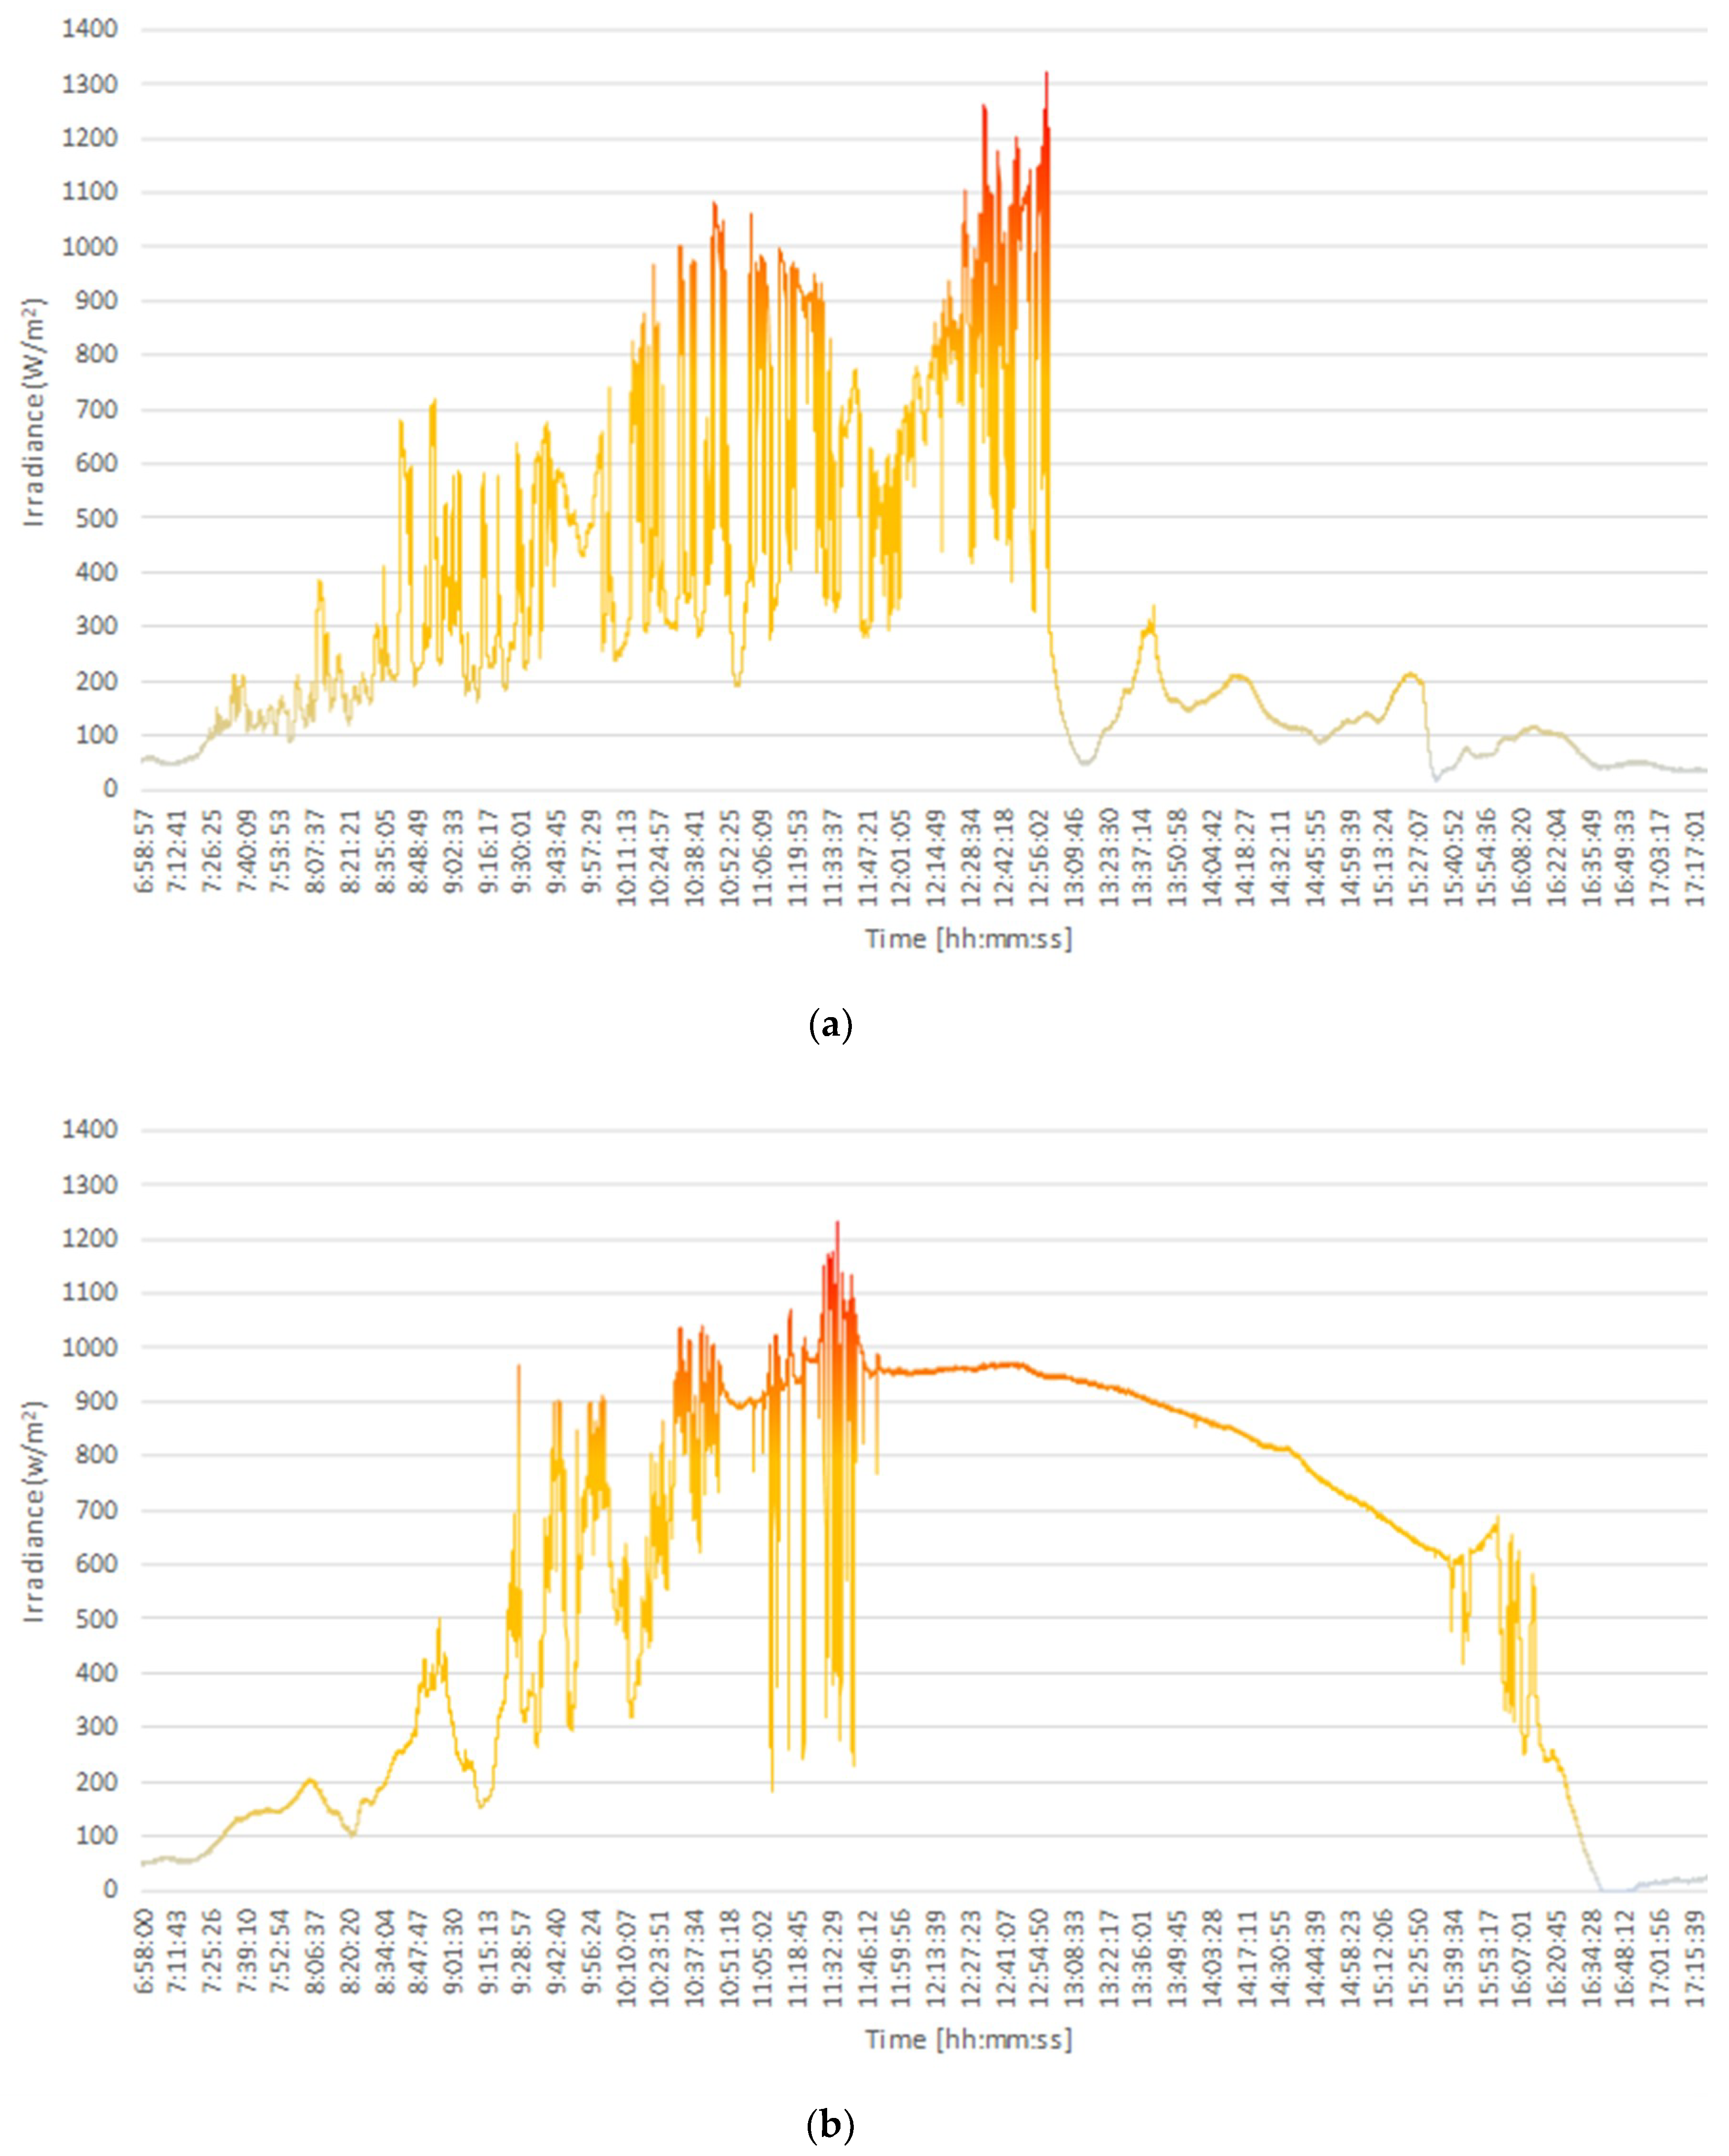
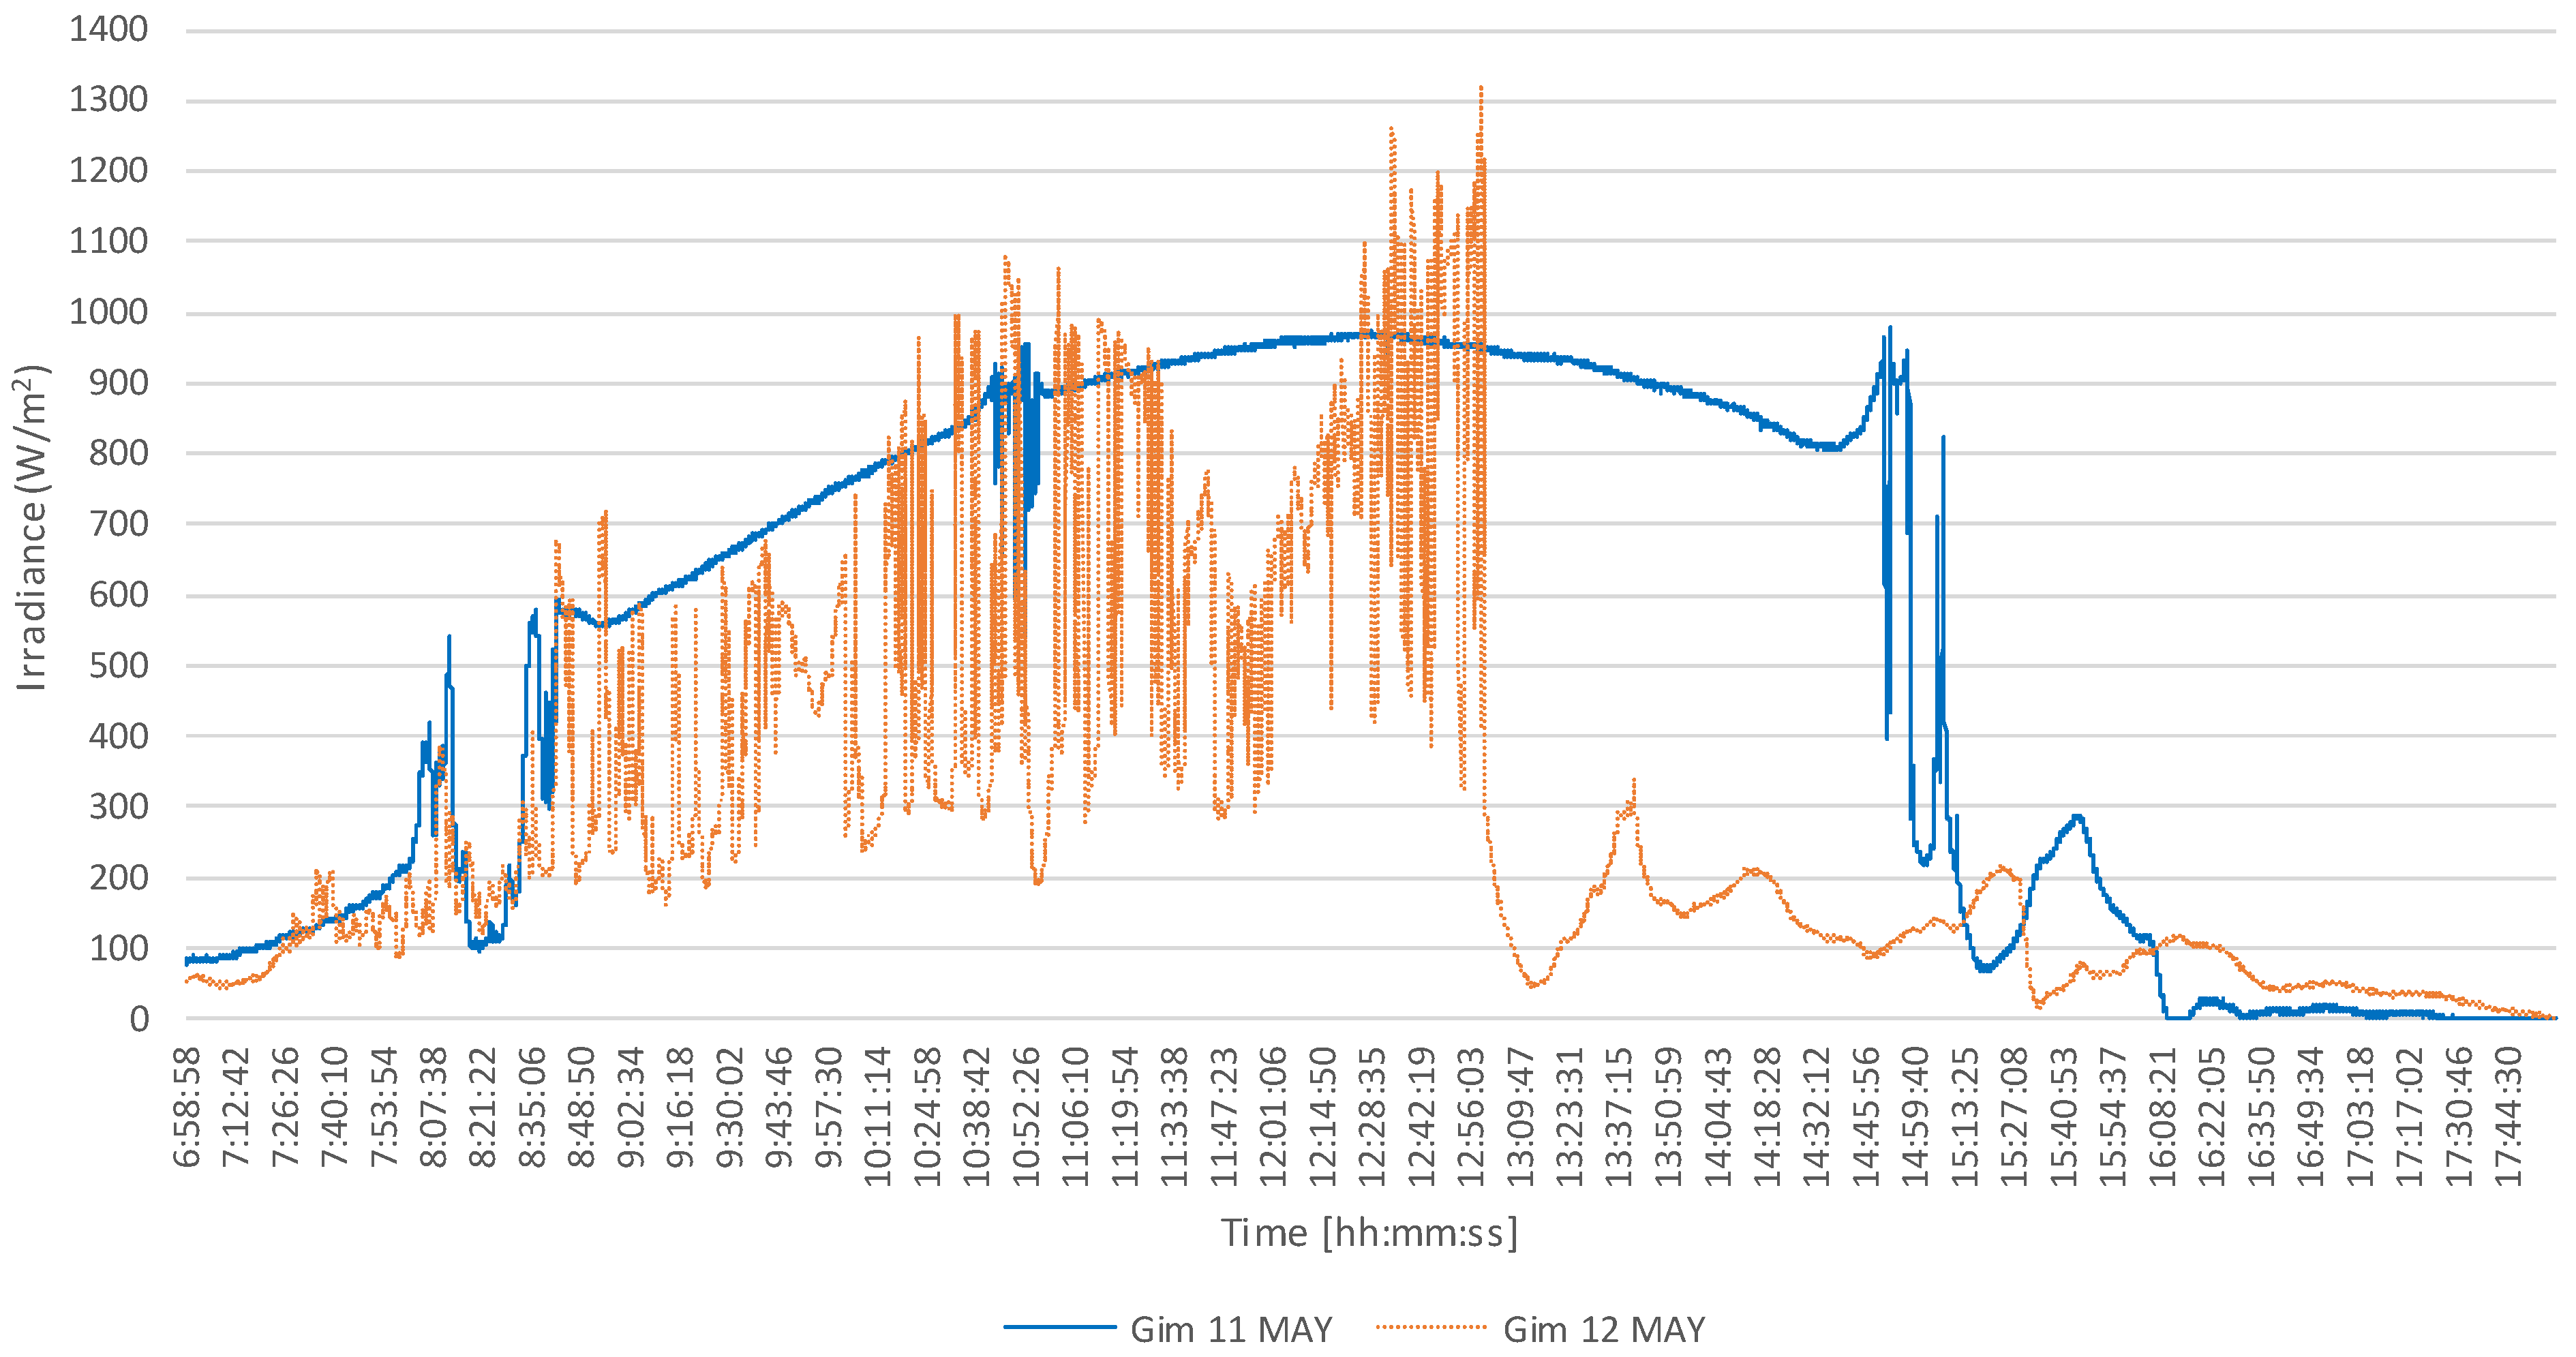
4. Results
5. Conclusions
Author Contributions
Funding
Acknowledgments
Conflicts of Interest
References
- Gueymard, C.A. Revised composite extraterrestrial spectrum based on recent solar irradiance observations. Sol. Energy 2018, 169, 434–440. [Google Scholar] [CrossRef]
- Yordanov, G.H.; Midtgård, O.M.; Saetre, T.O.; Nielsen, H.K.; Norum, L.E. Overirradiance (cloud enhancement) events at high latitudes. In Proceedings of the 2012 IEEE 38th Photovoltaic Specialists Conference (PVSC) PART 2, Austin, TX, USA, 3–8 June 2012; pp. 1–7. [Google Scholar]
- Piedehierro, A.A.; Antón, M.; Cazorla, A.; Alados-Arboledas, L.; Olmo, F.J. Evaluation of enhancement events of total solar irradiance during cloudy conditions at Granada (Southeastern Spain). Atmos. Res. 2014, 135–136, 1–7. [Google Scholar] [CrossRef]
- Luoma, J.; Kleissl, J.; Murray, K. Optimal inverter sizing considering cloud enhancement. Sol. Energy 2012, 86, 421–429. [Google Scholar] [CrossRef]
- Fontenele, L.F.; Inácio, C.O.; Gouveia, H.T.; Ferreira, P.H.F.; Araújo, R.G. O efeito lente E A sua influência na operação de uma usina fotovoltaica no nordeste brasileiro. In Proceedings of the XXIV SNPTEE, Curitiba-PR, Brazil, 22–25 October 2017. [Google Scholar]
- Yordanov, G.H.; Saetre, T.O.; Midtgård, O.M. 100-millisecond Resolution for Accurate Overirradiance Measurements. IEEE J. Photovolt. 2013, 3, 1354–1360. [Google Scholar] [CrossRef]
- Almeida, M.P.; Zilles, R.; Lorenzo, E. Extreme overirradiance events in São Paulo, Brazil. Sol. Energy 2014, 110, 168–173. [Google Scholar] [CrossRef] [Green Version]
- Yordanov, G.H.; Saetre, T.O.; Midtgård, O.-M. Extreme overirradiance events in Norway: 1.6 suns measured close to 60 °N. Sol. Energy 2015, 115, 68–73. [Google Scholar] [CrossRef]
- Emck, P.; Richter, M. An Upper Threshold of Enhanced Global Shortwave Irradiance in the Troposphere Derived from Field Measurements in Tropical Mountains. J. Appl. Meteorol. Climatol. 2008, 47, 2828–2845. [Google Scholar] [CrossRef]
- Shibata, N.; Inzunza, R.; Furukawa, M.; Tawada, Y.; Tanaka, T.; Sumiya, T.; Kinoshita, M. Performance validation of a photovoltaic inverter under enhanced cloud edge conditions. In Proceedings of the 2015 IEEE 2nd International Future Energy Electronics Conference (IFEEC), Taipei, Taiwan, 1–4 November 2015; pp. 1–5. [Google Scholar]
- Yordanov, G.H. A study of extreme overirradiance events for solar energy applications using NASA’s I3RC Monte Carlo radiative transfer model. Sol. Energy 2015, 122, 954–965. [Google Scholar] [CrossRef]
- Piacentini, R.D.; Salum, G.M.; Fraidenraich, N.; Tiba, C. Extreme total solar irradiance due to cloud enhancement at sea level of the NE Atlantic coast of Brazil. Renew. Energy 2011, 36, 409–412. [Google Scholar] [CrossRef]
- Gu, L.; Fuentes, J.D.; Garstang, M.; da Silva, J.T.; Heitz, R.; Sigler, J.; Shugart, H.H. Cloud modulation of surface solar irradiance at a pasture site in southern Brazil. Agric. For. Meteorol. 2001, 106, 117–129. [Google Scholar] [CrossRef]
- Chase, O.A.; Sousa de Almeida, J.F.; Brito de Souza, J.R.; Tavares da Costa Junior, C. Sensory platform architecture for IN SITU monitoring the thermal comfort in rural environments–The case study at Federal Rural University of Amazonian, Brazil. Measurement 2014, 58, 294–300. [Google Scholar] [CrossRef]
- Parra, L.; Sendra, S.; García, L.; Lloret, J. Design and Deployment of Low-Cost Sensors for Monitoring the Water Quality and Fish Behavior in Aquaculture Tanks during the Feeding Process. Sensors 2018, 18, 750. [Google Scholar] [CrossRef] [PubMed]
- Genikomsakis, K.N.; Galatoulas, N.-F.; Dallas, P.I.; Ibarra, L.M.C.; Margaritis, D.; Ioakimidis, C.S. Development and On-Field Testing of Low-Cost Portable System for Monitoring PM2.5 Concentrations. Sensors 2018, 18, 1056. [Google Scholar] [CrossRef] [PubMed]
- Gubbi, J.; Buyya, R.; Marusic, S.; Palaniswami, M. Internet of Things (IoT): A vision, architectural elements, and future directions. Future Gener. Comput. Syst. 2013, 29, 1645–1660. [Google Scholar] [CrossRef] [Green Version]
- Chalasani, S.; Conrad, J.M. A survey of energy harvesting sources for embedded systems. In Proceedings of the IEEE SoutheastCon 2008, Huntsville, AL, USA, 3–6 April 2008; pp. 442–447. [Google Scholar]
- Schwartz, M. Internet of Things with ESP8266; Packt Publishing: Birmingham, UK, 2016; ISBN 978-1-78646-802-4. [Google Scholar]
- SEEED. 3W Solar Panel 138*160-Wiki. Available online: http://wiki.seeedstudio.com/3W_Solar_Panel_138x160/ (accessed on 26 April 2016).
- SAMSUNG Samsung ICR18650-22E Specifications. Available online: http://www.meircell.co.il/files/Samsung%20ICR18650-22E.pdf (accessed on 29 September 2017).
- HOTMCU TP4056-Micro USB 5V 1A Lithium Battery Charger with Protection. Available online: https://www.hotmcu.com/tp4056-micro-usb-5v-1a-lithium-battery-charger-with-protection-p-176.html (accessed on 23 May 2018).
- ADAFRUIT INA219 Current Sensor Breakout. Available online: https://learn.adafruit.com/adafruit-ina219-current-sensor-breakout/overview (accessed on 30 June 2017).
- BANGGOOD Online Shopping for Cool Gadgets, RC Quadcopter, 3D Printer at Banggood. Available online: https://www.banggood.com/ (accessed on 7 June 2018).
- MAXIM DS3231 Extremely Accurate I2C-Integrated RTC/TCXO/Crystal-Maxim. Available online: https://www.maximintegrated.com/en/products/digital/real-time-clocks/DS3231.html (accessed on 23 May 2018).
- BOSCH BMP180. Available online: https://www.bosch-sensortec.com/bst/products/all_products/bmp180 (accessed on 22 November 2017).
- SEEED, 0.5W Solar Panel 55x70-Power Supply-Seeed Studio. Available online: https://www.seeedstudio.com/0.5W-Solar-Panel-55x70-p-632.html (accessed on 29 June 2017).
- Messenger, R.A.; Abtahi, A. Photovoltaic Systems Engineering, 3rd ed.; CRC Press: Boca Raton, FL, USA, 2010; ISBN 978-1-4398-0292-2. [Google Scholar]
- IKS ISET Solar radiation sensor. Available online: http://www.iks-photovoltaik.de/en/measurement/iset-sensor/overview/ (accessed on 23 May 2018).
- FLUKE Fluke 435 Series II Power Quality and Energy Analyzer. Available online: http://www.fluke.com/fluke/m2en/power-quality-tools/logging-power-meters/fluke-435-series-ii.htm?pid=73939 (accessed on 23 May 2018).
- Alvares, C.A.; Stape, J.L.; Sentelhas, P.C.; de Moraes Gonçalves, J.L.; Sparovek, G. Köppen’s climate classification map for Brazil. Meteorol. Z. 2013, 711–728. [Google Scholar] [CrossRef]
- Pinho, J.T.; Galdino, M.A. Maunal de Engenharia para Sistemas Fotovoltaicos; Cresesb-Centro de Referência para Energia Solar e Eólica Sérgio de Salvo Brito: Rio de Janeiro, Brazil, 2014; ISBN 978-85-99714-10-2. [Google Scholar]
- Weather Spark Average Weather in Belém, Brazil, Year Round-Weather Spark. Available online: https://weatherspark.com/y/30136/Average-Weather-in-Belém-Brazil-Year-Round (accessed on 23 May 2018).


| References (Year) | Maximum Irradiance (W/m2) | Location (Latitude and Altitude above Sea Level) | Instrument of Measurement and Orientation | Resolution of Measurements (s) | Response Time of Instrument, 95% of Final Value (s) |
|---|---|---|---|---|---|
| Emck and Ritcher [9] (2008) | 1832 W/m2 | Ecuador (Andes), 4 °S, 3400 m. | Thermopile pyranometer (CM3) with datalogger (Kipp & Zonen), horizontal. | 300 | ≤18 |
| Yordanov et al. [8] (2015) | 1600 W/m2 | Norway (Grimstad), 58 °N, 60 m. | Photovoltaic cell mc-Si (Soldata 80spc) with digital data unit (Soldata kit), tilted 39° from horizontal. | 10−2 | ≤0.025 * |
| Almeida et al. [7] (2014) | 1590 W/m2 | Brazil (São Paulo), 23 °S, 760 m. | Poly c-Si Photovoltaic module (MSX-10) with energy analyzer (Agilent), horizontal. | 1 | ≤10−5 |
| Present paper | 1321 W/m2 | Brazil (Belém-PA), 1 °S, 7 m. | Mono c-Si Photovoltaic Module (SEEED) with the sensory platform (low-cost), tilted 10° from horizontal. | 1 | ≤10−5 |
| Luoma et al. [4] (2012) | 1300 W/m2 | United States (San Diego), 32 °N, 22 m. | Photodiode pyranometer (LICOR LI-200) with datalogger (Kipp & Zonen), horizontal. | 1 | ≤10−5 |
| Piedehierro et al. [3] (2014) | 1244 W/m2 | Spain (Granada), 32 °N, 680 m. | Thermopile pyranometer (CM-11) with datalogger (Kipp & Zonen), horizontal. | 60 | ≤15 |
| Device | Unit Cost (€) 1 | Quantity | Total (€) |
|---|---|---|---|
| BMP280 | 6.67 | 1 | 6.67 |
| RTC DS3231 | 2.85 | 1 | 2.85 |
| SD module R/W | 2.24 | 1 | 2.24 |
| SD card (2 GB) | 2.91 | 1 | 2.91 |
| INA219 | 6.04 | 3 | 18.12 |
| TP4056 | 2.21 | 1 | 2.21 |
| Li-ion battery (ICR18650, 2200 mAh) | 5.06 | 3 | 15.2 |
| Photovoltaic module (mono c-Si, 0.5 Wp) | 2.14 | 1 | 2.14 |
| Photovoltaic module (mono c-Si, 3 Wp) | 4.48 | 1 | 4.48 |
| ESP8266 (NodeMCU) | 8.69 | 1 | 8.69 |
| Plastic case (IP67) | 3.80 | 1 | 3.80 |
| Total (€) | 69.31 | ||
© 2018 by the authors. Licensee MDPI, Basel, Switzerland. This article is an open access article distributed under the terms and conditions of the Creative Commons Attribution (CC BY) license (http://creativecommons.org/licenses/by/4.0/).
Share and Cite
Chase, O.A.; Teles, M.B.; De Jesus dos Santos Rodrigues, M.; De Almeida, J.F.S.; Macêdo, W.N.; Da Costa Junior, C.T. A Low-Cost, Stand-Alone Sensory Platform for Monitoring Extreme Solar Overirradiance Events. Sensors 2018, 18, 2685. https://0-doi-org.brum.beds.ac.uk/10.3390/s18082685
Chase OA, Teles MB, De Jesus dos Santos Rodrigues M, De Almeida JFS, Macêdo WN, Da Costa Junior CT. A Low-Cost, Stand-Alone Sensory Platform for Monitoring Extreme Solar Overirradiance Events. Sensors. 2018; 18(8):2685. https://0-doi-org.brum.beds.ac.uk/10.3390/s18082685
Chicago/Turabian StyleChase, Otavio Andre, Mailson Borges Teles, Marinaldo De Jesus dos Santos Rodrigues, José Felipe Souza De Almeida, Wilson Negrão Macêdo, and Carlos Tavares Da Costa Junior. 2018. "A Low-Cost, Stand-Alone Sensory Platform for Monitoring Extreme Solar Overirradiance Events" Sensors 18, no. 8: 2685. https://0-doi-org.brum.beds.ac.uk/10.3390/s18082685