Loosening Monitoring of a Threaded Pipe Connection Using the Electro-Mechanical Impedance Technique—Experimental and Numerical Studies

Abstract
:1. Introduction
- (1)
- Investigation of the relationship between the contact area of the screwed interface and the electrical impedance signature of the lead zirconate titanate (PZT) patch bonded on the pipe coupling.
- (2)
- Numerical simulations of loosening monitoring for the threaded pipe connection using the developed EMI-based approach.
- (3)
- Quantitative evaluation of the connection loosening severity based on both experimental and numerical results.
2. Detection Principle
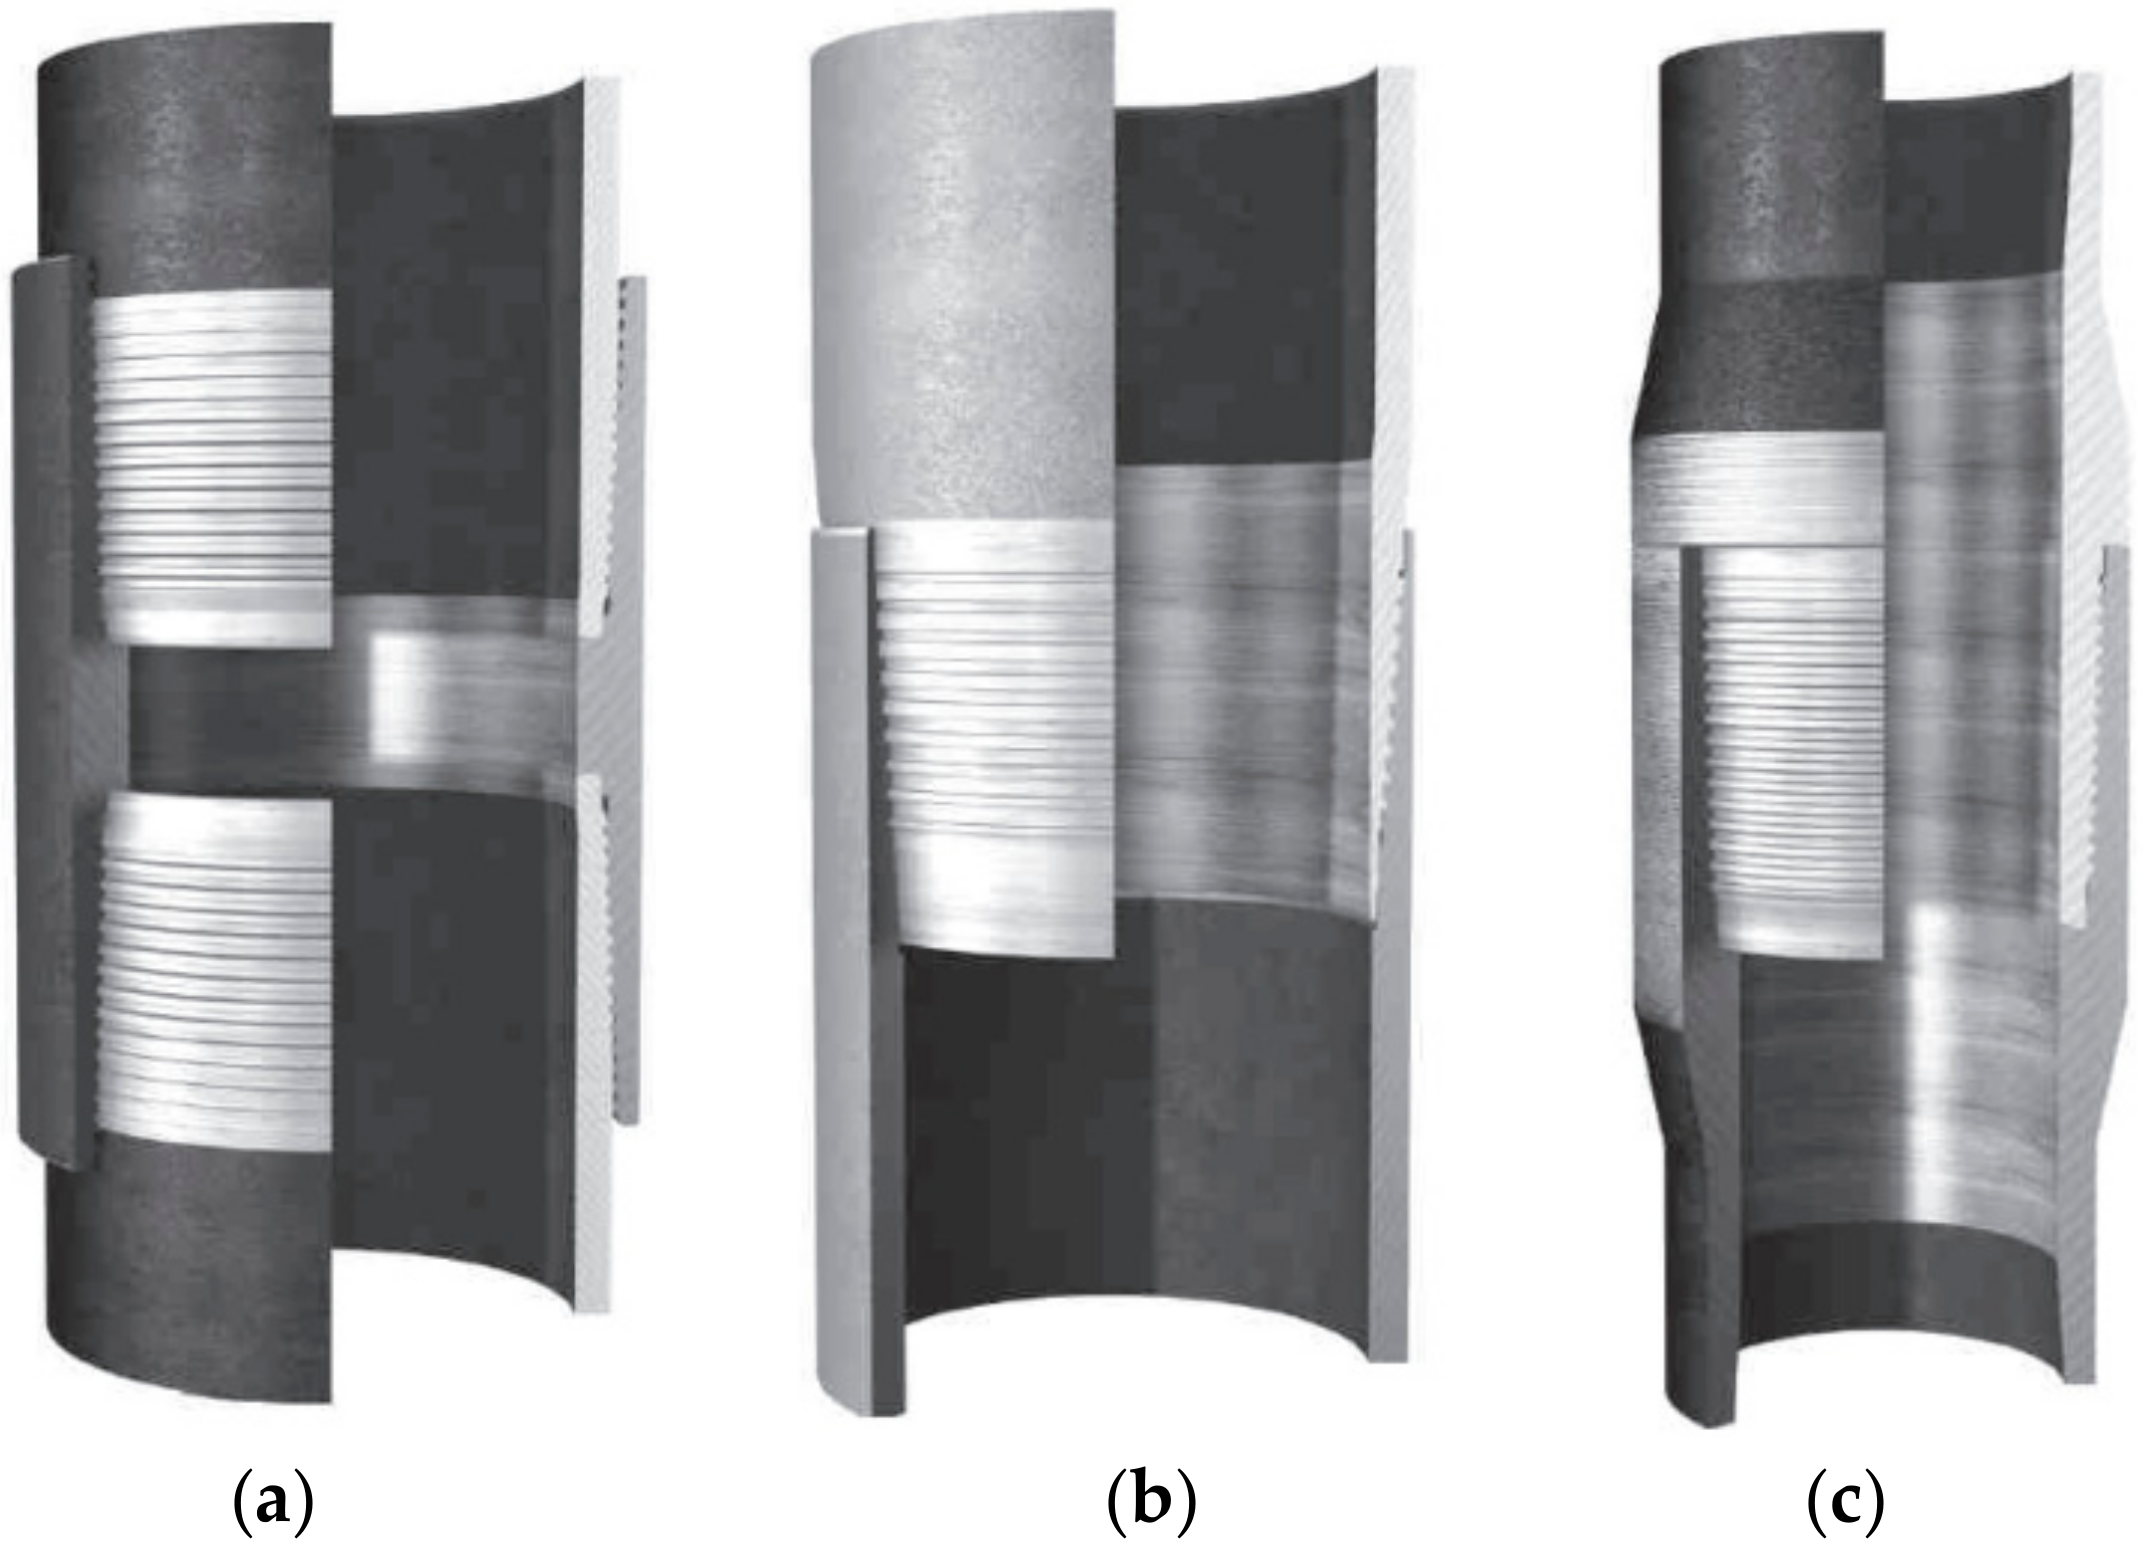
2.1. Threaded Pipe Connections
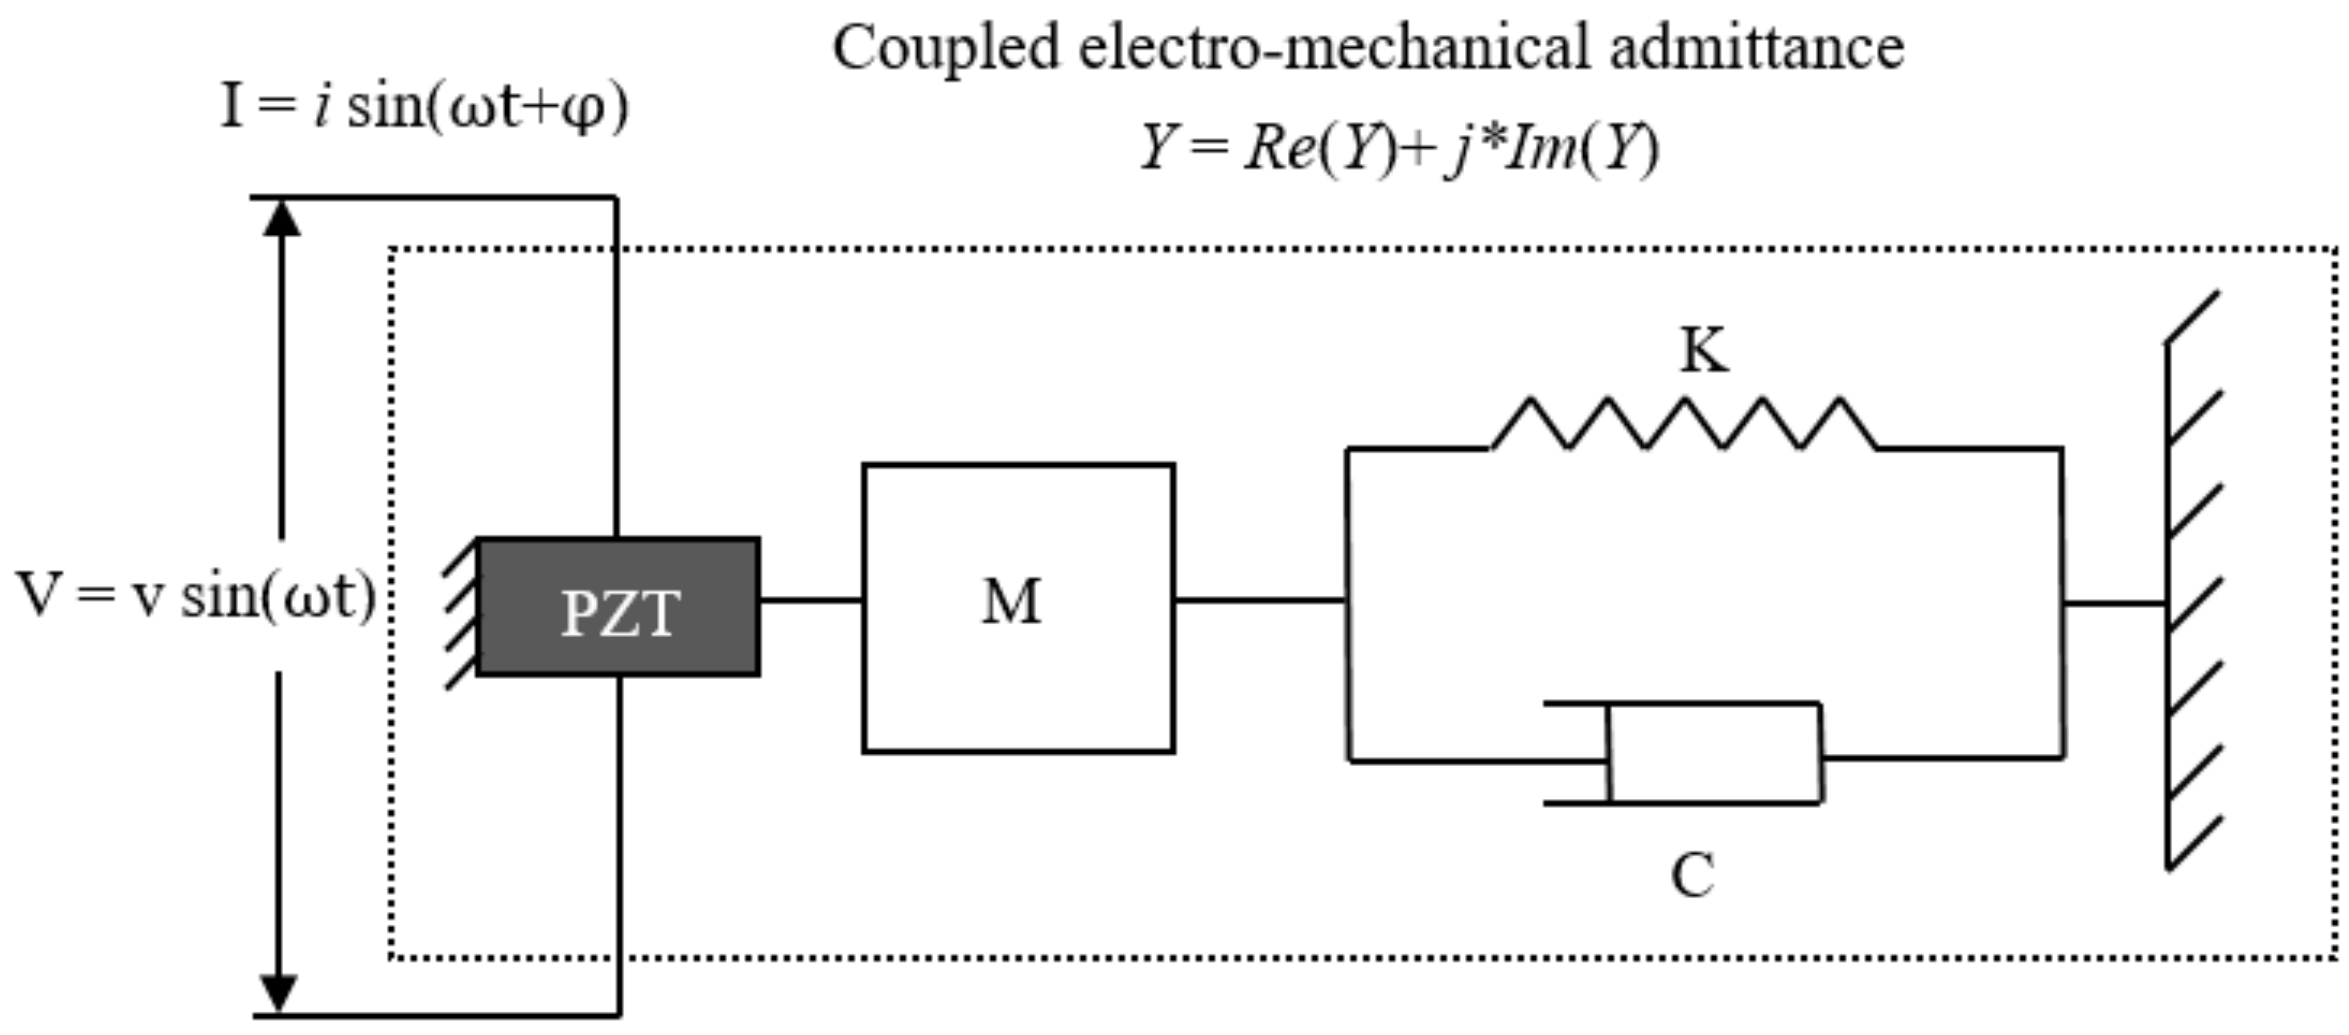
2.2. The Electro-Mechanical Impedance Technique
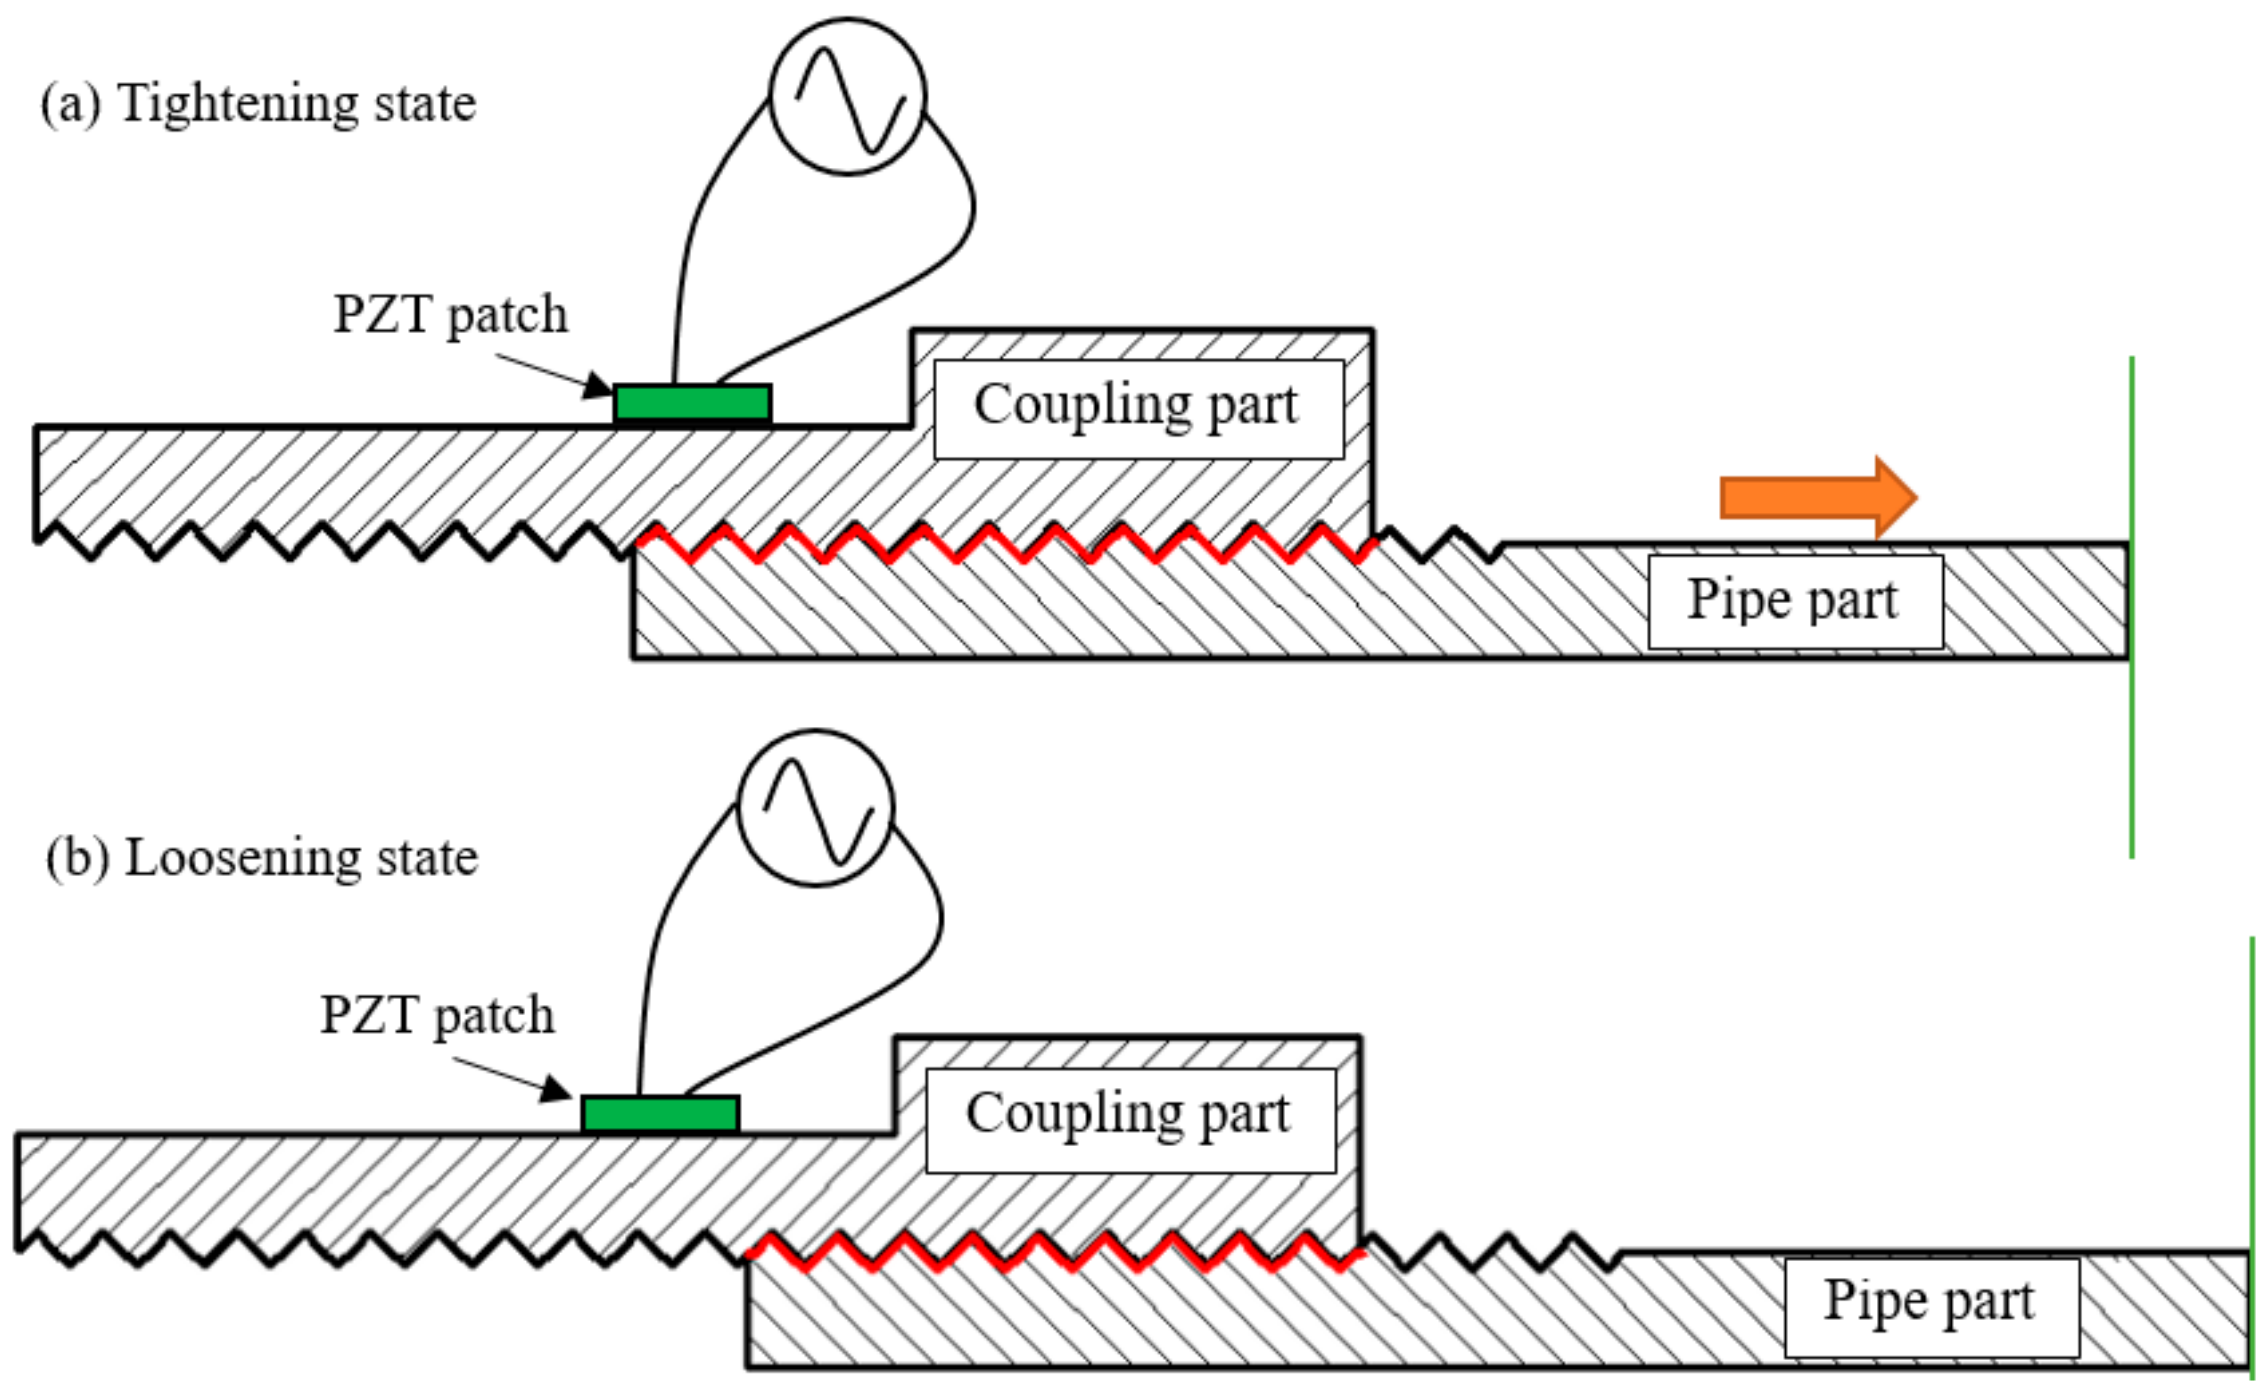
2.3. Loosening Monitoring for a Threaded Pipe Connection Using the EMI Technique
3. Experimental Investigation
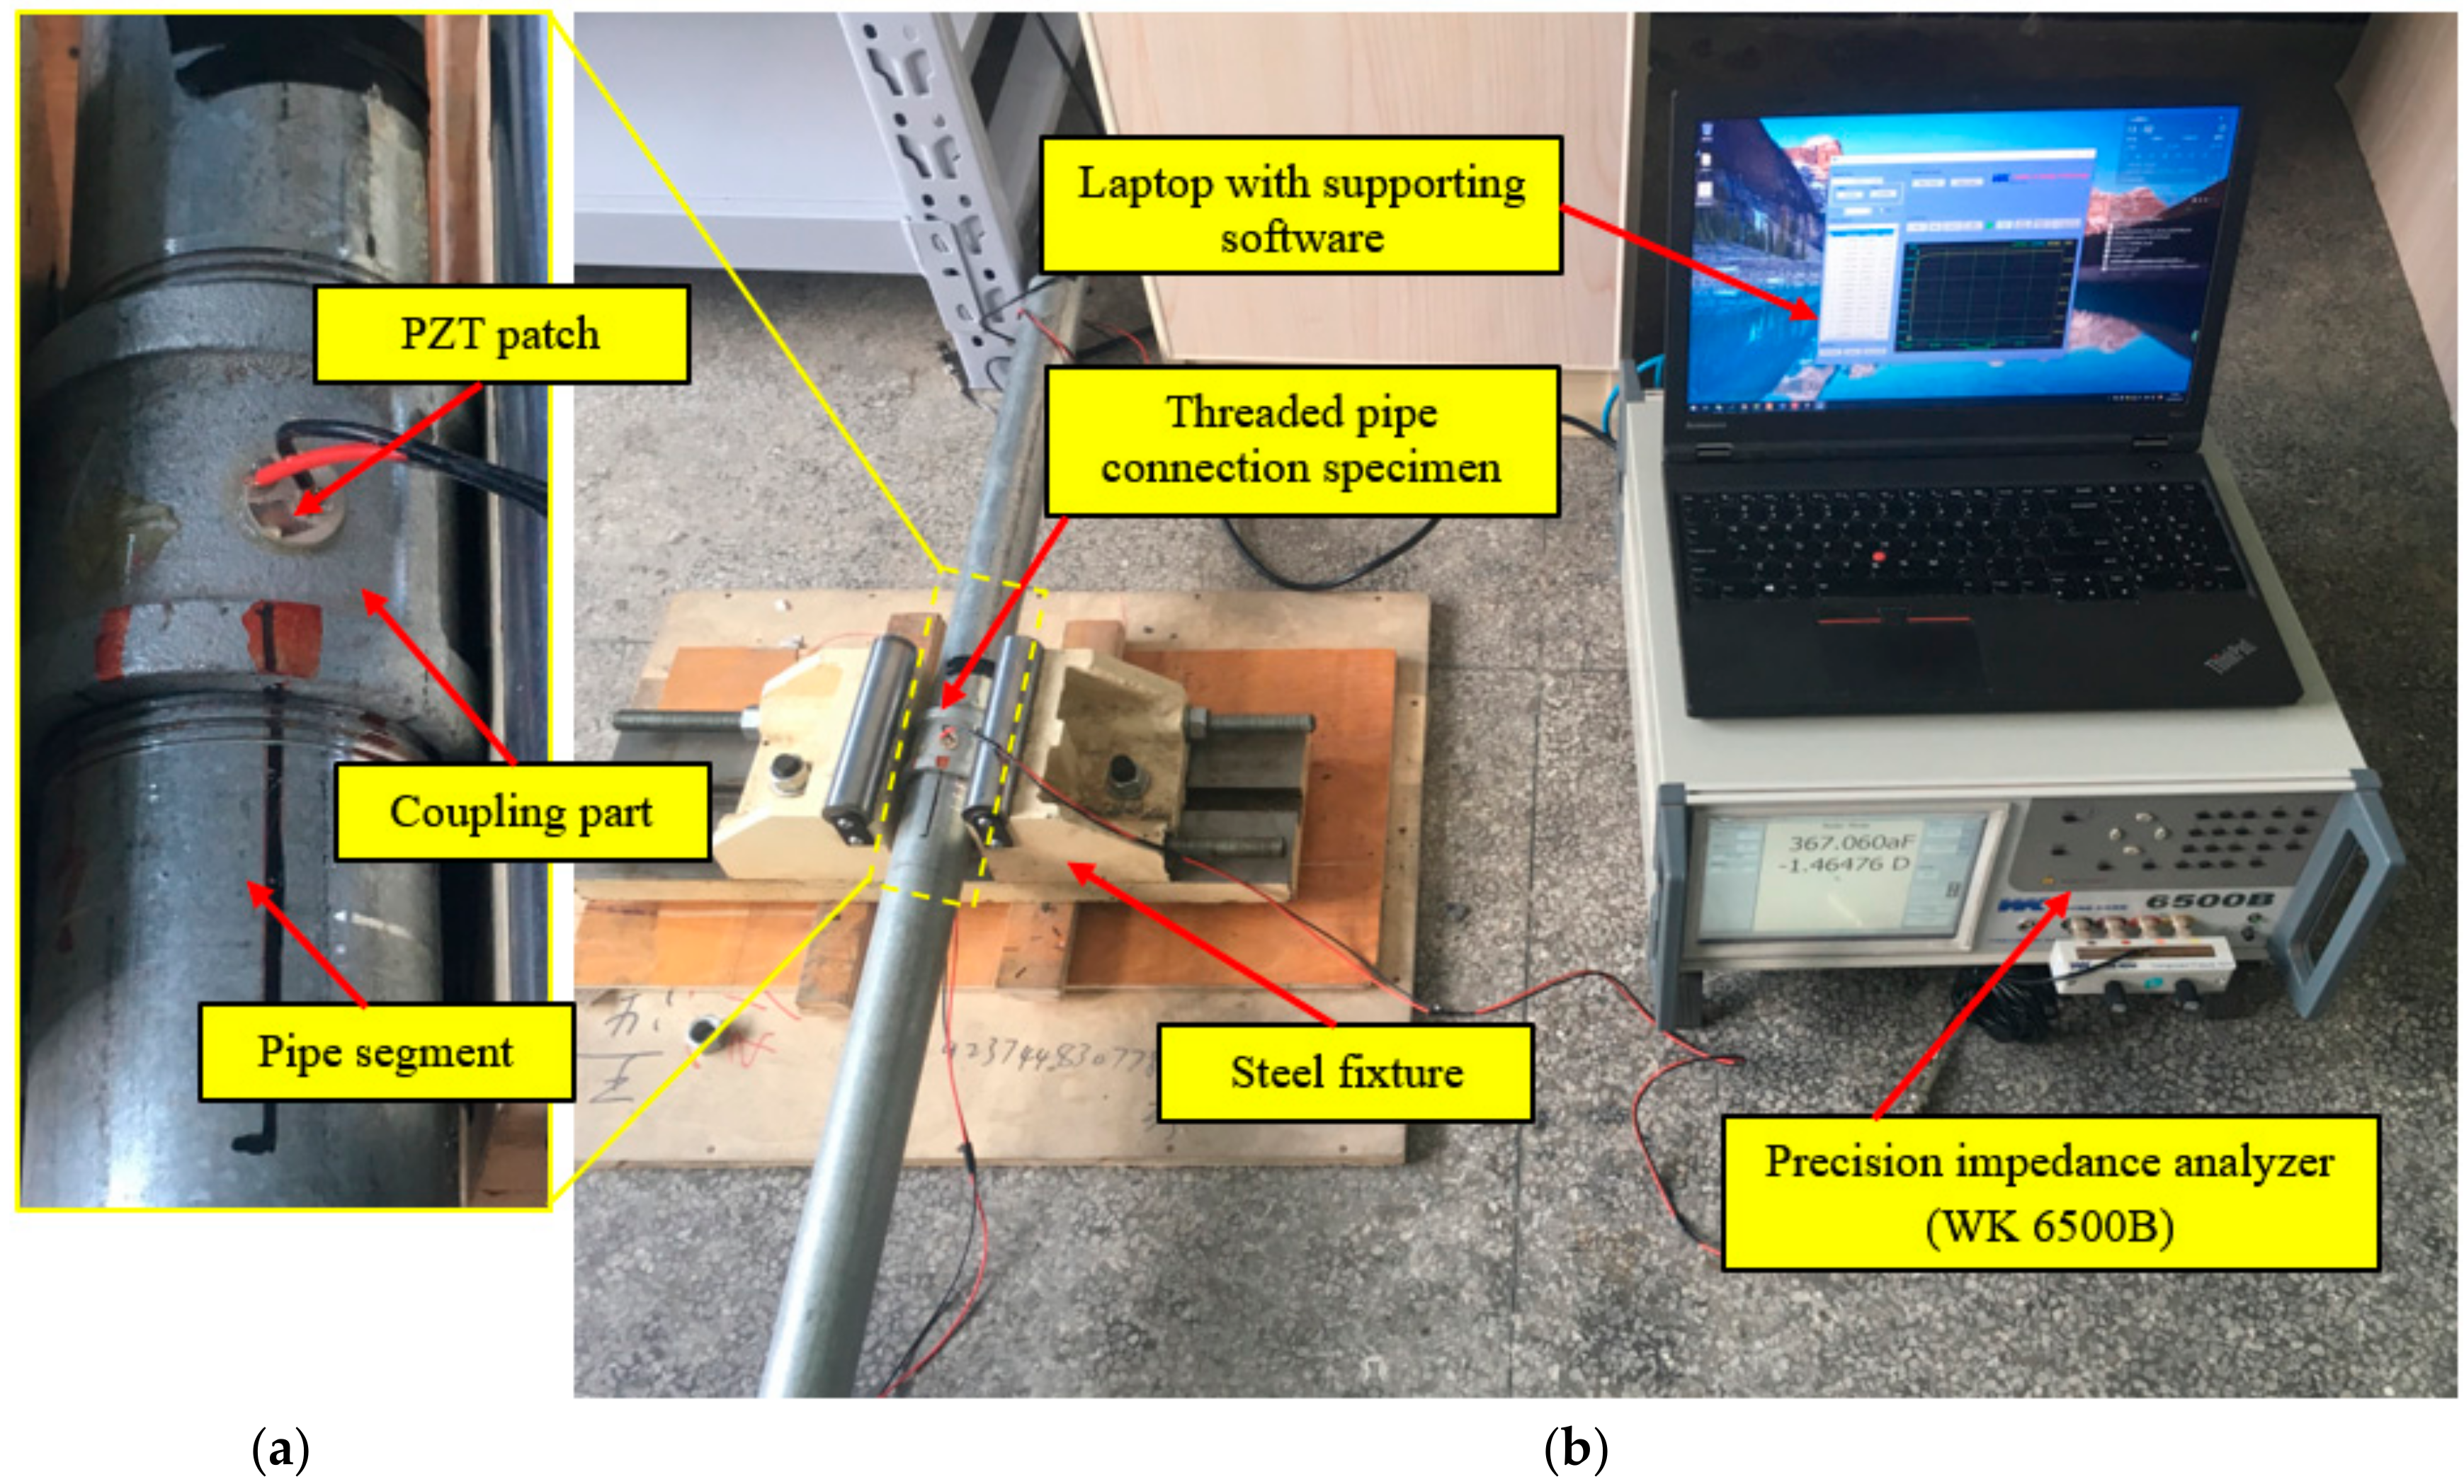
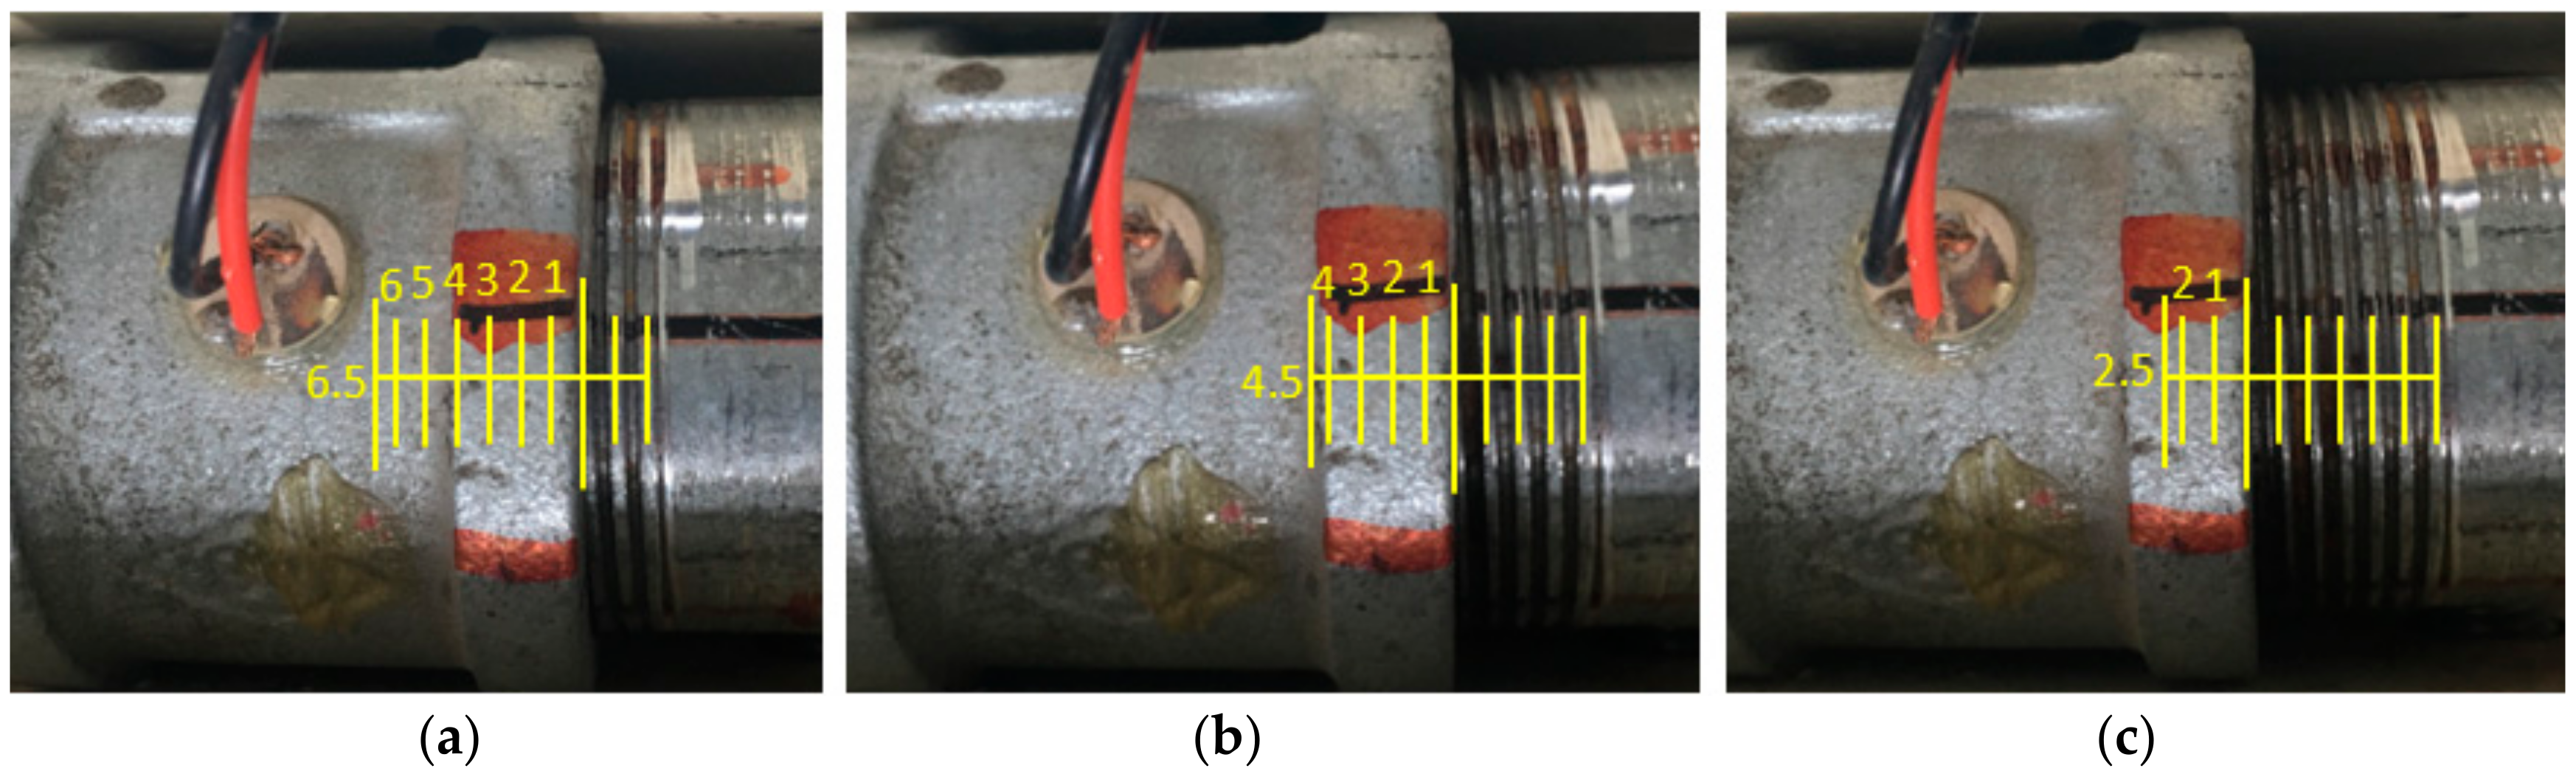
3.1. Experimental Setup and Procedure
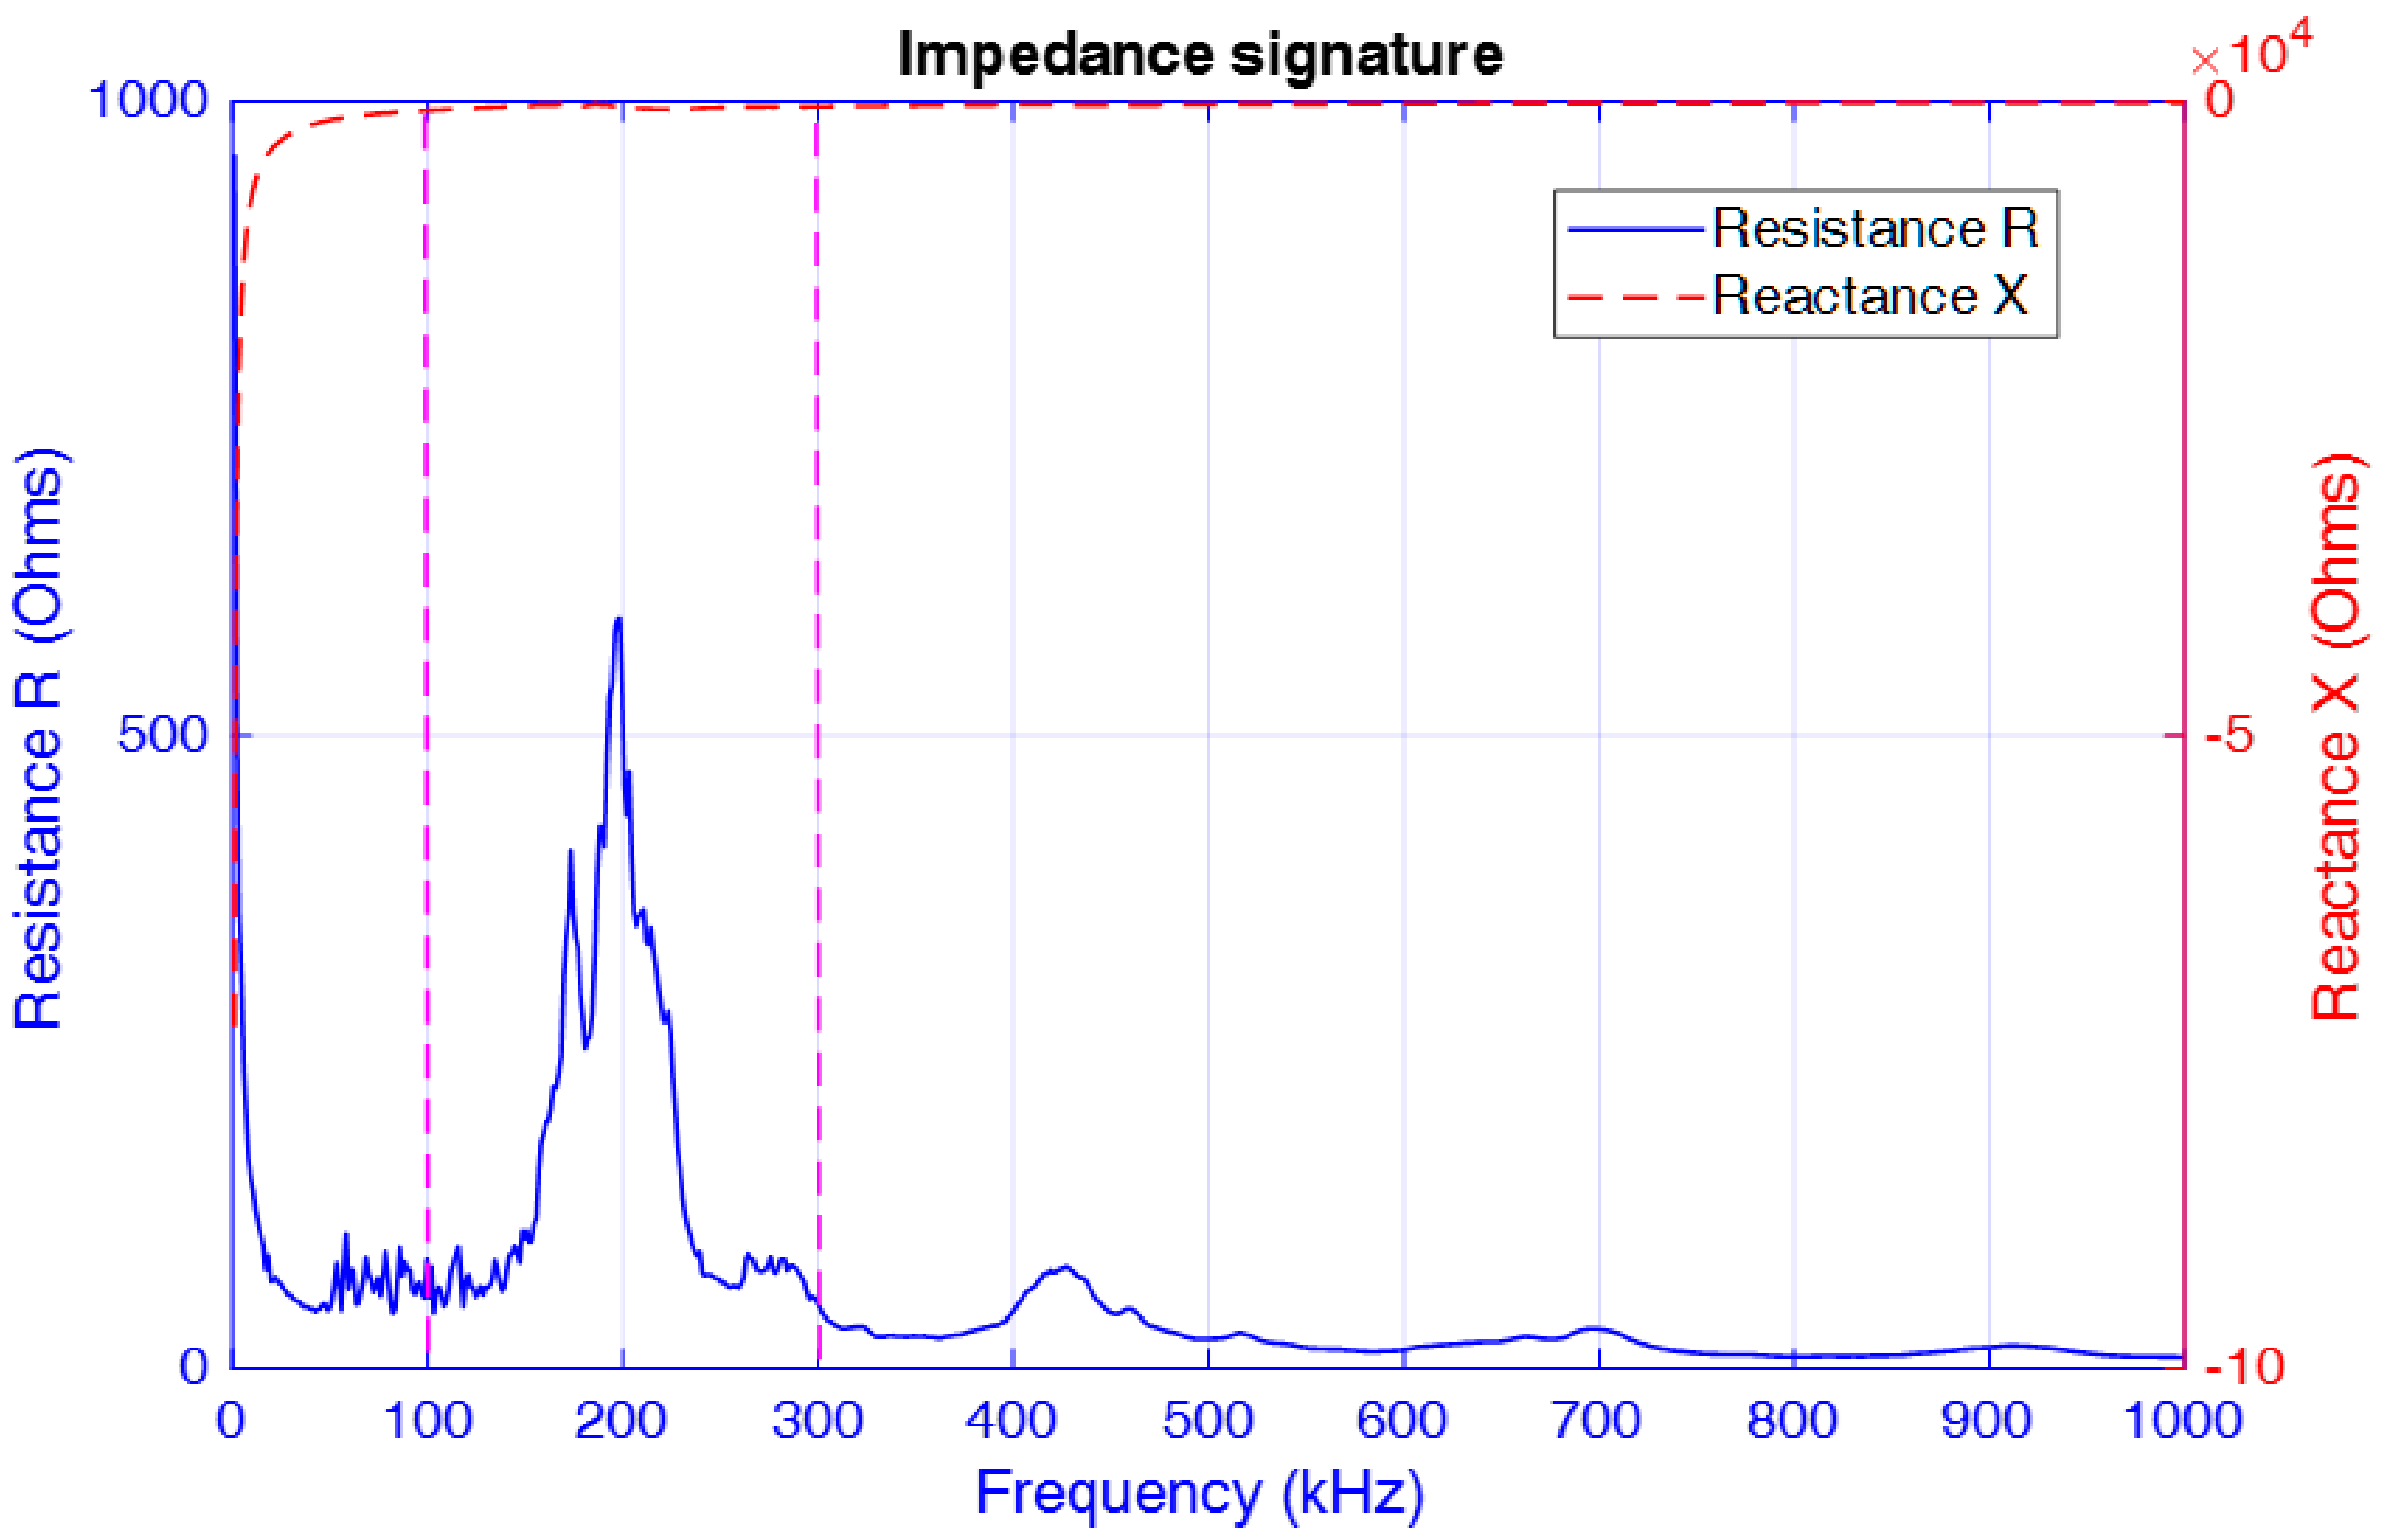
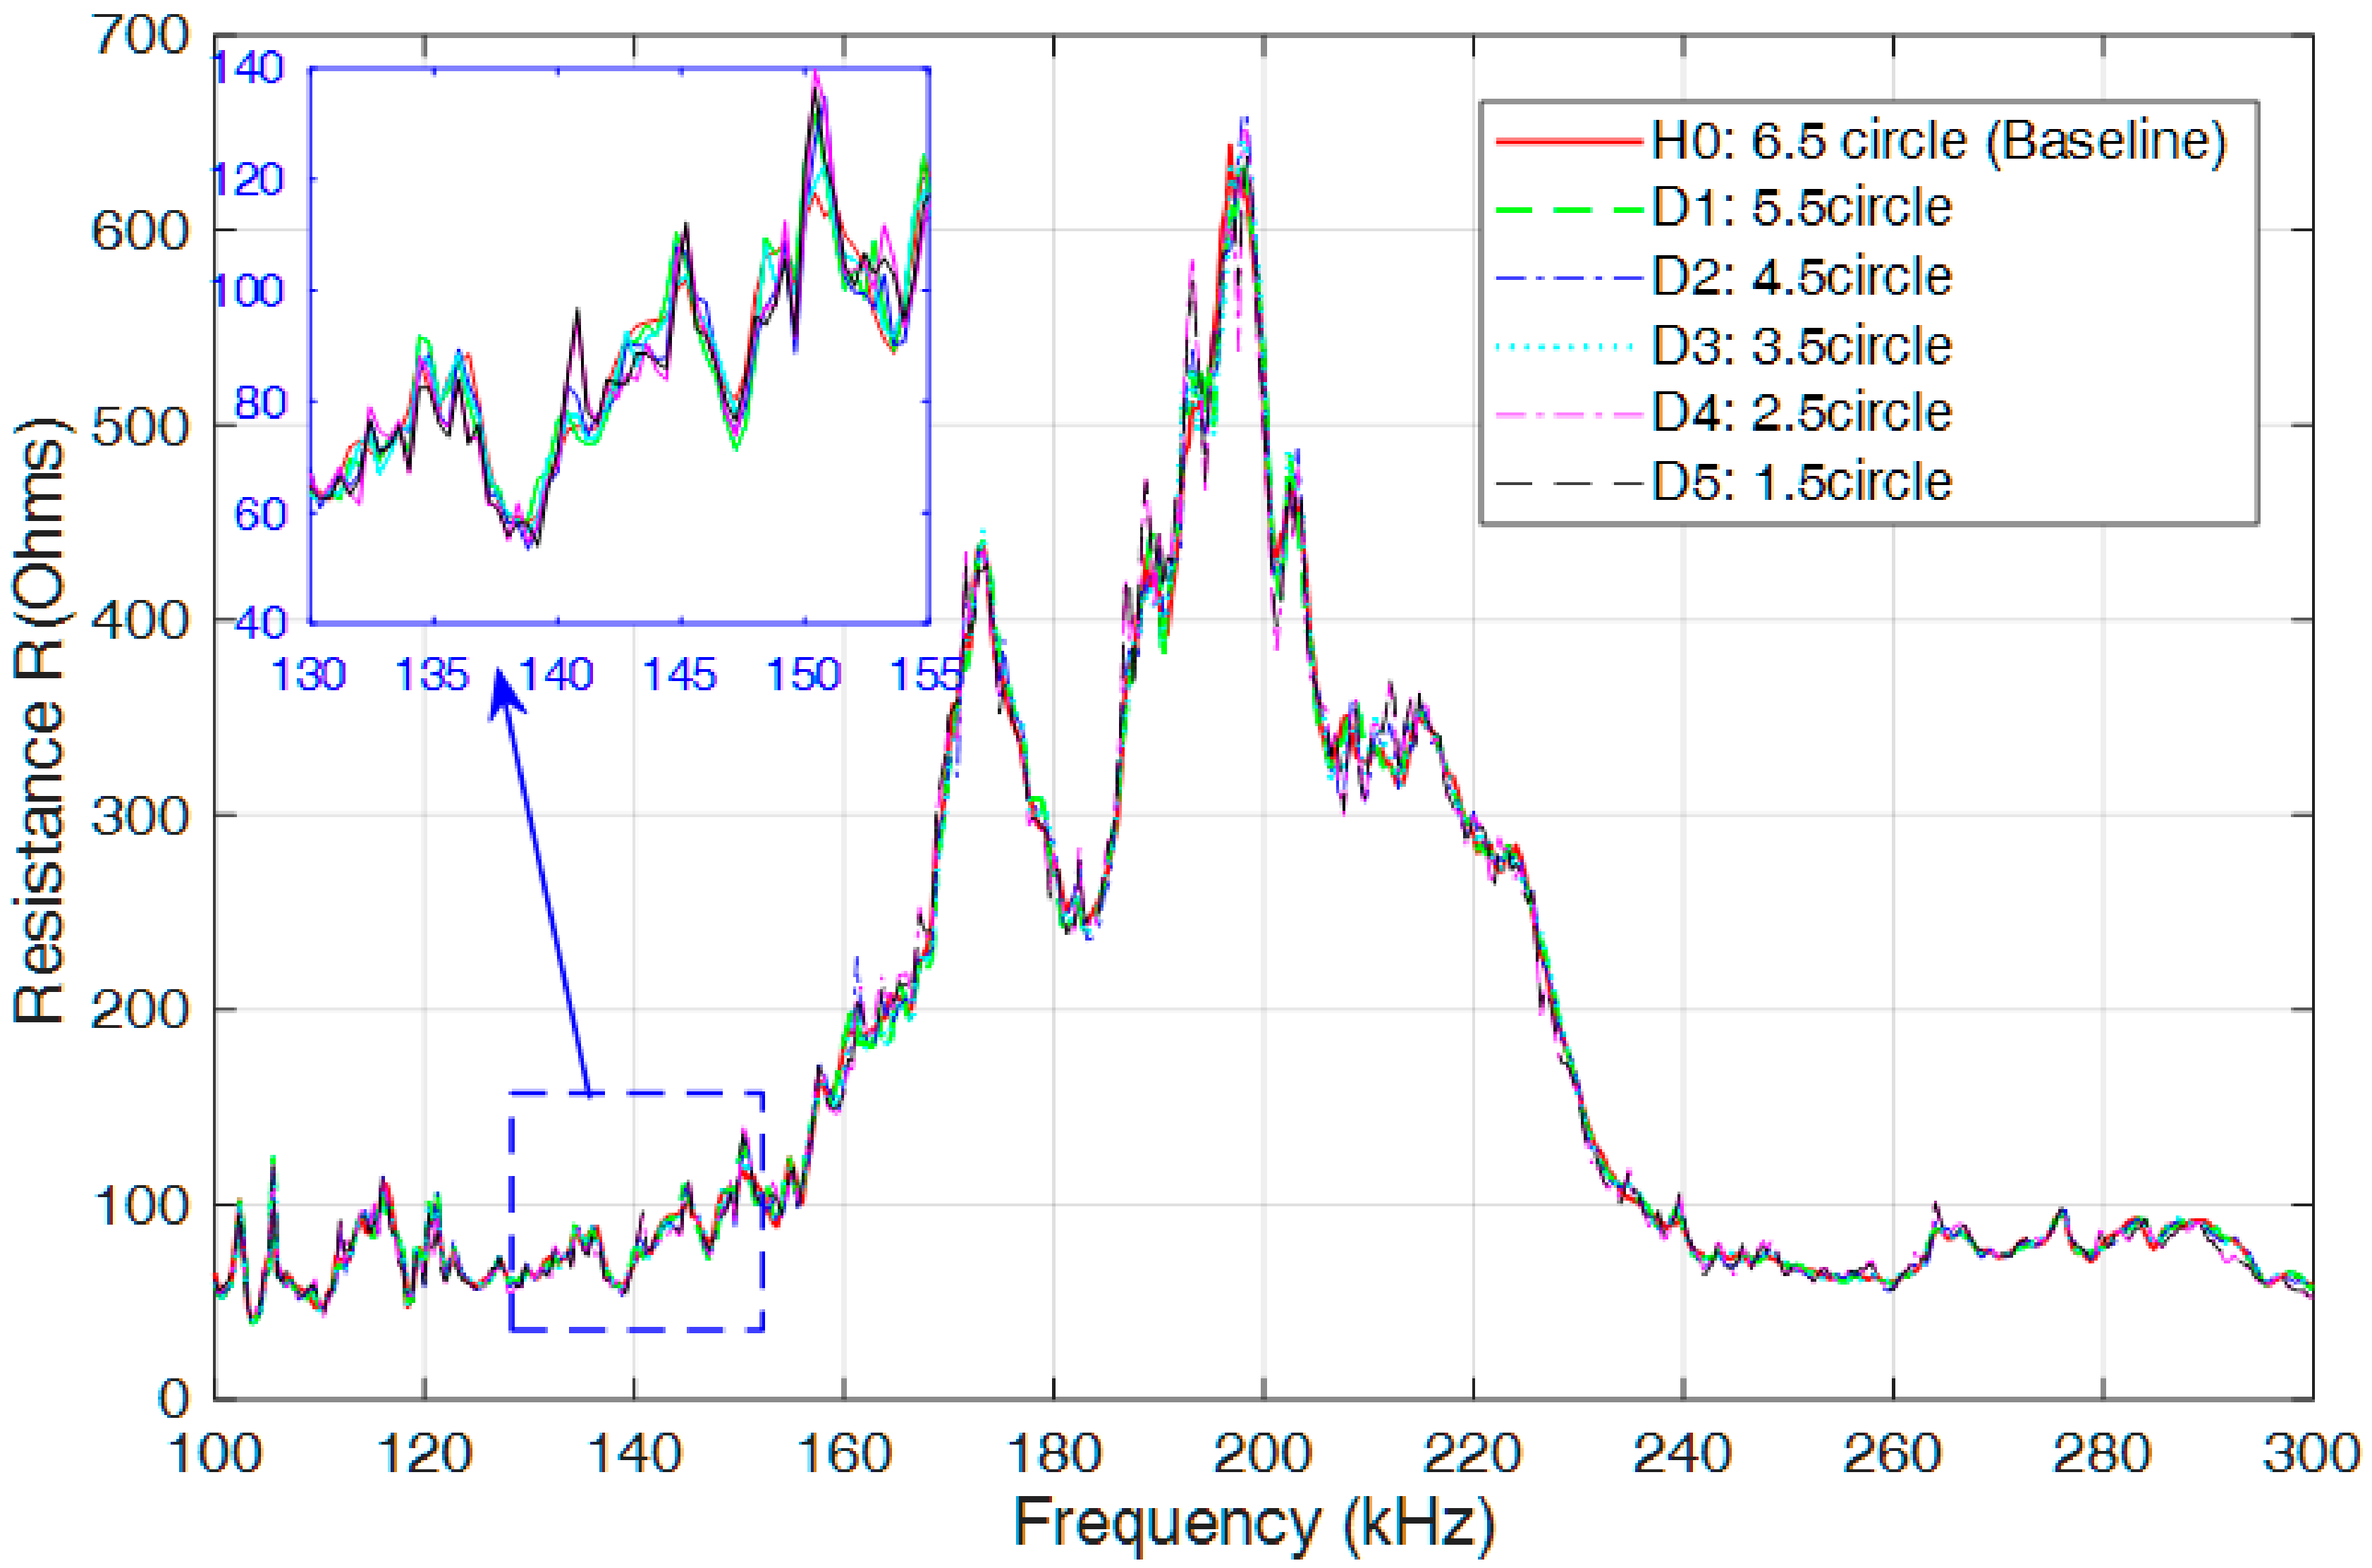
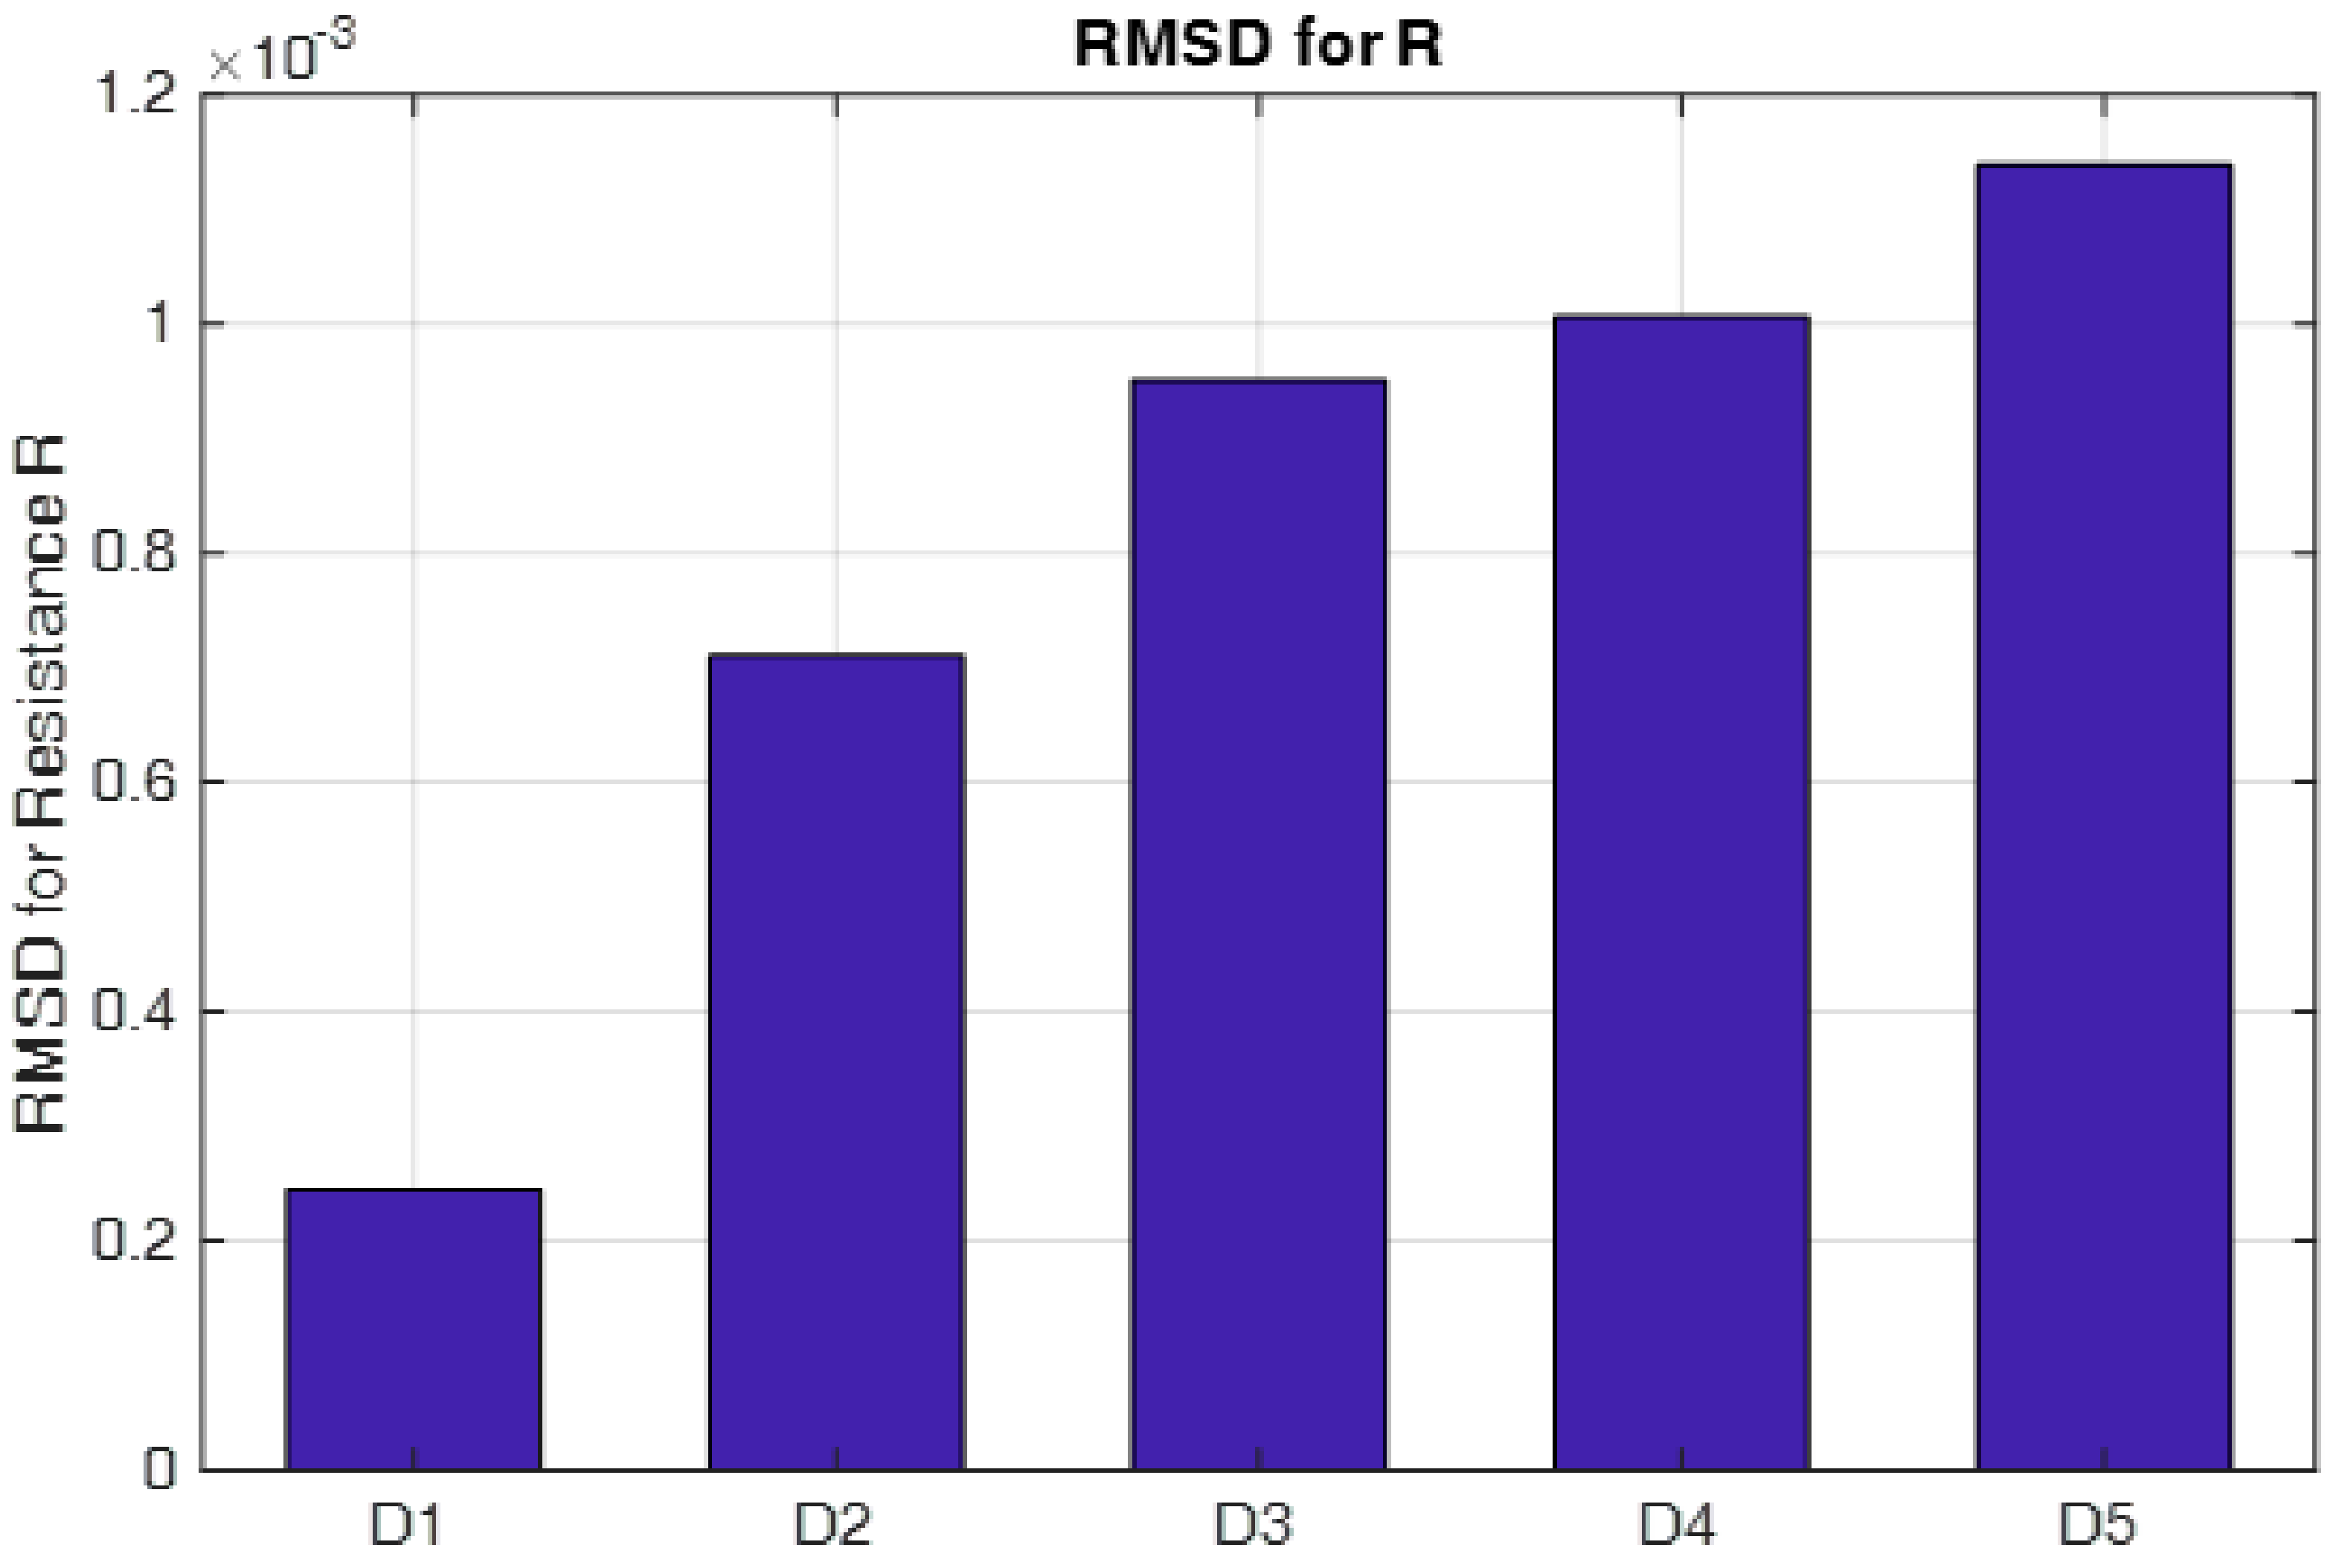
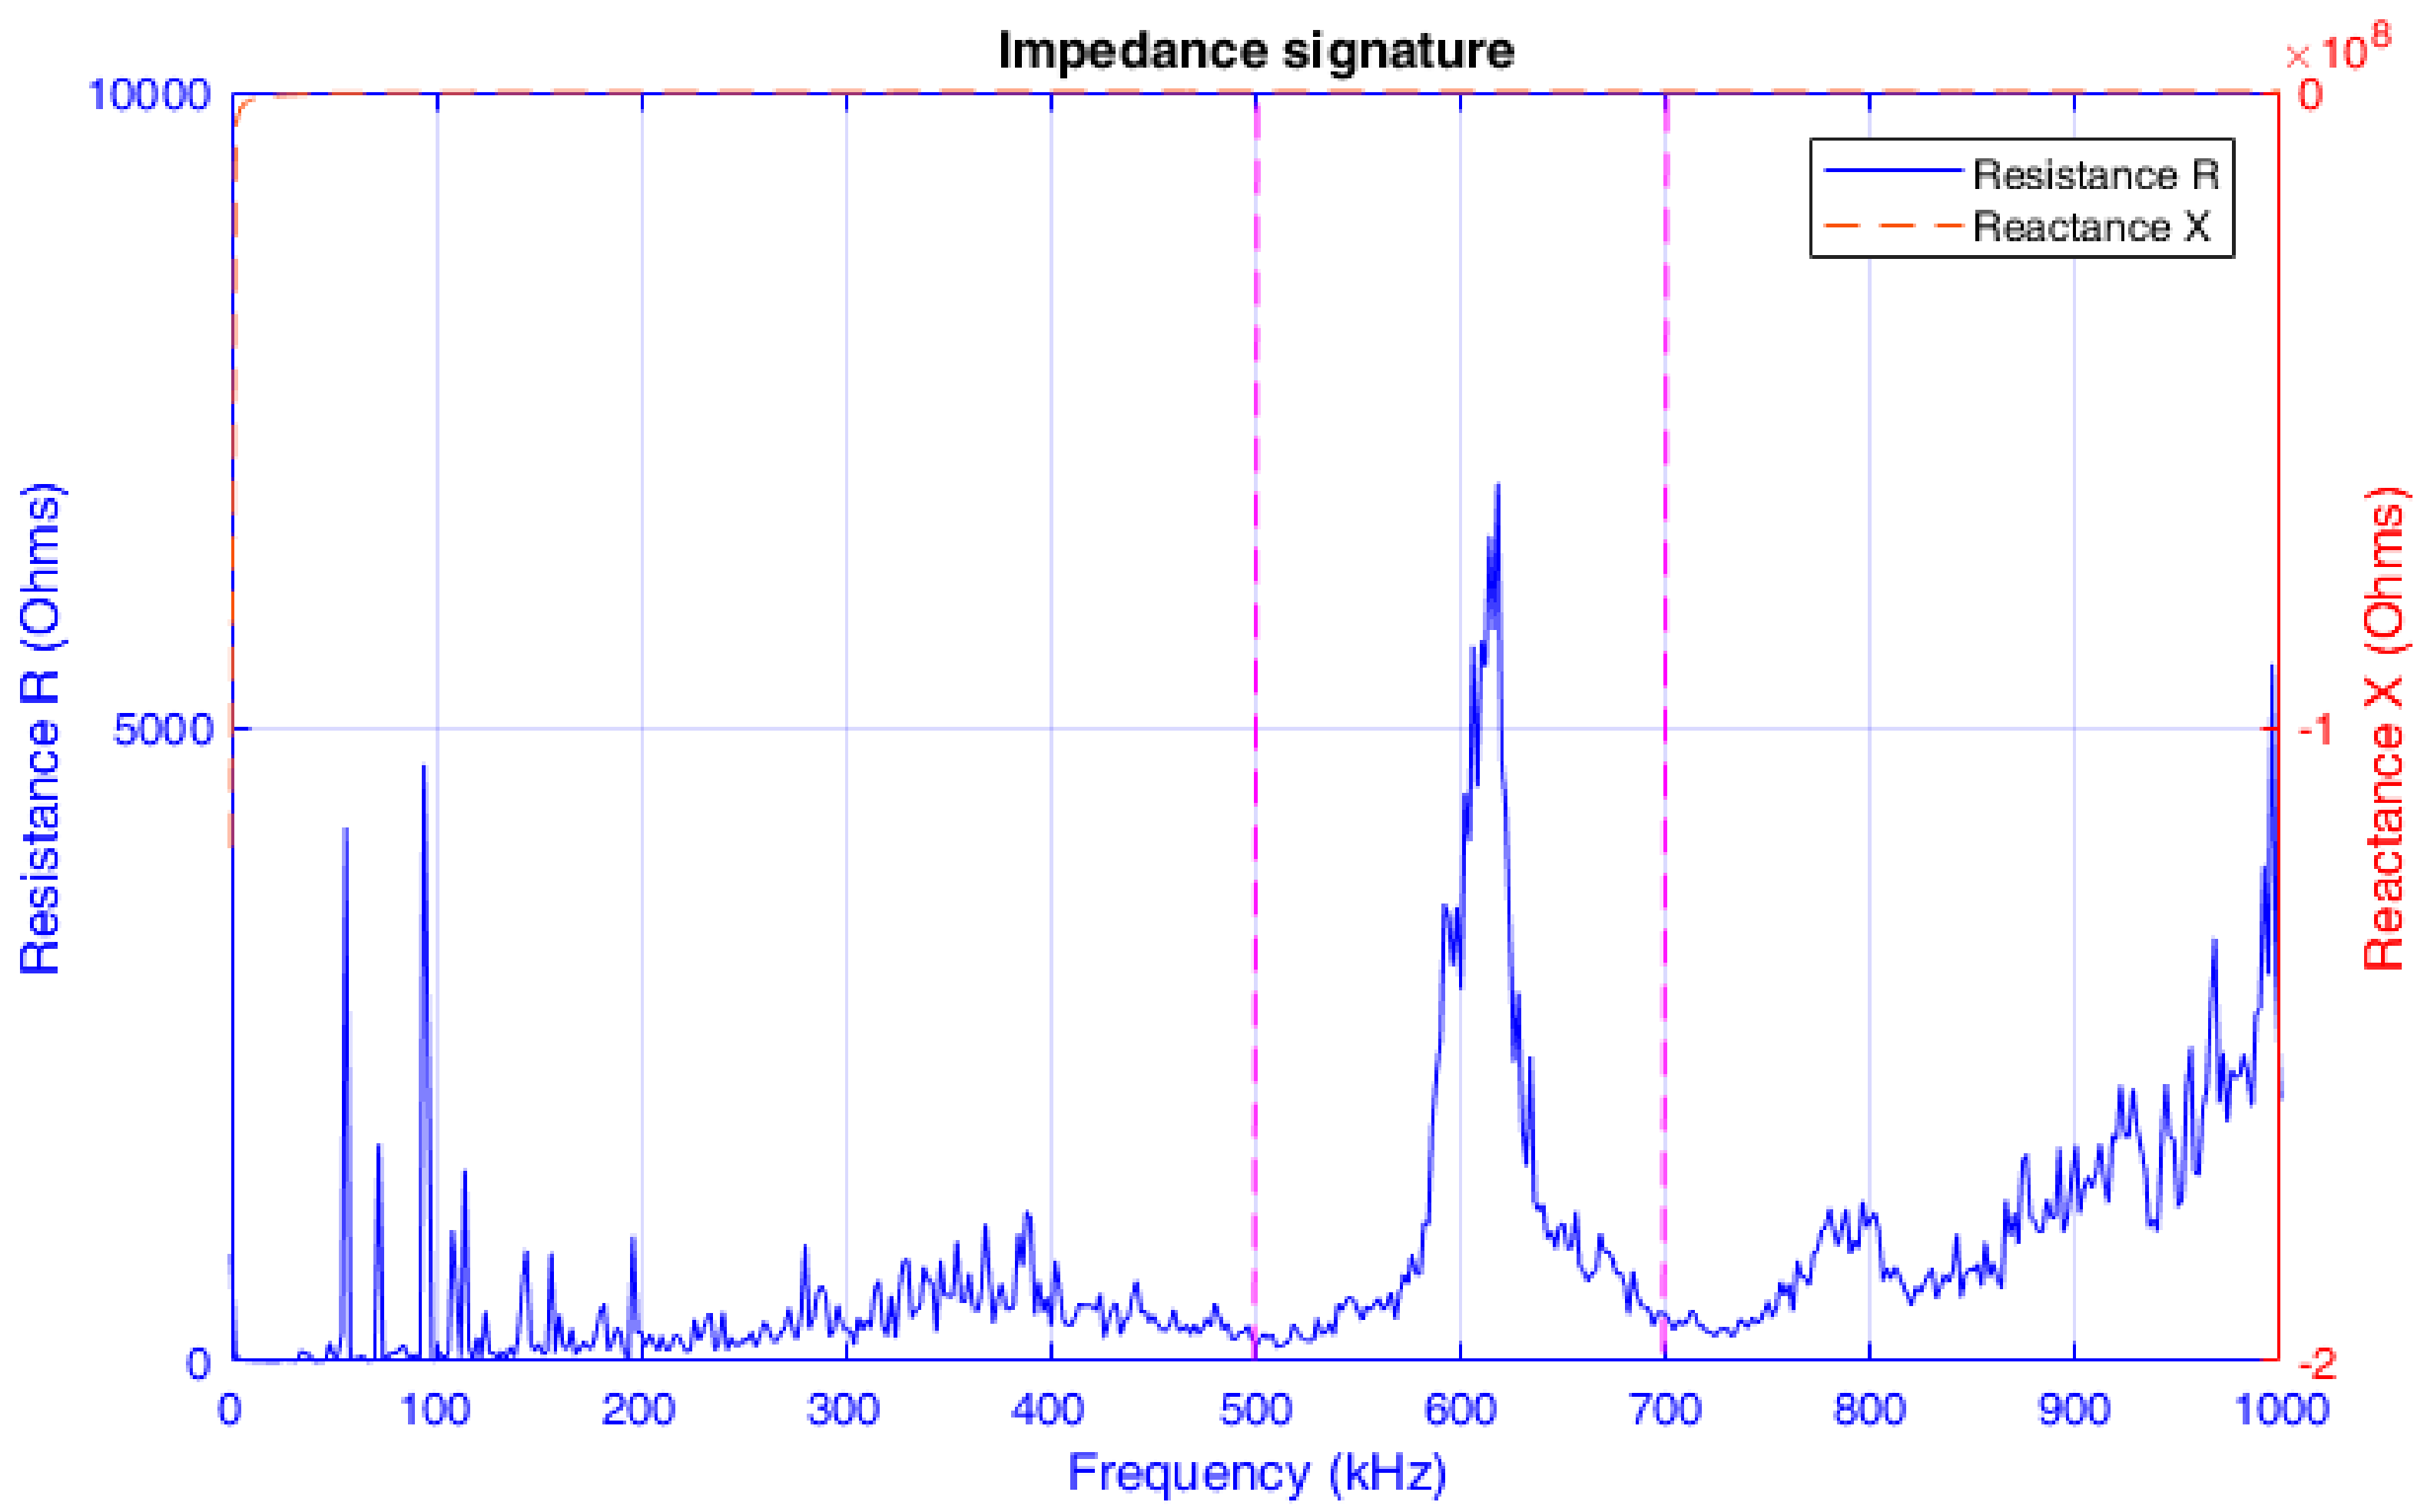
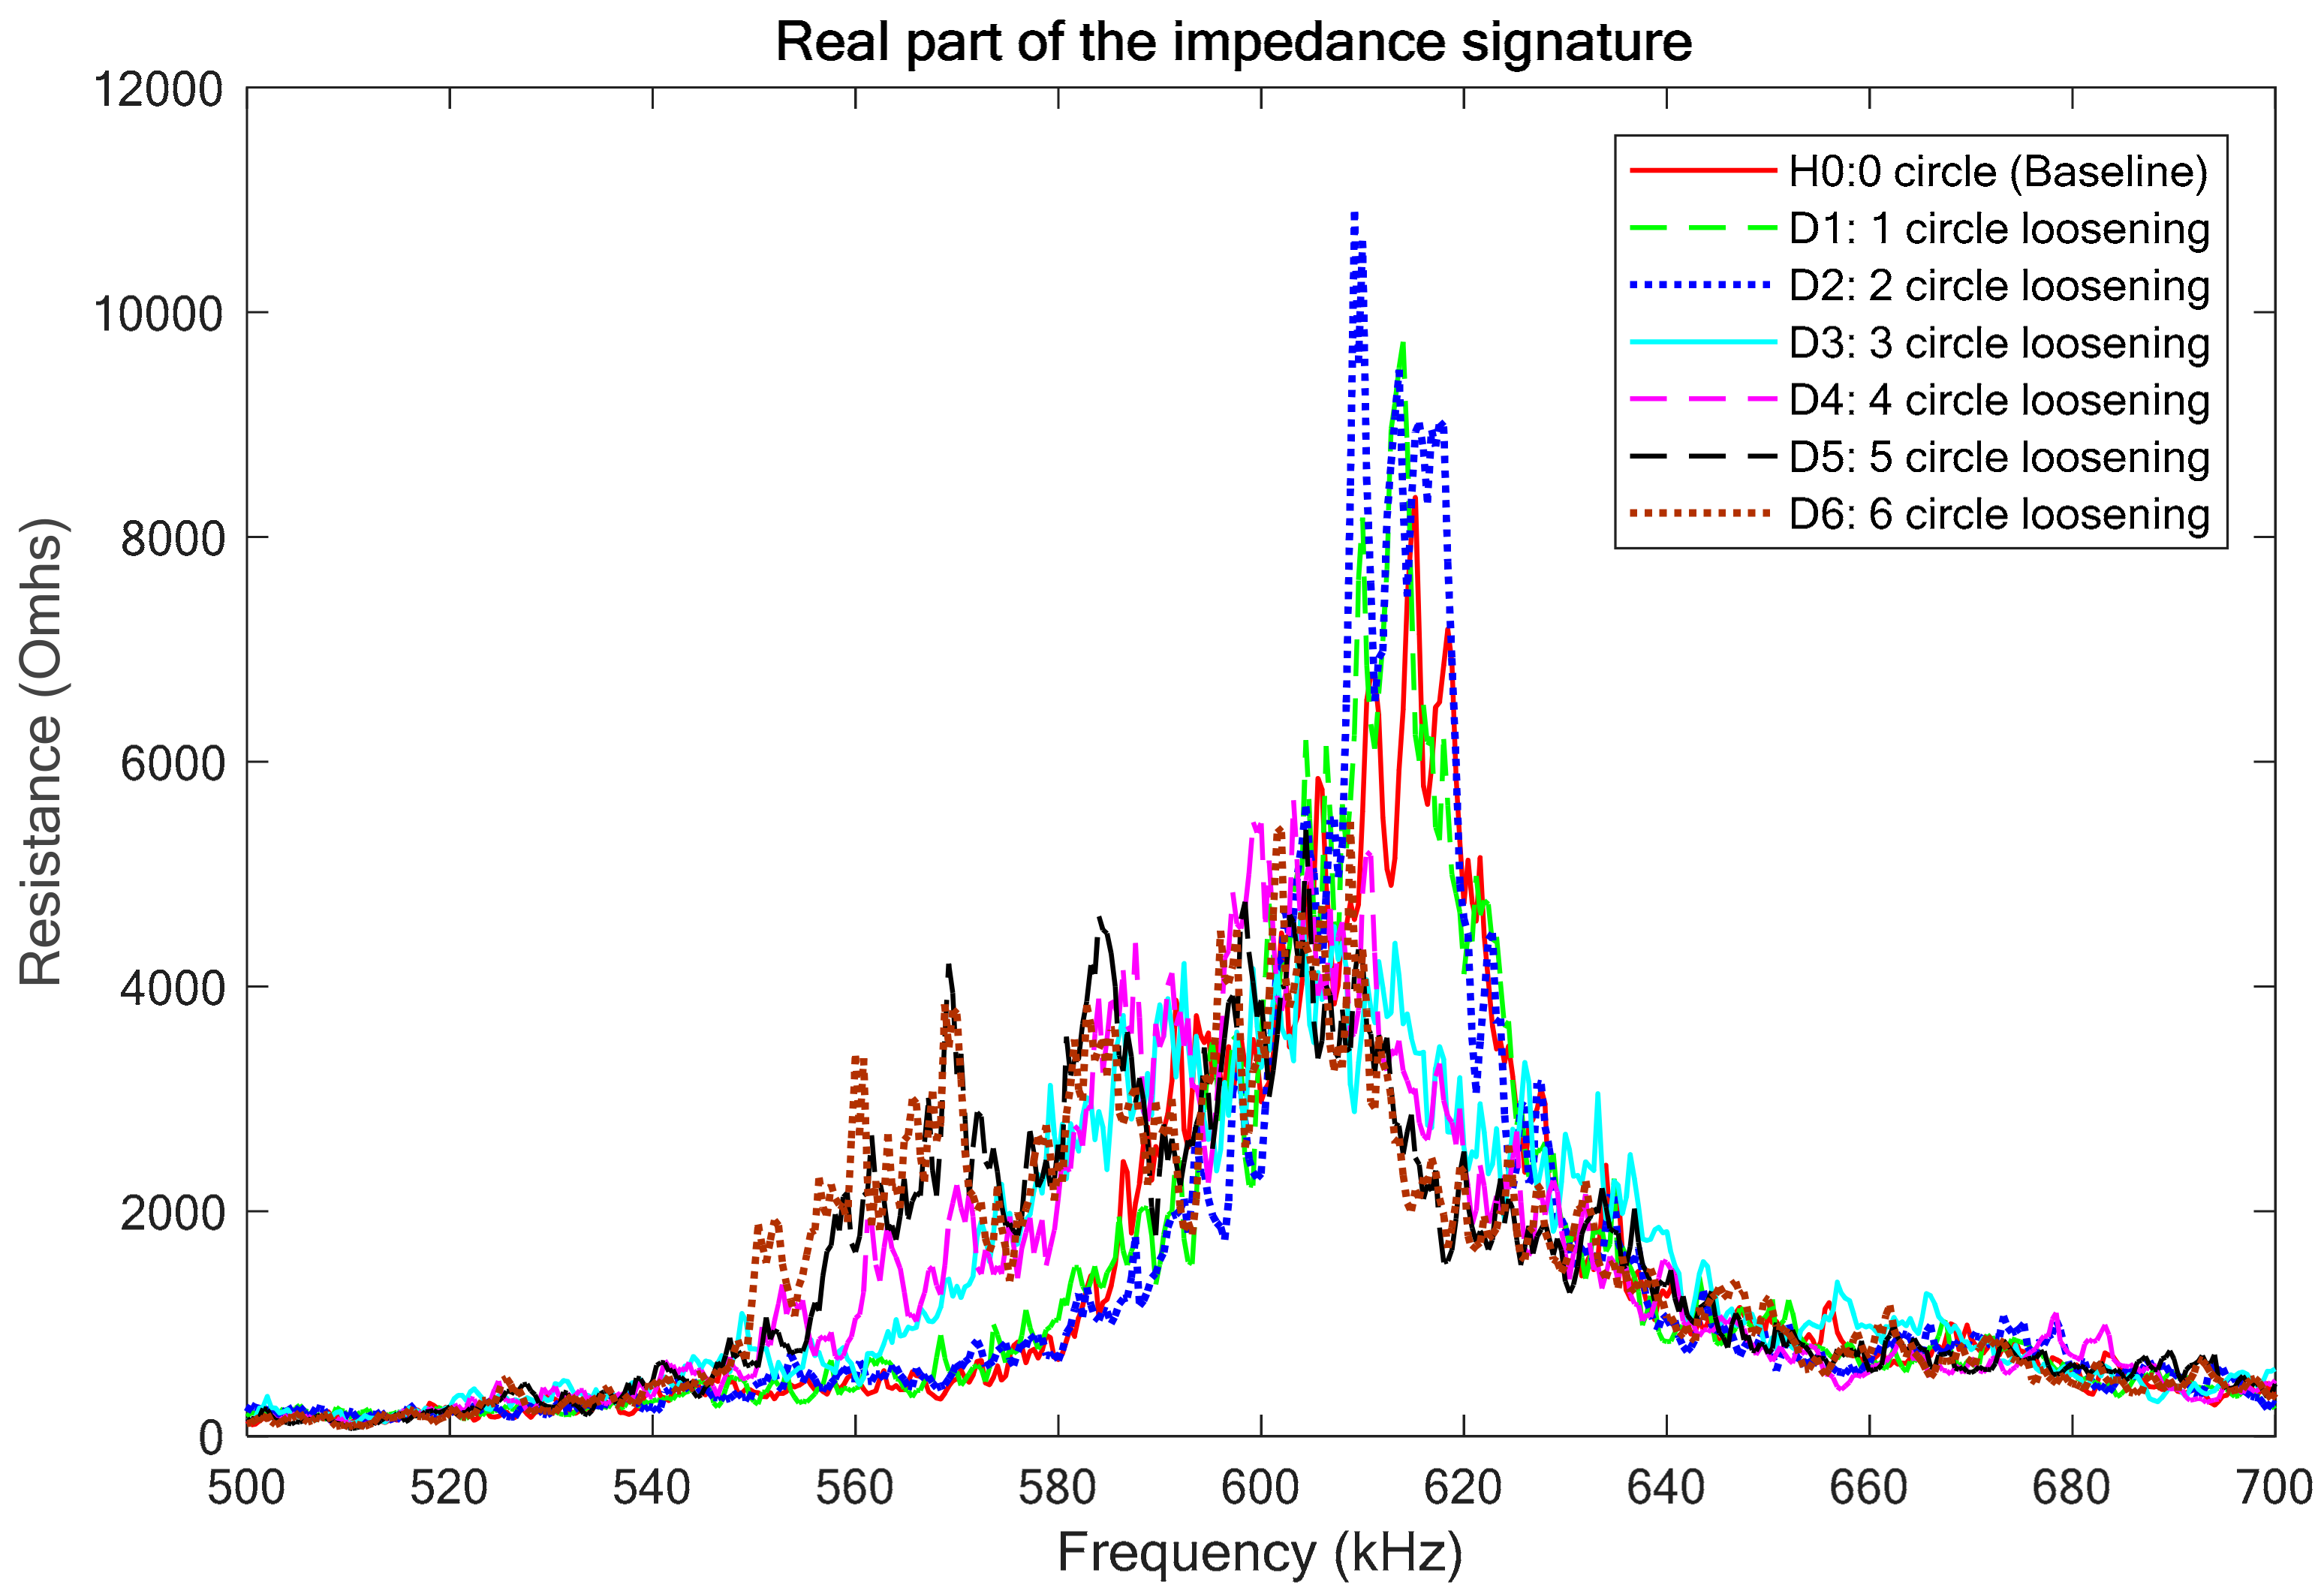
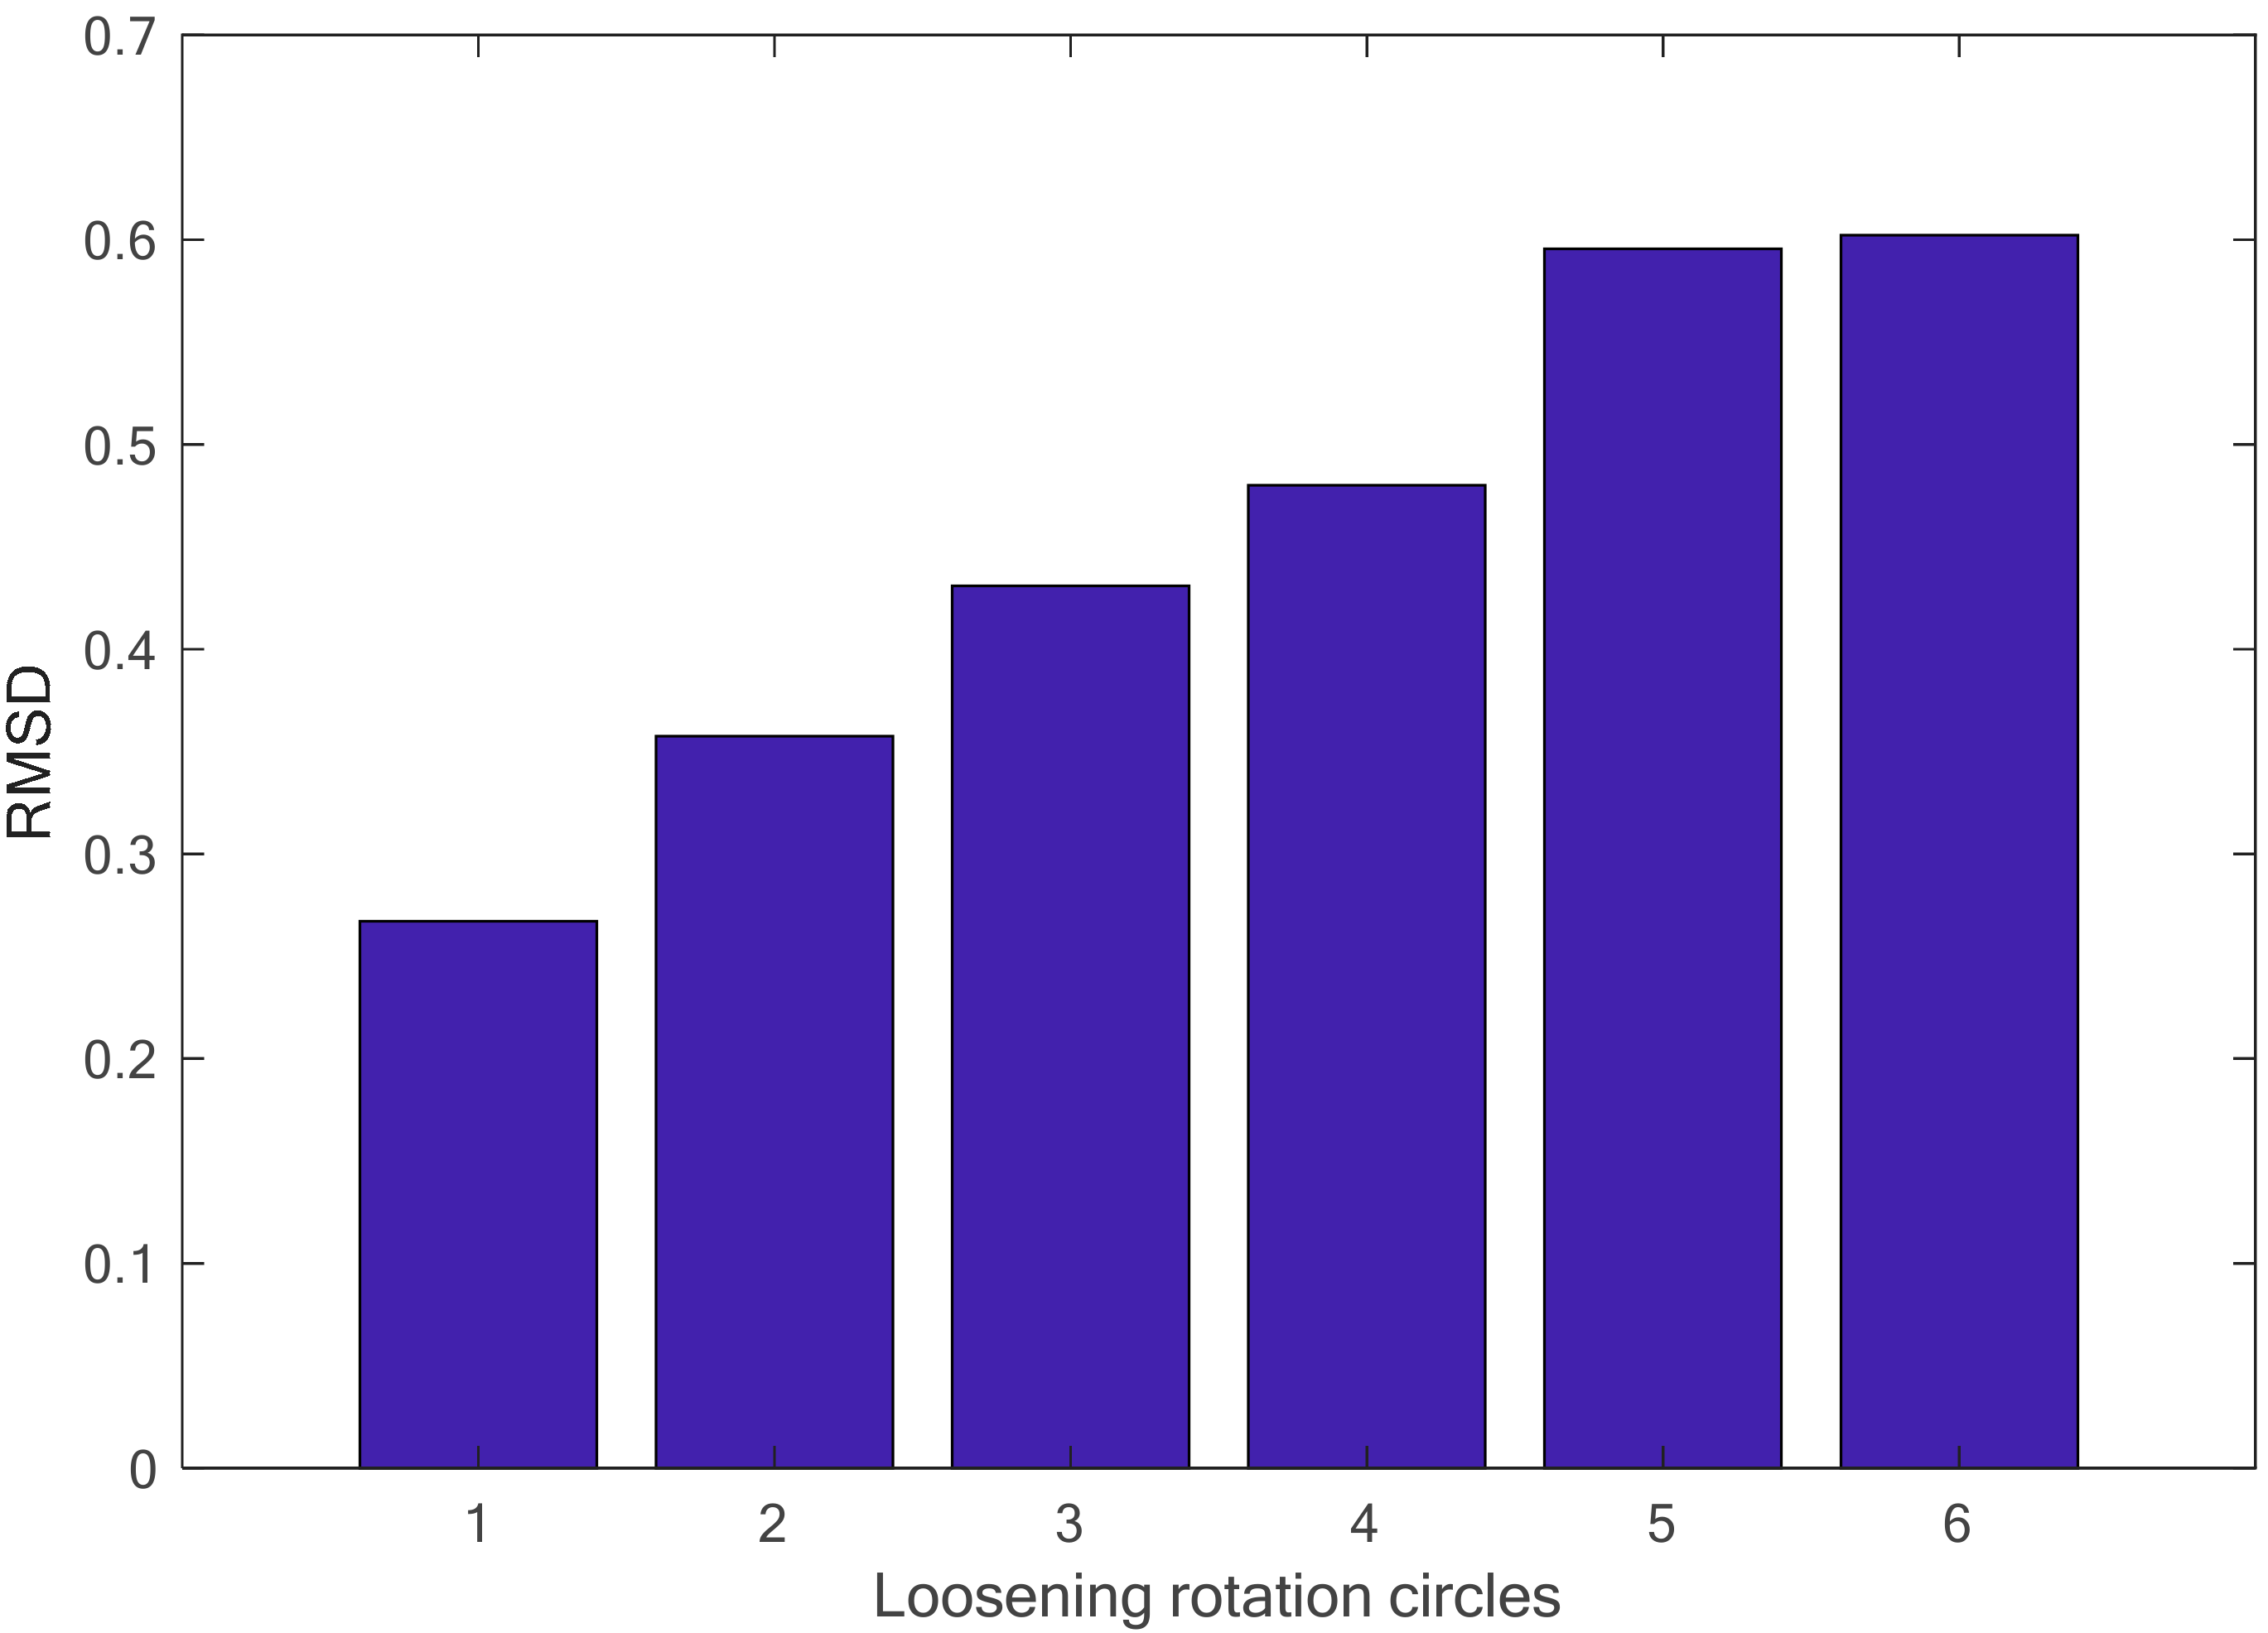
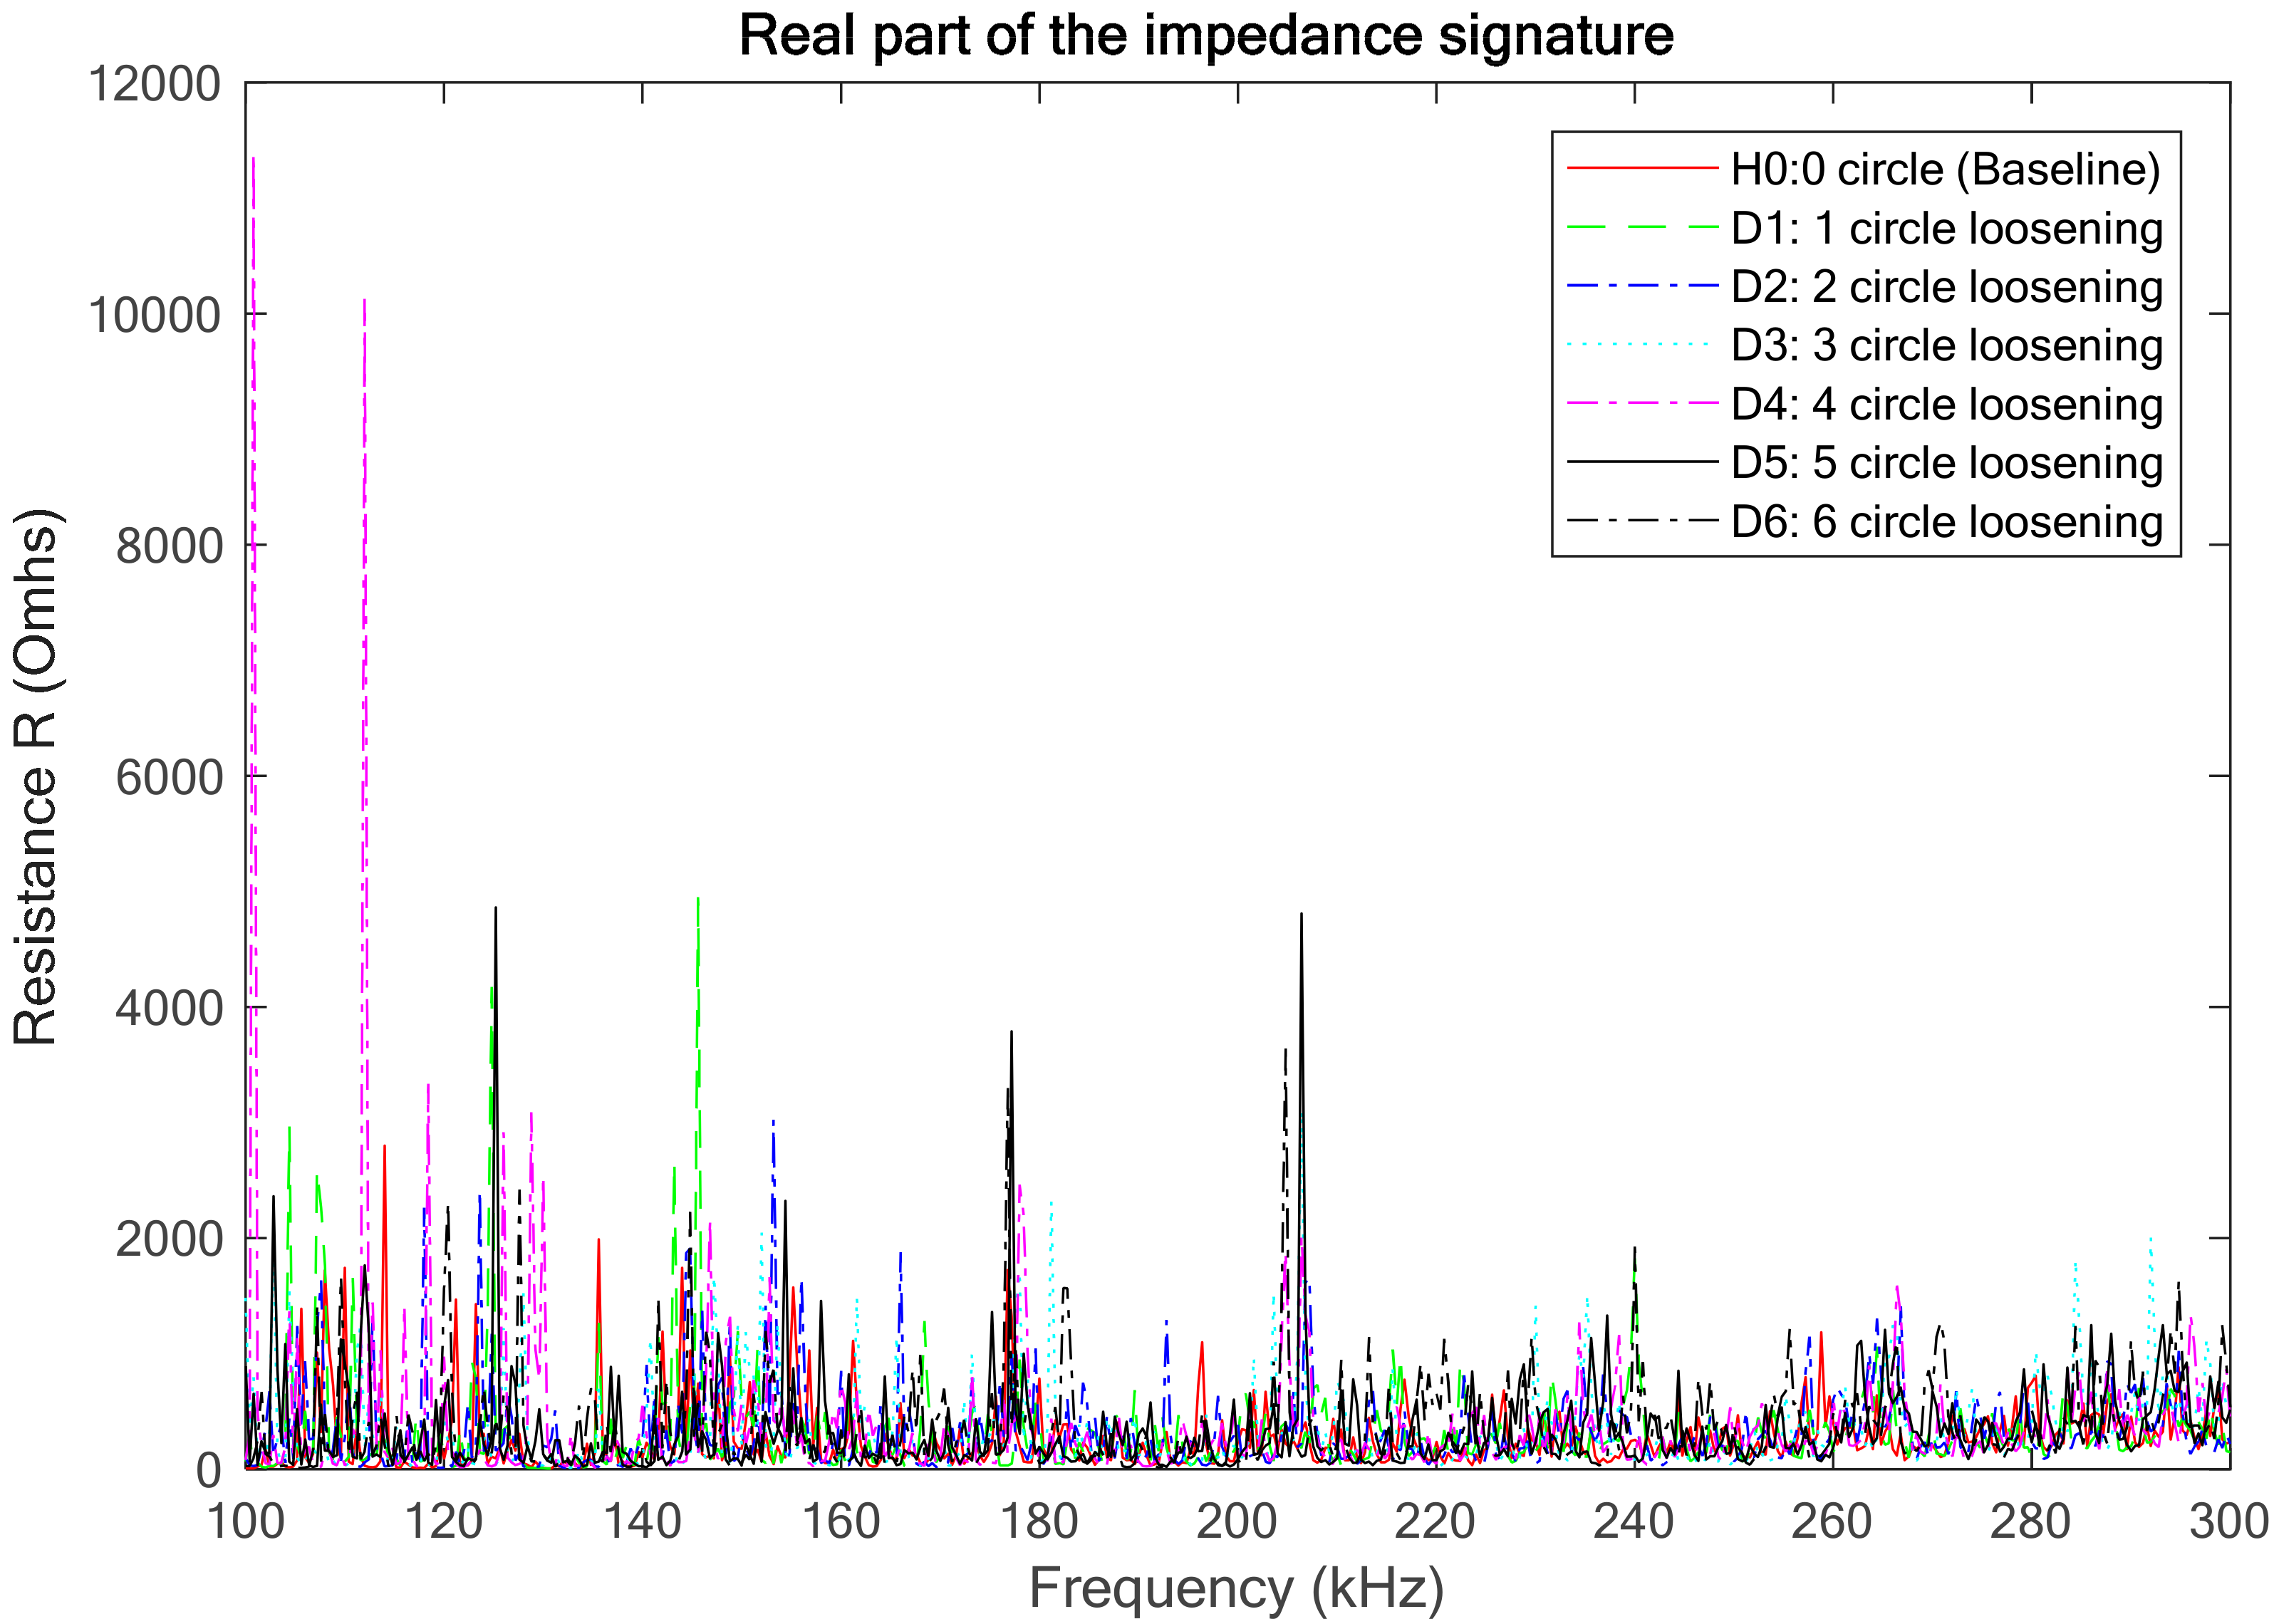
3.2. Experimental Results and Analysis
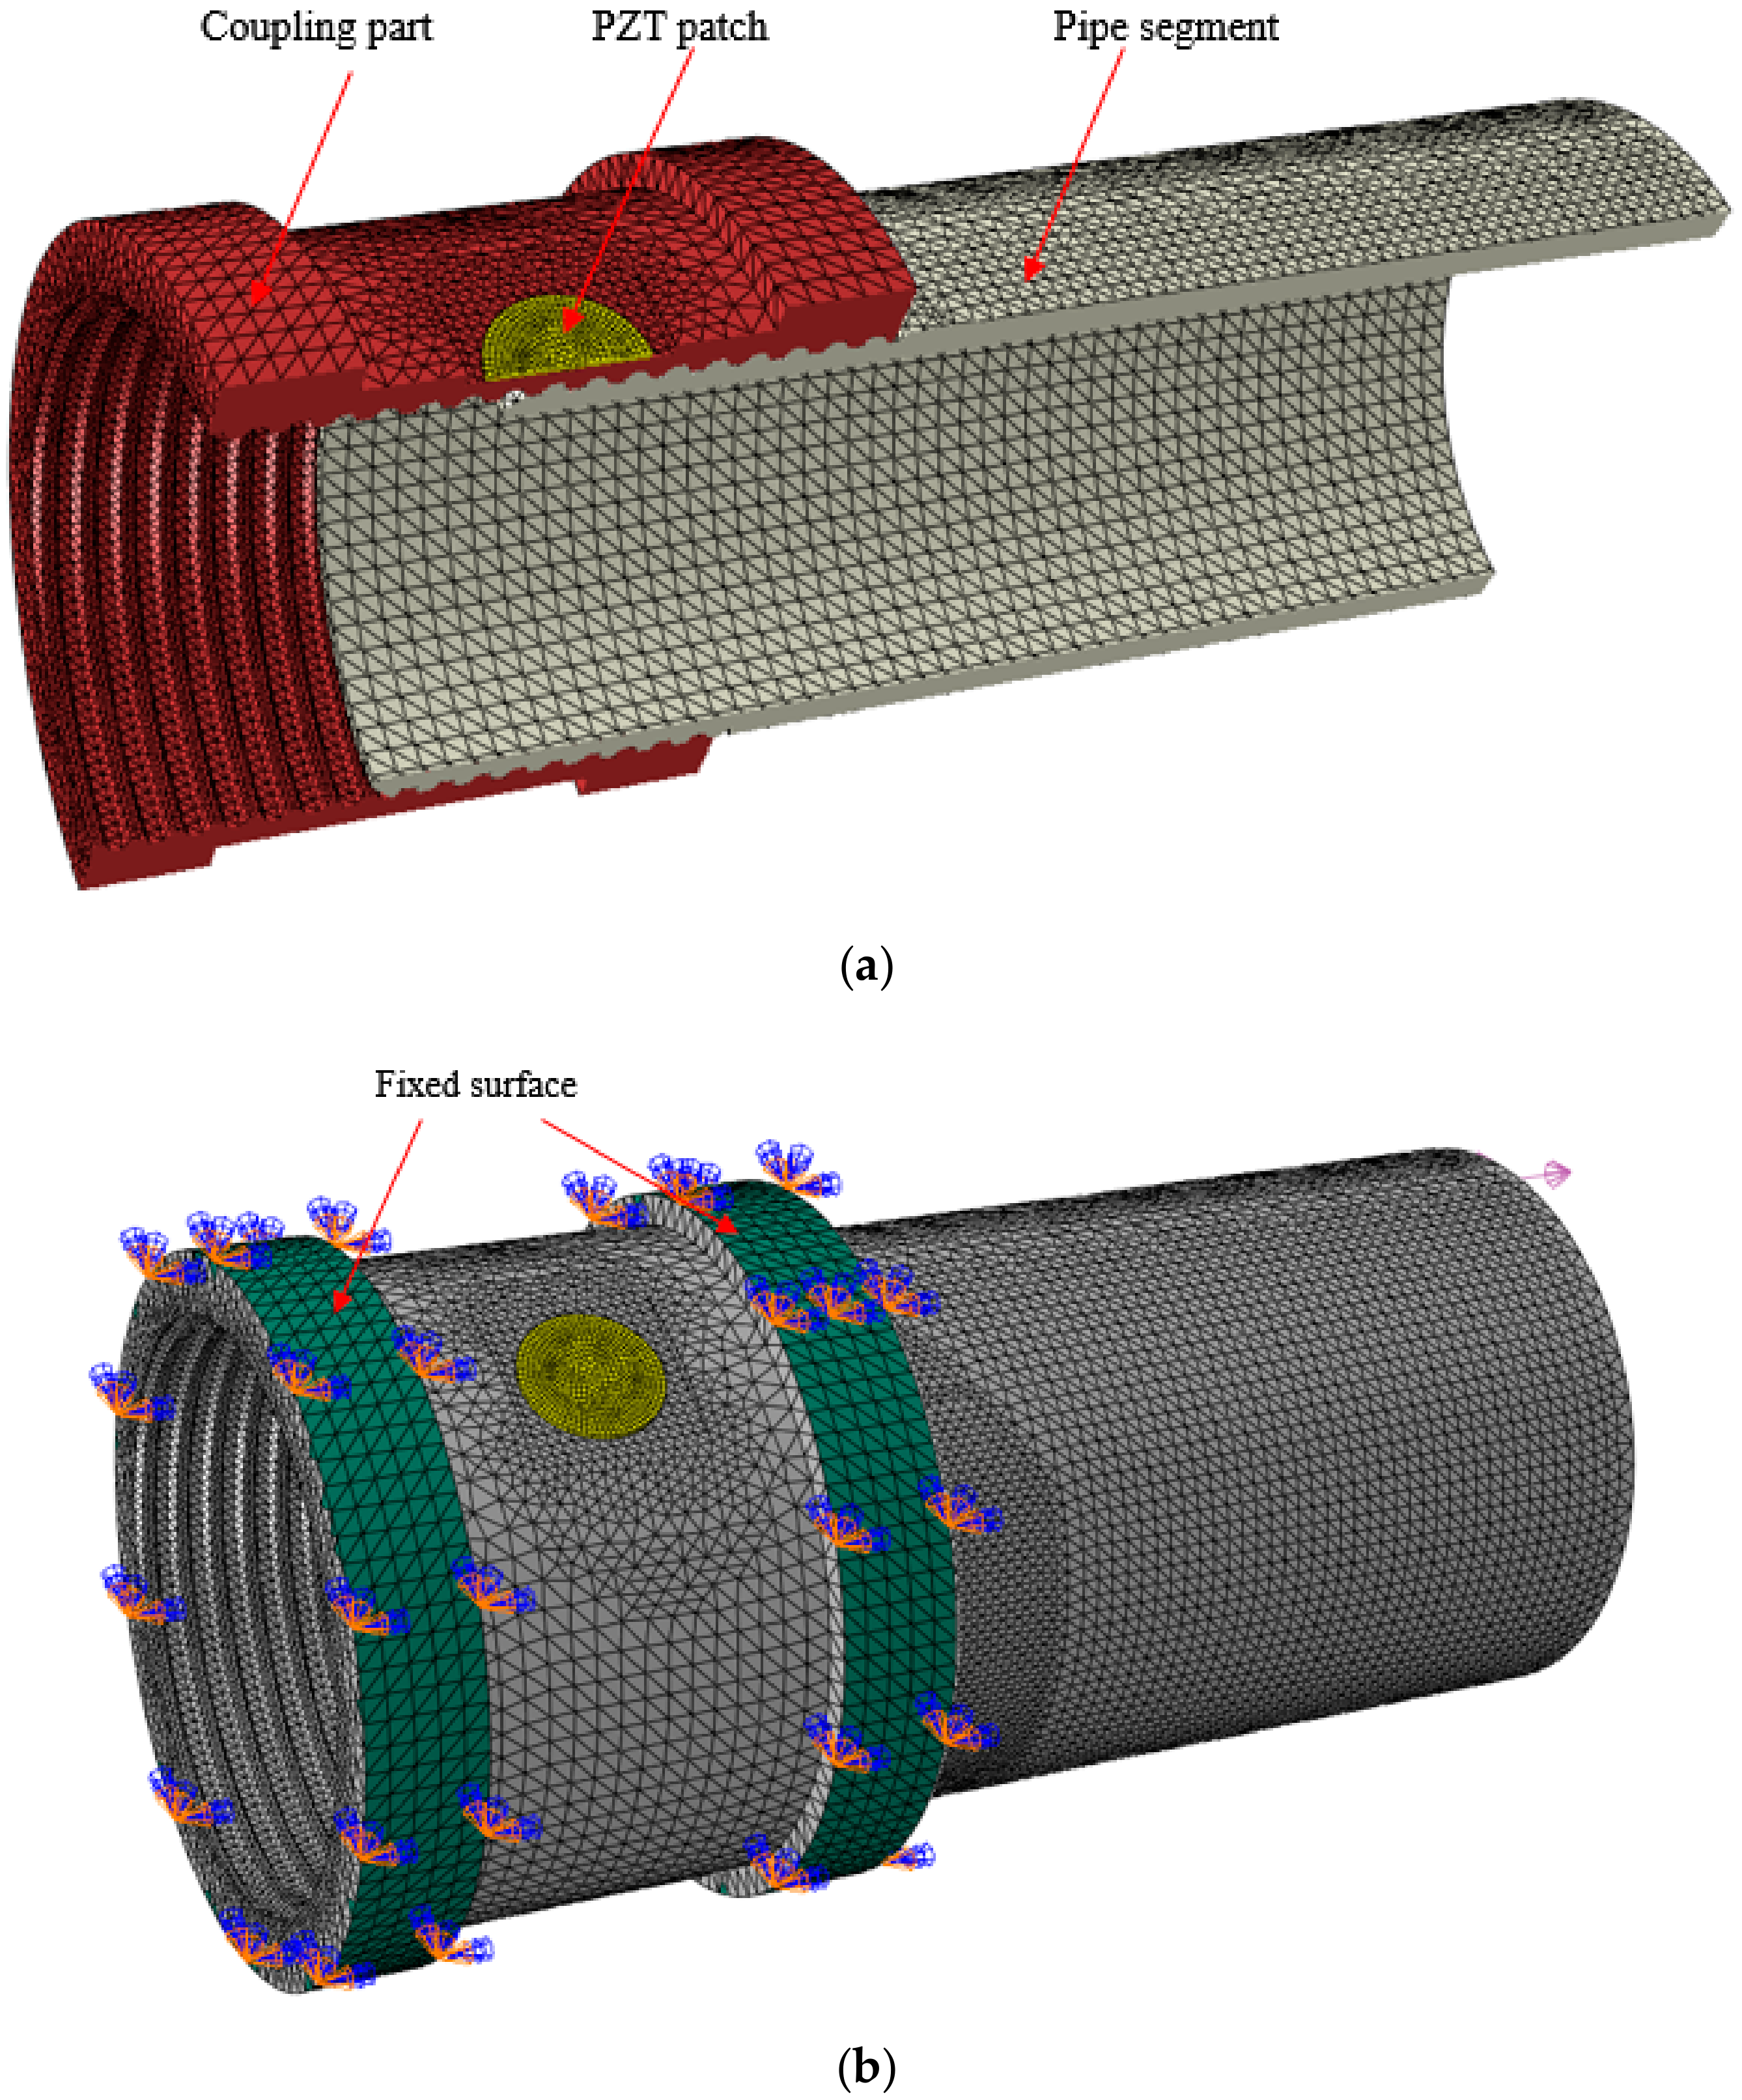
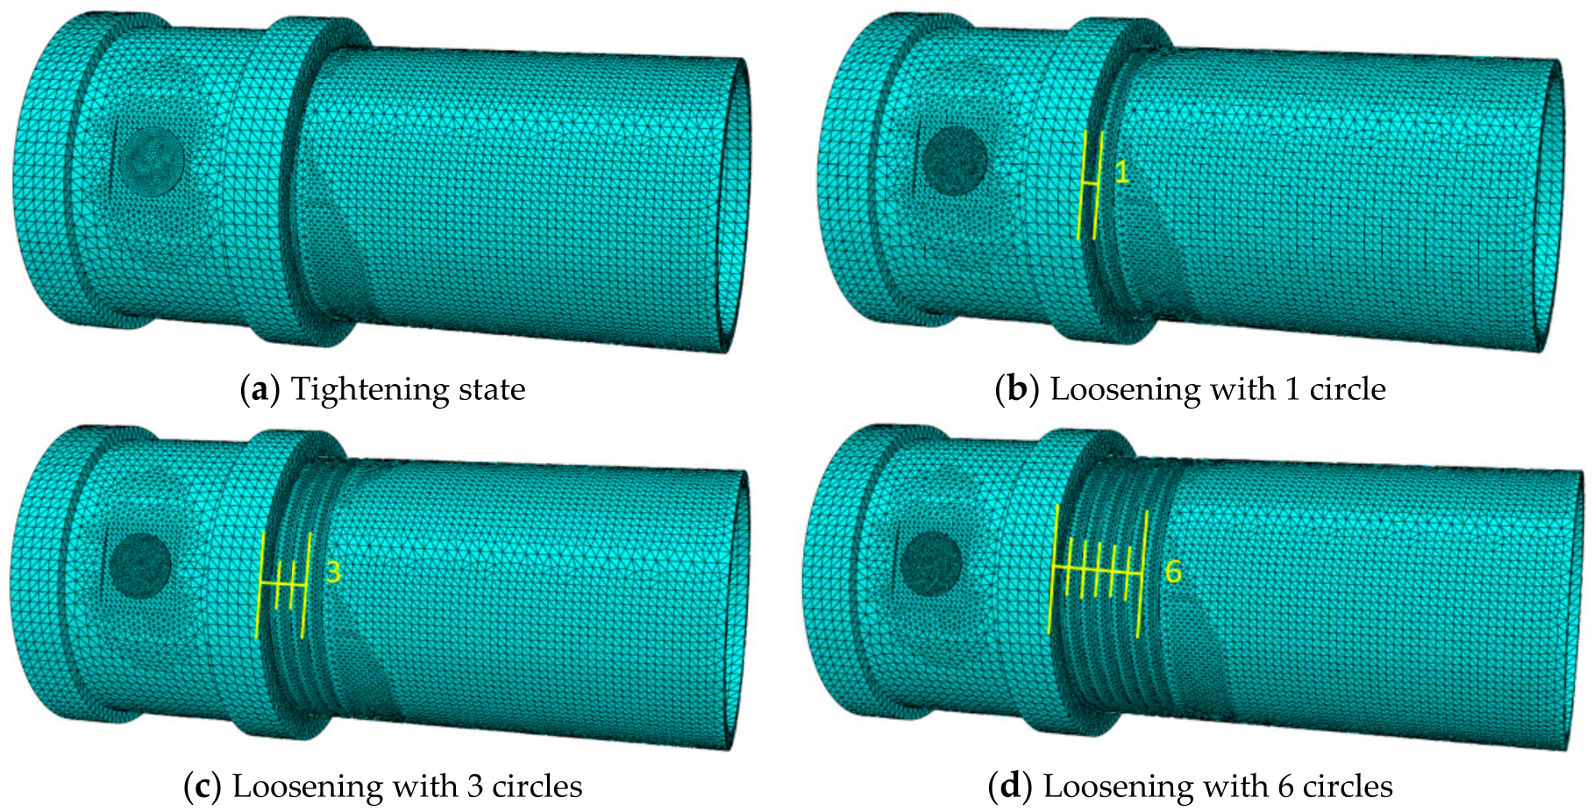
4. Numerical Simulation
4.1. Threaded Connection Model
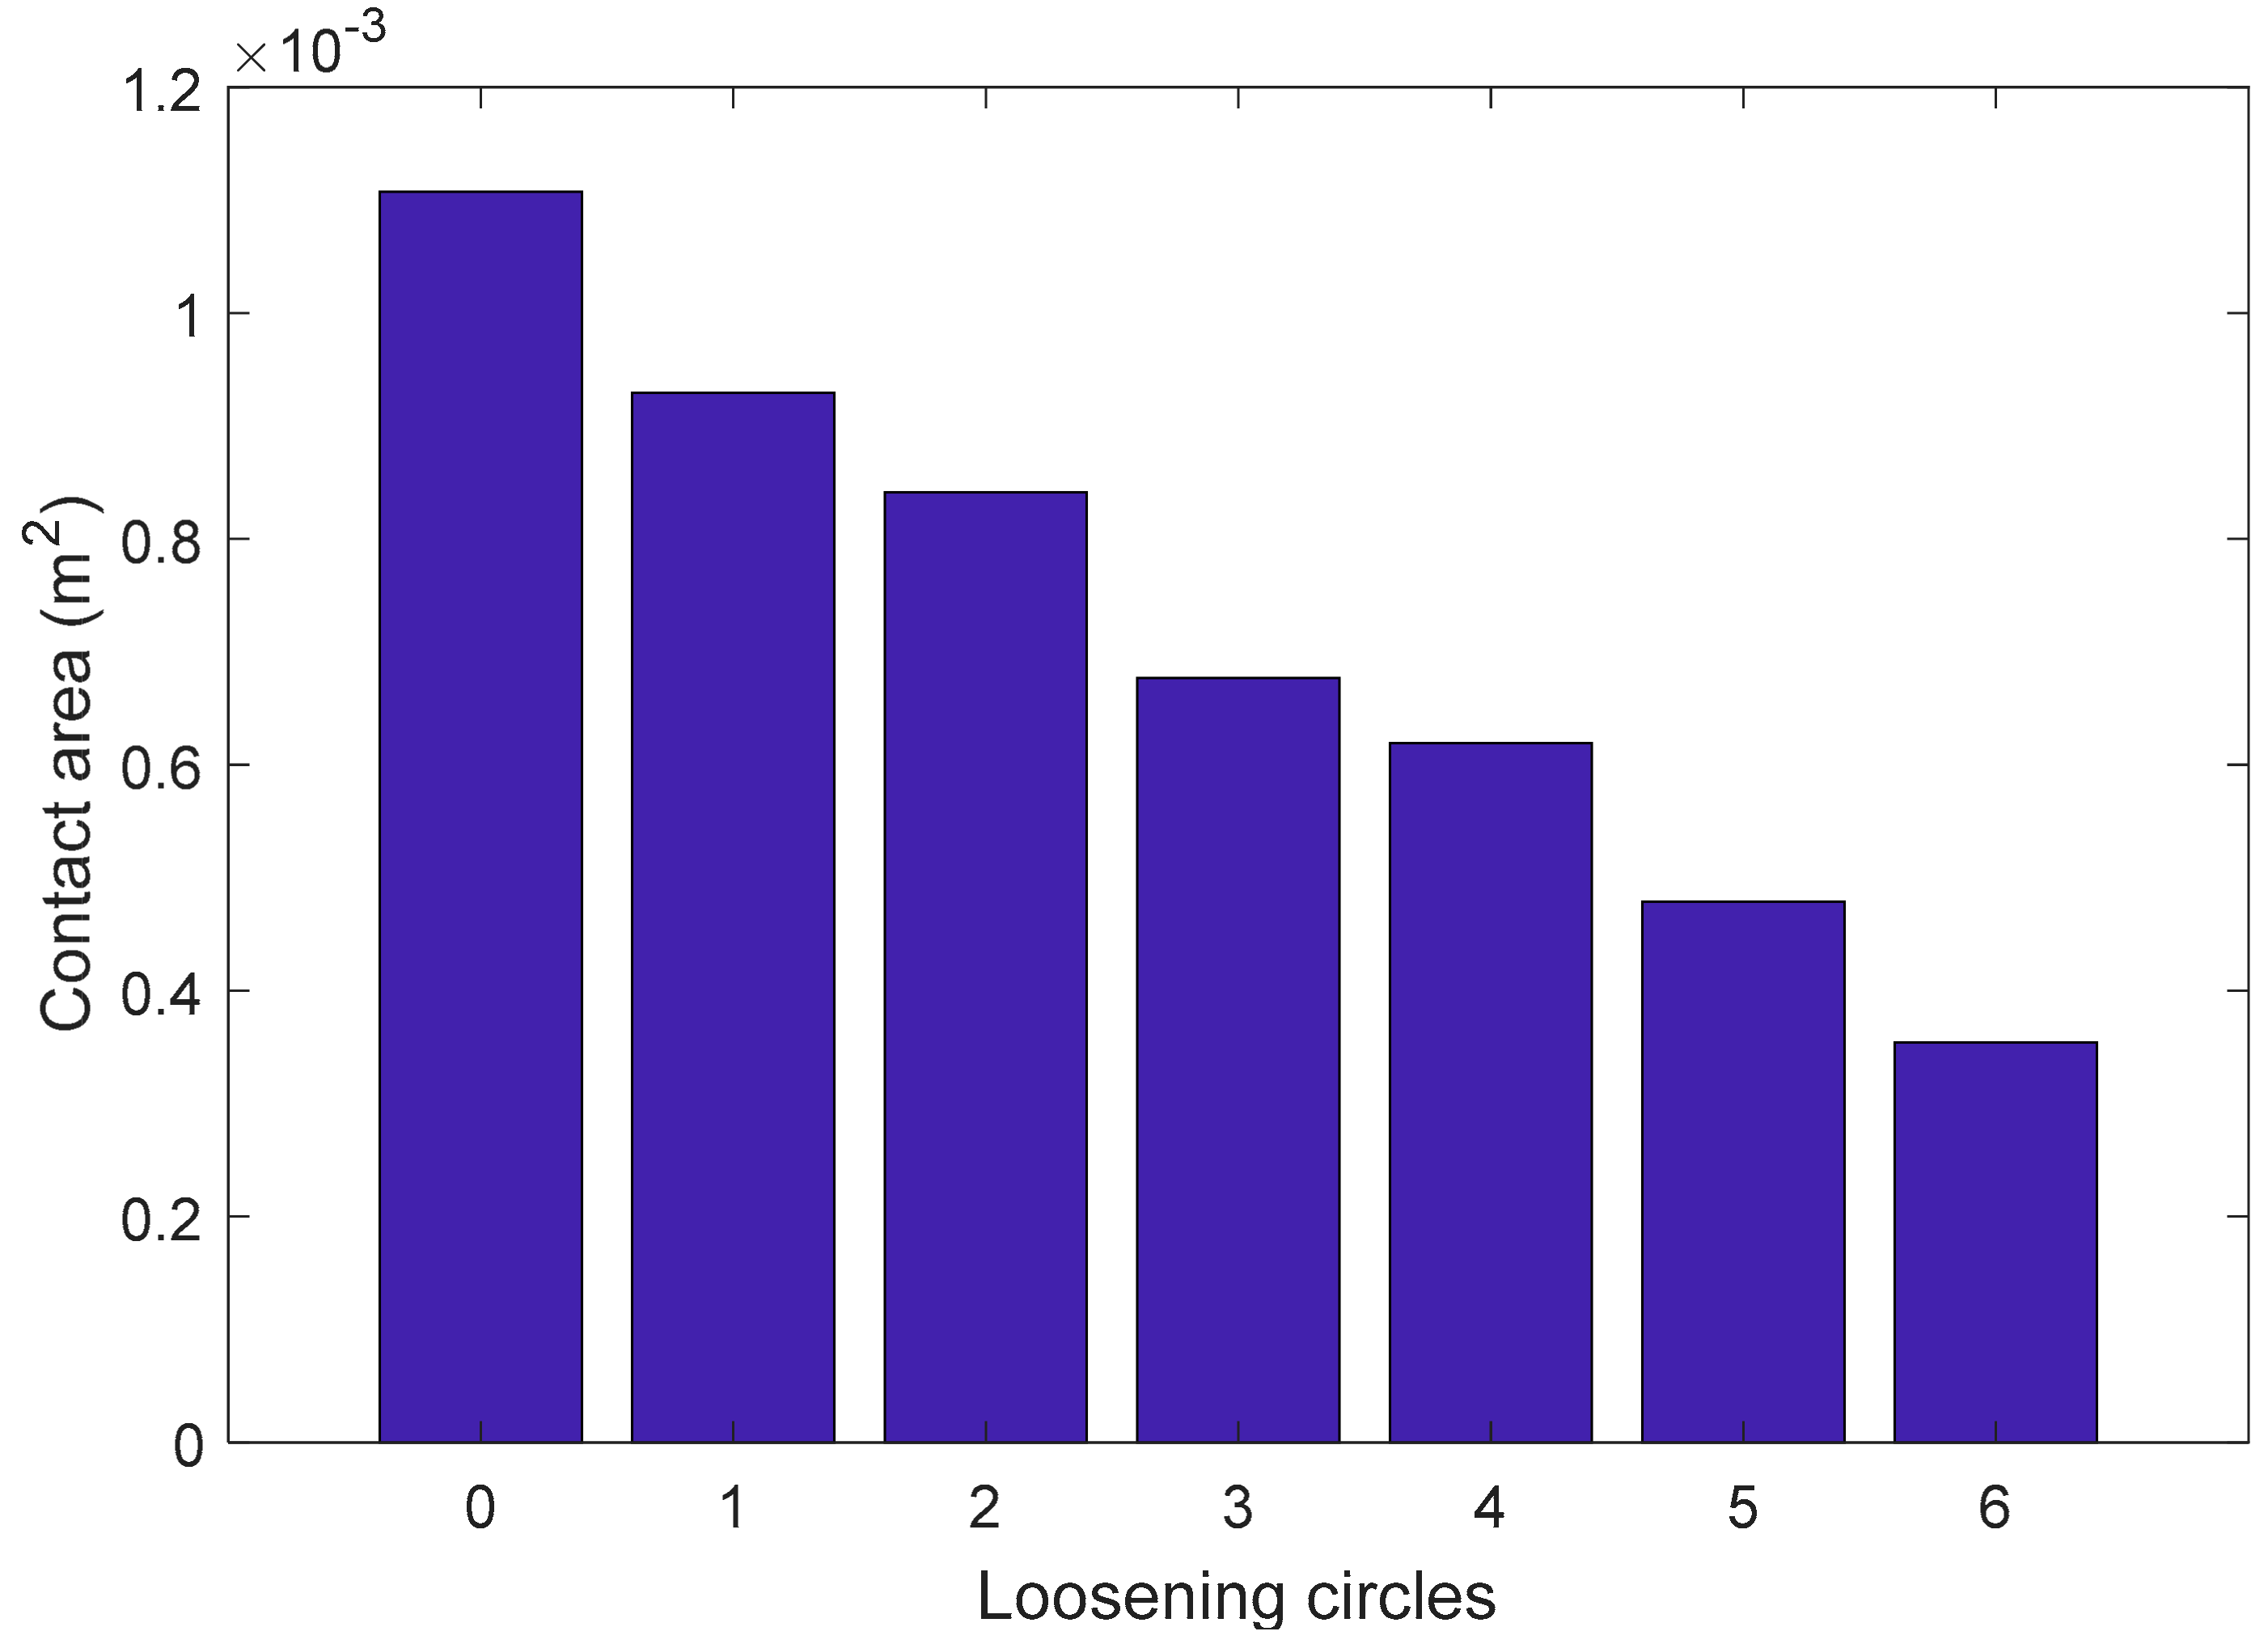
4.2. Simulation Results and Analysis
4.3. Discussion
5. Conclusions
Author Contributions
Funding
Conflicts of Interest
References
- Van Wittenberghe, J.; De Baets, P.; De Waele, W. Modeling of preloaded threaded pipe connections. In Proceedings of the 8th National Congress on Theoretical and Applied Mechanics (NCTAM 2009), Brussels, Belgium, 28–29 May 2009; pp. 149–156. [Google Scholar]
- Andrieux, S.; Leger, A. Multiple scaling method for the calculation of threaded assemblies. Comput. Method Appl. Mech. Eng. 1993, 102, 293–317. [Google Scholar] [CrossRef]
- Englund, R.B.; Johnson, D.H. Finite element analysis of a threaded connection compared to experimental and theoretical research. J. Eng. Technol. 1997, 14, 42–47. [Google Scholar]
- Tsai, M.; Morton, J. Stress and failure analysis of a pin-loaded composite plate: An experimental study. J. Compos. Mater. 1990, 24, 1101–1120. [Google Scholar] [CrossRef]
- Chen, S.J.; An, Q.; Zhang, Y.; Gao, L.X.; Li, Q. Loading analysis on the thread teeth in cylindrical pipe thread connection. J. Press. Vessel Technol. 2010, 132, 031202. [Google Scholar] [CrossRef]
- Niklès, M.; Vogel, B.H.; Briffod, F.; Grosswig, S.; Sauser, F.; Luebbecke, S.; Bals, A.; Pfeiffer, T. Leakage detection using fiber optics distributed temperature monitoring. In Proceedings of the 11th SPIE Annual International Symposium on Smart Structures and Materials, San Diego, CA, USA, 14–18 March 2004; pp. 18–26. [Google Scholar]
- Qu, Z.; Feng, H.; Zeng, Z.; Zhuge, J.; Jin, S. A SVM-based pipeline leakage detection and pre-warning system. Measurement 2010, 43, 513–519. [Google Scholar] [CrossRef]
- Liang, W.; Zhang, L.; Xu, Q.; Yan, C. Gas pipeline leakage detection based on acoustic technology. Eng. Fail. Anal. 2013, 31, 1–7. [Google Scholar] [CrossRef]
- Zhou, Y.; Jin, Y.; Zhang, S.; Sun, L. Distributed optical fiber sensing technology for pipeline leakage detection and location. Acta Pet. Sin. 2006, 2, 027. [Google Scholar]
- Liang, Y.; Feng, Q.; Li, D. Loosening monitoring of the threaded pipe connection using time reversal technique and piezoceramic transducers. Sensors 2018, 18, 2280. [Google Scholar] [CrossRef] [PubMed]
- Hong, X.; Wang, C.; Ruan, J.; Zhang, Z.; Wu, S.; Liu, G. Active monitoring of pipeline tapered thread connection based on time reversal using piezoceramic transducers. Smart Struct. Syst. 2016, 18, 643–662. [Google Scholar] [CrossRef]
- Galle, T.; De Waele, W.; Van Wittenberghe, J.; De Baets, P. Evaluation of a numerical model for tapered threaded connections subjected to combined loading using enhanced experimental measurement techniques. J. Strain. Anal. Eng. 2015, 50, 561–570. [Google Scholar] [CrossRef]
- Seys, J.; Roeygens, K.; Van Wittenberghe, J.; Galle, T.; De Baets, P.; De Waele, W. Failure behavior of preloaded API line pipe threaded connections. In Proceedings of the Sustainable Construction and Design 2011 (SCAD), Ghent, Belgium, 16–17 February 2011; Ghent University, Laboratory Soete: Ghent, Belgium, 2011; pp. 407–415. [Google Scholar]
- Van Wittenberghe, J.; De Baets, P.; De Waele, W.; De Pauw, J. Fatigue life improvement of threaded pipe couplings. In Proceedings of the ASME 2010 Pressure Vessels and Piping Division/K-PVP Conference, Believe, WA, USA, 18–22 July 2010; American Society of Mechanical Engineers: New York, NY, USA, 2010; pp. 559–566. [Google Scholar]
- Van Wittenberghe, J.; De Baets, P.; De Waele, W.; De Pauw, J. The Influence of Connection Geometry on the Fatigue Life of National Pipe Thread Threaded Pipe Couplings. J. Press. Vessel Technol. 2013, 135, 011201. [Google Scholar] [CrossRef]
- Van Wittenberghe, J.; De Baets, P.; De Waele, W.; Galle, T.; Bui, T.T.; De Roeck, G. Design characteristics that improve the fatigue life of threaded pipe connections. In Proceedings of the Sustainable Construction and Design 2011 (SCAD), Ghent, Belgium, 16–17 February 2011; Ghent University, Laboratory Soete: Ghent, Belgium, 2011; pp. 334–341. [Google Scholar]
- Park, G.; Cudney, H.H.; Inman, D.J. An integrated health monitoring technique using structural impedance sensors. J. Intell. Mater. Syst. Struct. 2000, 11, 448–455. [Google Scholar] [CrossRef]
- Peairs, D.M.; Park, G.; Inman, D.J. Improving accessibility of the impedance-based structural health monitoring method. J. Intell. Mater. Syst. Struct. 2004, 15, 129–139. [Google Scholar] [CrossRef]
- Hu, X.; Zhu, H.; Wang, D. A study of concrete slab damage detection based on the electromechanical impedance method. Sensors 2014, 14, 19897–19909. [Google Scholar] [CrossRef] [PubMed]
- Armstrong, T.W.; Sevostianov, I. Electrical impedance changes due to cracks in planar conductive structural elements. Struct. Health. Monit. 2015, 14, 489–501. [Google Scholar] [CrossRef]
- Wang, D.; Song, H.; Zhu, H. Electromechanical impedance analysis on piezoelectric smart beam with a crack based on spectral element method. Math. Probl. Eng. 2015, 2015, 713501. [Google Scholar] [CrossRef]
- Na, W.S.; Baek, J. A review of the piezoelectric electromechanical impedance based structural health monitoring technique for engineering structures. Sensors 2018, 18, 1307. [Google Scholar] [CrossRef] [PubMed]
- Liang, C.; Sun, F.; Rogers, C. Coupled electro-mechanical analysis of adaptive material systems—Determination of the actuator power consumption and system energy transfer. J. Intell. Mater. Syst. Struct. 1994, 5, 12–20. [Google Scholar] [CrossRef]
- Li, W.; Fan, S.; Ho, S.C.M.; Wu, J.; Song, G. Interfacial debonding detection in fiber-reinforced polymer rebar–reinforced concrete using electro-mechanical impedance technique. Struct. Health. Monit. 2018, 17, 461–471. [Google Scholar] [CrossRef]
- Liang, Y.; Li, D.; Parvasi, S.M.; Kong, Q.; Song, G. Bond-slip detection of concrete-encased composite structure using electro-mechanical impedance technique. Smart Mater. Struct. 2016, 25, 095003. [Google Scholar] [CrossRef]
- Fan, S.; Zhao, S.; Qi, B.; Kong, Q. Damage Evaluation of Concrete Column under Impact Load Using a Piezoelectric-Based EMI Technique. Sensors 2018, 18, 1591. [Google Scholar] [CrossRef] [PubMed]
- Song, G.; Li, W.; Wang, B.; Ho, S.C.M. A review of rock bolt monitoring using smart sensors. Sensors 2017, 17, 776. [Google Scholar] [CrossRef] [PubMed]
- Narayanan, A.; Kocherla, A.; Subramaniam, K.V. Understanding the coupled electromechanical response of a PZT patch attached to concrete: Influence of substrate size. Measurement 2018, 124, 505–514. [Google Scholar] [CrossRef]
- Malinowski, P.; Wandowski, T.; Ostachowicz, W. The use of electromechanical impedance conductance signatures for detection of weak adhesive bonds of carbon fibre–reinforced polymer. Struct. Health Monit. 2015, 14, 332–344. [Google Scholar] [CrossRef]
- Fiborek, P.; Malinowski, P.H.; Kudela, P.; Wandowski, T.; Ostachowicz, W.M. Time-domain spectral element method for modelling of the electromechanical impedance of disbonded composites. J. Intell. Mater. Syst. Struct. 2018, 29. [Google Scholar] [CrossRef]
- An, Y.K.; Sohn, H. Integrated impedance and guided wave based damage detection. Mech. Syst. Signal Process. 2012, 28, 50–62. [Google Scholar] [CrossRef]
- Sevillano, E.; Sun, R.; Perera, R. Damage detection based on power dissipation measured with PZT sensors through the combination of electro-mechanical impedances and guided waves. Sensors 2016, 16, 639. [Google Scholar] [CrossRef] [PubMed]
- Perera, R.; Pérez, A.; García-Diéguez, M.; Zapico-Valle, J.L. Active Wireless System for Structural Health for Structural Health Monitoring Applications. Sensors 2017, 17, 2880. [Google Scholar] [CrossRef] [PubMed]
- Shao, J.; Wang, T.; Yin, H.; Yang, D.; Li, Y. Bolt looseness detection based on piezoelectric impedance frequency shift. Appl. Sci. 2016, 6, 298. [Google Scholar] [CrossRef]
- Wandowski, T.; Opoka, S.; Malinowski, P.; Ostachowicz, W. The performance of three Electromechanical Impedance damage indicators on structural element with bolted joints. In Proceeding of the International Symposium on NDT in Aerospace Symposium, Bremen, Germany, 16–18 November 2015. [Google Scholar]
- Huo, L.; Chen, D.; Liang, Y.; Li, H.; Feng, X.; Song, G. Impedance based bolt pre-load monitoring using piezoceramic smart washer. Smart Mater. Struct. 2017, 26, 057004. [Google Scholar] [CrossRef]
- Liang, Y.; Li, D.; Parvasi, S.M.; Song, G. Load monitoring of pin-connected structures using piezoelectric impedance measurement. Smart Mater. Struct. 2016, 25, 105011. [Google Scholar] [CrossRef]
- Fan, S.; Li, W.; Kong, Q.; Feng, Q.; Song, G. Monitoring of pin connection loosening using eletromechanical impedance: Numerical simulation with experimental verification. J. Intell. Mater. Syst. Struct. 2018, 29, 1964–1973. [Google Scholar] [CrossRef]
- Park, G.; Cudney, H.H.; Inman, D.J. Feasibility of using impedance-based damage assessment for pipeline structures. Earthq. Eng. Struct. Dyn. 2001, 30, 1463–1474. [Google Scholar] [CrossRef]
- Martowicz, A.; Sendecki, A.; Salamon, M.; Rosiek, M.; Uhl, T. Application of electromechanical impedance-based SHM for damage detection in bolted pipeline connection. Nondestruct. Test. Eval. 2016, 31, 17–44. [Google Scholar] [CrossRef]
- Van Wittenberghe, J. Experimental Analysis and Modelling of the Fatigue behavior of Threaded Pipe Connections. Ph.D. Thesis, Ghent University, Ghent, Belgium, 2011. [Google Scholar]
- Galle, T.; De Waele, W.; De Baets, P.; Van Wittenberghe, J. Influence of design features on the structural integrity of threaded pipe connections. In Proceedings of the Sustainable Construction and Design 2011 (SCAD), Ghent, Belgium, 16–17 February 2011; Ghent University, Laboratory Soete: Ghent, Belgium, 2011; pp. 237–245. [Google Scholar]
- TenarisHydril Premium Connections. Available online: http://www.tenaris.com/en/Products/PremiumConnections.aspx (accessed on 3 September 2018).
- Song, G.; Gu, H.; Mo, Y.-L. Smart aggregates: Multi-functional sensors for concrete structures—A tutorial and a review. Smart Mater. Struct. 2008, 17, 033001. [Google Scholar] [CrossRef]
- Kong, Q.; Robert, R.H.; Silva, P.; Mo, Y. Cyclic crack monitoring of a reinforced concrete column under simulated pseudo-dynamic loading using piezoceramic-based smart aggregates. Appl. Sci. 2016, 6, 341. [Google Scholar] [CrossRef]
- Kong, Q.; Chen, H.; Mo, Y.; Song, G. Real-time monitoring of water content in sandy soil using shear mode piezoceramic transducers and active sensing-A feasibility study. Sensors 2017, 17, 2395. [Google Scholar] [CrossRef] [PubMed]
- Qian, F.; Kong, Q.; Jiang, J.; Liang, Y.; Song, G. Detection of interfacial debonding in a rubber-steel-layered structure using active sensing enable by embedded piezoceramic transducers. Sensors 2017, 17, 2001. [Google Scholar]
- Du, G.; Kong, Q.; Zhou, H.; Gu, H. Multiple cracks detection in pipeline using damage index matrix based on piezoceramic transducer-enabled stress wave propagation. Sensors 2017, 17, 1812. [Google Scholar] [CrossRef] [PubMed]
- Kong, Q.; Hou, S.; Ji, Q.; Mo, Y.; Song, G. Very early age concrete hydration characterization monitoring using piezoceramic based smart aggregates. Smart Mater. Struct. 2013, 22, 085025. [Google Scholar] [CrossRef]
- Giurgiutiu, V.; Reynolds, A.; Rogers, C.A. Experimental investigation of E/M impedance health monitoring for spot-welded structural joints. J. Intell. Mater. Syst. Struct. 1999, 10, 802–812. [Google Scholar] [CrossRef]
- Yang, Y.; Hu, Y.; Lu, Y. Sensitivity of PZT impedance sensors for damage detection of concrete structures. Sensors 2008, 8, 327–346. [Google Scholar] [CrossRef] [PubMed]
- Wang, D.; Wang, Q.; Wang, H.; Zhu, H. Experimental study on damage detection in timber specimens based on an electromechanical impedance technique and RMSD-based mahalanobis distance. Sensors 2016, 16, 1765. [Google Scholar] [CrossRef] [PubMed]
- Farrar, C.; Park, G.; Sohn, H.; Inman, D.J. Overview of piezoelectric impedance-based health monitoring and path forward. Shock Vib. Digest 2003, 35, 451–463. [Google Scholar]
- Moro, A.; Farina, C.; Rossi, F. Measurement of ultrasonic wave velocity in steel for various structures and degrees of cold-working. NDT Int. 1980, 13, 169–175. [Google Scholar] [CrossRef]
- Wiskel, J.B.; Kennedy, J.; Ivey, D.G.; Henein, H. Ultrasonic velocity evaluation of three grades of heat treated steel. In Proceedings of the NDT Canada Conference, Edmonton, AB, Canada, 15–17 June 2015. [Google Scholar]
- Baptista, F.G.; Budoya, D.E.; de Almeida, V.A.; Ulson, J.A.C. An experimental study on the effect of temperature on piezoelectric sensors for impedance-based structural health monitoring. Sensors 2014, 14, 1208–1227. [Google Scholar] [CrossRef] [PubMed]
- Wandowski, T.; Malinowski, P.H.; Ostachowicz, W.M. Delamination detection in CFRP panels using EMI method with temperature compensation. Compos. Struct. 2016, 151, 99–107. [Google Scholar] [CrossRef]


| Components | Parameters | Values | Unit |
|---|---|---|---|
| Steel specimen | Diameter (pipe segment) | 48 (42) 1 | mm |
| Diameter (coupling part) | 60 (45) 1 | mm | |
| Density | 7900 | Kg/m3 | |
| Young’s modulus | 206 | Gpa | |
| Poisson’s ratio | 0.3 | — | |
| Static friction coefficient (steel–steel) | 0.15 | — | |
| PZT-5H | Dimension | 0.5 | mm |
| Density | 7800 | Kg/m3 | |
| Young’s modulus | 46 | Gpa | |
| Poisson’s ratio | 0.3 | — | |
| Structural damping | 3 10−9 | — | |
| Dielectric loss factor | 0.02 | — | |
| Mechanical loss factor | 0.001 | — | |
| Piezoelectric strain coefficients d31, d32/d33/d24, d15 | −2.10/5.00/5.80 | 10−10 m/V or 10−10 C/N | |
| Electric permittivity , / | 1.75/2.12 | 10−8 F/m |
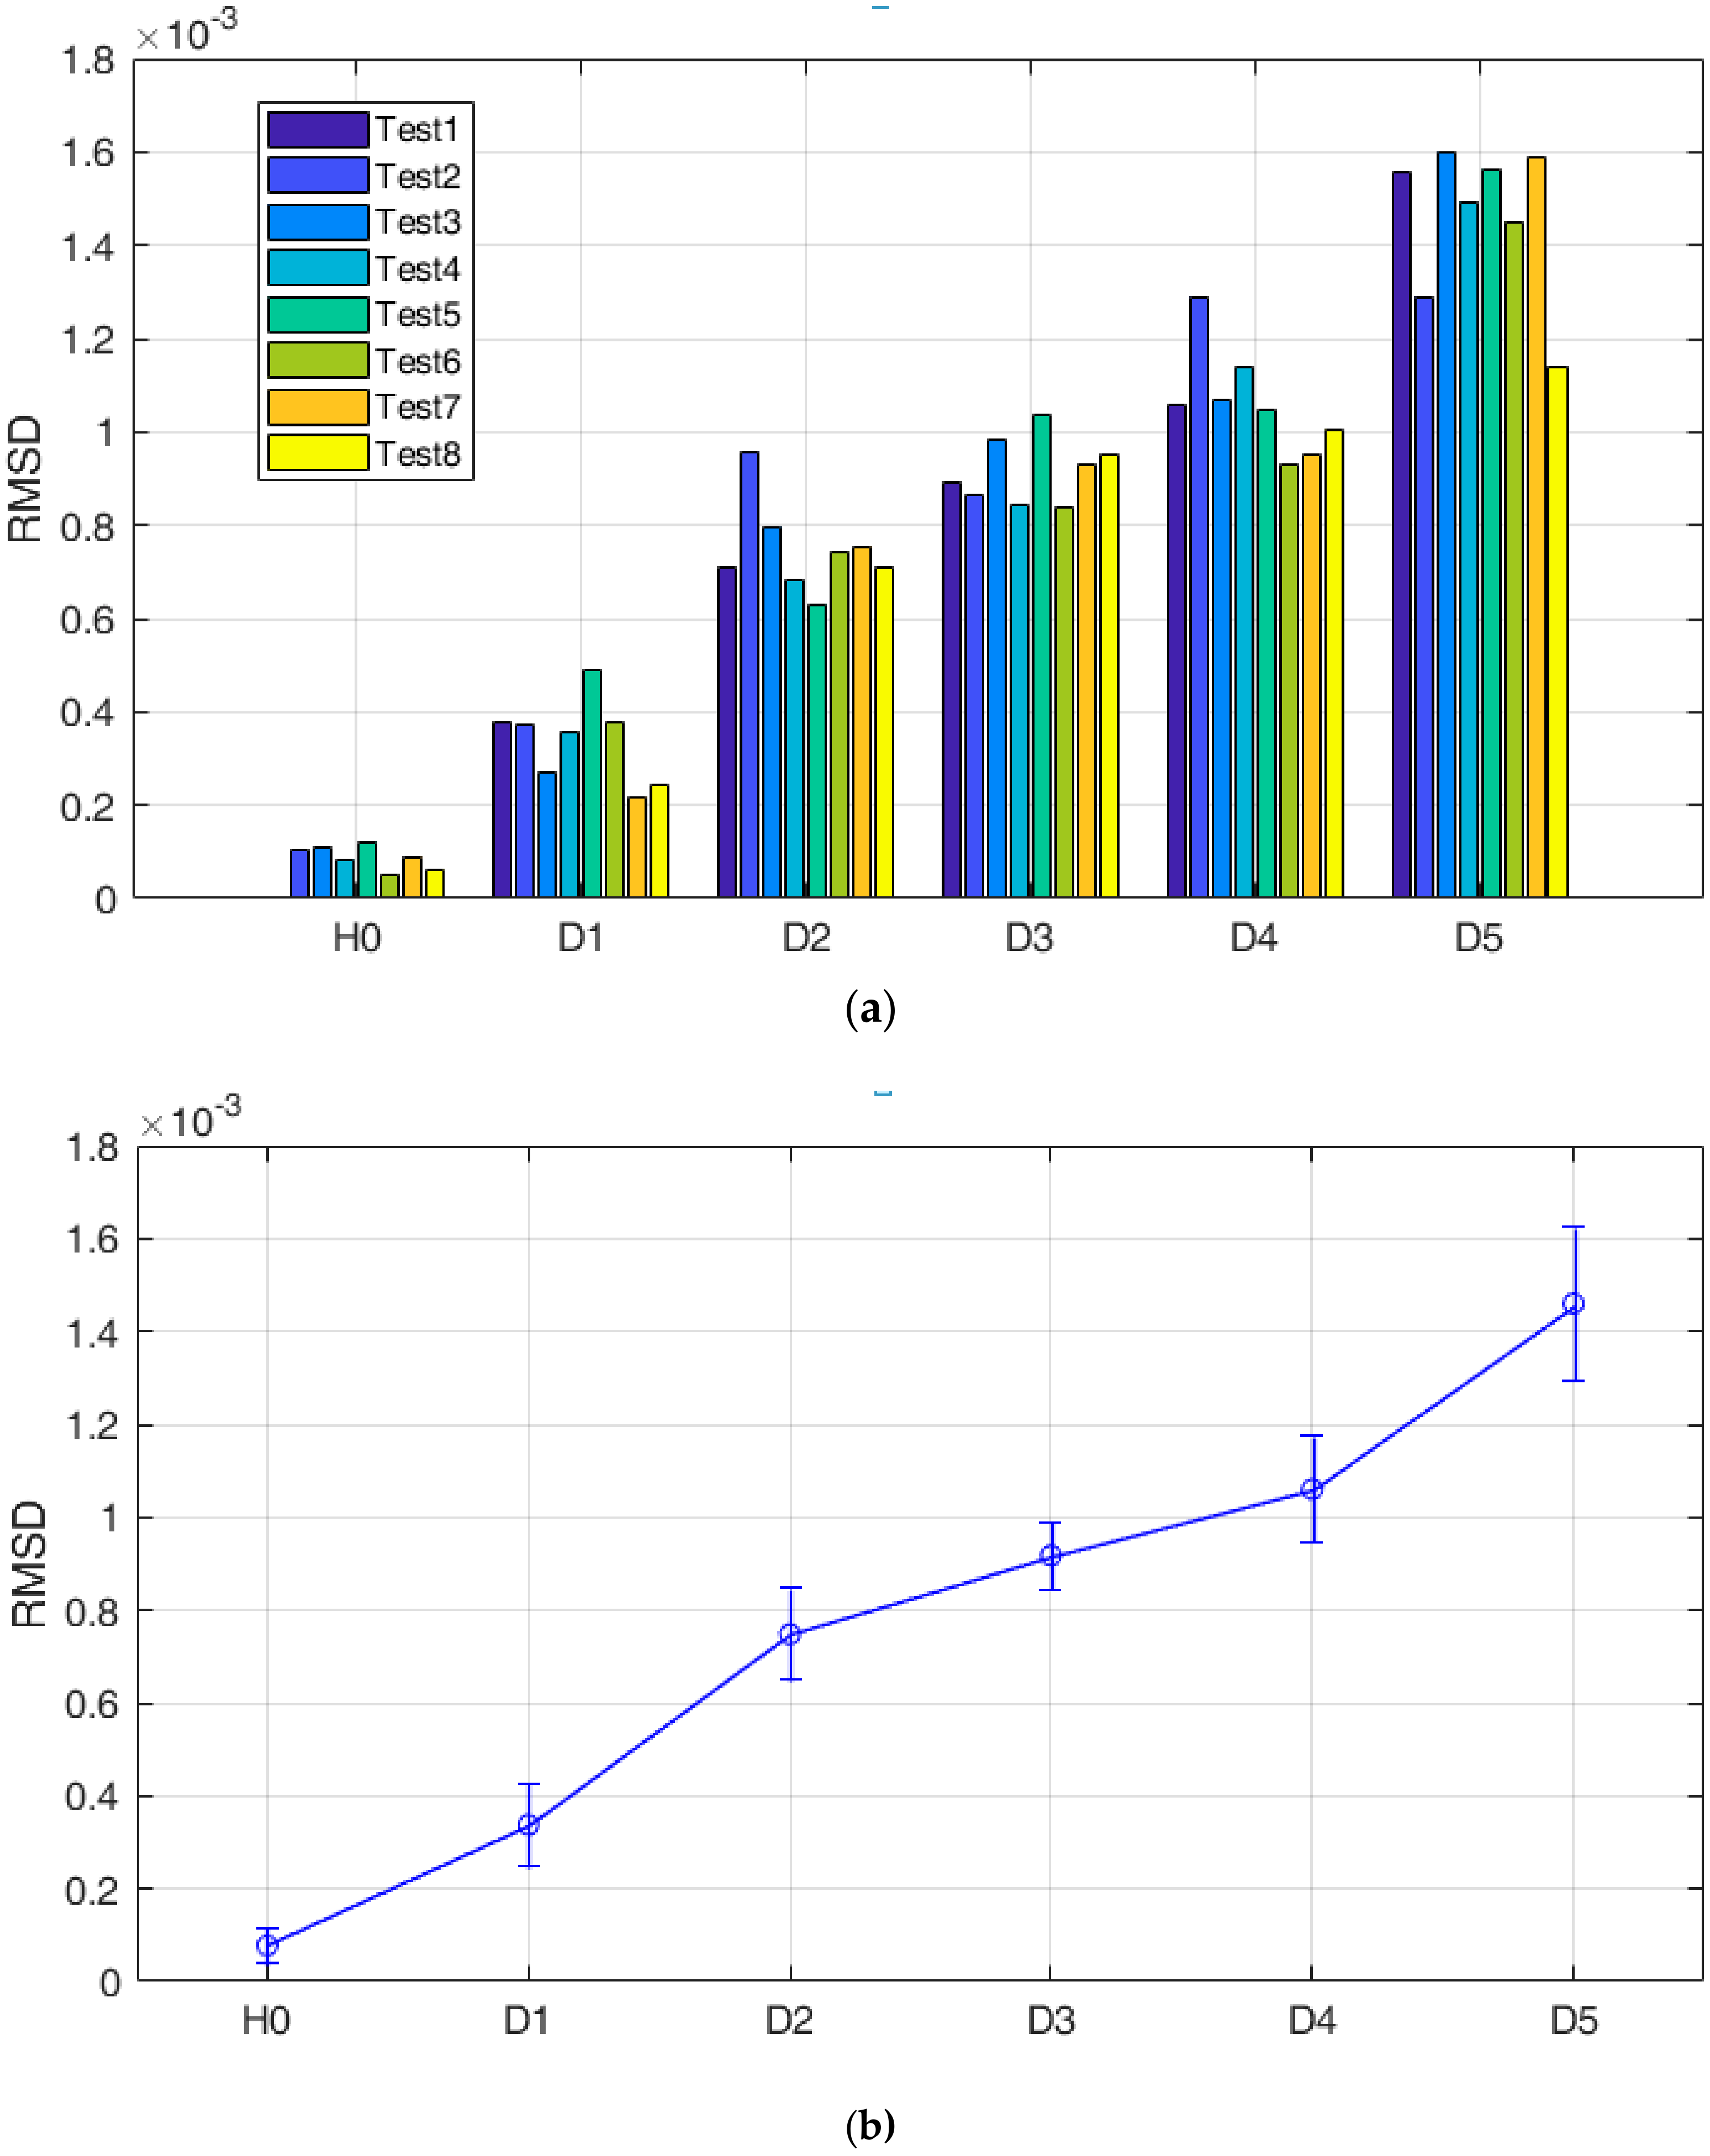
| Status | Mean | Std. |
|---|---|---|
| H0 | 7.79 × 10⁻⁵ | 3.90 × 10⁻⁵ |
| D1 | 3.37 × 10⁻⁴ | 8.86 × 10⁻⁵ |
| D2 | 7.48 × 10⁻⁴ | 9.86 × 10⁻⁵ |
| D3 | 9.17 × 10⁻⁴ | 7.15 × 10⁻⁵ |
| D4 | 1.06 × 10⁻³ | 1.14 × 10⁻⁴ |
| D5 | 1.50 × 10⁻³ | 1.64 × 10⁻⁴ |
| Loosening Rotation Circles | 0 | 1 | 2 | 3 | 4 | 5 | 6 |
|---|---|---|---|---|---|---|---|
| Contact area (10−4 m2) | 11 | 9.29 | 8.41 | 6.77 | 6.19 | 4.79 | 3.54 |
© 2018 by the authors. Licensee MDPI, Basel, Switzerland. This article is an open access article distributed under the terms and conditions of the Creative Commons Attribution (CC BY) license (http://creativecommons.org/licenses/by/4.0/).
Share and Cite
Liang, Y.; Feng, Q.; Li, D.; Cai, S. Loosening Monitoring of a Threaded Pipe Connection Using the Electro-Mechanical Impedance Technique—Experimental and Numerical Studies. Sensors 2018, 18, 3699. https://0-doi-org.brum.beds.ac.uk/10.3390/s18113699
Liang Y, Feng Q, Li D, Cai S. Loosening Monitoring of a Threaded Pipe Connection Using the Electro-Mechanical Impedance Technique—Experimental and Numerical Studies. Sensors. 2018; 18(11):3699. https://0-doi-org.brum.beds.ac.uk/10.3390/s18113699
Chicago/Turabian StyleLiang, Yabin, Qian Feng, Dongsheng Li, and Sijia Cai. 2018. "Loosening Monitoring of a Threaded Pipe Connection Using the Electro-Mechanical Impedance Technique—Experimental and Numerical Studies" Sensors 18, no. 11: 3699. https://0-doi-org.brum.beds.ac.uk/10.3390/s18113699