Flood Hazard Assessment of the Urban Area of Tabuk City, Kingdom of Saudi Arabia by Integrating Spatial-Based Hydrologic and Hydrodynamic Modeling


Abstract
:1. Introduction
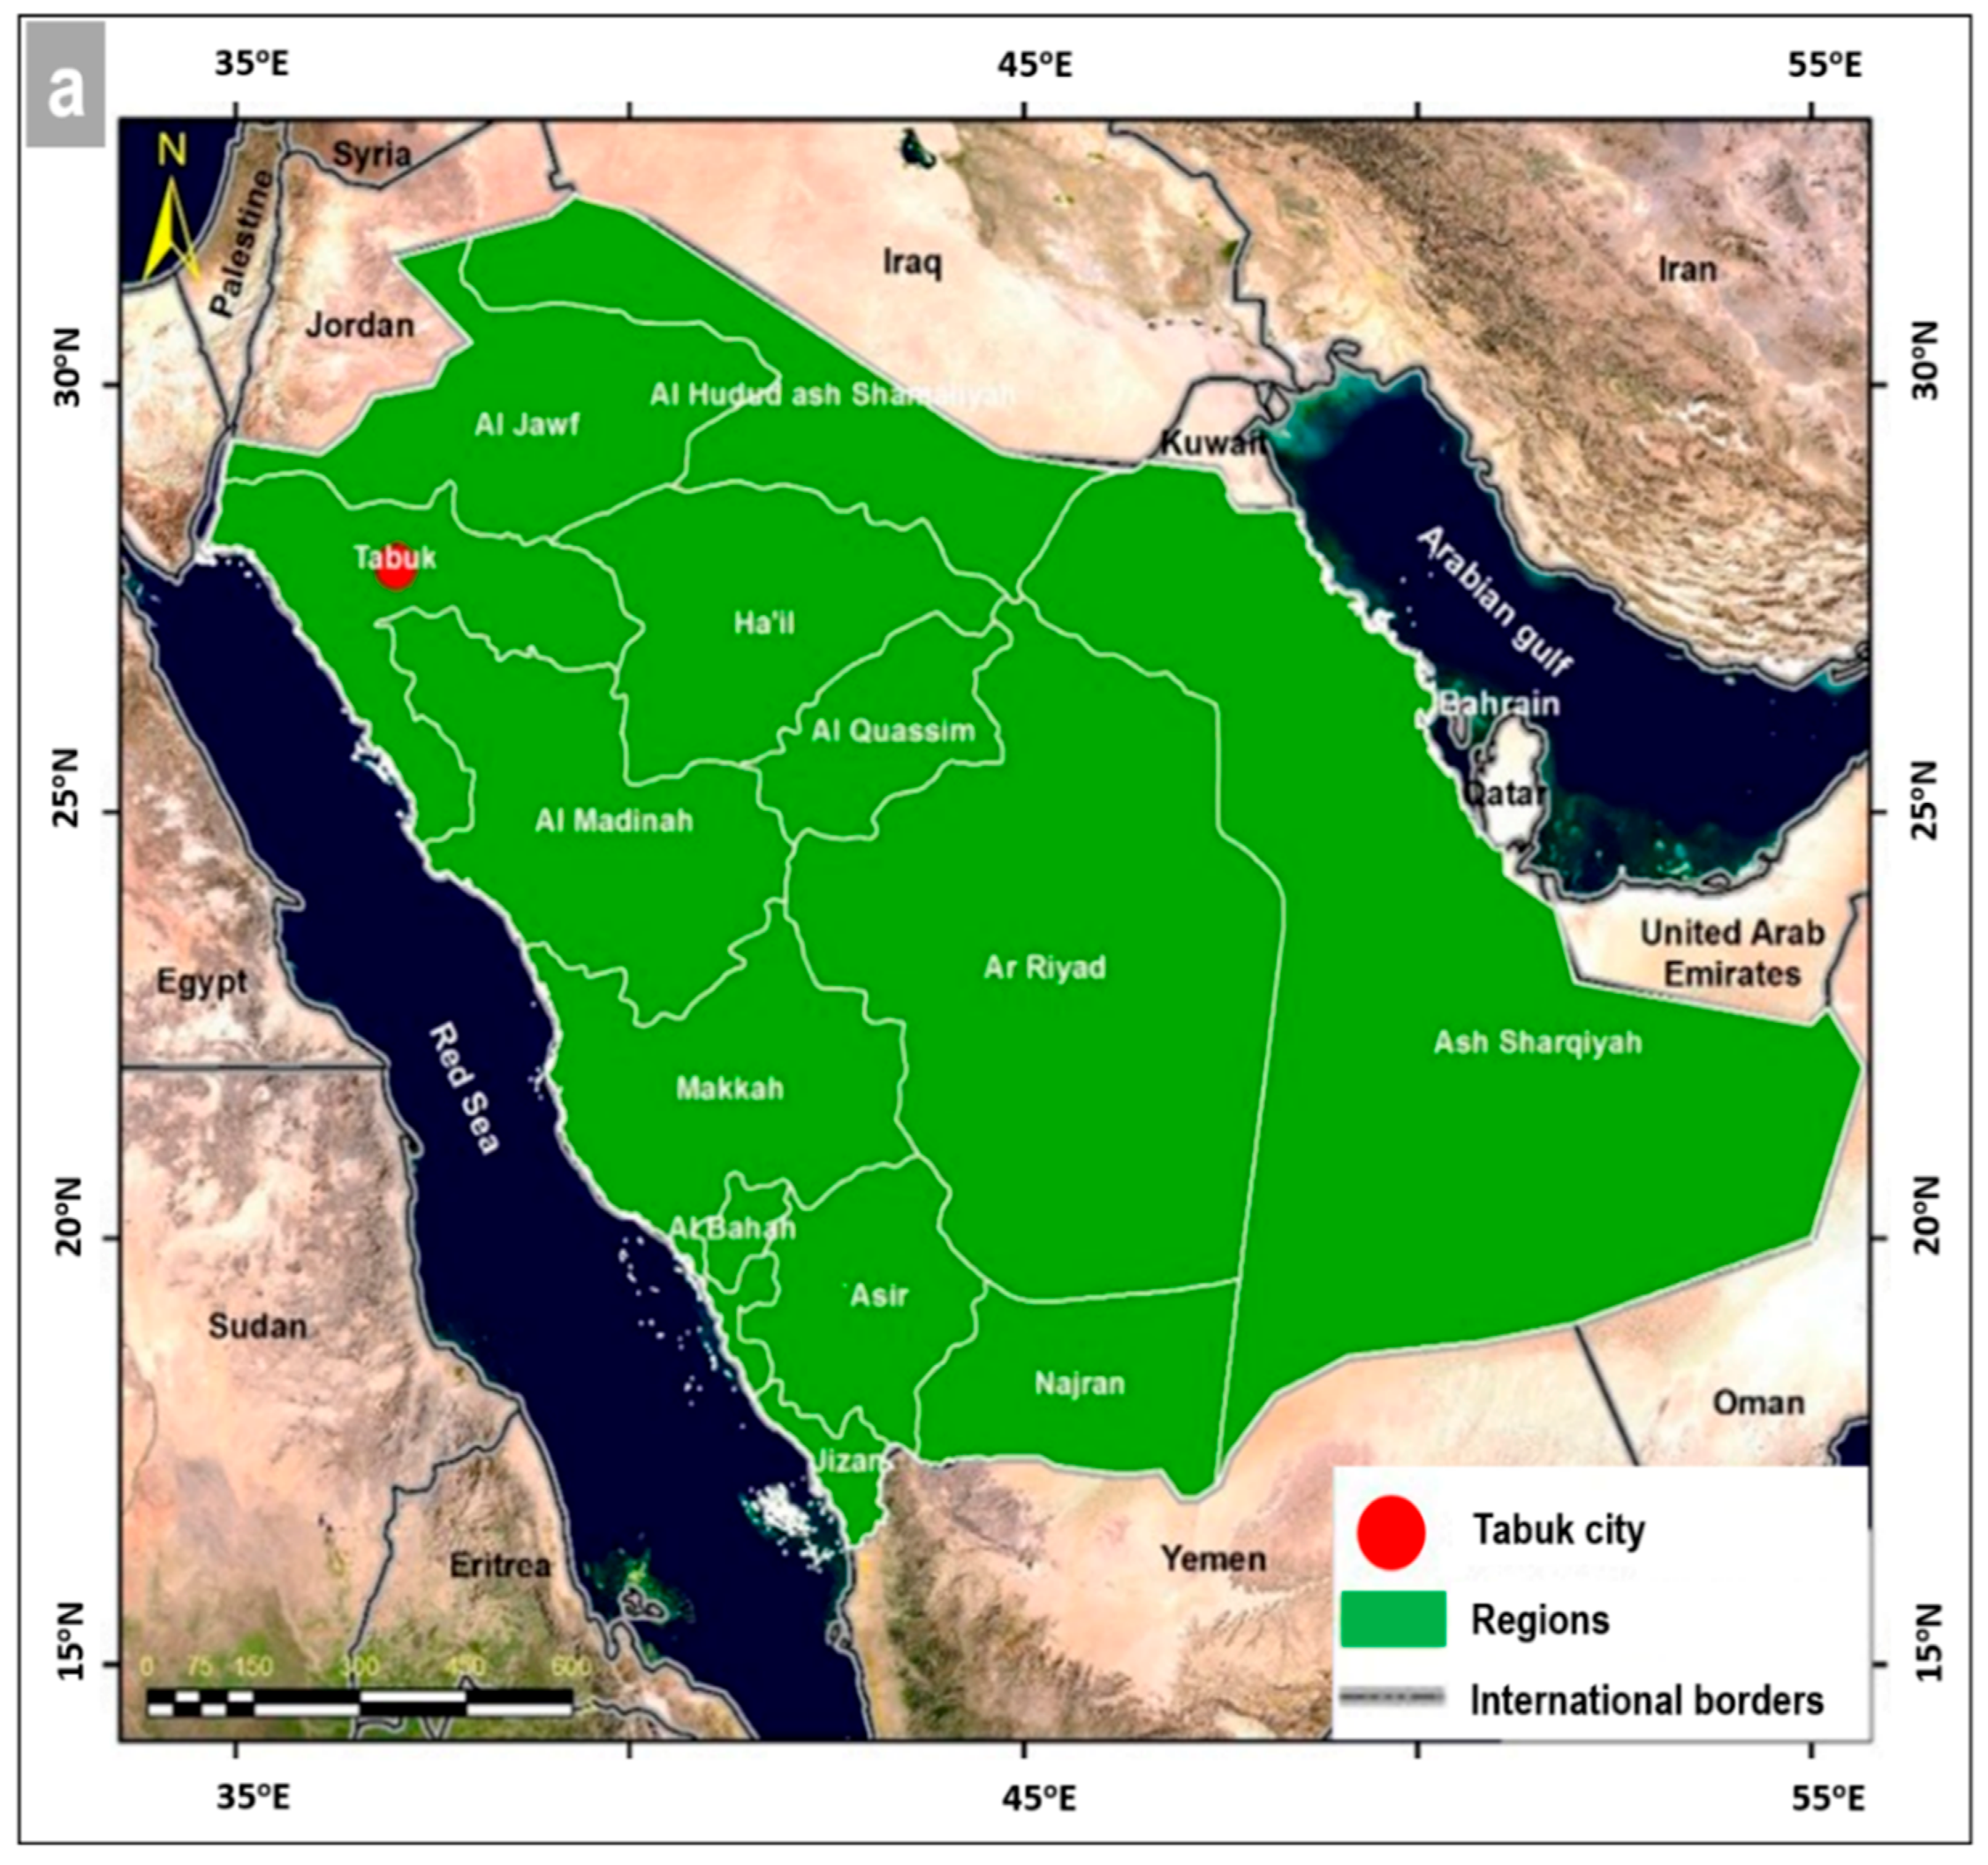
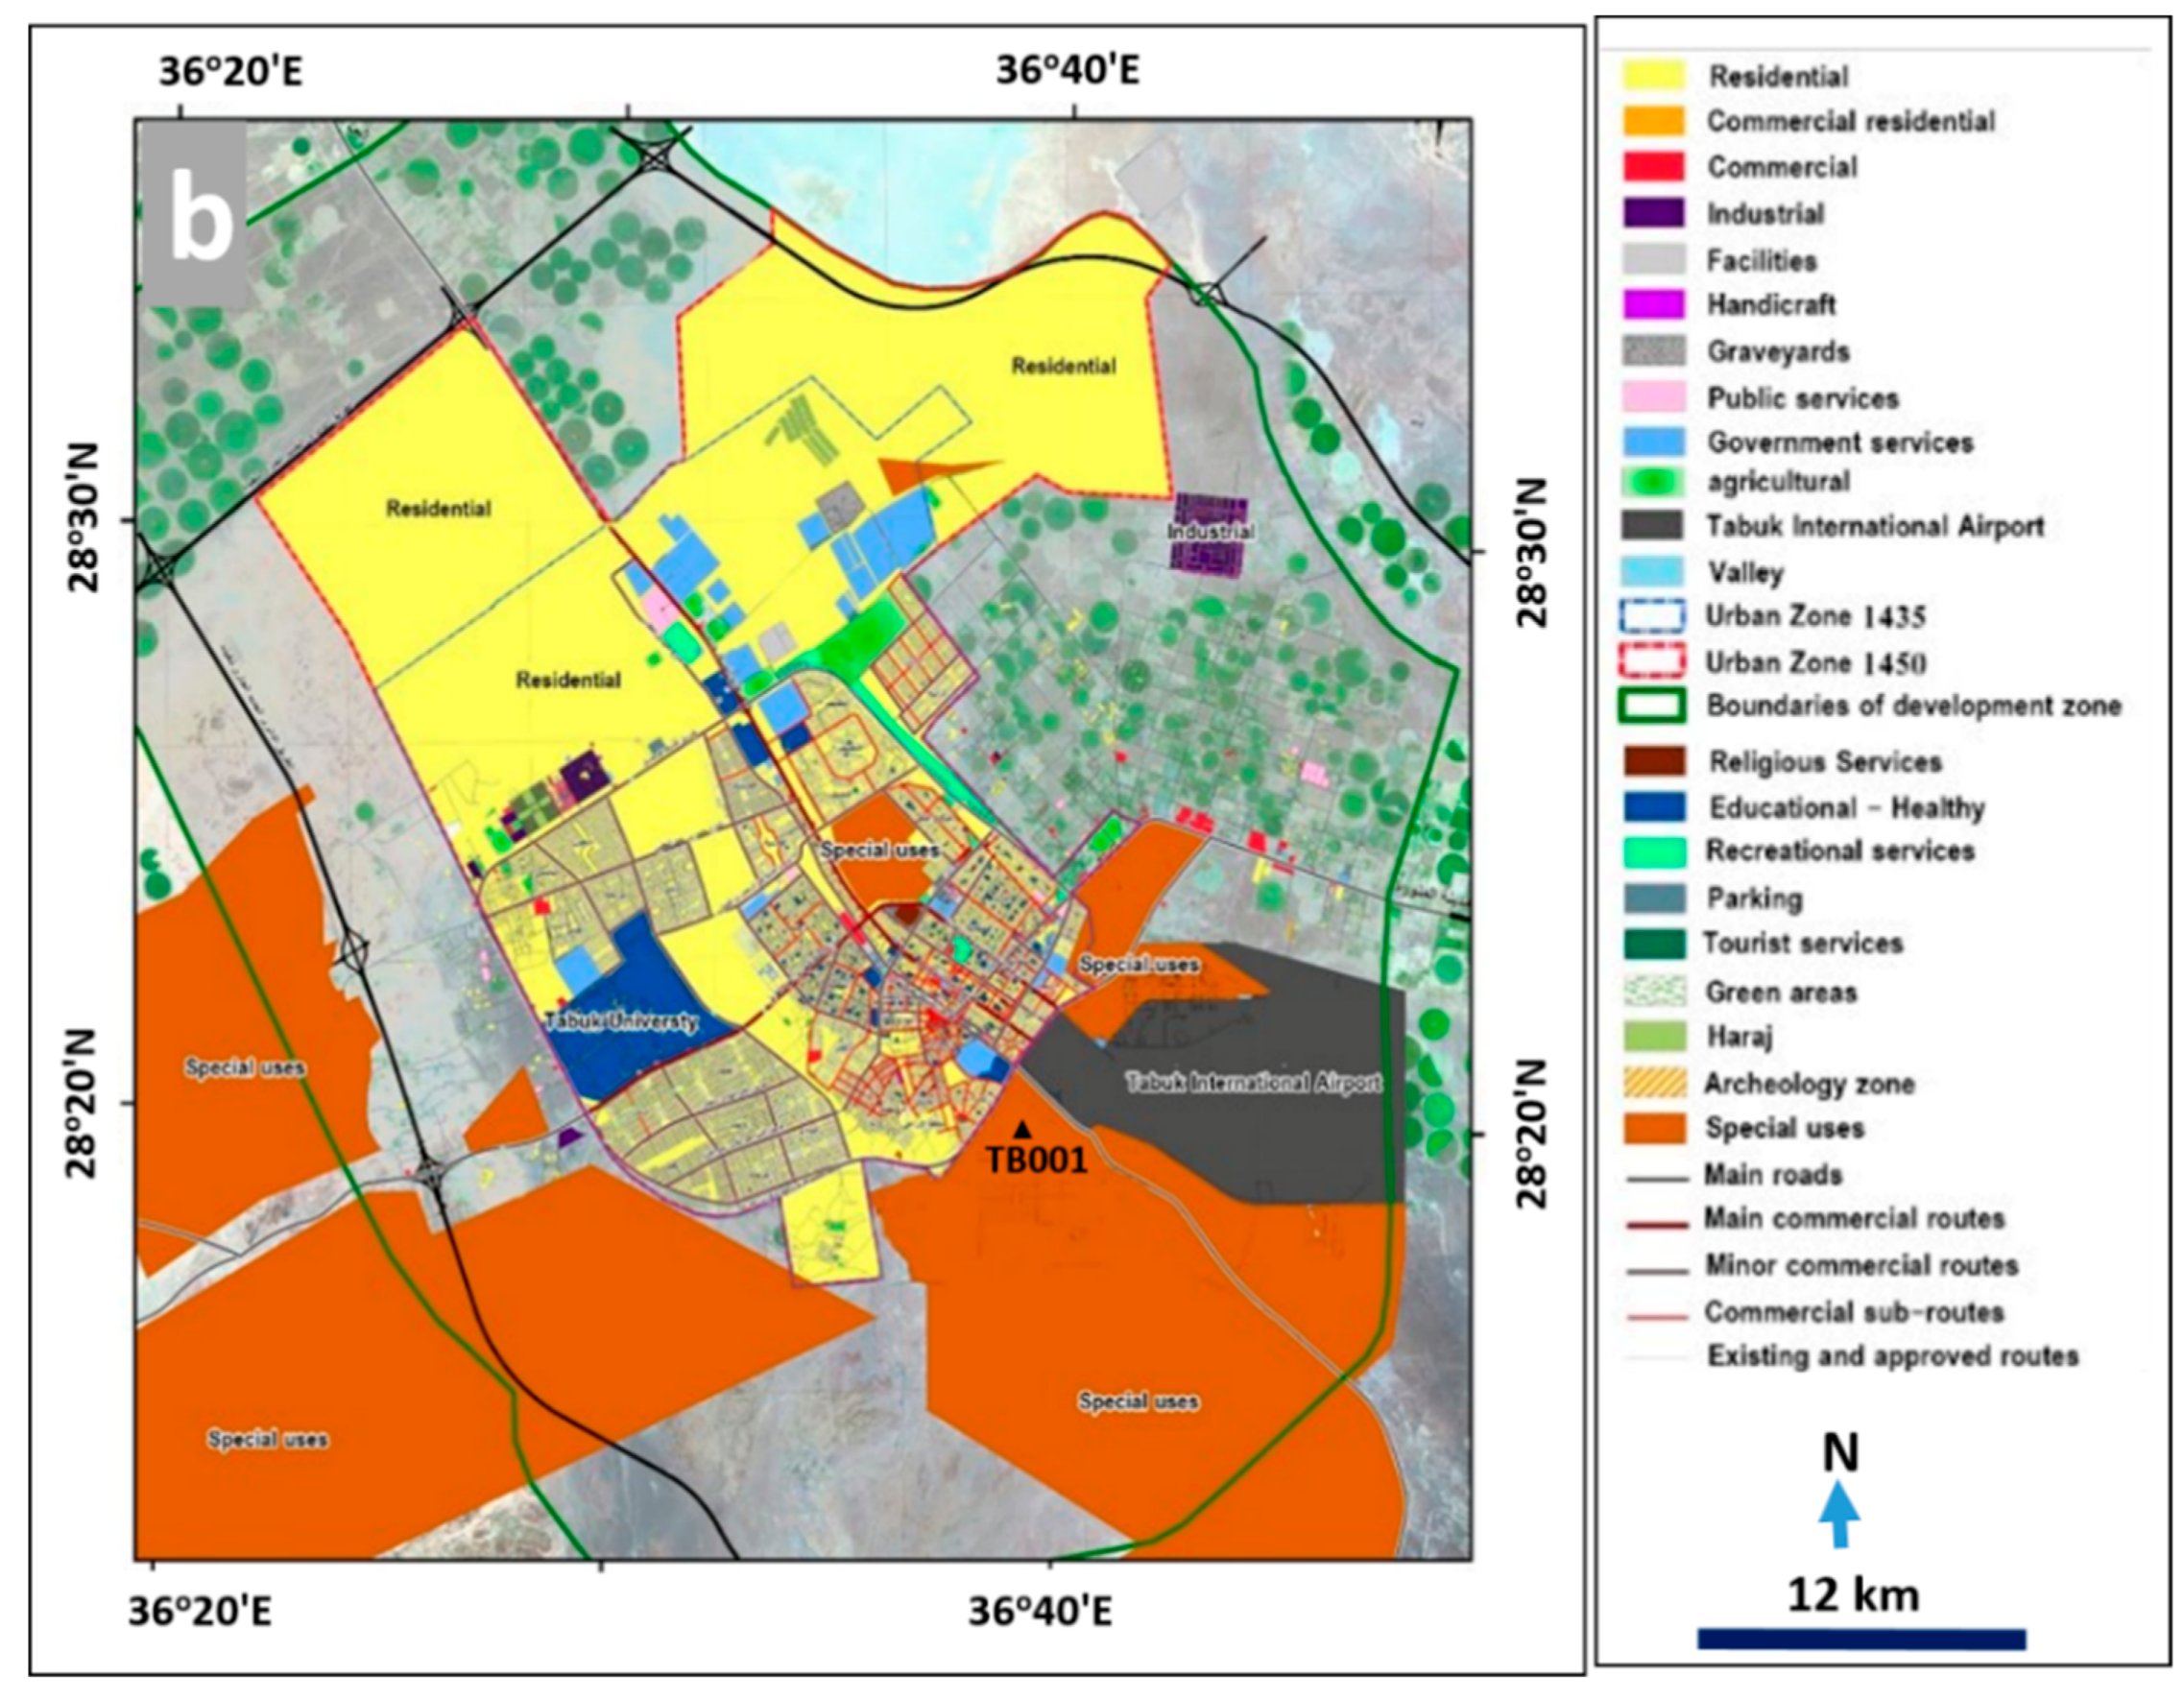
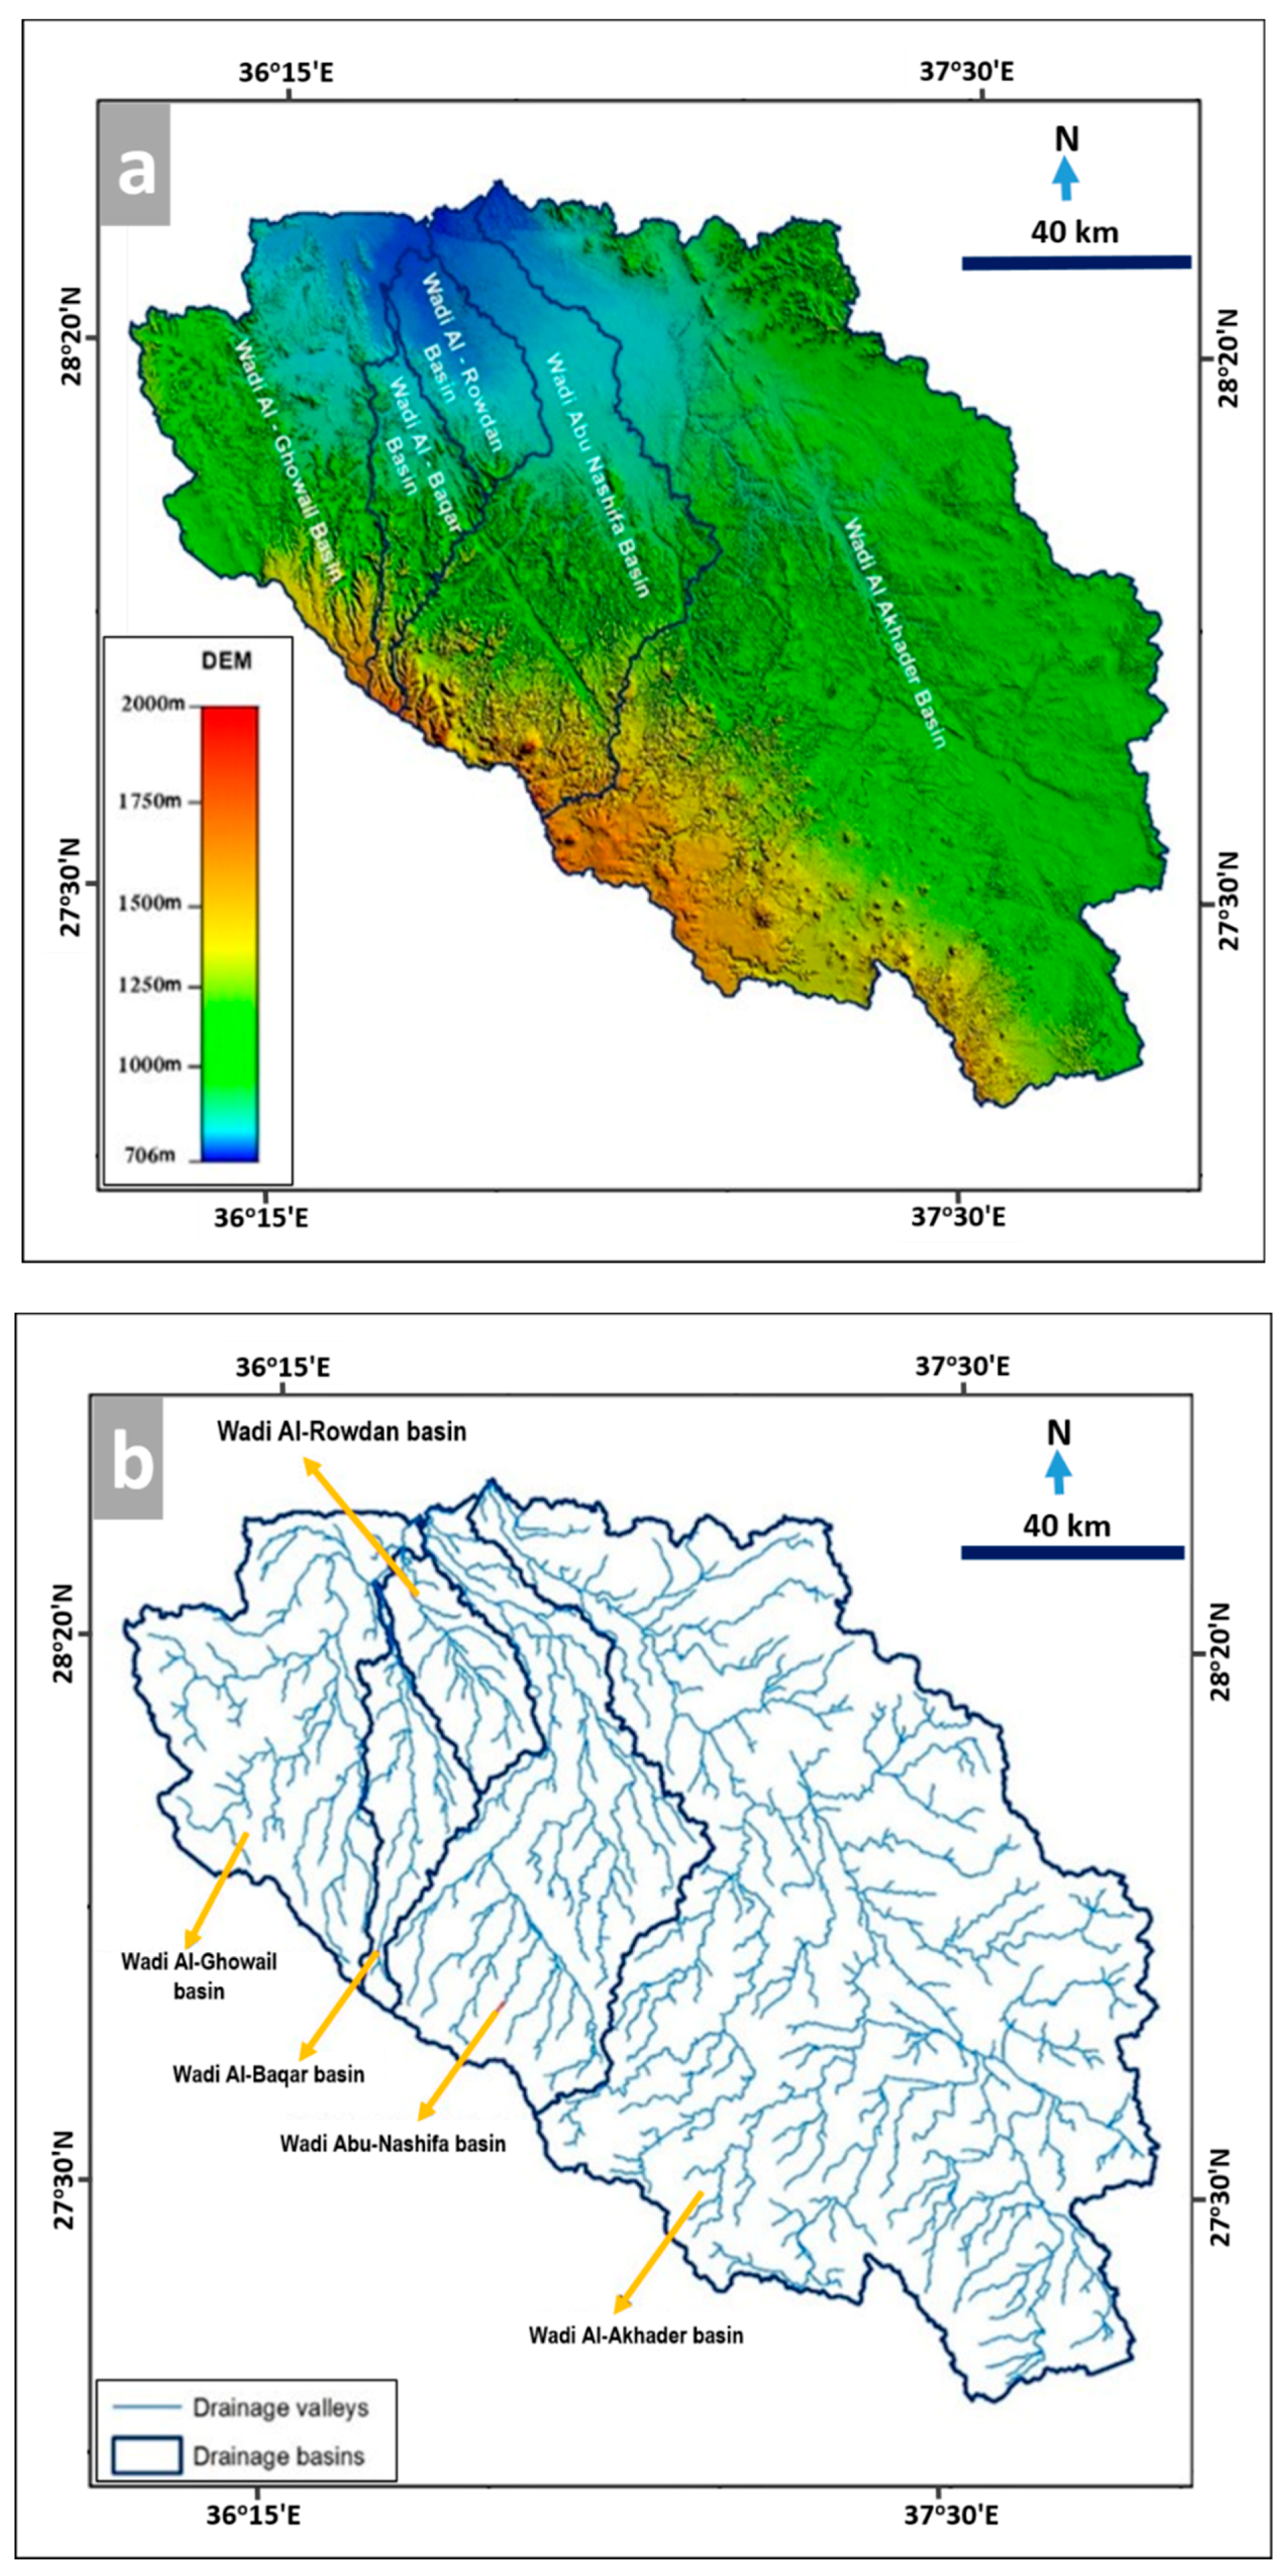
2. Study Area
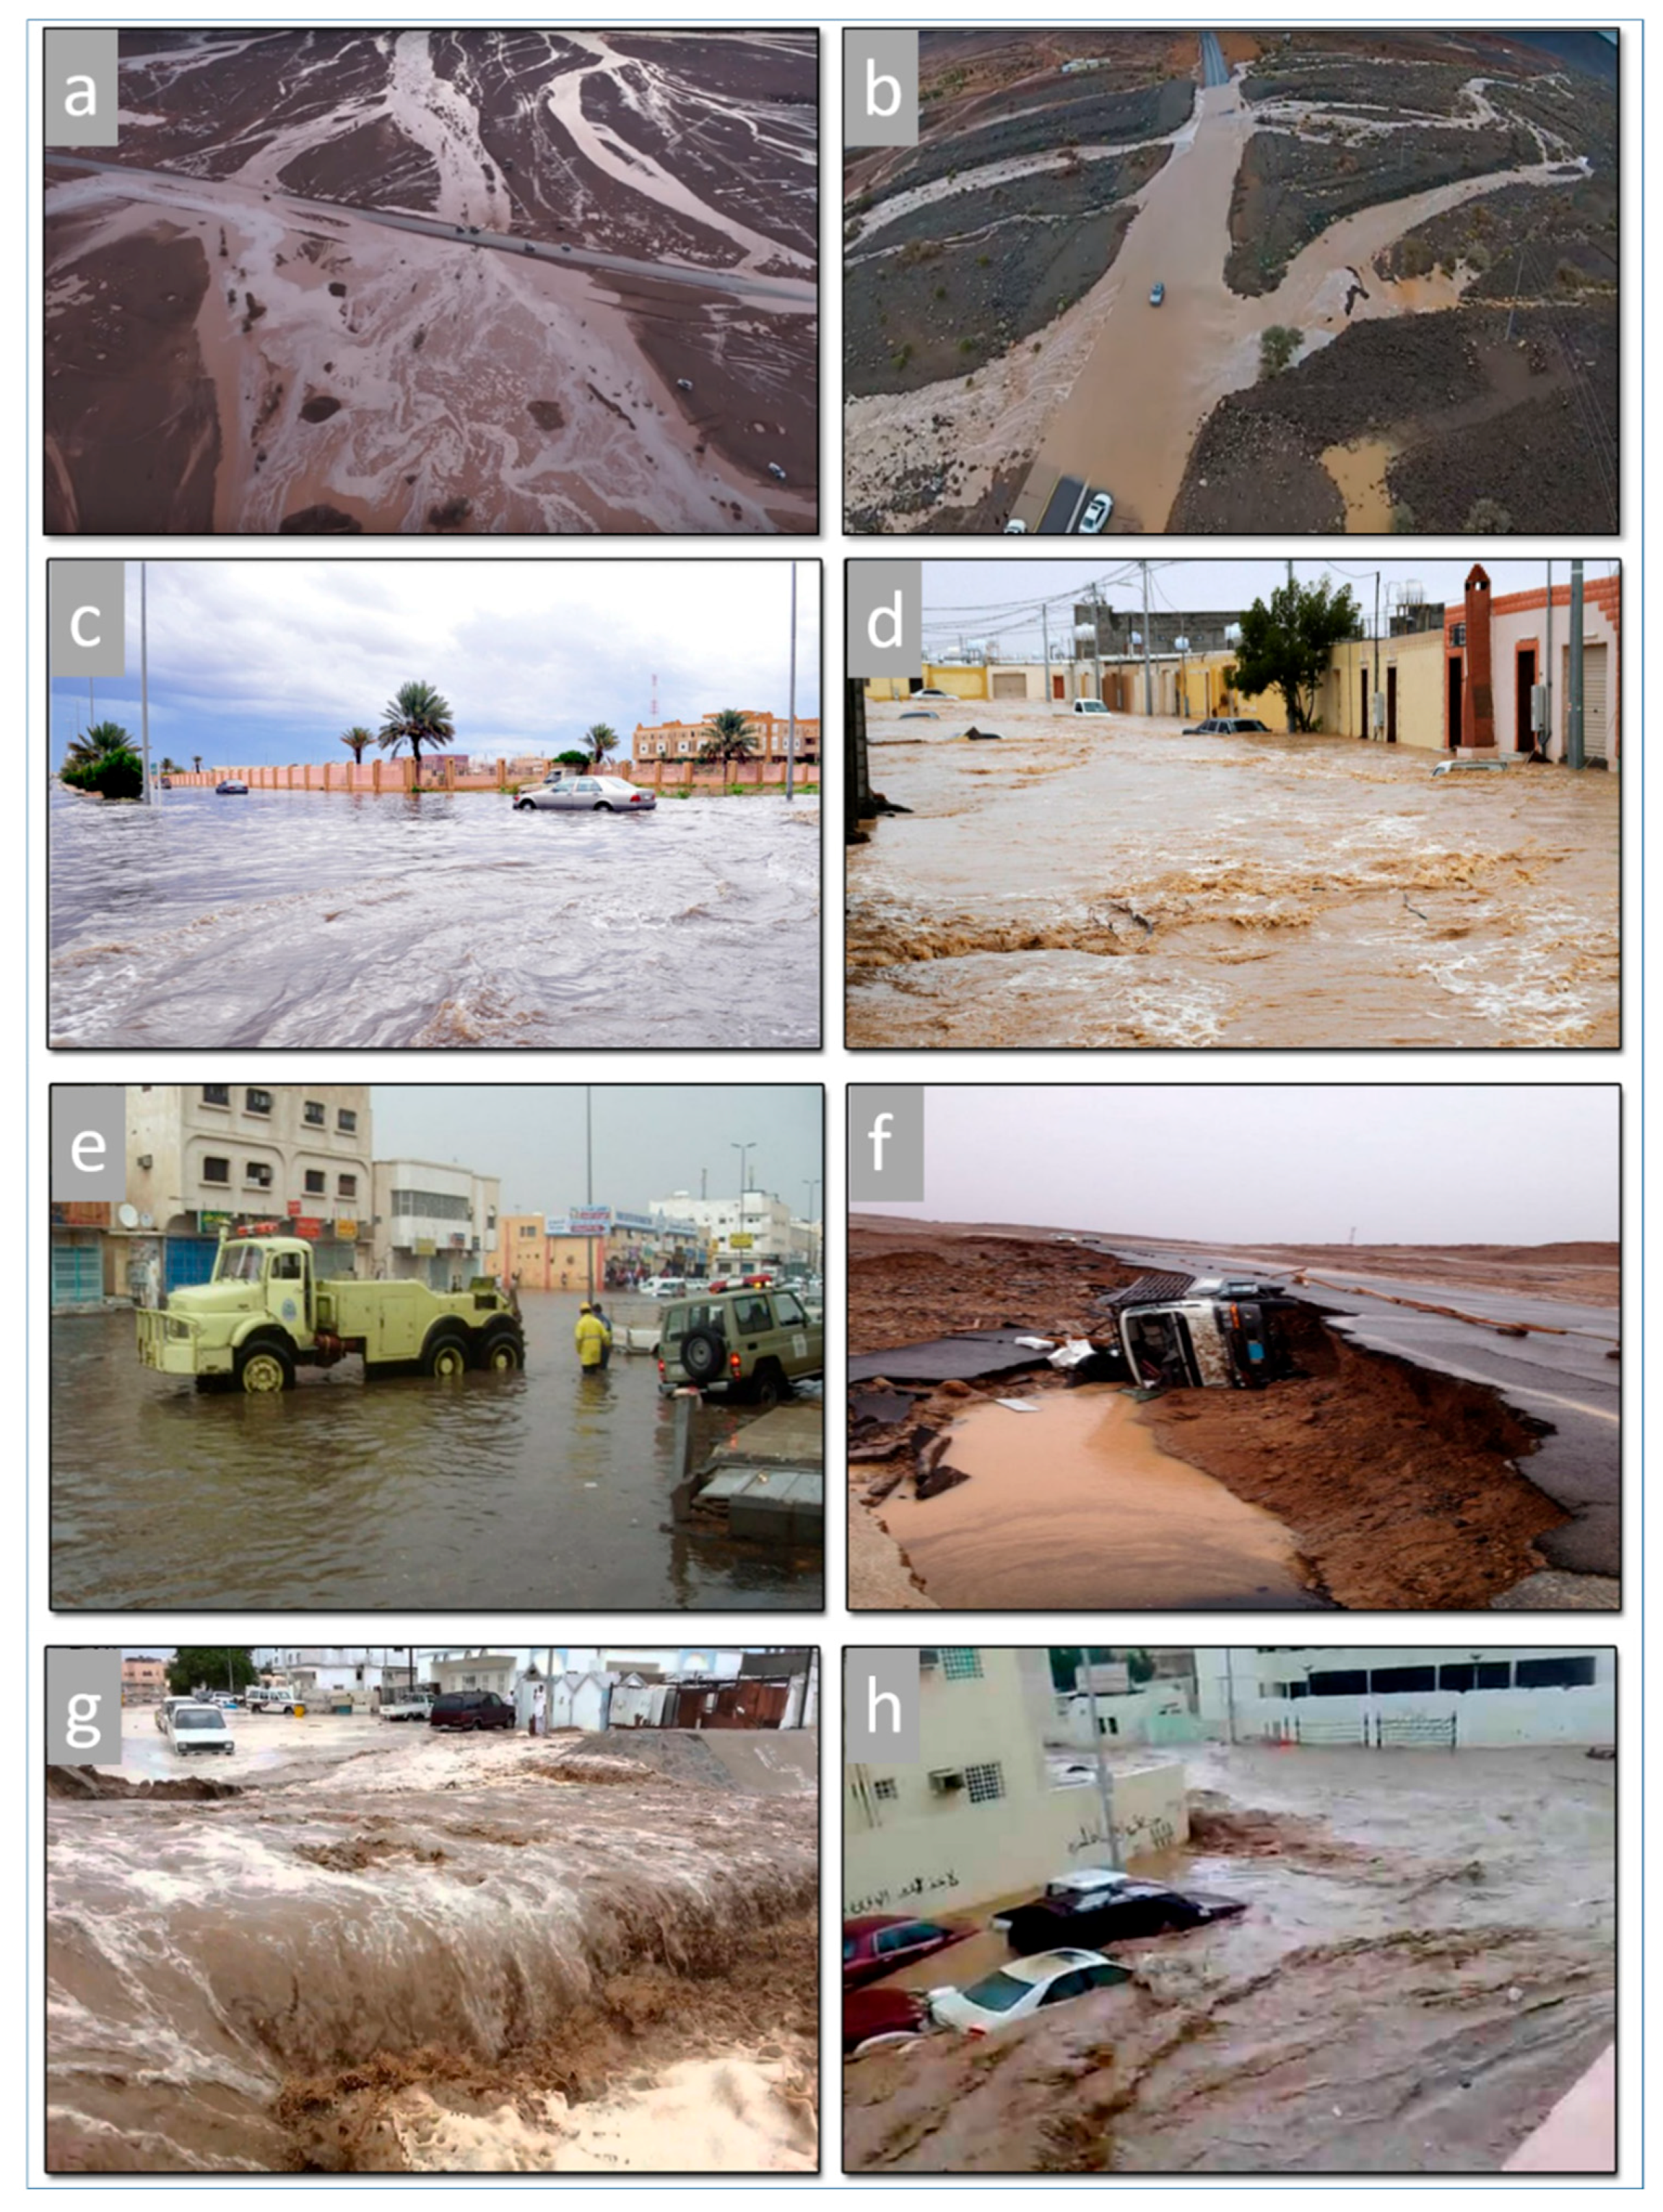
3. Causes and Consequences of Flash Floods in Tabuk City
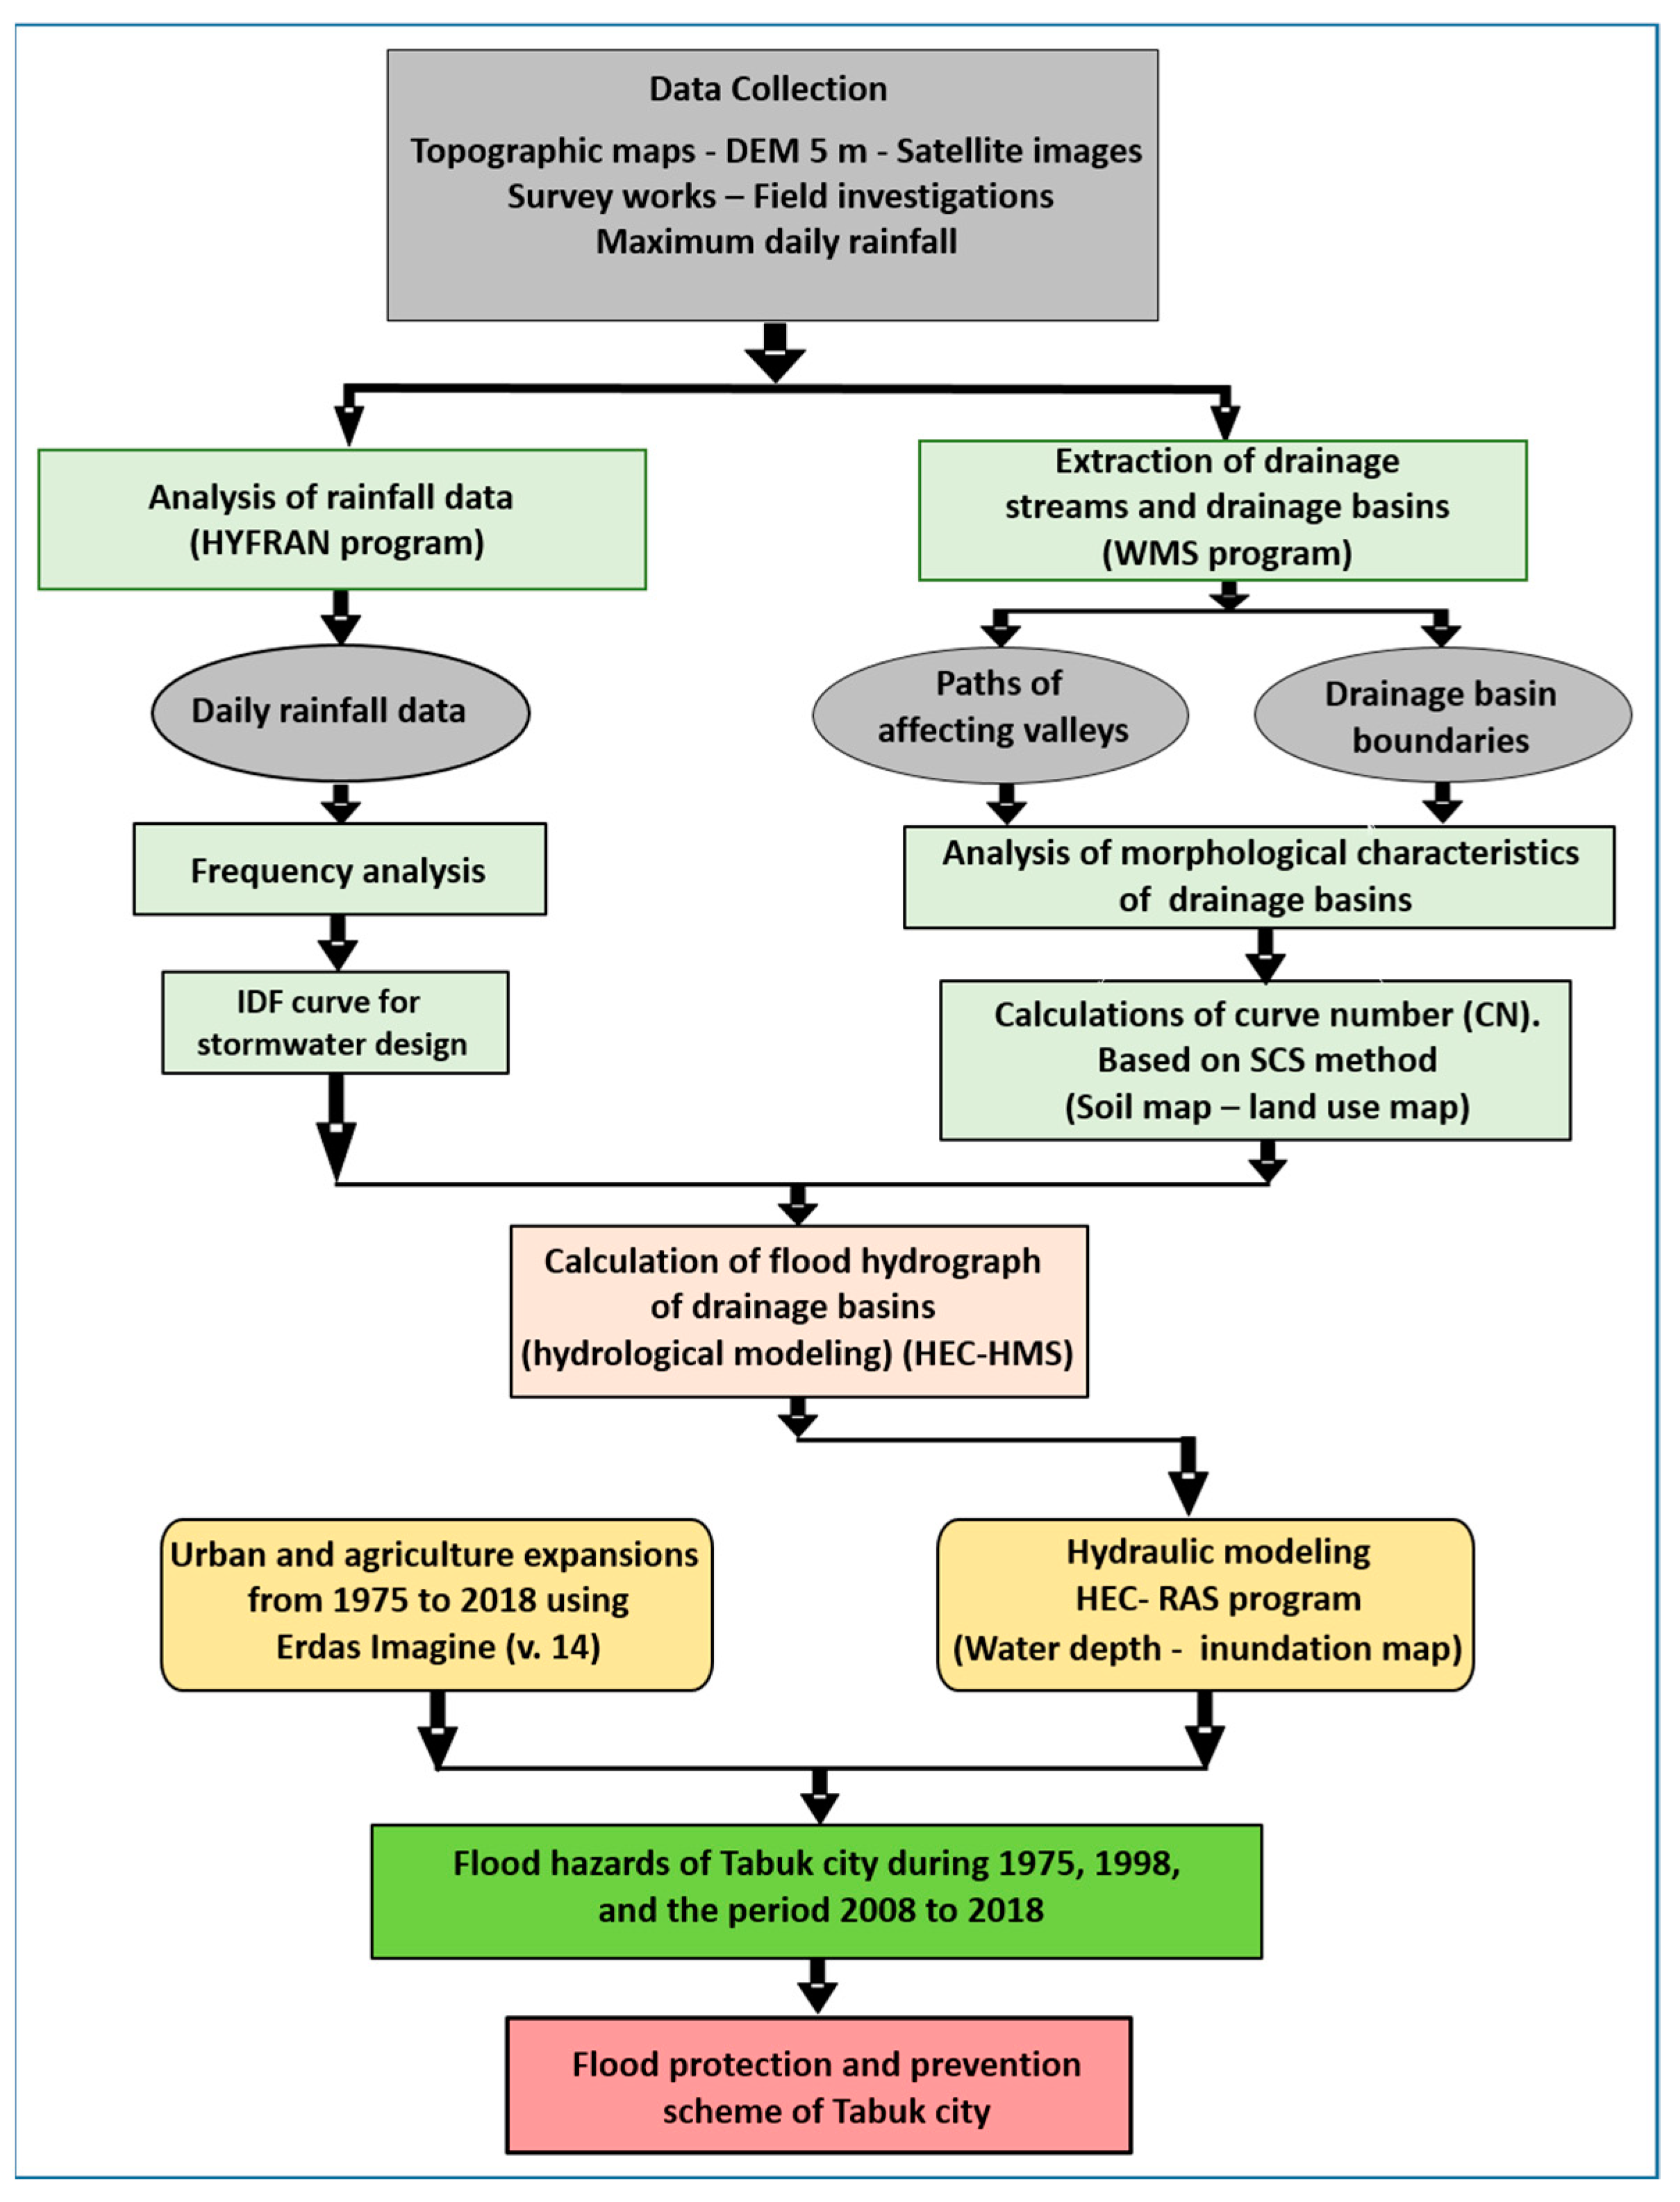
4. Data and Methodology Used
5. Results
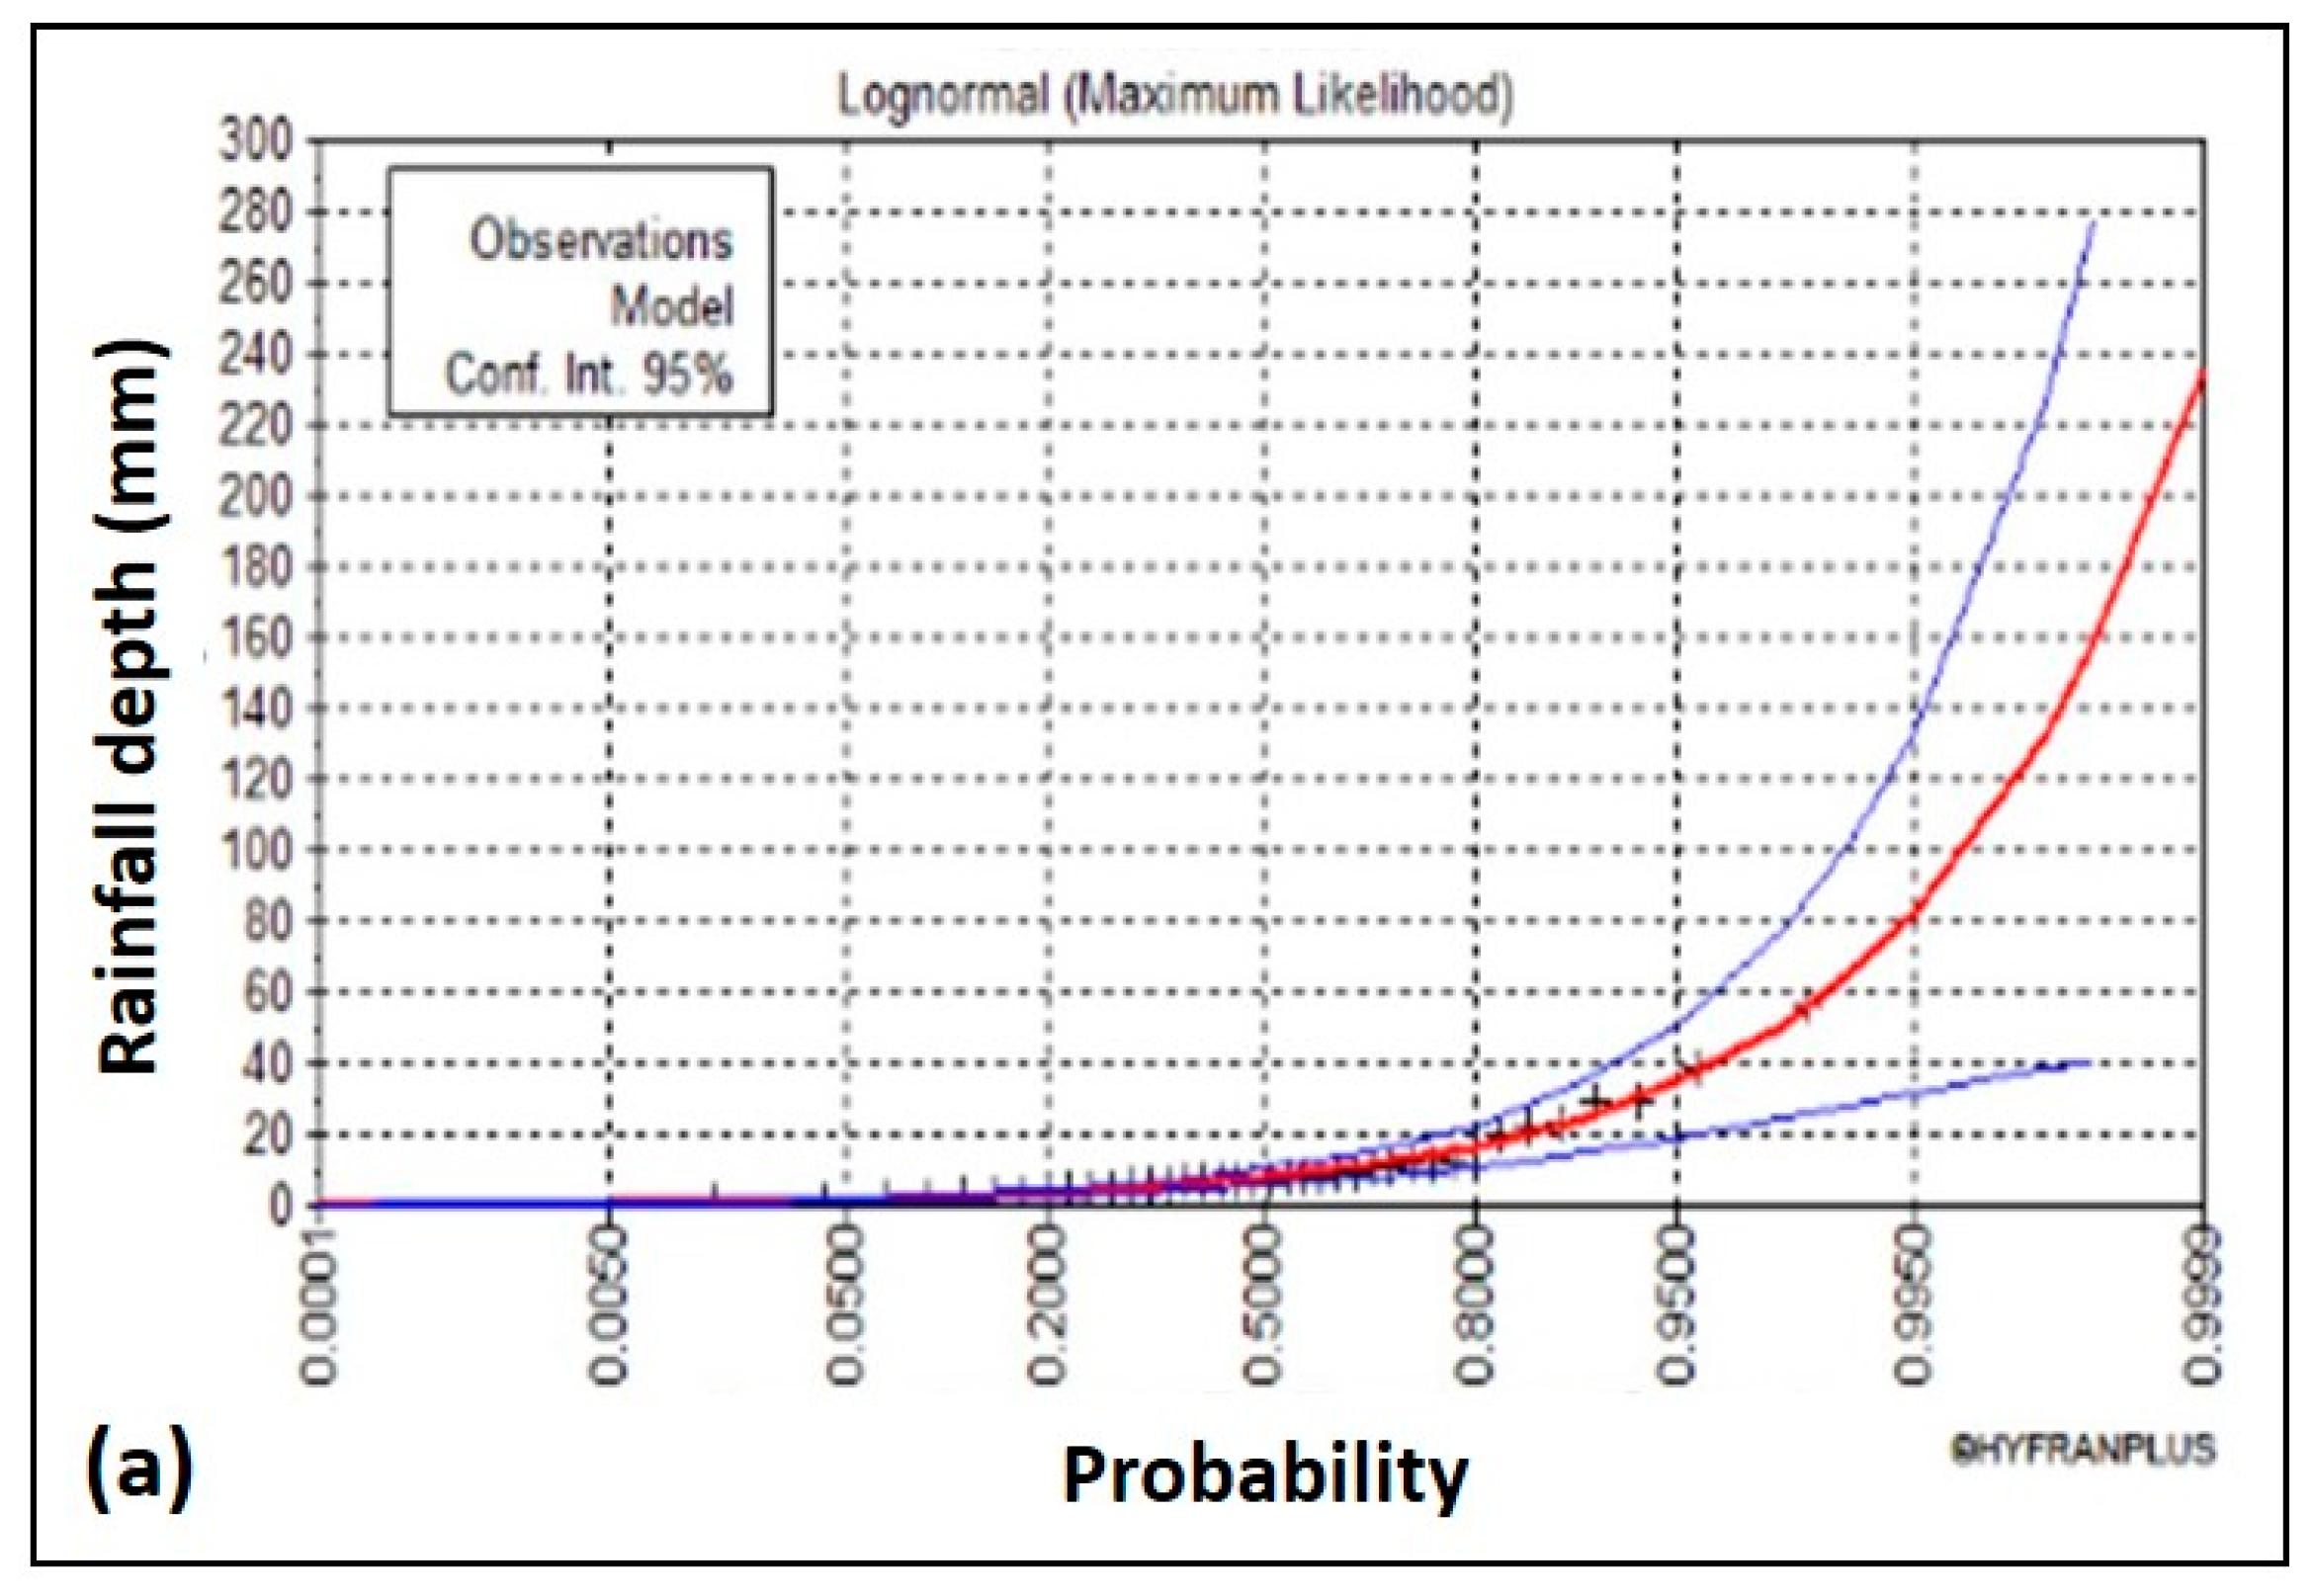
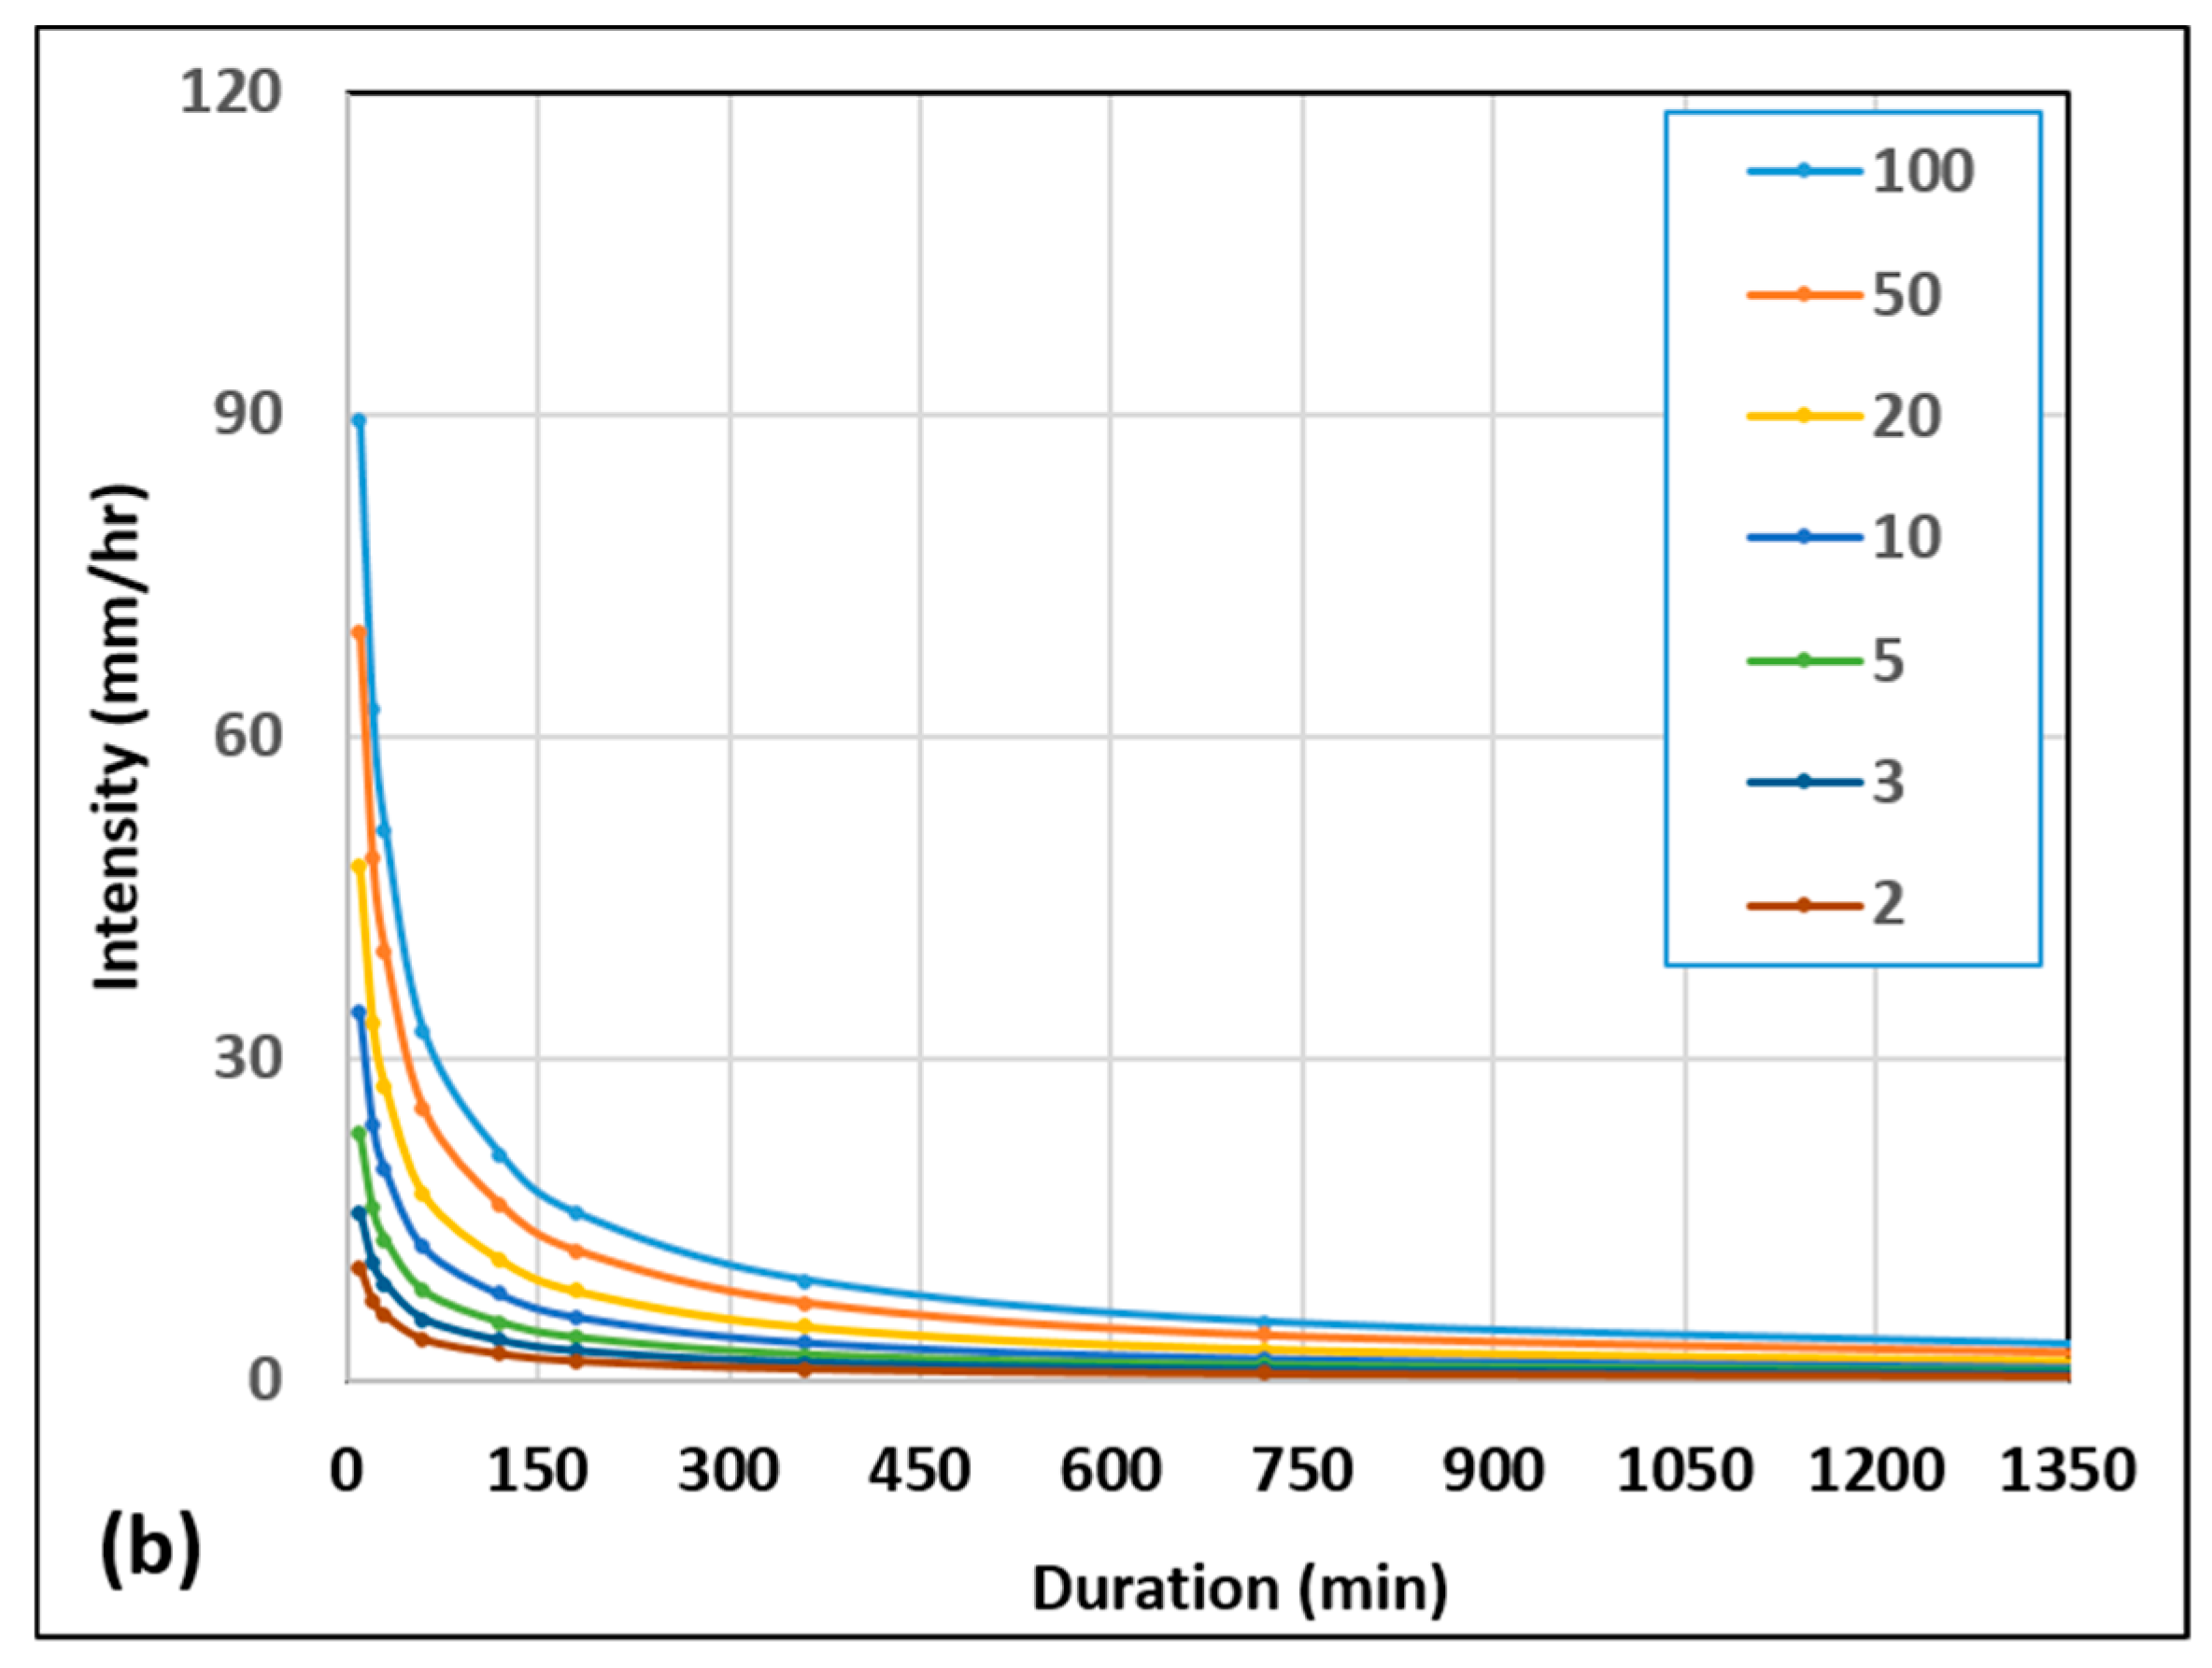
5.1. Analysis of Rainfall Amounts in Water Basins of Tabuk City
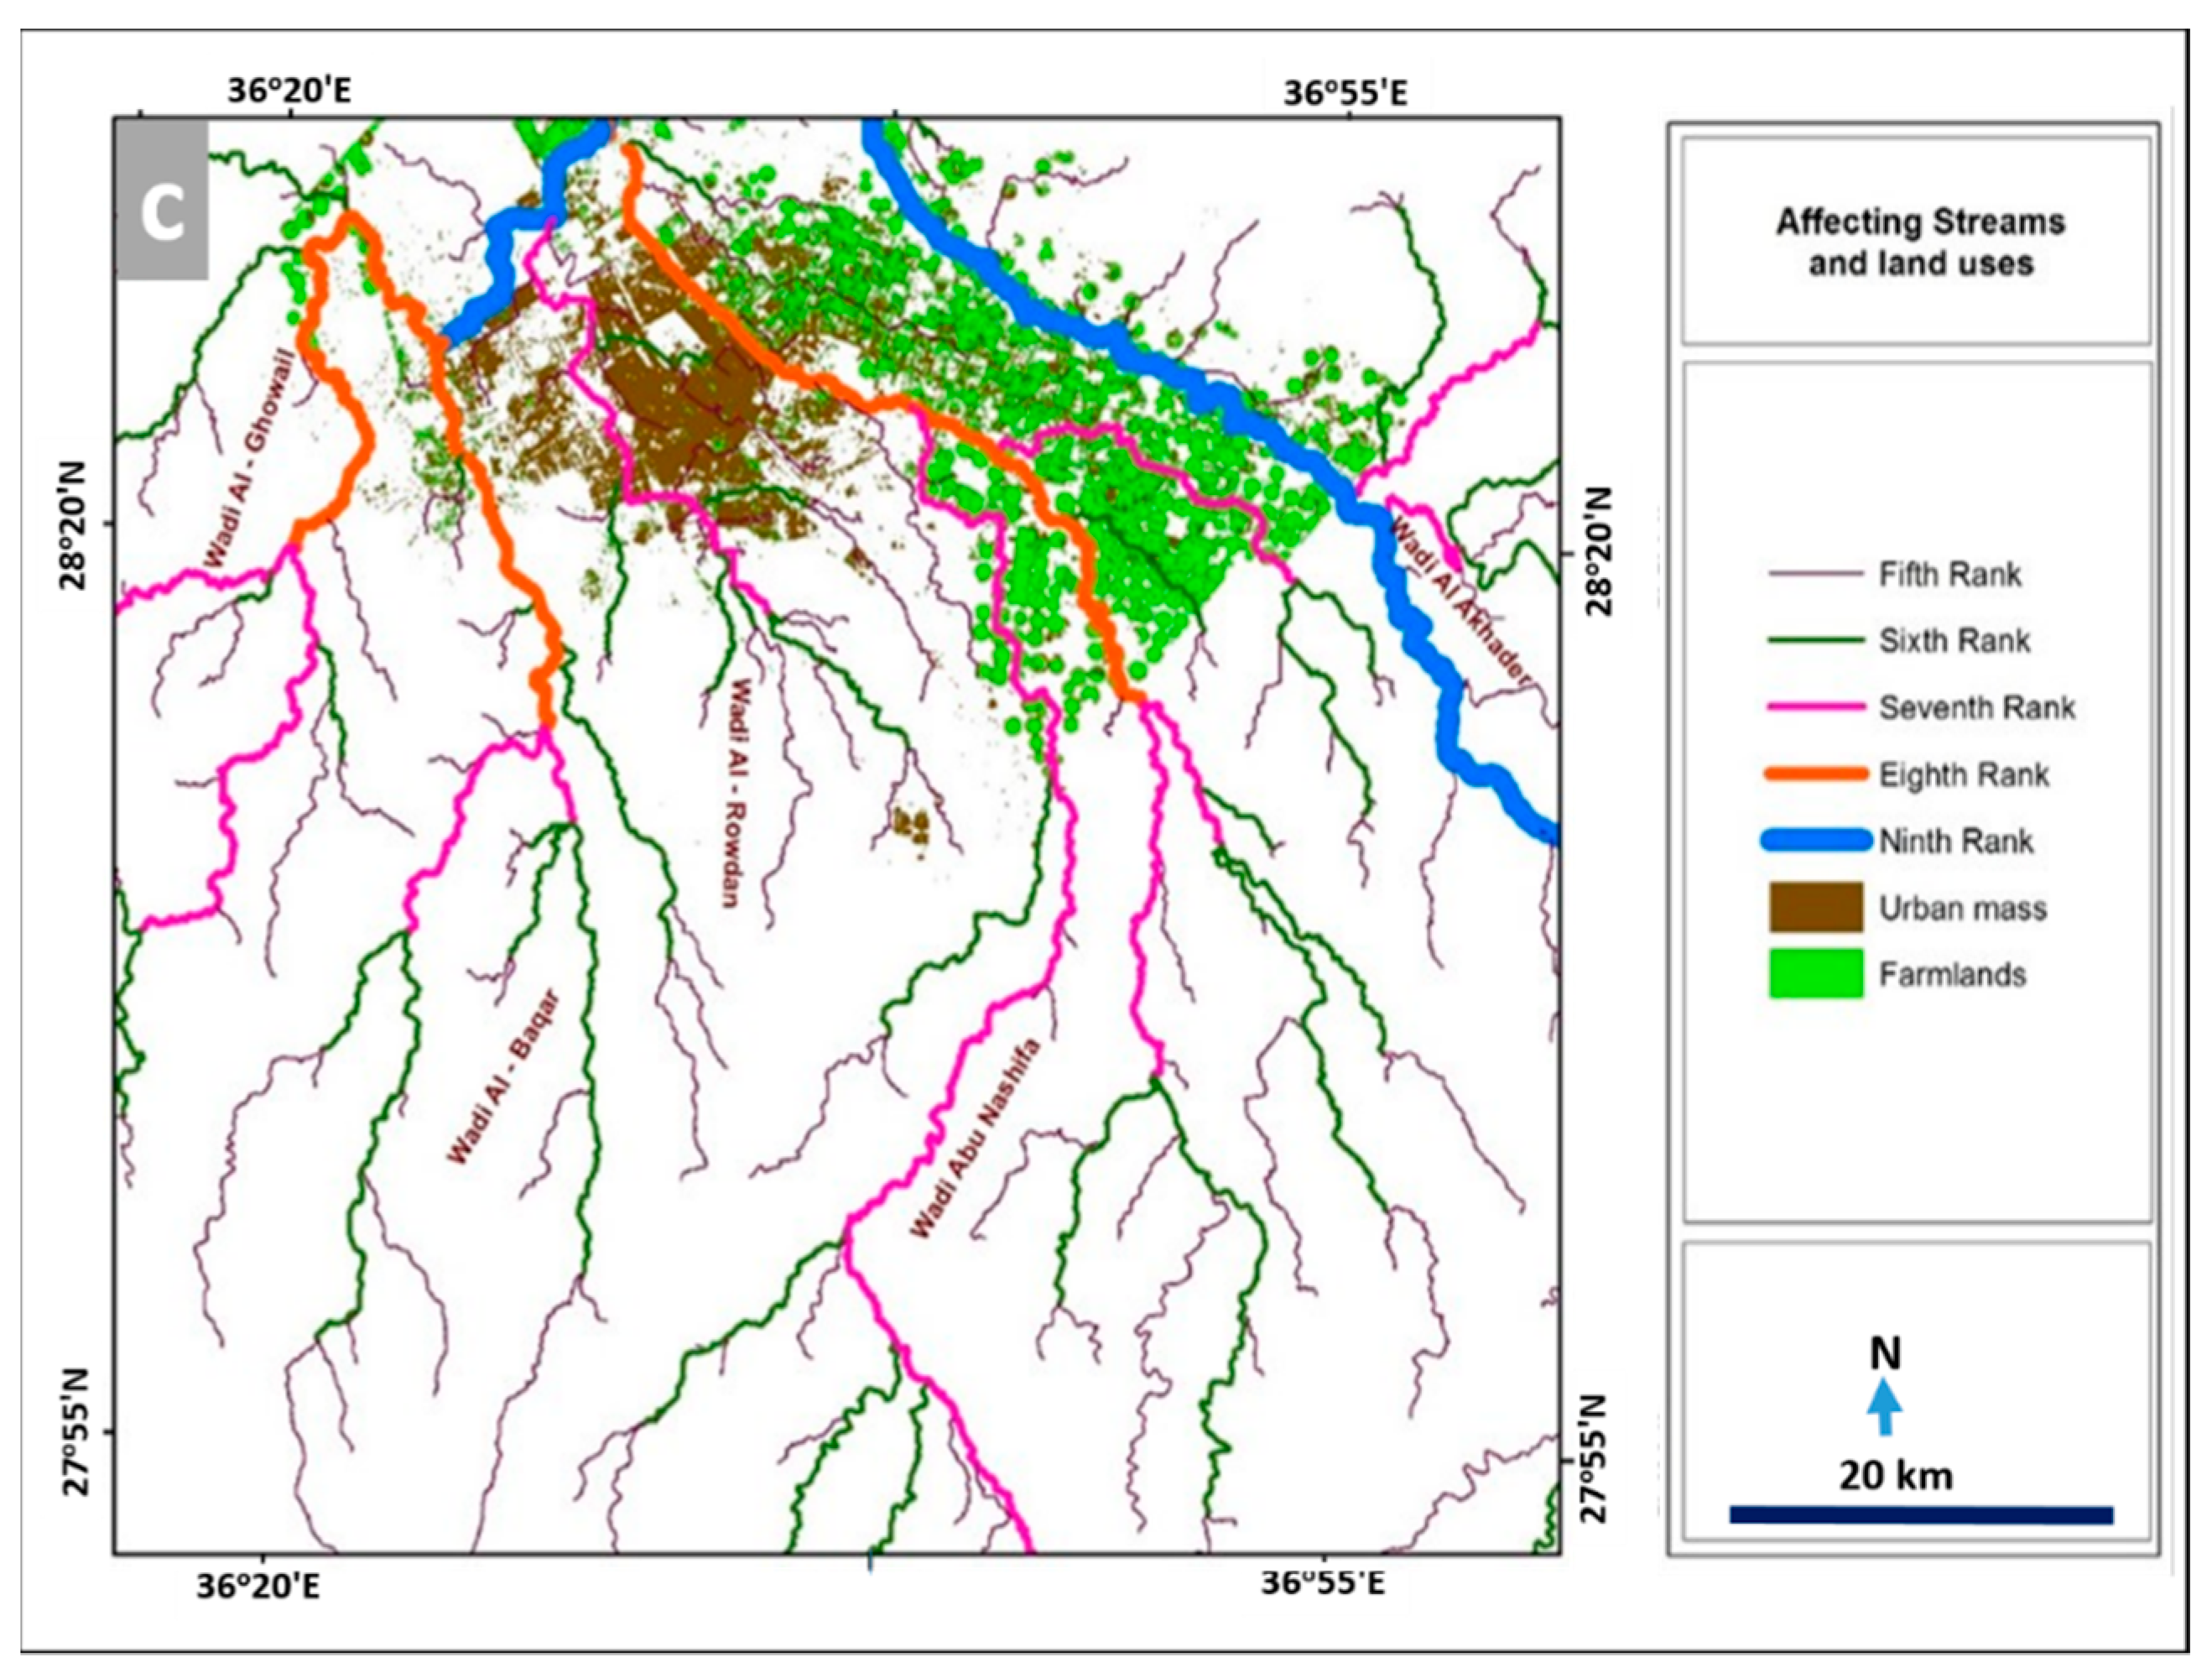
5.2. Drainage Networks and Basins and Their Characteristics
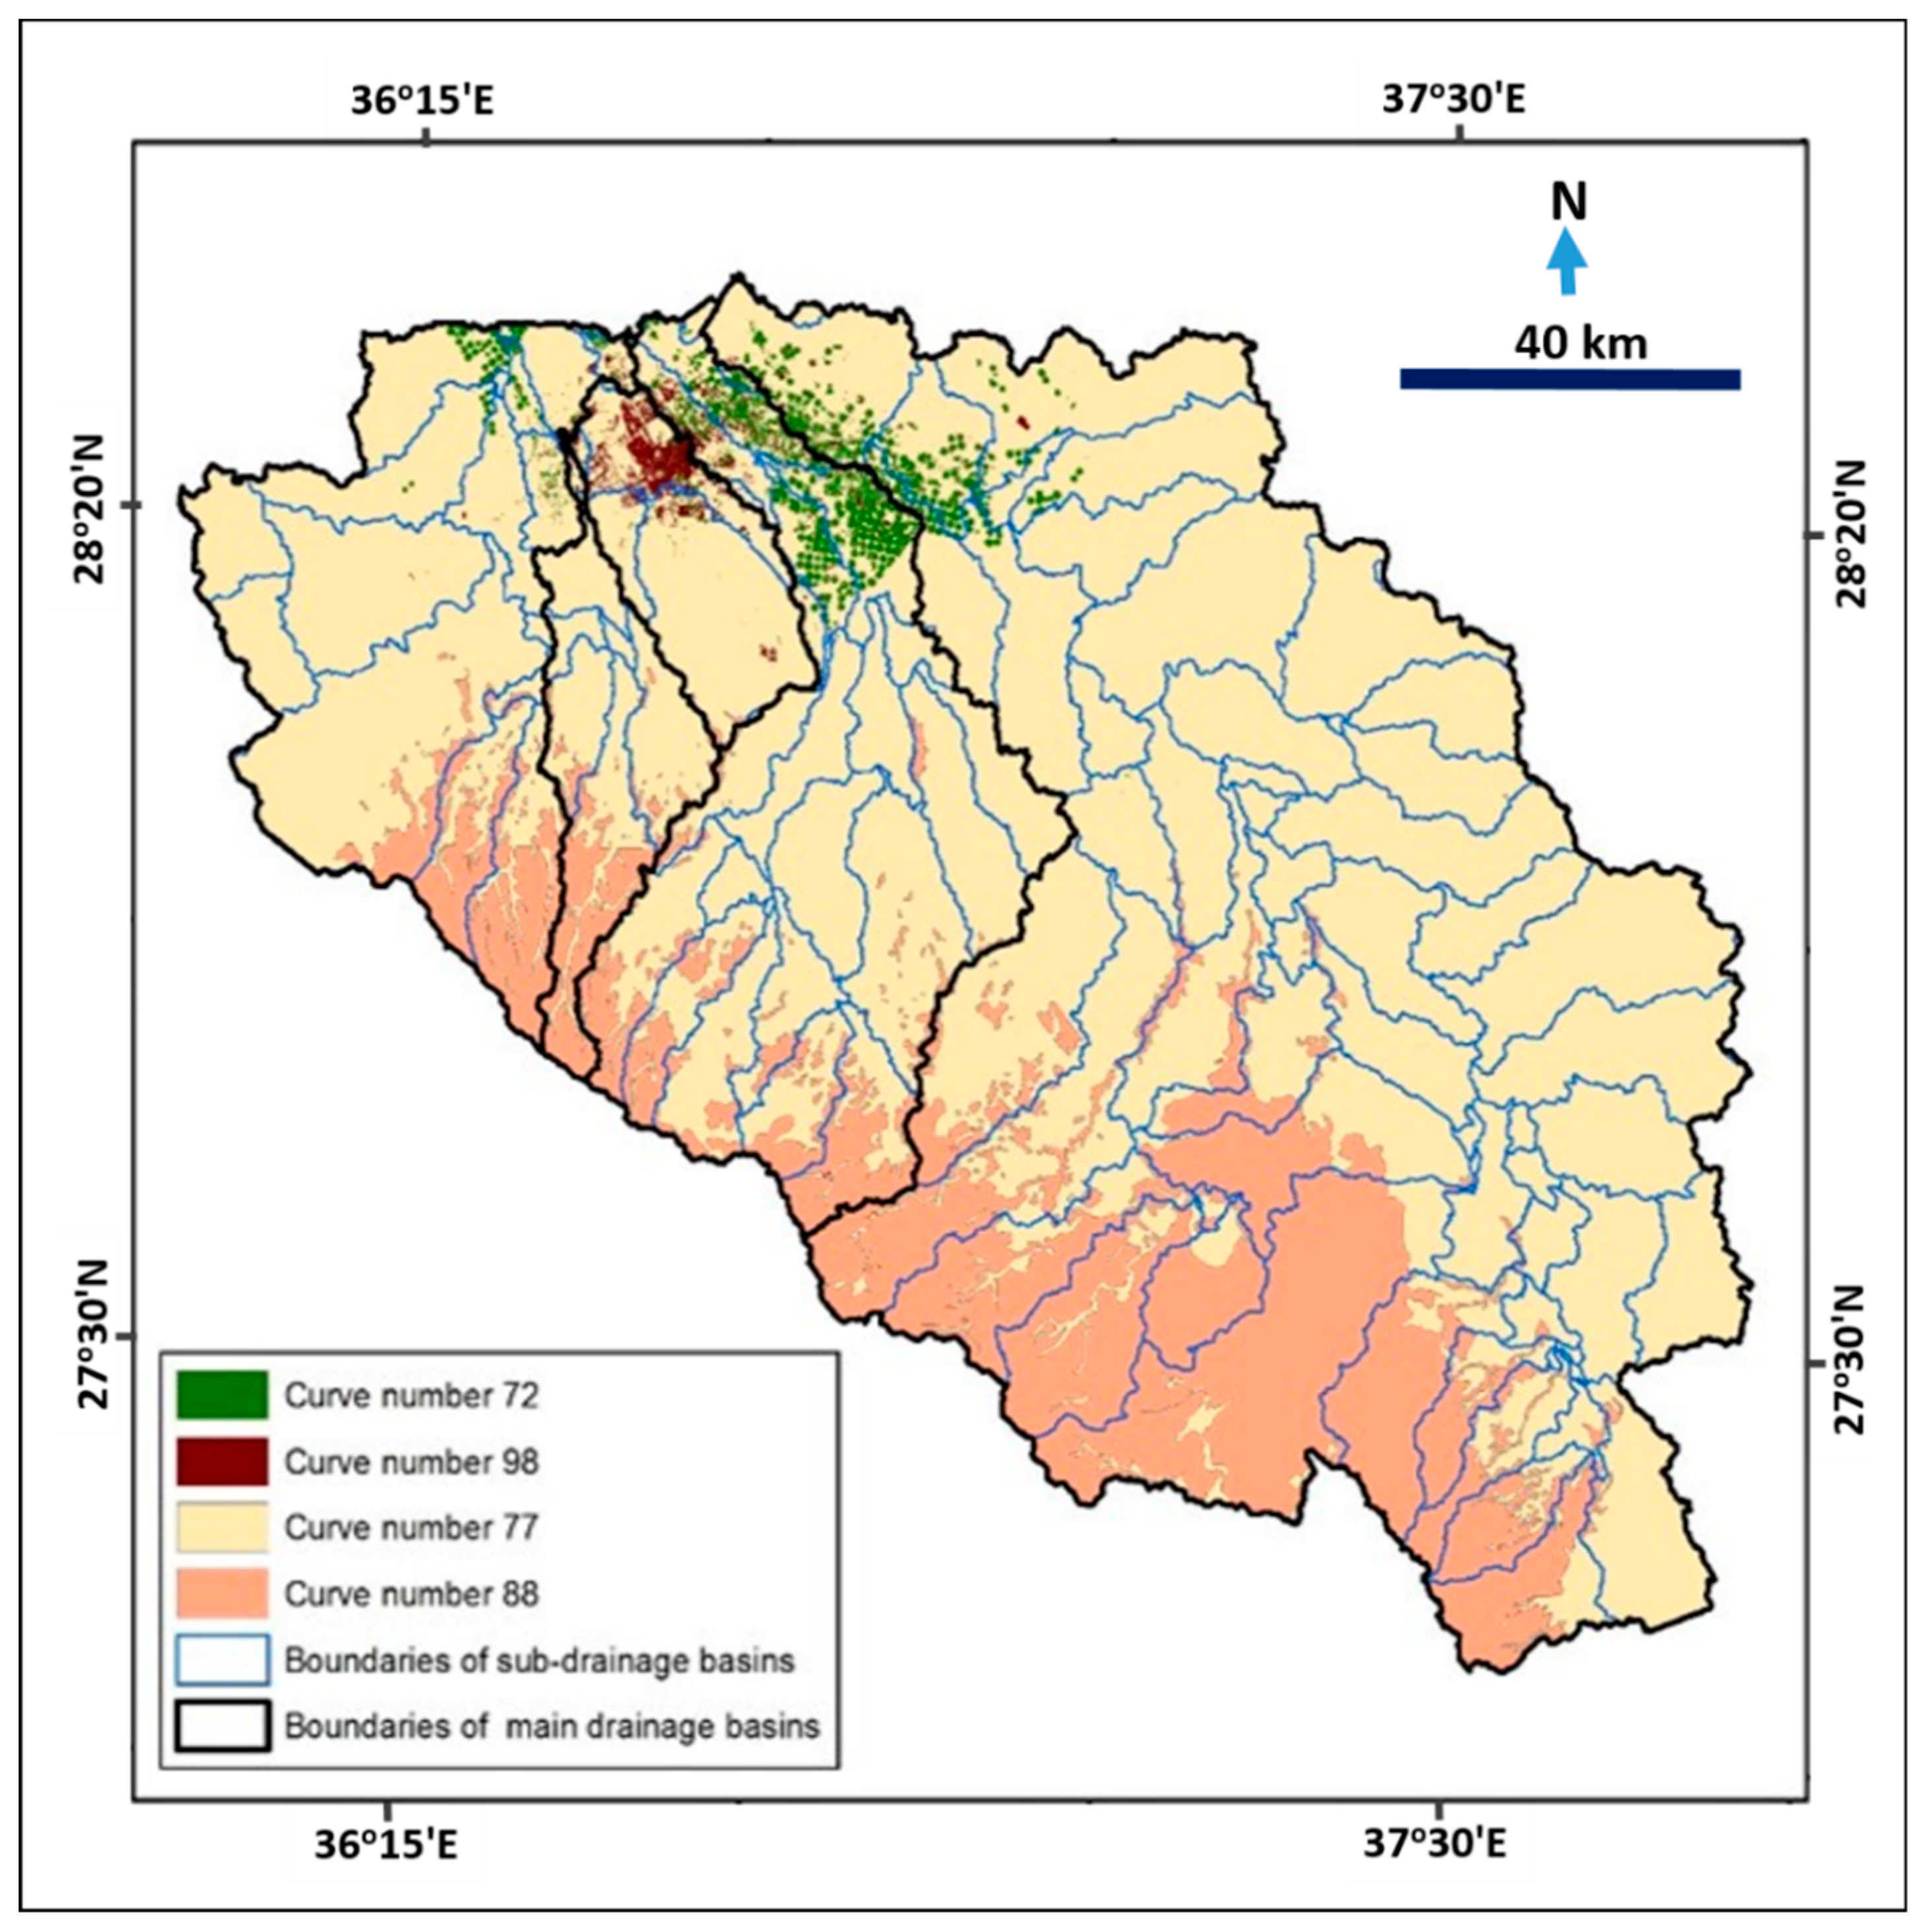
5.3. Flood Analysis for Drainage Basins
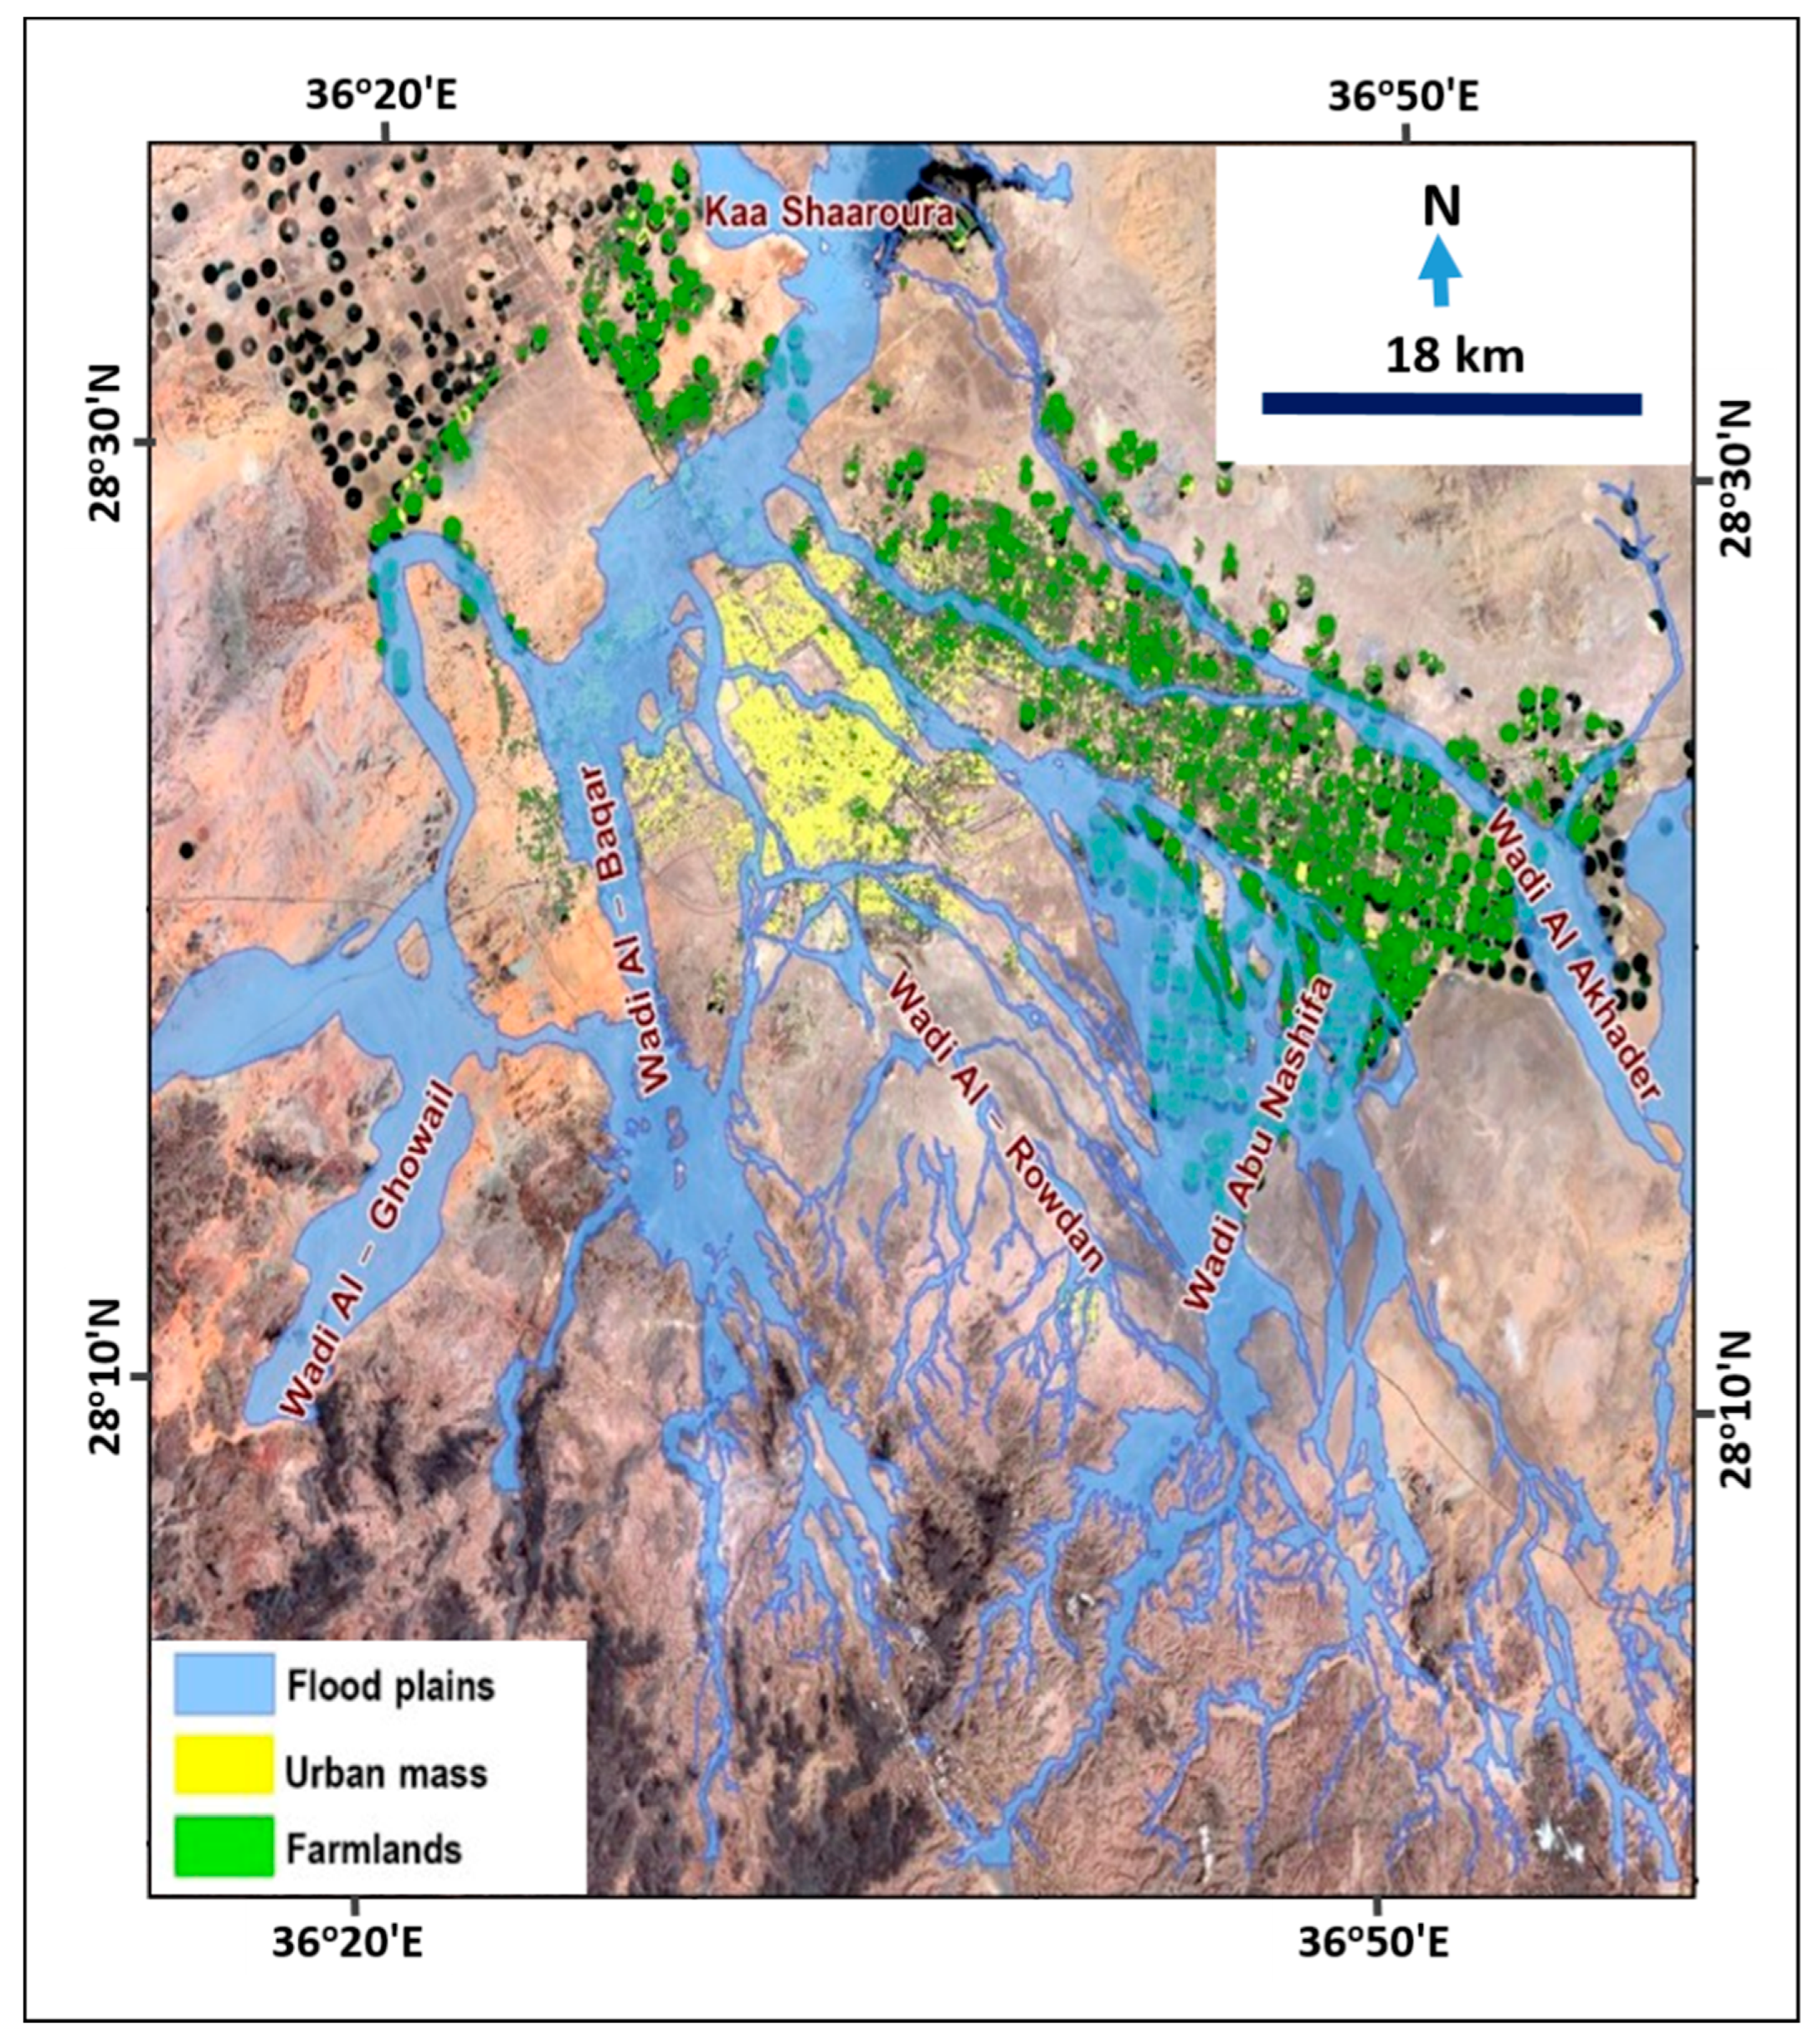
5.4. Inundation Areas Mapped Using HEC-RAS
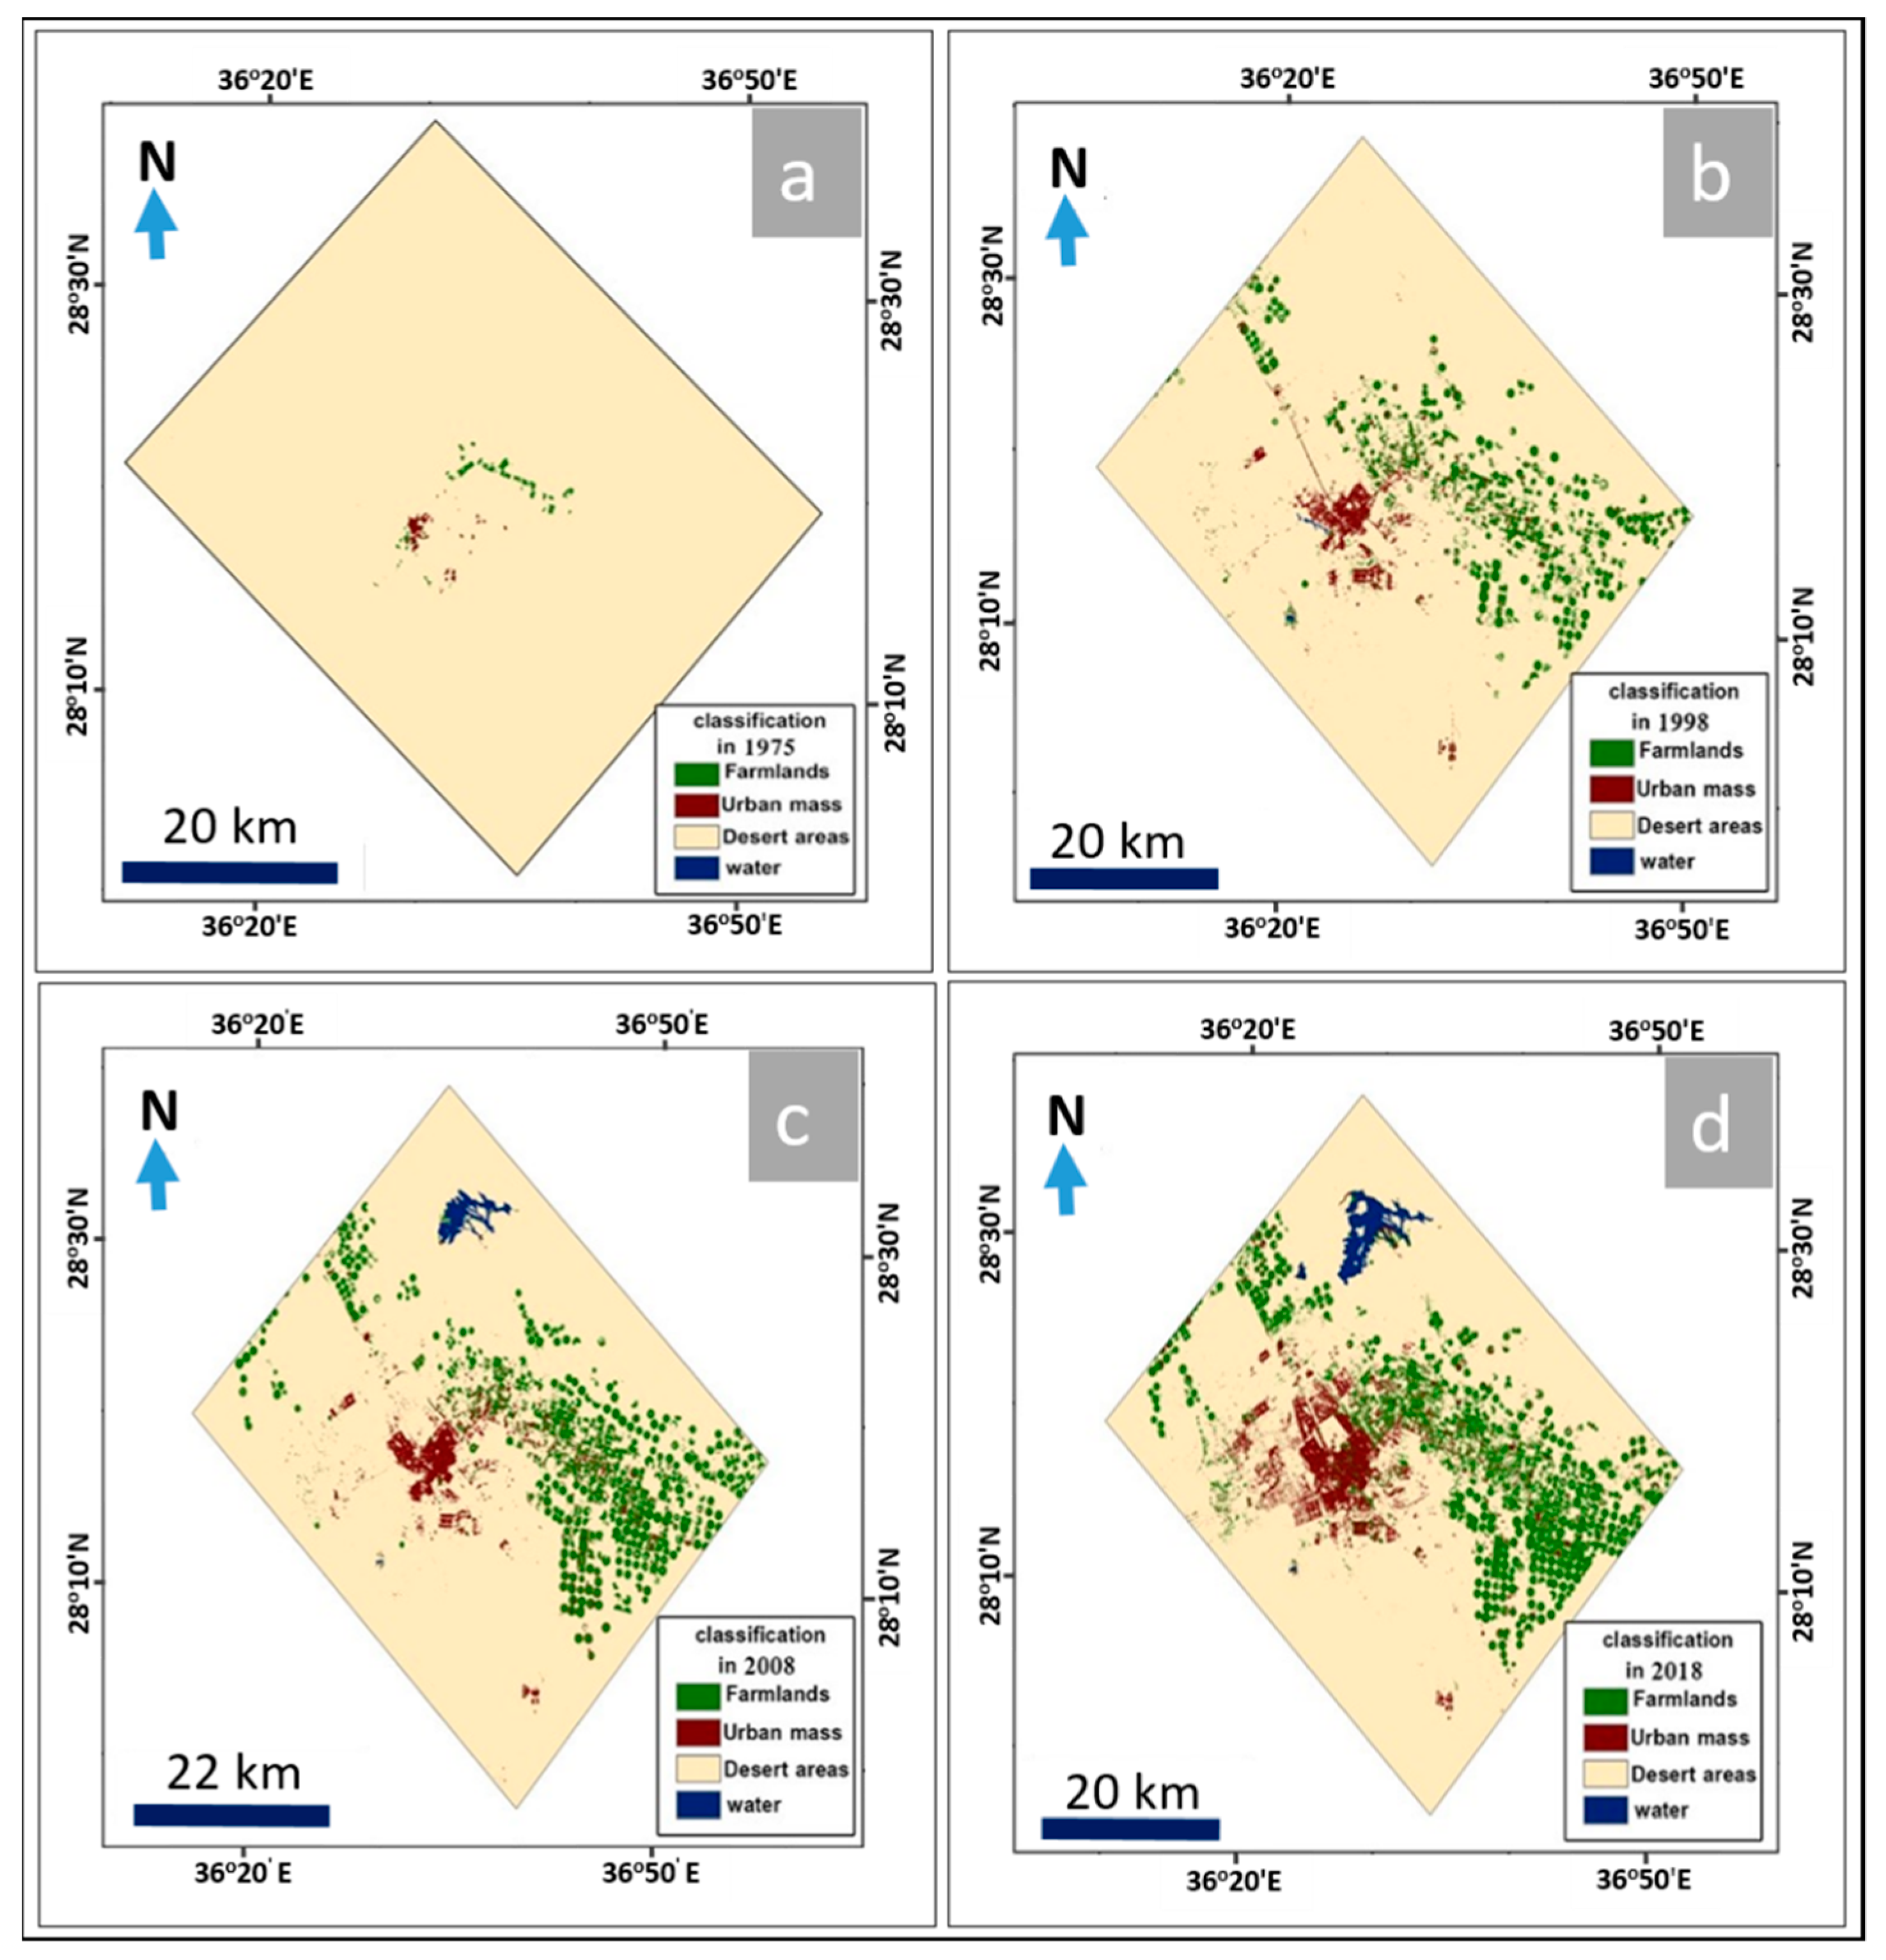
5.5. Land Use Changes (Urban and Agricultural Areas)
6. Discussion
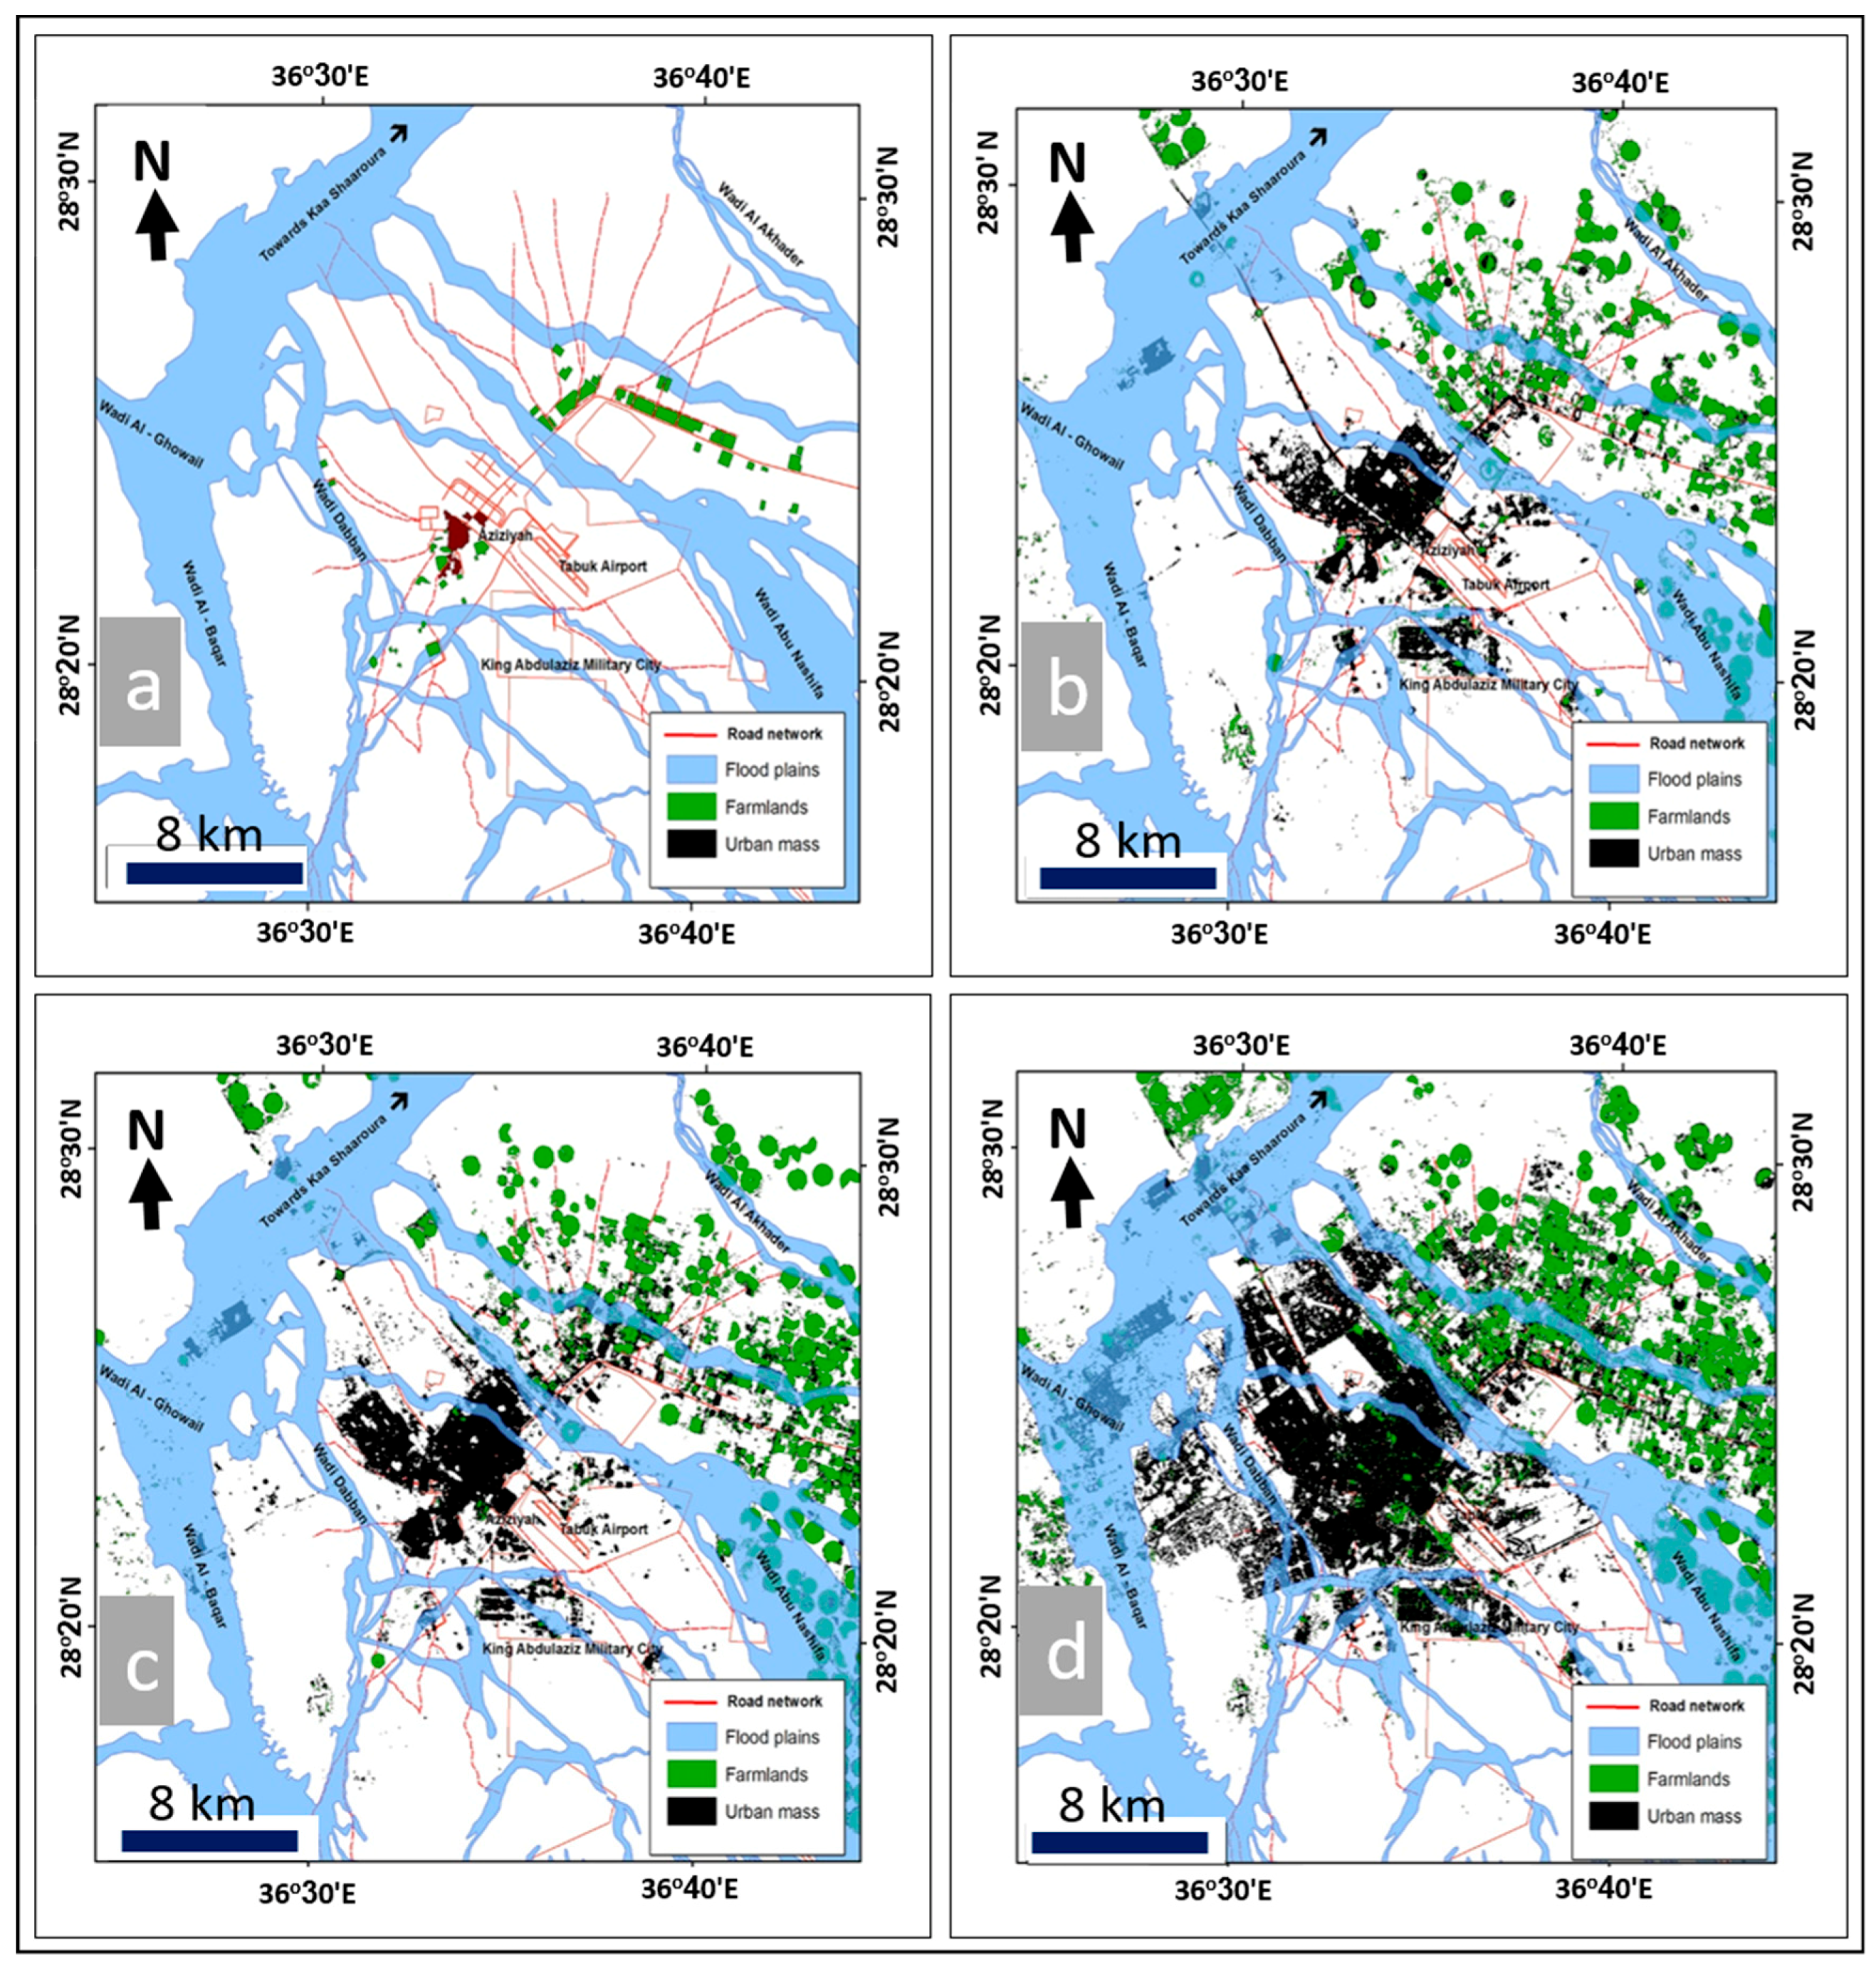
6.1. Relationship between Urban Expansion, Basins, and Flood-Prone Areas
6.2. Protection and Flood Hazard Prevention Plan for the City
7. Recommendations
8. Conclusions
Author Contributions
Funding
Acknowledgments
Conflicts of Interest
References
- Foddy, G.; Ghoneim, E.; Arnell, N. Predicting locations sensitive to flash flooding in an arid environment. J. Hydrol. 2004, 292, 48–58. [Google Scholar] [CrossRef]
- Coumou, D.; Rahmstorf, S. A decade of weather extremes. Nat. Clim. Chang. 2012, 2, 491–496. [Google Scholar] [CrossRef]
- Mambretti, S.; De Wrachien, D.; Sole, A. Flood-risk assessment and hazard mitigation measures: Case studies and lessons learnt in Italy. WIT Trans. Ecol. Environ. 2013, 118, 17–26. [Google Scholar] [CrossRef]
- Ozturk, M.; Copty, N.; Saysel, A. Modeling the impact of land use change on the hydrology of a rural watershed. J. Hydrol. 2013, 497, 97–109. [Google Scholar] [CrossRef]
- Avinash, S. Flood related disasters: Concerned to urban flooding in Bangalore, India. Int. J. Res. Eng. Technol. 2016, 3, 76–83. [Google Scholar] [CrossRef]
- Bathrellos, G.D.; Karymbalis, E.; Skilodimou, H.D.; Gaki-Papanastassiou, K.; Baltas, E.A. Urban flood hazard assessment in the basin of Athens Metropolitan city, Greece. Environ. Earth Sci. 2016, 75, 319. [Google Scholar] [CrossRef]
- Van Oldenborgh, G.J.; Otto, F.E.L.; Haustein, K.; AchutaRao, K. The massive precipitation event of December 2015 in Chennai, India. Bull. Am. Meteorol. Soc. 2016, 97, S87–S91. [Google Scholar] [CrossRef]
- Roxy, M.K.; Ghosh, S.; Pathak, A.; Athulya, R.; Mujumdar, M.; Murtugudde, R.; Terray, P.; Rajeevan, M. A threefold rise in widespread extreme rain events over central India. Nat. Commun. 2017, 8, 708. [Google Scholar] [CrossRef] [PubMed] [Green Version]
- Dottori, F.; Szewczyk, W.; Ciscar, J.C.; Zhao, F.; Alfieri, L.; Hirabayashi, Y.; Bianchi, A.; Mongelli, I.; Frieler, K.; Betts, R.A.; et al. Increased human and economic losses from river flooding with anthropogenic warming. Nat. Clim. Chang. 2018, 8, 781–786. [Google Scholar] [CrossRef]
- Skilodimou, H.D.; Bathrellos, G.D.; Chousianitis, K.; Youssef, A.M.; Pradhan, B. Multi-hazard assessment modeling via multi-criteria analysis and GIS: A case study. Environ. Earth Sci. 2019, 78, 47. [Google Scholar] [CrossRef]
- Youssef, A.M.; Pradhan, B.; Sefry, S.A. Flash flood Susceptibility mapping in Jeddah city (Kingdom of Saudi Arabia) using bivariate and multivariate statistical models. Environ. Earth Sci. 2016, 75, 12. [Google Scholar] [CrossRef]
- Youssef, A.M.; Sefry, S.A.; Pradhan, B.; Alfadail, E.A. Analysis on causes of flash flood in Jeddah city (Kingdom of Saudi Arabia) of 2009 and 2011 using multi-sensor remote sensing data and GIS. Geomatics. Nat. Hazards Risk 2016, 7, 1018–1042. [Google Scholar] [CrossRef]
- Al-Ghamdi, K.; Elzahrany, R.; Mirza, M.; Dawod, G. Impacts of urban growth on flood hazards in Makkah City, Saudi Arabia. Int. J. Water Resour. Environ. Eng. 2012, 4, 23–34. [Google Scholar]
- Nirupama, N.; Simonovic, S. Increase of flood risk because of urbanization: A Canadian example. Nat. Hazards 2007, 40, 25–41. [Google Scholar] [CrossRef]
- Saghafian, B.; Farazjoo, H.; Bozorgy, B.; Yazdandoost, F. Flood intensification because of changes in land use. Water Resour. Manag. 2008, 22, 1051–1067. [Google Scholar] [CrossRef]
- Wheather, H. Hydrological processes in arid and semi-arid areas. In Hydrology of Wadi Systems; Wheather, H.S., Al-Weshah, R.A., Eds.; UNESCO: Paris, France, 2002. [Google Scholar]
- Benz, U.C.; Hoffmann, P.; Willhauck, G.; Lingenfelder, I.; Heynen, M. Multi-resolution, object-oriented fuzzy analysis of remote sensing data for GIS-ready information. ISPRS J. Photogramm. Remote Sens. 2004, 58, 239–258. [Google Scholar] [CrossRef] [Green Version]
- Burns, D.; Vitvar, T.; McDonnell, J.; Hassett, J.; Duncan, J.; Kendall, C. Effects of suburban development on runoff generation in the Croton River basin, New York, USA. J. Hydrol. 2005, 311, 266–281. [Google Scholar] [CrossRef]
- Dutta, D.; Herath, S. Trend of floods in Asia and a proposal for flood risk management with integrated river basin approach. In Proceedings of the Second International Conference of Asia–Pacific Hydrology and Water Resources Association, Singapore, 5–9 July 2004; Volume 1, pp. 128–137. [Google Scholar]
- Fernandez, D.; Lutz, M. Urban flood hazard zoning in Tucumán Province, Argentina, using GIS and multicriteria decision analysis. Eng. Geol. 2010, 111, 90–98. [Google Scholar] [CrossRef]
- Gaitan, S.; ten Veldhuis, M.; van de Giesen, N. Spatial distribution of flood incidents along urban overland flow-paths. Water Resour. Manag. 2015, 29, 3387–3399. [Google Scholar] [CrossRef]
- Horritt, M.S. A methodology for the validation of uncertain flood inundation models. J. Hydrol. 2006, 326, 153–165. [Google Scholar] [CrossRef]
- Mason, D.C.; Bates, P.D.; Dall Amico, J.T. Calibration of uncertain flood inundation models using remotely sensed water levels. J. Hydrol. 2009, 368, 224–236. [Google Scholar] [CrossRef]
- Ahmad, S.S.; Simonovic, S.P. A three-dimensional fuzzy methodology for flood risk analysis. J. Flood Risk Manag. 2011, 4, 53–74. [Google Scholar] [CrossRef]
- Billa, L.; Mansor, S.; Mahmud, A.R.; Ghazali, A.H. Comprehensive planning and the role of SDSS in flood disaster management in Malaysia. Disaster Prev. Manag. 2006, 15, 233–240. [Google Scholar] [CrossRef] [Green Version]
- Chormanski, J.; Van de Voorde, T.; Deroeck, T.; Batelaan, O.; Canters, F. Improving distributed runoff prediction in urbanized catchments with remote sensing based estimates of impervious surface cover. Sensors 2008, 8, 910–932. [Google Scholar] [CrossRef] [PubMed]
- Cunderlik, J.M.; Burn, D.H. Analysis of the linkage between rain and flood regime and its application to regional flood frequency estimation. J. Hydrol. 2002, 261, 115–131. [Google Scholar] [CrossRef]
- Essel, B. The application of GIS in mapping of flood hazard areas and assessing of risk in Kumasi, Ghana. J. Energy Nat. Resour. Manag. JENRM 2017, 3, 97–103. [Google Scholar] [CrossRef]
- Haeng, H.J.; Salas, J.D.; Boes, D.C. Regional flood frequency analysis based on a Weibull model, part 2 Simulations and applications. J. Hydrol. 2001, 242, 171–182. [Google Scholar] [CrossRef]
- Knebl, M.R.; Yang, Z.L.; Hutchison, K.; Maidment, D.R. Regional scale flood modeling using NEXRAD rainfall, GIS, and HEC-HMS/RAS: A case study for the San Antonio River Basin Summer 2002 storm event. J. Environ. Manag. 2005, 75, 325–336. [Google Scholar] [CrossRef] [PubMed]
- Merwade, V.; Cook, A.; Coonrod, J. GIS techniques for creating river terrain models for hydrodynamic modeling and flood inundation mapping. Environ. Model. Softw. 2008, 23, 1300–1311. [Google Scholar] [CrossRef]
- Pradhan, B.; Shafie, M. Flood hazard assessment for cloud prone rainy areas in a typical tropical environment. Disaster Adv. 2009, 2, 7–15. [Google Scholar]
- Rahmati, O.; Zeinivand, H.; Besharat, M. Flood hazard zoning in Yasooj region, Iran, using GIS and multi-criteria decision analysis. Geomat. Nat. Hazards Risk 2017, 7, 1000–1017. [Google Scholar] [CrossRef]
- Sanyal, J.; Lu, X.X. Remote sensing and GIS-based flood vulnerability assessment of human settlements: A case study of Gangetic West Bengal, India. Hydrol. Process. 2005, 19, 3699–3716. [Google Scholar] [CrossRef]
- Youssef, A.M.; Pradhan, B.; Hassan, A.M. Flash flood risk estimation along the St. Katherine road, southern Sinai, Egypt using GIS based morphometry and satellite imagery. Environ. Earth Sci. 2011, 62, 611–623. [Google Scholar] [CrossRef]
- Portugués-Mollá, I.; Bonache-Felici, X.; Mateu-Bellés, J.F.; Marco-Segura, J.B. A GIS-Based Model for the analysis of an urban flash flood and its hydrogeomorphic response. The Valencia event of 1957. J. Hydrol. 2016, 541, 582–596. [Google Scholar] [CrossRef]
- Ali, S.A.; Aadhar, S.; Shah, H.L.; Mishra, V. Projected Increase in Hydropower Production in India under Climate Change. Sci. Rep. 2018, 8, 12450. [Google Scholar] [CrossRef] [PubMed]
- Fowler, H.J.; Cooley, D.; Sain, S.R.; Thurston, M. Detecting change in UK extreme precipitation using results from the climateprediction.net BBC climate change experiment. Extremes 2010, 13, 241–267. [Google Scholar] [CrossRef] [Green Version]
- Kundzewicz, Z.W.; Kanae, S.; Seneviratne, S.I.; Handmer, J.; Nicholls, N.; Peduzzi, P.; Mechler, R.; Bouwer, L.M.; Arnell, N.; Mach, K.; et al. Flood risk and climate change: Global and regional perspectives. Hydrol. Sci. J. 2014, 59, 1–28. [Google Scholar] [CrossRef]
- El Shinnawy, I.; Bestawy, A.; Tahawy, T.E. Assessment and Management of Flash Floods for Sustainable Development in Al-Sail Al Kabir Area, Kingdom of Saudi Arabia. Int. J. Appl. Eng. Res. 2017, 12, 2807–2814. [Google Scholar]
- Elkhrachv, I. Flash Flood Hazard Mapping Using Satellite Images and GIS Tools: A case study of Najran City, Kingdom of Saudi Arabia (KSA). Egypt. J. Remote Sens. Space Sci. 2015, 18, 261–278. [Google Scholar] [CrossRef] [Green Version]
- Sharif, H.O.; Al-Juaidi, F.H.; Al-Othman, A.; Al-Dousary, I.; Fadda, E.; Jamal-Uddeen, S.; Elhassan, A. Flood hazards in an urbanizing watershed in Riyadh, Saudi Arabia. Geomat. Nat. Hazards Risk 2014, 7, 702–720. [Google Scholar] [CrossRef]
- Abdul Karim, A.A.A. Effect of spatial changes of urban growth and land uses on increasing flood risks in the Saudi City: Case Study of Ha’il city Using Geographical Information Systems and Remote Sensing (GIS & RS). Arab. J. Geogr. Inf. Syst. Saudi Geogr. Soc. 2013, 6. Available online: http://abjdh.com/mag/wp-content/uploads/2016/12/ABSTRACTSISSUE12622014Last.pdf (accessed on 28 February 2019).
- Embaby, A.; Abu Halawa, A.; Ramadan, M. Integrating Geotechnical Investigation with Hydrological Modeling for Mitigation of Expansive Soil Hazards in Tabuk City, Saudi Arabia. Open J. Mod. Hydrol. 2017, 7, 11. [Google Scholar] [CrossRef]
- Abushandi, E. Flash flood simulation for Tabuk City catchment, Saudi Arabia. Arab. J. Geosci. 2016, 9, 188. [Google Scholar] [CrossRef]
- Al-Laboun, A.A. The Subsurface Stratigraphy of Pre-Khuff Formation in Central and Northwestern Arabia. Ph.D. Thesis, Faculty of Earth Sciences, King Abdulaziz University, Jeddah, Saudi Arabia, 1982. [Google Scholar]
- Edgell, H.S. Aquifers of Saudi Arabia and their Geological Framework. Arab. J. Sci. Eng. 1997, 22, 5–31. [Google Scholar]
- Halimi, M.; Sedighifar, Z.; Mohammadi, C. Analyzing spatiotemporal landuse/cover dynamic using remote sensing imagery and GIS techniques case: Kan basin of Iran. GeoJournal 2017, 83, 1067–1077. [Google Scholar] [CrossRef]
- Park, S.; Jeon, S.; Kim, S.; Choi, C. Prediction and comparison of urban growth by land suitability index mapping using GIS and RS in South Korea. Landsc. Urban Plan. 2011, 99, 104–114. [Google Scholar] [CrossRef]
- Rimal, B.; Zhang, L.; Stork, N.; Sloan, S.; Rijal, S. Urban Expansion Occurred at the Expense of Agricultural Lands in the Tarai Region of Nepal from 1989 to 2016. Sustainability 2018, 10, 1341. [Google Scholar] [CrossRef]
- Zhao, M.; Cheng, W.; Zhou, C.; Li, M.; Huang, K.; Wang, N. Assessing Spatiotemporal Characteristics of Urbanization Dynamics in Southeast Asia Using Time Series of DMSP/OLS Nighttime Light Data. Remote Sens. 2018, 10, 47. [Google Scholar] [CrossRef]
- Lillesand, T.M.; Kiefer, R.W. Remote Sensing and Image Interpretation, 3rd ed.; John Wiley & Sons: New York, NY, USA, 1994; p. 750. [Google Scholar]
- HYFRAN Manual. Developed by INRS-Eau with Collaboration of Hydro-Quebec Hydraulic. 1998. Available online: https://www.wrpllc.com/books/HyfranPlus/hyfranplusgeneralinfo.html (accessed on 28 February 2019).
- US Army Corps of Engineers (USACE). Hydrologic Modeling System HEC-HMS Technical Reference Manual; Hydrologic Engineering Center: Davis, CA, USA, 2000.
- Soil Conservation Services (SCS). National Engineering Handbook, Section 4: Hydrology; US Department of Agriculture, Soil Conservation Service, Engineering Division: Washington, DC, USA, 1985.
- Ponce, V.M.; Hawkins, R.H. Runoff Curve Number: Has It Reached Maturity. J. Hydrol. Eng. 1996, 1, 9–20. [Google Scholar] [CrossRef]
- US Army Corps of Engineers (USACE). HEC-1 Flood Hydrograph Package User’s Manual; Hydrologic Engineering Center (HEC): Davis, CA, USA, 1998.
- Barkhordai, J.; Telvari, A.; Ghyasi, N.; Rastgar, H. Checking and evaluating synthetic unit hydrograph methods in flood estimation in Sikhoran watershed. Res. Constr. J. Nat. Resour. 2006, 71, 57–65. [Google Scholar]
- Majidi, A.; Moradi, M.; Vagharfard, H.; Purjenaie, A. Evaluation of Synthetic Unit Hydrograph (SCS) and Rational Methods in Peak Flow Estimation (Case Study: Khoshehaye Zarrin Watershed, Iran). Int. J. Hydraul. Eng. 2012, 5, 43–47. [Google Scholar] [CrossRef]
- Istomina, M.N.; Kocharyan, A.G.; Lebedeva, I.P. Floods: Genesis, socioeconomic and environmental impacts. Water Resour. 2005, 32, 349–358. [Google Scholar] [CrossRef]
- Brath, A.; Montanari, A.; Moretti, G. Assessing the effect on flood frequency of land use change via hydrological simulation (with uncertainty). J. Hydrol. 2006, 324, 141–153. [Google Scholar] [CrossRef]
- Mao, D.; Cherkauer, K.A. Impacts of land-use change on hydrologic responses in the Great Lakes region. J. Hydrol. 2009, 374, 71–82. [Google Scholar] [CrossRef]
- Sheng, J.; Wilson, J.P. Watershed urbanization and changing flood behavior across the Los Angeles metropolitan region. Nat. Hazards 2009, 48, 41–57. [Google Scholar] [CrossRef]
- Solin, L.; Feranec, J.; Novacek, J. Land cover changes in small catchments in Slovakia during 1990-2006 and their effects on frequency of flood events. Nat. Hazards 2011, 56, 195–214. [Google Scholar] [CrossRef]
- Suarez, P.; Anderson, W.; Mahal, V.; Lakshmanan, T.R. Impacts of flooding and climate change on urban transportation: A system wide performance assessment of the Boston Metro Area. Transp. Res. 2005, 10, 231–244. [Google Scholar] [CrossRef]
- Ramachandra, T.V.; Mujumdar, P.P. Urban floods: Case study of Bangalore. Disaster Dev. 2009, 3, 1–98. [Google Scholar]
- Huong, H.T.L.; Pathirana, A. Urbanization and climate change impacts on future urban flooding in Can Tho city, Vietnam. Hydrol. Earth Syst. Sci. 2013, 17, 379–394. [Google Scholar] [CrossRef] [Green Version]
- Neuvel, J.M.M.; van den Brink, A. Flood risk management inDutch local spatial planning practices. J. Environ. Plan. Manag. 2009, 52, 865–880. [Google Scholar] [CrossRef]
- Audisio, C.; Turconi, L. Urban floods: A case study in the Savigliano area (North-Western Italy). Nat. Hazards Earth Syst. Sci. 2011, 11, 2951–2964. [Google Scholar] [CrossRef]
- Špitalar, M.; Gourley, J.J.; Lutoff, C.; Kirstetter, P.E.; Brilly, M.; Carr, N. Analysis of flash flood parameters and human impacts in the US from 2006 to 2012. J. Hydrol. 2014, 519, 863–870. [Google Scholar] [CrossRef]
- Ran, J.; Nedovic-Budic, Z. Integrating spatial planning and flood risk management: A new conceptual framework for the spatially integrated policy infrastructure. Comput. Environ. Urban Syst. 2016, 57, 68–79. [Google Scholar] [CrossRef] [Green Version]
- Sanyal, J.; Lu, X.X. Application of remote sensing in flood management with special reference to monsoon Asia: A review. Nat. Hazards 2004, 33, 283–301. [Google Scholar] [CrossRef]
- Dewan, A.M.; Islam, M.M.; Kumamoto, T.; Nishigaki, M. Evaluating flood hazard for land-use planning in Greater Dhaka of Bangladesh using remote sensing and GIS techniques. Water Resour. Manag. 2007, 21, 1601–1612. [Google Scholar] [CrossRef]
- Kadiogullari, A.I.; Baskent, E.Z. Spatial and temporal dynamics of land use pattern in Eastern Turkey: A case study in Gumushane. Environ. Monit. Assess. 2008, 138, 289–303. [Google Scholar] [CrossRef] [PubMed]
- Chen, J.; Hill, A.A.; Urbano, L.D. A GIS-based model for urban flood inundation. J. Hydrol. 2009, 373, 184–192. [Google Scholar] [CrossRef]
- Mishra, A.K. A study on the occurrence of flood events over Jammu and Kashmir during September 2014 using satellite remote sensing. Nat. Hazards 2015, 78, 1463–1467. [Google Scholar] [CrossRef]


| Equation | Formula | Description |
|---|---|---|
| (1) | tc = time of concentration (min); L = maximum flow distance (m); S = maximum flow distance slope (%); TLAG = lag time (hour); Sr = maximum effort for soil moisture (maximum retention) calculated from curve number (cm); Y = basin slope (%); P = rainfall for different return periods (cm); Ia = amount of water before occurrence of flood, such as filtration and suspended rain on plants; qp = peak discharge (m3/s); A = basin area (km2); Tp = time to peak (hour); Q = direct runoff (mm); Δt = duration of designed stormwater | |
| (2) | ||
| (3) | ||
| (4) | ||
| (5) | ||
| (6) | ||
| (7) | ||
| (8) | Tp = Δt/2 + TLAG |
| Return period (year) | 2 | 3 | 5 | 10 | 20 | 50 | 100 |
|---|---|---|---|---|---|---|---|
| Rainfall within 24 h (mm) | 7.74 | 11.5 | 16.8 | 25.1 | 35 | 51 | 65.5 |
| Basin Name | Basin Area (km2) | Maximum Flow Distance (km) | Basin Slope (m/m) | Lag Time (min) | Time of Concentration (min) |
|---|---|---|---|---|---|
| Wadi Dabban | 603.8 | 43.9 | 0.03010 | 166.8 | 278.0 |
| Wadi Al-Baqar | 658.9 | 72.9 | 0.12780 | 141.2 | 235.3 |
| Wadi Al-Ghowail | 2343.5 | 81.5 | 0.07940 | 184.7 | 307.9 |
| Wadi Abu Nashifa | 2771.3 | 103.9 | 0.11490 | 193.2 | 321.9 |
| Wadi Al-Akhader | 10,345.7 | 188.2 | 0.06110 | 389.3 | 648.8 |
| Basin Name | Description | Return Periods (years) | ||||
|---|---|---|---|---|---|---|
| 5 | 10 | 20 | 50 | 100 | ||
| Wadi Dabban | Peak discharge (m3/s) | 1.69 | 15.42 | 46.07 | 118.80 | 201.26 |
| Flood volume × 1000 (m3) | 113.80 | 1102.50 | 3277.40 | 8327.20 | 13,981.80 | |
| Wadi Al-Baqar | Peak discharge (m3/s) | 3.32 | 24.59 | 72.64 | 187.23 | 317.33 |
| Flood volume × 1000 (m3) | 171.00 | 1357.60 | 3860.50 | 9563.70 | 15,885.60 | |
| Wadi Al-Ghowail | Peak discharge (m3/s) | 3.81 | 46.37 | 145.71 | 385.36 | 659.65 |
| Flood volume × 1000 (m3) | 286.40 | 3700.40 | 11,626.80 | 30,450.40 | 51,781.00 | |
| Wadi Abu Nashifa | Peak discharge (m3/s) | 4.52 | 54.98 | 172.77 | 456.94 | 782.25 |
| Flood volume × 1000 (m3) | 338.90 | 4375.70 | 13,748.70 | 36,007.80 | 61,231.30 | |
| Wadi Al-Akhader | Peak discharge (m3/s) | 17. 03 | 145.32 | 421.92 | 1058.90 | 1768.41 |
| Flood volume × 1000 (m3) | 2354.50 | 20,252.80 | 58,670.80 | 146,911.70 | 245,146.60 | |
| Factor | Year | |||
|---|---|---|---|---|
| 1975 | 1998 | 2008 | 2018 | |
| Number of sub-basins intersecting urban areas | 1 | 13 | 16 | 18 |
| Area of sub-basins including urban areas (km2) | 200.42 | 2129.27 | 2284.78 | 2646.93 |
| Area of flood-prone areas in sub-basins (km2) | 24.56 | 319.28 | 392.96 | 442.08 |
| Agricultural area distribution (km2) (Figure 5) | 5.80 | 136.80 | 221.90 | 281.13 |
| Area of urban distribution in sub-basins (km2) (Figure 6) | 1.59 | 50.37 | 64.35 | 118.58 |
| Factor | Annual Increase between 1975 and 1998/Variation Rate (%) | Annual Increase between 1998 and 2008/Variation Rate (%) | Annual Increase between 2008 and 2018/Variation Rate (%) |
|---|---|---|---|
| Number of sub-basins intersecting urban areas | 0.52/1200% | 0.3/23.1% | 0.2/12.5% |
| Area of sub-basins including urban areas (km2) | 83.86/962.4% | 15.55/7.3% | 36.22/15.9% |
| Area of flood-prone areas in sub-basins (km2) | 12.81/1200% | 7.37/23.1% | 4.91/12.5% |
| Agricultural area distribution (km2) (Figure 5) | 5.70/2258.6% | 8.51/62.2% | 5.92/26.7% |
| Area of urban distribution in sub-basins (km2) (Figure 6) | 2.12/3061% | 1.39/27.7% | 5.42/84.3% |
© 2019 by the authors. Licensee MDPI, Basel, Switzerland. This article is an open access article distributed under the terms and conditions of the Creative Commons Attribution (CC BY) license (http://creativecommons.org/licenses/by/4.0/).
Share and Cite
Abdelkarim, A.; Gaber, A.F.D.; Youssef, A.M.; Pradhan, B. Flood Hazard Assessment of the Urban Area of Tabuk City, Kingdom of Saudi Arabia by Integrating Spatial-Based Hydrologic and Hydrodynamic Modeling. Sensors 2019, 19, 1024. https://0-doi-org.brum.beds.ac.uk/10.3390/s19051024
Abdelkarim A, Gaber AFD, Youssef AM, Pradhan B. Flood Hazard Assessment of the Urban Area of Tabuk City, Kingdom of Saudi Arabia by Integrating Spatial-Based Hydrologic and Hydrodynamic Modeling. Sensors. 2019; 19(5):1024. https://0-doi-org.brum.beds.ac.uk/10.3390/s19051024
Chicago/Turabian StyleAbdelkarim, Ashraf, Ahmed F. D. Gaber, Ahmed M. Youssef, and Biswajeet Pradhan. 2019. "Flood Hazard Assessment of the Urban Area of Tabuk City, Kingdom of Saudi Arabia by Integrating Spatial-Based Hydrologic and Hydrodynamic Modeling" Sensors 19, no. 5: 1024. https://0-doi-org.brum.beds.ac.uk/10.3390/s19051024