Sub-ppm Formaldehyde Detection by n-n TiO2@SnO2 Nanocomposites

 , , ,
, , , 
Abstract
:1. Introduction
2. Materials and Methods
2.1. Materials Synthesis
2.2. Materials Characterization
3. Results and Discussion
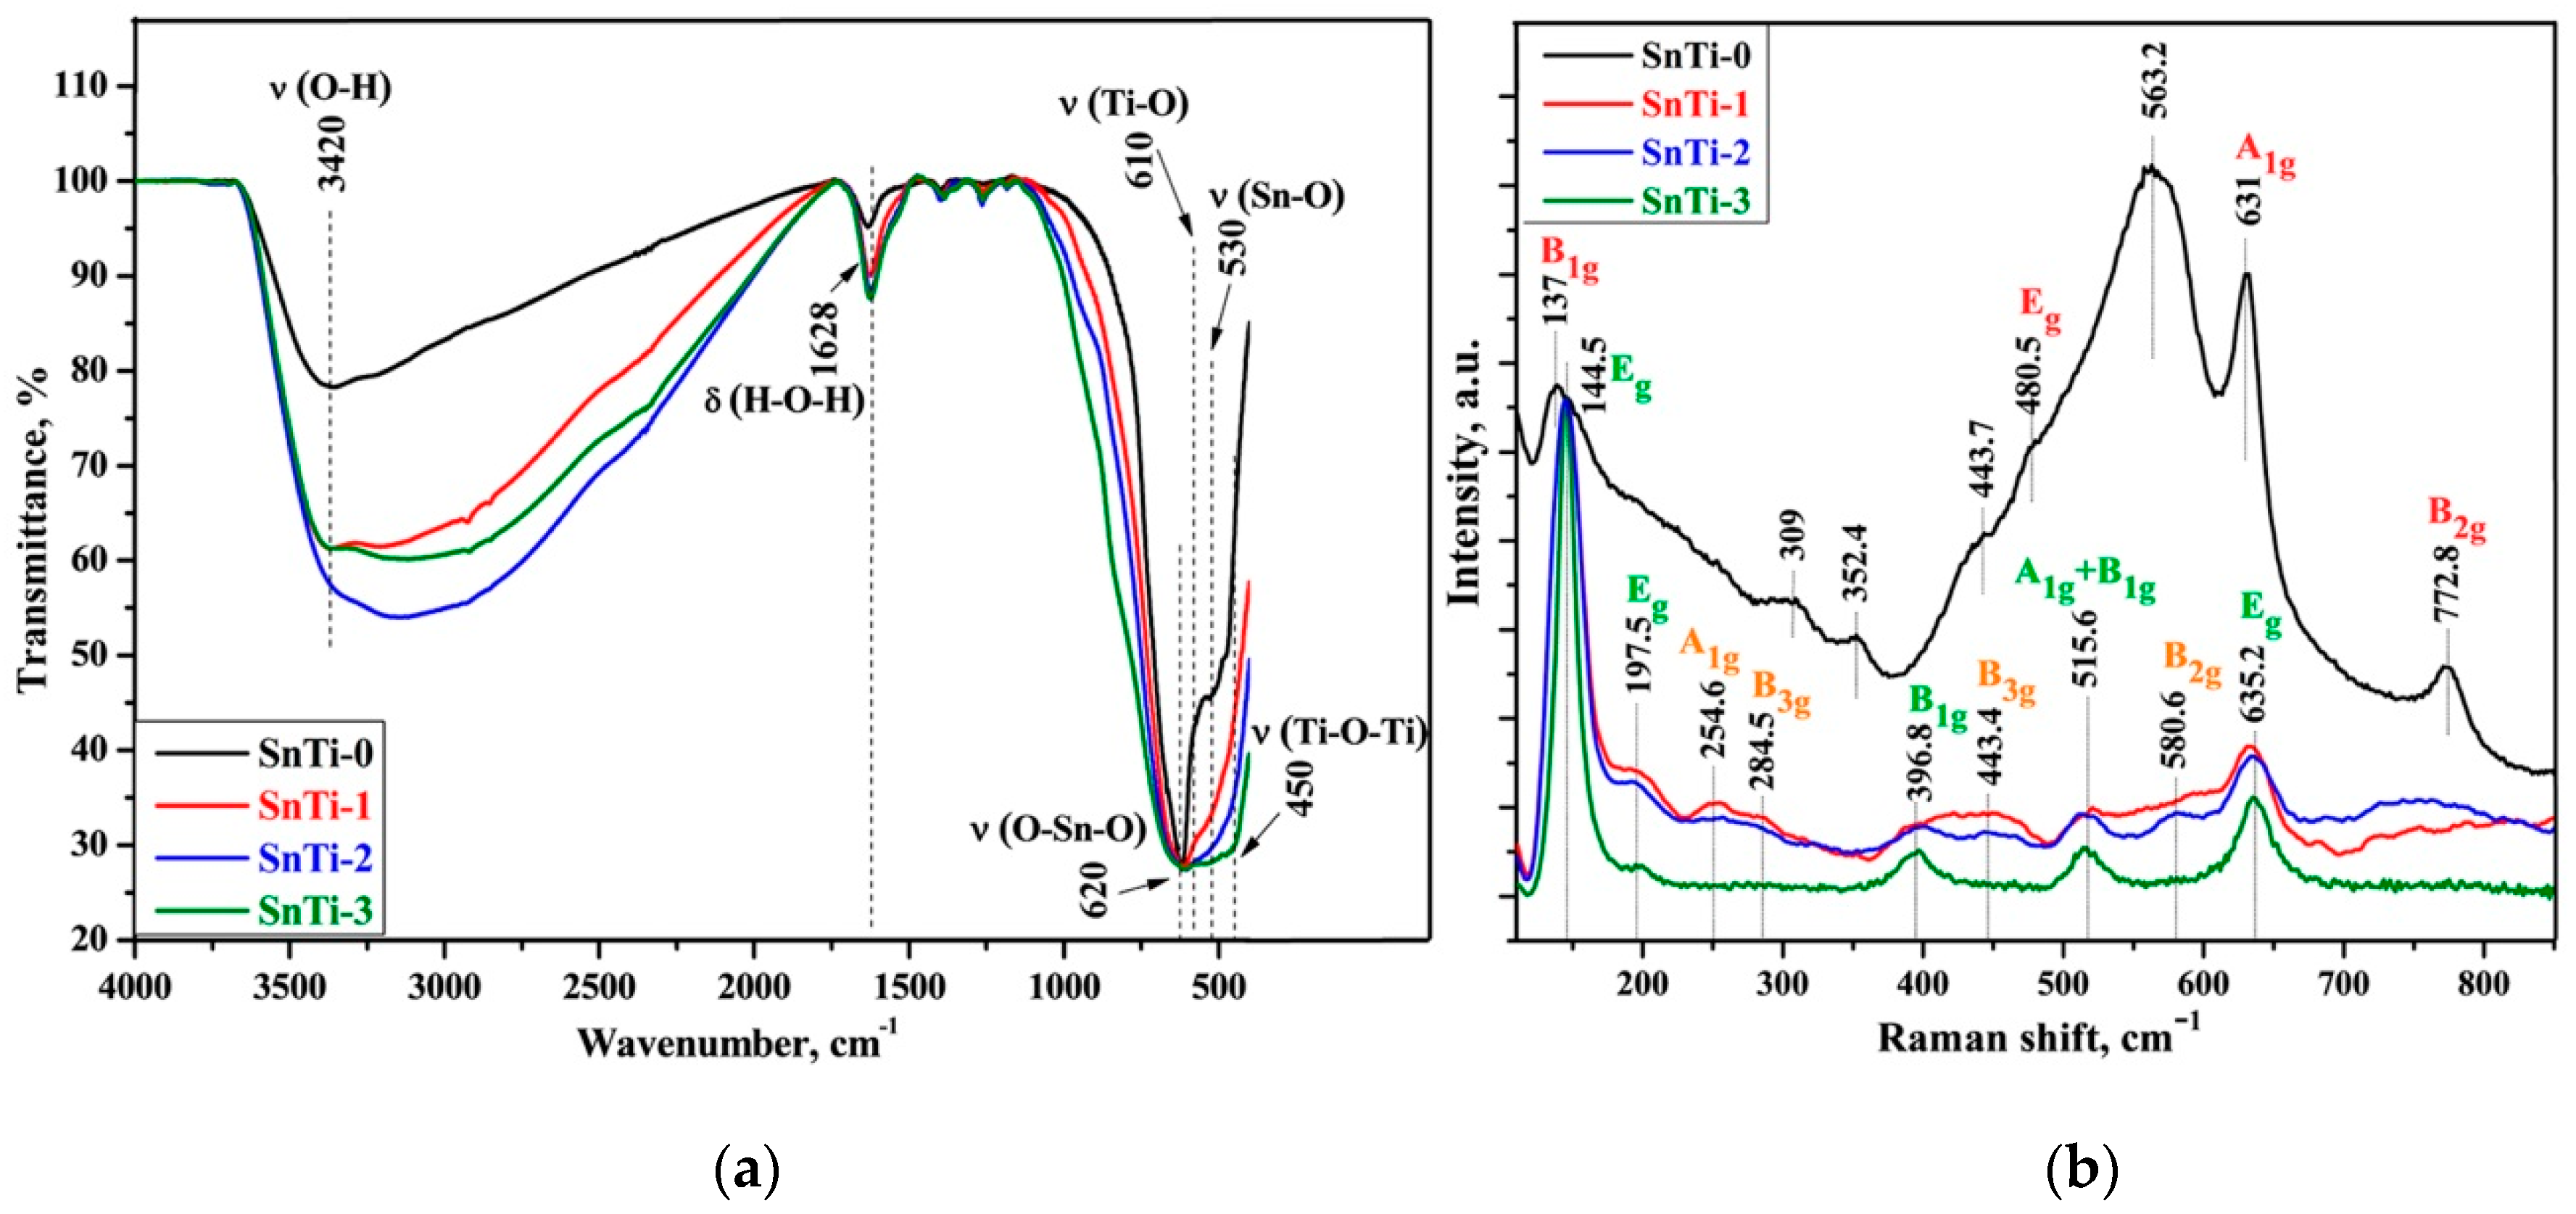
3.1. Characteristics of Nanocrystalline SnO2 and TiO2@SnO2 Nanocomposites
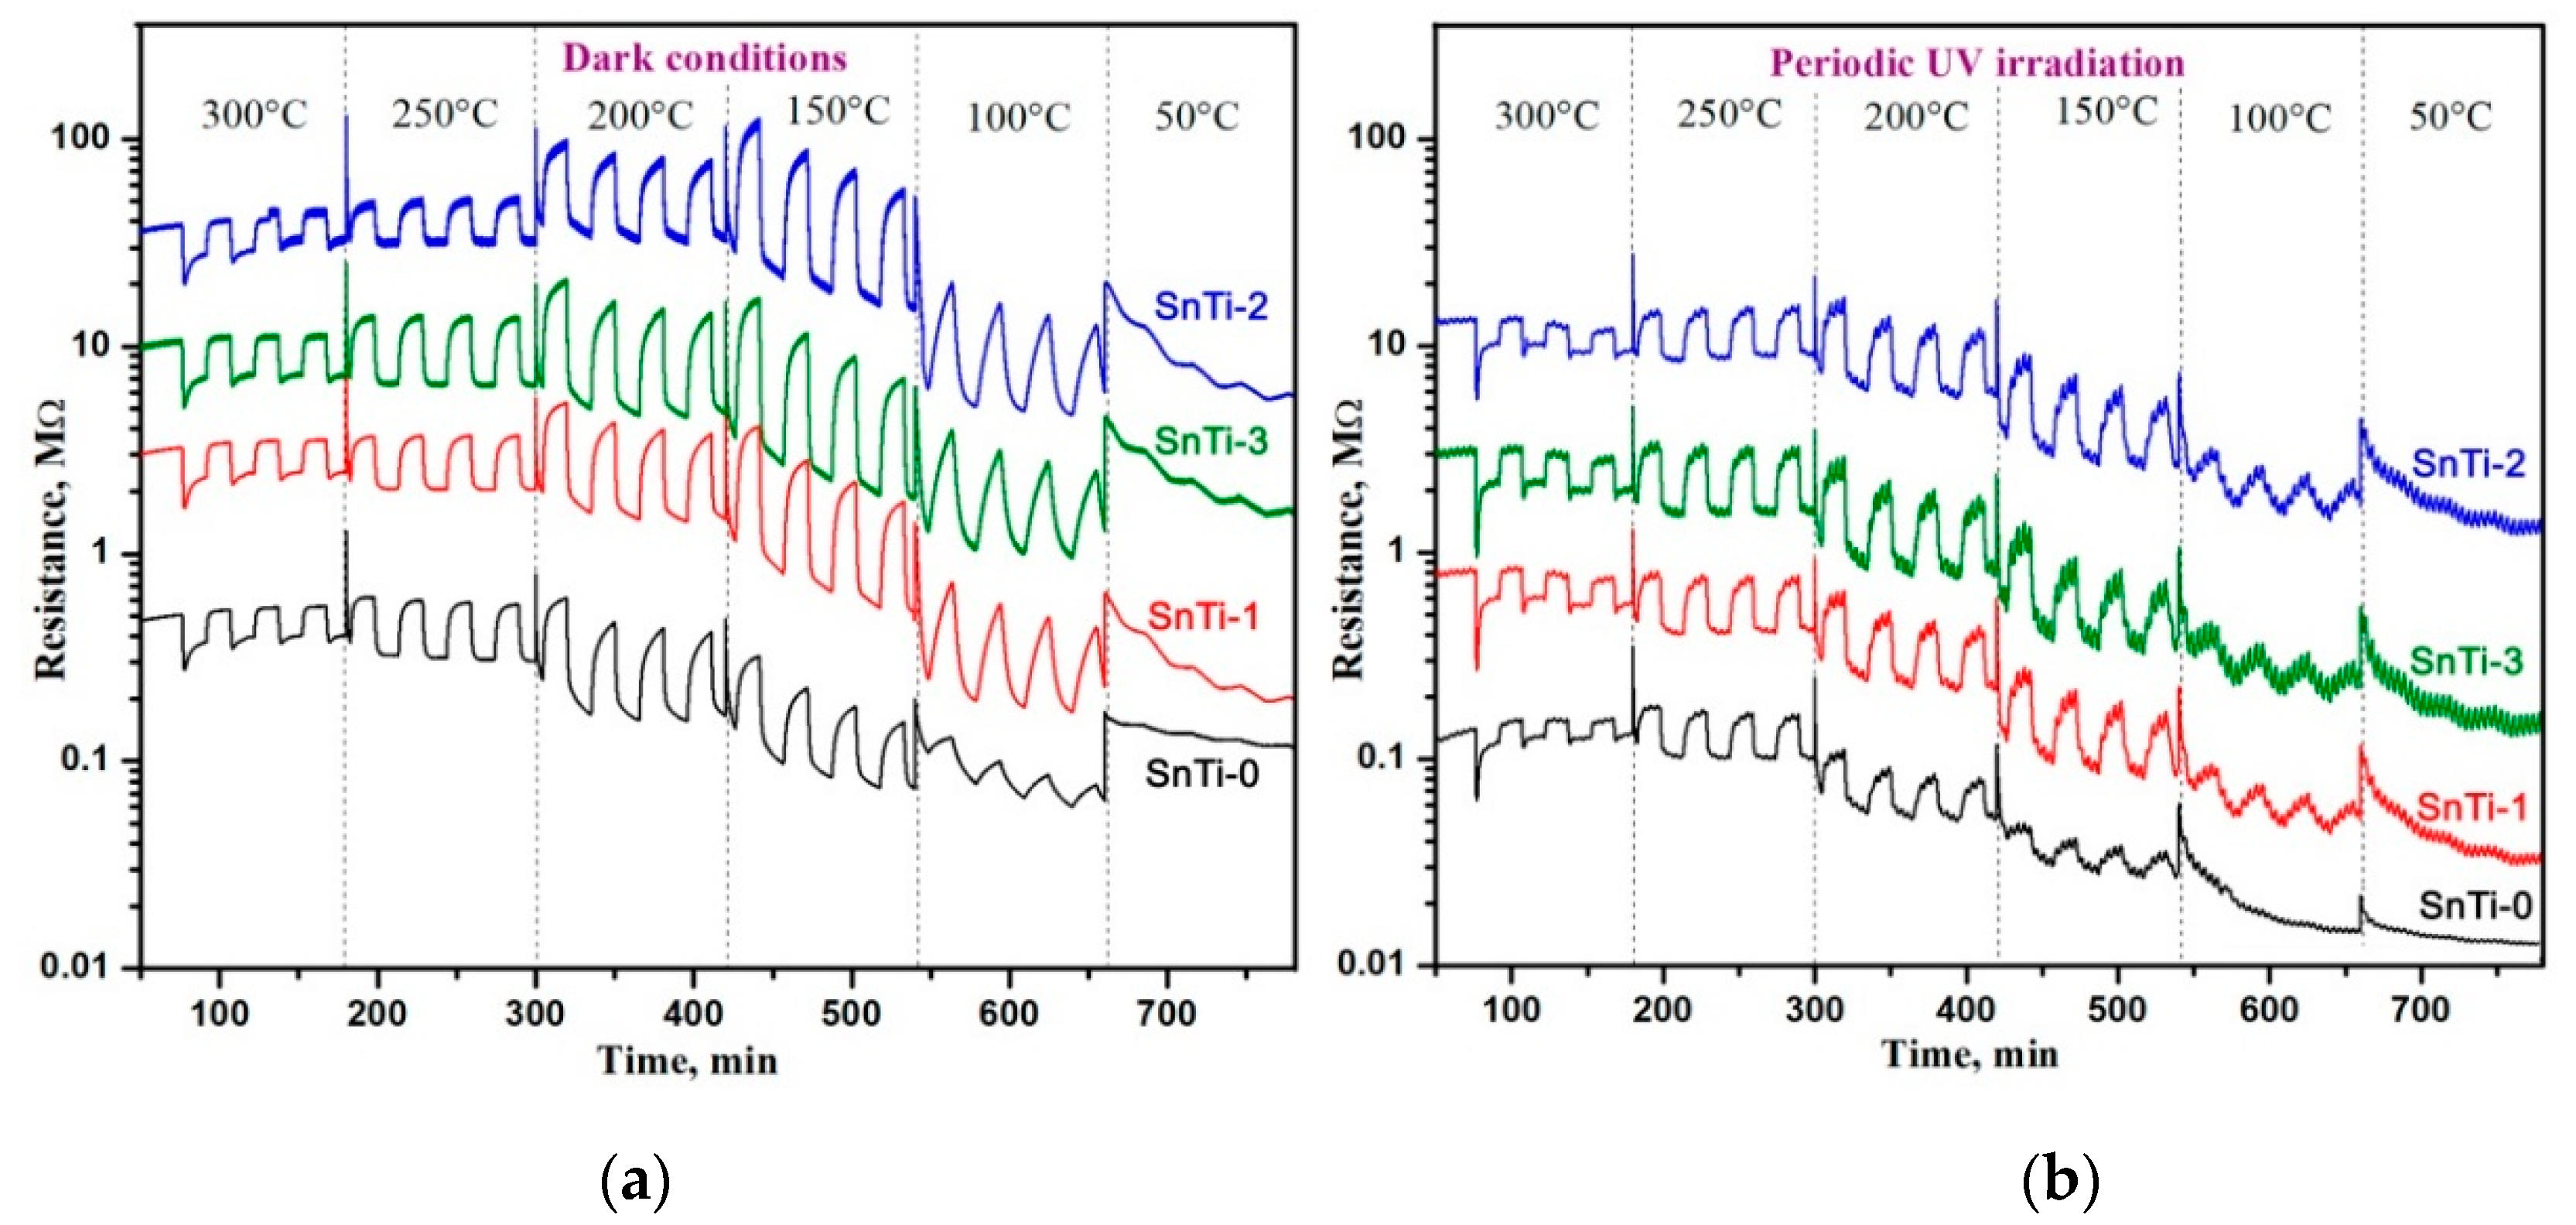
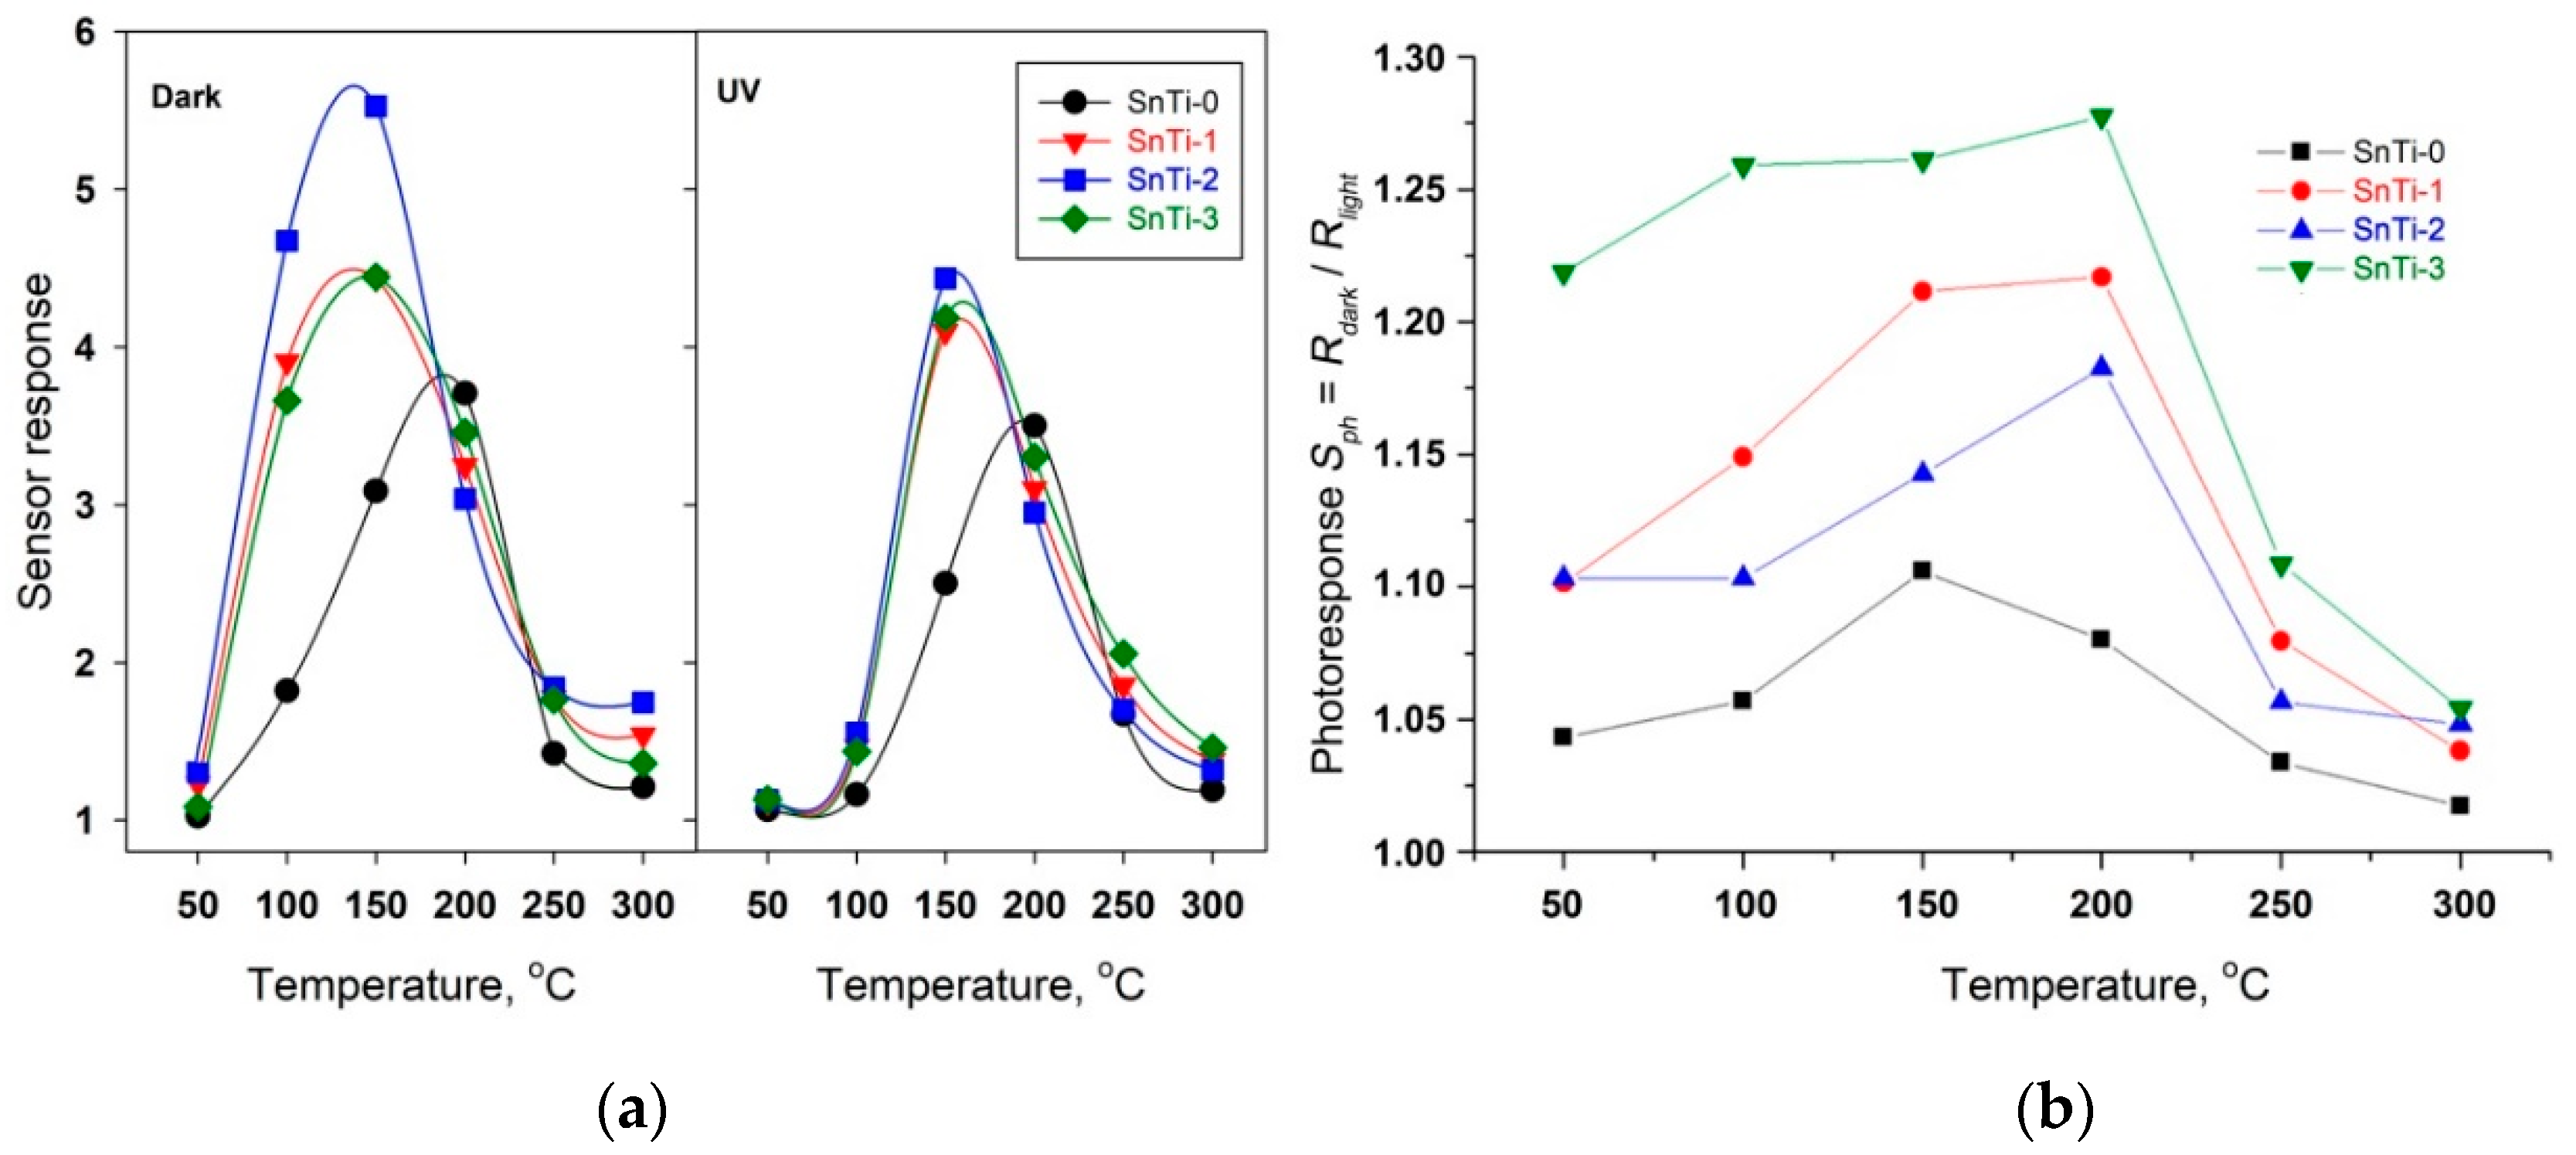
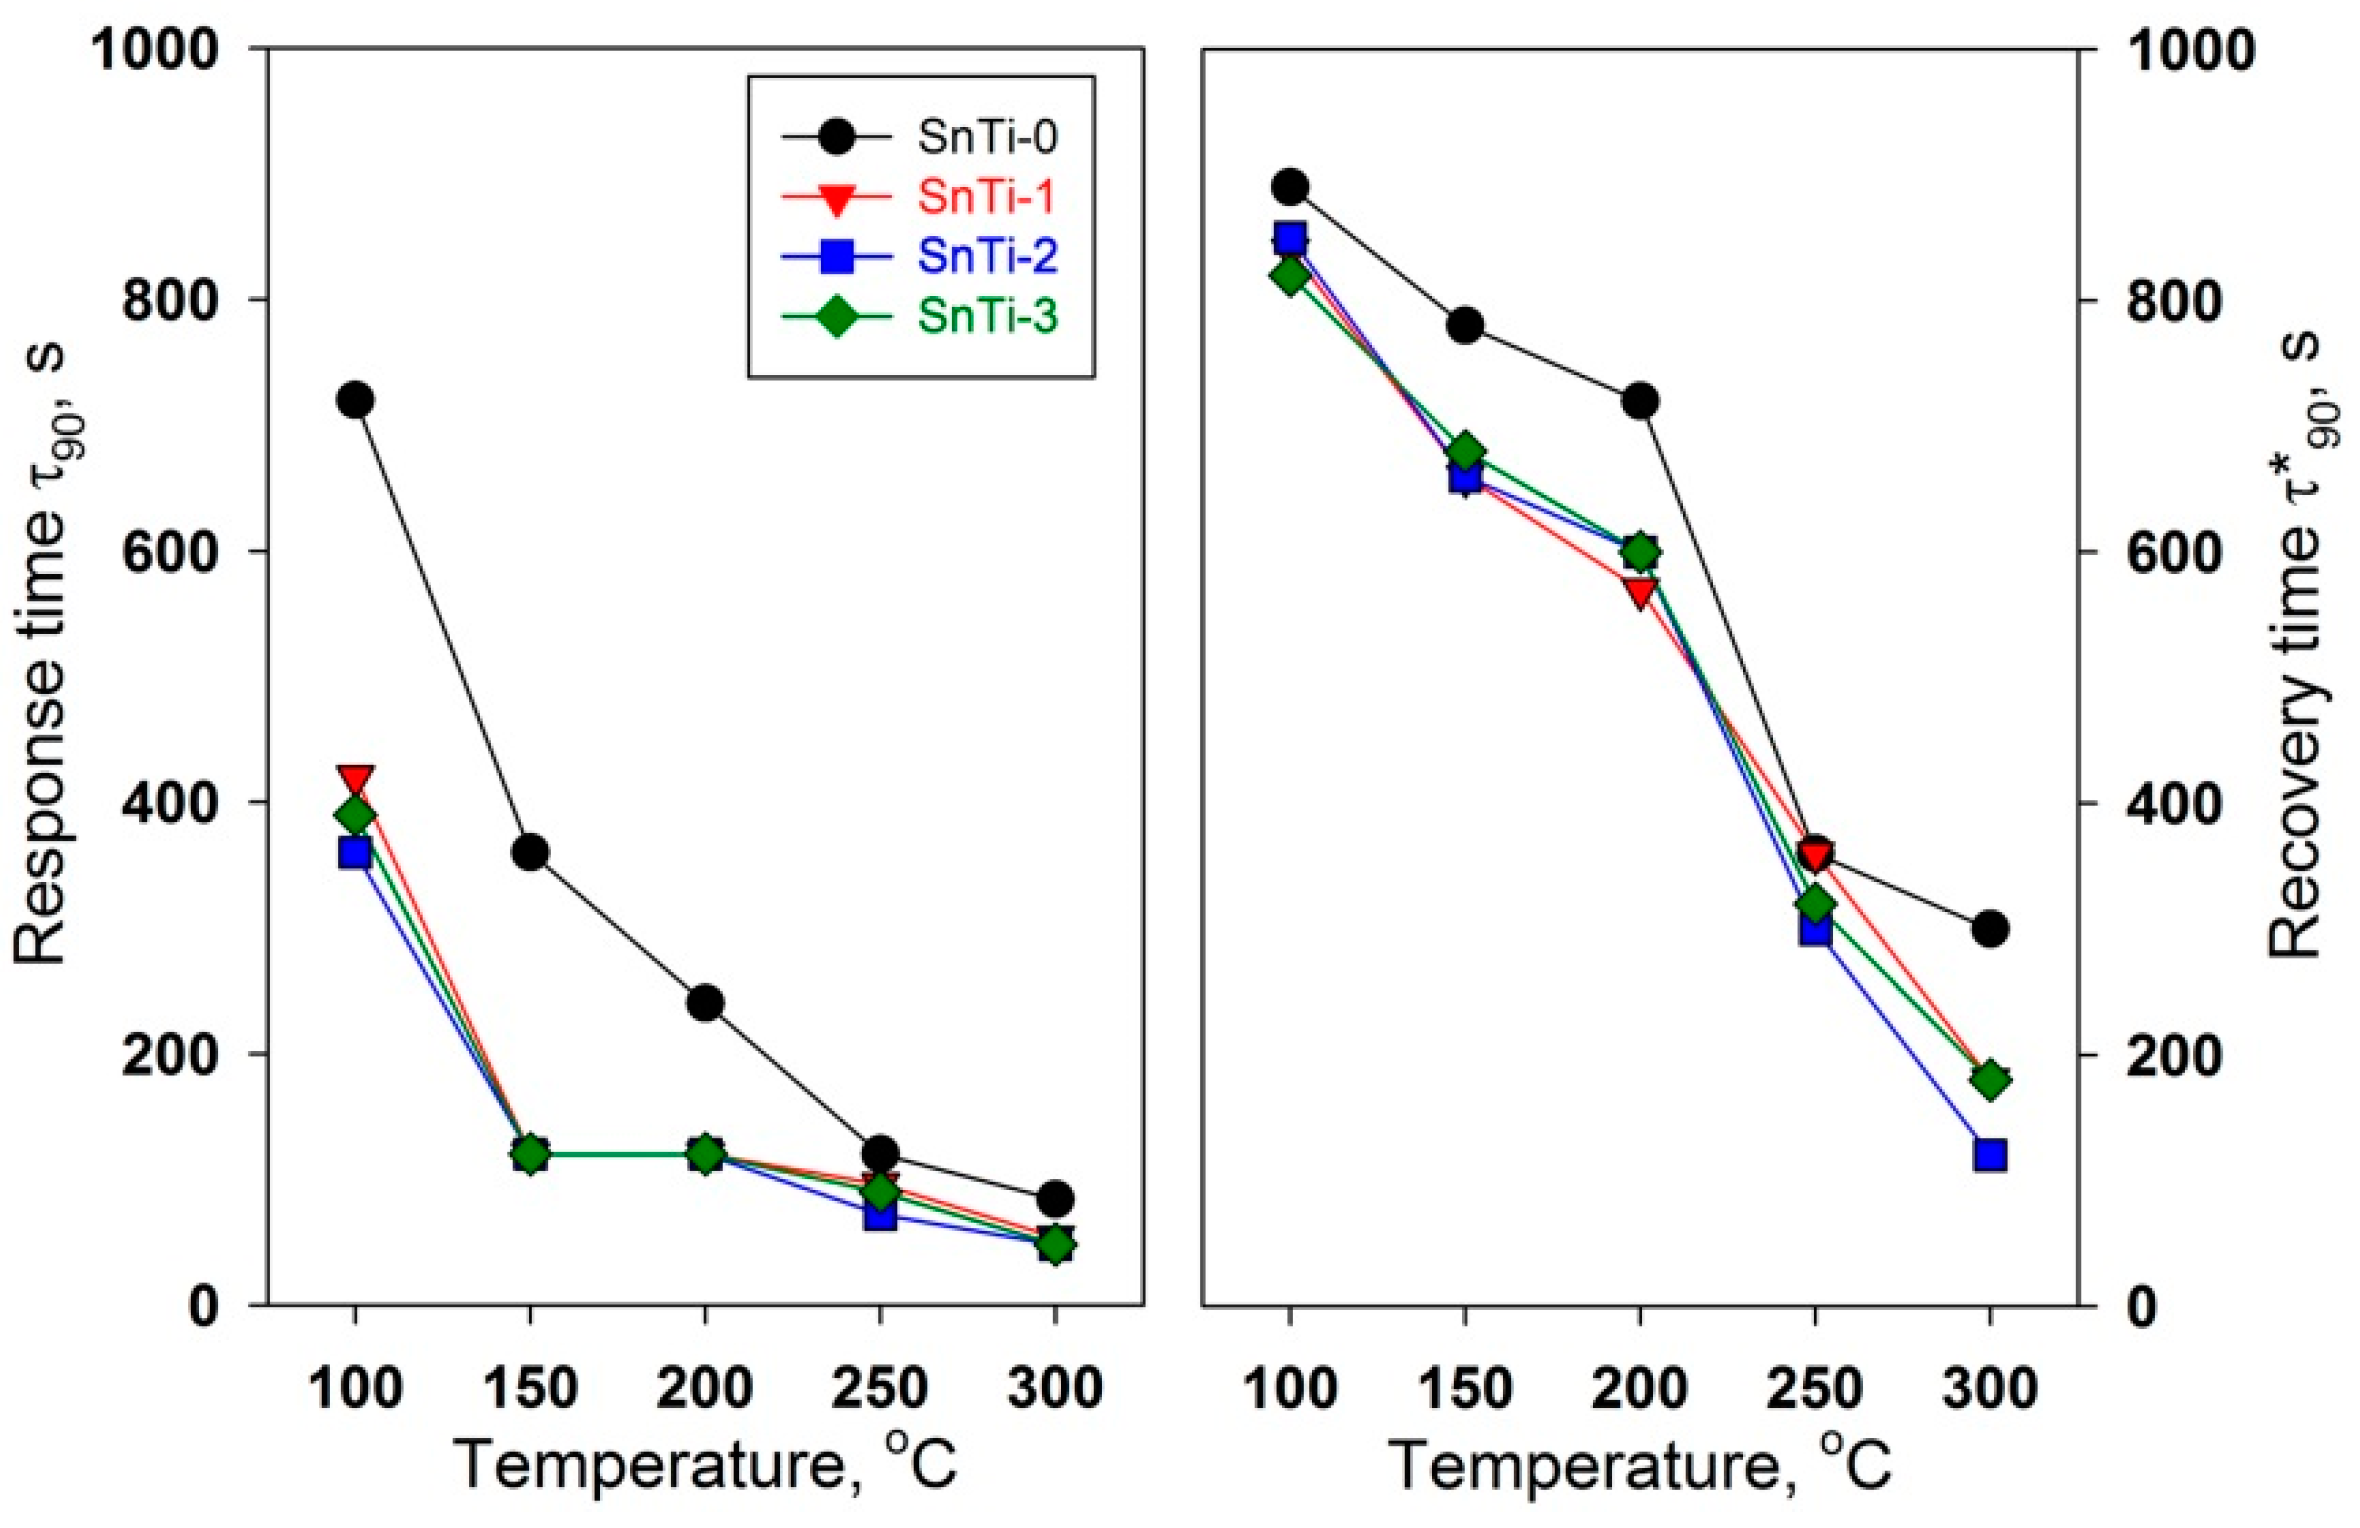
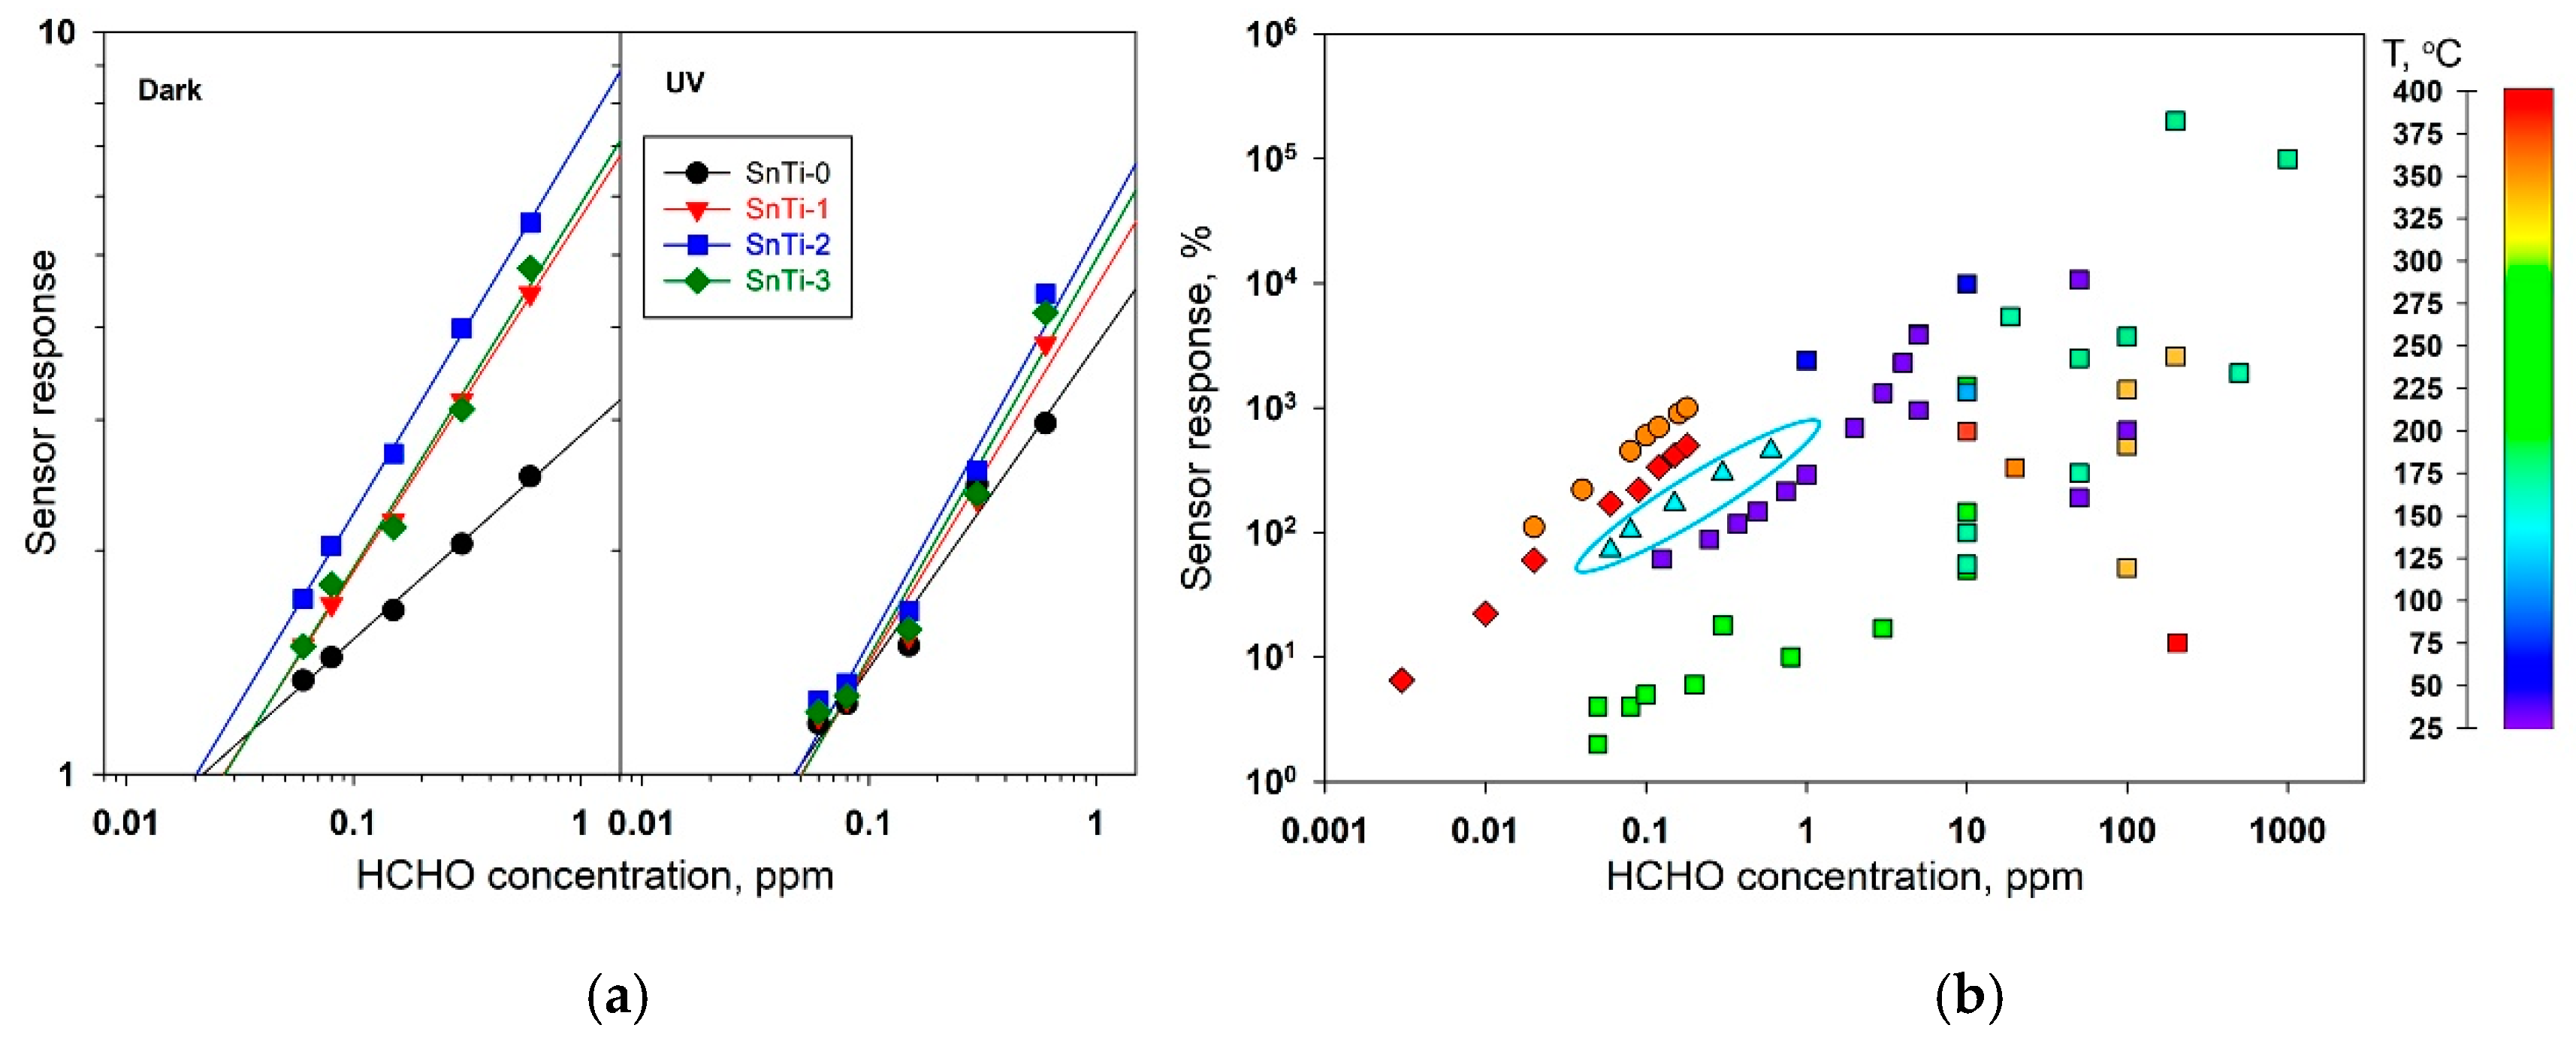
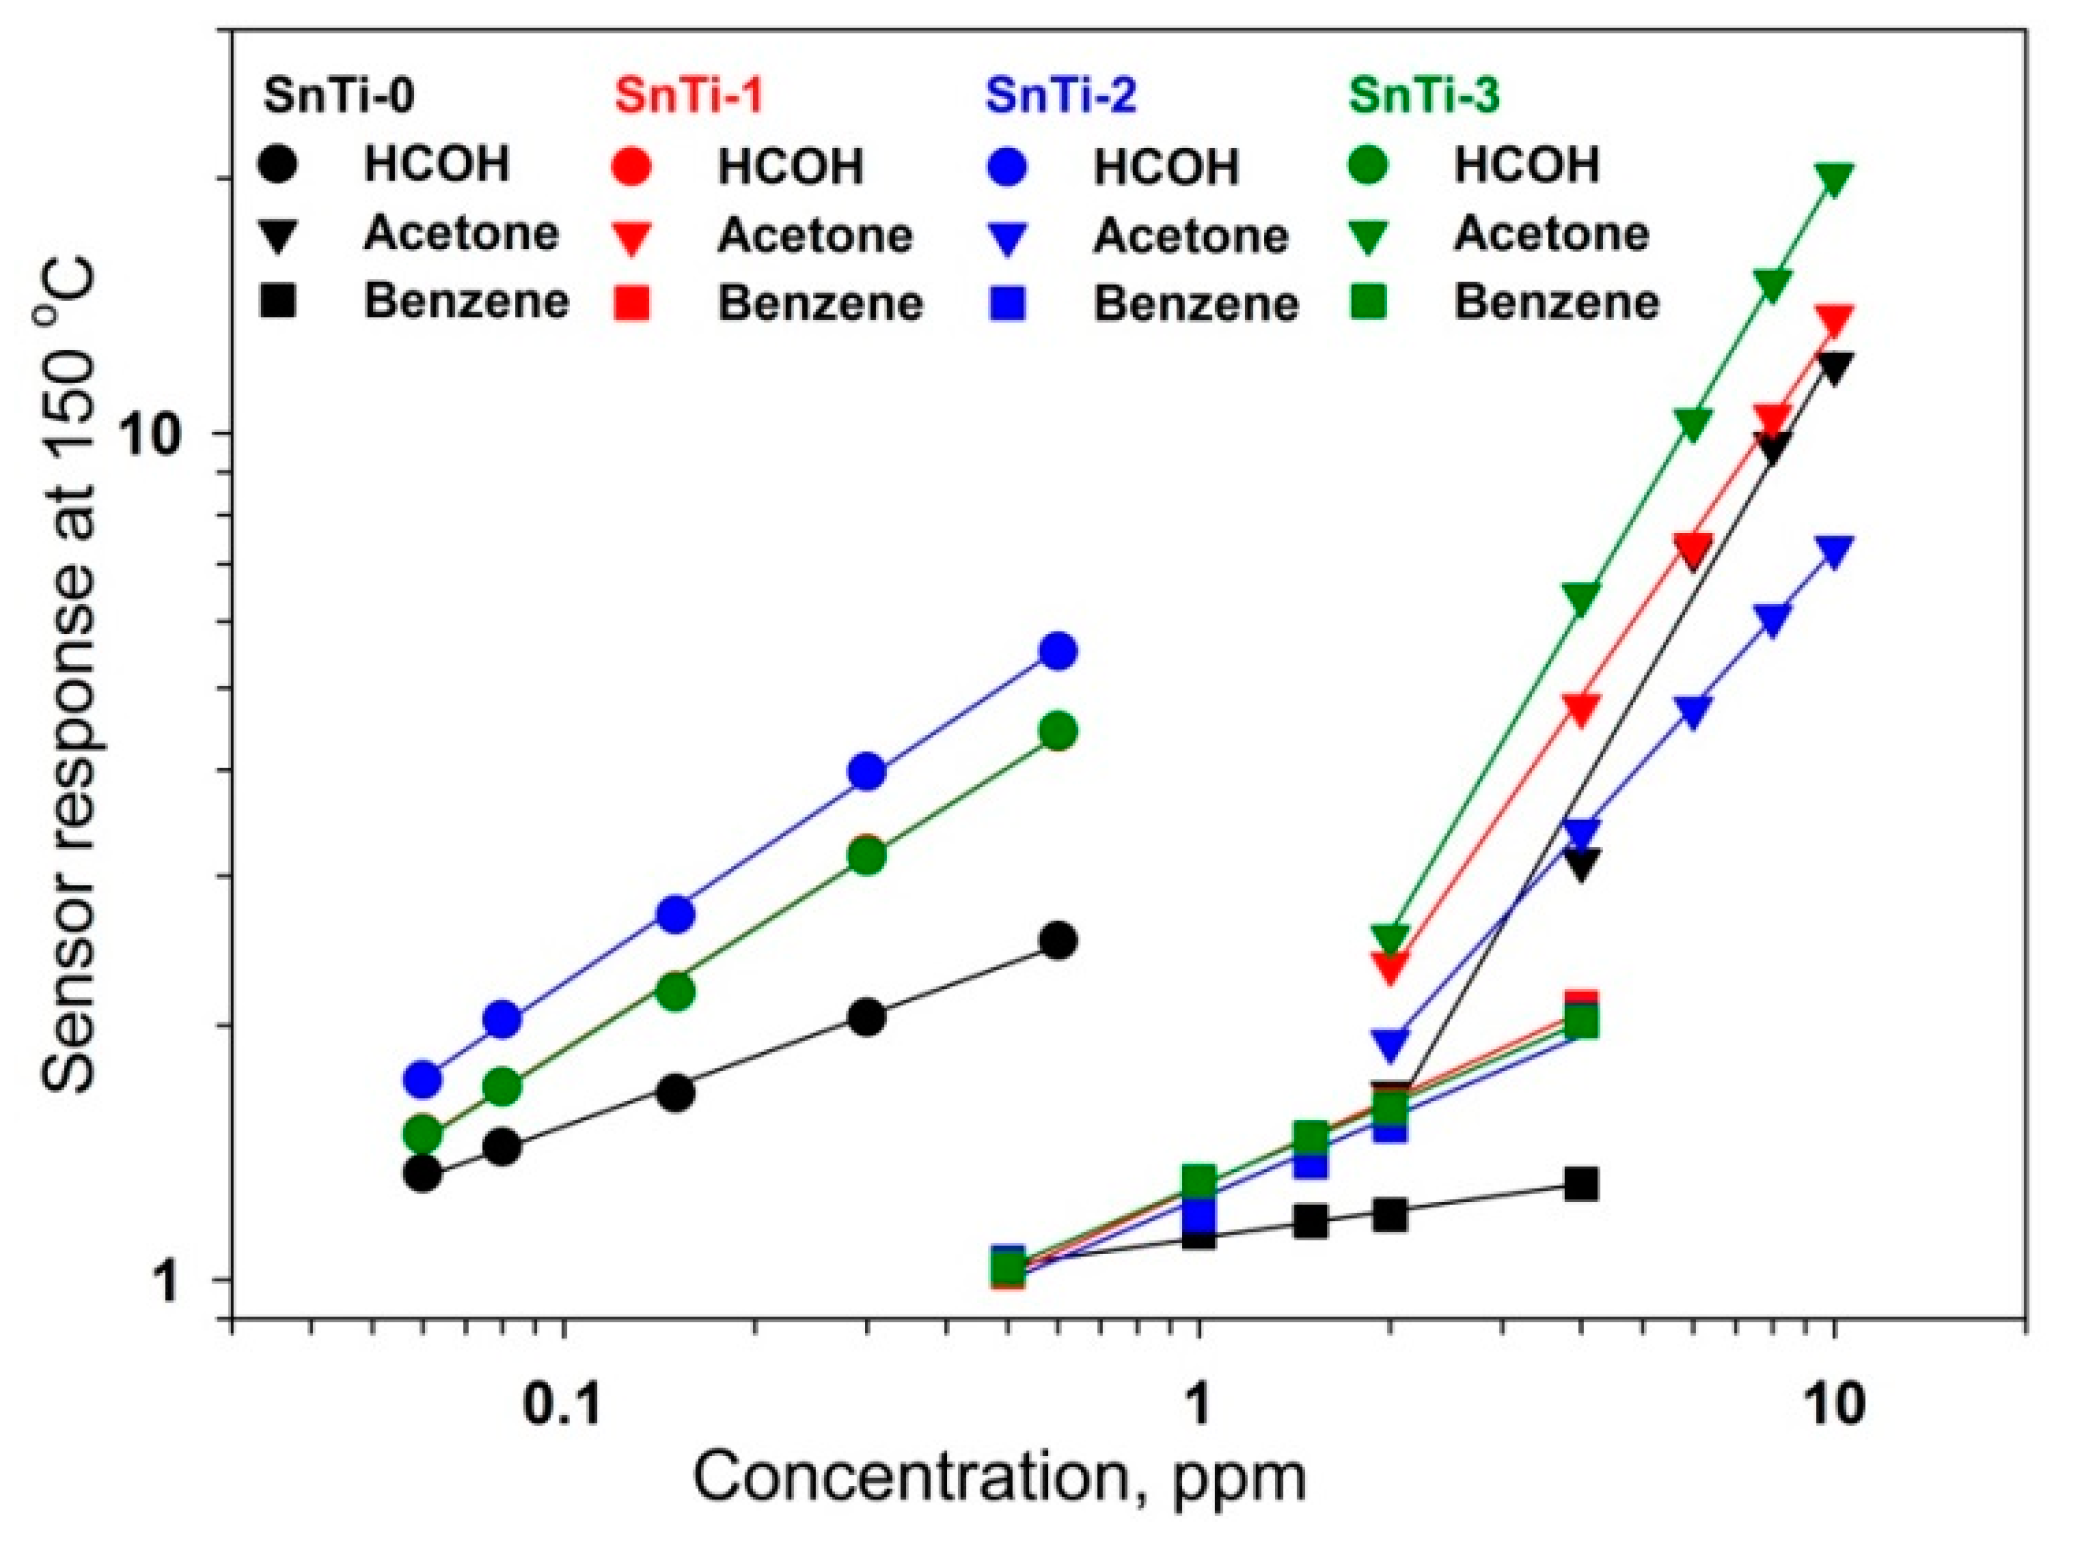
3.2. Gas Sensor Properties
4. Conclusions
Author Contributions
Funding
Acknowledgments
Conflicts of Interest
References
- World Health Organization (WHO). WHO Guidelines for Indoor Air Quality: Selected Pollutants. Available online: www.euro.who.int_data/assets/pdf_file/0009/128169/e94535/pdf (accessed on 7 July 2019).
- Nielsen, G.D.; Larsen, S.T.; Wolkoff, P. Re-evaluation of the WHO (2010) formaldehyde indoor air quality guideline for cancer risk assessment. Arch. Toxicol. 2017, 91, 35–61. [Google Scholar] [CrossRef]
- Konvalina, G.; Haik, H. Sensors for Breath Testing: From Nanomaterials to Comprehensive Disease Detection. Acc. Chem. Res. 2014, 47, 66–76. [Google Scholar] [CrossRef] [PubMed]
- Hakim, M.; Broza, Y.Y.; Barash, O.; Peled, N.; Phillips, M.; Amann, A.; Haick, H. Volatile Organic Compounds of Lung Cancer and Possible Biochemical Pathways. Chem. Rev. 2012, 112, 5949–5966. [Google Scholar] [CrossRef] [PubMed]
- Fuchs, P.; Loeseken, C.; Schubert, J.K.; Miekisch, W. Breath gas aldehydes as biomarkers of lung cancer. Int. J. Cancer 2010, 126, 2663–2670. [Google Scholar] [CrossRef] [PubMed]
- Güntner, A.T.; Abegg, S.; Königstein, K.; Gerber, P.A.; Schmidt-Trucksäss, A.; Pratsinis, S.E. Breath Sensors for Health Monitoring. ACS Sens. 2019, 42, 268–280. [Google Scholar] [CrossRef] [PubMed]
- Gütner, A.T.; Koren, V.; Chikkadi, K.; Righettoni, M.; Pratsinis, S.E. E-Nose Sensing of Low-ppb Formaldehyde in Gas Mixtures at High Relative Humidity for Breath Screening of Lung Cancer? ACS Sens. 2016, 1, 528–535. [Google Scholar] [CrossRef]
- Lv, P.; Tang, Z.; Wei, G.; Yu, J.; Huang, Z. Recognizing indoor formaldehyde in binary gas mixtures with a micro gas sensor array and a neural network. Meas. Sci. Technol. 2007, 18, 2997–3004. [Google Scholar] [CrossRef]
- Castro-Hurtado, I.; Mandayo, G.G.; Castaño, E. Conductometric formaldehyde gas sensors. A review: From conventional films to nanostructured materials. Thin Solid Films 2013, 548, 665–676. [Google Scholar] [CrossRef]
- Mirzaei, A.; Leonardi, S.G.; Neri, G. Detection of hazardous volatile organic compounds (VOCs) by metal oxide nanostructures-based gas sensors: A review. Ceram. Int. 2016, 42, 15119–15141. [Google Scholar] [CrossRef]
- Espid, E.; Taghipour, F. UV-LED Photo-activated Chemical Gas Sensors: A Review. Crit. Rev. Solid State Mater. Sci. 2017, 42, 416–432. [Google Scholar] [CrossRef]
- Xu, F.; HO, H.P. Light-Activated Matel Oxide Gas Sensors: A Review. Micromachines 2017, 8, 333. [Google Scholar] [CrossRef] [PubMed]
- Trawka, M.; Smulko, J.; Hasse, L.; Granqvist, C.-G.; Annanouch, F.E.; Ionescu, R. Fluctuation enhanced gas sensing with WO3-based nanoparticle gas sensors modulated by UV light at selected wavelengths. Sens. Actuators B 2016, 234, 453–461. [Google Scholar] [CrossRef]
- Wongrat, E.; Chanlek, N.; Chueaiarrom, C.; Samransuksamer, B.; Hongsith, N.; Choopun, S. Low temperature ethanol response enhancement of ZnO nanostructures sensor decorated with gold nanoparticles exposed to UV illumination. Sens. Actuators A 2016, 251, 188–197. [Google Scholar] [CrossRef]
- Cui, J.; Wang, D.; Xie, T.; Lin, Y. Study on photoelectric gas-sensing property and photogenerated carrier behavior of Ag–ZnO at the room temperature. Sens. Actuators B 2013, 186, 165–171. [Google Scholar] [CrossRef]
- Peng, L.; Zhao, Q.; Wang, D.; Zhai, J.; Wang, P.; Pang, S.; Xie, T. Ultraviolet-assisted gas sensing: A potential formaldehyde detection approach at room temperature based on zinc oxide nanorods. Sens. Actuators B 2009, 136, 80–85. [Google Scholar] [CrossRef]
- Peng, L.; Xie, T.; Yang, M.; Wang, P.; Xu, D.; Pang, S.; Wang, D. Light induced enhancing gas sensitivity of copper-doped zinc oxide at room temperature. Sens. Actuators B 2008, 131, 660–664. [Google Scholar] [CrossRef]
- De Lacy Costello, B.P.J.; Ewen, R.J.; Ratcliffe, N.M.; Richards, M. Highly sensitive room temperature sensors based on the UV-LED activation of zinc oxide nanoparticles. Sens. Actuators B 2008, 134, 945–952. [Google Scholar] [CrossRef]
- Chen, H.; Liu, Y.; Xie, C.; Wu, J.; Zeng, D.; Liao, Y. A comparative study on UV light activated porous TiO2 and ZnO film sensors for gas sensing at room temperature. Ceram. Int. 2012, 38, 503–509. [Google Scholar] [CrossRef]
- Liu, L.; Li, X.; Dutta, P.K.; Wang, J. Room temperature impedance spectroscopy-based sensing of formaldehyde with porous TiO2 under UV illumination. Sens. Actuators B 2013, 185, 1–9. [Google Scholar] [CrossRef]
- Lin, S.; Li, D.; Wu, J.; Li, X.; Akbar, S.A. A selective room temperature formaldehyde gas sensor using TiO2 nanotube arrays. Sens. Actuators B 2011, 156, 505–509. [Google Scholar] [CrossRef]
- Zhang, S.; Lei, T.; Li, D.; Zhang, G.; Xie, C. UV light activation of TiO2 for sensing formaldehyde: How to be sensitive, recovering fast, and humidity less sensitive. Sens. Actuators B 2014, 202, 964–970. [Google Scholar] [CrossRef]
- Li, X.; Li, X.; Wang, J.; Lin, S. Highly sensitive and selective room-temperature formaldehyde sensors using hollow TiO2 microspheres. Sens. Actuators B 2015, 219, 158–163. [Google Scholar] [CrossRef]
- Jia, C.; Dong, T.; Li, M.; Wang, P.; Yang, P. Preparation of anatase/rutile TiO2/SnO2 hollow heterostructures for gas sensor. J. Alloy. Compd. 2018, 769, 521–531. [Google Scholar] [CrossRef]
- Marzec, A.; Radeck, M.; Maziarzc, W.; Kusior, A.; Pędzich, Z. Structural, optical and electrical properties of nanocrystalline TiO2, SnO2 and their composites obtained by the sol–gel method. J. Eur. Ceram. Soc. 2016, 36, 2981–2989. [Google Scholar] [CrossRef]
- Lyson-Sypien, B.; Czapla, A.; Lubecka, M.; Kusior, E.; Zakrzewska, K.; Radecka, M.; Kusior, A.; Balogh, A.G.; Lauterbach, S.; Kleebe, H.-J. Gas sensing properties of TiO2–SnO2 nanomaterials. Sens. Actuators B 2013, 187, 445–454. [Google Scholar] [CrossRef]
- Kusior, A.; Radecka, M.; Zych, Ł.; Zakrzewska, K.; Reszka, A.; Kowalski, B.J. Sensitization of TiO2/SnO2 nanocomposites for gas detection. Sens. Actuators B 2013, 189, 251–259. [Google Scholar] [CrossRef]
- Zeng, W.; Liu, T.; Zang, Z. Sensitivity improvement of TiO2-doped SnO2 to volatile organic compounds. Phys. E 2010, 43, 633–638. [Google Scholar] [CrossRef]
- Ahn, K.; Pham-Cong, D.; Choi, H.S.; Jeong, S.-Y.; Cho, J.H.; Kim, J.; Kim, J.-P.; Bae, J.-S.; Cho, C.-R. Bandgap-designed TiO2/SnO2 hollow hierarchical nanofibers: Synthesis, properties, and their photocatalytic mechanism. Curr. Appl. Phys. 2016, 16, 251–260. [Google Scholar] [CrossRef]
- Chizhov, A.S.; Rumyantseva, M.N.; Vasiliev, R.B.; Filatova, D.G.; Drozdov, K.A.; Krylov, I.V.; Marchevsky, A.V.; Karakulina, O.M.; Abakumov, A.M.; Gaskov, A.M. Visible light activation of room temperature NO2 gas sensors based on ZnO, SnO2 and In2O3 sensitized with CdSe quantum dots. Thin Solid Films 2016, 618, 253–262. [Google Scholar] [CrossRef]
- Rumyantseva, M.N.; Gaskov, A.M.; Rosman, N.; Pagnier, T.; Morante, J.R. Raman surface vibration modes in nanocrystalline SnO2 prepared by wet chemical methods: Correlations with the gas sensors performances. Chem. Mater. 2005, 17, 893–901. [Google Scholar] [CrossRef]
- Güntner, A.T.; Pineau, N.J.; Chie, D.; Krumeich, F.; Pratsinis, S.E. Selective sensing of isoprene by Ti-doped ZnO for breath diagnostics. J. Mater. Chem. B 2016, 4, 5358–5366. [Google Scholar] [CrossRef]
- Rumyantseva, M.N.; Gaskov, A.M. Chemical modification of nanocrystalline metal oxides: Effect of the real structure and surface chemistry on the sensor properties. Russ. Chem. Bull. 2008, 57, 1106–1125. [Google Scholar] [CrossRef]
- Vorobyeva, N.A.; Rumyantseva, M.N.; Vasiliev, R.B.; Kozlovskiy, V.F.; Soshnikova, Y.M.; Filatova, D.G.; Zaytsev, V.B.; Zaytseva, A.V.; Gaskov, A.M. Doping effects on electrical and optical properties of spin-coated ZnO thin films. Vacuum 2015, 114, 198–204. [Google Scholar] [CrossRef]
- Korotcenkov, G.; Cho, B.K. Metal oxide composites in conductometric gas sensors: Achievements and challenges. Sens. Actuators B 2017, 244, 182–210. [Google Scholar] [CrossRef]
- Miodownik, M.; Holm, E.A.; Hassold, G.N. Highly parallel computer simulation of particle pinning: Zener vindicated. Scripta Mater. 2000, 42, 1173–1177. [Google Scholar] [CrossRef]
- Socrates, G. Infrared and Raman Characteristic Group Frequencies: Tables and Charts, 3rd ed.; John Wiley & Sons Ltd.: West Sussex, UK, 2001. [Google Scholar]
- Nakamoto, K. Infrared and Raman Spectra of Inorganic and Coordination Compounds. Part A: Theory and Applications in Inorganic Chemistry, 6th ed.; John Wiley & Sons, Inc.: Hoboken, NJ, USA, 2009. [Google Scholar]
- Kumar, A.; Rout, L.; Dhaka, R.S.; Samala, S.L.; Dash, P. Design of a graphene oxide-SnO2 nanocomposite with superior catalytic efficiency for the synthesis of β-enaminones and β-enaminoesters. RSC Adv. 2015, 5, 39193–39204. [Google Scholar] [CrossRef]
- Tang, Y.; Fu, S.; Zhao, K.; Xie, G.; Teng, L. Synthesis of TiO2 nanofibers with adjustable anatase/rutile ratio from Ti sol and rutile nanoparticles for the degradation of pollutants in wastewater. Ceram. Int. 2015, 41, 13285–13293. [Google Scholar] [CrossRef]
- Karthick, S.N.; Hemalatha, K.V.; Seo, H.; Ludeman, D.; Kim, J.-K.; Prabakar, K.; Kim, H.-J. Titanium oxide prepared by polymer gel assisted combustion method for dye-sensitized solar cell. Curr. Appl. Phys. 2011, 11, 127–130. [Google Scholar] [CrossRef]
- León, A.; Reuquen, P.; Garín, C.; Segura, R.; Vargas, P.; Zapata, P.; Orihuela, P.A. FTIR and Raman characterization of TiO2 nanoparticles coated with polyethylene glycol as carrier for 2-methoxyestradiol. Appl. Sci. 2017, 7, 49. [Google Scholar] [CrossRef]
- Peercy, P.S.; Morosin, B. Pressure and temperature dependences of the Raman-active phonons in SnO2. Phys. Rev. B 1973, 7, 2779–2786. [Google Scholar] [CrossRef]
- Garcia-Tecedor, M.; Maestre, D.; Cremades, A.; Piqueras, J. Growth and characterization of Cr doped SnO2 microtubes with resonant cavity modes. J. Mater. Chem. C 2016, 4, 5709–5716. [Google Scholar] [CrossRef]
- Caoshui, X.; Yonghong, X.; Hong, Z.; Yuheng, Z.; Yulong, L. Investigation of Raman spectrum for nano-SnO2. Sci. China (Ser. A). 1997, 40, 1222–1227. [Google Scholar]
- Ferreira, C.S.; Santos, P.L.; Bonacin, J.A.; Passos, R.R.; Pocrifka, L.A. Rice husk reuse in the preparation of SnO2/SiO2 Nanocomposite. Mat. Res. 2015, 18, 639–643. [Google Scholar] [CrossRef]
- Zuo, J.; Xu, C.; Liu, X.; Wang, C.; Wang, C.; Hu, Y.; Qian, Y. Study of the Raman spectrum of nanometer SnO2. J. Appl. Phys. 1994, 75, 1835–1836. [Google Scholar] [CrossRef]
- Abello, L.; Bochu, B.; Gaskov, A.; Koudryavtseva, S.; Lucazeau, G.; Roumyantseva, M. Structural characterization of nanocrystalline SnO2 by X-ray and Raman spectroscopy. J. Solid State Chem. 1998, 135, 78–85. [Google Scholar] [CrossRef]
- Dieguez, A.; Romano-Rodriguez, A.; Vila, A.; Morante, J.R. The complete Raman spectrum of nanometric SnO2 particles. J. Appl. Physics. 2001, 90, 1550–1557. [Google Scholar] [CrossRef]
- Liu, L.Z.; Li, T.H.; Wu, X.L.; Shen, J.C.; Chu, P.K. Identification of oxygen vacancy types from Raman spectra of SnO2 nanocrystals. J. Raman Spectrosc. 2012, 43, 1423–1426. [Google Scholar] [CrossRef]
- Loudon, R. The Raman effect in crystals. Adv. Phys. 1964, 13, 423–482. [Google Scholar] [CrossRef]
- Verma, R.; Mantri, B.; Ramphal, A.K.S. Shape control synthesis, characterizations, mechanisms and optical properties of large scaled metal oxide nanostructures of ZnO and TiO2. Adv. Mater. Lett. 2015, 6, 324–333. [Google Scholar] [CrossRef]
- Gupta, S.K.; Desai, R.; Jha, P.K.; Sahoo, S.P.; Kirin, D. Titanium dioxide synthesized using titanium chloride: Size effect study using Raman and Photoluminescence. J. Raman Spectrosc. 2010, 41, 350–355. [Google Scholar] [CrossRef]
- Bersani, D.; Lottici, P.P.; Ding, X.Z. Phonon confinement effects in the Raman scattering by TiO2 nanocrystals. Appl. Phys. Lett. 1998, 72, 73–75. [Google Scholar] [CrossRef]
- Zhang, W.F.; Zhang, M.S.; Yin, Z.; Chen, Q. Photoluminescence in anatase titanium dioxide nanocrystals. Appl. Phys. B 2000, 70, 261–265. [Google Scholar] [CrossRef]
- Tompsett, G.A.; Bowmaker, G.A.; Cooney, R.P.; Metson, J.B.; Rodgers, K.A.; Seakins, J.M. The Raman spectrum of brookite, TiO2 (Pbca, Z = 8). J. Raman Spectrosc. 1995, 26, 57–62. [Google Scholar] [CrossRef]
- Rezaee, M.; Khoie, S.M.M.; Liu, K.H. The role of brookite in mechanical activation of anatase-to-rutile transformation of nanocrystalline TiO2: An XRD and Raman spectroscopy investigation. CrystEngComm 2011, 13, 5055–5061. [Google Scholar] [CrossRef]
- Nikodemski, S.; Dameron, A.A.; Perkins, J.D.; O’Hayre, R.P.; Ginley, D.S.; Berry, J.J. The role of nanoscale seed layers on the enhanced performance of niobium doped TiO2 thin films on glass. Sci. Rep. 2016, 6, 32830. [Google Scholar] [CrossRef]
- Zhang, H.; Banfield, J.F. Understanding polymorphic phase transformation behavior during growth of nanocrystalline aggregates: Insights from TiO2. J. Phys. Chem. B 2000, 104, 3481–3487. [Google Scholar] [CrossRef]
- Zhu, K.-R.; Zhang, M.-S.; Hong, J.-M.; Yin, Z. Size effect on phase transition sequence of TiO2 nanocrystal. Mater. Sci. Eng. A 2005, 403, 87–93. [Google Scholar] [CrossRef]
- Fan, S.W.; Srivastava, A.K.; Dravid, V.P. UV-activated room-temperature gas sensing mechanism of polycrystalline ZnO. Appl. Phys. Lett. 2009, 95, 142106-1–142106-3. [Google Scholar] [CrossRef]
- Xu, Y.; Schoonen, M.A.A. The absolute energy positions of conduction and valence bands of selected semiconducting minerals. Am. Miner. 2000, 85, 543–556. [Google Scholar] [CrossRef]
- Oguchiand, T.; Fujishima, A. Photocatalytic degradation of gaseous formaldehyde using TiO2 film. Environ. Sci. Technol. 1998, 32, 3831–3833. [Google Scholar]
- Sun, S.; Ding, J.J.; Bao, J.; Gao, C.; Qi, Z.; Li, C. Photocatalytic oxidation of gaseous formaldehyde on TiO2: An in situ DRIFTS study. Catal. Lett. 2010, 137, 239–246. [Google Scholar] [CrossRef]
- Varechkina, E.N.; Rumyantseva, M.N.; Vasiliev, R.B.; Konstantinova, E.A.; Gaskov, A.M. UV-VIS photoconductivity of nanocrystalline tin oxide. J. Nanoelectron. Op. 2012, 7, 623–628. [Google Scholar] [CrossRef]
- Rumyantseva, M.; Nasriddinov, A.; Vladimirova, S.; Fedorova, O.; Tokarev, S.; Krylov, I.; Drozdov, K.; Baranchikov, A.; Gaskov, A. Photosensitive organic-inorganic hybrid materials for room temperature gas sensor applications. Nanomaterials 2018, 8, 671. [Google Scholar] [CrossRef]
- Popova, G.Y.; Budneva, A.A.; Andrushkevich, T.V. Identification of adsorption forms by IR spectroscopy for formaldehyde and formic acid on K3PMo12O40. React. Kinet. Catal. Lett. 1997, 61, 353–362. [Google Scholar] [CrossRef]
- Busca, G.; Lamotte, J.; Lavalley, J.-C.; Lorenzelli, V. FT-IR study of the adsorption and transformation of formaldehyde on oxide surfaces. J. Am. Chem. Soc. 1987, 109, 5197–5202. [Google Scholar] [CrossRef]
- Gomes, J.R.B.; Gomes, J.A.N.F. A theoretical study of dioxymethylene, proposed as intermediate in the oxidation of formaldehyde to formate over copper. Surf. Sci. 2000, 446, 283–293. [Google Scholar] [CrossRef]
- Chen, D.; Qu, Z.; Sun, Y.; Gao, K.; Wang, Y. Identification of reaction intermediates and mechanism responsible for highly active HCHO oxidation on Ag/MCM-41 catalysts. Appl. Catal. B 2013, 142–143, 838–848. [Google Scholar] [CrossRef]
- Xu, B.Y.; Shang, J.; Zhu, T.; Tang, X.Y. Heterogeneous reaction of formaldehyde on the surface of γ-Al2O3. Atmos. Environ. 2011, 45, 3569–3575. [Google Scholar] [CrossRef]
- Gao, H.W.; Yan, T.X.; Zhang, C.B.; He, H. Theoretical experimental analysis on vibrational spectra of formate species adsorbed on Cu-Al2O3 catalyst. J. Mol. Str. THEOCHEM 2008, 857, 38–43. [Google Scholar] [CrossRef]
- Zhang, C.; He, H.; Tanaka, K. Catalytic performance and mechanism of a Pt/TiO2 catalyst for the oxidation of formaldehyde at room temperature. Appl. Catal. B 2006, 65, 37–43. [Google Scholar] [CrossRef]
- Chen, B.; Shi, C.; Crocker, M.; Wang, Y.; Zhu, A. Catalytic removal of formaldehyde at room temperature over supported gold catalysts. Appl. Catal. B 2013, 132–133, 245–255. [Google Scholar] [CrossRef]
- Guo, J.; Lin, C.; Jiang, C.; Zhang, P. Review on noble metal-based catalysts for formaldehyde oxidation at room temperature. Appl. Surf. Sci. 2019, 475, 237–255. [Google Scholar] [CrossRef]
- Huang, K.; Kong, L.; Yuan, F.; Xie, C. In situ diffuse reflectance infrared Fourier transform spectroscopy study of formaldehyde adsorption and reactions on nano γ-Fe2O3 films. Appl. Surf. Sci. 2013, 270, 405–410. [Google Scholar] [CrossRef]
- Lin, S.D.; Cheng, H.K.; Hsiao, T.C. In situ DRIFTS study on the methanol oxidation by lattice oxygen over Cu/ZnO catalyst. J. Mol. Catal. A 2011, 342–343, 35–40. [Google Scholar] [CrossRef]
- Rumyantseva, M.N.; Makeeva, E.A.; Badalyan, S.M.; Zhukova, A.A.; Gaskov, A.M. Nanocrystalline SnO2 and In2O3 as materials for gas sensors: The relationship between microstructure and oxygen chemisorption. Thin Solid Films 2009, 518, 1283–1288. [Google Scholar] [CrossRef]
- Tharsika, T.; Haseeb, A.S.M.A.; Akbar, S.A.; Sabri, M.; Hoong, W.Y. Enhanced ethanol gas sensing properties of SnO2-core/ZnO-shell nanostructures. Sensors 2014, 14, 14586–14600. [Google Scholar] [CrossRef]
- Dobrokhotov, V.; Larin, A. Multisensory gas chromatography for field analysis of complex gaseous mixtures. ChemEngineering 2019, 3, 13. [Google Scholar] [CrossRef]
- Miller, D.R.; Akbar, S.A.; Morris, P.A. Nanoscale metal oxide-based heterojunctions for gas sensing: A review. Sens. Actuators B 2014, 204, 250–272. [Google Scholar] [CrossRef]
- Buckeridge, J.; Butler, K.T.; Catlow, C.R.A.; Logsdail, A.J.; Scanlon, D.O.; Shevlin, S.A.; Woodley, S.M.; Sokol, A.A.; Walsh, A. Polymorph Engineering of TiO2: Demonstrating How Absolute Reference Potentials Are Determined by Local Coordination. Chem. Mater. 2015, 27, 3844–3851. [Google Scholar] [CrossRef]
- Li, X.S.; Li, W.Z.; Wang, H.L. Enhancement of hydrogen spillover by surface labile oxygen species on oxidized Pt/TiO2 catalyst. Catal. Lett. 1995, 32, 31–42. [Google Scholar]
- Wang, J.A.; Cuan, A.; Salmones, J.; Nava, N.; Castillo, S.; Morán-Pineda, M.; Rojas, F. Studies of sol–gel TiO2 and Pt/TiO2 catalysts for NO reduction by CO in an oxygen-rich condition. Appl. Surf. Sci. 2004, 230, 94–105. [Google Scholar] [CrossRef]
- Jiang, X.; Ding, G.; Lou, L.; Chen, Y.; Zheng, X. Catalytic activities of CuO/TiO2 and CuO-ZrO2/TiO2 in NO + CO reaction. J. Molec. Catal. A 2004, 218, 187–195. [Google Scholar]
- Kemmler, J.A.; Pokhrel, S.; Birkenstock, J.; Schowalter, M.; Rosenauer, A.; Bârsan, N.; Weimar, U.; Mädler, L. Quenched, nanocrystalline In4Sn3O12 high temperature phase for gas sensing applications. Sens. Actuators B 2012, 161, 740–747. [Google Scholar] [CrossRef]
- Park, H.J.; Choi, N.J.; Kang, H.; Jung, M.Y.; Park, J.W.; Park, K.H.; Lee, D.S. A ppb-level formaldehyde gas sensor based on CuO nanocubes prepared using a polyol process. Sens. Actuators B 2014, 203, 282–288. [Google Scholar] [CrossRef]
- Fang, F.; Bai, L.; Sun, H.; Kuang, Y.; Sun, X.; Shi, T.; Song, D.; Guo, P.; Yang, H.; Zhang, Z.; et al. Hierarchically porous indium oxide nanolamellas with ten-parts-per-billion-level formaldehyde-sensing performance. Sens. Actuators B 2015, 206, 714–720. [Google Scholar] [CrossRef]
- Lv, P.; Tang, Z.A.; Yu, J.; Zhang, F.T.; Wei, G.F.; Huang, Z.X.; Hu, Y. Study on a micro-gas sensor with SnO2–NiO sensitive film for indoor formaldehyde detection. Sens. Actuators B. 2008, 132, 74–80. [Google Scholar] [CrossRef]
- Zhang, Y.; Liu, Q.; Zhang, J.; Zhu, Q.; Zhu, Z. A highly sensitive and selective formaldehyde gas sensor using a molecular imprinting technique based on Ag–LaFeO3. J. Mater. Chem. C 2014, 2, 10067–10072. [Google Scholar] [CrossRef]
- Zhang, Y.M.; Lin, J.Y.T.; Chen, L.; Zhang, J.; Zhu, Z.Q.; Liu, Q.J. A high sensitivity gas sensor for formaldehyde based on silver doped lanthanum ferrite. Sens. Actuators B 2014, 190, 171–176. [Google Scholar] [CrossRef]
- Chung, F.-C.; Zhu, Z.; Luo, P.-Y.; Wu, R.-J.; Li, W. Au@ZnO core–shell structure for gaseous formaldehyde sensing at room temperature. Sens. Actuators B 2014, 199, 314–319. [Google Scholar] [CrossRef]
- Chen, T.; Liu, Q.J.; Zhou, Z.L.; Wang, Y.D. The fabrication and gas-sensing characteristics of the formaldehyde gas sensors with high sensitivity. Sens. Actuators B 2008, 131, 301–305. [Google Scholar] [CrossRef]
- Wang, Y.Q.H.; Chen, H.; Lin, Z.; Dai, K. Highly selective n-butanol gas sensor based on mesoporous SnO2 prepared with hydrothermal treatment. Sens. Actuators B 2014, 201, 153–159. [Google Scholar] [CrossRef]
- Hu, R.; Wang, J.; Chen, P.; Hao, Y.; Zhang, C.; Li, X. Preparation of Cd-loaded In2O3 hollow nanofibers by electro spinning and improvement of formaldehyde sensing performance. J. Nanomater. 2014, 2014, 7. [Google Scholar] [CrossRef]
- Liu, D.; Pan, J.; Tang, J.; Liu, W.; Bai, S.; Luo, R. Ag decorated SnO2 nanoparticles to enhance formaldehyde sensing properties. J. Phys. Chem. Solids 2019, 124, 36–43. [Google Scholar] [CrossRef]
- Du, H.; Wang, J.; Su, M.; Yao, P.; Zheng, Y.; Yu, N. Formaldehyde gas sensor based on SnO2/In2O3 hetero-nanofibers by a modified double jets electro spinning process. Sens. Actuators B 2012, 166, 746–752. [Google Scholar] [CrossRef]
- Castro-Hurtado, I.; Herrán, J.; Mandayo, G.G.; Castaño, E. SnO2-nanowires grown by catalytic oxidation of tin sputtered thin films for formaldehyde detection. Thin Solid Films 2012, 520, 4792–4796. [Google Scholar] [CrossRef]
- Sun, P.; Zhou, X.; Wang, C.; Shimanoe, K.; Lu, G.; Yamazoe, N. Hollow SnO2/α-Fe2O3 spheres with a double-shell structure for gas sensors. J. Mater. Chem. A 2014, 2, 1302–1308. [Google Scholar] [CrossRef]
- Wang, J.; Zhang, P.; Qi, J.-Q.; Yao, P.-J. Silicon-based micro-gas sensors for detecting formaldehyde. Sens. Actuators B 2009, 136, 399–404. [Google Scholar] [CrossRef]
- Lee, C.-Y.; Chiang, C.-M.; Wang, Y.-H.; Ma, R.-H. A self-heating gas sensor with integrated NiO thin-film for formaldehyde detection. Sens. Actuators B 2007, 122, 503–510. [Google Scholar] [CrossRef]
- Zhang, G.; Zhang, S.; Yang, L.; Zou, Z.; Zeng, D.; Xie, C. La2O3-sensitized SnO2 nanocrystalline porous film gas sensors and sensing mechanism toward formaldehyde. Sens. Actuators B 2013, 188, 137–146. [Google Scholar] [CrossRef]
- Castro-Hurtado, I.; Herrán, J.; Mandayo, G.G.; Castaño, E. Studies of influence of structural properties and thickness of NiO thin films on formaldehyde detection. Thin Solid Films 2011, 520, 947–952. [Google Scholar] [CrossRef]
- Peng, L.; Zhai, J.; Wang, D.; Zhang, Y.; Wang, P.; Zhao, Q.; Xie, T. Size- and photoelectric characteristics-dependent formaldehyde sensitivity of ZnO irradiated with UV light. Sens. Actuators B 2010, 148, 66–73. [Google Scholar] [CrossRef]
- Yao, P.J.; Wang, J.; Chu, W.L.; Hao, Y.W. Preparation and characterization of La1-xSrxFeO3 materials and their formaldehyde gas-sensing properties. J. Mater. Sci. 2013, 48, 441–450. [Google Scholar] [CrossRef]
- Wang, J.; Liu, L.; Cong, S.-Y.; Qi, J.-Q.; Xu, B.-K. An enrichment method to detect low concentration formaldehyde. Sens. Actuators B 2008, 134, 1010–1015. [Google Scholar] [CrossRef]
- Chung, F.-C.; Wu, R.-J.; Cheng, F.-C. Fabrication of a Au@SnO2 core–shell structure for gaseous formaldehyde sensing at room temperature. Sens. Actuators B 2014, 190, 1–7. [Google Scholar] [CrossRef]
- Li, Y.; Chen, N.; Deng, D.; Xing, X.; Xiao, X.; Wang, Y. Formaldehyde detection: SnO2 microspheres for formaldehyde gas sensor with high sensitivity, fast response/recovery and good selectivity. Sens. Actuators B 2017, 238, 264–273. [Google Scholar] [CrossRef]
- Zeng, W.; Liu, T.; Wang, Z.; Tsukimoto, S.; Saito, M.; Ikuhara, Y. Selective detection of formaldehyde gas using a Cd-doped TiO2-SnO2 sensor. Sensors 2009, 9, 9029–9038. [Google Scholar] [CrossRef]
- Tian, H.; Fan, H.; Li, M.; Ma, L. Zeolitic Imidazolate Framework Coated ZnO Nanorods as Molecular Sieving to Improve Selectivity of Formaldehyde Gas Sensor. ACS Sens. 2016, 1, 243–250. [Google Scholar] [CrossRef]
- Li, Y.; Jin, H.; Sun, G.; Zhang, B.; Luo, N.; Lin, L.; Bala, H.; Cao, J.; Zhang, Z.; Wang, Y. Synthesis of novel porous ZnO octahedrons and their improved UV-light activated formaldehyde-sensing performance by Au decoration. Phys. E 2019, 106, 40–44. [Google Scholar] [CrossRef]
- Mondal, B.; Mukherjee, K.; Das, P. Facile synthesis of pseudo-peanut shaped hematite iron oxide nano-particles and their promising ethanol and formaldehyde sensing characteristics. RSC Adv. 2014, 4, 31879–31886. [Google Scholar]
- Han, N.; Wu, X.; Zhang, D.; Shen, G.; Liu, H.; Chen, Y. CdO activated Sn-doped ZnO for highly sensitive, selective and stable formaldehyde sensor. Sens. Actuators B 2011, 152, 324–329. [Google Scholar] [CrossRef]
- Xie, C.; Xiao, L.; Hu, M.; Bai, Z.; Xia, X.; Zeng, D. Fabrication and formaldehyde gas-sensing property of ZnO–MnO2 coplanar gas sensor arrays. Sens. Actuators B 2010, 145, 457–463. [Google Scholar] [CrossRef]
- Han, N.; Tian, Y.; Wu, X.; Chen, Y. Improving humidity selectivity in formaldehyde gas sensing by a two-sensor array made of Ga-doped ZnO. Sens. Actuators B 2009, 138, 228–235. [Google Scholar] [CrossRef]
- Zhang, H.; Song, P.; Han, D.; Wang, Q. Synthesis and formaldehyde sensing performance of LaFeO3 hollow nanospheres. Phys. E 2014, 63, 21–26. [Google Scholar] [CrossRef]
- Chu, X.; Chen, T.; Zhang, W.; Zheng, B.; Shui, H. Investigation on formaldehyde gas sensor with ZnO thick film prepared through microwave heating method. Sens. Actuators B 2009, 142, 49–54. [Google Scholar] [CrossRef]
- Güntner, A.T.; Abegg, S.; Wegner, K.; Pratsinis, S.E. Zeolite membranes for highly selective formaldehyde sensors. Sens. Actuators B 2018, 257, 916–923. [Google Scholar] [CrossRef]
- Gulevich, D.; Rumyantseva, M.; Gerasimov, E.; Marikutsa, A.; Krivetskiy, V.; Shatalova, T.; Khmelevsky, N.; Gaskov, A. Nanocomposites SnO2/SiO2 for CO gas sensors: Microstructure and reactivity in the interaction with the gas phase. Materials 2019, 12, 1096. [Google Scholar] [CrossRef]
- Gulevich, D.G.; Marikutsa, A.V.; Rumyantseva, M.N.; Fabrichnyi, P.B.; Shatalova, T.B.; Gaskov, A.M. Detection of carbon monoxide in humid air with double-layer structures based on semiconducting metal oxides and silicalite. Russ. J. Appl. Chem. 2018, 91, 1671–1679. [Google Scholar] [CrossRef]
- Chen, E.-X.; Yang, H.; Zhang, J. Zeolitic Imidazolate Framework as Formaldehyde Gas Sensor. Inorg. Chem. 2014, 53, 5411–5413. [Google Scholar] [CrossRef]
- Krivetskiy, V.; Efitorov, A.; Arkhipenko, A.; Vladimirova, S.; Rumyantseva, M.; Dolenko, S.; Gaskov, A. Selective detection of individual gases and CO/H2 mixture at low concentrations in air by single semiconductor metal oxide sensors working in dynamic temperature mode. Sens. Actuators B 2018, 254, 502–513. [Google Scholar] [CrossRef]


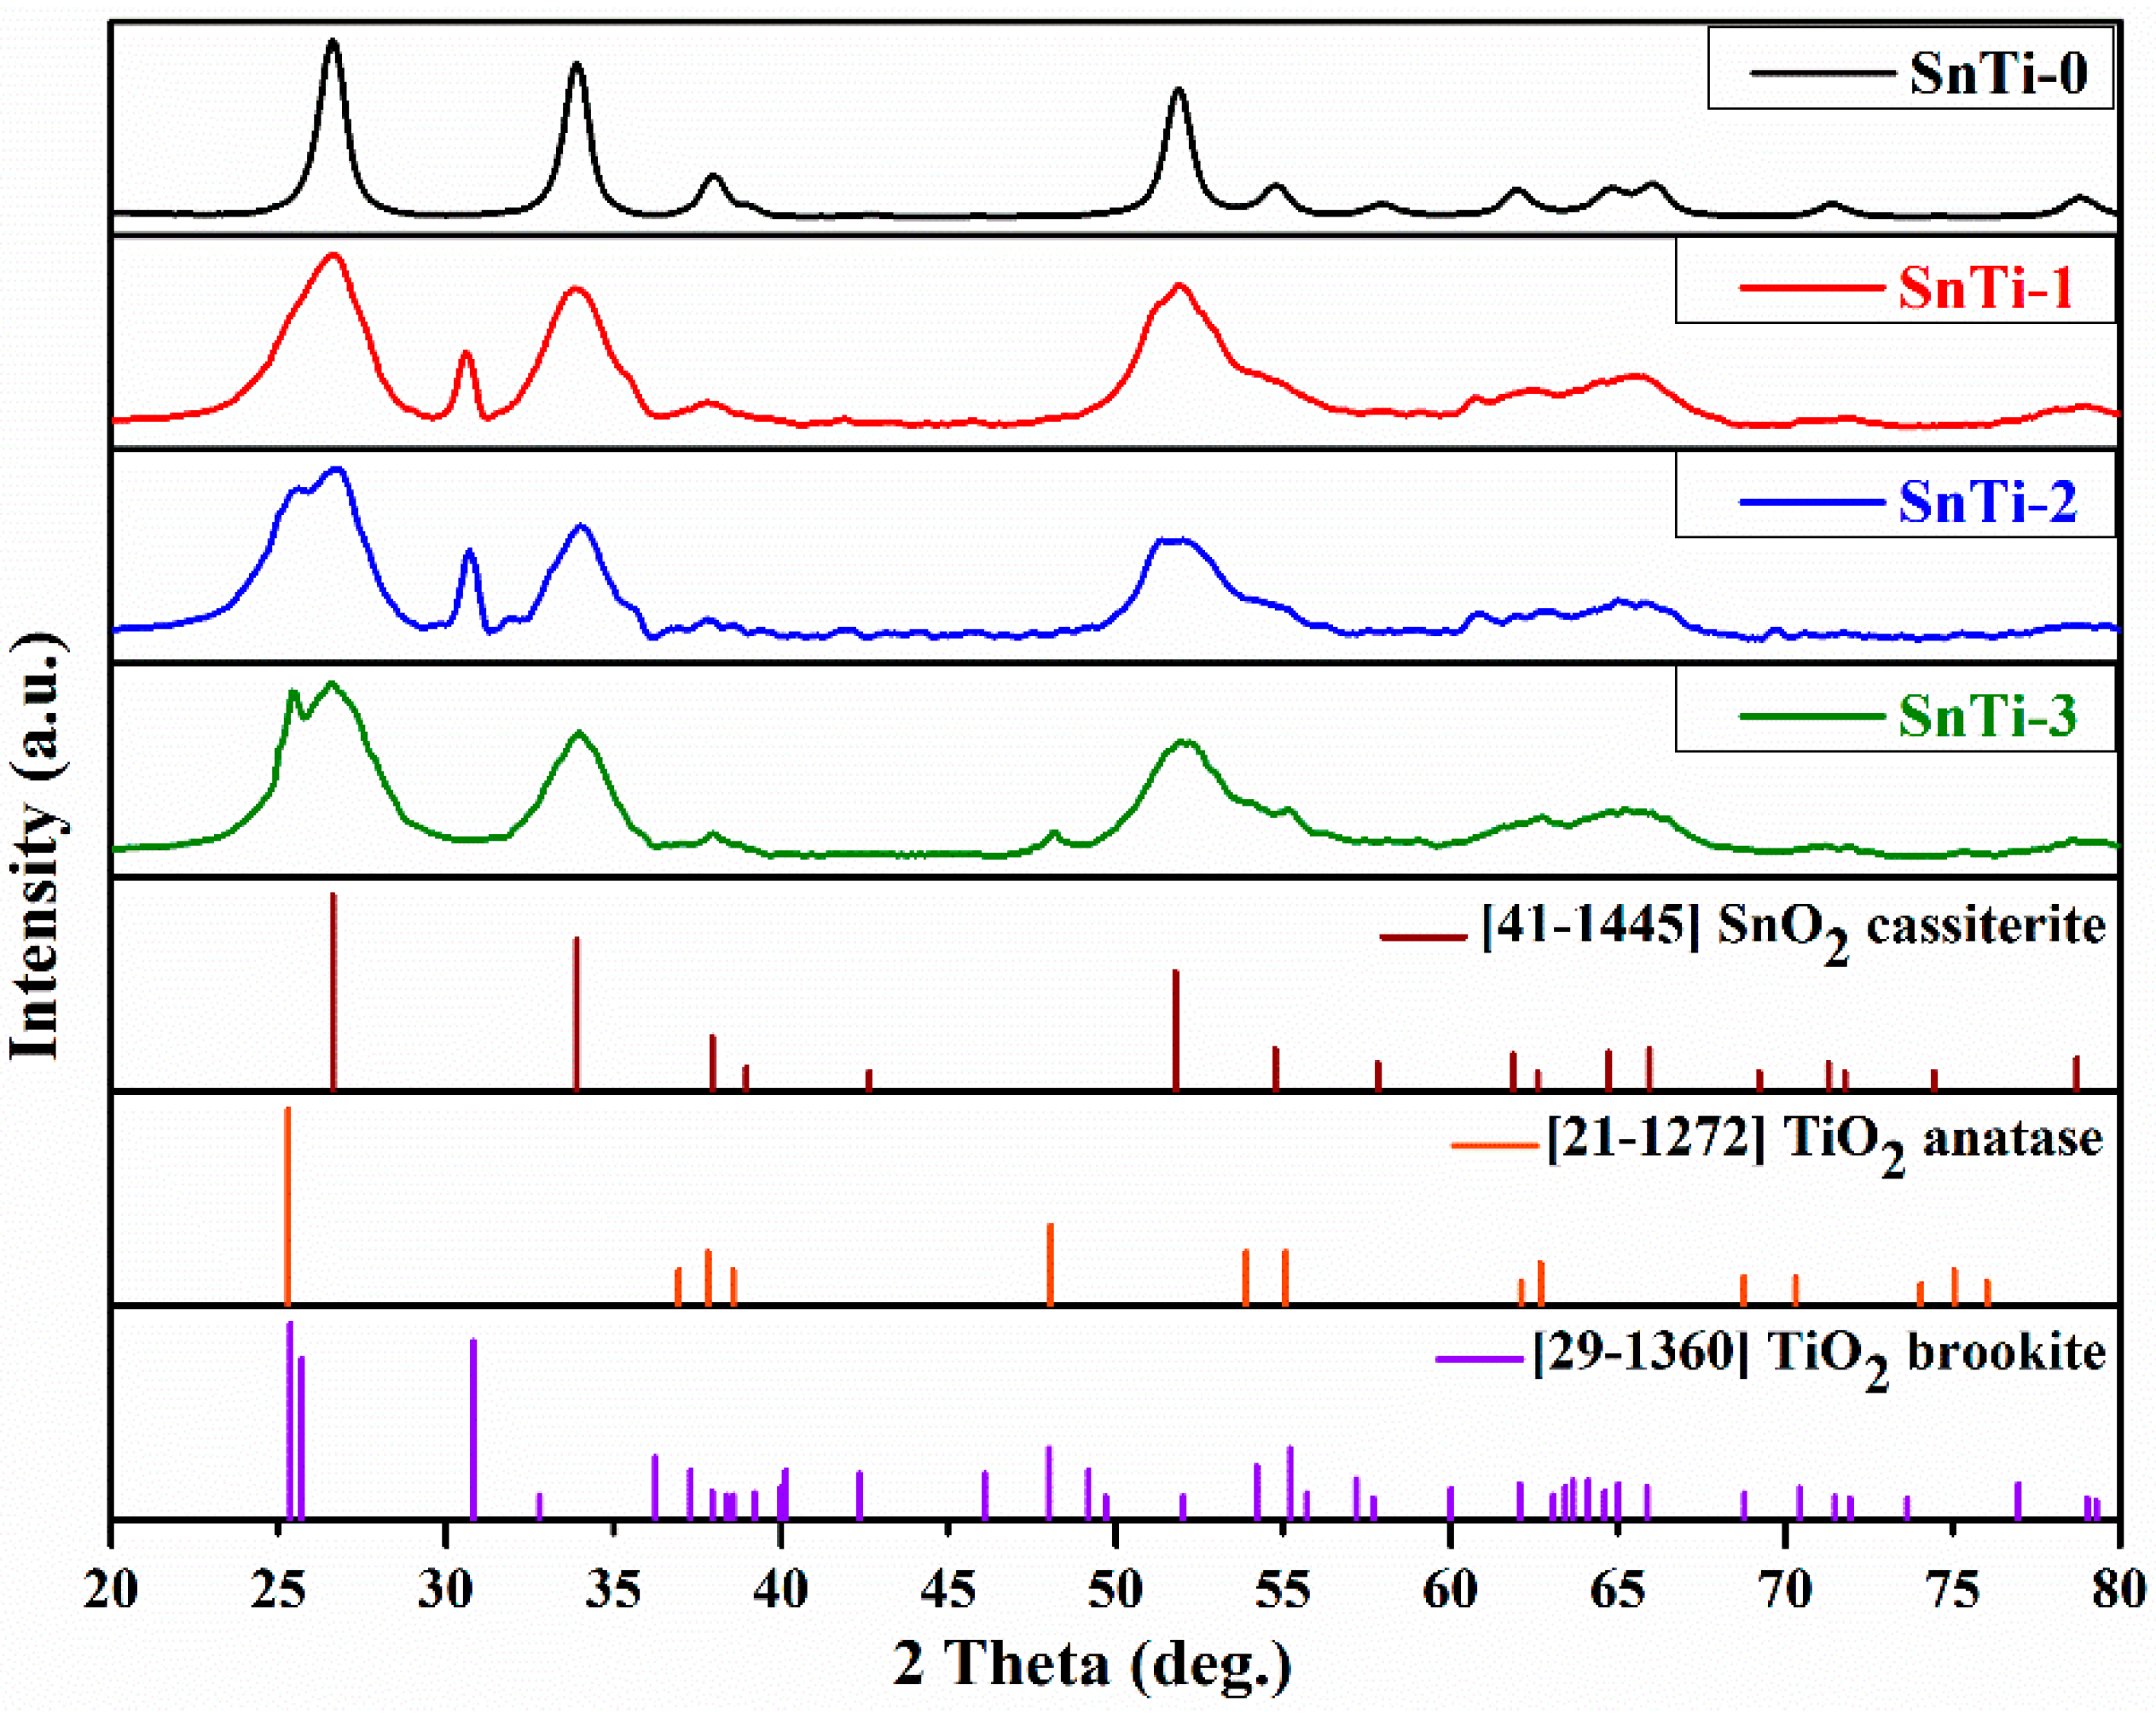
| Sample | Number of ALD Cycles | [Ti]/([Ti]+[Sn]), mol.% | Phase Composition | |
|---|---|---|---|---|
| Phases | dXRD, nm | |||
| SnTi-0 | 0 | 0 | SnO2 cassiterite | 9 ± 1 |
| SnTi-1 | 500 | 20 ± 2 | SnO2 cassiterite | 5.1 ± 0.5 |
| TiO2 brookite | 13 ± 1 | |||
| TiO2 anatase | n/d | |||
| SnTi-2 | 1000 | 24 ± 2 | SnO2 cassiterite | 4.5 ± 0.5 |
| TiO2 brookite | 16 ± 2 | |||
| TiO2 anatase | n/d | |||
| SnTi-3 | 2000 | 39 ± 3 | SnO2 cassiterite | 3.5 ± 0.5 |
| TiO2 anatase | 22 ± 2 | |||
| SnTi-0 | SnTi-1 | SnTi-2 | SnTi-3 |
|---|---|---|---|
| 137 (B1g, cassiterite) | 145 (Eg, anatase) | 145 (Eg, anatase) | 145 (Eg, anatase) |
| 309 (IR Eu, cassiterite) | 198 (Eg, anatase) | 198 (Eg, anatase) | 198 (Eg, anatase) |
| 352 (IR Eu, cassiterite) | 255 (A1g, brookite) | 255 (A1g, brookite) | |
| 444 (IR B1u, cassiterite) | 285 (B3g, brookite) | 285 (B3g, brookite) | |
| 481 (Eg, cassiterite) | 397 (B1g, anatase) | 397 (B1g, anatase) | 397 (B1g, anatase) |
| 563 (surface mode) | 443 (B3g, brookite) | 443 (B3g, brookite) | |
| 631 (A1g, cassiterite) | 516 (A1g+B1g, anatase) | 516 (A1g+B1g, anatase) | 516 (A1g+B1g, anatase) |
| 773 (B2g, cassiterite) | 581 (B2g, brookite) | 581 (B2g, brookite) | |
| 635 (Eg, anatase) | 635 (Eg, anatase) | 635 (Eg, anatase) |
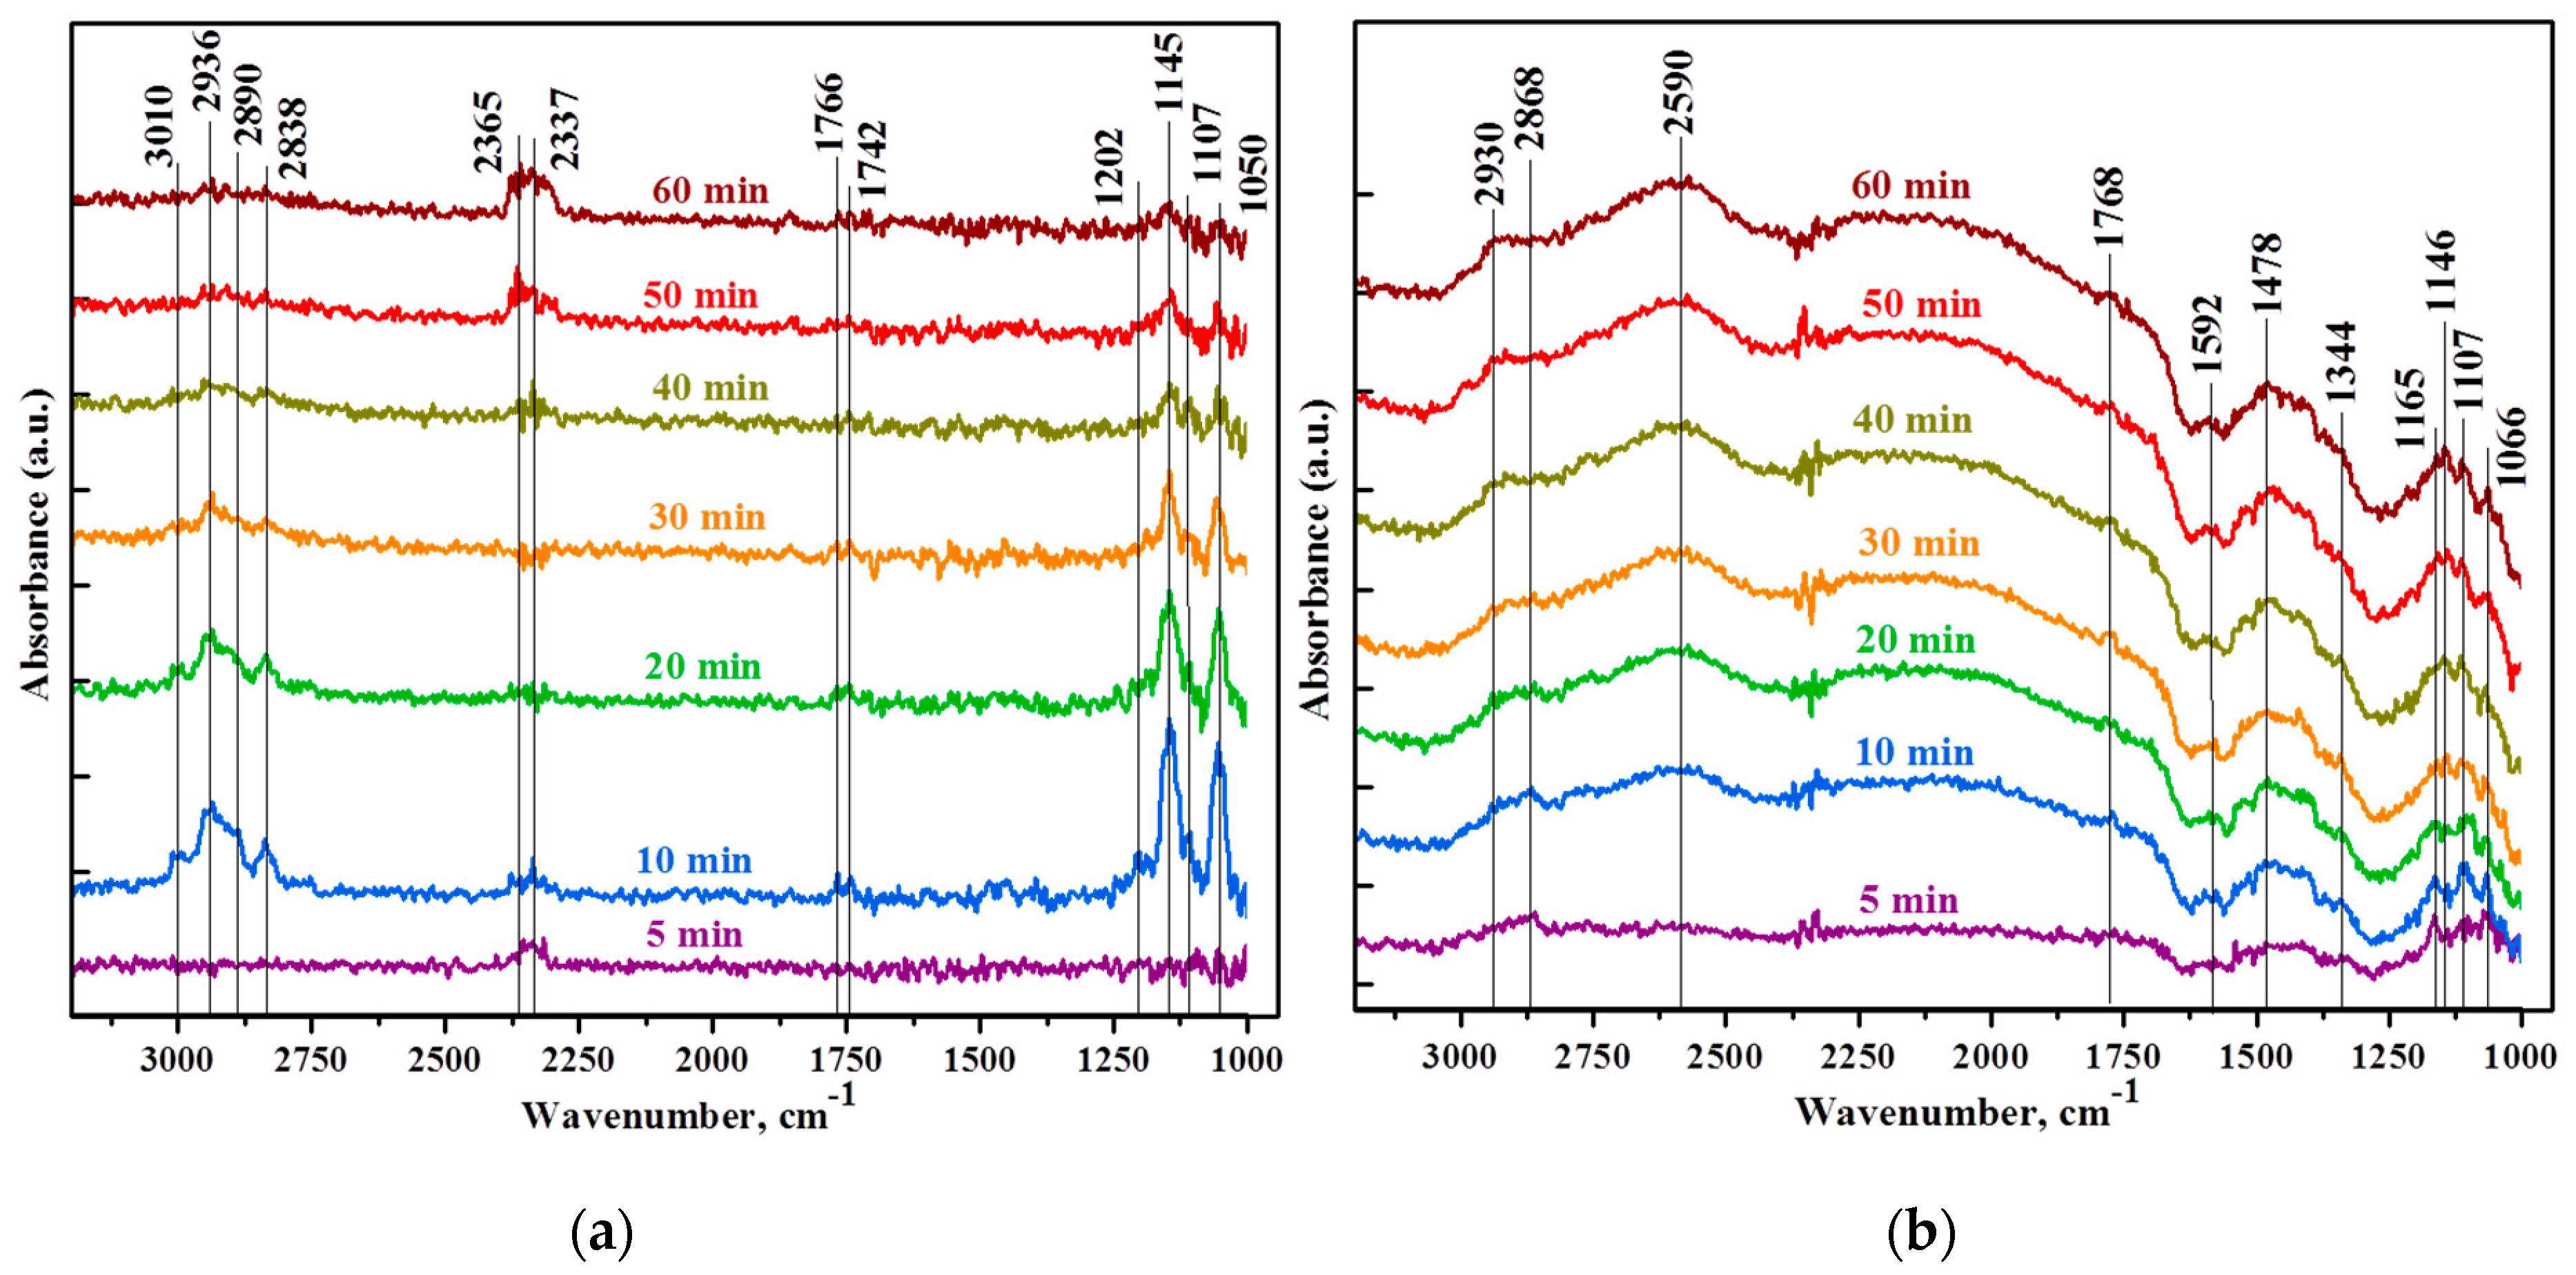
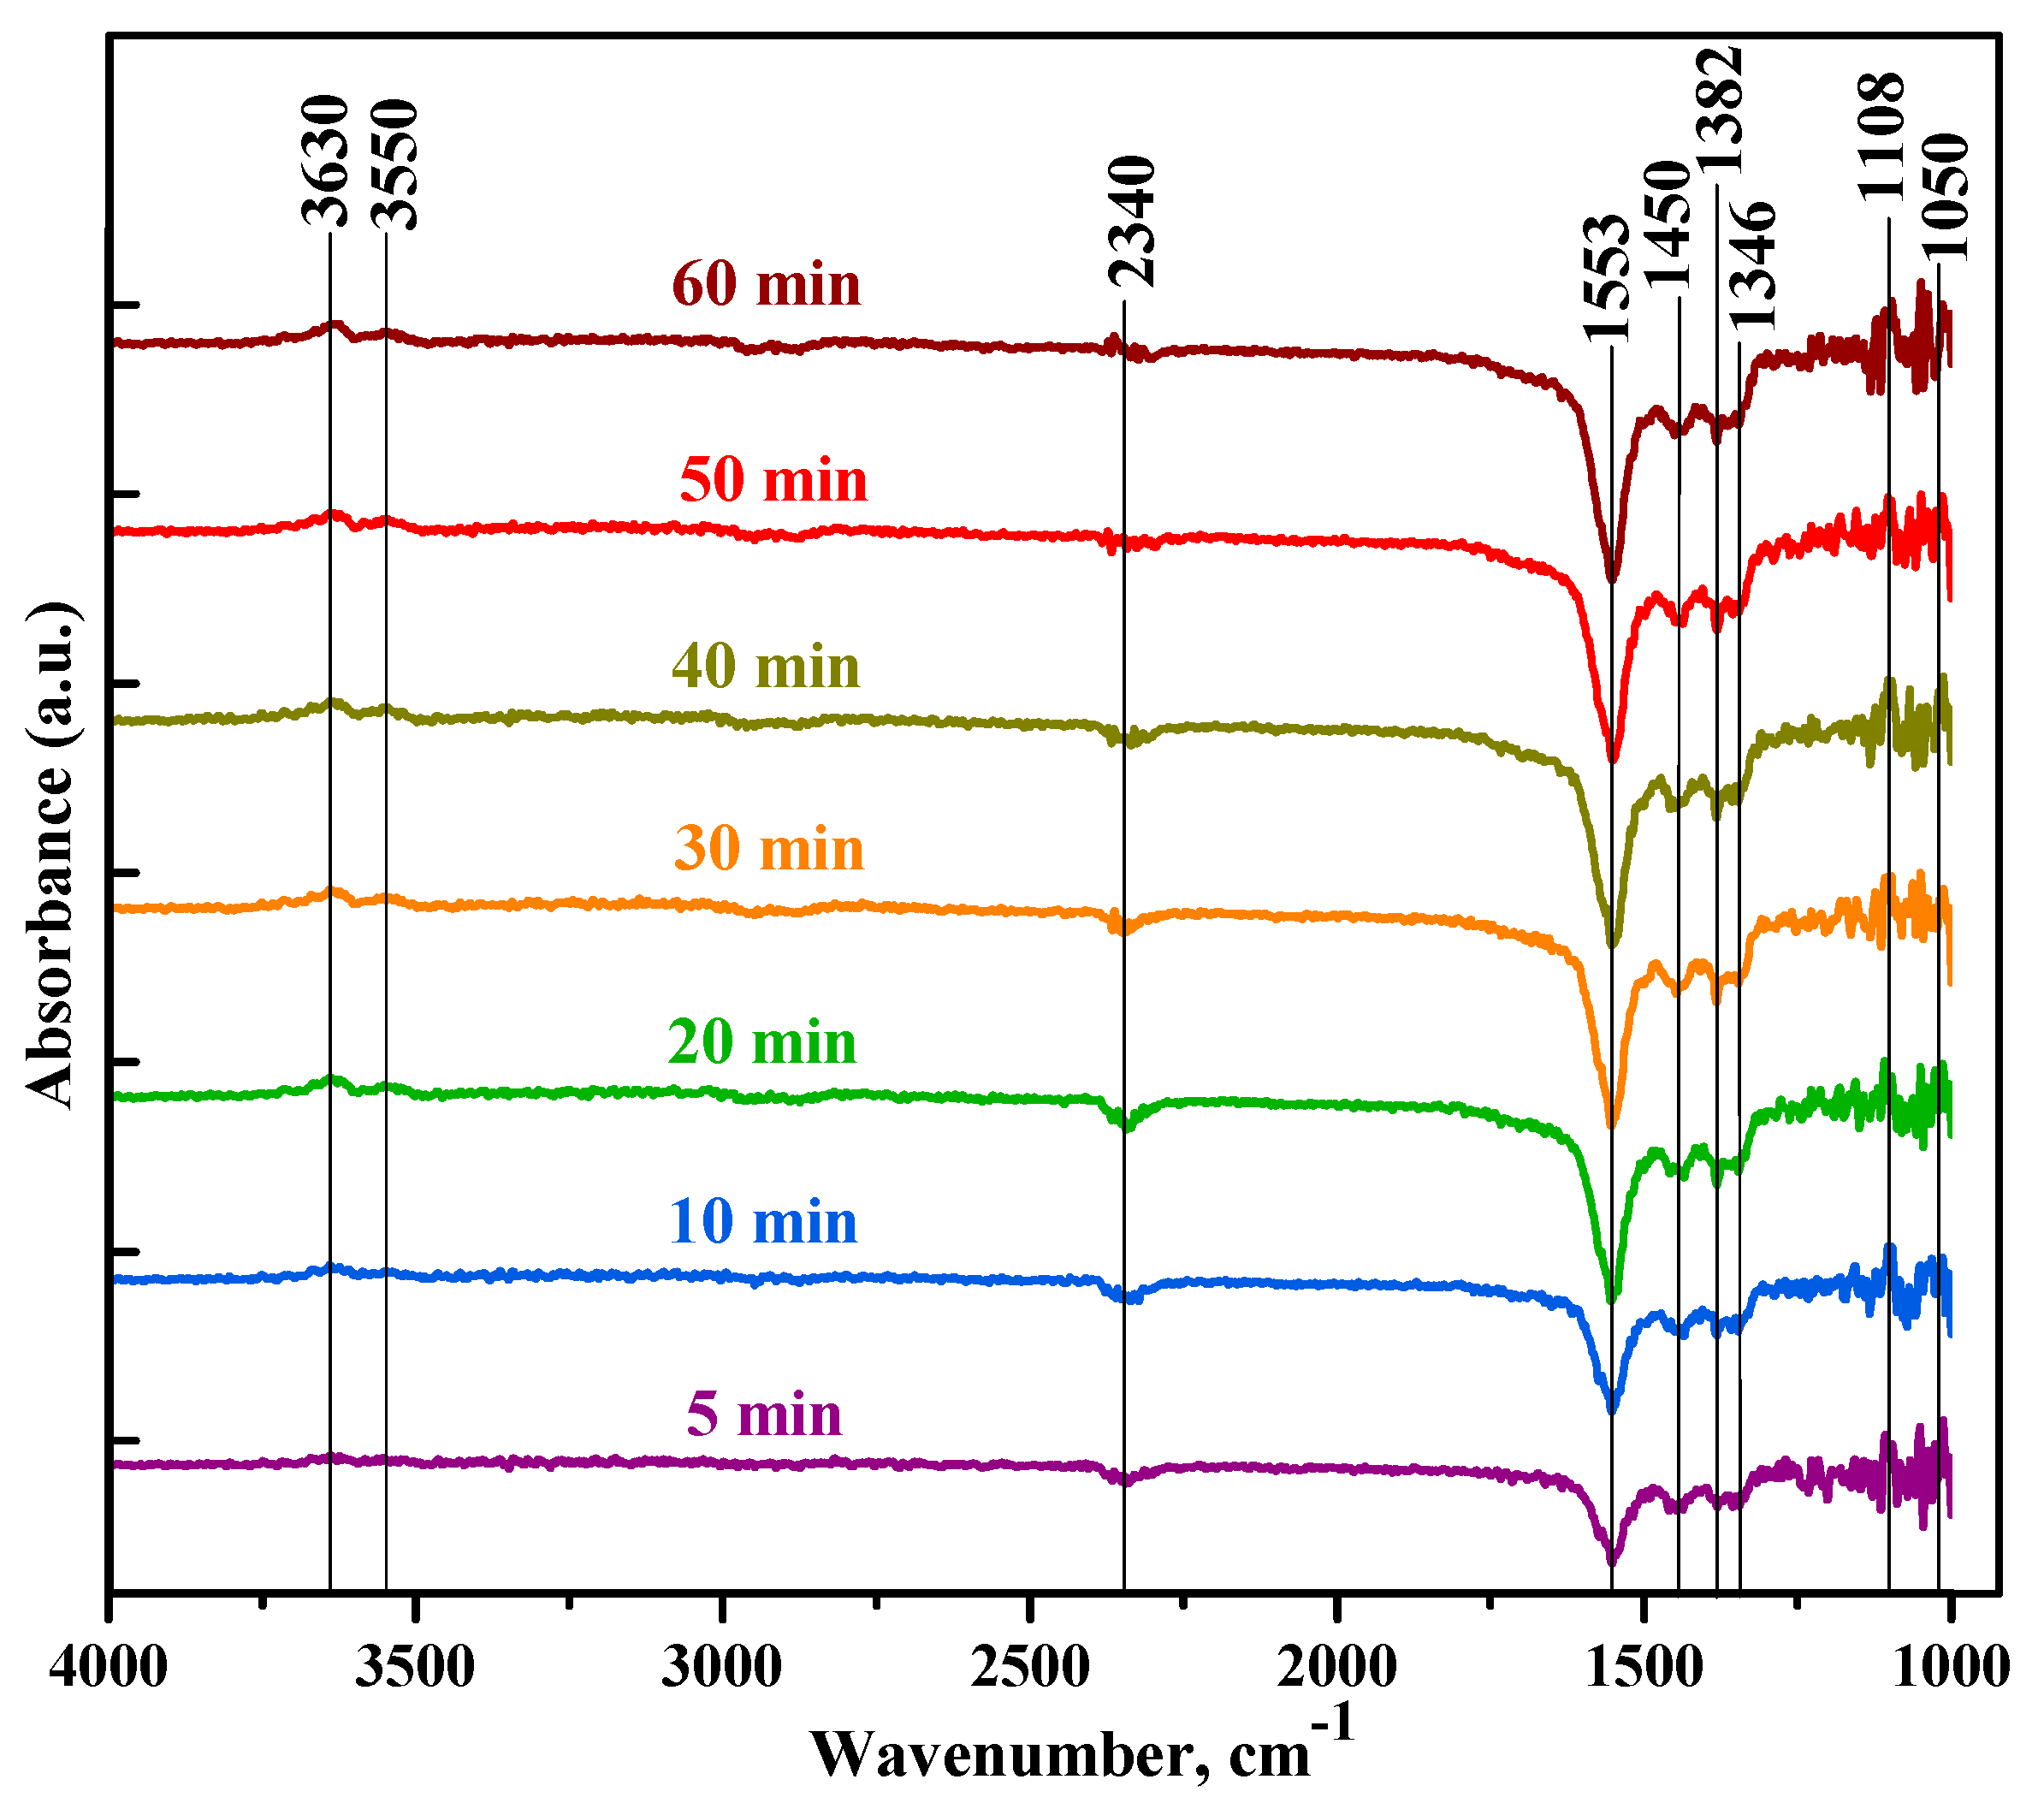
| Sample | Formaldehyde HCHO | DOM H2COO- | Formate HCOO- | Other Bands |
|---|---|---|---|---|
| SnTi-0 | 1202 τ (CH2) | 1050 ν(CO) | 2838 ν(CH) | 2337 CO2 |
| 1742 ν(CO) | 1107 ρ(CH2) | 2890 ν(CH) | 2365 CO2 | |
| 1766 ν(CO) | 1145 ρ(CH2) | |||
| 3010 | 2936 δ (CH2) | |||
| SnTi-2 | 1768 ν(CO) | 1066 ν(CO) | 1344 νs(COO) | 2340 CO2 |
| 1107 ρ(CH2) | 1346 νs(COO) | 3550 ν(OH) | ||
| 1146 ρ(CH2) | 1382 δ(CH) | 3630 ν(OH) | ||
| 1165 ρ(CH2) | 1553 νass(COO) | |||
| 1450 δs(CH2) | 1592 νass(COO) | |||
| 1478 δs (CH2) | 2590 | |||
| 2930 δ (CH2) | 2868 ν(CH) |
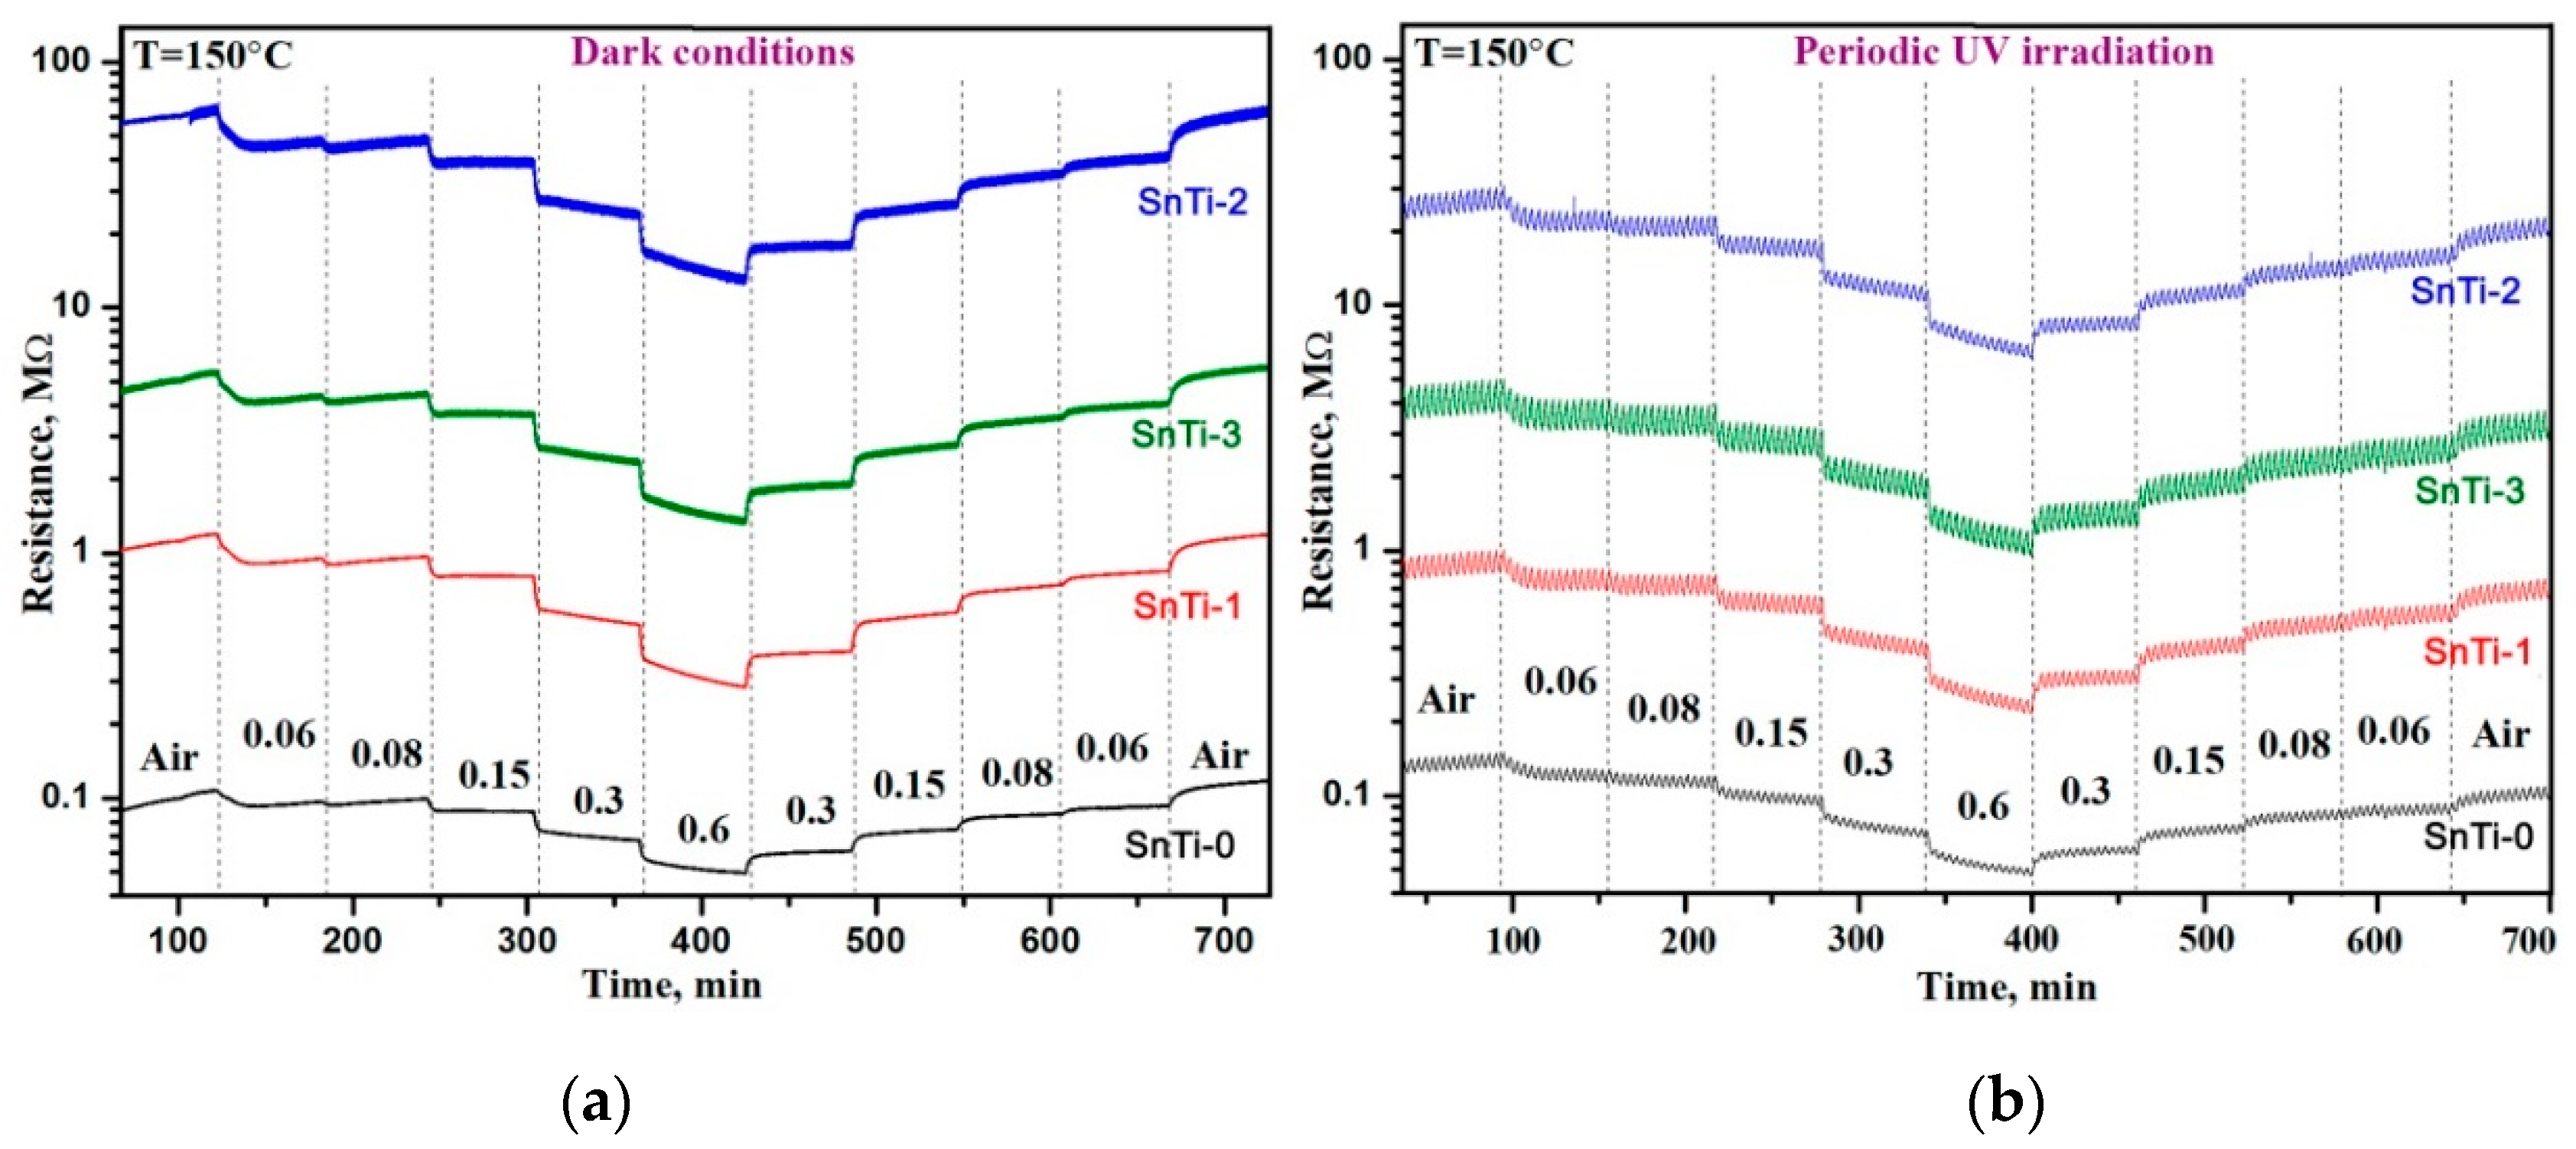
| Sample | S (to 0.06 ppm) | LDL, ppb | Rav, Ohm | τ90, s | τ*90, s | |||
|---|---|---|---|---|---|---|---|---|
| Dark | UV | Dark | UV | Dark | UV | |||
| SnTi-0 | 1.34 | 1.17 | 9 | 30 | 1.2·105 | 1.1·105 | 360 | 780 |
| SnTi-1 | 1.49 | 1.20 | 9 | 32 | 1.2·106 | 7.4·105 | 120 | 660 |
| SnTi-2 | 1.72 | 1.26 | 15 | 32 | 6.5·107 | 2.2·107 | 120 | 660 |
| SnTi-3 | 1.48 | 1.21 | 10 | 30 | 5.8·106 | 3.5·106 | 120 | 680 |
| Material | HCHO conc., ppm | Response S | T, oC | Ref. |
|---|---|---|---|---|
| Si-SnO2 FSP a films | 0.003 | 6.5 | 400 | [7] |
| In4Sn3O12 thin films | 0.02 | 110 | 350 | [86] |
| CuO nanocubes | 0.05 | 4 | 300 | [87] |
| SnO2-Au | 0.05 | 2 | 300 | [8] |
| In2O3 nanolamellas | 0.08 | 4 | 300 | [88] |
| TiO2 UV activation | 0.1 | 67 | RT | [22] |
| SnO2-NiO | 0.3 | 18 | 300 | [89] |
| Ag-LaFeO3 | 0.5 | 2400 | 40 | [90] |
| Ag-LaFeO3 | 1 | 2400 | 90 | [91] |
| TiO2 hollow microspheres | 5 | 3900 | RT | [23] |
| Au@ZnO core-shell structure | 5 | 957 | RT | [92] |
| CdO-In2O3 | 10 | 9900 | 95 | [93] |
| SnO2 mesoporous | 10 | 9900 | 150 | [94] |
| TiO2 macroporous | 10 | 6900 | RT | [20] |
| Cd-In2O3 hollow fibers | 10 | 1500 | 280 | [95] |
| Ag-SnO2 nanoparticles | 10 | 1340 | 125 | [96] |
| SnO2/In2O3 nanofibers | 10 | 650 | 375 | [97] |
| SnO2 nanowires | 10 | 145 | 270 | [98] |
| SnO2/α-Fe2O3 hollow spheres | 10 | 100 | 250 | [99] |
| Pd-SnO2 thin films | 10 | 55 | 250 | [100] |
| NiO thin films | 10 | 50 | 300 | [101] |
| TiO2 nanotube arrays | 10 | 7 | RT | [21] |
| La2O3-SnO2 thin films | 18.7 | 5400 | 250 | [102] |
| NiO thin films | 20 | 330 | 340 | [103] |
| ZnO UV activated | 50 | 10700 | RT | [104] |
| TiO2-SnO2 | 50 | 3000 | 360 | [28] |
| La1-xSrxFeO3 | 50 | 2500 | 200 | [105] |
| SnO2-MWCNT b | 50 | 300 | 250 | [106] |
| Au@SnO2 core-shell structure | 50 | 190 | RT | [107] |
| SnO2 microspheres | 100 | 3730 | 200 | [108] |
| Cd-TiO2/SnO2 | 100 | 1400 | 320 | [109] |
| ZnO/ZIF c | 100 | 1100 | 300 | [110] |
| Au-ZnO octahedrons | 100 | 660 | RT | [111] |
| γ-Fe2O3 | 100 | 500 | 320 | [77] |
| α-Fe2O3 | 100 | 52 | 325 | [112] |
| CdO/Sn-ZnO | 200 | 200000 | 200 | [113] |
| ZnO-MnO2 | 200 | 2600 | 320 | [114] |
| Ga-ZnO | 205 | 13 | 400 | [115] |
| LaFeO3 hollow nanospheres | 500 | 1900 | 260 | [116] |
| ZnO | 1000 | 99600 | 210 | [117] |
© 2019 by the authors. Licensee MDPI, Basel, Switzerland. This article is an open access article distributed under the terms and conditions of the Creative Commons Attribution (CC BY) license (http://creativecommons.org/licenses/by/4.0/).
Share and Cite
Nasriddinov, A.; Rumyantseva, M.; Marikutsa, A.; Gaskov, A.; Lee, J.-H.; Kim, J.-H.; Kim, J.-Y.; Kim, S.S.; Kim, H.W. Sub-ppm Formaldehyde Detection by n-n TiO2@SnO2 Nanocomposites. Sensors 2019, 19, 3182. https://0-doi-org.brum.beds.ac.uk/10.3390/s19143182
Nasriddinov A, Rumyantseva M, Marikutsa A, Gaskov A, Lee J-H, Kim J-H, Kim J-Y, Kim SS, Kim HW. Sub-ppm Formaldehyde Detection by n-n TiO2@SnO2 Nanocomposites. Sensors. 2019; 19(14):3182. https://0-doi-org.brum.beds.ac.uk/10.3390/s19143182
Chicago/Turabian StyleNasriddinov, Abulkosim, Marina Rumyantseva, Artem Marikutsa, Alexander Gaskov, Jae-Hyoung Lee, Jae-Hun Kim, Jin-Young Kim, Sang Sub Kim, and Hyoun Woo Kim. 2019. "Sub-ppm Formaldehyde Detection by n-n TiO2@SnO2 Nanocomposites" Sensors 19, no. 14: 3182. https://0-doi-org.brum.beds.ac.uk/10.3390/s19143182