Closing the Wearable Gap—Part II: Sensor Orientation and Placement for Foot and Ankle Joint Kinematic Measurements

 , ,
, ,  ,
,  and
and
Abstract
:1. Introduction
- The initial work in [3] was extended to human movement.
- SRS sensor placement was analyzed and optimal sensor placement was determined for plantar flexion (PF), dorsiflexion (DF), inversion (INV), and eversion (EVR).
- Linear model analysis results show high levels of goodness-of-fit and low RMSE values, meaning the proposed placements are effective at measuring INV, EVR, PF and DF compared to the gold-standard motion capture solution.
2. Materials and Methods
2.1. Participants
2.2. Study Design
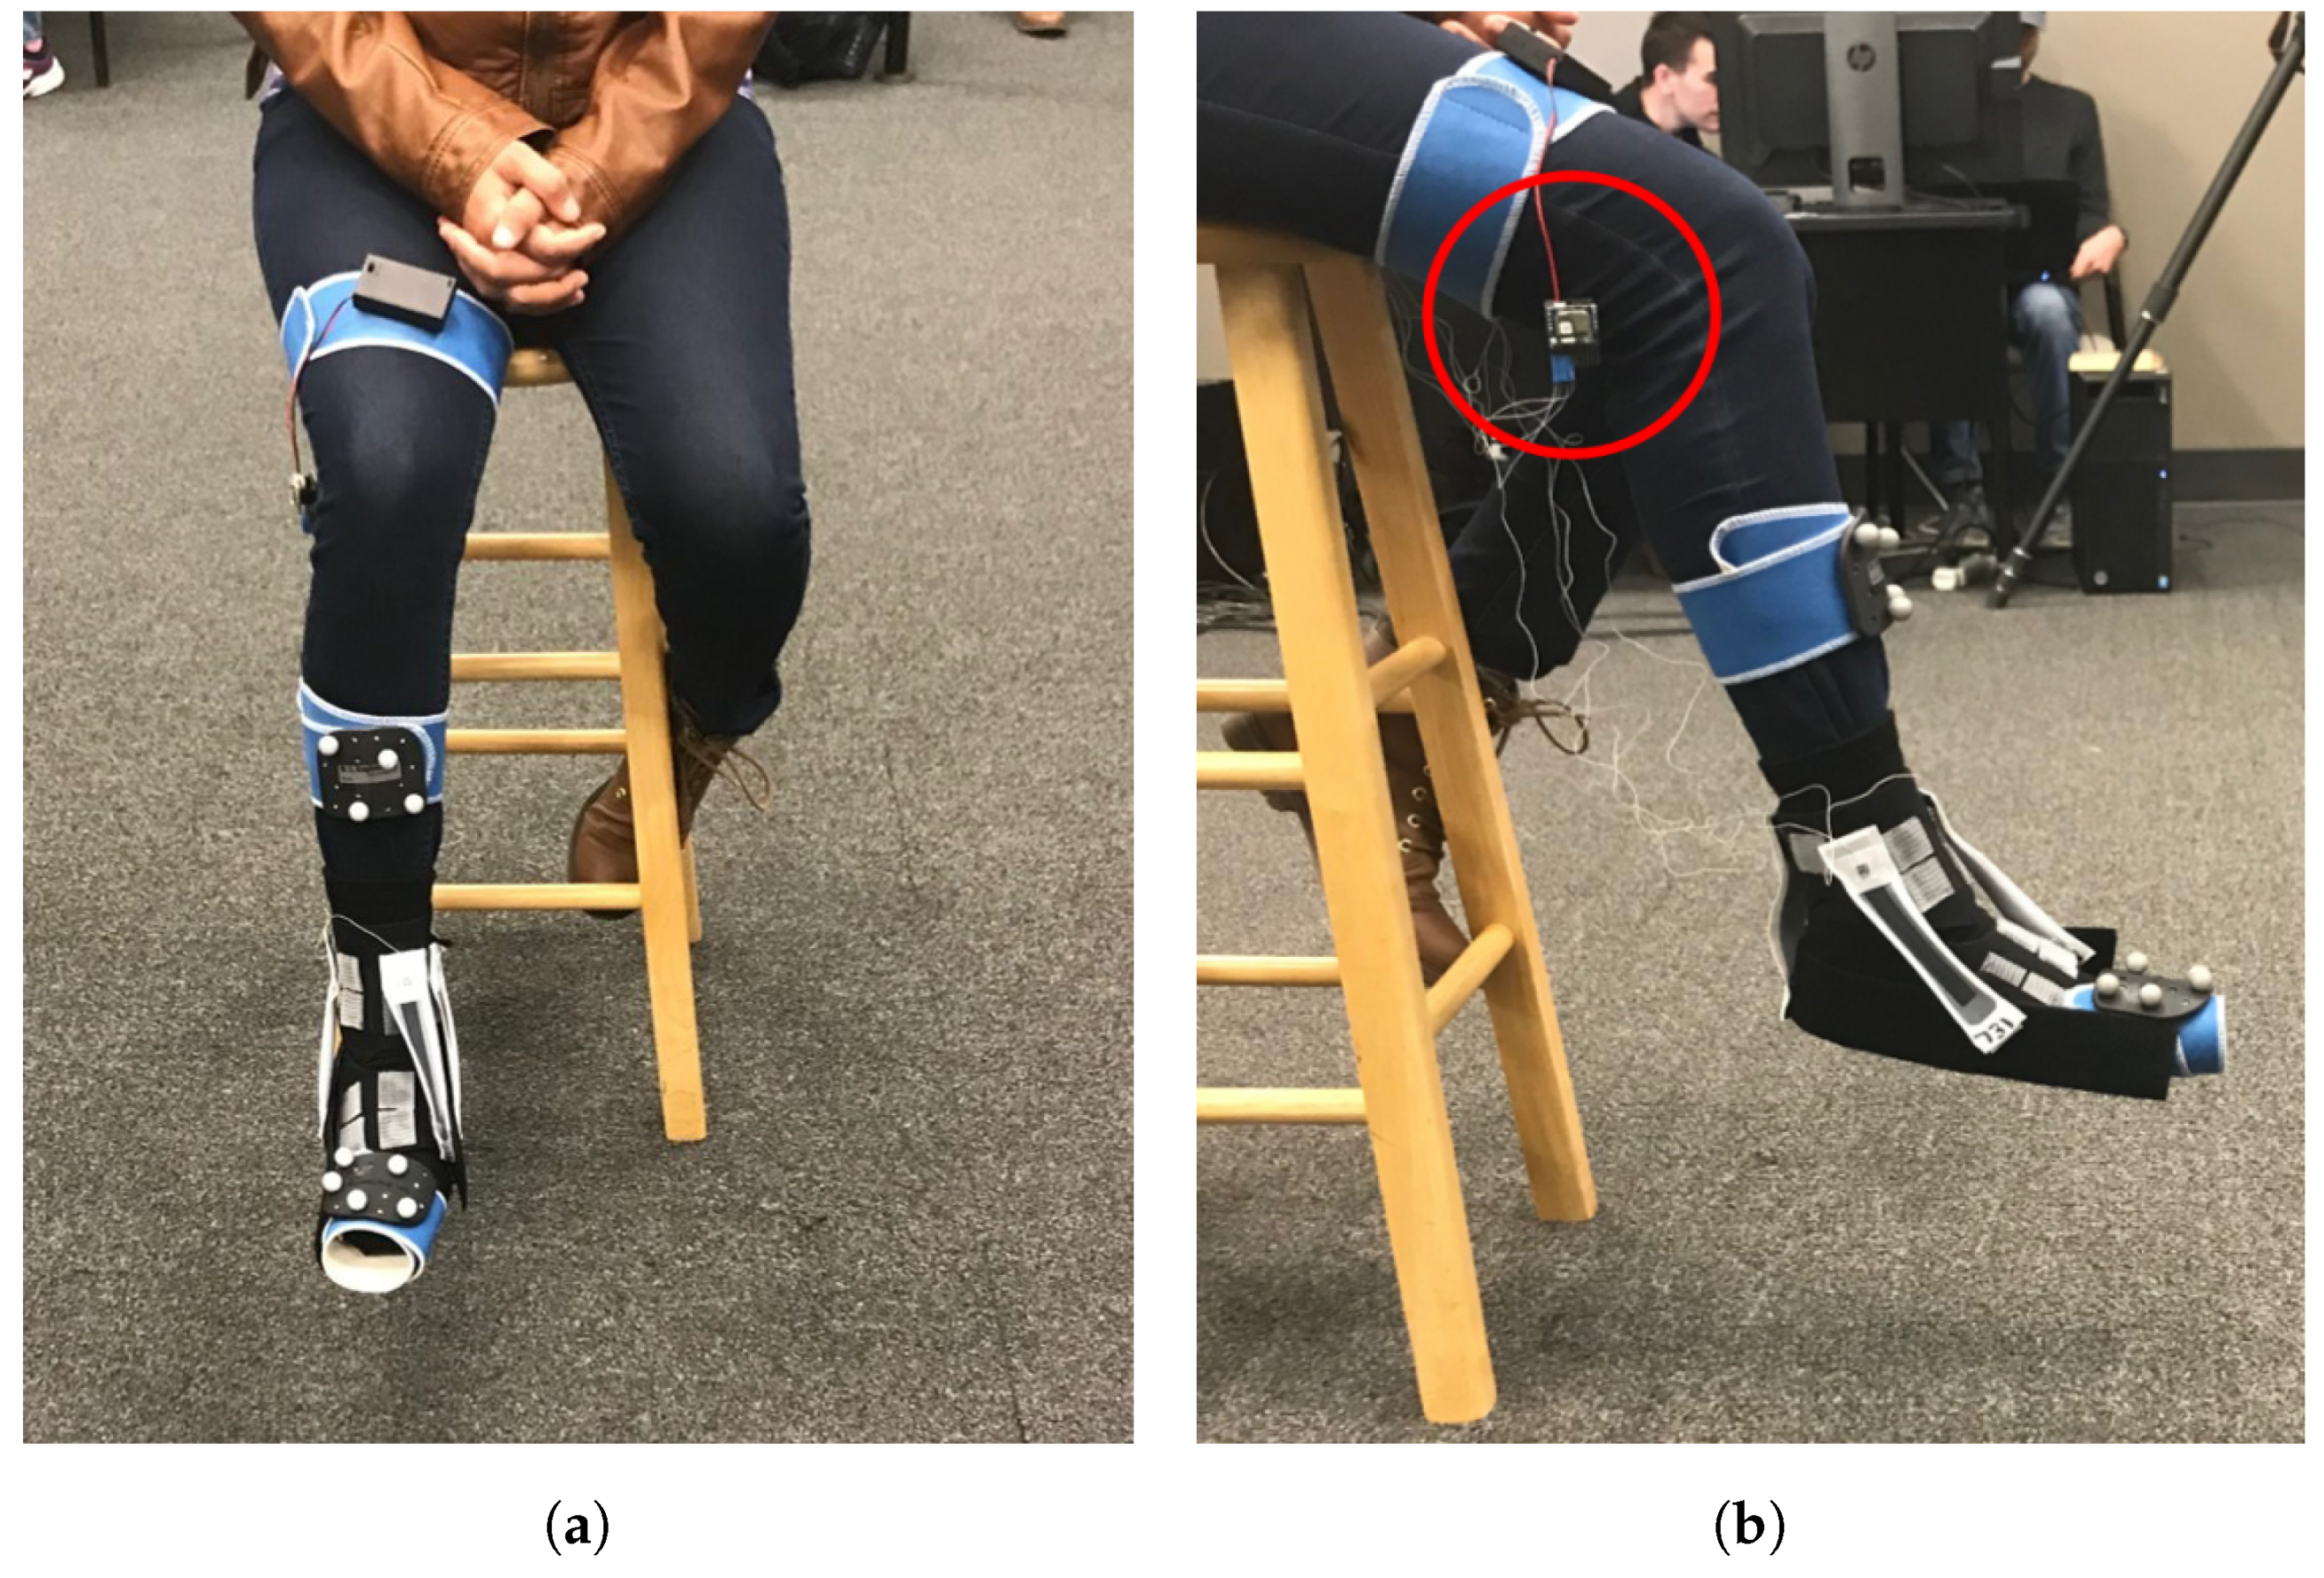
2.3. Instrumentation and Participant Preparation
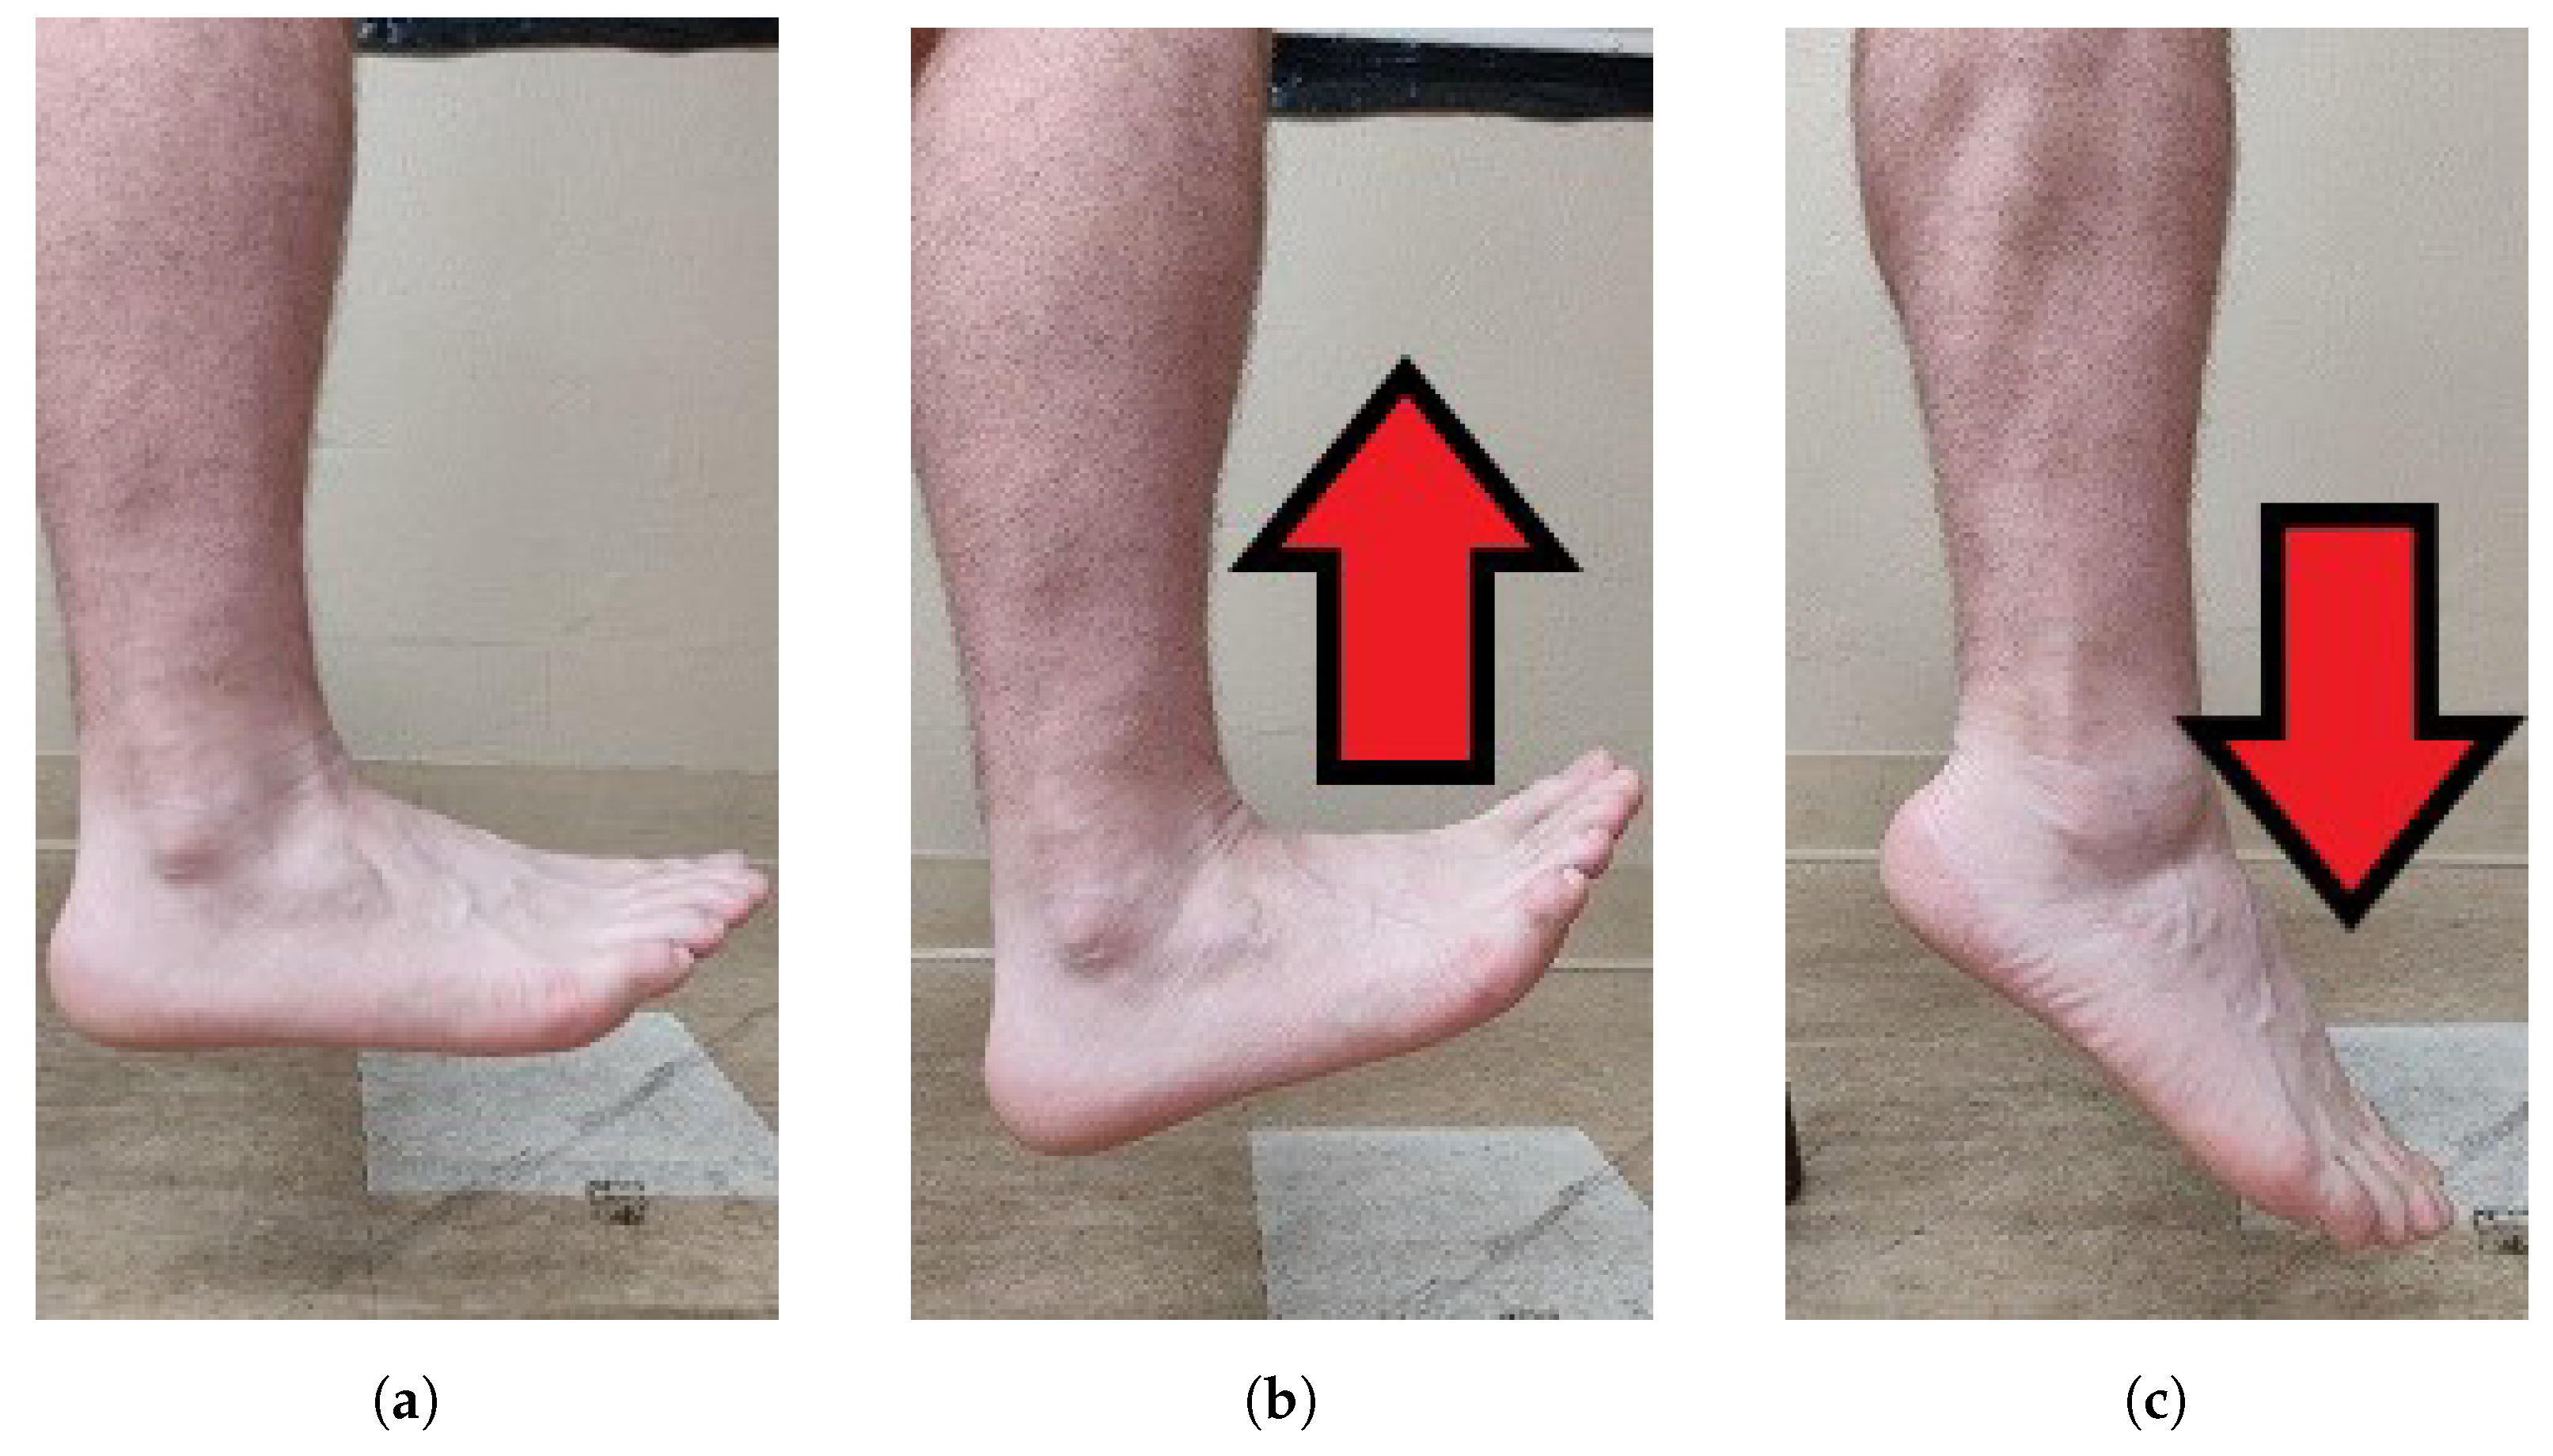
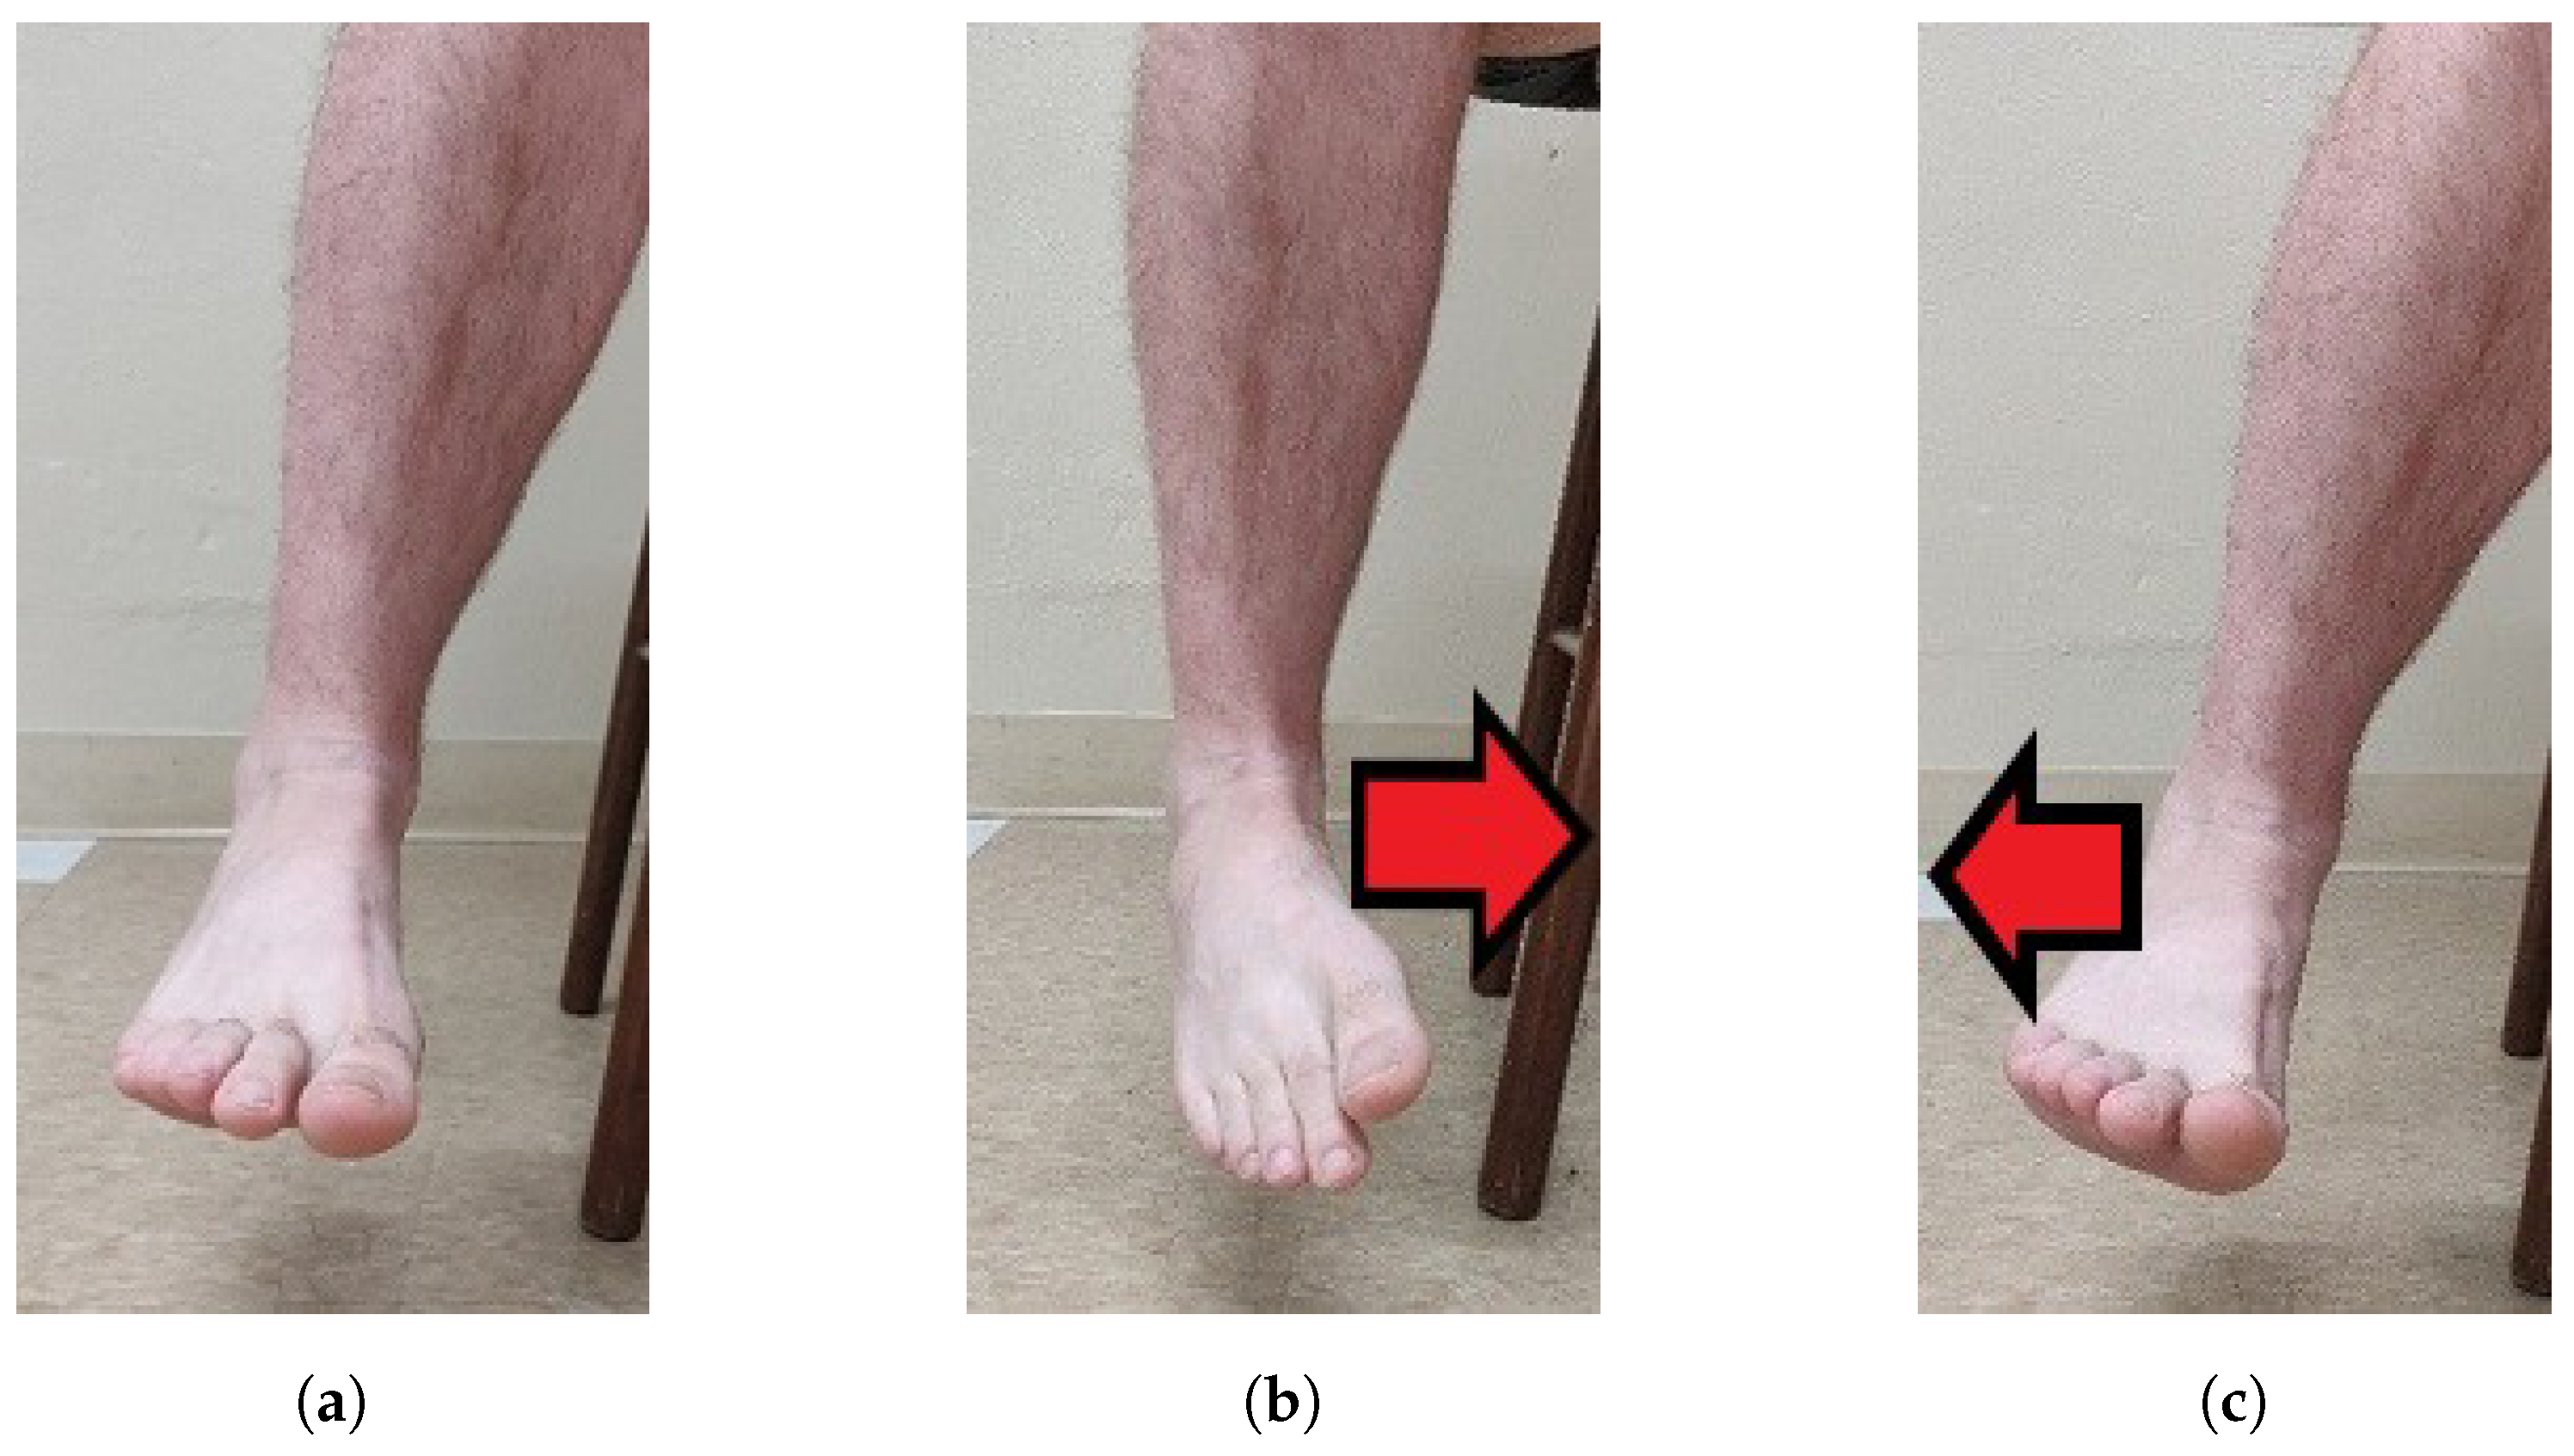
2.4. Movements
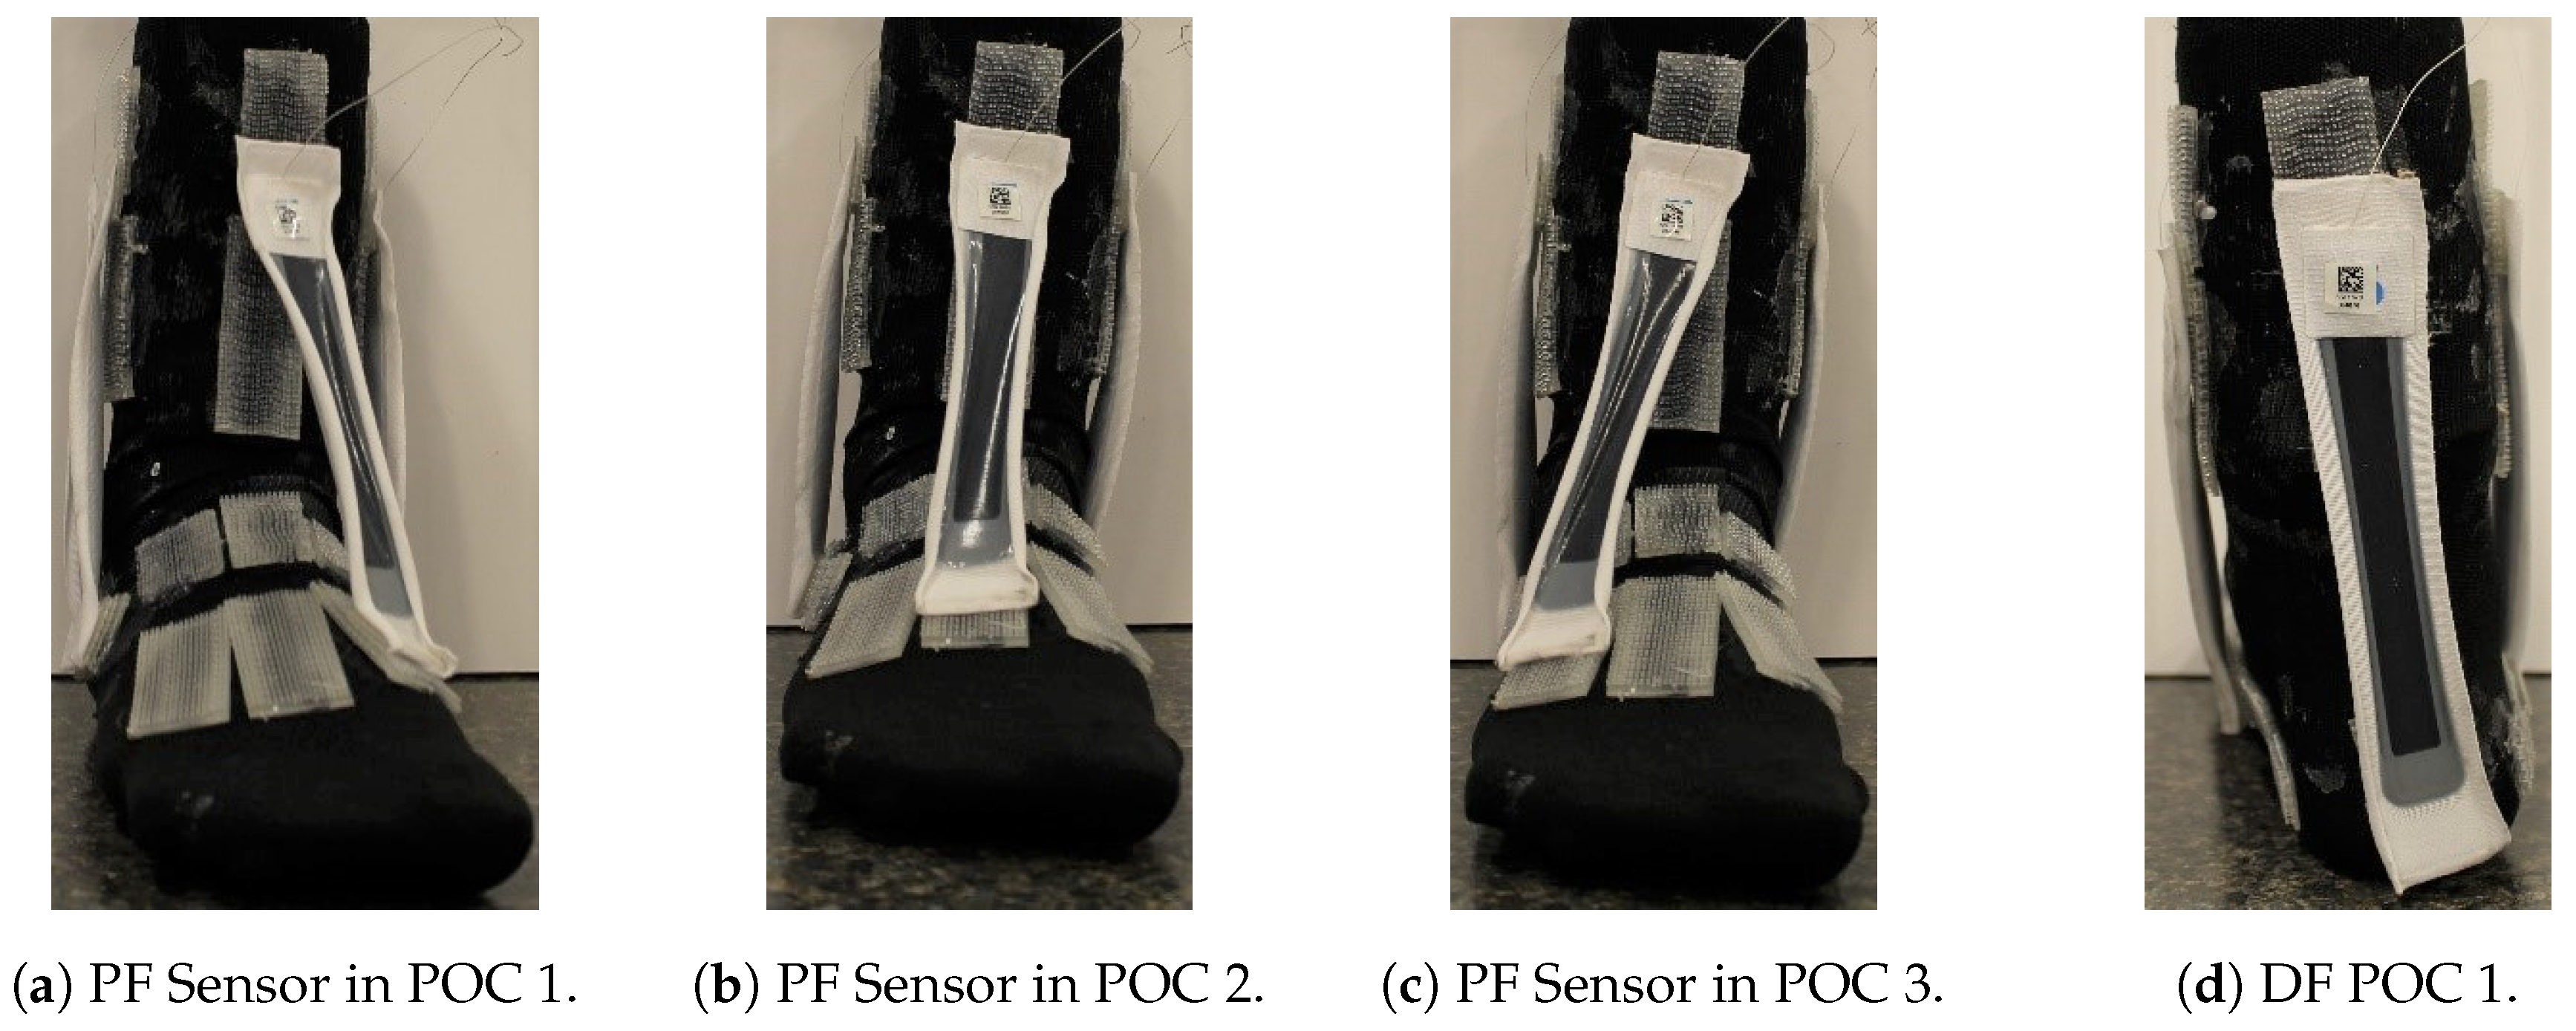
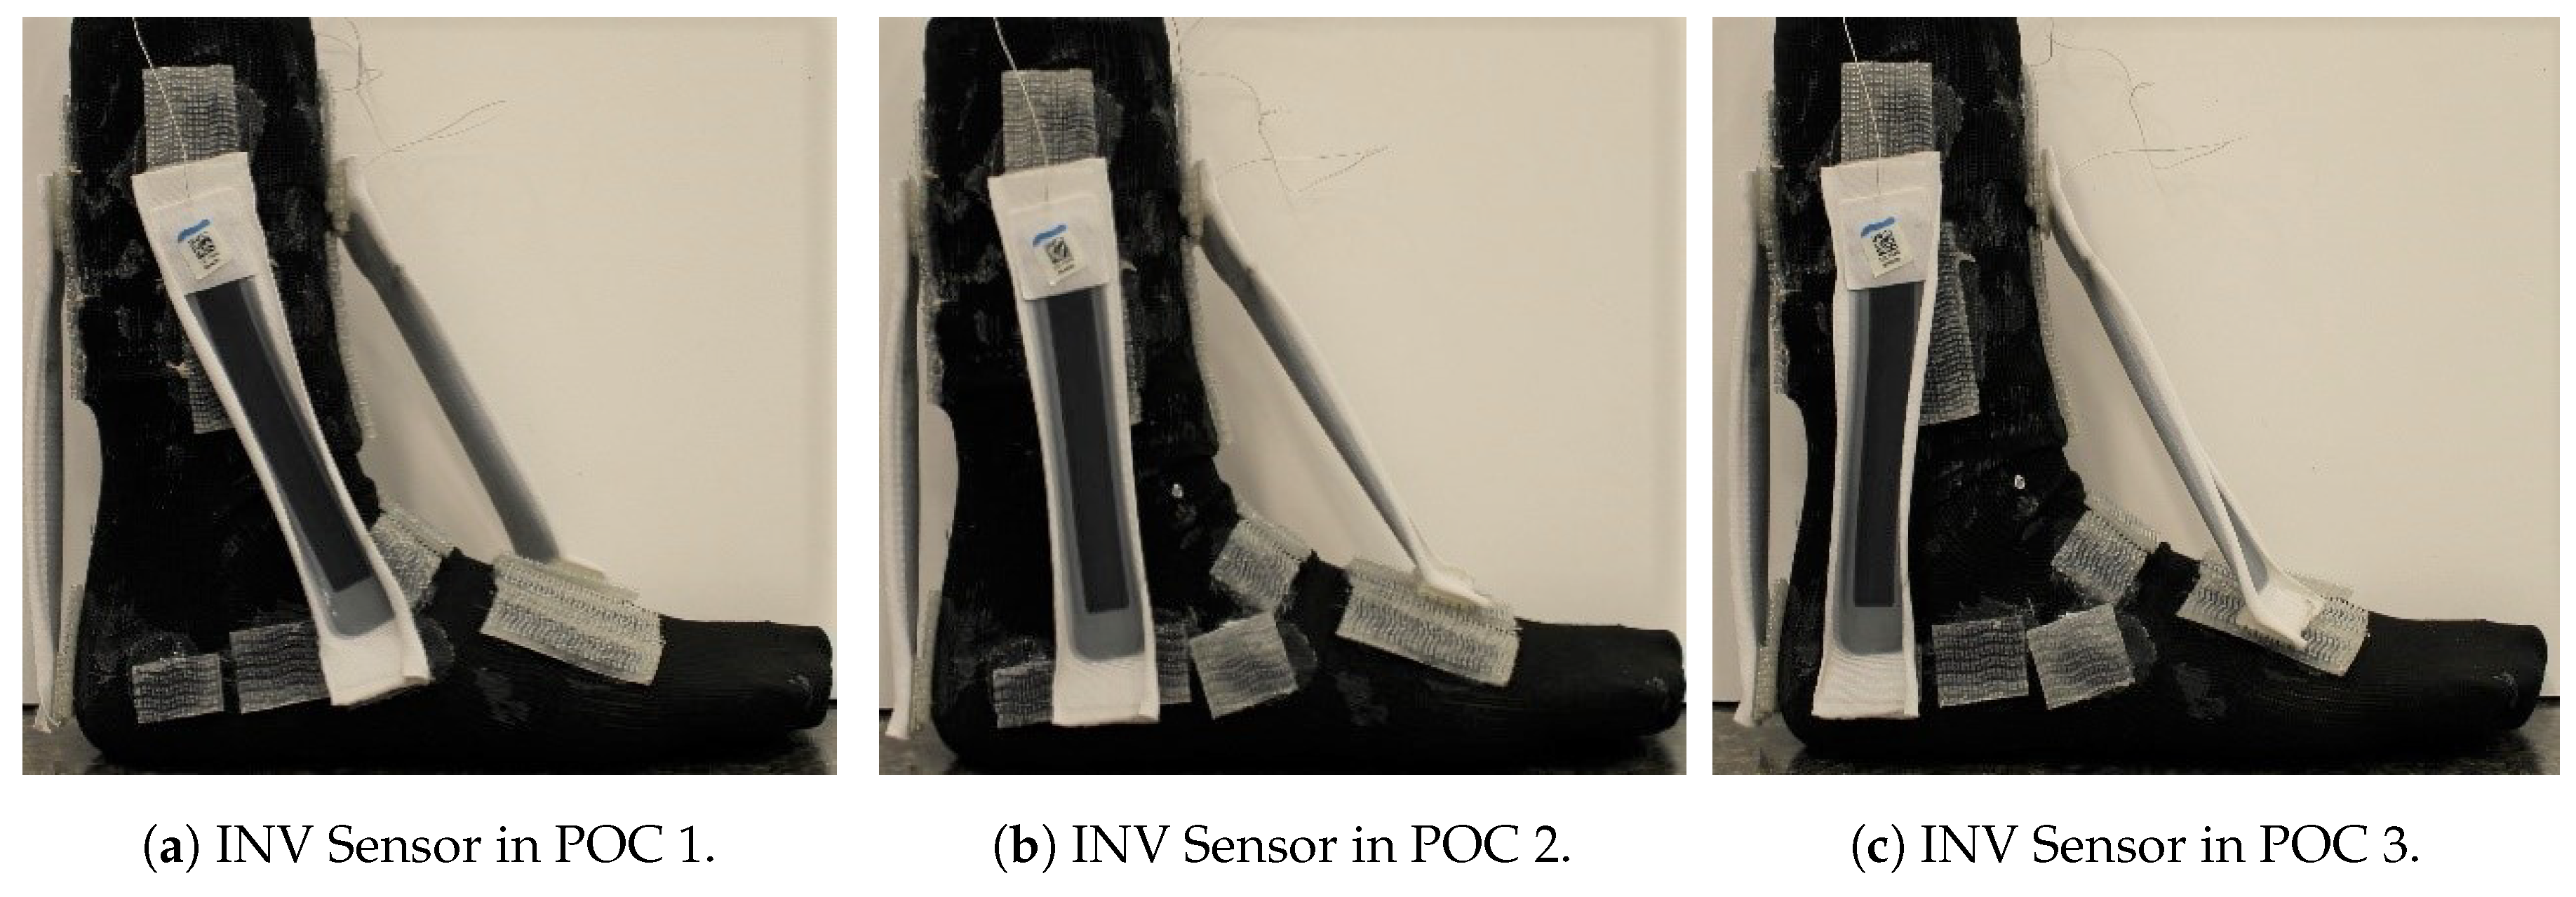
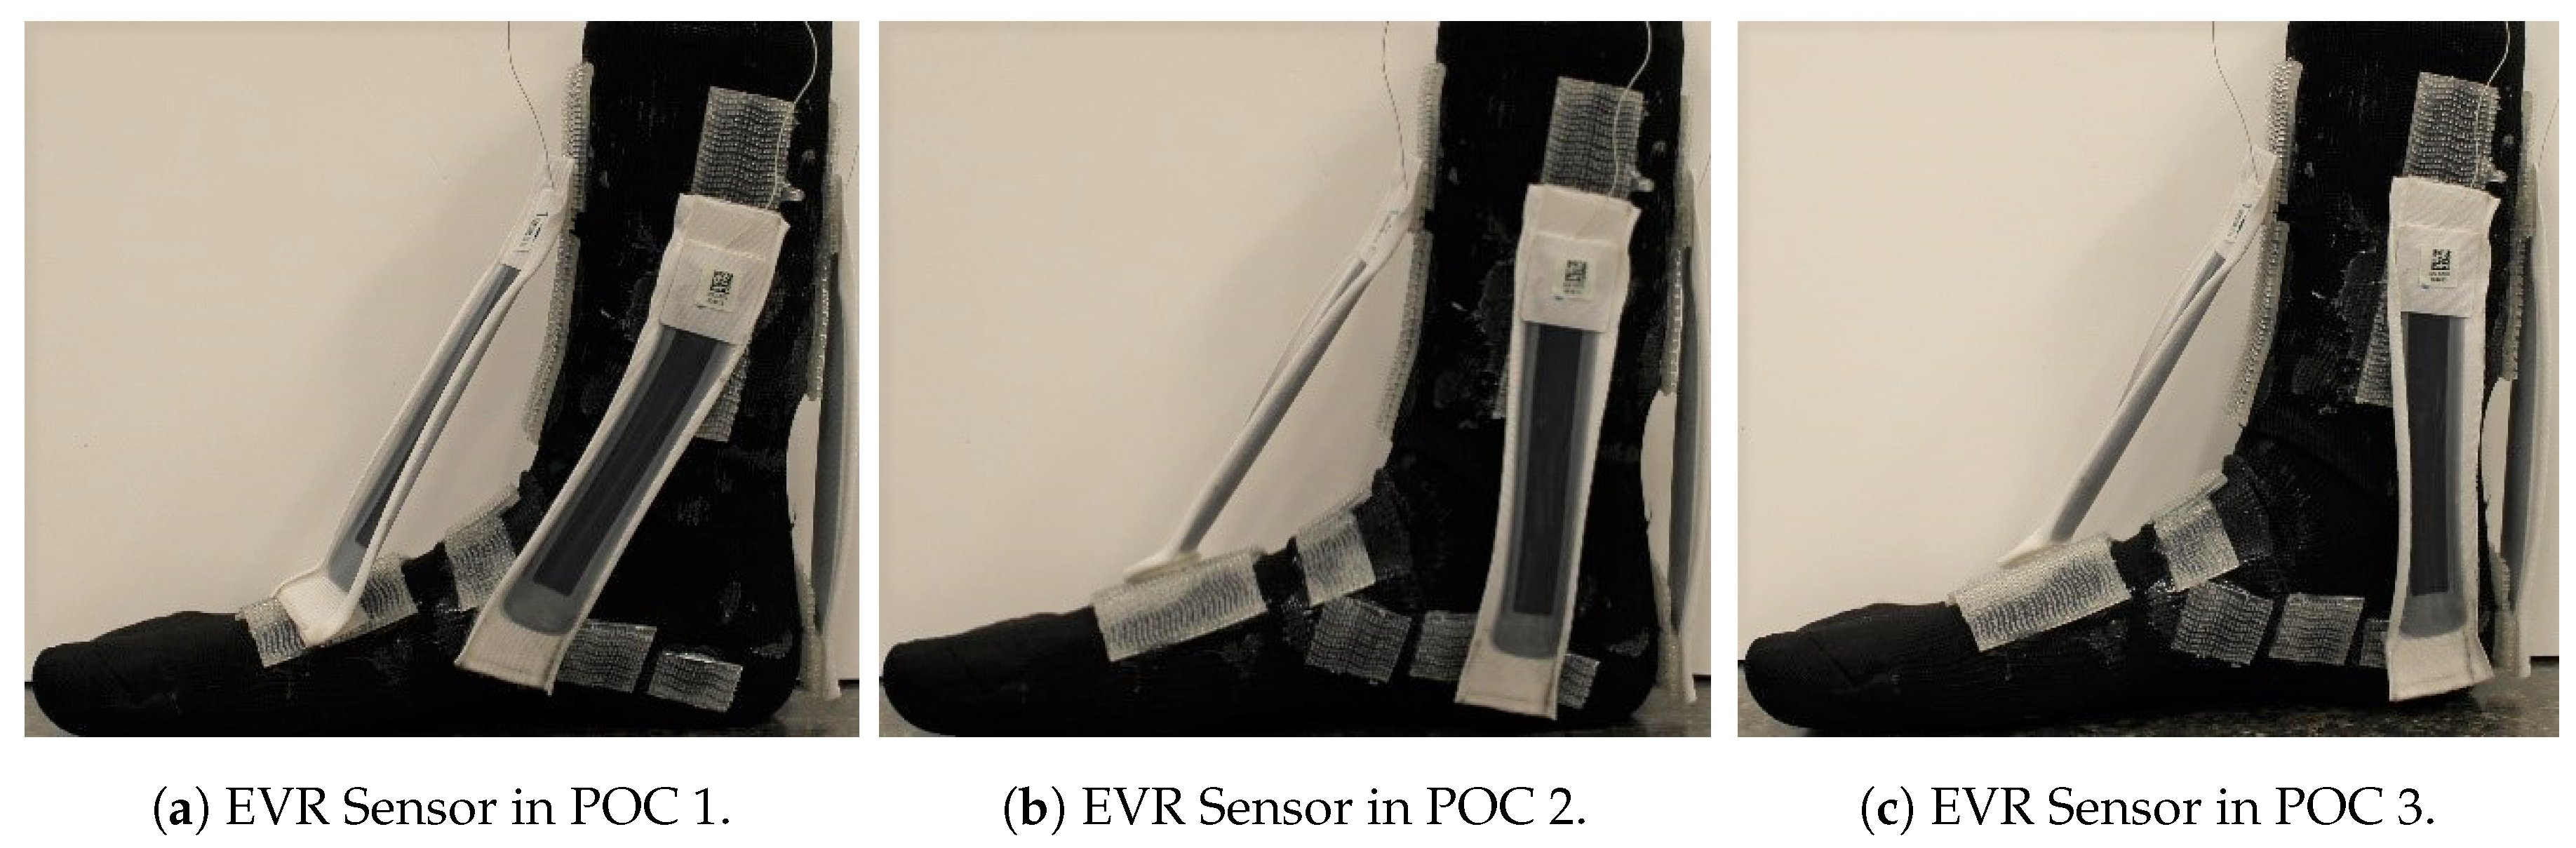
2.4.1. SRS POCs
2.5. Experimental Procedures
2.6. Data Analysis
2.7. Statistical Analysis
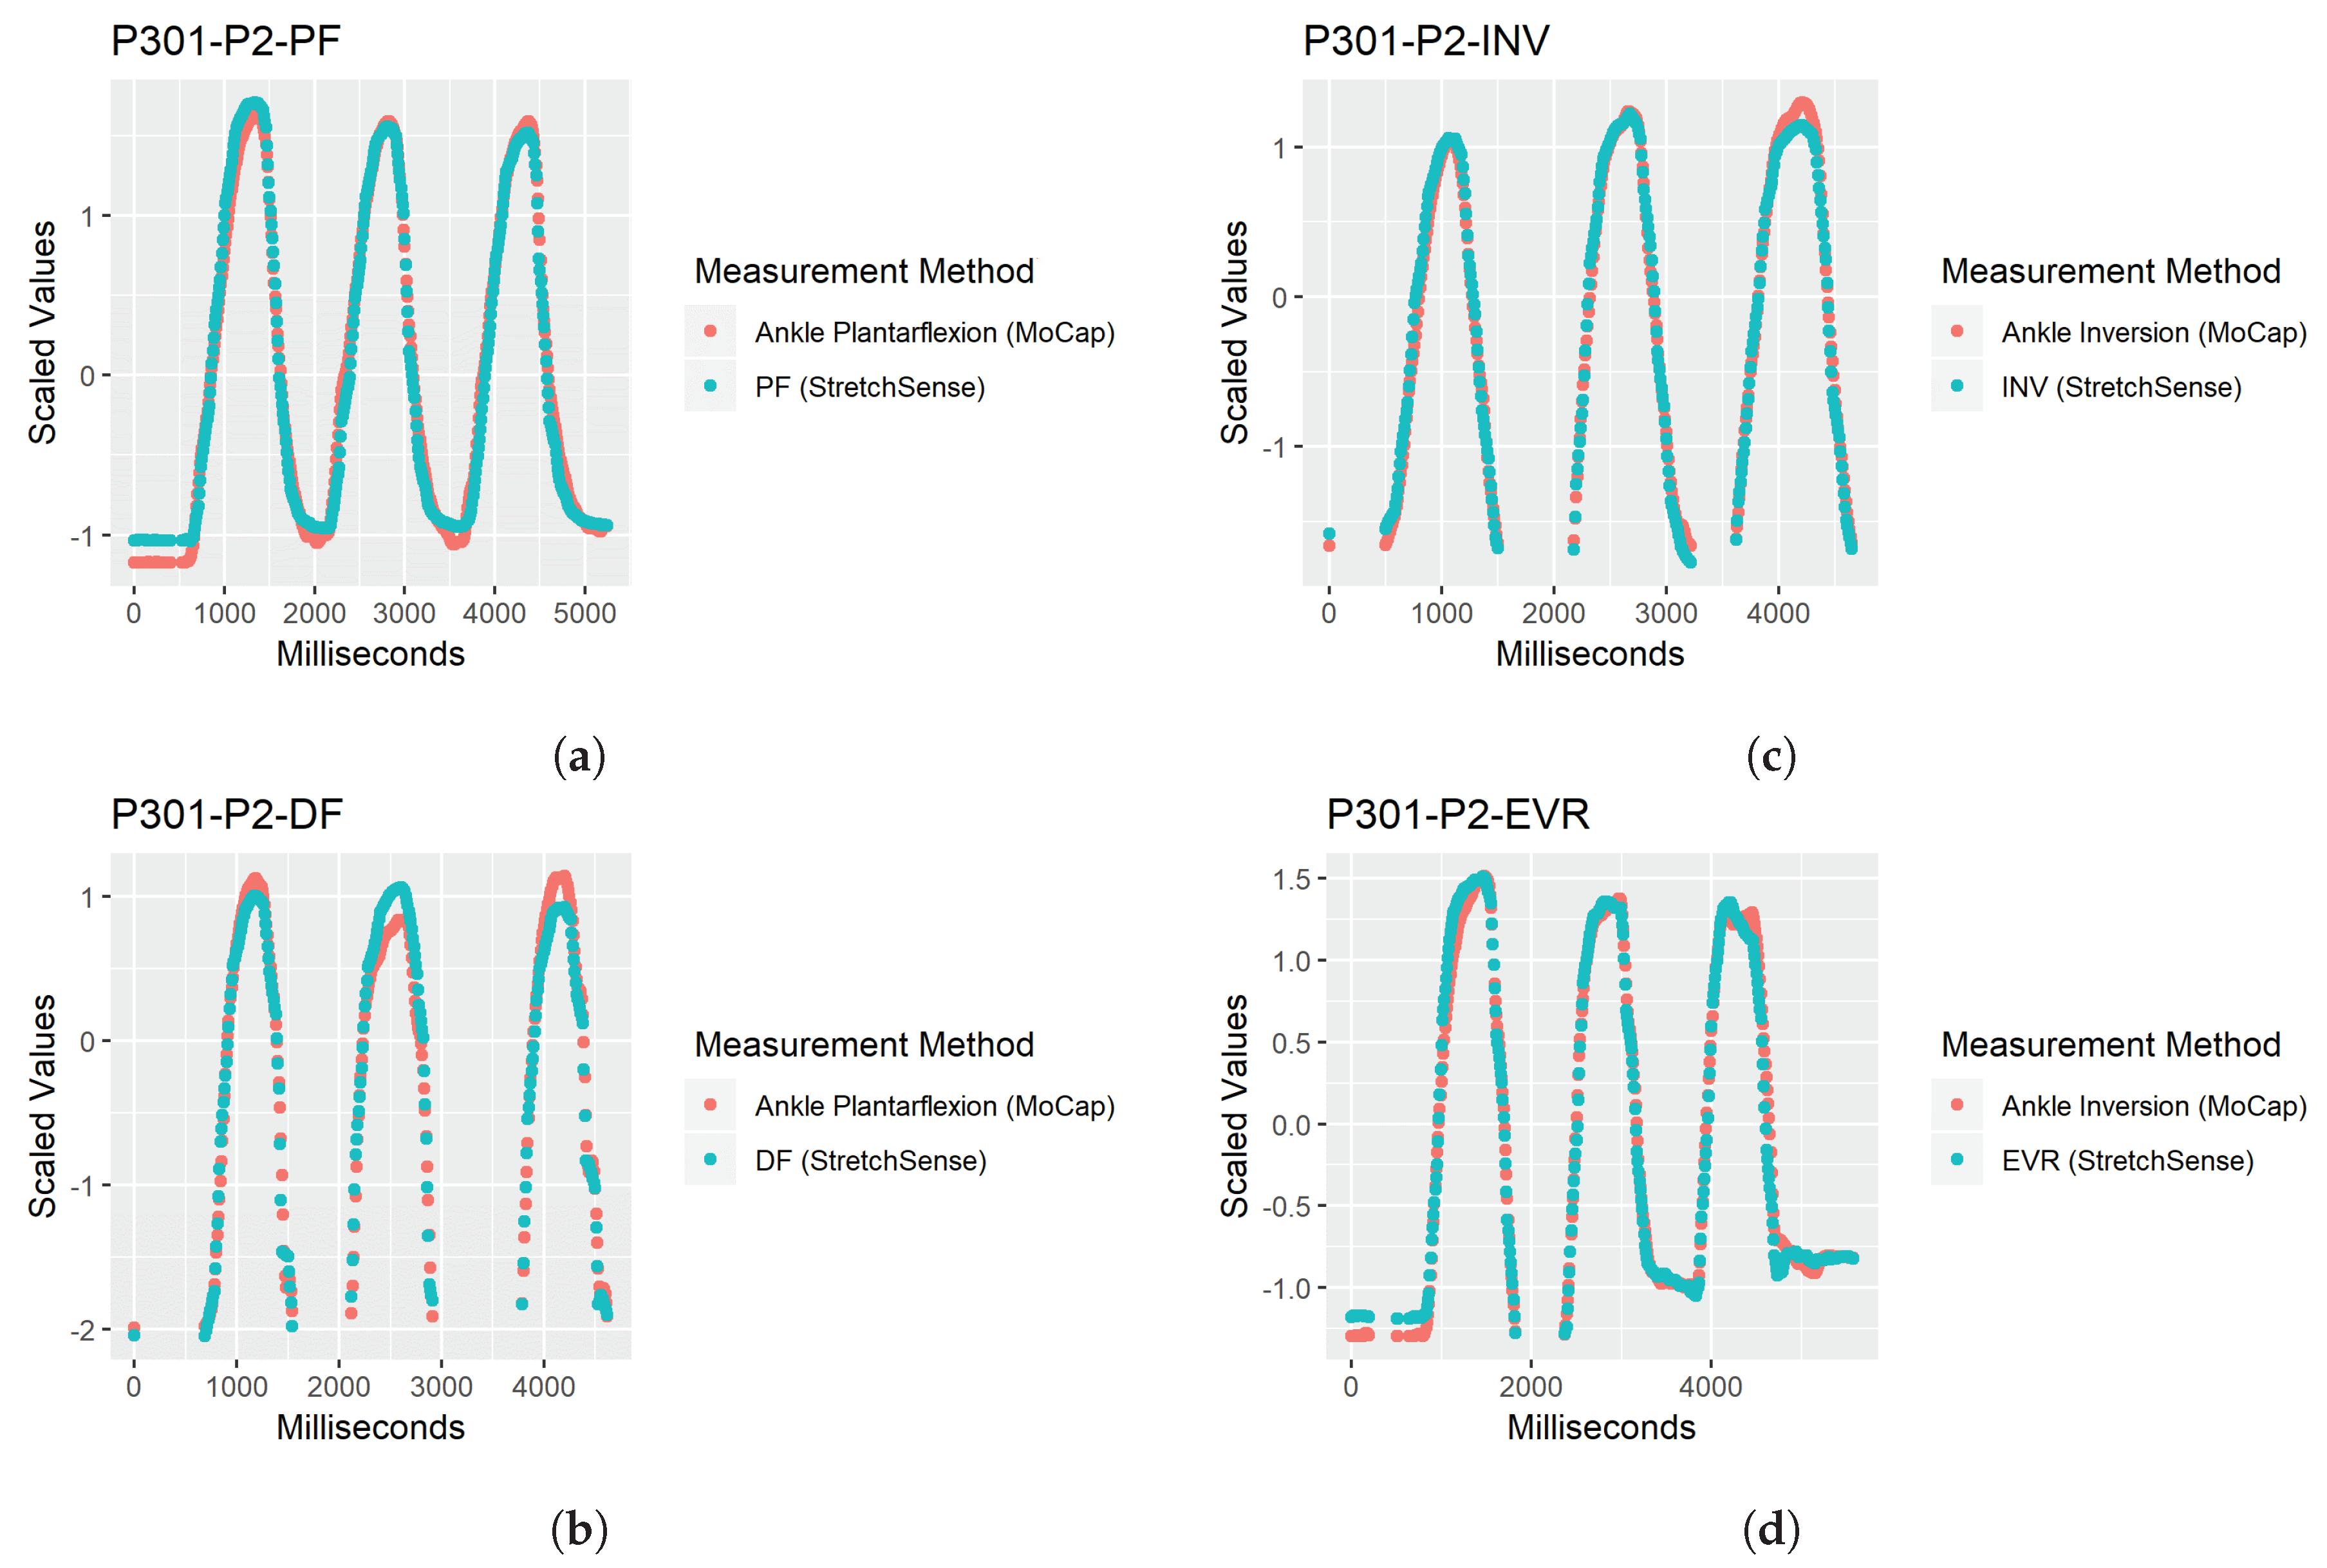
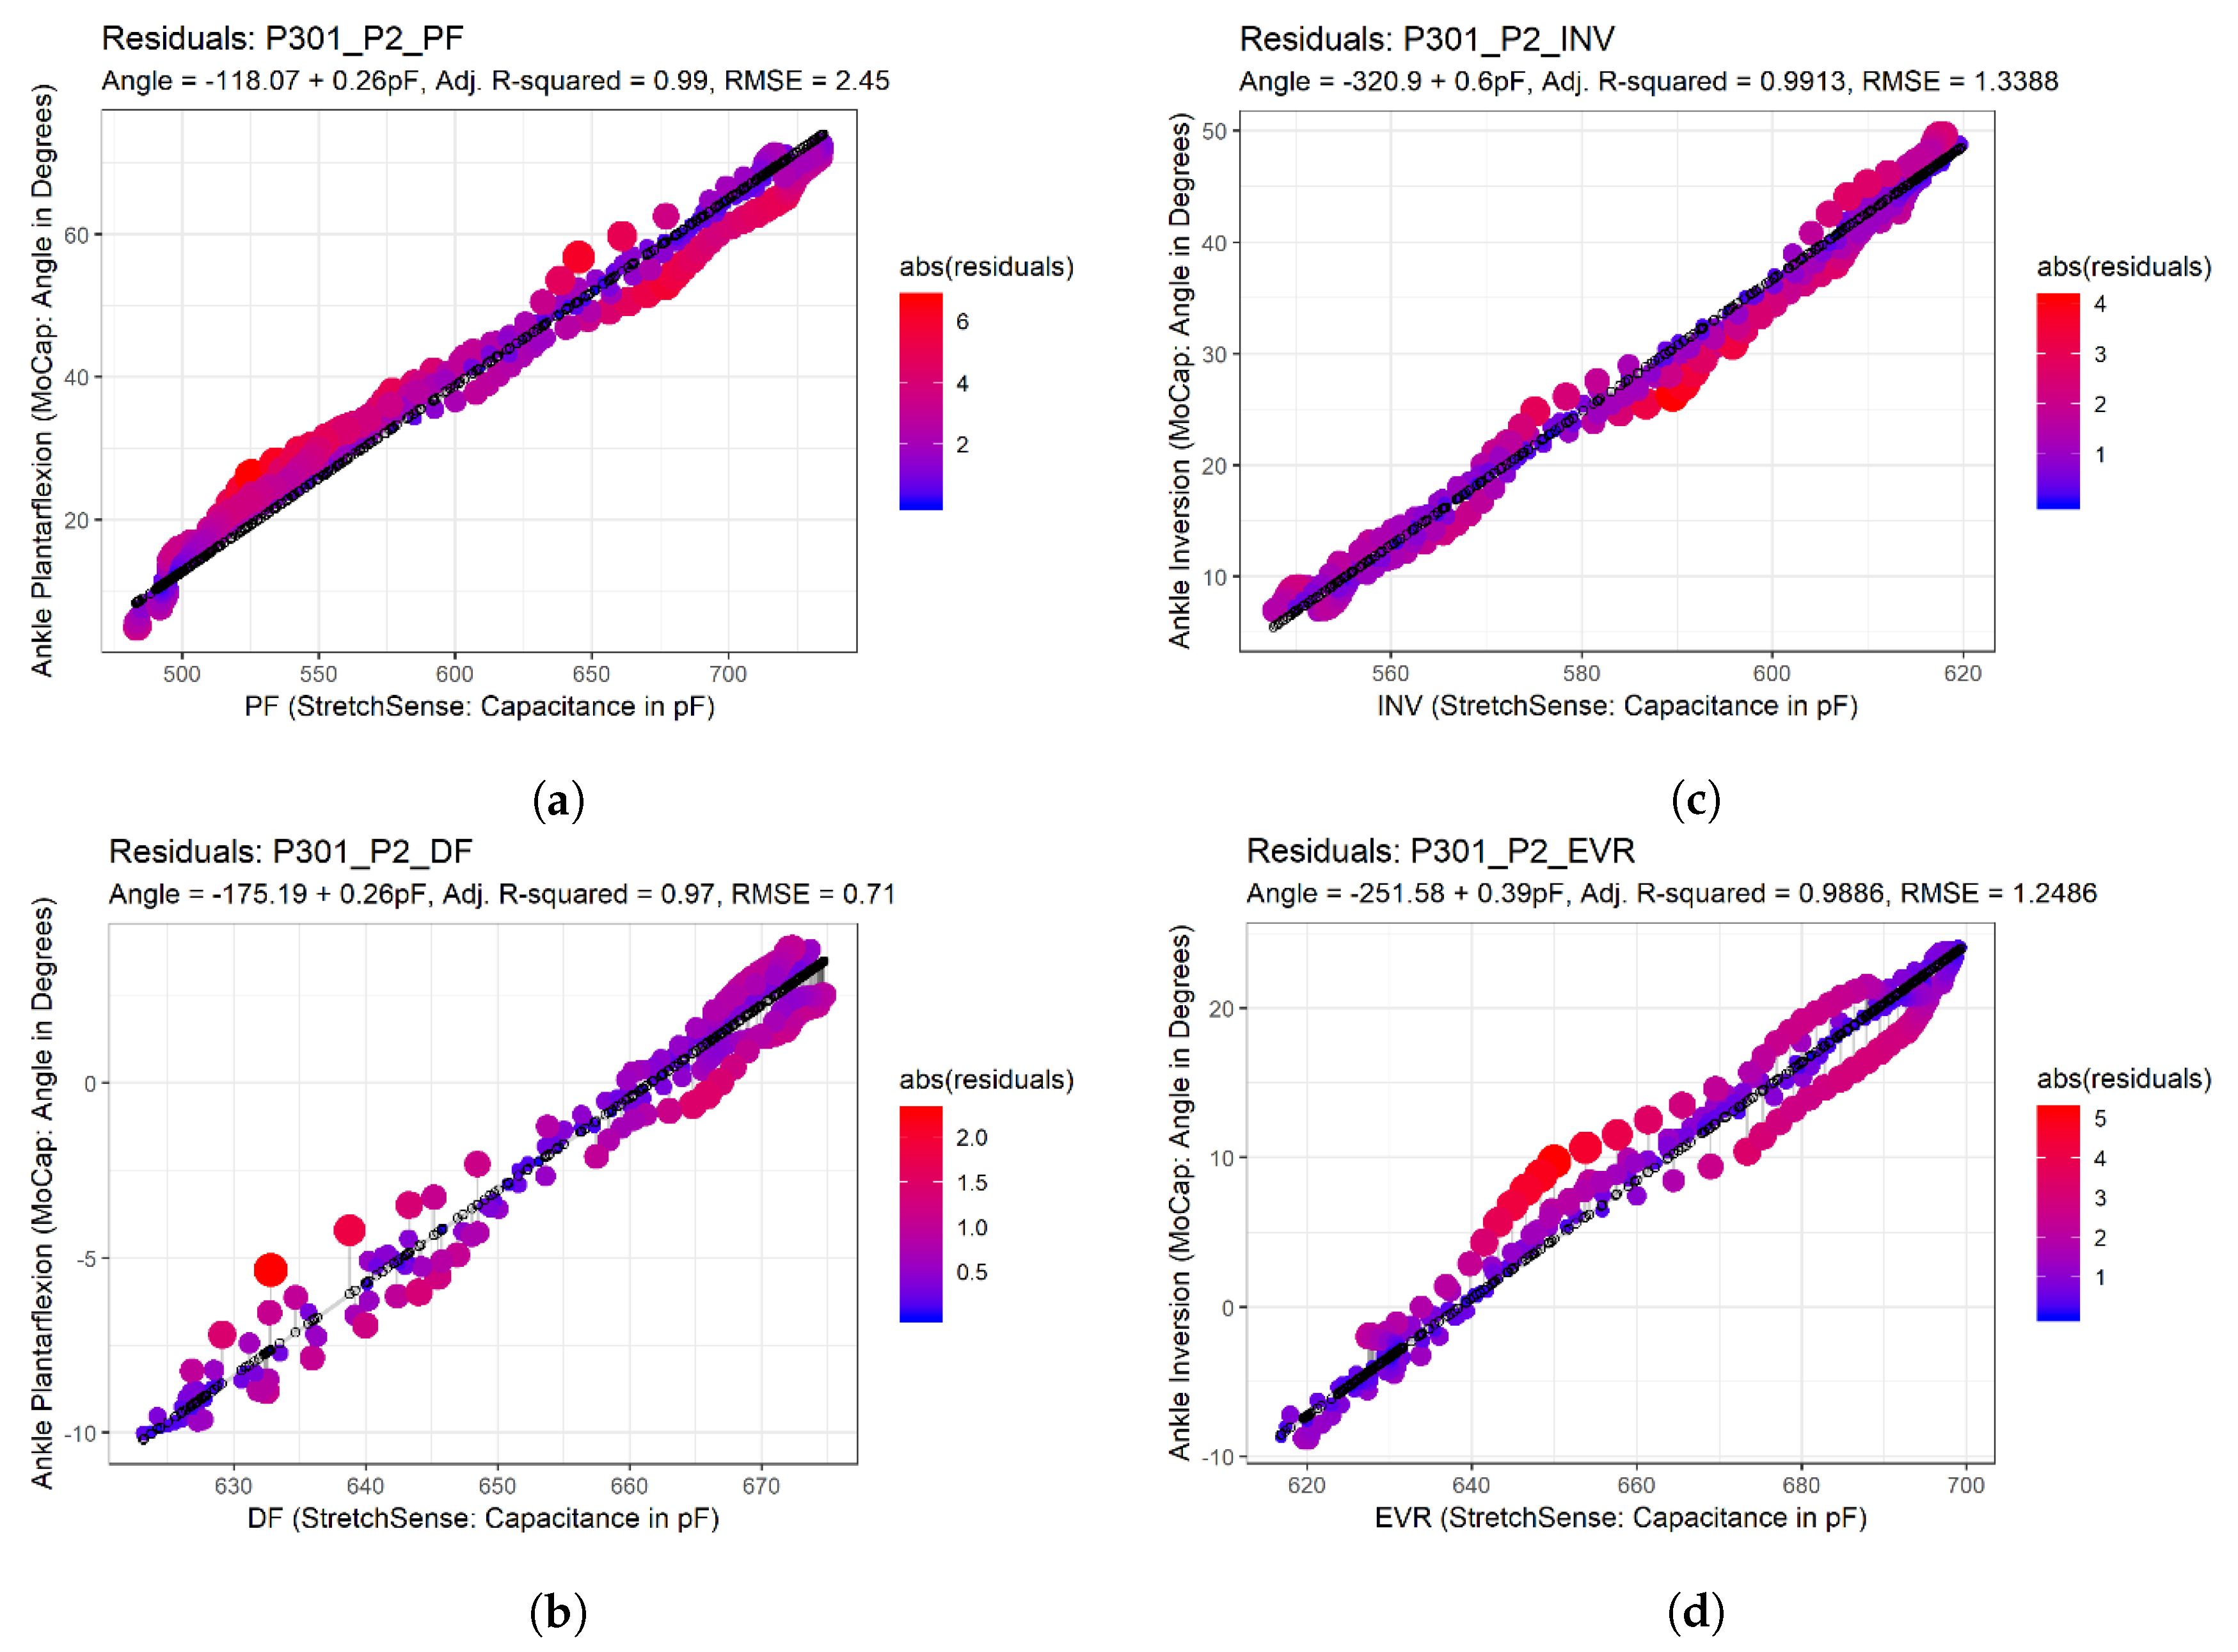
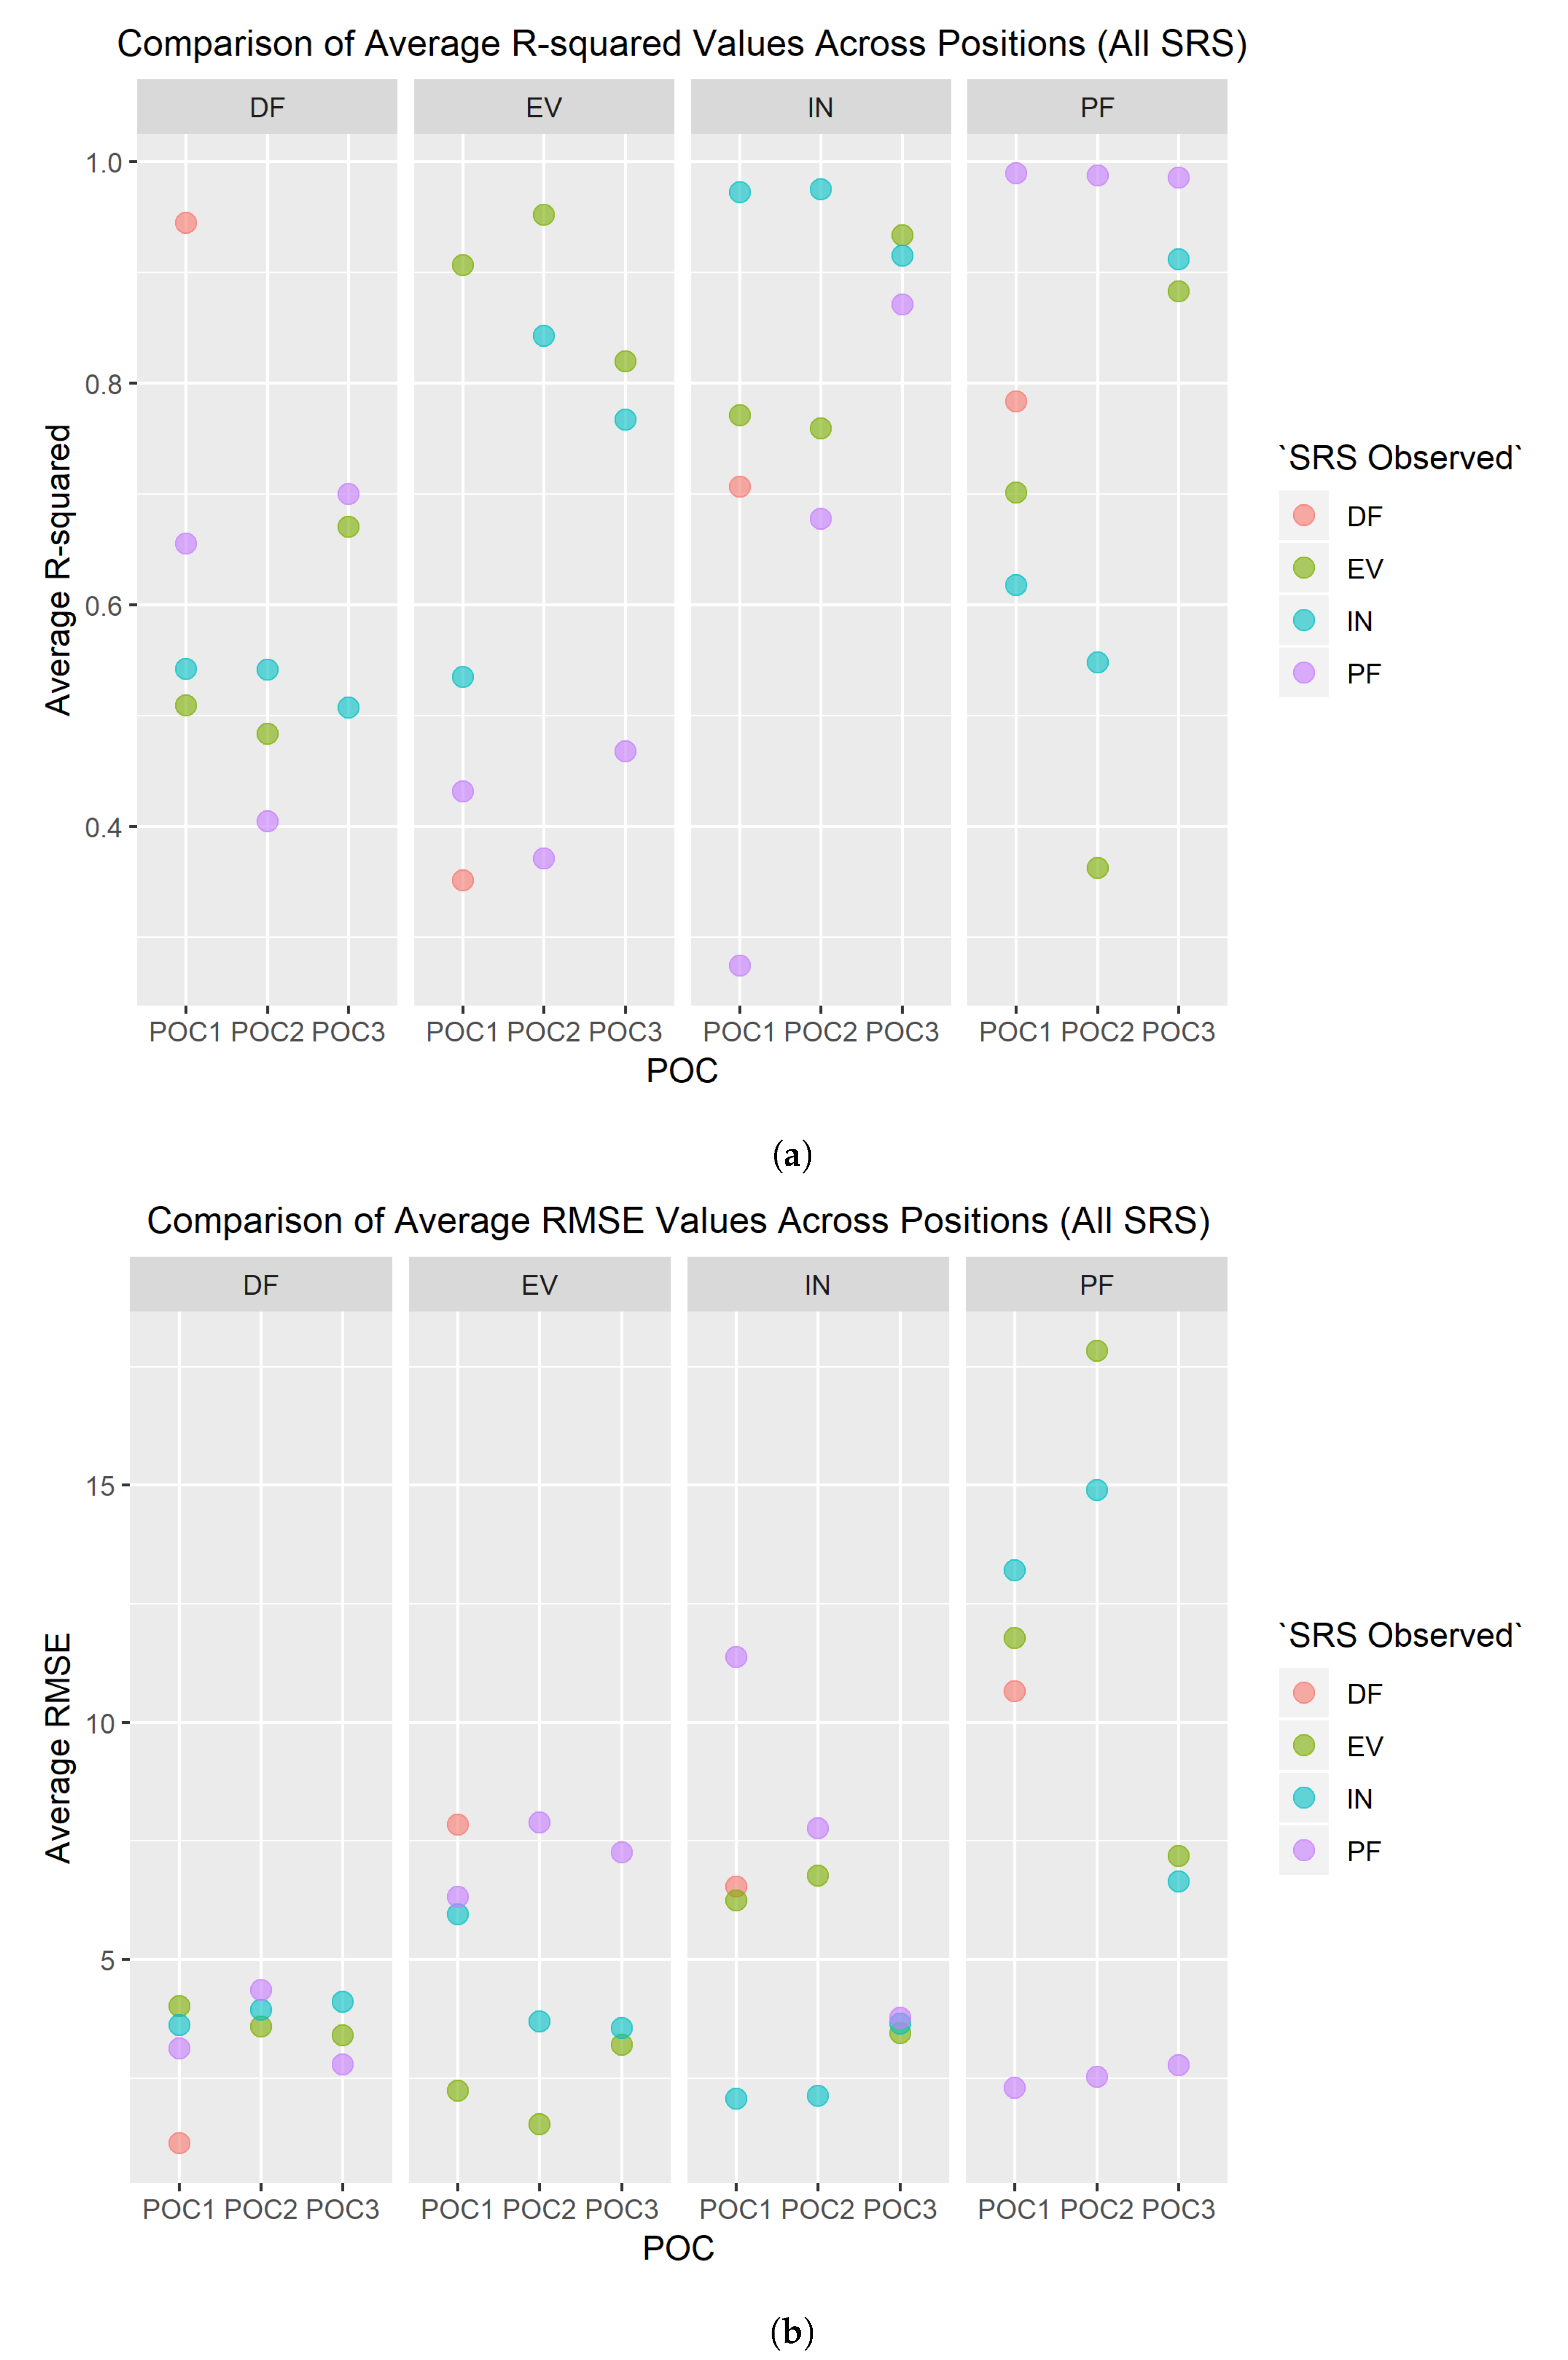
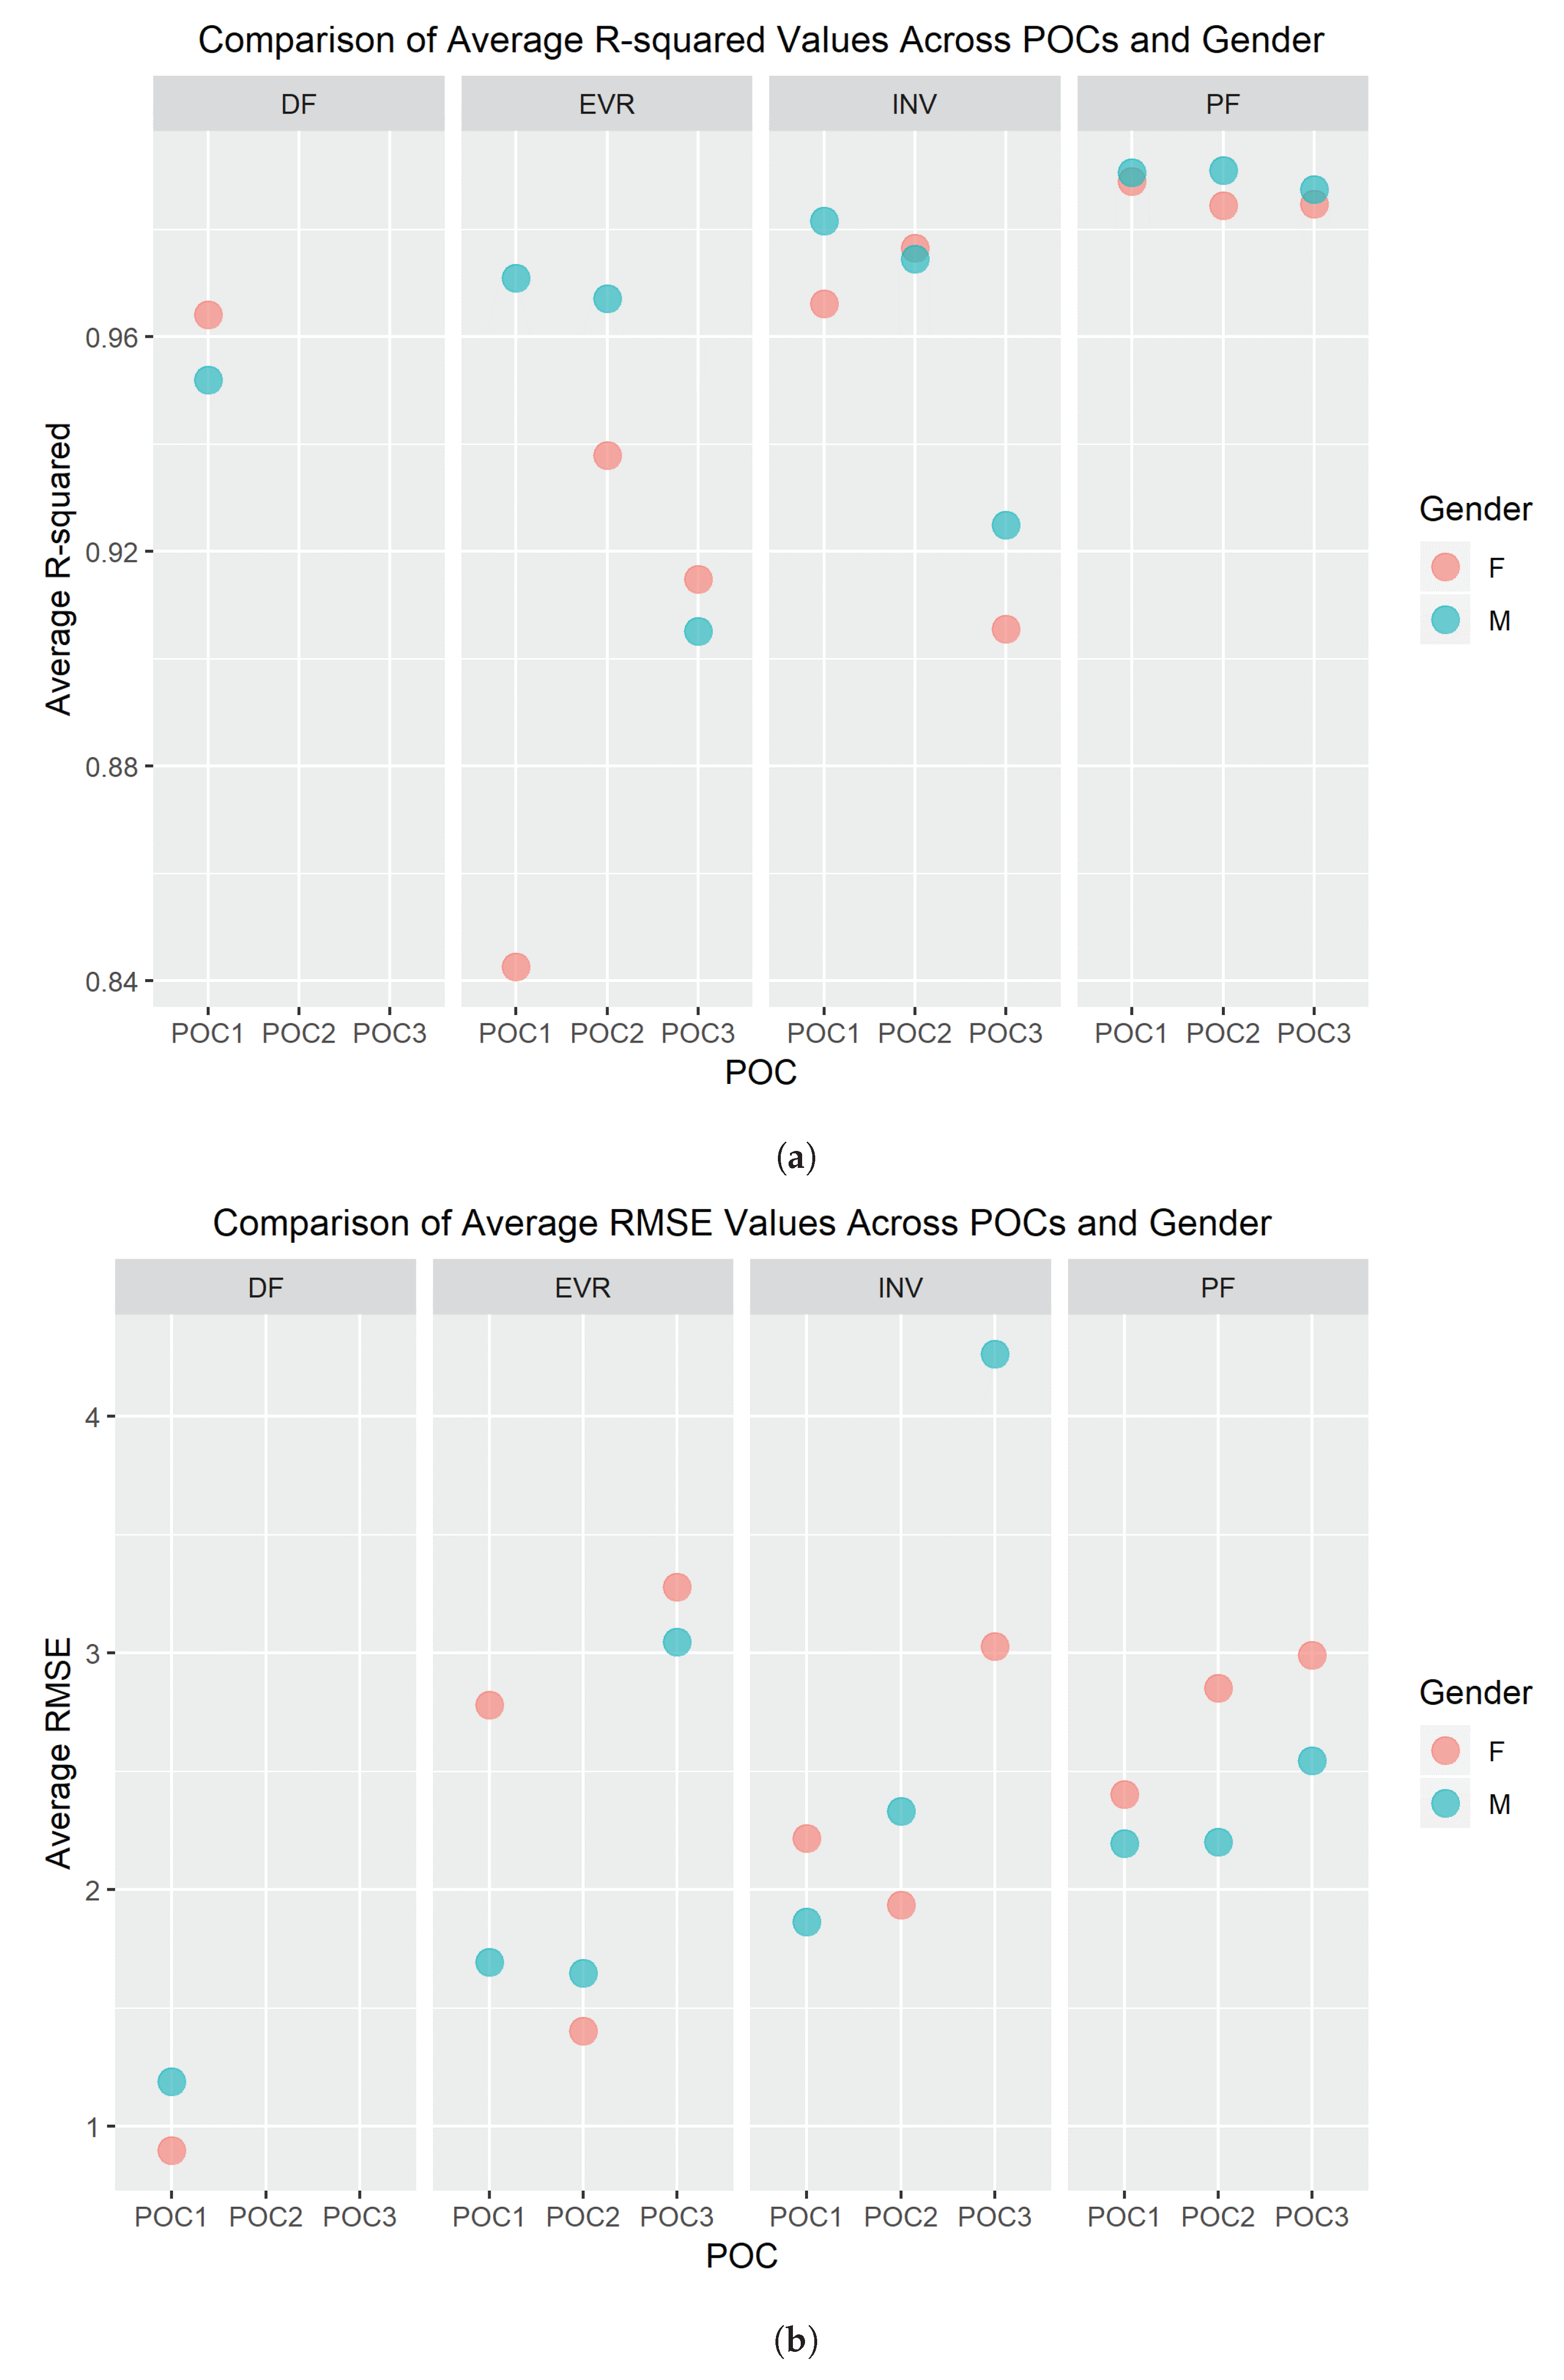
3. Results
4. Discussion
4.1. Dorsiflexion (DF)
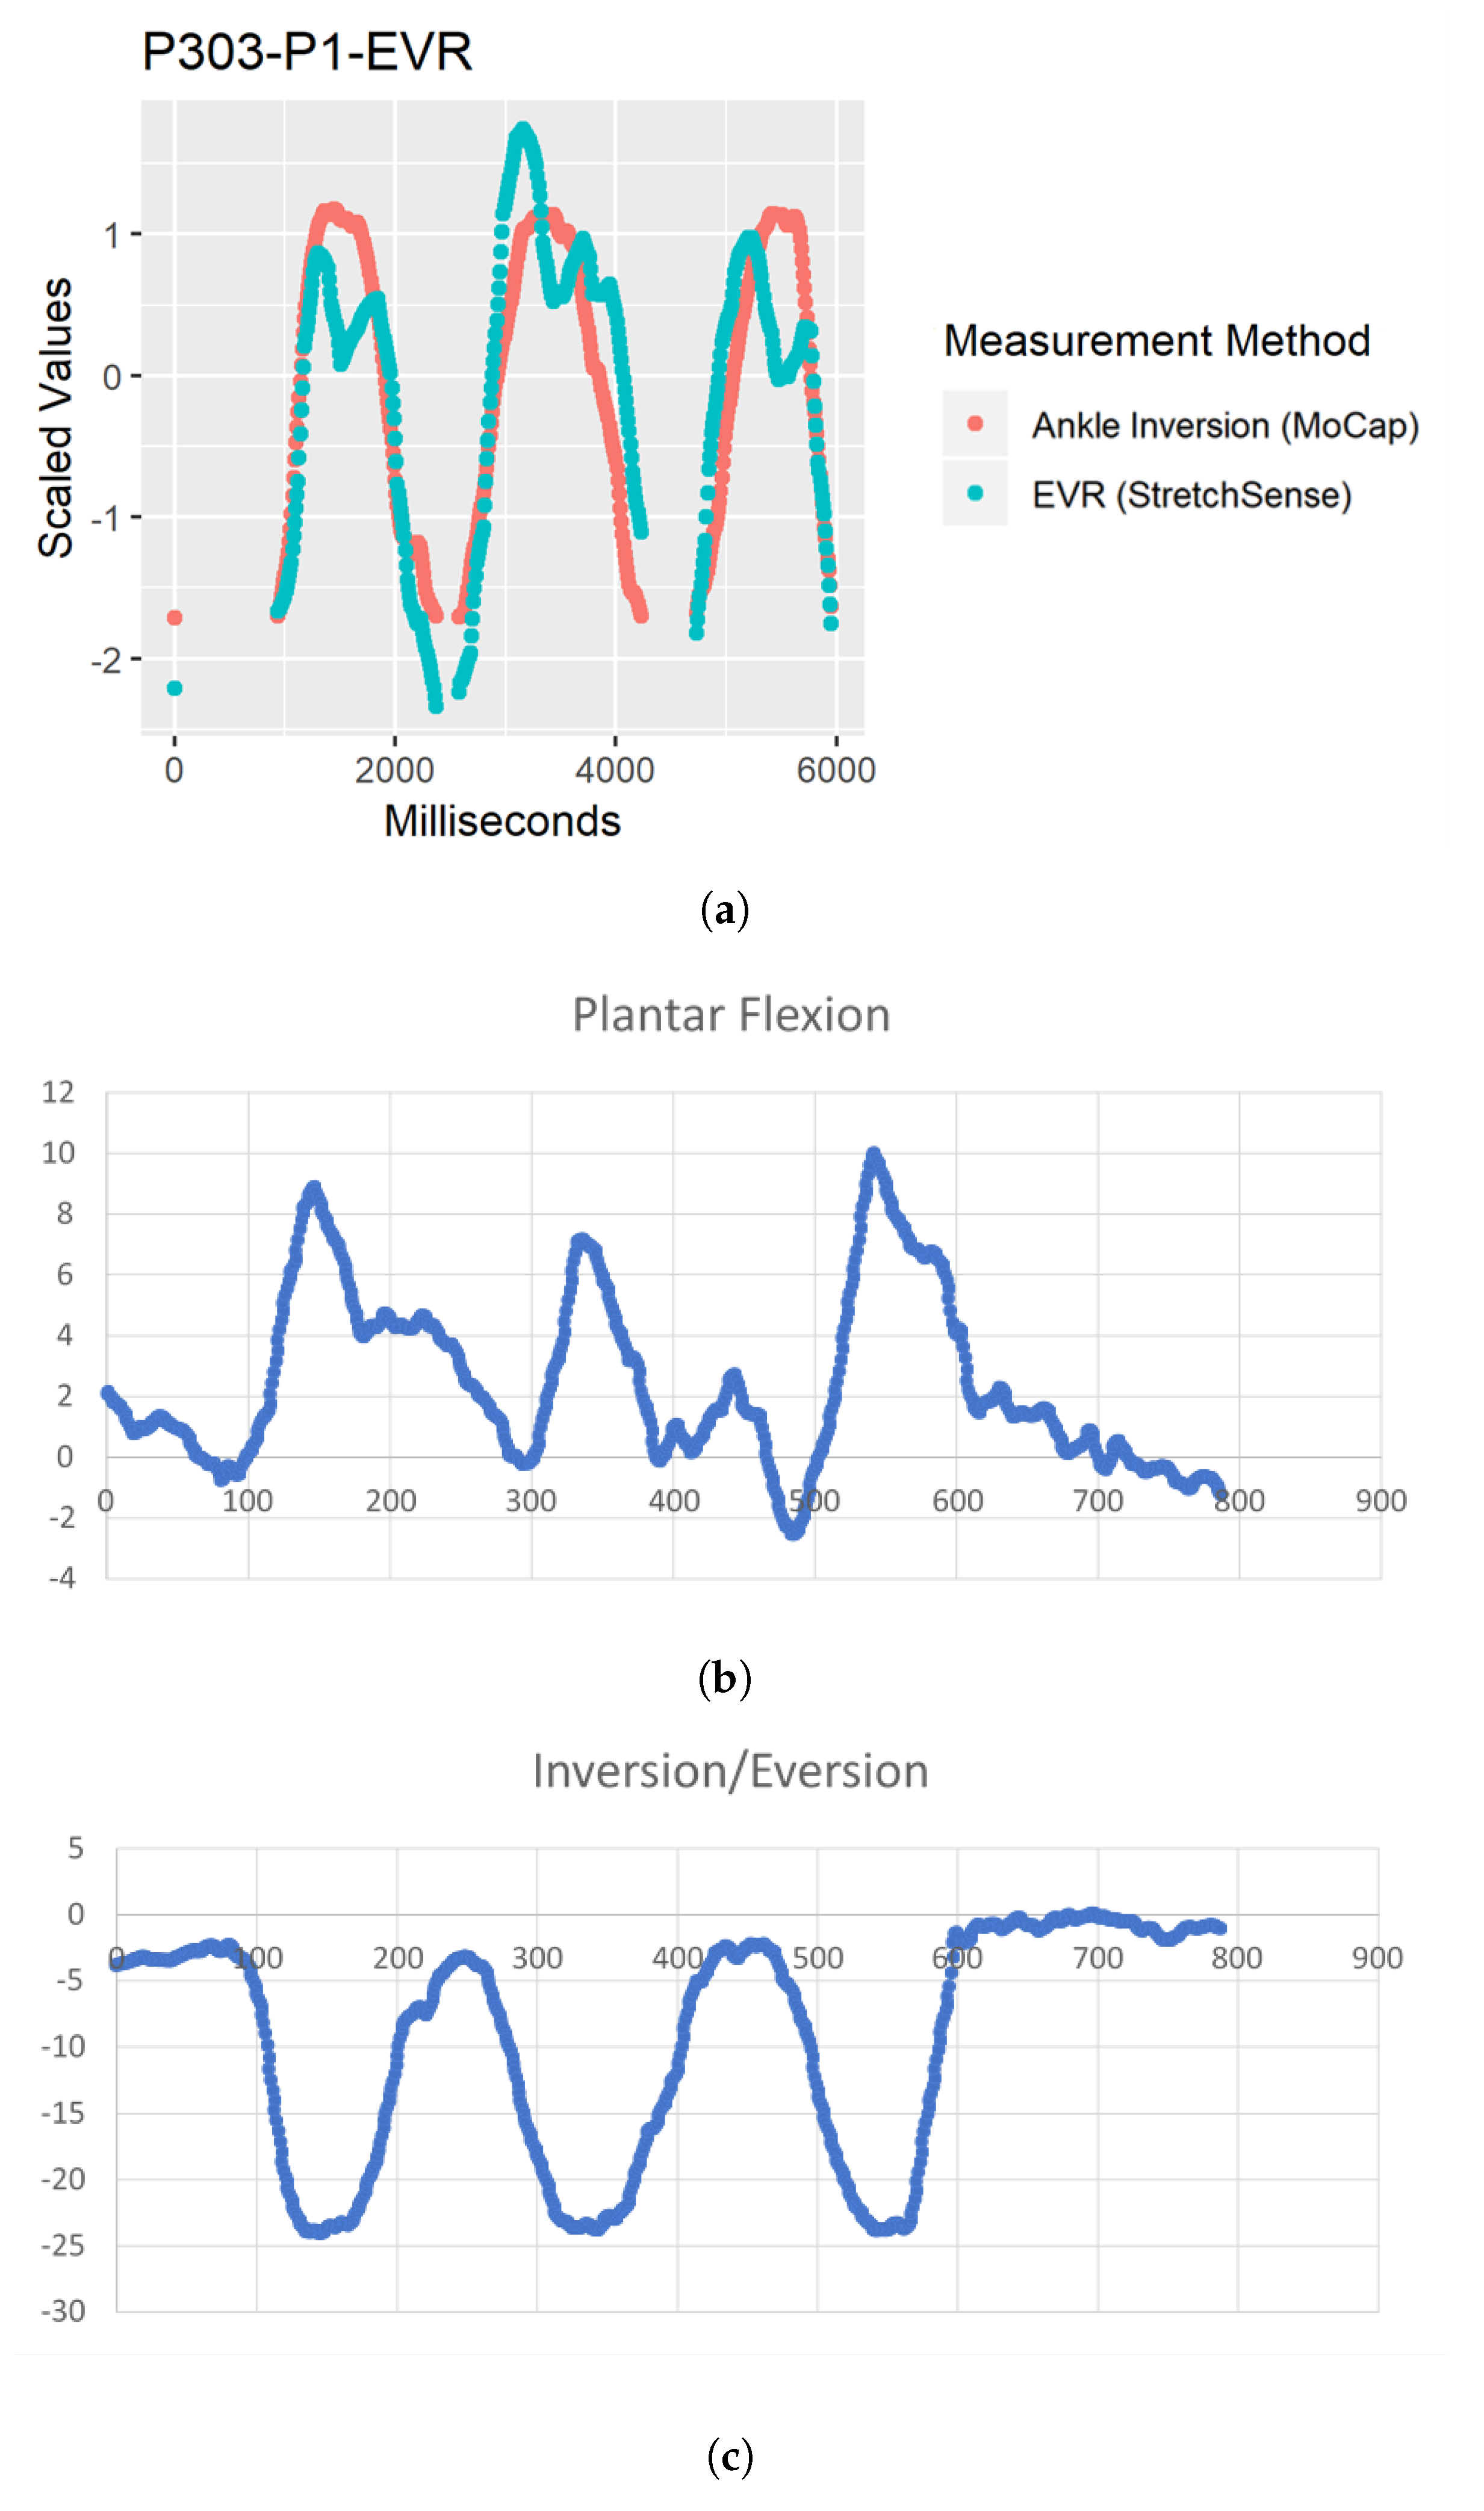
4.2. Eversion (EVR)
4.3. Plantar Flexion (PF)
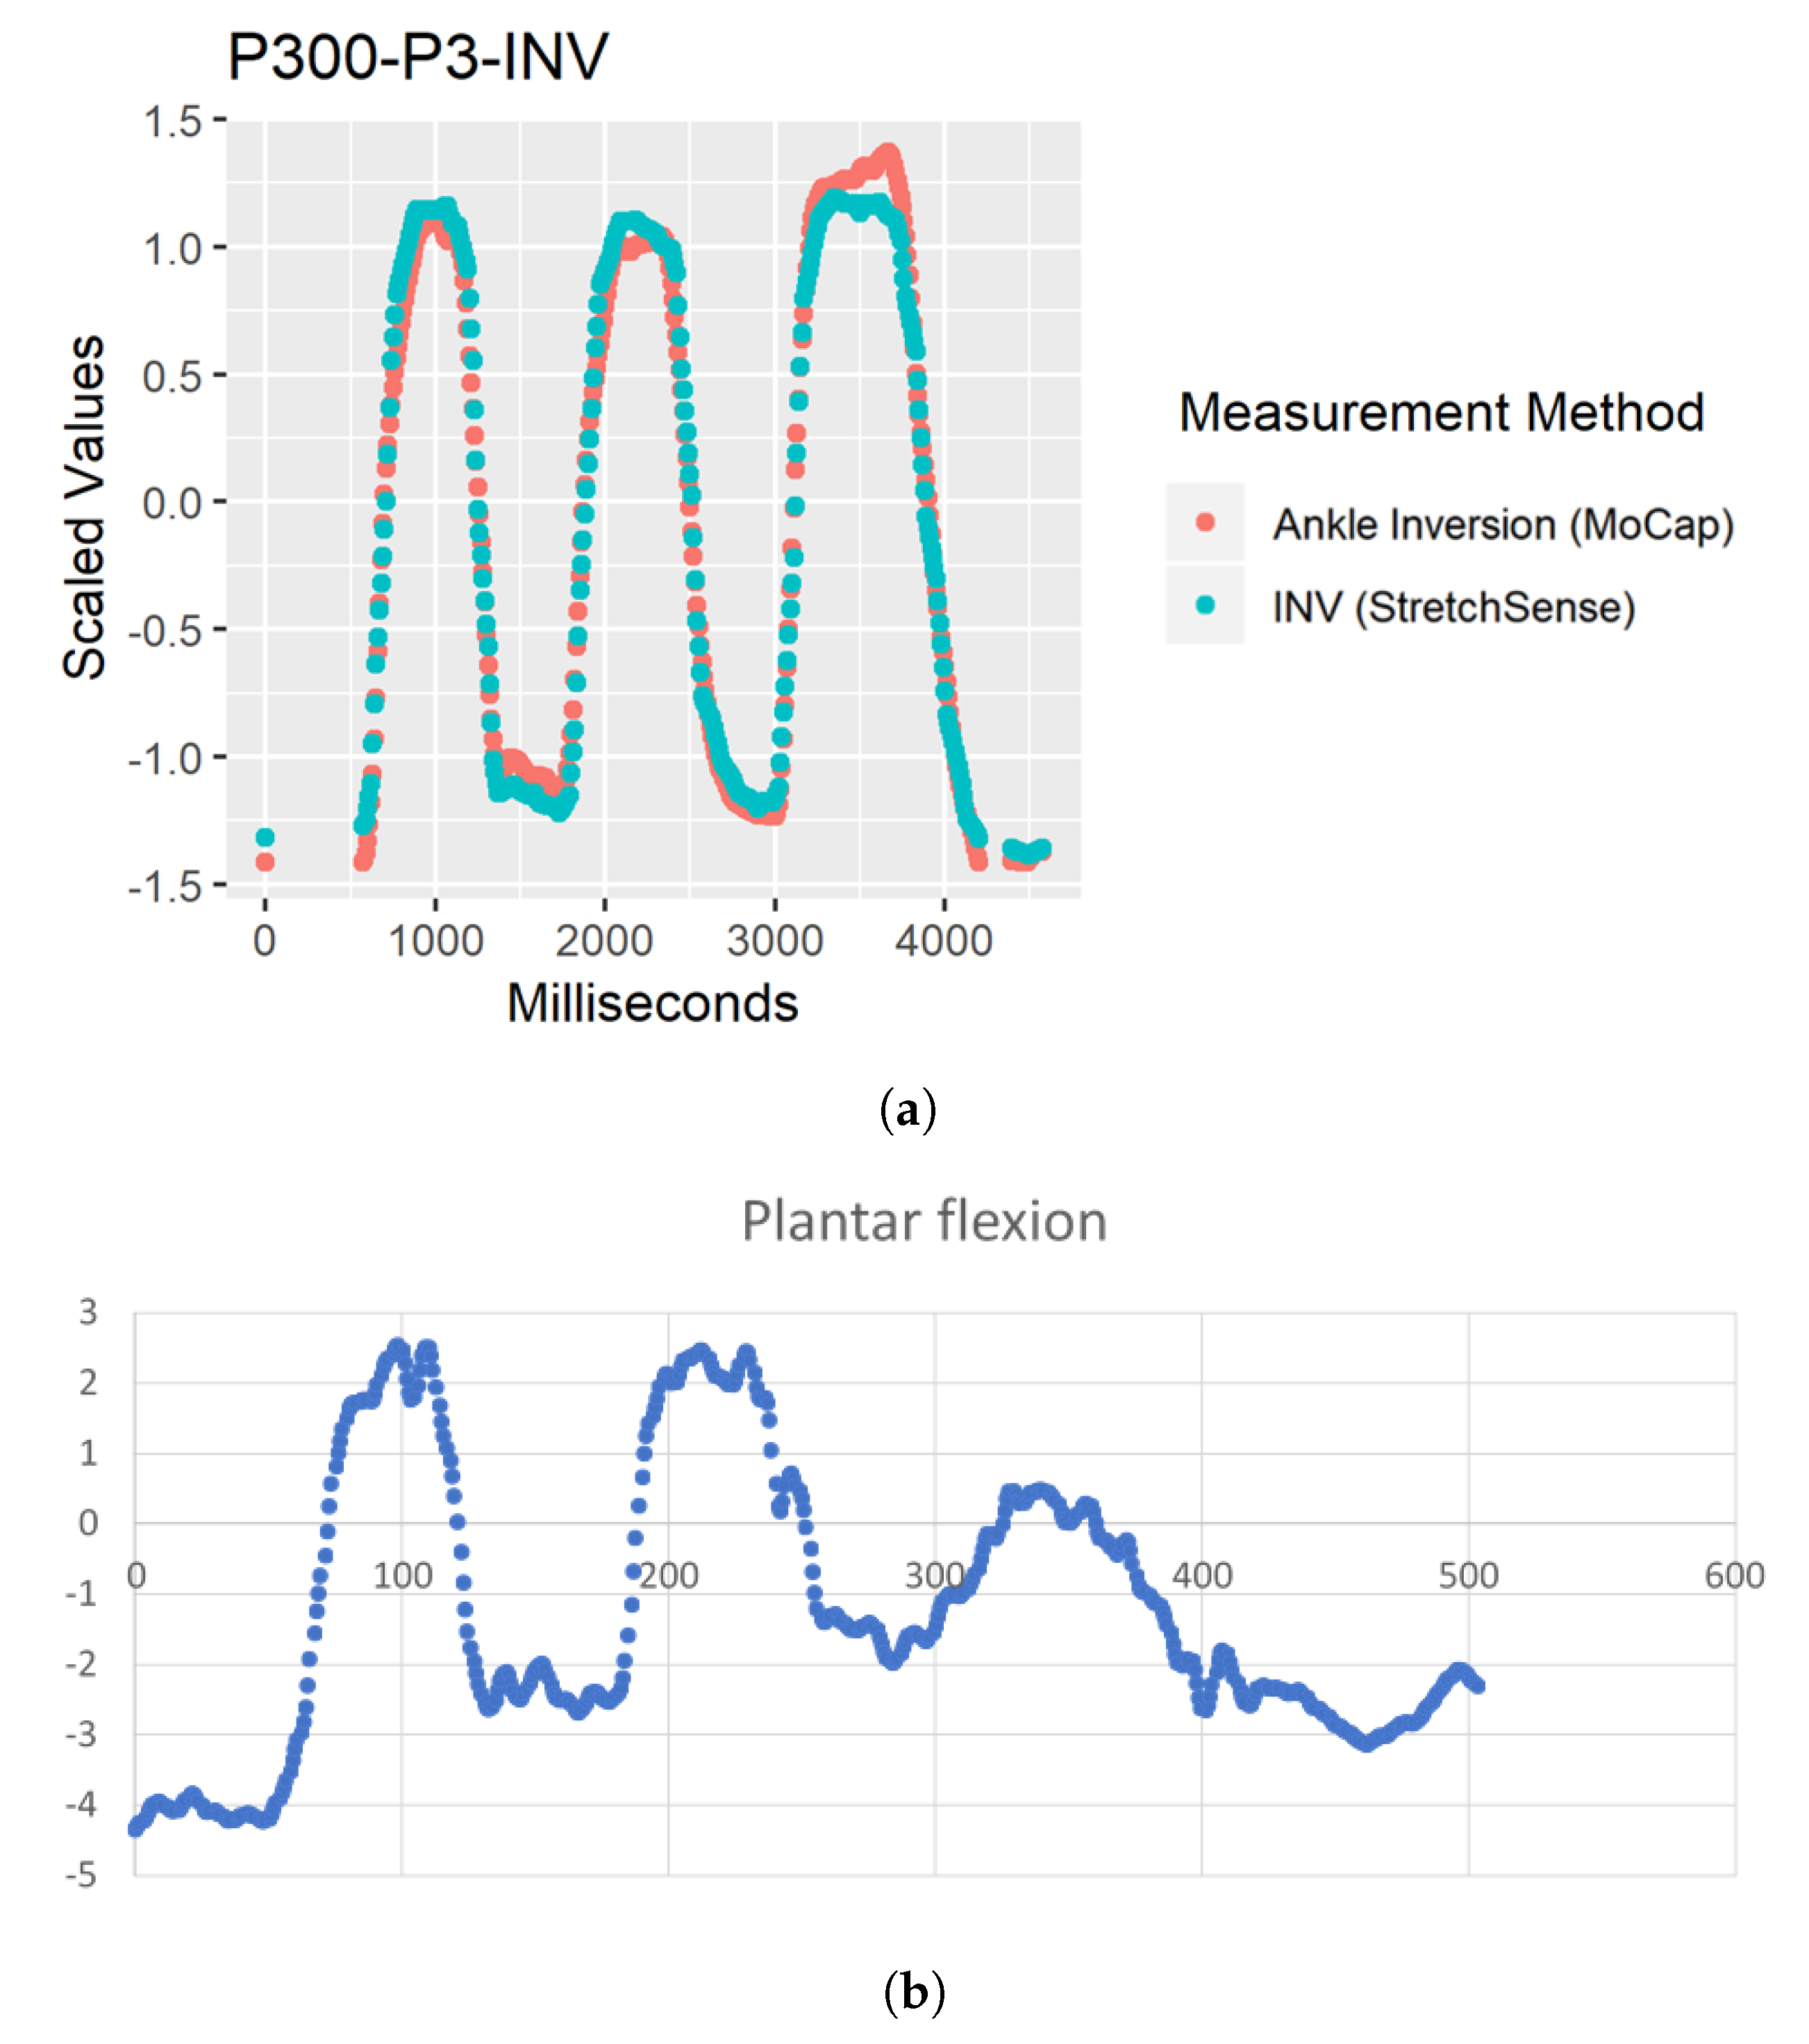
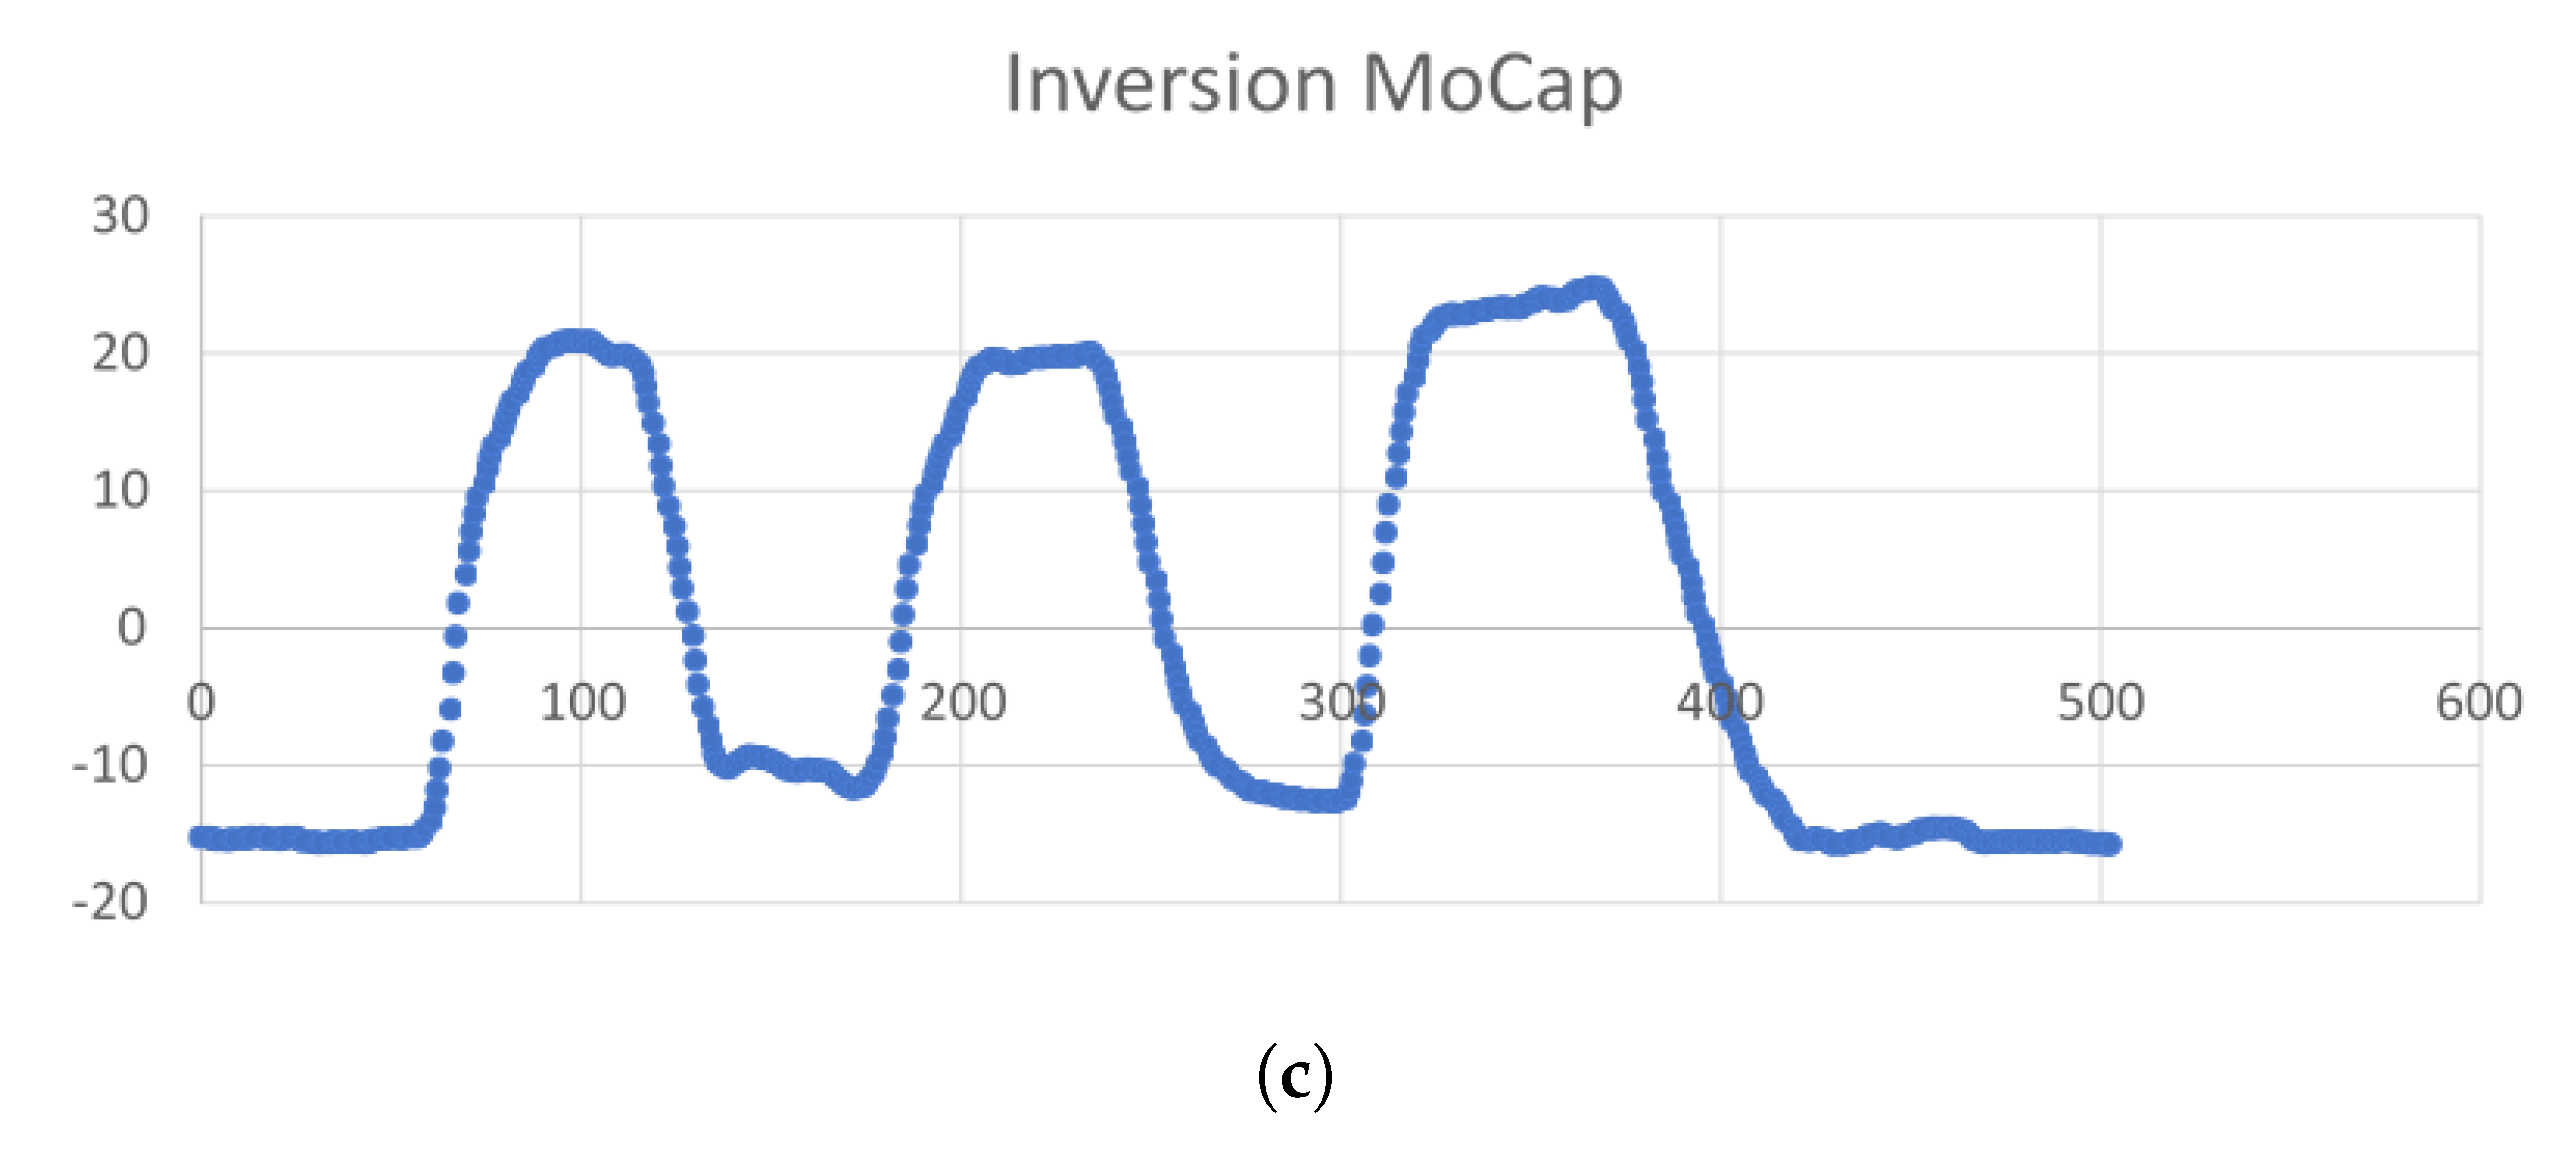
4.4. Inversion (INV)
4.5. Limitations
4.6. Future Work
5. Conclusions
Author Contributions
Funding
Acknowledgments
Conflicts of Interest
References
- Fong, D.; Chan, Y.Y. The use of wearable inertial motion sensors in human lower limb biomechanics studies: A systematic review. Sensors 2010, 10, 11556–11565. [Google Scholar] [CrossRef] [PubMed]
- Chan, M.; EstèVe, D.; Fourniols, J.Y.; Escriba, C.; Campo, E. Smart wearable systems: Current status and future challenges. Artif. Intell. Med. 2012, 56, 137–156. [Google Scholar] [CrossRef] [PubMed]
- Luczak, T.; Saucier, D.; Burch, V.; Ball, J.; Chander, H.; Knight, A.; Wei, P.; Iftekhar, T. Closing the Wearable Gap: Mobile Systems for Kinematic Signal Monitoring of the Foot and Ankle. Electronics 2018, 7, 117. [Google Scholar] [CrossRef]
- Mengüç, Y.; Park, Y.L.; Martinez-Villalpando, E.; Aubin, P.; Zisook, M.; Stirling, L.; Wood, R.J.; Walsh, C.J. Soft wearable motion sensing suit for lower limb biomechanics measurements. In Proceedings of the 2013 IEEE International Conference on Robotics and Automation, Karlsruhe, Germany, 6–10 May 2013; IEEE: Piscataway, NJ, USA, 2013; pp. 5309–5316. [Google Scholar] [CrossRef]
- Mengüç, Y.; Park, Y.L.; Pei, H.; Vogt, D.; Aubin, P.M.; Winchell, E.; Fluke, L.; Stirling, L.; Wood, R.J.; Walsh, C.J. Wearable soft sensing suit for human gait measurement. Int. J. Robot. Res. 2014, 33, 1748–1764. [Google Scholar] [CrossRef]
- Yamada, T.; Hayamizu, Y.; Yamamoto, Y.; Yomogida, Y.; Izadi-Najafabadi, A.; Futaba, D.N.; Hata, K. A stretchable carbon nanotube strain sensor for human-motion detection. Nat. Nanotechnol. 2011, 6, 296. [Google Scholar] [CrossRef] [PubMed]
- Floyd, R.; Thompson, C.W. Manual of Structural Kinesiology, 20th ed.; McGraw-Hill: New York, NY, USA, 2018. [Google Scholar]
- Hertel, J. Functional anatomy, pathomechanics, and pathophysiology of lateral ankle instability. J. Athl. Train. 2002, 37, 364. [Google Scholar] [PubMed]
- Mishra, E.; Jena, S.; Bhoi, C.; Arunachalam, T.; Panda, S.K. Effect of high heel gait on hip and knee-ankle-foot rollover characteristics while walking over inclined surfaces—A pilot study. Foot 2019, 40, 8–13. [Google Scholar] [CrossRef] [PubMed]
- Rhudy, M. Time alignment techniques for experimental sensor data. Int. J. Comput. Sci. Eng. Surv. 2014, 5, 1–14. [Google Scholar] [CrossRef]
- Grace-Martin, K. Assessing the Fit of Regression Models. Available online: https://www.theanalysisfactor.com/assessing-the-fit-of-regression-models/ (accessed on 29 May 2019).
- Hertel, J.; Denegar, C.R.; Monroe, M.M.; Stokes, W.L. Talocrural and subtalar joint instability after lateral ankle sprain. Med. Sci. Sport. Exerc. 1999, 31, 1501–1508. [Google Scholar] [CrossRef]
- Teixeira, P.A.G.; Formery, A.S.; Gwenaël, B.; Lux, G.; Isabelle, L.; Hossu, G.; Blum, A. Comparison between Subtalar Joint Quantitative Kinematic 4-D CT Parameters in Healthy Volunteers and Patients with joint Stiffness or Chronic ankle instability: A preliminary study. Eur. J. Radiol. 2019, 114, 76–84. [Google Scholar] [CrossRef] [PubMed]
- Weindel, S.; Schmidt, R.; Rammelt, S.; Claes, L.; Campe, A.V.; Rein, S. Subtalar instability: A biomechanical cadaver study. Arch. Orthop. Trauma Surg. 2010, 130, 313–319. [Google Scholar] [CrossRef] [PubMed]
- Kwon, J.; Park, J.H.; Ku, S.; Jeong, Y.; Paik, N.J.; Park, Y.L. A Soft Wearable Robotic Ankle-Foot-Orthosis for Post-Stroke Patients. IEEE Robot. Autom. Lett. 2019, 4, 2547–2552. [Google Scholar] [CrossRef]
- Park, Y.L.; Chen, B.R.; Pérez-Arancibia, N.O.; Young, D.; Stirling, L.; Wood, R.J.; Goldfield, E.C.; Nagpal, R. Design and control of a bio-inspired soft wearable robotic device for ankle–foot rehabilitation. Bioinspir. Biomim. 2014, 9, 016007. [Google Scholar] [CrossRef] [PubMed]
- De Rossi, S.M.M.; Vitiello, N.; Lenzi, T.; Ronsse, R.; Koopman, B.; Persichetti, A.; Giovacchini, F.; Vecchi, F.; Ijspeert, A.J.; van der Kooij, H.; et al. Soft artificial tactile sensors for the measurement of human-robot interaction in the rehabilitation of the lower limb. In Proceedings of the 2010 Annual International Conference of the IEEE Engineering in Medicine and Biology, Buenos Aires, Argentina, 31 August–4 September 2010; IEEE: Piscataway, NJ, USA, 2010; pp. 1279–1282. [Google Scholar] [CrossRef]
- Zhang, J.; Cao, Y.; Qiao, M.; Ai, L.; Sun, K.; Mi, Q.; Zang, S.; Zuo, Y.; Yuan, X.; Wang, Q. Human motion monitoring in sports using wearable graphene-coated fiber sensors. Sens. Actuators A Phys. 2018, 274, 132–140. [Google Scholar] [CrossRef]
- Glaros, C.; Fotiadis, D.I.; Likas, A.; Stafylopatis, A. A wearable intelligent system for monitoring health condition and rehabilitation of running athletes. In Proceedings of the 4th International IEEE EMBS Special Topic Conference on Information Technology Applications in Biomedicine, Birmingham, UK, 24–26 April 2003; pp. 276–279. [Google Scholar] [CrossRef]
- Seneviratne, S.; Hu, Y.; Nguyen, T.; Lan, G.; Khalifa, S.; Thilakarathna, K.; Hassan, M.; Seneviratne, A. A Survey of Wearable Devices and Challenges. IEEE Commun. Surv. Tutor. 2017, 19, 2573–2620. [Google Scholar] [CrossRef]
- Akçetin, P.I.; Ergen, S.Ç.; Sezgin, T.M. HMM based inertial sensor system for coaching of rowing activity. In Proceedings of the 2012 20th Signal Processing and Communications Applications Conference (SIU), Mugla, Turkey, 18–20 April 2012; IEEE: Piscataway, NJ, USA, 2012; pp. 1–4. [Google Scholar] [CrossRef]
- Tao, W.; Liu, T.; Zheng, R.; Feng, H. Gait analysis using wearable sensors. Sensors 2012, 12, 2255–2283. [Google Scholar] [CrossRef] [PubMed]
- Karatsidis, A.; Bellusci, G.; Schepers, H.; de Zee, M.; Andersen, M.; Veltink, P. Estimation of Ground Reaction Forces and Moments During Gait Using Only Inertial Motion Capture. Sensors 2016, 17, 75. [Google Scholar] [CrossRef] [PubMed]


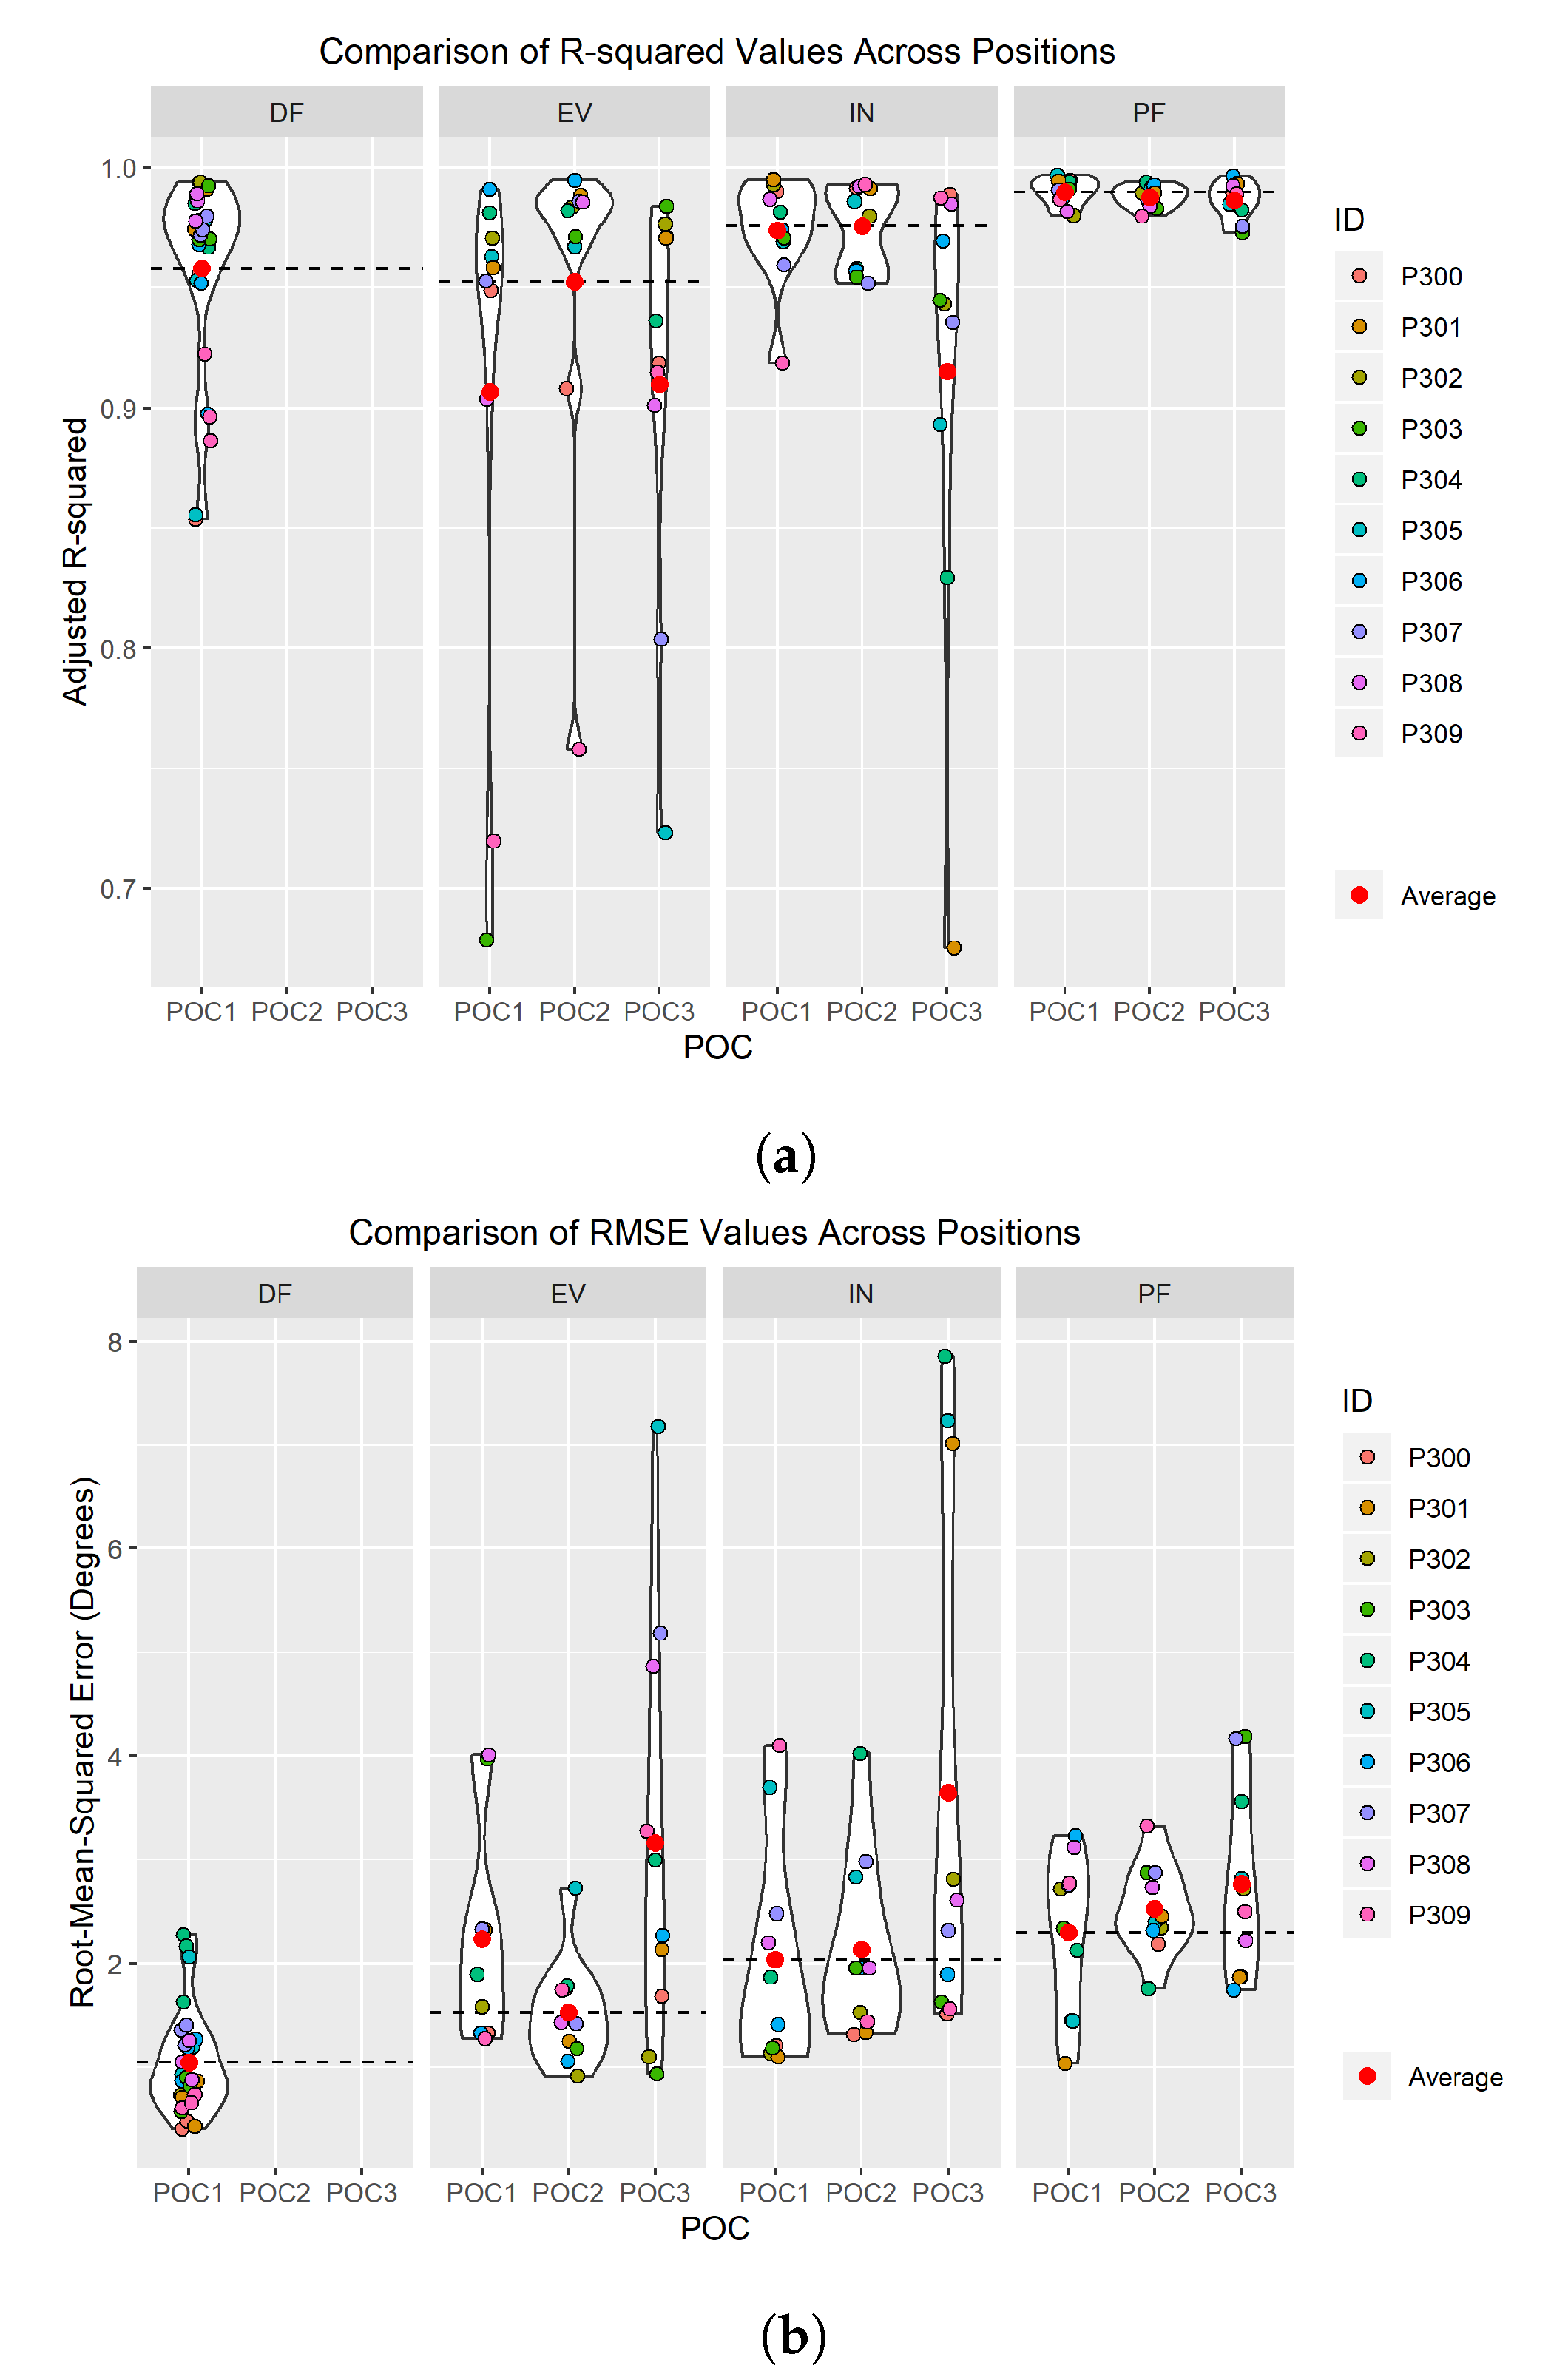
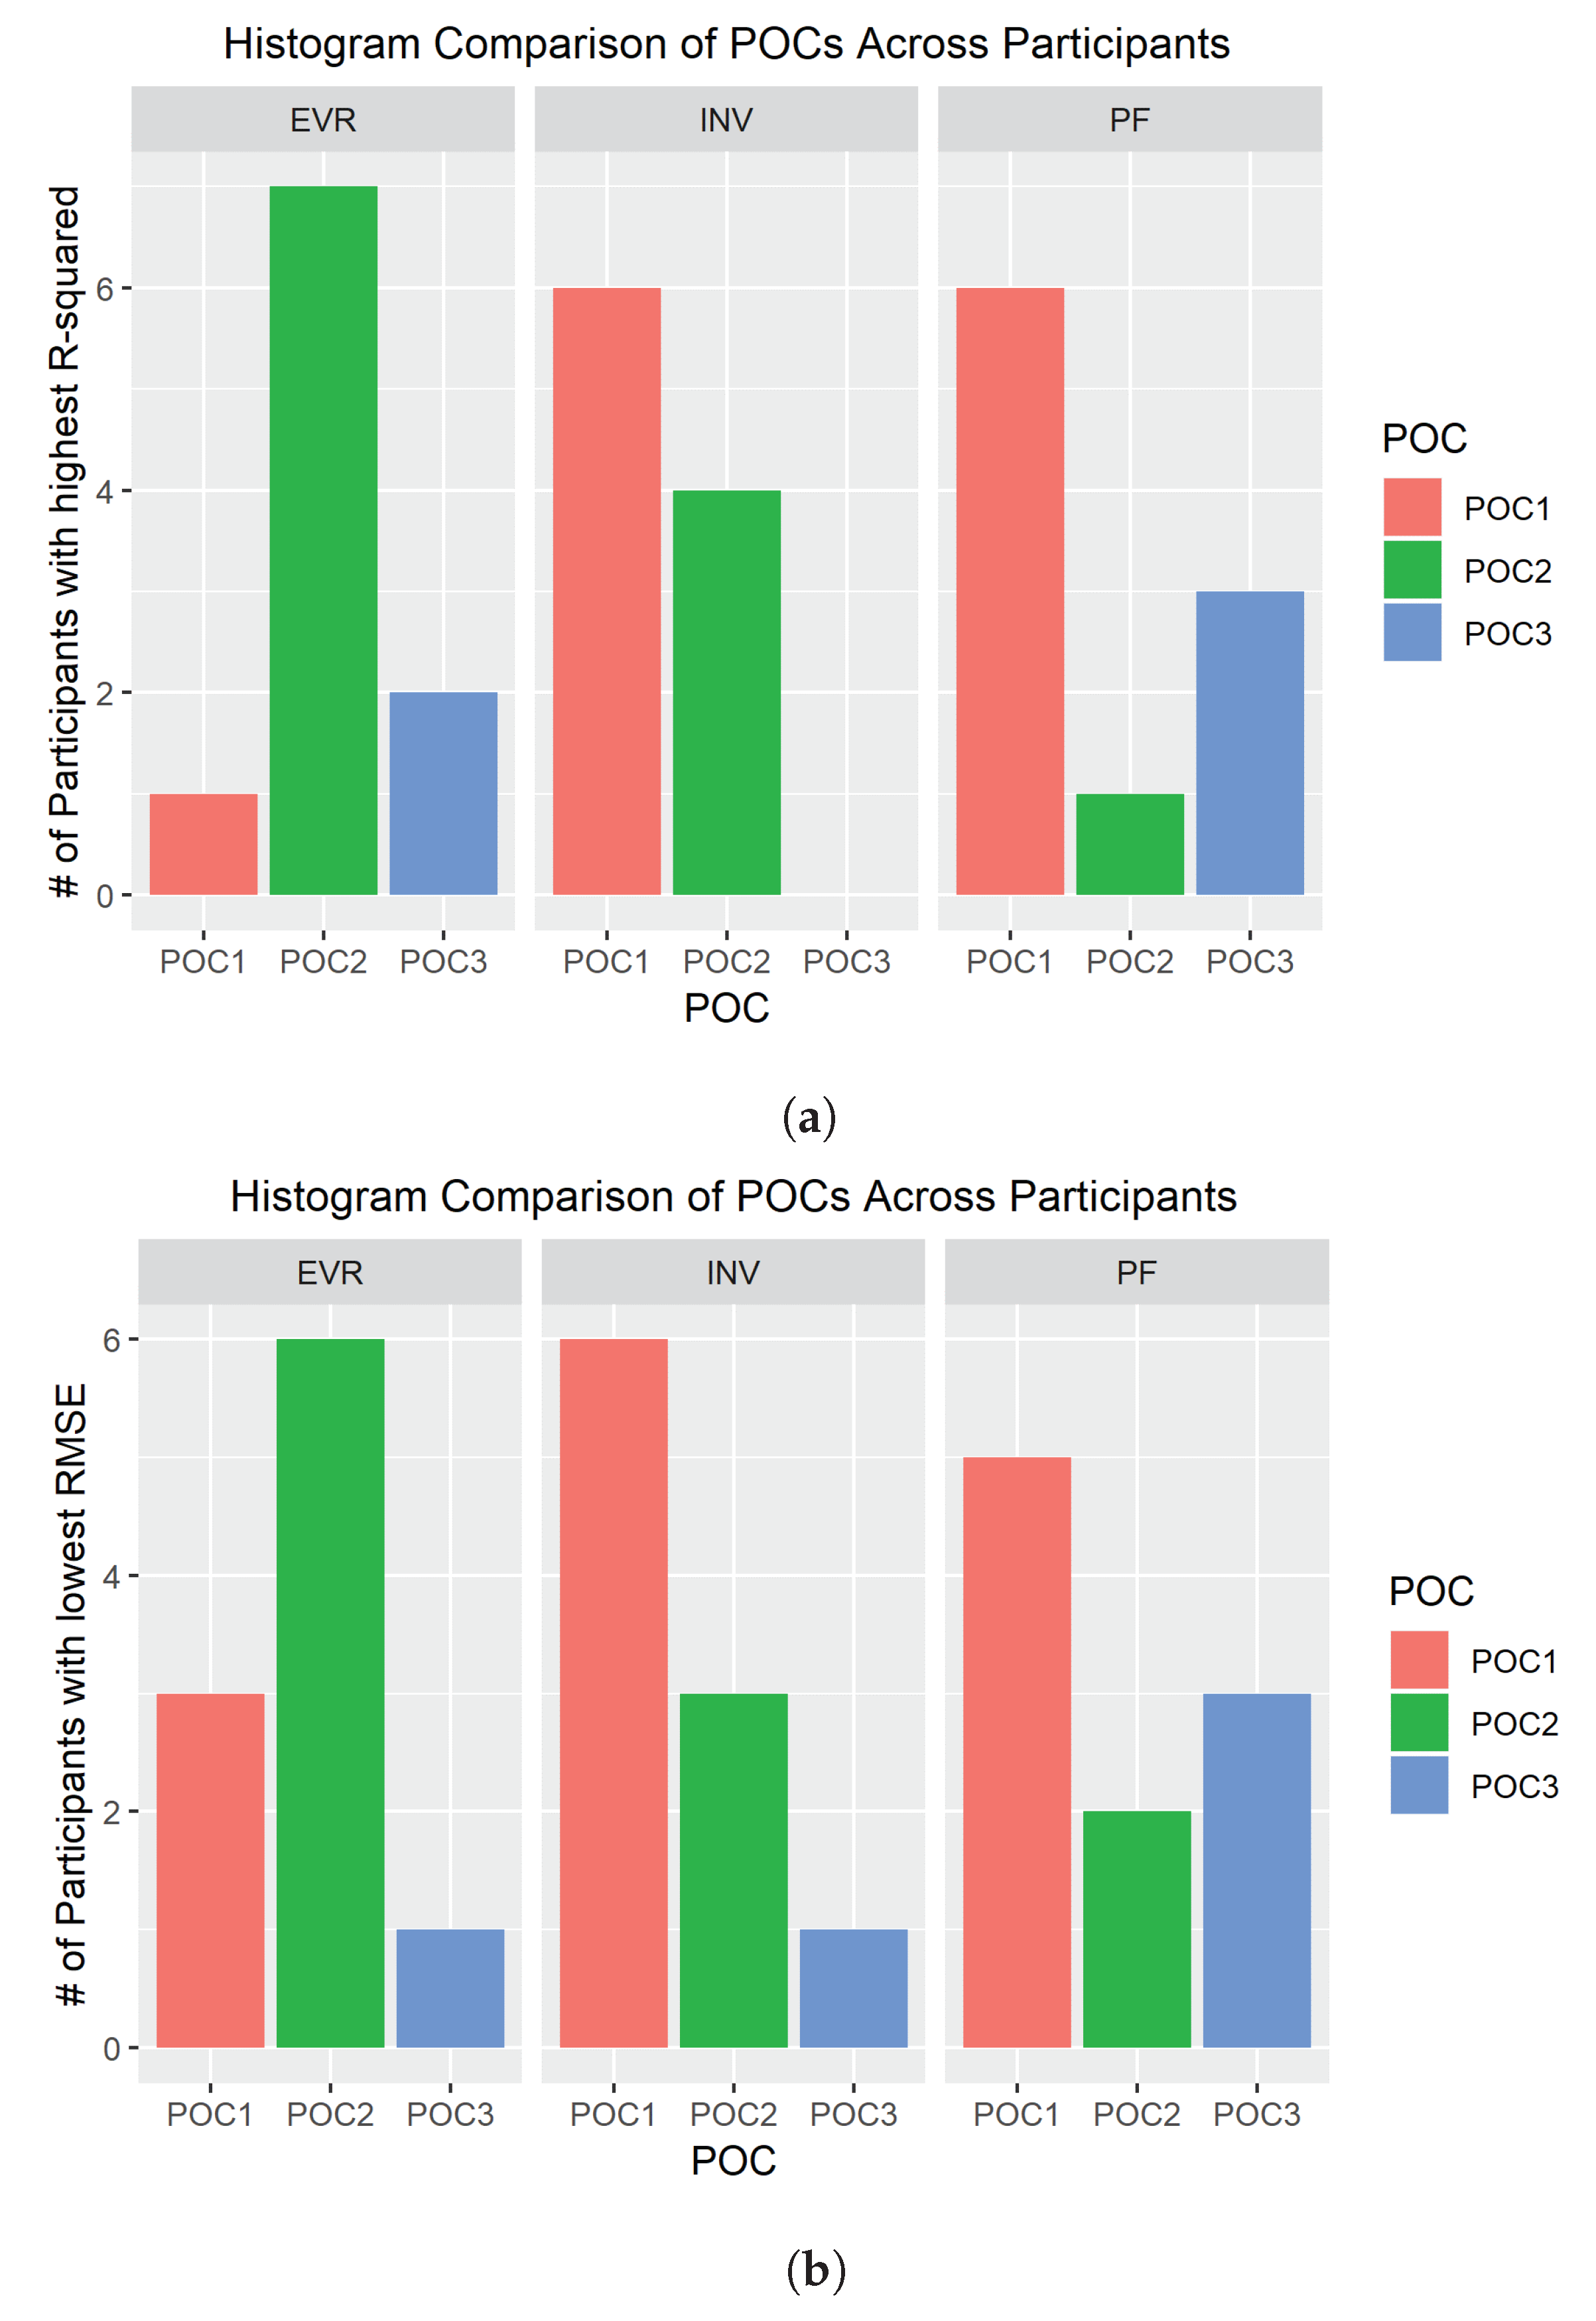
| Movement | Position and Orientation Configuration (POC) | R2 Average (Figure 9a) | RMSE Average (deg.) (Figure 9b) | R2 Std. Dev. | RMSE Std. Dev. (deg.) | Higest R2 Number of Participants (Figure 10a) | Lowest RMSE Number of Participants (Figure 10b) |
|---|---|---|---|---|---|---|---|
| EVR | POC 1 | 0.9068 | 2.2378 | 0.1123 | 1.0159 | 1 | 3 |
| EVR | POC 2 * | 0.9525 | 1.5269 | 0.0727 | 0.5186 | 7 | 6 |
| EVR | POC 3 | 0.9100 | 3.1628 | 0.0845 | 2.0127 | 2 | 1 |
| INV | POC 1 | 0.9739 | 2.0407 | 0.0225 | 1.0939 | 6 | 6 |
| INV | POC 2 * | 0.9755 | 2.1340 | 0.0178 | 0.8838 | 4 | 3 |
| INV | POC 3 | 0.9153 | 3.6455 | 0.0977 | 2.6128 | 0 | 1 |
| PF | POC 1 * | 0.9898 | 2.2996 | 0.0056 | 0.7616 | 6 | 5 |
| PF | POC 2 | 0.9877 | 2.5274 | 0.0046 | 0.4376 | 1 | 2 |
| PF | POC 3 | 0.9861 | 2.7679 | 0.0076 | 0.9216 | 3 | 3 |
| DF | POC 1 * | 0.9567 | 1.0568 | 0.0410 | 0.4952 | N/A | N/A |
© 2019 by the authors. Licensee MDPI, Basel, Switzerland. This article is an open access article distributed under the terms and conditions of the Creative Commons Attribution (CC BY) license (http://creativecommons.org/licenses/by/4.0/).
Share and Cite
Saucier, D.; Luczak, T.; Nguyen, P.; Davarzani, S.; Peranich, P.; Ball, J.E.; Burch, R.F., V; Smith, B.K.; Chander, H.; Knight, A.; et al. Closing the Wearable Gap—Part II: Sensor Orientation and Placement for Foot and Ankle Joint Kinematic Measurements. Sensors 2019, 19, 3509. https://0-doi-org.brum.beds.ac.uk/10.3390/s19163509
Saucier D, Luczak T, Nguyen P, Davarzani S, Peranich P, Ball JE, Burch RF V, Smith BK, Chander H, Knight A, et al. Closing the Wearable Gap—Part II: Sensor Orientation and Placement for Foot and Ankle Joint Kinematic Measurements. Sensors. 2019; 19(16):3509. https://0-doi-org.brum.beds.ac.uk/10.3390/s19163509
Chicago/Turabian StyleSaucier, David, Tony Luczak, Phuoc Nguyen, Samaneh Davarzani, Preston Peranich, John E. Ball, Reuben F. Burch, V, Brian K. Smith, Harish Chander, Adam Knight, and et al. 2019. "Closing the Wearable Gap—Part II: Sensor Orientation and Placement for Foot and Ankle Joint Kinematic Measurements" Sensors 19, no. 16: 3509. https://0-doi-org.brum.beds.ac.uk/10.3390/s19163509