A New Calibration Circuit Design to Reduce Drift Effect of RuO2 Urea Biosensors


Graduate School of Electronic Engineering, National Yunlin University of Science and Technology, Douliu 64002, Taiwan
*
Author to whom correspondence should be addressed.
Sensors 2019, 19(20), 4558; https://0-doi-org.brum.beds.ac.uk/10.3390/s19204558
Submission received: 11 September 2019
/
Revised: 11 October 2019
/
Accepted: 18 October 2019
/
Published: 20 October 2019
(This article belongs to the Special Issue Potentiometric Bio/Chemical Sensing)
Abstract
:The goal of this study was to reduce the drift effect of RuO2 urea biosensors. A new calibration circuit (NCC) based on the voltage regulation technique with the advantage of having a simple structure was presented. To keep its simplicity, the proposed NCC was composed of a non-inverting amplifier and a voltage calibrating circuit. A ruthenium oxide (RuO2) urea biosensor was fabricated to test the calibrating characteristics of the drift rate of the proposed NCC. The experiment performed in this study was divided into two main stages. For the first stage, a sound RuO2 urea biosensor testing environment was set-up. The RuO2 urea sensing film was immersed in the urea solution for 12 h and the response voltage was measured using the voltage-time (V–T) measurement system and the proposed NCC. The results of the first stage showed that the RuO2 urea biosensor has an average sensitivity of 1.860 mV/(mg/dL) and has a linearity of 0.999 which means that the RuO2 urea biosensor had been well fabricated. The second stage of the experiment verified the proposed NCC’s functions, and the results indicated that the proposed NCC reduced the drift rate of RuO2 urea biosensor to 0.02 mV/hr (98.77% reduction).
1. Introduction
Recently, cases of kidney diseases have been increasing due to changes in diet and eating patterns. Urea plays an important role in clinical processes for detecting kidney functions [1]. For the past decades, many urea biosensors have been widely studied to achieve high sensitivity, linearity, and some sensing characteristics [1,2,3,4,5,6,7,8,9,10,11,12,13,14,15,16,17,18,19,20,21,22,23,24,25]. However, biomedical workers still find the current biosensors that measure drift rates unacceptable and unsatisfactorily. Scientists suspected that the unstable readout of urea biosensor for long-term measurement may be due to the drift effect. During long-term measurement, the response voltage of the sensor is changing with time, which is called the drift phenomenon. The reason that response voltage change is that hydration layer formed on the surface of sensing film [26,27]. The hydroxyl groups were formed on the surface of sensing film in solution, and the hydrated ions, formed by coulombic attraction between water molecules and ions, diffused to the sensing film will result in the formation of hydration layer. The surface potential of the film was attributed to electrical double layer capacitance which was formed by the hydration layer. Hence, some researchers devoted themselves to finding new biosensor materials. At present, the most widely used sensing film in fabricating urea biosensors is composed of nickel oxide (NiO) and titanium oxide (TiO2). The NiO has strong chemical stability and fast electron transfer capability; therefore, it is also applied as a sensing material to develop uric and glucose sensors [1,5,6,7]. TiO2 is a non-toxic, non-corrosive, and reusable material with better electron transition, making it a good sensing film material for biosensors [8,9,10,11,12]. Ruthenium oxide (RuO2) is a transition metal oxide with rutile-type structure and high metallic conductivity; RuO2 is a suitable material for working electrodes due to its low resistivity, high thermal stability, and good diffusion barrier properties [28,29,30,31]. In previous studies, RuO2 has been applied as a sensing material to fabricate pH [31] and chloride sensors [32,33]. The above researchers also demonstrated that the proposed sensors achieved better sensing properties such as average sensitivity and linearity. Therefore, RuO2 is a good material for fabricating biosensors. According to the above discussions, many researchers apply NiO and TiO2 as materials to improve the sensing characteristics of urea biosensors. However, the drift effect is rarely discussed in these articles. Recently, Chou et al. [27] presented urea biosensors based on graphene oxide/titanium dioxide films modified by urease-magnetic beads to achieve better sensing characteristics. The drift problem is still not solved in this reported work.
Although different urea biosensors had been widely studied to achieve better sensing characteristics [1,2,3,4,5,6,7,8,9,10,11,12,13,14,15,16,17,18,19,20,21,22,23,24,25], the non-ideal effects and drift rates had been barely discussed in previous works. Chou et al. [24] presented a flexible arrayed urea sensor based on urease-magnetic beads (MBs) and graphene oxide (GO), but it was only able to measure the drift rate and the drift effect calibration method was not discussed. This non-ideal effect is critical for biosensors and must be resolved [32,33].
In this study, RuO2 was used as a sensing film to fabricate a urea biosensor, and a new calibration circuit (NCC) was proposed to reduce the drift effect of an RuO2 urea biosensor. To verify the functions of the RuO2 urea biosensor, several sensing characteristics were measured within the normal urea concentration range of the human body (2.5–7.5 mM) [25], using the conventional voltage–time (V–T) measurement system. Based on the results, with the application of the voltage regulation technique, the proposed NCC obtained a significantly lowered drift rate compared to that of the conventional V–T measurement system. Moreover, the sensing characteristics of the RuO2 urea biosensor were also compared to those measured by the noise-canceling readout circuit proposed in Kuo’s work [34]. In this reported work, a new readout circuit was presented to reduce the power line noise during sensing measurements of urea biosensors. In Kuo’s work, the proposed circuit, a Twin-T notch filter was used to cancel the power line noise, and a Sallen–Key low-pass filter was used to suppress the high-frequency noise. However, this readout circuit only improved the two sensing characteristics, average sensitivity and linearity. The sensing characteristics in [34] were also compared with those of the proposed urea biosensor in this work, and our RuO2 urea biosensor achieved better average sensitivity and linearity.
2. Experiment
To realize the study goals, the experiment was divided into two stages: the first stage of the experiment entailed setting-up of a sound RuO2 urea biosensor testing environment, and the second stage involved verification of the proposed NCC’s functions. For the convenience of the readers, this section was presented in detail in terms of materials, manufacturing of the flexible arrayed RuO2 urea biosensor, the V–T measurement system, and the proposed NCC for drift rate.
2.1. Materials
The polyethylene terephthalate (PET) substrate used in this study was purchased from Zencatec Corporation (Tao-Yuan City, Taiwan). The required ruthenium (Ru) purity was targeted at 99.95% and it was sourced from Ultimate Materials Technology Co., Ltd (Hsinchu County, Taiwan), which deposits ruthenium dioxide (RuO2) film onto PET substrate by the sputtering system. Besides, silver was used in this study as electrodes made from arrayed wires, which was purchased as silver paste from Advanced Electronic Material Inc. (Tainan City, Taiwan), and was made into silver wires using a screen-printing system. This study also employed an epoxy thermosetting polymer (product no. JA643) from Sil-More Industrial, Ltd. (New Taipei City, Taiwan) cured using a screen-printing technology to make an insulation layer. Urease and urea were purchased from Sigma-Aldrich Corp. (St. Louis, MO, USA) and J. T. Baker Corp. (St. Louis, MO, USA), respectively. Phosphate monobasic (KH2PO4) powders and potassium phosphate dibasic (K2HPO4) powders were purchased from Katayama Chemical Industries Co., Ltd. (Yasuo Machi, Japan), and were used to make 30 mM phosphate buffer saline solutions (PBS) with a pH level of 7 (considered neutral in the human body). The deionized (D.I) water, which was approximately equal to 18.4 MΩ cm−1, was used to prepare the aqueous solutions.
2.2. Manufacturing of the Flexible Arrayed RuO2 Urea Biosensor
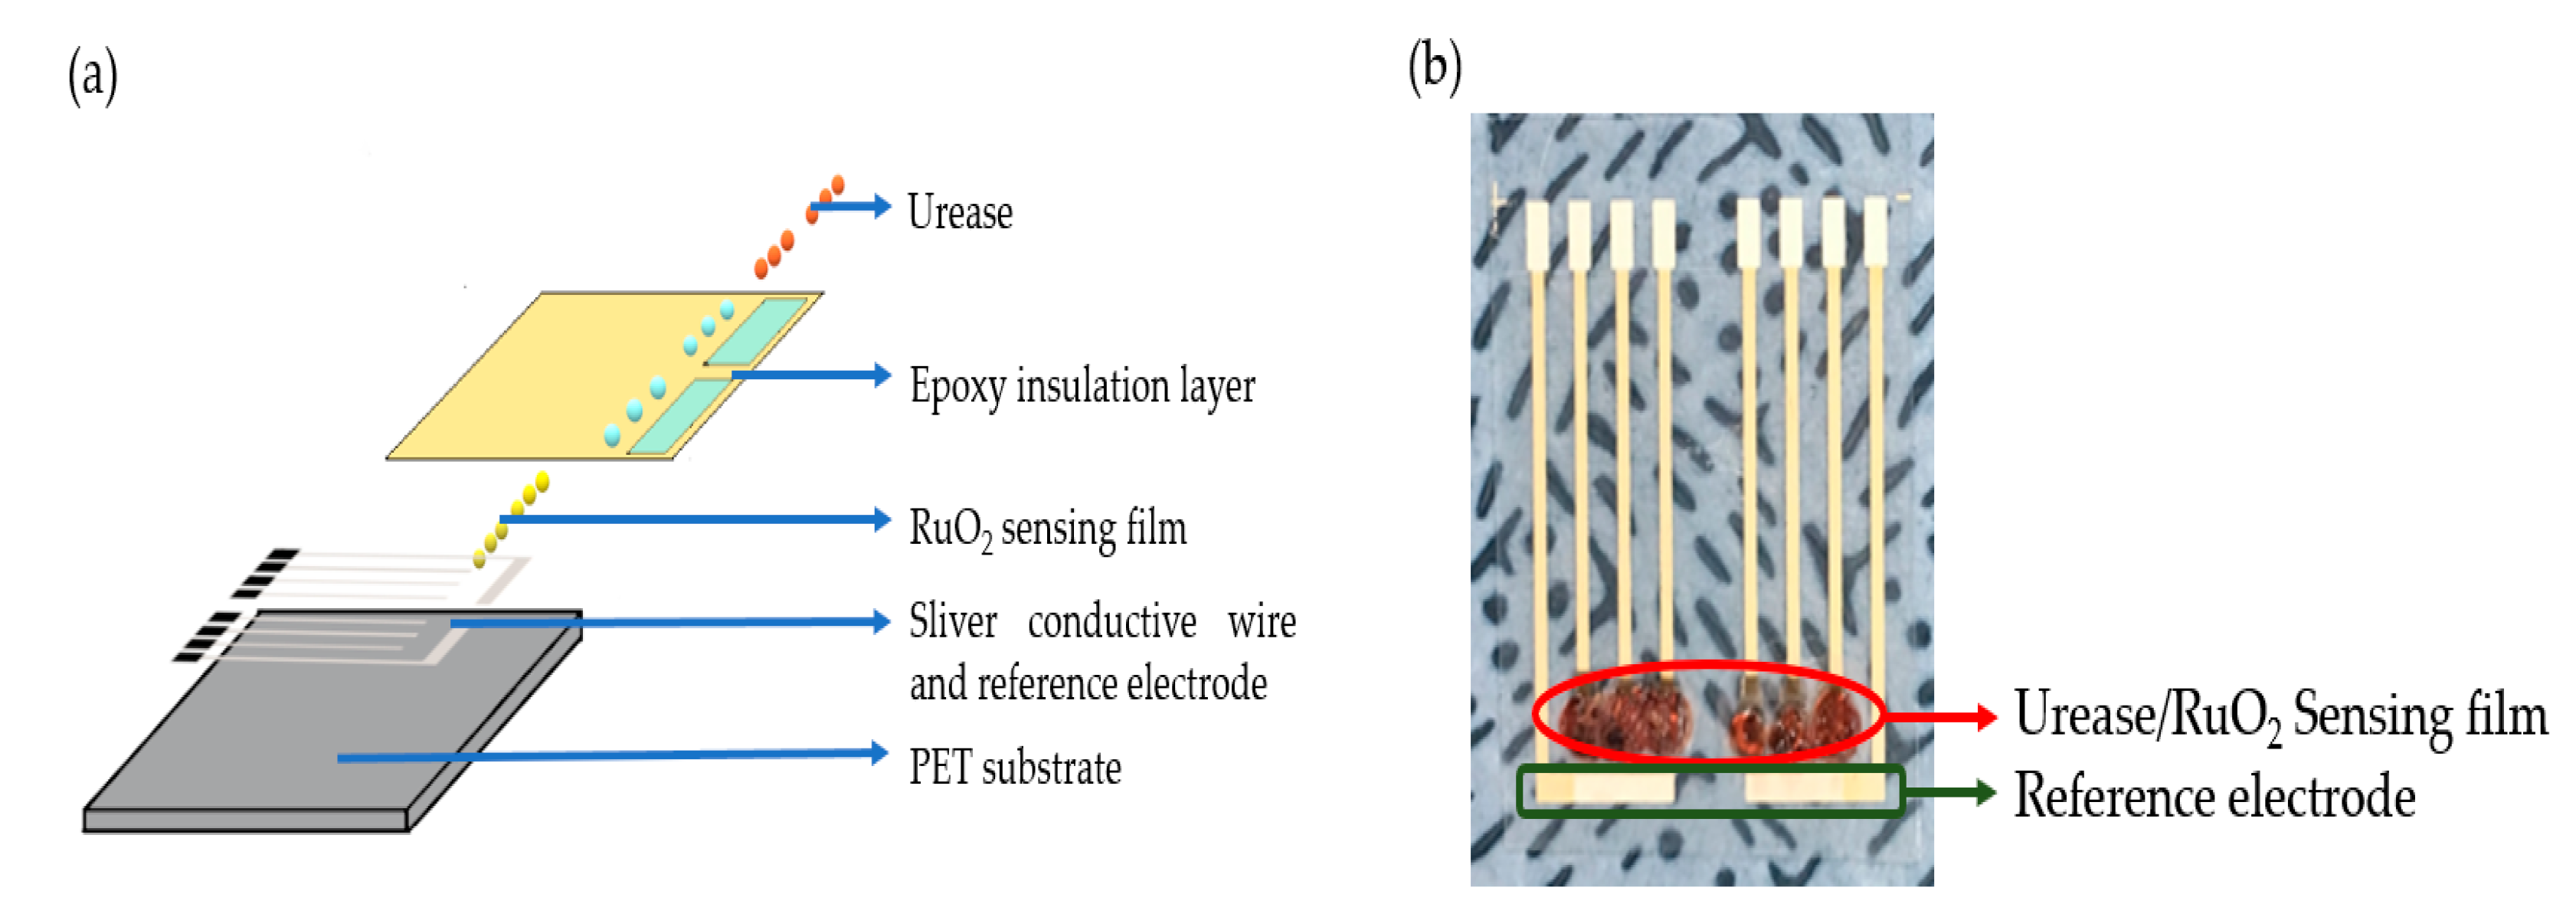
RuO2, a transition metal oxide with high-temperature stability, low resistivity, and good diffusion barrier properties was used in this study to fabricate the flexible arrayed urea biosensor. The production process of flexible arrayed RuO2 urea biosensor was similar to Chou’s previous work [24]. The structure diagram of the flexible arrayed RuO2 urea biosensor is shown in Figure 1.
The manufacturing process of the flexible arrayed RuO2 urea biosensor started with the silver paste being printed on flexible arrayed PET substrates using screen printing techniques to form the arrayed silver wires producing the working electrode and the reference electrode. Next, the RuO2 film was deposited on the flexible arrayed PET substrate through a sputtering system to form the RuO2 film window; then, it was encapsulated with an epoxy thermosetting polymer. The urease was immobilized because of the covalent bond, its low diffusivity, and strong binding, which reduced the loss and stability of the urease [25]. Afterward, the aminopropyltriethoxysilane (APTS) solution was dropped on the RuO2 sensing film at room temperature. The ability of urease to be adsorbed on the surface was enhanced by dropping 1% glutaraldehyde solution onto the RuO2 sensor which was kept still for 24 h. Finally, the urease was dropped onto the RuO2 sensing film to form a flexible arrayed RuO2 urea biosensor.
2.3. V–T Measurement System
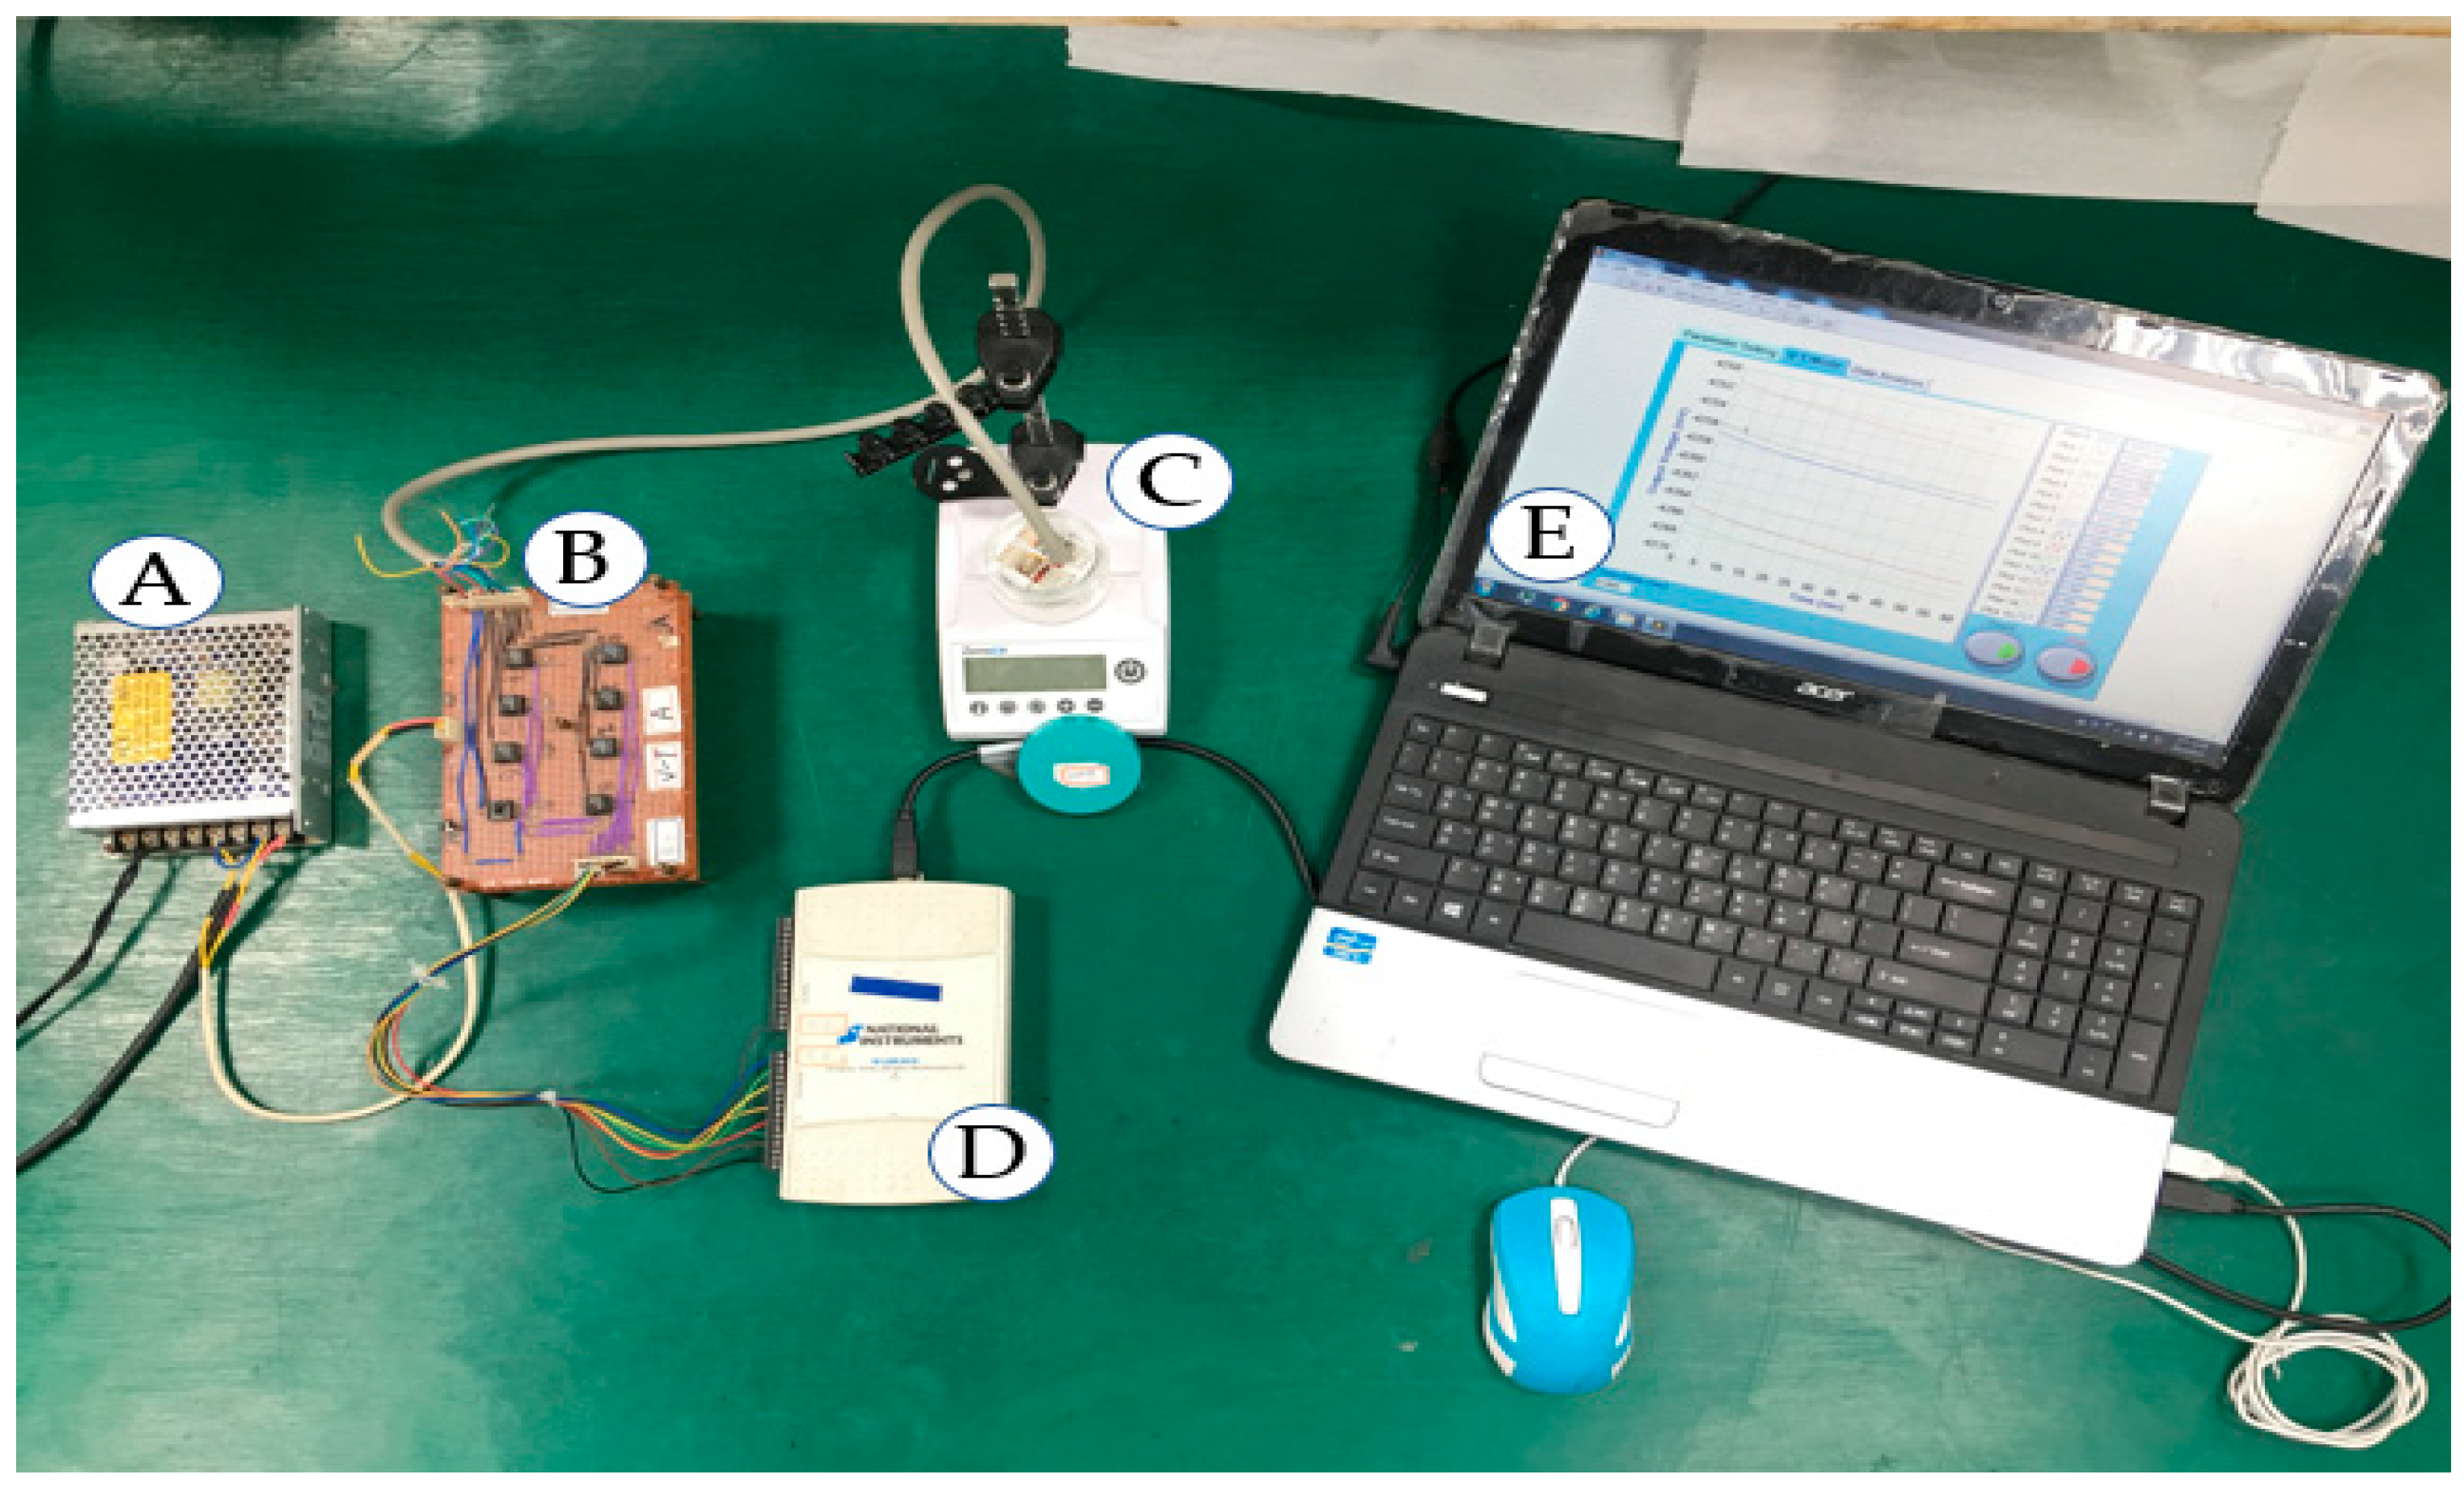
The sensing characteristics of the flexible arrayed RuO2 urea biosensor was measured using the V–T measurement system. The V–T measurement system had been reported in previous studies [32,33]. The measurement system consisted of an LT1167 instrumentation amplifier (Type: LT1167CN8#PBF, Linear Technology/Analog Devices Crop., Norwood, MA, USA), a data acquisition (DAQ) device (Type: USB-6210, National Instruments Crop., Austin, TX, USA), and a program system software (Type: LabVIEW, National Instruments Crop., Austin, TX, USA). The schematic diagram and the actual V–T measurement system used are shown in Figure 2 and Figure 3, respectively. In Figure 3, the V–T measurement system was composed of a power supply, a readout circuit (LT1167), a data acquisition card (DAQ device, Model: NI USB-6201, National Instrument Corp., Austin, TX, USA), and a computer with LabVIEW program [32,33]. The response potential was sensed by the readout circuit. To obtain the digital signals, the output voltage will be transmitted to the DAQ device. Finally, the digital data were transmitted into the computer and analyzed by the LabVIEW program. The LT1167 instrumentation amplifier is a precision electronic component with a high input impedance of about 200 GΩ, which means that the input signal will not be attenuated; the disadvantage of this is that the input noise may be amplified resulting in unstable measurement results. The LT1167 instrumentation amplifier has the advantage of a higher common-mode rejection ratio (CMRR) (90 dB, G = 1) and power supply rejection ratio (PSRR) (105 dB, G = 1), which means that the amplifier is effective in resisting noise and power noise. The LT1167 instrumentation amplifier’s gain was set between 1 (0 dB) to 1,000 (60 dB), which was controlled by an external resistor. The LT1167 instrumentation amplifier was used to read the response voltage of the biosensor. The output voltage and gain were computed as:
where:
- Vout is the response voltage of the LT1167 readout sensor,
- VA is the positive input of the amplifier,
- VB is the negative input of the amplifier,
- RG is the external resistor,
- Vr is the voltage of the reference electrode,
- Vw is the voltage of the working electrode.
In this V–T measurement system, the internal resistance was set at 49.4KΩ, the external resistor RG controlled the magnification of the LT1167 instrumentation amplifier, and the biosensor was immersed in the urea solution. Based on Equation (2), the gain of the LT1167 was set to 0 dB, so RG does not need a separate external resistor to amplify the voltage gain; RG was regarded as an open circuit (RG is infinite). Furthermore, Vout represents the potential difference between the reference electrode and the working electrode. Since the reference electrode was connected to the ground (Vr = 0 V), the response voltage of the RuO2 urea biosensor was −Vw. The response voltage was then captured by the DAQ device, and the analog signal was converted into a digital signal, which was transmitted to the LabVIEW software program to display the sensing voltage of the biosensor on the computer.
2.4. The Proposed New Calibration Circuit for Drift Effect
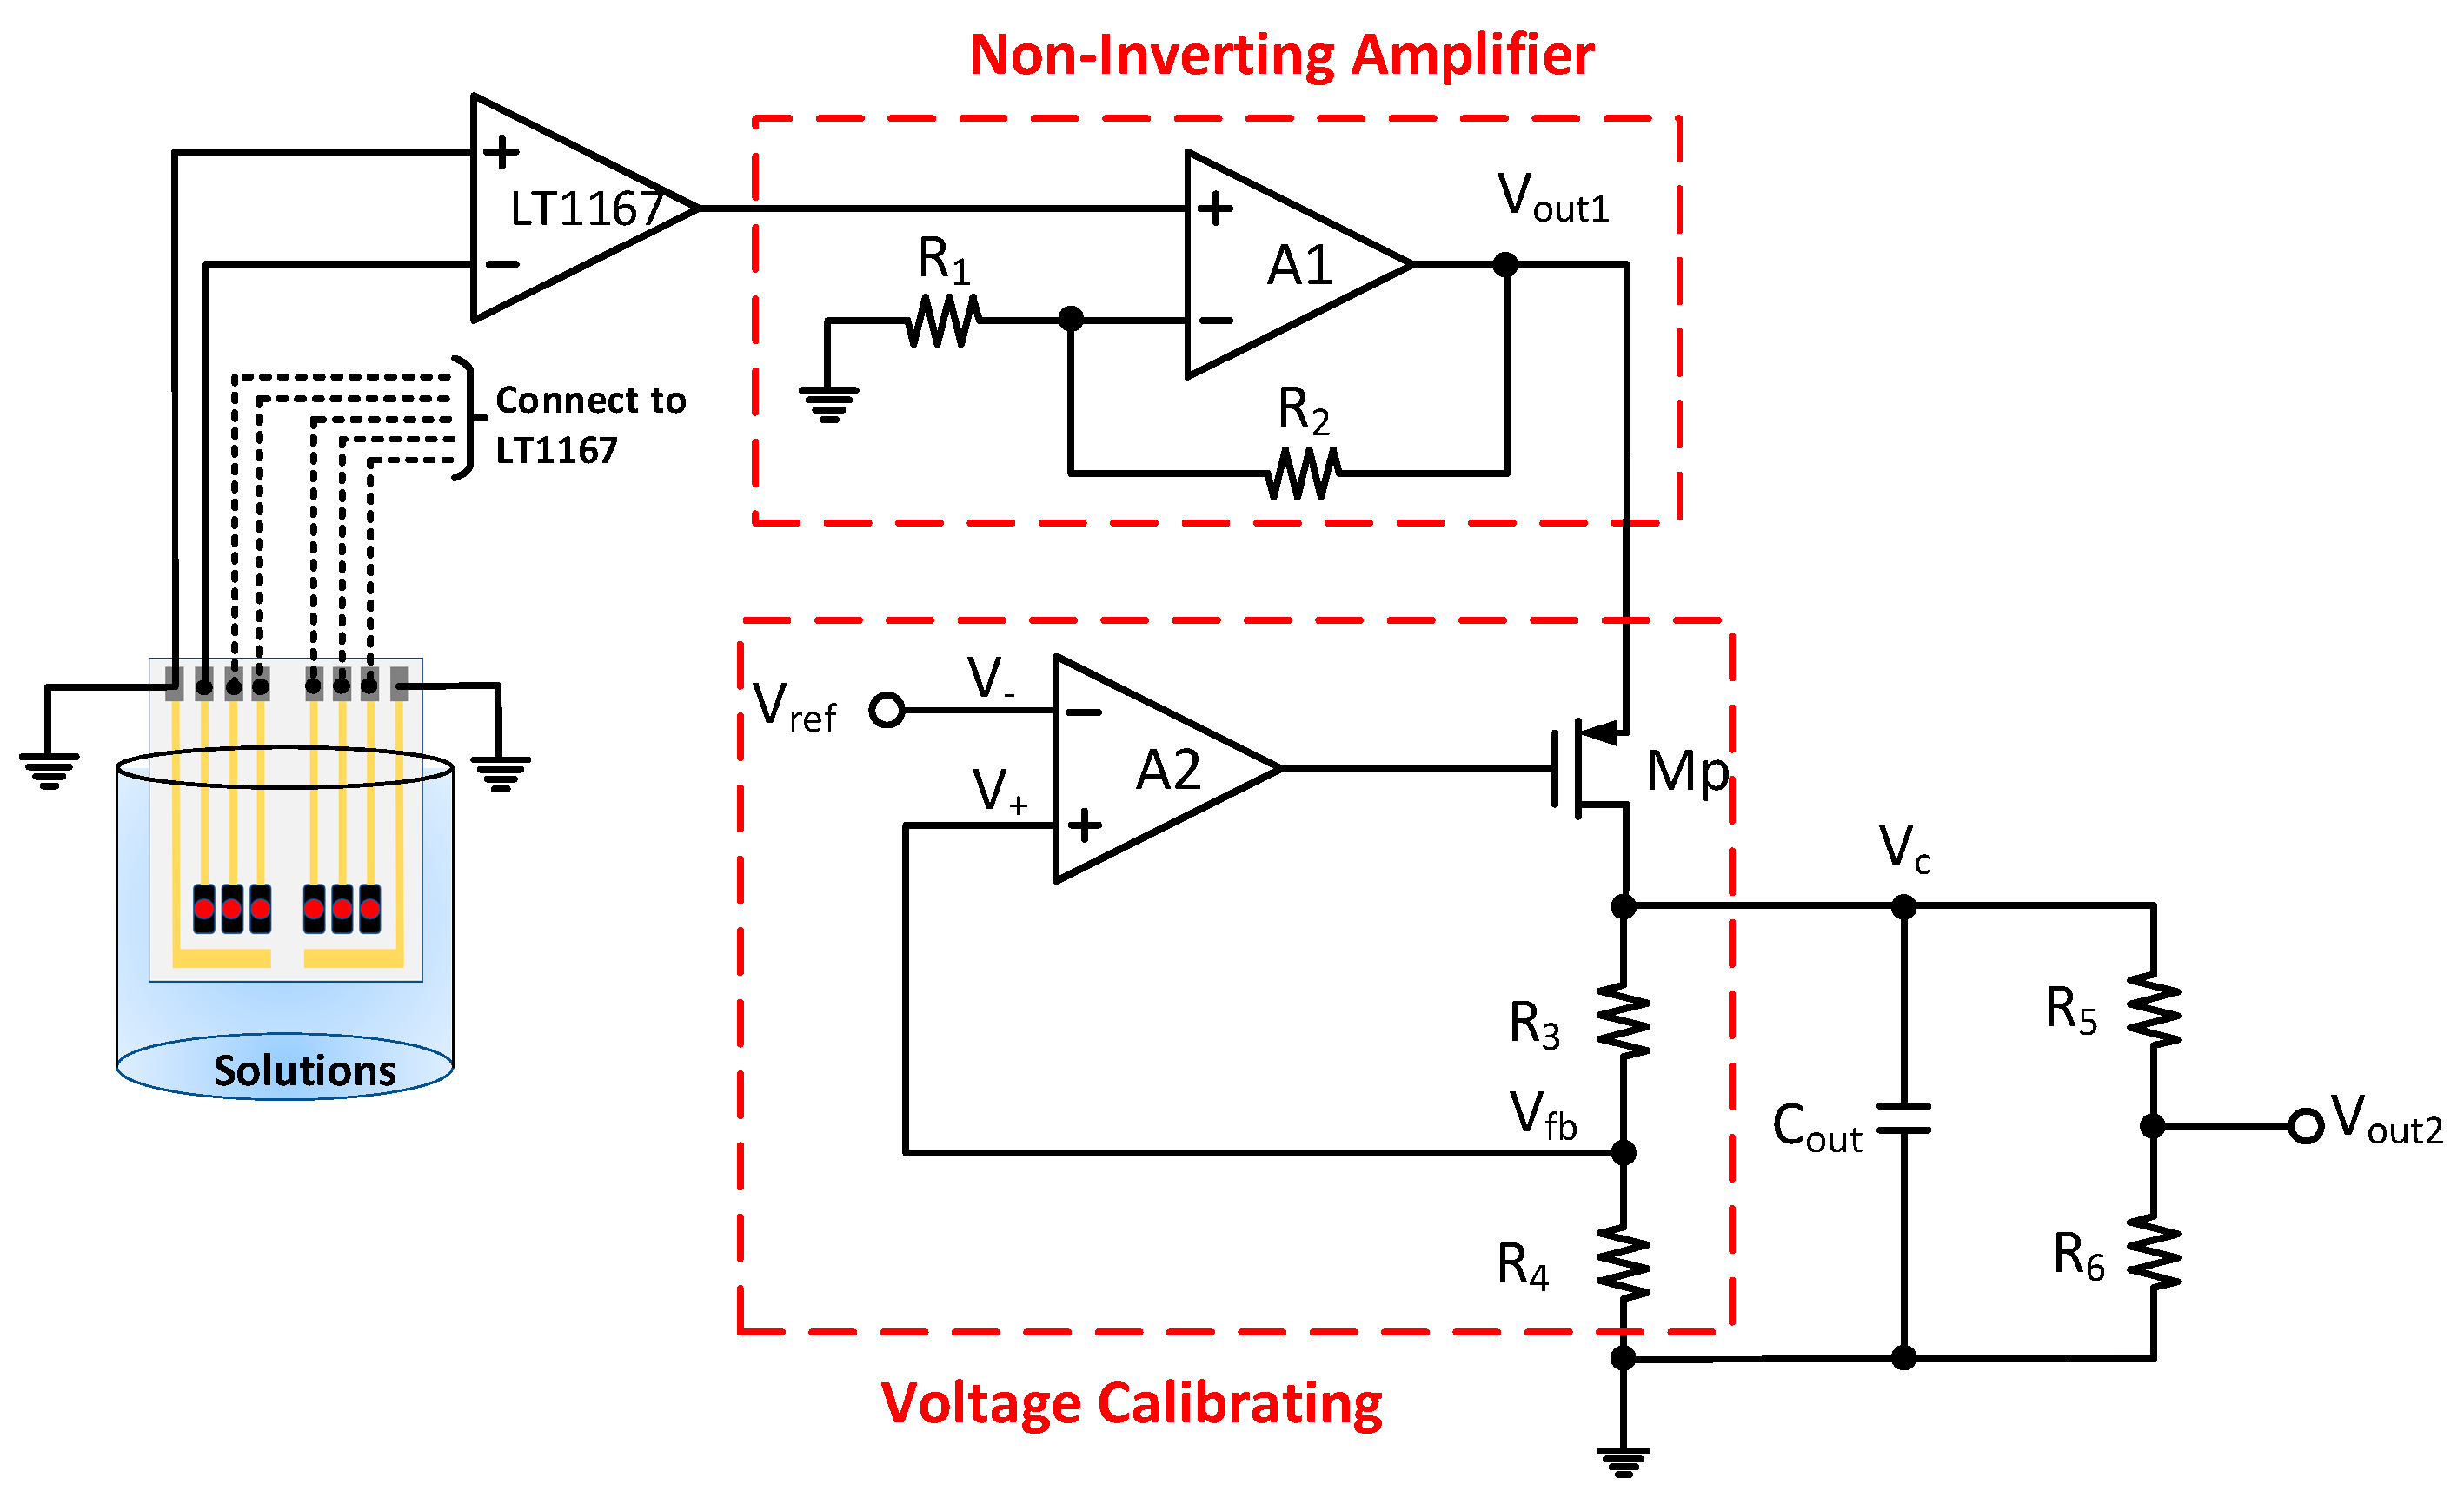
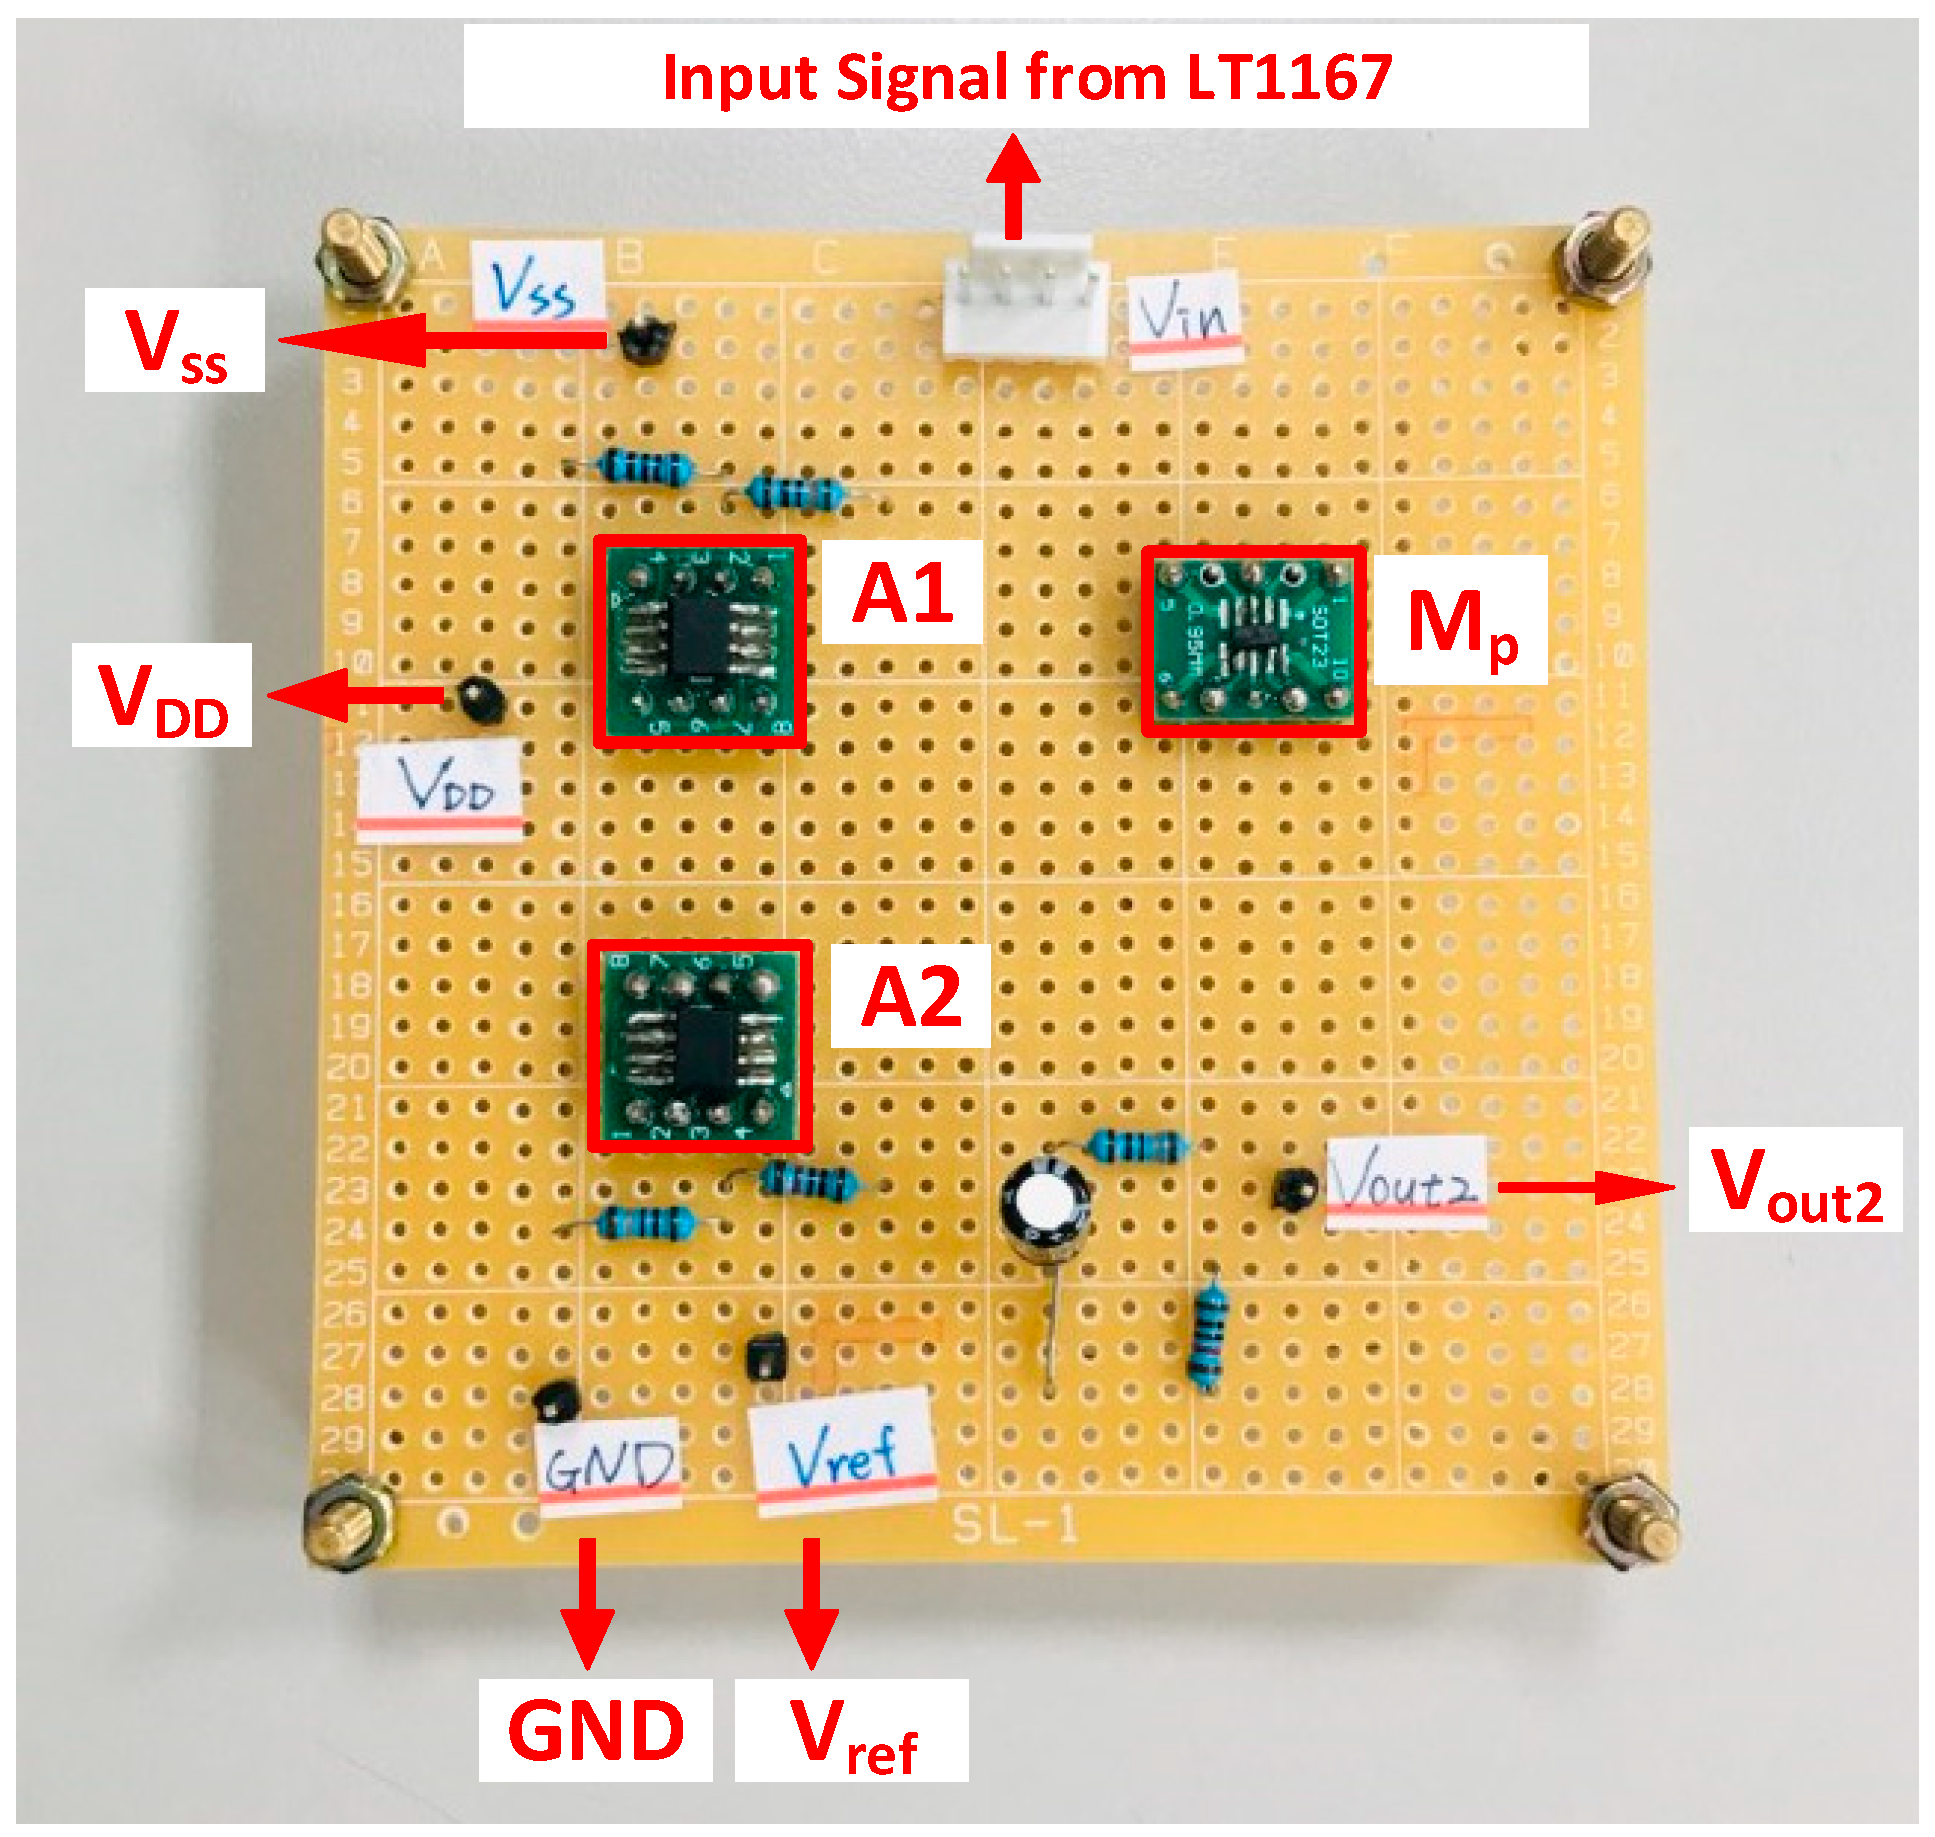
A new calibration circuit (NCC) was proposed by this study to reduce the drift effect of the flexible arrayed RuO2 urea biosensor as shown in Figure 4. This NCC consisted of a non-inverting amplifier (A1, R1, and R2) and an error amplifier A2, a P-MOSFET transmission transistor Mp, a negative feedback network (R3 and R4), an output voltage capacitor Cout, and a resistor divider (R5 and R6). The implementation of the proposed NCC is shown in Figure 5. The operational amplifier OPA130 was used as the error amplifier A1 and A2. A P-Chanel MOSFEF FDN340P-ND was utilized as the drive transmission transistor Mp. The proposed circuit was attached to a real circuit board with simple discrete devices such as resistors, capacitors, field-effect transistors, and amplifiers for its simplicity. The operational amplifier OPA130 is a low-power precision FET-input operational amplifier, which has a higher CMRR (90dB min) and has good noise resistance. It also has a wide voltage supply range (V+ & V- = ±2.25 V to ±18 V), which means that the non-inverting and the inverting inputs of the OPA130 have a wider range. The amplifier magnification factor was improved by controlling its bias in the non-saturation mode. The low response voltage of the biosensor was amplified by the non-inverting amplifier, enabling transmission of the transistor Mp in the linear region. Mp provided output current to charge the output load capacitor (Cout) maintaining Vc at a high level. The mechanism of the voltage regulation is depicted as follows: it is implemented by the negative feedback resistors (R3 and R4), and the feedback voltage network is expressed as the formula in Equation (3).
Based on Equation (3), when the Vc output voltage is decreased, the Vfb will also decrease compared to the reference voltage Vref. In this period, the voltage difference between the V+ terminal and the V– terminal of the error amplifier will be reduced, and the gate voltage of Mp will also be reduced. Therefore, the source-gate voltage (Vgs) of Mp will increase and will generate more current to charge the output load capacitor. The output voltage Vc will then increase and remain at a stable level. A high Vc voltage will result in an increased output voltage of the error amplifier and decreased the source-gate voltage (Vgs) of Mp. Under this condition, Mp will reduce the current to charge the output load capacitor. In this way, the output voltage will be controlled at a stable level as well. By changing the voltage or current, the output voltage can be maintained at a fairly stable level in a very short period.
The response voltage of RuO2 urea biosensor was read by LT1167, and the non-inverting amplifier (A1, R1 and R2) was used to amplify the sensing voltage which was input into the voltage calibration circuit. To obtain the real response voltage, the original magnification factor was reduced through the voltage divider (R5 and R6). The output voltage Vout2 was calculated using Equation (4).
The drift rate is a non-ideal effect in a biosensor during the measurement process. During long-term measurement, the response voltage of the sensor will gradually reach a stable level; this is called the drift rate [32,33,35]. In practice, the response voltage slowly changes proportionally with time during long-term measurement. Most researchers believe that this as a tedious and an unsolved issue. Based on previous studies [32,33,35], the response voltage of sensors stabilizes after 5 h. The drift rate can be calculated using Equation (5).
The drift rate in this study was obtained within different time frames which were between the response potential of output node at 5th and 12th hour. The values obtained were then divided by the measured time intervals (7 h). To maintain the response voltage of urea biosensor at a stable level during long-term measurement, the proposed NCC was applied to measure the response voltage. The response voltage was controlled at a stable level by the proposed NCC, which then significantly reduced the drift rate.
3. Results and Discussion
3.1. Sensing Properties of the Flexible Arrayed RuO2 Urea Biosensor
In this study, urease was used as the enzyme electrode. Urea was catalyzed and hydrolyzed by the urease and the reaction can be expressed as follows:
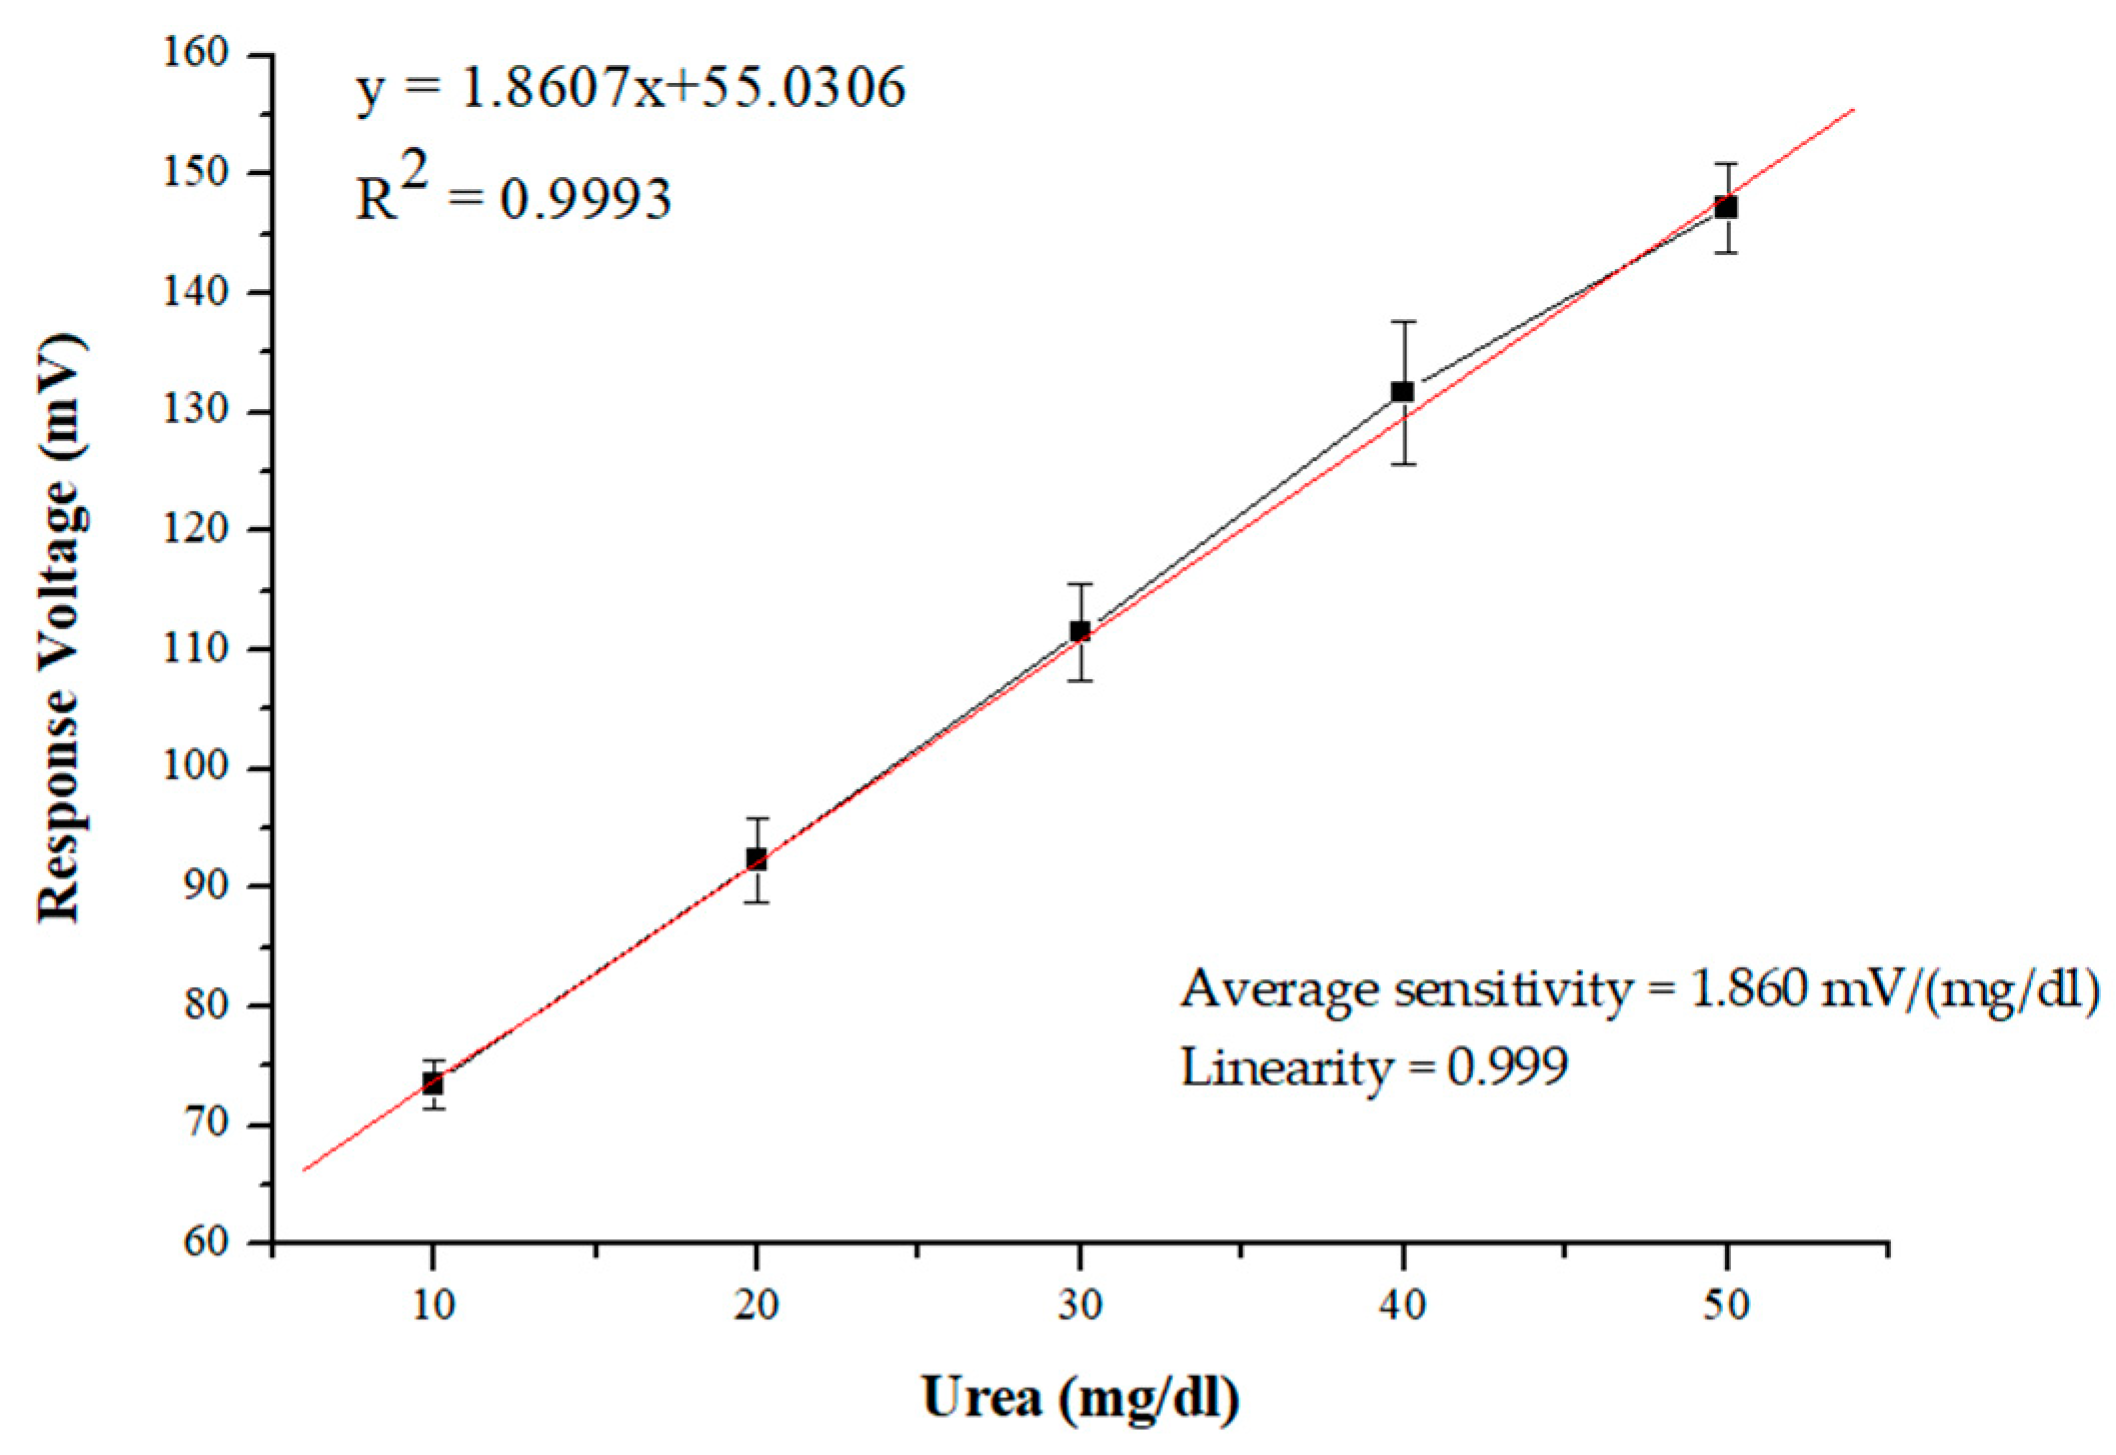
In this chemical equation, urea reacts with urease and is converted to ammonium (NH4+), bicarbonate (HCO3−), and hydroxide ions (OH−) [25]. The sensing properties of the flexible arrayed RuO2 urea biosensor were measured by the V–T measurement system. The flexible arrayed RuO2 urea biosensors were immersed in 10, 20, 30, 40, and 50 mg/dL urea concentration solutions. The output voltages were measured by the V–T measurement system five times. The results of the sensing measurement are shown in Figure 6. The average sensitivity and linearity recorded were 1.860 mV/(mg/dL) and 0.999, respectively. Moreover, the limit of detection (LOD) was estimated in this study. Limit of detection (LOD) is defined as the lowest concentration of analyte that can be detected in the analyte, but not quantitated [36]. In this experiment, a RuO2 urea biosensor was immersed in a buffer solution, and the LOD was measured by a V–T measurement system. To obtain the analyte concentration of the LOD urea biosensor, we followed the three sigma rule [37] and the equations are shown as follows:
where is the standard deviation of measuring the response voltage of the PBS solution, is value in the data, is the mean of the data, S0 is the sensitivity. The experimental results showed that the response voltage of the PBS solution was −7.348 mV, the standard deviation of σ is 0.807 and S0 is 1.860 mV/(mg/dL). Hence, the detection limit was calculated as 1.345 mg/dL. The sensing characteristics of the flexible arrayed RuO2 urea biosensors are shown in Table 1. Table 2 shows the comparisons of urea biosensors with various sensing films.
3.2. Analysis of the Response Time of the Flexible Arrayed RuO2 Urea Biosensor
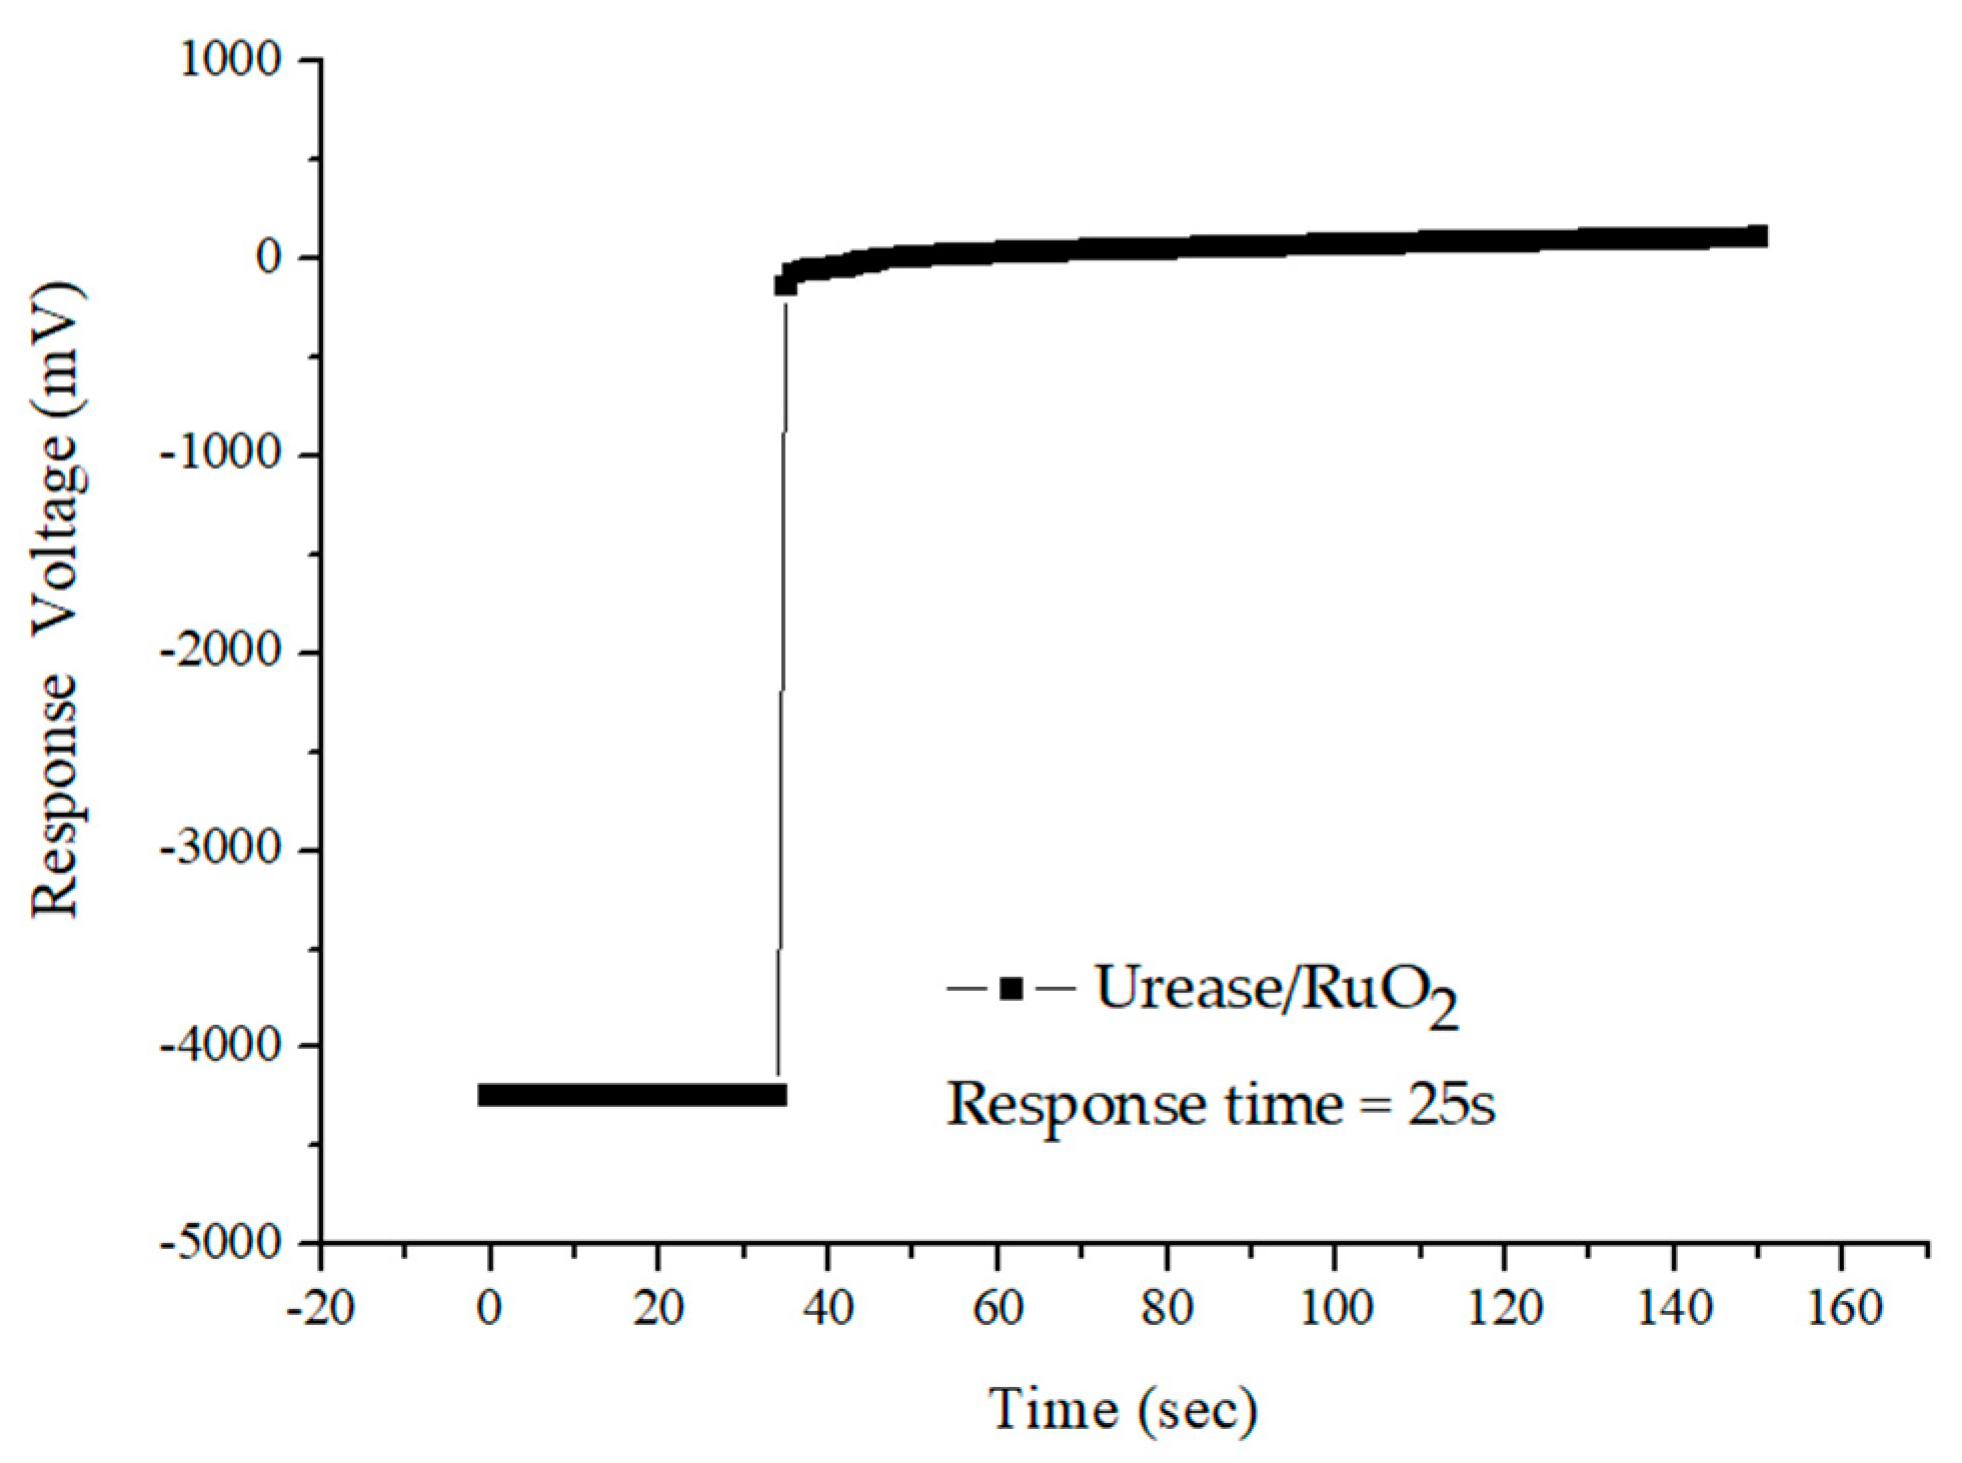
To measure the response time of the urea biosensor, the RuO2 urea sensor was immersed in 30 mg/dL urea solutions. The response voltage of the sensor did not change immediately when the input potential signal change occurred. It required some time to change from origin state to a stable state. The response time is defined as the time required for the sensor output to change from its original state to 95% of its equilibrium value [24]. In this study, the response time of the flexible arrayed RuO2 urea biosensor was measured by the V–T measurement system. The result of the experiment’s response time is shown in Figure 7. The RuO2 urea biosensor exhibited a fast response time of 25 s.
3.3. Analysis of Interference Effect of the Flexible Arrayed RuO2 Urea Biosensor
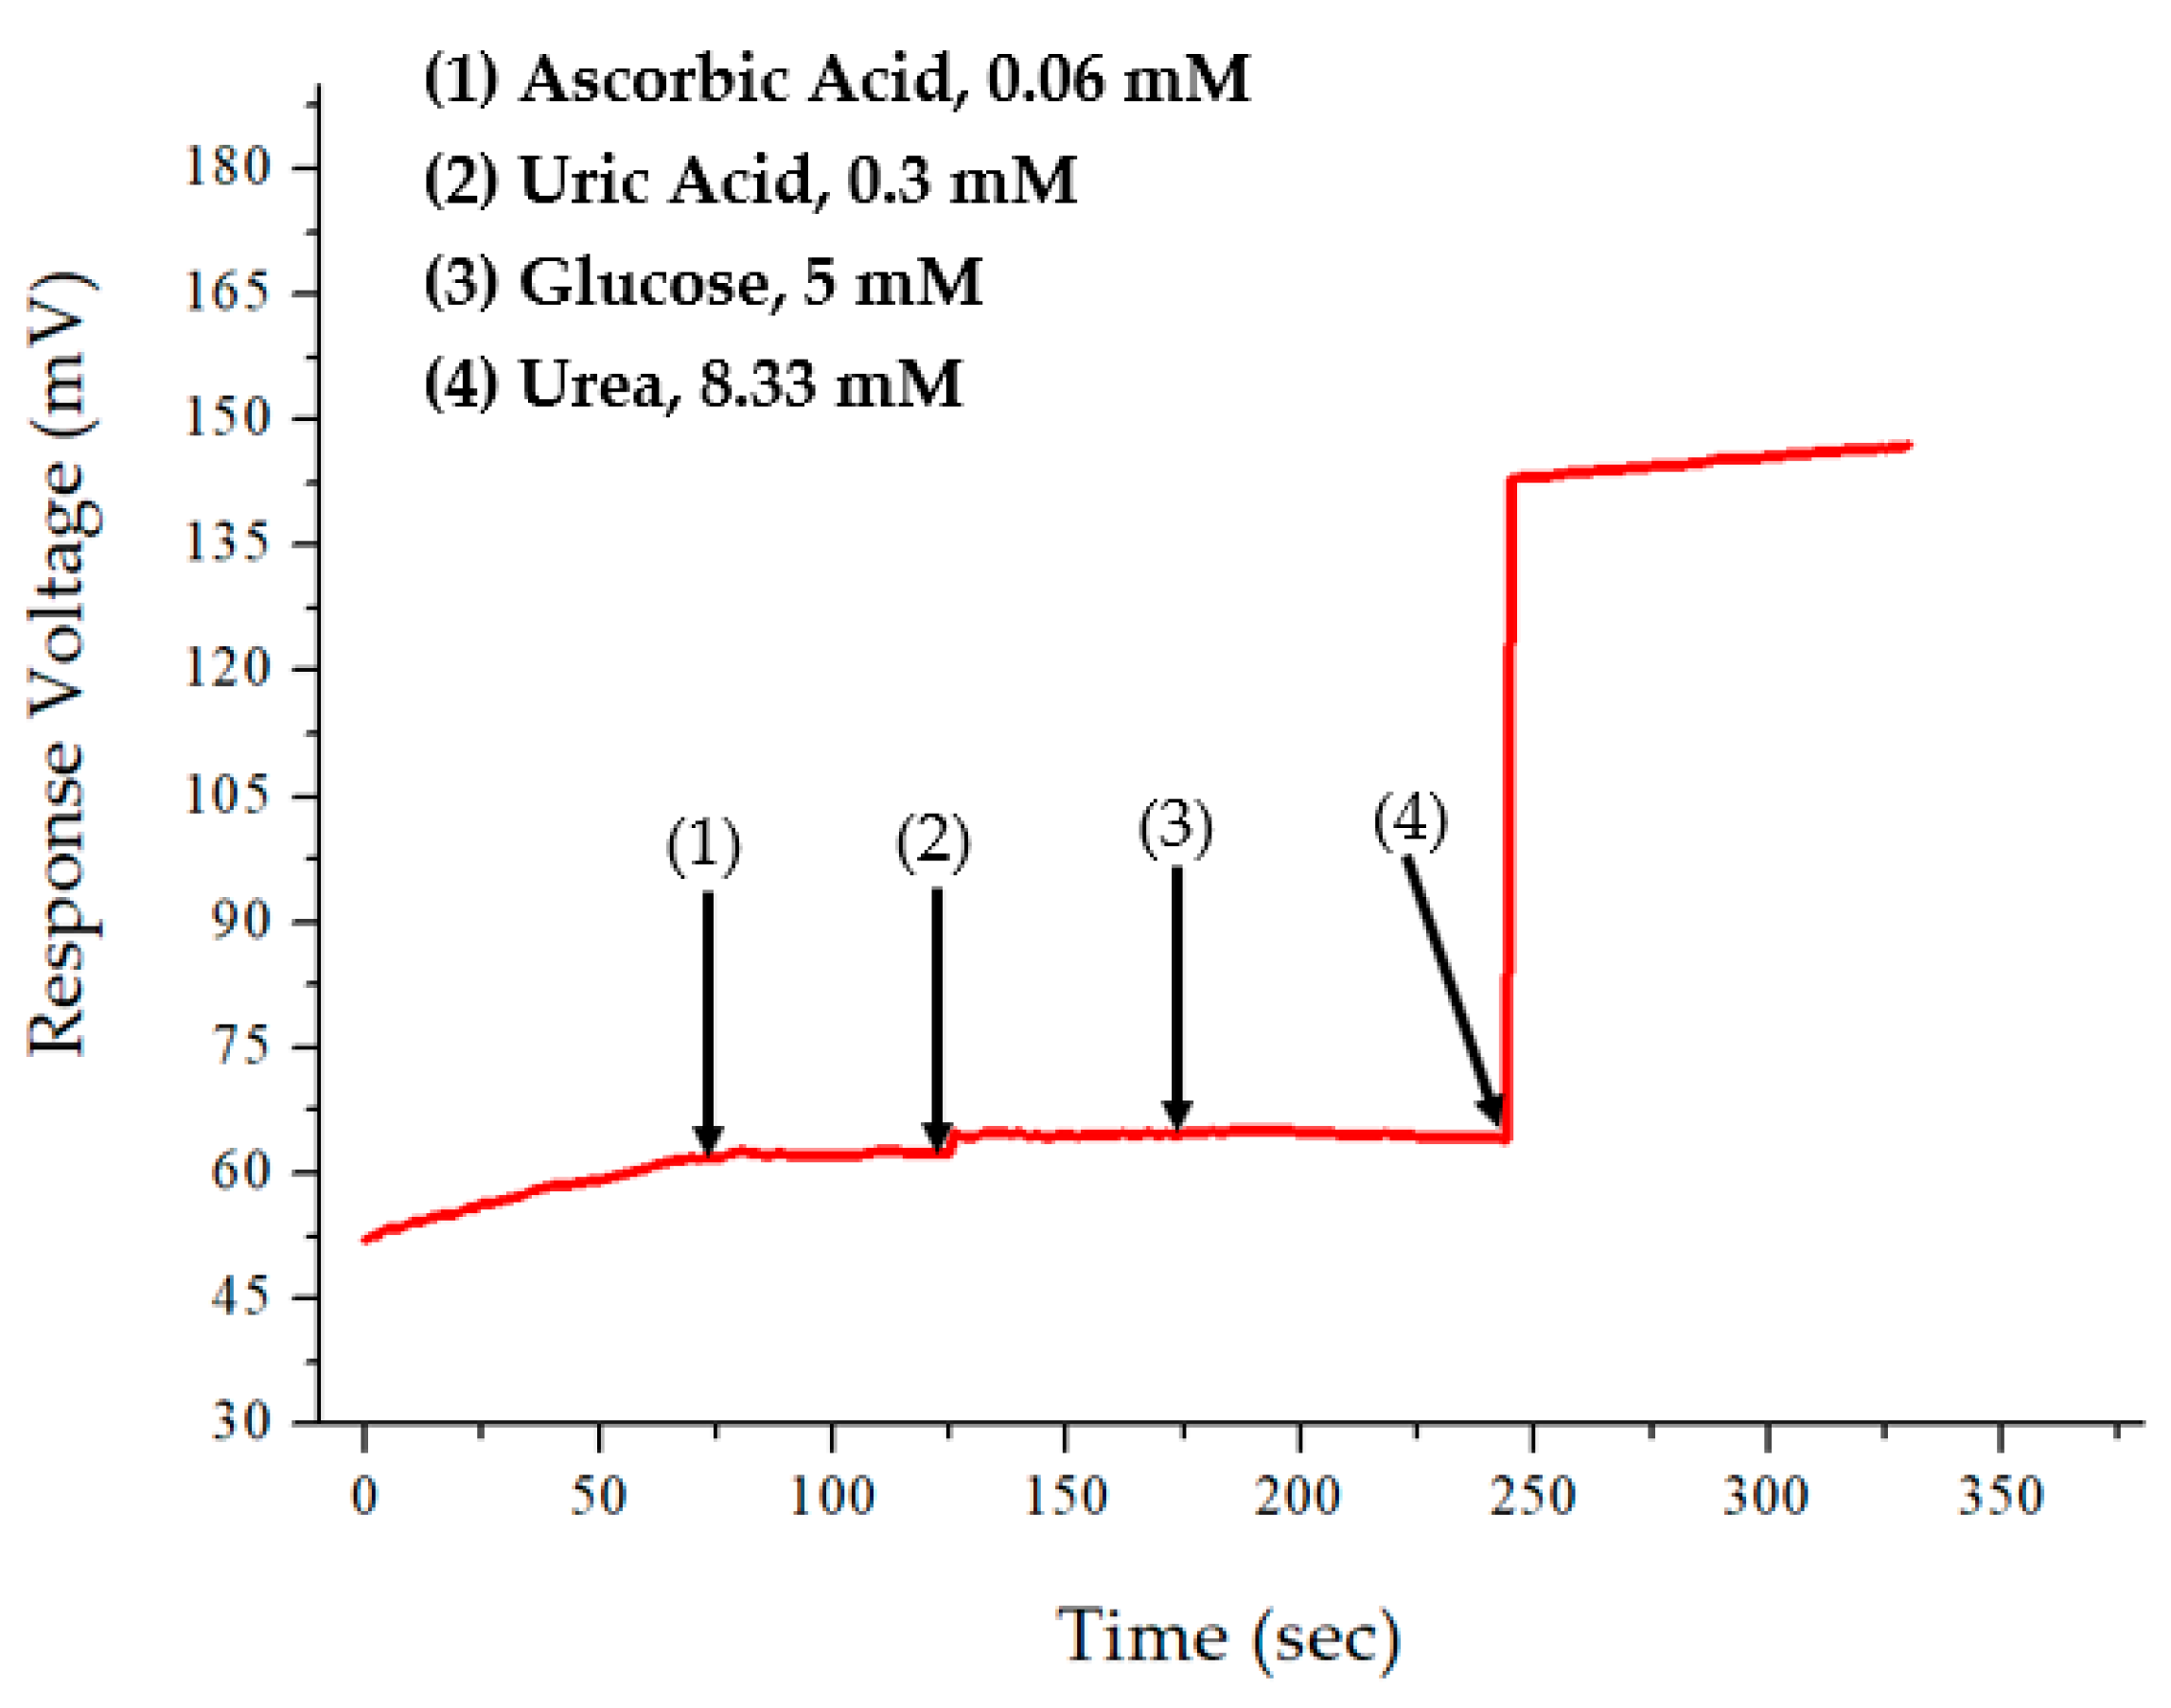
The interference effects could determine the type of urea biosensor to be used. The selectivity of the urea biosensor is related to the analyte measurement, and the potential interference for the human body could be uric acid, ascorbic acid, and glucose [27]. For the experiment, interferences were added in the measurement to determine the performance of the urea biosensor and to test the selectivity of the RuO2 urea biosensor. During practical application, the interference solutions were selected based on the normal range of the solutions obtained on the sample human blood. The urea sensor was first immersed into the test urea solution 1.66 mM (10 mg/dL); then, the ascorbic acid solution (0.06 mM), uric acid solution (0.3 mM), and glucose solution (5 mM) were added into the test solution, sequentially. Finally, the 8.33 mM (50 mg/dL) urea solution was added to the test solution. The results of the interference effect are shown in Figure 8. It was observed that the flexible arrayed RuO2 urea biosensor was not easily interfered with by other materials.
3.4. Analysis of the Drift Effect of the of the Flexible Arrayed RuO2 Urea Biosensor
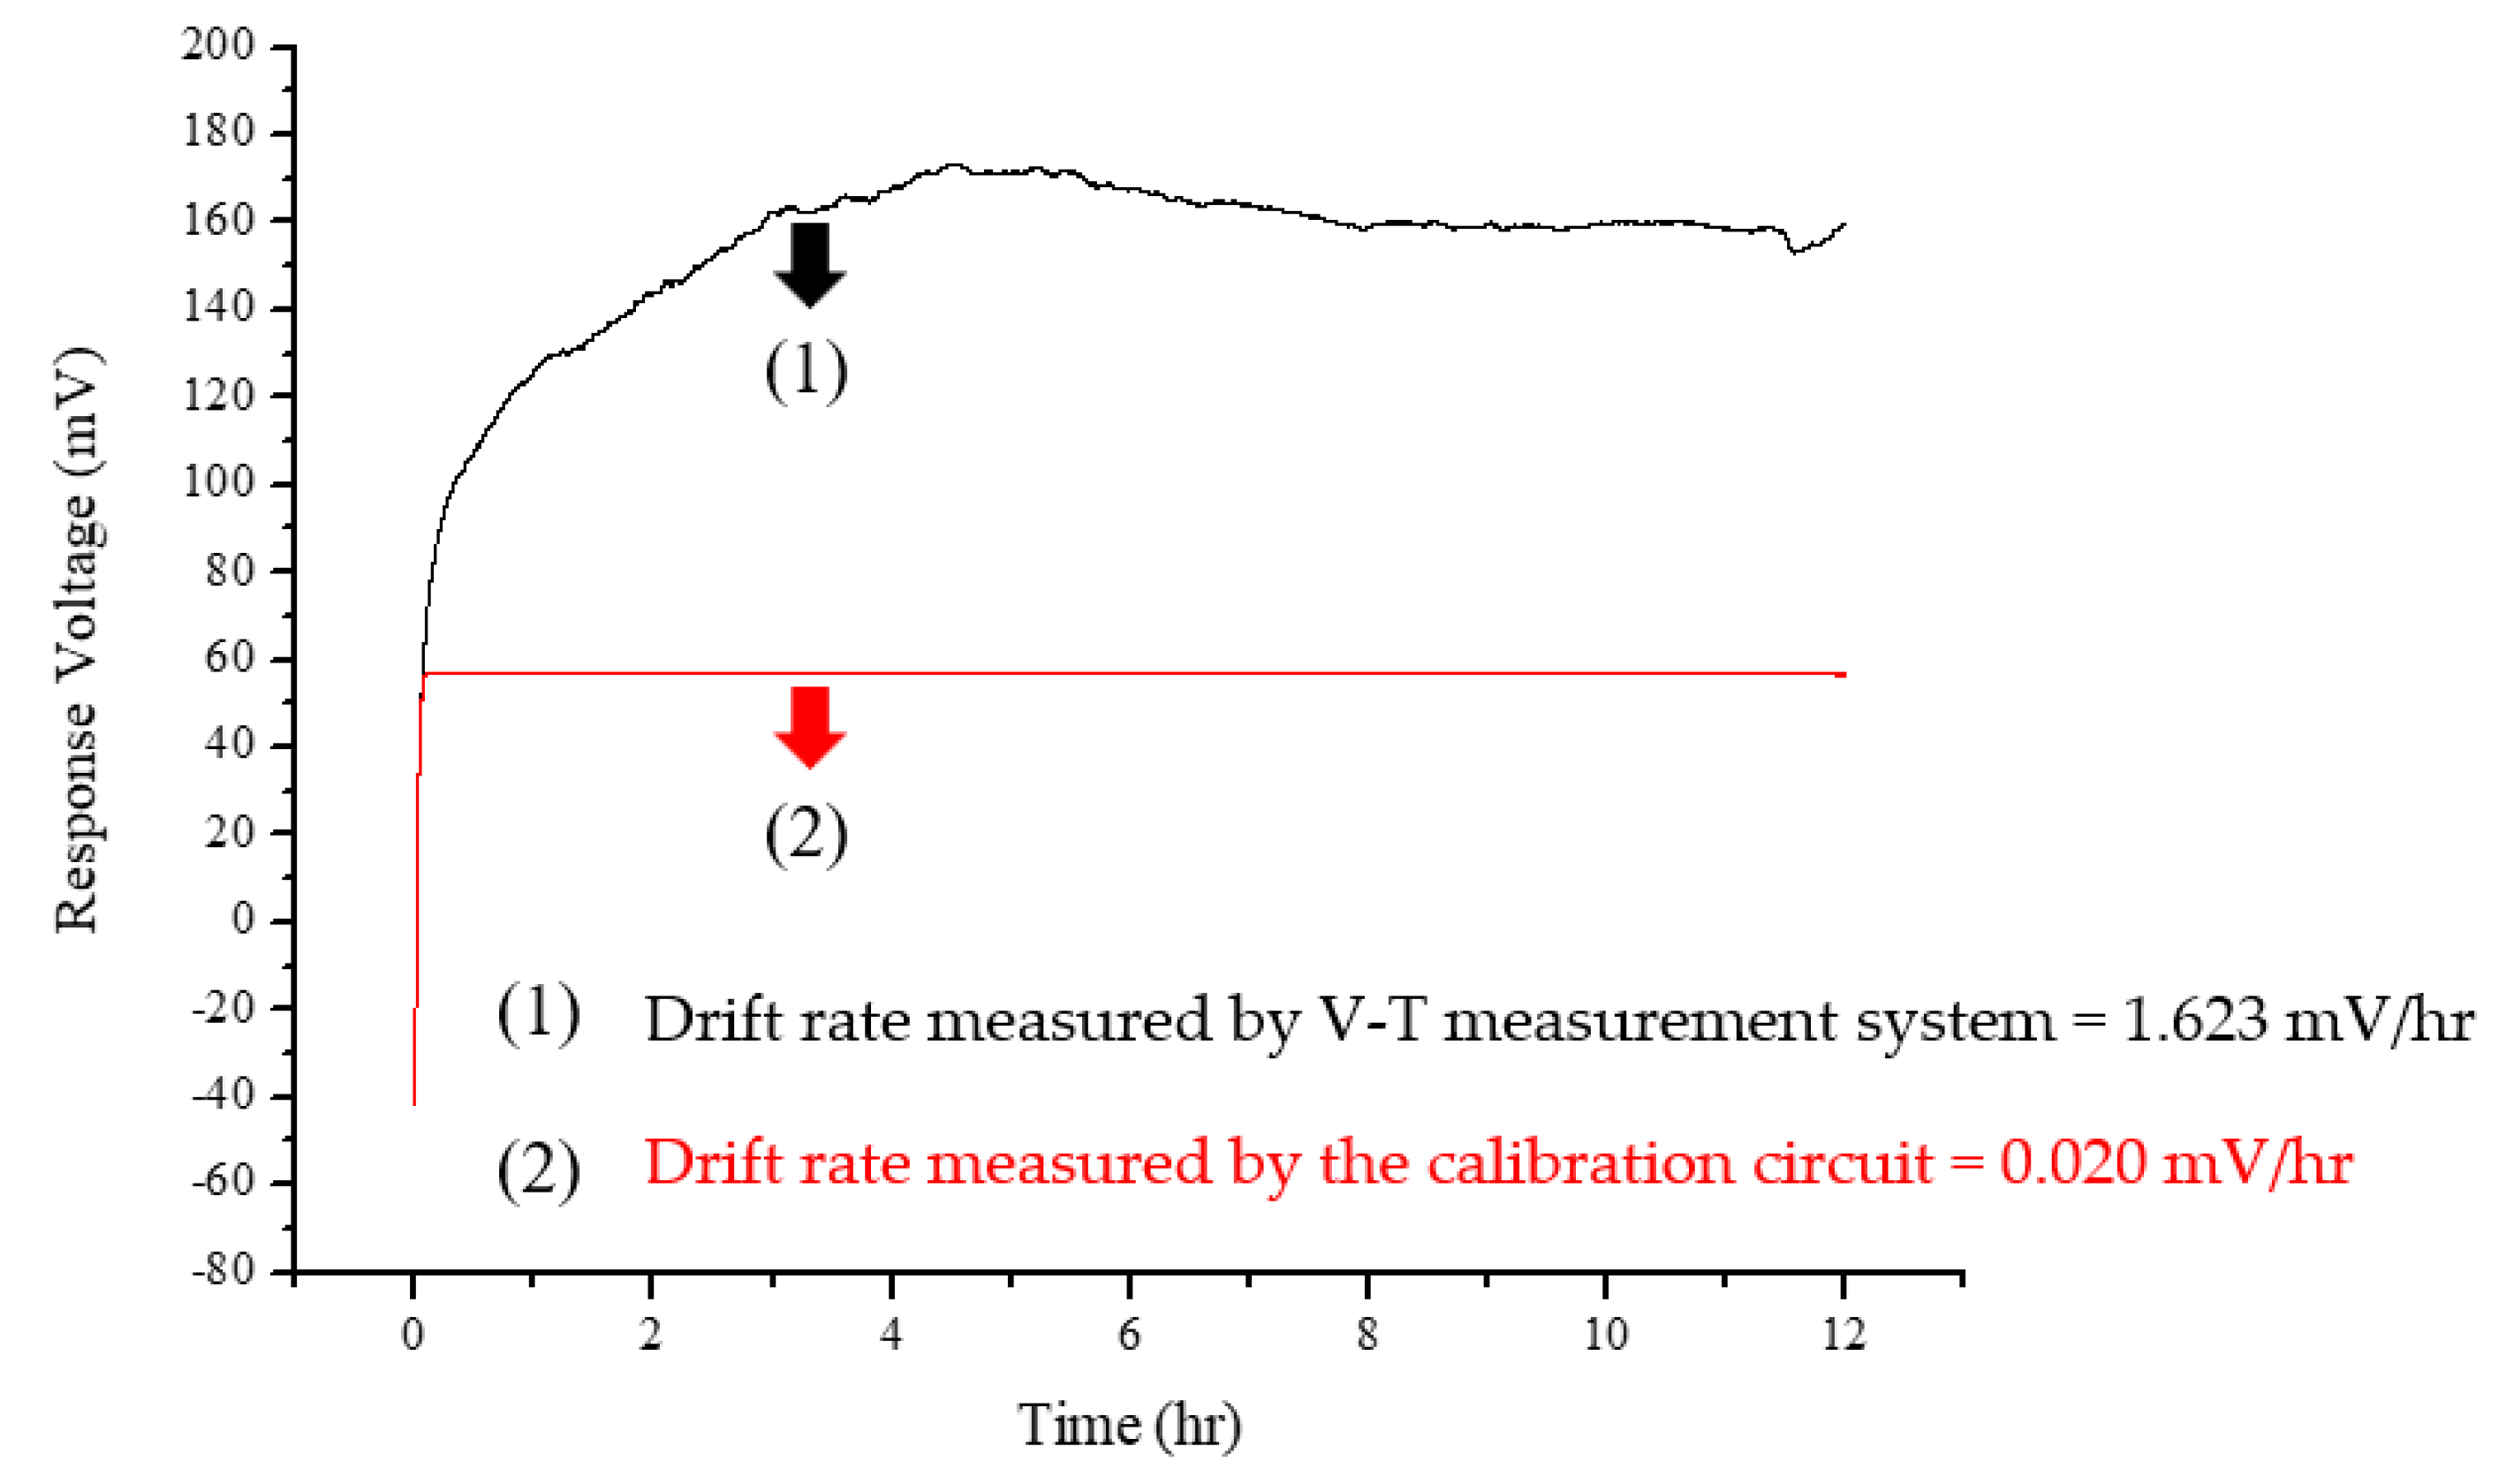
As mentioned, the drift rates in this study were obtained within different time frames which were between the response potential of output node at 5th and 12th h. The result was then divided by 7 h which was the measured time interval. The drift rate, as previously discussed, was calculated using Equation (5). In the drift effect experiment, the RuO2 urea biosensor was immersed into the 40 mg/dL urea test solution for 12 h. The drift effect of the flexible arrayed RuO2 urea biosensor was tested by first, measuring the drift voltage through the conventional V–T measurement system to observe the response-voltage characteristics for 12 h; and by measuring the same RuO2 urea biosensor using the proposed NCC. From the experimental results shown in Figure 9, the drift rate measured by the V–T measurement system was 1.623 mV/hr. By applying the NCC, the drift rate was reduced to 0.02 mV/hr. These experimental results indicate that the proposed NCC reduced the drift rate obtained by the V–T measurement system by 98.77%. This study also compared the drift rate obtained by NCC with that of previous studies and is shown in Table 3.
3.5. Analysis of the Hysteresis Effect of the of the Flexible Arrayed RuO2 Urea Biosensor
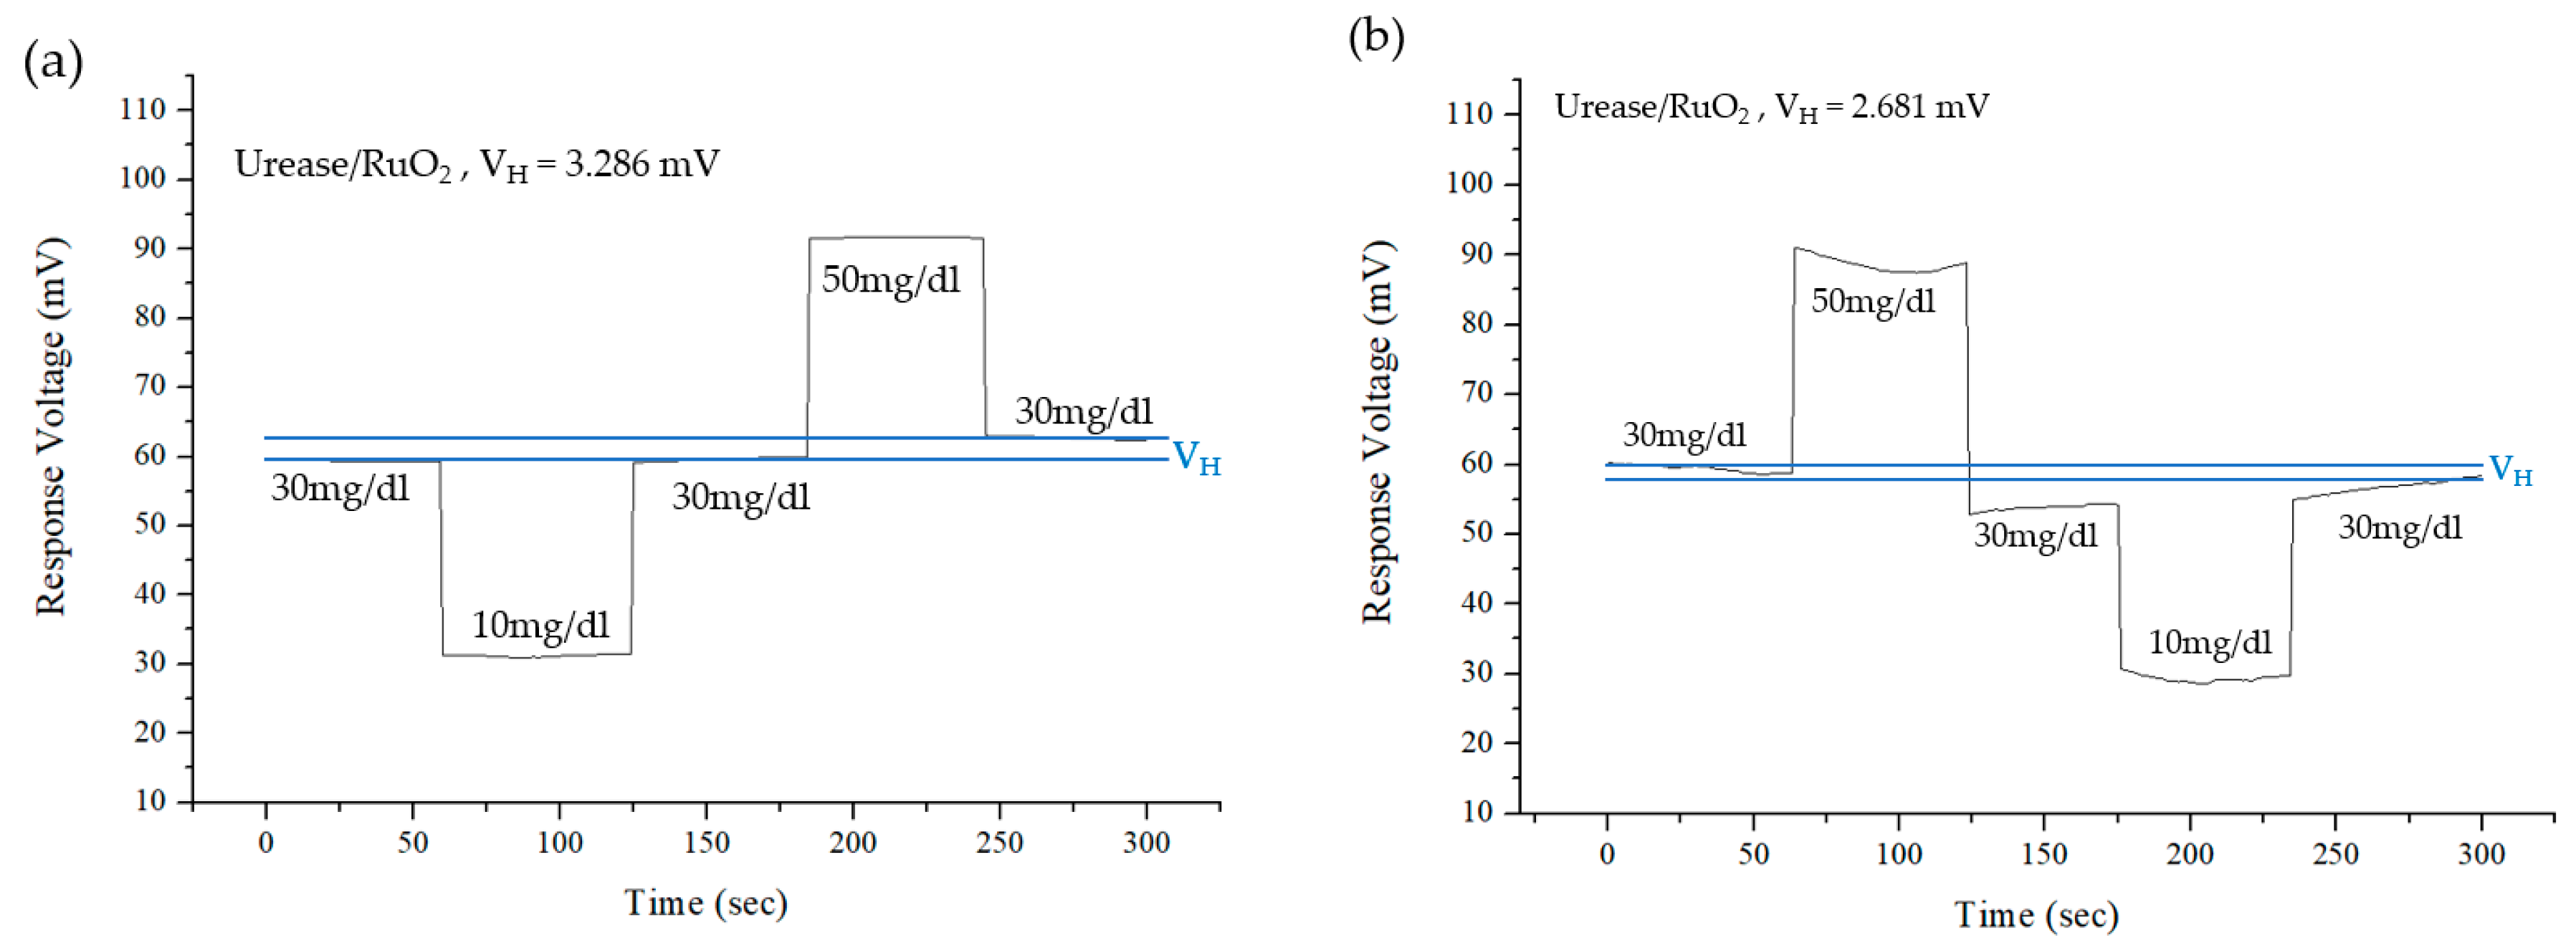
Traditionally, biosensor devices’ readout results are usually recorded more than twice, as with the RuO2 urea biosensor. The concentration of the test solution could be changed after resumption originally buffers solution. There might be a voltage difference during the second time measurement process. This is called the hysteresis voltage [26]. Typically, the hysteresis voltage is due to the change of response potential. The hysteresis effect can be measured by immersing RuO2 sensing films in the loop of urea solutions for 60 s in different urea solutions. Then, the difference of initial and last response voltages of the same urea solution is called hysteresis voltage [26]. The hysteresis effect was measured by immersing the flexible arrayed RuO2 biosensor in a urea solution in the loops of 30 mg/dL → 10 mg/dL → 30 mg/dL → 50 mg/dL→ 30 mg/dL and 30 mg/dL → 50 mg/dL → 30 mg/dL → 10 mg/dL → 30 mg/dL, respectively. Figure 10 shows the hysteresis effects of flexible arrayed RuO2 urea biosensor. From the results, the hysteresis voltages of the RuO2 urea biosensor in the loop 30 mg/dL → 10 mg/dL → 30 mg/dL → 50 mg/dL→ 30 mg/dL was 3.286mV. The hysteresis voltages of the RuO2 urea biosensor in the loop 30 mg/dL → 50 mg/dL → 30 mg/dL → 10 mg/dL → 30 mg/dL was 2.681 mV.
4. Conclusions
This paper proposed a new calibration circuit (NCC) to reduce the drift rate effect of the urea biosensor. A flexible arrayed RuO2 urea biosensor was fabricated which was measured by the voltage–time (V–T) measurement system. The experimental results showed that the RuO2 urea biosensor had an average sensitivity of 1.860 mV/(mg/dL) and a linearity of 0.999. By applying the voltage regulation technique, the proposed NCC reduced the drift rate of the flexible arrayed RuO2 urea biosensor to 0.02mV/hr. These experimental results indicate that the drift rate measured by the NCC was 98.77% lower compared to that of the conventional V–T measurement system. The drift rate measured by the proposed NCC was considerably better than the traditional V–T measurement system. Moreover, the structure of this newly proposed readout circuit is simple and is suitable to apply on different biosensors to reduce non-ideal effects.
Author Contributions
All authors contributed to this research. P.-Y.K. conceived the research idea, developed the proposed calibration circuit, supervised the experiments, and completed the manuscript. Z.-X.D. performed the experiments, tested the proposed circuit, and collected and analyzed the experimental data.
Funding
The authors would like to appreciate the budget support from the Ministry of Science and Technology, Taiwan, under the Grant MOST 107-2221-E-224-030, MOST 108-2221-E-224-020, and MOST 108-2221-E-224-040.
Conflicts of Interest
The authors declare no conflict of interest.
References
- Tyagi, M.; Tomar, M.; Gupta, V. NiO Nanoparticle-Based Urea Biosensor. Biosens. Bioelectron. 2013, 41, 110–115. [Google Scholar] [CrossRef] [PubMed]
- Malhotra, B.D.; Ali, A. Nanomaterials for Biosensors: Fundamentals and Applications; Elsevier: Atlanta, GA, USA, 2017. [Google Scholar]
- Andrianova, M.S.; Kuznetsov, E.V.; Grudtsov, V.P.; Kuznetsov, A.E. CMOS-Compatible Biosensor for L-Carnitine Detection. Biosens. Bioelectron. 2018, 119, 48–54. [Google Scholar] [CrossRef] [PubMed]
- Molinnus, D.; Muschallik, L.; Gonzalez, L.O.; Bongaerts, J.; Wagner, T.; Selmer, T.; Siegert, P.; Keusgen, M.; Schoning, M.J. Development and Characterization of a Field-Effect Biosensor for the Detection of Acetoin. Biosens. Bioelectron. 2018, 115, 1–6. [Google Scholar] [CrossRef] [PubMed]
- Tyagi, M.; Tomar, M.; Gupta, V. Glad Assisted Synthesis of NiO Nanorods for Realization of Enzymatic Reagentless Urea Biosensor. Biosens. Bioelectron. 2014, 52, 196–201. [Google Scholar] [CrossRef]
- Arora, K.; Tomar, M.; Gupta, V. Highly Sensitive and Selective Uric Acid Biosensor Based on RF Sputtered NiO Thin Film. Biosens. Bioelectron. 2011, 30, 333–336. [Google Scholar] [CrossRef]
- Kaur, G.; Tomar, M.; Gupta, V. Nanostructured NiO-Based Reagentless Biosensor for Total Cholesterol and Low-Density Lipoprotein Detection. Anal. Bioanal. Chem. 2017, 409, 1995–2005. [Google Scholar] [CrossRef]
- Bai, J.; Zhou, B. Titanium Dioxide Nanomaterials for Sensor Applications. Chem. Rev. 2014, 114, 10131–10176. [Google Scholar] [CrossRef]
- Wei, L.; Wang, P.; Yang, Y.; Zhan, Z.; Dong, Y.; Songa, W.; Fan, R. Enhanced Performance of the Dye-Sensitized Solar Cells by the Introduction of Graphene Oxide into the TiO2 Photoanode. Inorg. Chem. Front. 2018, 5, 54–62. [Google Scholar] [CrossRef]
- Karunagaran, B.; Uthirakumar, P.; Chung, S.J.; Velumani, S.; Suh, E.K. TiO2 Thin Film Gas Sensor for Monitoring Ammonia. Mater. Charact. 2007, 58, 680–684. [Google Scholar] [CrossRef]
- Nakata, K.; Fujishima, A. TiO2 Photocatalysis: Design and Applications. J. Photochem. Photobiol. 2012, 13, 169–189. [Google Scholar] [CrossRef]
- Alev, O.; Kılıç, A.; Çakırlar, C.; Büyükköse, S.; Öztürk, Z. Gas Sensing Properties of p-Co3O4/n-TiO2 Nanotube Heterostructures. Sensors 2018, 18, 956. [Google Scholar] [CrossRef] [PubMed]
- Addabbo, T.; Fort, A.; Mugnaini, M.; Vignoli, V.; Baldi, A.; Bruzzi, M. Quartz-Crystal Microbalance Gas Sensors Based on TiO2 Nanoparticles. IEEE Trans. Instrum. Meas. 2018, 67, 722–730. [Google Scholar] [CrossRef]
- Mahadeva, S.K.; Kim, J. Porous Tin-Oxide-Coated Regenerated Cellulose as Disposable and Low-Cost Alternative Transducer for Urea Detection. IEEE Sens. J. 2013, 13, 2223–2228. [Google Scholar] [CrossRef]
- Ali, A.; Ansari, A.A.; Kaushik, A.; Solanki, P.R.; Barik, A.; Pandey, M.K.; Malhotra, B.D. Nanostructured Zinc Oxide Film for Urea Sensor. Mater. Lett. 2009, 63, 2473–2475. [Google Scholar] [CrossRef]
- Slaugther, G.A. Gold Interdigitated Microelectrodes Fabricated on Polyhydroxybutyrate Substrate for the Determination of Urea Using Impedimetric Measurements. IEEE Sens. J. 2012, 12, 821–826. [Google Scholar] [CrossRef]
- Ansari, S.G.; Ansari, Z.A.; Seo, H.K.; Kim, G.S.; Kim, Y.S.; Khang, G.; Shin, H.S. Urea Sensor Based on Tin Oxide Thin Films Prepared by Modified Plasma-Enhanced CVD. Sens. Actuators B Chem. 2008, 132, 265–271. [Google Scholar] [CrossRef]
- Chou, N.H.; Chou, J.C.; Sun, T.P.; Hsiung, S.K. Measurement and Comparison of Potentiometric Selectivity Coefficients of Urea Biosensors Based on Ammonium Ion-Selective Electrodes. IEEE Sens. J. 2005, 5, 1362–1368. [Google Scholar] [CrossRef]
- Pan, C.W.; Chou, J.C.; Sun, T.P.; Hsiung, S.K. Solid-State Urea Biosensor Based on the Differential Method. IEEE Sens. J. 2006, 6, 269–275. [Google Scholar]
- Chou, N.H.; Chou, J.C.; Sun, T.P.; Hsiung, S.K. Study on the Disposable Urea Biosensors Based on PVC-COOH Membrane Ammonium Ion-Selective Electrodes. IEEE Sens. J. 2006, 6, 262–268. [Google Scholar] [CrossRef]
- Laurinavicius, V.; Razumiene, J.; Gureviciene, V. Bioelectrochemical Conversion of Urea on Carbon Black Electrode and Application. IEEE Sens. J. 2013, 13, 2208–2213. [Google Scholar] [CrossRef]
- Lee, C.T.; Chiu, Y.S. Gate-Recessed AlGaN/GaN ISFET Urea Biosensor Fabricated by Photoelectrochemical Method. IEEE Sens. J. 2016, 16, 1518–1523. [Google Scholar] [CrossRef]
- Chou, J.C.; Huang, H.Y.; Liao, Y.H.; Lai, C.H.; Yan, S.J.; Wu, C.Y.; Wu, Y.X. The Fabrication and Sensing Characteristics of Flexible Arrayed IGZO/Al Urea Biosensor Modified by Graphene Oxide. IEEE Sens. J. 2017, 16, 958–964. [Google Scholar] [CrossRef]
- Chou, J.C.; Wu, C.Y.; Kuo, P.Y.; Lai, C.H.; Nien, Y.H.; Wu, Y.X.; Lin, S.H.; Liao, Y.H. The Flexible Urea Biosensor Using Magnetic Nanoparticles. IEEE Trans. Nanotechnol. 2019, 18, 484–490. [Google Scholar] [CrossRef]
- Chou, J.C.; Wu, C.Y.; Lin, S.H.; Kuo, P.Y.; Lai, C.H.; Nien, Y.H.; Wu, Y.X.; Lai, T.Y. The Analysis of the Urea Biosensors Using Different Sensing Matrices via a Wireless Measurement system & microfluidic measurement system. Sensors 2019, 19, 2–11. [Google Scholar]
- Chou, J.C.; Yan, S.J.; Liao, Y.H.; Lai, C.H.; Chen, J.S.; Chen, H.Y.; Tseng, T.W.; Wu, T.Y. Characterization of flexible arrayed pH sensor based on nickel oxide films. IEEE Sens. J. 2018, 18, 605–612. [Google Scholar] [CrossRef]
- Chou, J.C.; Wu, C.Y.; Liao, Y.H.; Lai, C.H.; Yan, S.J.; Wu, Y.X.; Lin, S.H. Enzymatic urea sensor based on graphene oxide/titanium dioxide films modified by urease-magnetic beads. IEEE Trans. Nanotechnol. 2019, 18, 336–344. [Google Scholar] [CrossRef]
- Pocrifka, L.A.; Gonçalves, C.; Grossi, P.; Colpa, P.C.; Pereira, E.C. Development of RuO2–TiO2 (70–30) mol % for pH measurements. Sens. Actuators B Chem. 2006, 113, 1012–1016. [Google Scholar] [CrossRef]
- Chiang, J.L.; Jhan, S.S.; Hsieh, S.C.; Huang, A.L. Hydrogen ion sensors based on indium tin oxide thin film using radio frequency sputtering system. Thin Solid Films 2009, 517, 4805–4809. [Google Scholar] [CrossRef]
- Adeyemo, A.; Hunter, G.; Dutta, P.K. Interaction of CO with hydrous ruthenium oxide and development of a chemoresistive ambient CO sensor. Sens. Actuators B Chem. 2011, 152, 307–315. [Google Scholar] [CrossRef]
- Chou, J.C.; Lin, C.Y.; Liao, Y.H.; Chen, J.T.; Tsai, Y.L.; Chen, J.L.; Chou, H.T. Data fusion and fault diagnosis for flexible arrayed pH sensor measurement system based on LabVIEW. IEEE Sens. J. 2014, 14, 1405–1411. [Google Scholar] [CrossRef]
- Tseng, S.C.; Wu, T.Y.; Chou, J.C.; Liao, Y.H.; Lai, C.H.; Yan, S.J.; Tseng, T.W. Investigation of sensitivities and drift effects of the arrayed flexible chloride sensor based on RuO2/GO at different temperatures. Sensors 2018, 18, 632. [Google Scholar] [CrossRef] [PubMed]
- Tseng, S.C.; Wu, T.Y.; Chou, J.C.; Liao, Y.H.; Lai, C.H.; Yan, S.J.; Tseng, T.W. Investigation of sensing characteristic of flexible arrayed RuO2 chlorine ion sensor modified by graphene oxide. Sens. Actuators B Chem. 2006, 113, 1012–1016. [Google Scholar] [CrossRef]
- Kuo, P.Y.; Lian, Z.L. NCRC to improve linearity and sensitivity for RuO2 urea biosensor sensing measurement. Electron. Lett. 2019, 55, 1076–1078. [Google Scholar] [CrossRef]
- Zhong, Y.; Zhao, S.; Liu, T. Drift characteristics of pH-ISFET output. Chin. J. Semicond. 1994, 12, 838–843. [Google Scholar]
- Forootan, A.; Sjöback, R.; Björkman, J.; Sjögreen, B.; Linz, L.; Kubista, M. Methods to determine limit of detection and limit of quantification in quantitative real-time PCR (qPCR). Biomol. Detect. Quantif. 2017, 12, 1–6. [Google Scholar] [CrossRef]
- Rajakovic, L.V.; Marković, D.D.; Rajaković-Ognjanović, V.N.; Antanasijević, D.Z. Review: The approaches for estimation of limit of detection for ICP-MS trace analysis of arsenic. Talanta 2012, 102, 79–87. [Google Scholar] [CrossRef]
- Prats-Alfonso, E.; Abad, L.; Casan-Pastor, N.; Gonzalo-Ruiz, J.; Baldrich, E. Iridium oxide pH sensor for biomedical applications. case urea– urease in real urine samples. Biosens. Bioelectron. 2013, 39, 163–169. [Google Scholar] [CrossRef]
- Jakhar, S.; Pundir, C.S. Preparation, characterization and application of urease nanoparticles for construction of an improved potentiometric urea biosensor. Biosens. Bioelectron. 2018, 100, 242–250. [Google Scholar] [CrossRef]
Figure 1.
(a) The structure diagram of the flexible arrayed RuO2 urea biosensor, and (b) top view of the completed flexible arrayed RuO2 urea biosensor.
Figure 1.
(a) The structure diagram of the flexible arrayed RuO2 urea biosensor, and (b) top view of the completed flexible arrayed RuO2 urea biosensor.

Figure 2.
The schematic diagram of the traditional V–T measurement system [32].
Figure 2.
The schematic diagram of the traditional V–T measurement system [32].

Figure 3.
The actual V–T measurement system. (a) DC power supply. (b) Readout circuit. (c) Urea solution and urea biosensor. (d) Data acquisition (DAQ) device. (e) Computer.
Figure 3.
The actual V–T measurement system. (a) DC power supply. (b) Readout circuit. (c) Urea solution and urea biosensor. (d) Data acquisition (DAQ) device. (e) Computer.

Figure 4.
The structure diagram of the proposed new calibration circuit (NCC).

Figure 5.
The implementation of the proposed calibration circuit.

Figure 6.
The results of the sensing measurement of the flexible arrayed RuO2 urea biosensor.

Figure 7.
The response time of the flexible arrayed RuO2 urea biosensor.

Figure 8.
The result of the interference effect for flexible arrayed RuO2 urea biosensor.

Figure 9.
The drift effect experiment results in the flexible arrayed RuO2 urea biosensor.

Figure 10.
Hysteresis effect of the flexible arrayed RuO2 urea biosensor. (a) 30 mg/dL→10 mg/dL→.30 mg/dL→50 mg/dL→30 mg/dL and (b) 30 mg/dL→50 mg/dL→30 mg/dL→10 mg/dL→30 mg/dL.
Figure 10.
Hysteresis effect of the flexible arrayed RuO2 urea biosensor. (a) 30 mg/dL→10 mg/dL→.30 mg/dL→50 mg/dL→30 mg/dL and (b) 30 mg/dL→50 mg/dL→30 mg/dL→10 mg/dL→30 mg/dL.


Table 1.
The sensing characteristics of the flexible arrayed RuO2 urea biosensors over a urea concentration ranging from 10 mg/dL to 50 mg/dL.
Table 1.
The sensing characteristics of the flexible arrayed RuO2 urea biosensors over a urea concentration ranging from 10 mg/dL to 50 mg/dL.
| Membrane | Urea Concentration (mg/dL) | Response Voltage (mV) (Mean ± SD) | Average Sensitivity (mV/(mg/dL)) | Linearity | LOD (mg/dL) |
|---|---|---|---|---|---|
| Urease/RuO2 | 10 | 73.49 ± 2.06 | 1.860 | 0.999 | 1.345 |
| 20 | 92.26 ± 3.46 | ||||
| 30 | 111.48 ± 4.08 | ||||
| 40 | 131.63 ± 5.96 | ||||
| 50 | 147.14 ± 3.76 |
Table 2.
Comparisons of the sensing properties of urea biosensors with various sensing films.
| Sensing membrane | Liner Range (mg/dL) | Average Sensitivity (mV/(mg/dL)) | Linearity | Limit of Detection (LOD) | Reference |
|---|---|---|---|---|---|
| Urease/RuO2 | 10–50 | 1.860 | 0.999 | 1.345 mg/dL (0.239 mM) | This work |
| SnO2 | 5–80 | 1.980 | 0.976 | − | [19] 2006 |
| Magnetic microparticles-Urease/ Iridium oxide/Pt | 0–7.5 | 1.964 | 0.997 | 78 μM | [38] 2013 |
| Preparation, characterization, and application of urease nanoparticles for construction of an improved potentiometric urea biosensor | 0.012–0.480 | 1.001 | 0.999 | 1 μmol/L | [39] 2018 |
| Urease-MBs/GO/NiO | 10–50 | 6.343 | 0.960 | 1.338 mg/dL (0.223 mM) | [24] 2019 |
| Urease/TiO2 | 10–50 | 1.445 | 0.977 | − | [27] 2019 |
| Urease/RuO2 | 10–50 | 1.220 | 0.956 | − | [34] 2019 |
Table 3.
Comparison of drift rates of urea biosensor with different sensing membranes.
| Sensing Membrane | Drift Rate (mV/hr) | Reference |
|---|---|---|
| RuO2 measured by NCC (the proposed new calibration circuit) | 0.02 | This work |
| RuO2 measured by (the V–T measurement system) | 1.623 | This work |
| Urease-MBs/GO/NiO | 1.551 | [24] 2019 |
| MBs-Urease/GO/TiO2 | 4.395 | [27] 2019 |
© 2019 by the authors. Licensee MDPI, Basel, Switzerland. This article is an open access article distributed under the terms and conditions of the Creative Commons Attribution (CC BY) license (http://creativecommons.org/licenses/by/4.0/).
Share and Cite
MDPI and ACS Style
Kuo, P.-Y.; Dong, Z.-X. A New Calibration Circuit Design to Reduce Drift Effect of RuO2 Urea Biosensors. Sensors 2019, 19, 4558. https://0-doi-org.brum.beds.ac.uk/10.3390/s19204558
AMA Style
Kuo P-Y, Dong Z-X. A New Calibration Circuit Design to Reduce Drift Effect of RuO2 Urea Biosensors. Sensors. 2019; 19(20):4558. https://0-doi-org.brum.beds.ac.uk/10.3390/s19204558
Chicago/Turabian StyleKuo, Po-Yu, and Zhe-Xin Dong. 2019. "A New Calibration Circuit Design to Reduce Drift Effect of RuO2 Urea Biosensors" Sensors 19, no. 20: 4558. https://0-doi-org.brum.beds.ac.uk/10.3390/s19204558
Note that from the first issue of 2016, this journal uses article numbers instead of page numbers. See further details here.