A Critical Evaluation of Vibrational Stark Effect (VSE) Probes with the Local Vibrational Mode Theory

 , ,
, ,
Abstract
:1. Introduction
- The vibrational frequency shift arising from changes in the vicinal environment of the probe molecule can be fully attributed to the external electric field. This is the basic foundation for using the VSE as a tool to characterize non-covalent interactions;
- The difference dipole moment in Equation (1) is unaffected by the external electric field , so that the vibrational frequency shift responds to in a linear fashion;
- The linear relationship between vibrational frequency and the electric field, observed for a relatively weak electric field strength (in the order of 1 MV/cm) will also hold for the binding pocket of proteins, where the effective electric field caused by the enzyme environment could be a hundred times stronger.
2. Methodology
3. Computational Details
4. Results and Discussion
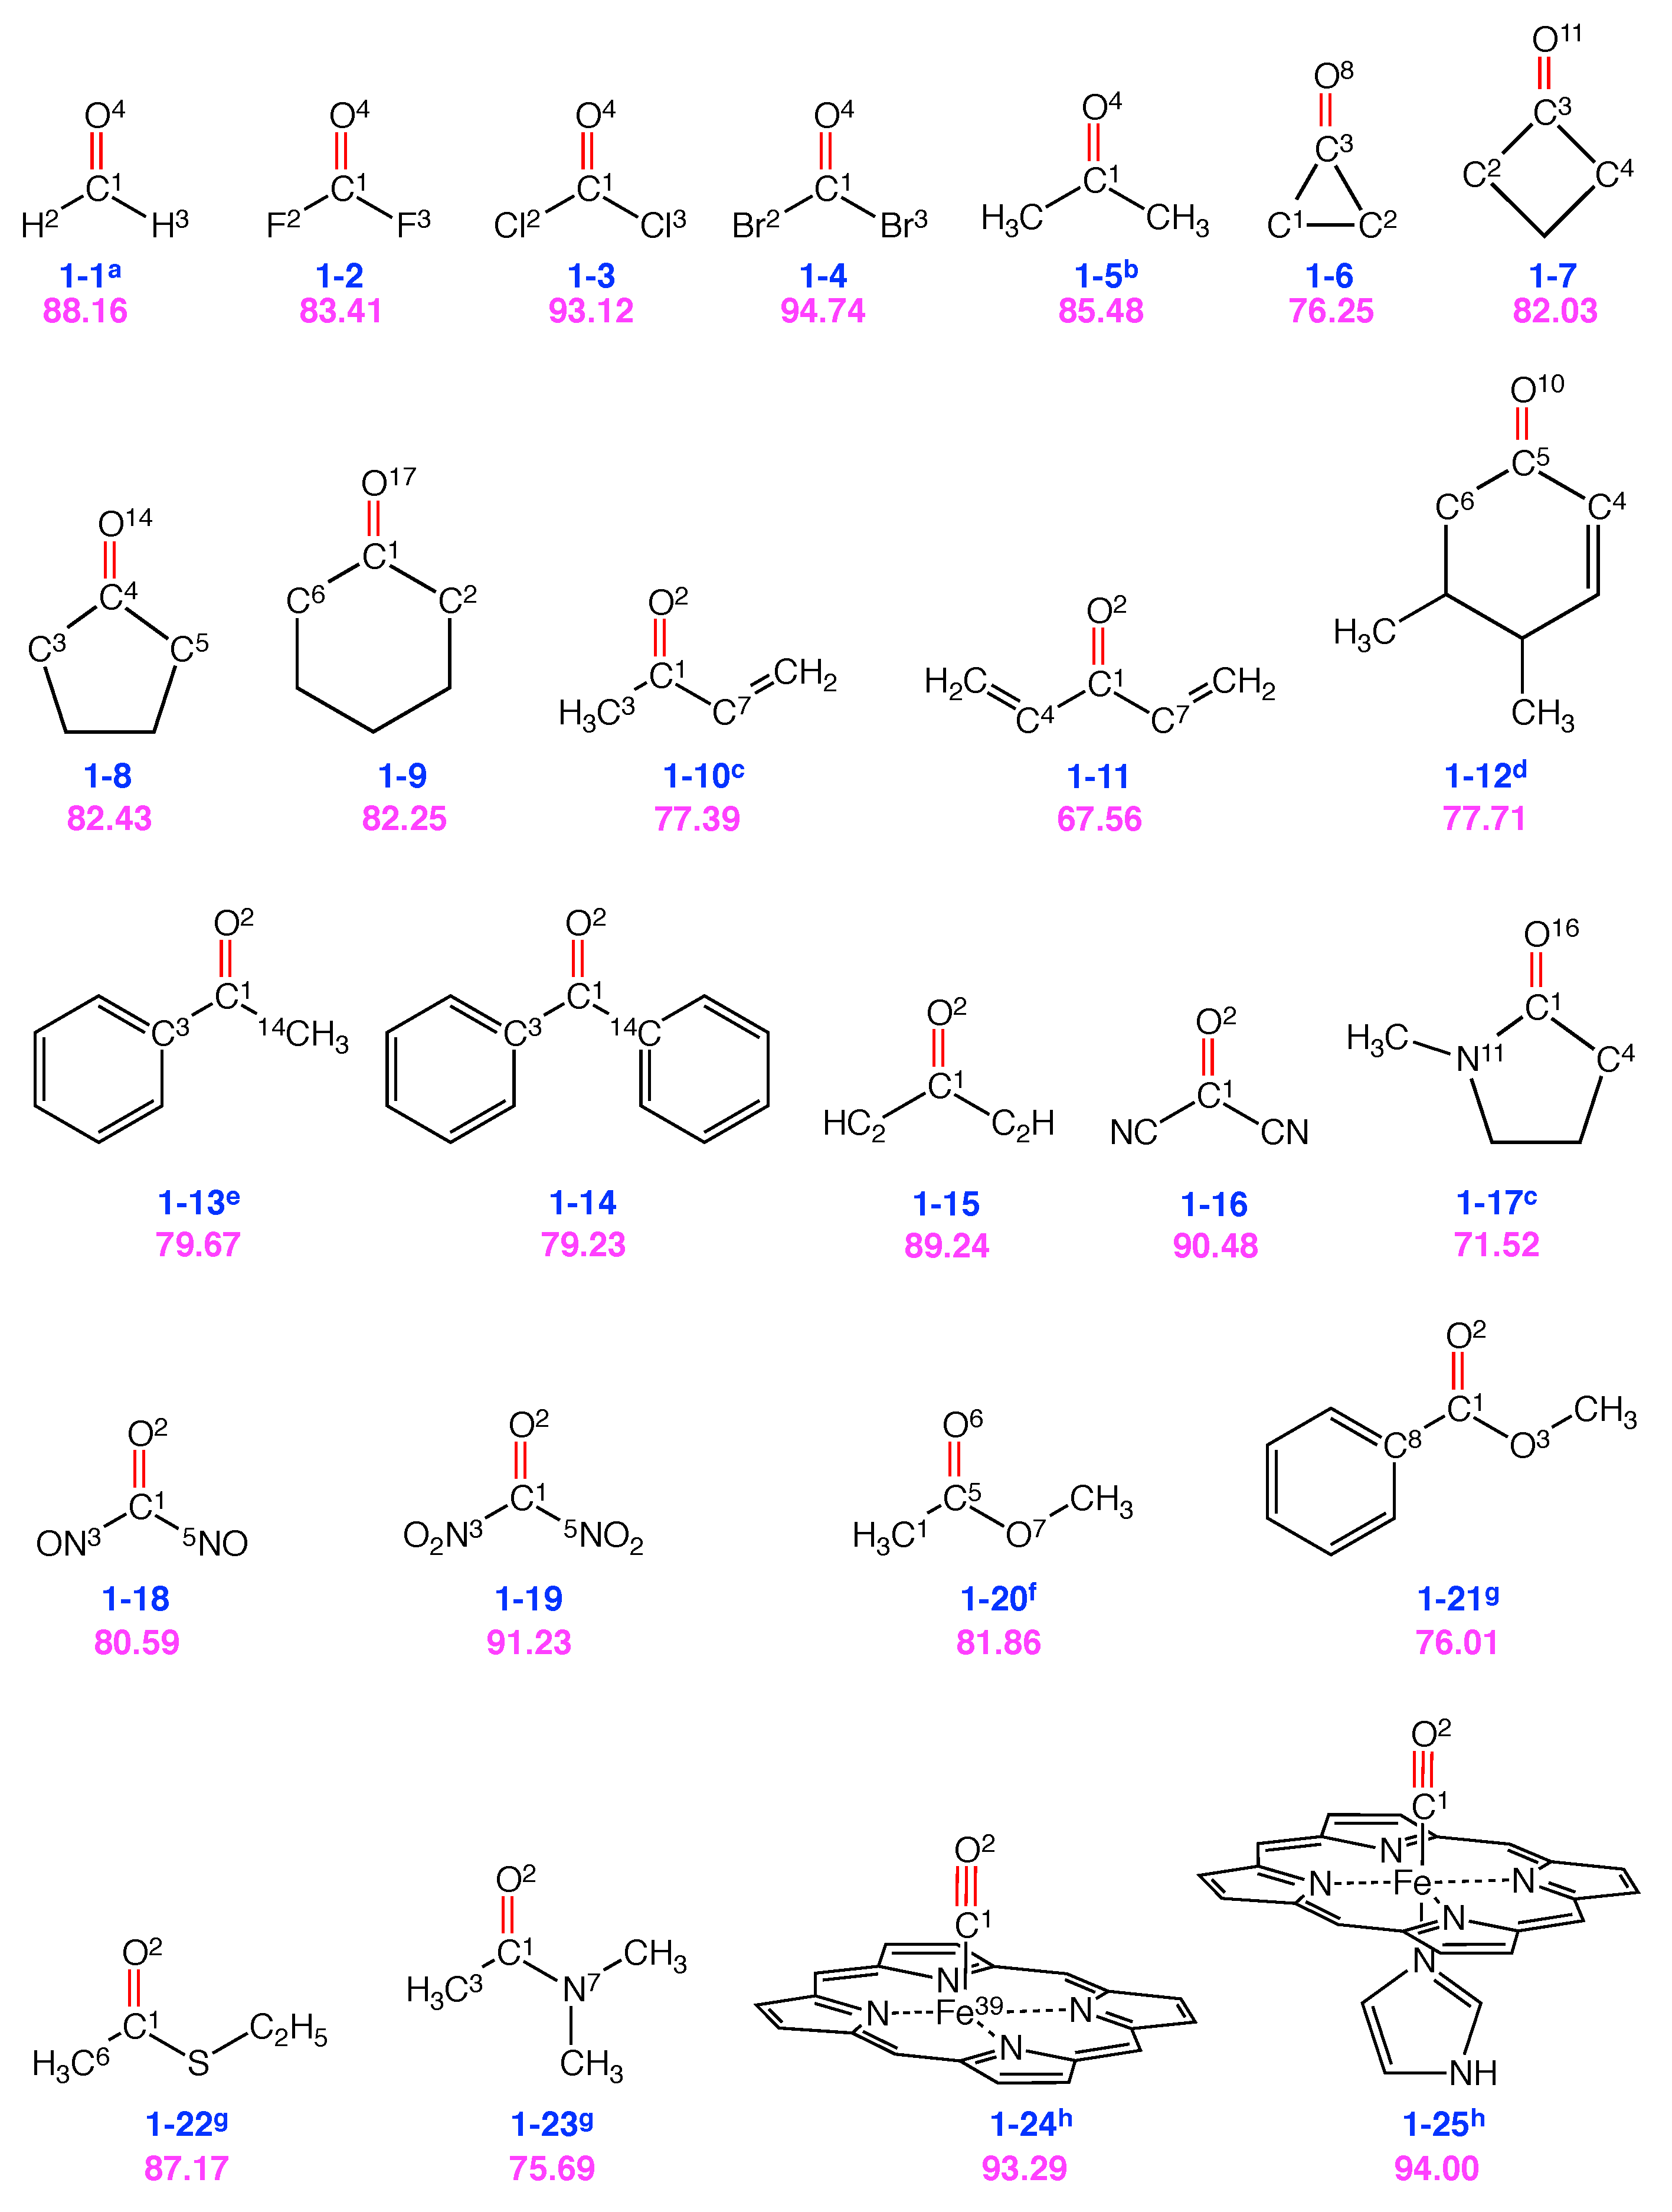
4.1. Group 1: C=O/C≡O Probes
4.2. Groups 2 and 3: C≡N and S=O Probes
4.3. Group 4: Vibrational Probes with Miscellaneous Bonds
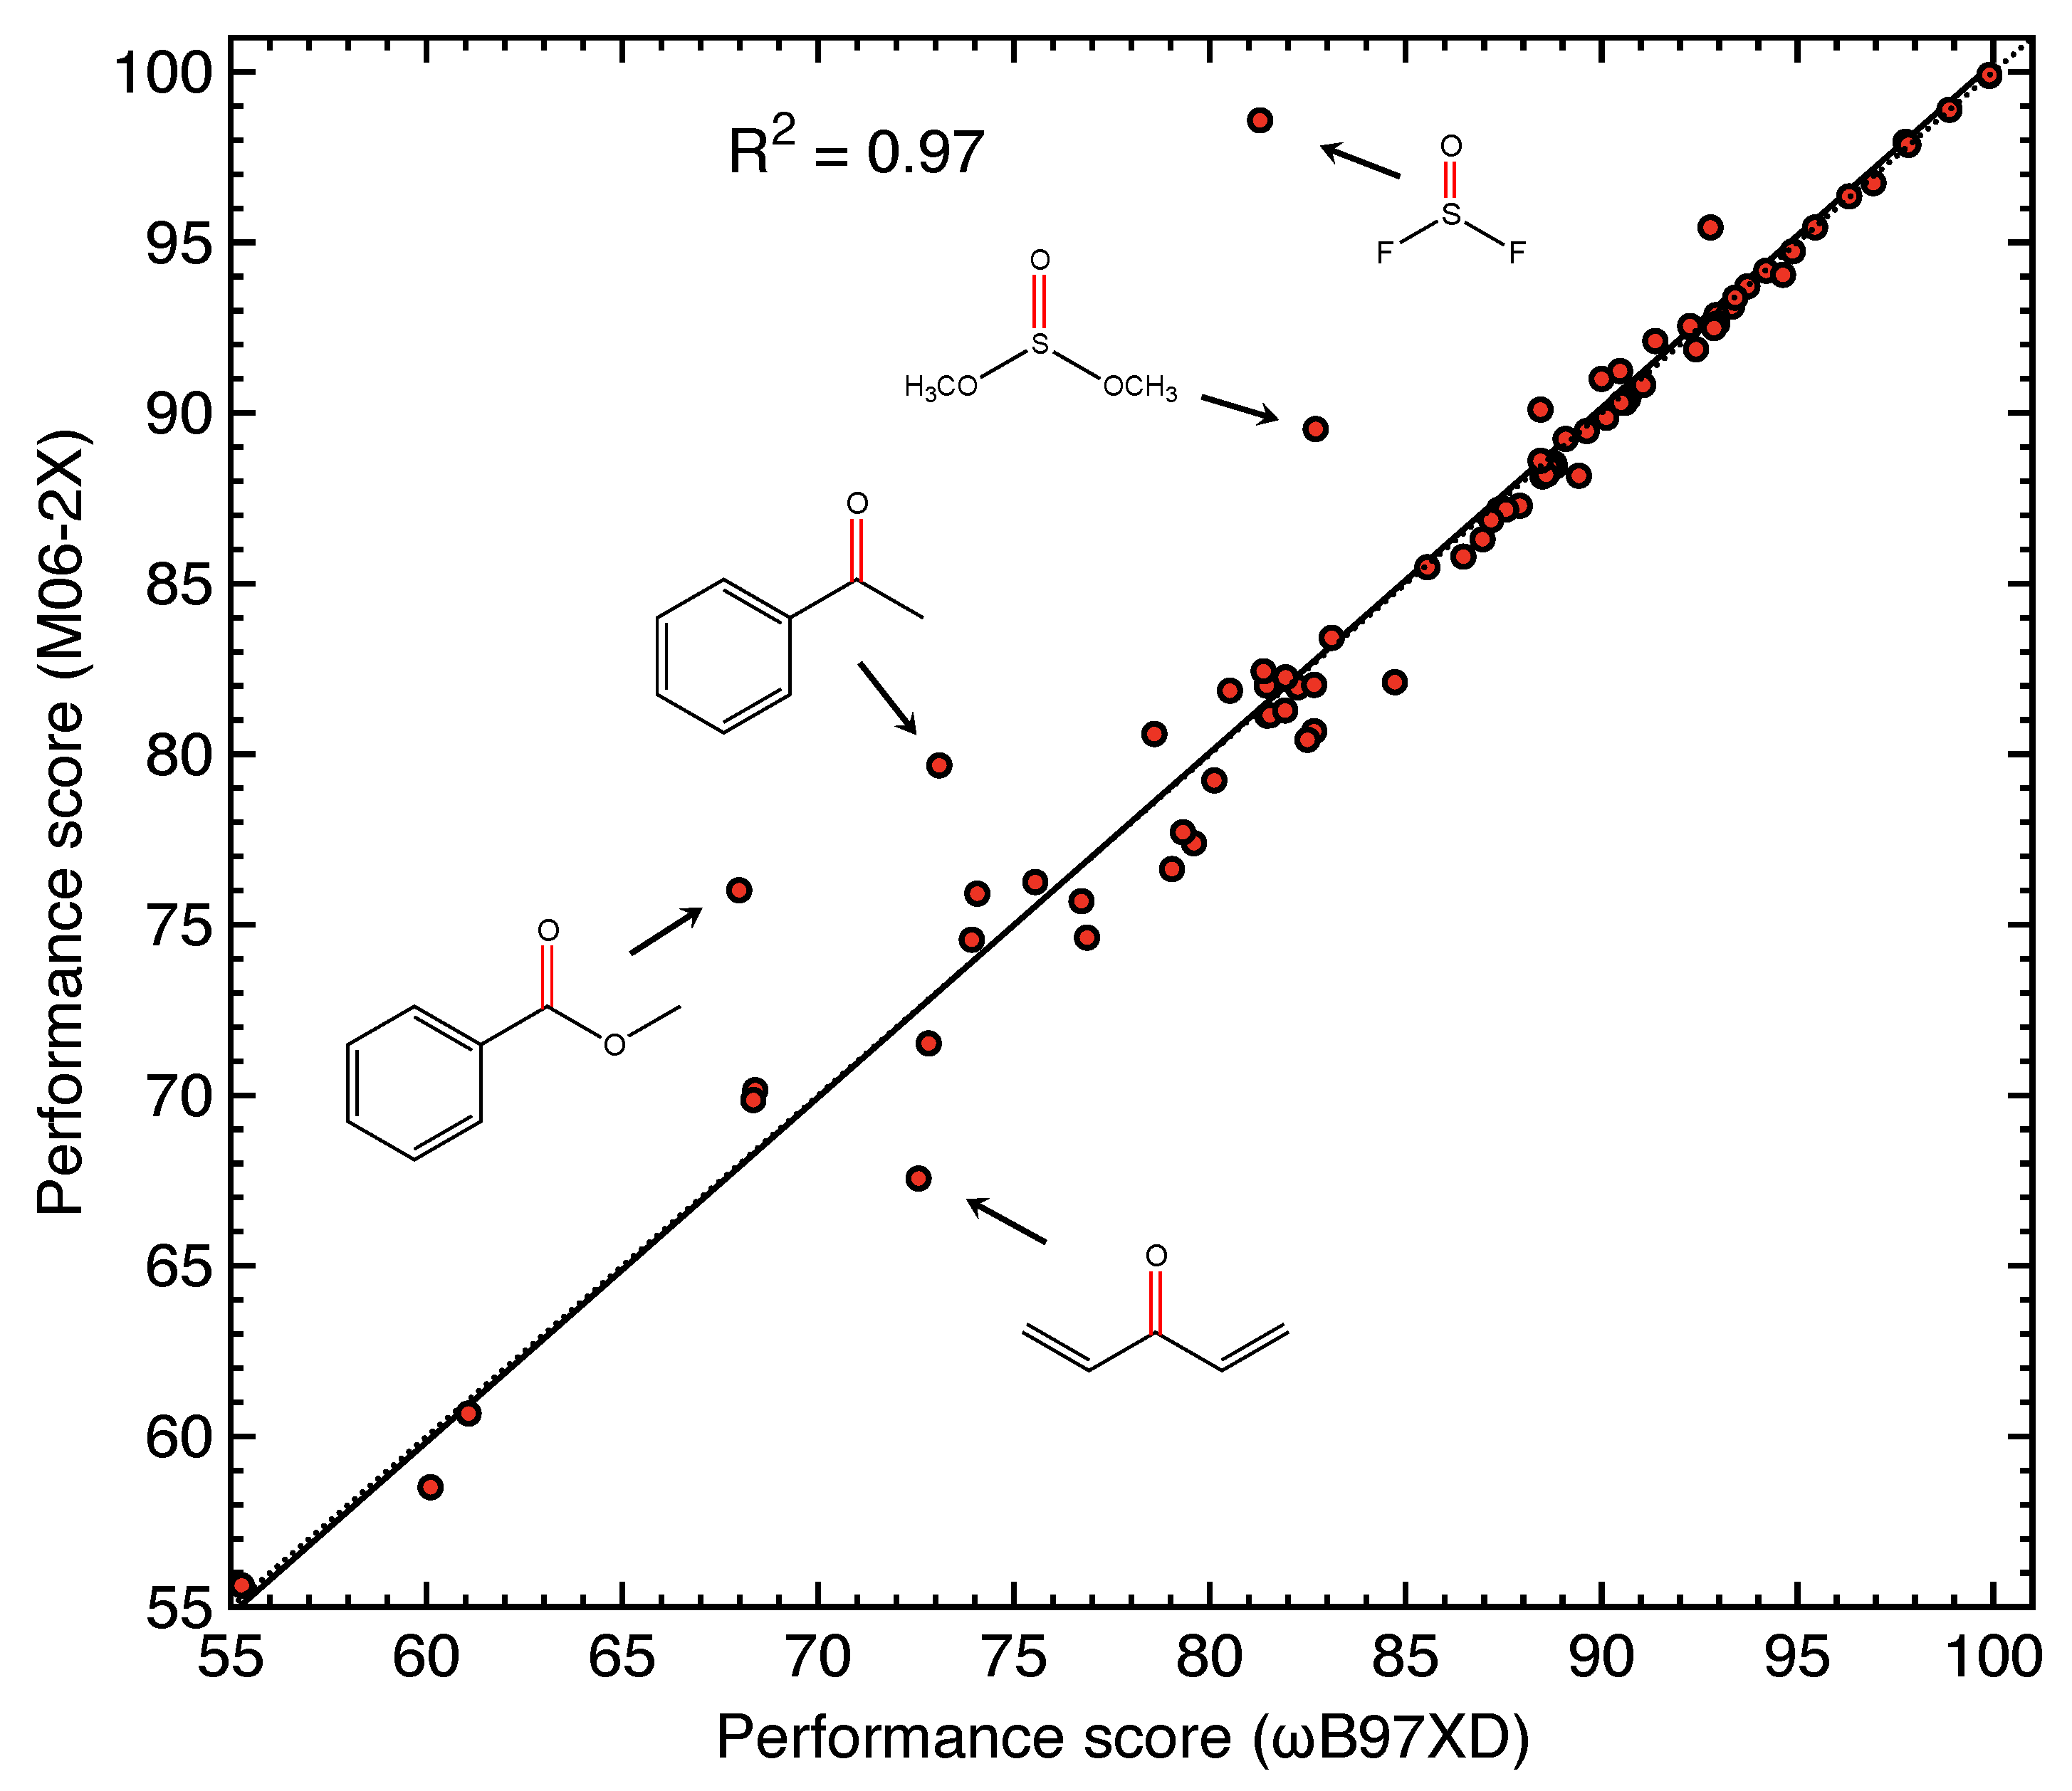
4.4. Sensitivity of Performance Score to Density Functional
4.5. Suggestion on Ideal Vibrational Probes
5. Conclusions
Supplementary Materials
Author Contributions
Funding
Acknowledgments
Conflicts of Interest
Abbreviations
| VSE | Vibrational Stark Effect |
| VSS | Vibrational Stark Spectroscopy |
| CNM | Characterization of Normal Mode |
| PED | Potential Energy Distribution |
| DFT | Density Functional Theory |
References
- Stark, J. Observation of the Separation of Spectral Lines by an Electric Field. Nature 1913, 92, 401. [Google Scholar] [CrossRef] [Green Version]
- Chattopadhyay, A.; Boxer, S.G. Vibrational Stark Effect Spectroscopy. J. Am. Chem. Soc. 1995, 117, 1449–1450. [Google Scholar] [CrossRef]
- Bublitz, G.U.; Boxer, S.G. Stark Spectroscopy: Applications in Chemistry, Biology, and Materials Science. Annu. Rev. Phys. Chem. 1997, 48, 213–242. [Google Scholar] [CrossRef] [PubMed] [Green Version]
- Boxer, S.G. Stark Realities. J. Phys. Chem. B 2009, 113, 2972–2983. [Google Scholar] [CrossRef] [PubMed]
- Fried, S.D.; Boxer, S.G. Measuring Electric Fields and Noncovalent Interactions Using the Vibrational Stark Effect. Acc. Chem. Res. 2015, 48, 998–1006. [Google Scholar] [CrossRef] [PubMed]
- Ma, J.; Pazos, I.M.; Zhang, W.; Culik, R.M.; Gai, F. Site-Specific Infrared Probes of Proteins. Annu. Rev. Phys. Chem. 2015, 66, 357–377. [Google Scholar] [CrossRef] [PubMed] [Green Version]
- Fried, S.D.; Boxer, S.G. Electric Fields and Enzyme Catalysis. Annu. Rev. Biochem. 2017, 86, 387–415. [Google Scholar] [CrossRef]
- Adhikary, R.; Zimmermann, J.; Romesberg, F.E. Transparent Window Vibrational Probes for the Characterization of Proteins With High Structural and Temporal Resolution. Chem. Rev. 2017, 117, 1927–1969. [Google Scholar] [CrossRef]
- Błasiak, B.; Londergan, C.H.; Webb, L.J.; Cho, M. Vibrational Probes: From Small Molecule Solvatochromism Theory and Experiments to Applications in Complex Systems. Acc. Chem. Res. 2017, 50, 968–976. [Google Scholar] [CrossRef]
- Slocum, J.D.; Webb, L.J. Measuring Electric Fields in Biological Matter Using the Vibrational Stark Effect of Nitrile Probes. Annu. Rev. Phys. Chem. 2018, 69, 253–271. [Google Scholar] [CrossRef] [Green Version]
- Welborn, V.V.; Head-Gordon, T. Computational Design of Synthetic Enzymes. Chem. Rev. 2018, 119, 6613–6630. [Google Scholar] [CrossRef] [Green Version]
- Staffa, J.K.; Lorenz, L.; Stolarski, M.; Murgida, D.H.; Zebger, I.; Utesch, T.; Kozuch, J.; Hildebrandt, P. Determination of The Local Electric Field at Au/SAM Interfaces Using the Vibrational Stark Effect. J. Phys. Chem. C 2017, 121, 22274–22285. [Google Scholar] [CrossRef]
- Fried, S.D.; Bagchi, S.; Boxer, S.G. Measuring Electrostatic Fields in Both Hydrogen-Bonding and Non-Hydrogen-Bonding Environments Using Carbonyl Vibrational Probes. J. Am. Chem. Soc. 2013, 135, 11181–11192. [Google Scholar] [CrossRef] [PubMed] [Green Version]
- Laberge, M.; Sharp, K.A.; Vanderkooi, J.M. Protein Electric Field Effects on the CO Stretch Frequency of Carbonmonoxycytochromes c as a Function of Carbonyl Tilting and Bending Investigated with a Continuum Electrostatic Approach. J. Phys. Chem. B 1997, 101, 7364–7367. [Google Scholar] [CrossRef]
- Phillips, G.N.J.; Teodoro, M.; Li, T.; Smith, B.; Gilson, M.M.; Olson, J.S. Bound CO is A Molecular Probe of Electrostatic Potential in the Distal Pocket of Myoglobin. J. Phys. Chem. B 1999, 103, 8817–8829. [Google Scholar] [CrossRef]
- Park, E.S.; Andrews, S.S.; Hu, R.B.; Boxer, S.G. Vibrational Stark Spectroscopy in Proteins: A Probe and Calibration for Electrostatic Fields. J. Phys. Chem. B 1999, 103, 9813–9817. [Google Scholar] [CrossRef]
- Park, E.S.; Thomas, M.R.; Boxer, S.G. Vibrational Stark Spectroscopy of NO Bound to Heme: Effects of Protein Electrostatic Fields on the NO Stretch Frequency. J. Am. Chem. Soc. 2000, 122, 12297–12303. [Google Scholar] [CrossRef]
- Suydam, I.T.; Boxer, S.G. Vibrational Stark Effects Calibrate the Sensitivity of Vibrational Probes for Electric Fields in Proteins. Biochemistry 2003, 42, 12050–12055. [Google Scholar] [CrossRef]
- Webb, L.J.; Boxer, S.G. Electrostatic Fields Near the Active Site of Human Aldose Reductase: 1. New Inhibitors and Vibrational Stark Effect Measurements. Biochemistry 2008, 47, 1588–1598. [Google Scholar] [CrossRef] [Green Version]
- Lindquist, B.A.; Furse, K.E.; Corcelli, S.A. Nitrile Groups as Vibrational Probes of Biomolecular Structure and Dynamics: An Overview. Phys. Chem. Chem. Phys. 2009, 11, 8119. [Google Scholar] [CrossRef]
- Walker, D.M.; Wang, R.; Webb, L.J. Conserved Electrostatic Fields at the Ras-effector Interface Measured through Vibrational Stark Effect Spectroscopy Explain the Difference in Tilt Angle in the Ras Binding Domains of Raf and RalGDS. Phys. Chem. Chem. Phys. 2014, 16, 20047–20060. [Google Scholar] [CrossRef] [PubMed]
- Fried, S.D.; Bagchi, S.; Boxer, S.G. Extreme Electric Fields Power Catalysis in the Active Site of Ketosteroid Isomerase. Science 2014, 346, 1510–1514. [Google Scholar] [CrossRef] [PubMed] [Green Version]
- Ritchie, A.W.; Webb, L.J. Understanding and Manipulating Electrostatic Fields at the Protein-Protein Interface Using Vibrational Spectroscopy and Continuum Electrostatics Calculations. J. Phys. Chem. B 2015, 119, 13945–13957. [Google Scholar] [CrossRef]
- Mohrmann, H.; Kube, I.; Lórenz-Fonfría, V.A.; Engelhard, M.; Heberle, J. Transient Conformational Changes of Sensory Rhodopsin II Investigated by Vibrational Stark Effect Probes. J. Phys. Chem. B 2016, 120, 4383–4387. [Google Scholar] [CrossRef]
- Wu, Y.; Boxer, S.G. A Critical Test of the Electrostatic Contribution to Catalysis with Noncanonical Amino Acids in Ketosteroid Isomerase. J. Am. Chem. Soc. 2016, 138, 11890–11895. [Google Scholar] [CrossRef] [PubMed] [Green Version]
- Schneider, S.H.; Boxer, S.G. Vibrational Stark Effects of Carbonyl Probes Applied to Reinterpret IR and Raman Data for Enzyme Inhibitors in Terms of Electric Fields at the Active Site. J. Phys. Chem. B 2016, 120, 9672–9684. [Google Scholar] [CrossRef] [PubMed]
- Deb, P.; Haldar, T.; Kashid, S.M.; Banerjee, S.; Chakrabarty, S.; Bagchi, S. Correlating Nitrile IR Frequencies to Local Electrostatics Quantifies Noncovalent Interactions of Peptides and Proteins. J. Phys. Chem. B 2016, 120, 4034–4046. [Google Scholar] [CrossRef] [Green Version]
- Zoi, I.; Antoniou, D.; Schwartz, S.D. Electric Fields and Fast Protein Dynamics in Enzymes. J. Phys. Chem. Lett. 2017, 8, 6165–6170. [Google Scholar] [CrossRef]
- Voller, J.S.; Biava, H.; Hildebrandt, P.; Budisa, N. An Expanded Genetic Code for Probing the Role of Electrostatics in Enzyme Catalysis by Vibrational Stark Spectroscopy. Biochim. Biophys. Acta 2017, 1861, 3053–3059. [Google Scholar] [CrossRef]
- Xu, R.J.; Blasiak, B.; Cho, M.; Layfield, J.P.; Londergan, C.H. A Direct, Quantitative Connection between Molecular Dynamics Simulations and Vibrational Probe Line Shapes. J. Phys. Chem. Lett. 2018, 9, 2560–2567. [Google Scholar] [CrossRef] [Green Version]
- Welborn, V.V.; Ruiz Pestana, L.; Head-Gordon, T. Computational Optimization of Electric Fields for Better Catalysis Design. Nat. Catal. 2018, 1, 649–655. [Google Scholar] [CrossRef] [Green Version]
- Biava, H.; Schreiber, T.; Katz, S.; Voeller, J.S.; Stolarski, M.; Schulz, C.; Michael, N.; Budisa, N.; Kozuch, J.; Utesch, T.; et al. Long-Range Modulations of Electric Fields in Proteins. J. Phys. Chem. B 2018, 122, 8330–8342. [Google Scholar] [CrossRef] [PubMed]
- Saggu, M.; Fried, S.D.; Boxer, S.G. Local and Global Electric Field Asymmetry in Photosynthetic Reaction Centers. J. Phys. Chem. B 2019, 123, 1527–1536. [Google Scholar] [CrossRef] [PubMed]
- Silverman, L.N.; Pitzer, M.E.; Ankomah, P.O.; Boxer, S.G.; Fenlon, E.E. Vibrational Stark Effect Probes for Nucleic Acids. J. Phys. Chem. B 2007, 111, 11611–11613. [Google Scholar] [CrossRef] [Green Version]
- Watson, M.D.; Gai, X.S.; Gillies, A.T.; Brewer, S.H.; Fenlon, E.E. A Vibrational Probe for Local Nucleic Acid Environments: 5-Cyano-2′-deoxyuridine. J. Phys. Chem. B 2008, 112, 13188–13192. [Google Scholar] [CrossRef]
- Zhang, S.; Shi, R.; Ma, X.; Lu, L.; He, Y.; Zhang, X.; Wang, Y.; Deng, Y. Intrinsic Electric Fields in Ionic Liquids Determined by Vibrational Stark Effect Spectroscopy and Molecular Dynamics Simulation. Chem. Eur. J. 2012, 18, 11904–11908. [Google Scholar] [CrossRef]
- Zhang, S.; Zhang, Y.; Deng, Y. Investigation of the Intrinsic Electric Field of Nonhydroxyl and Hydroxyl Ionic Liquids by Vibrational Stark Effect Spectroscopy. RSC Adv. 2013, 3, 11480–11484. [Google Scholar] [CrossRef]
- Hu, W.; Webb, L.J. Direct Measurement of the Membrane Dipole Field in Bicelles Using Vibrational Stark Effect Spectroscopy. J. Phys. Chem. Lett. 2011, 2, 1925–1930. [Google Scholar] [CrossRef]
- Lambert, D.K. Vibrational Stark Effect of CO on Ni(100), and CO in the Aqueous Double Layer: Experiment, Theory, and Models. J. Chem. Phys. 1988, 89, 3847–3860. [Google Scholar] [CrossRef]
- Lambert, D.K. Vibrational Stark Effect of Adsorbates at Electrochemical Interfaces. Electrochim. Acta 1996, 41, 623–630. [Google Scholar] [CrossRef]
- Schkolnik, G.; Salewski, J.; Millo, D.; Zebger, I.; Franzen, S.; Hildebrandt, P. Vibrational Stark Effect of the Electric-Field Reporter 4-Mercaptobenzonitrile as a Tool for Investigating Electrostatics at Electrode/SAM/Solution Interfaces. Int. J. Mol. Sci. 2012, 13, 7466–7482. [Google Scholar] [CrossRef] [PubMed]
- Ge, A.; Videla, P.E.; Lee, G.L.; Rudshteyn, B.; Song, J.; Kubiak, C.P.; Batista, V.S.; Lian, T. Interfacial Structure and Electric Field Probed by in Situ Electrochemical Vibrational Stark Effect Spectroscopy and Computational Modeling. J. Phys. Chem. C 2017, 121, 18674–18682. [Google Scholar] [CrossRef]
- Gieseking, R.L.M.; Lee, J.; Tallarida, N.; Apkarian, V.A.; Schatz, G.C.; Apkarian, A.; Schatz, G.C. Bias-Dependent Chemical Enhancement and Nonclassical Stark Effect in Tip-Enhanced Raman Spectromicroscopy of CO-Terminated Ag Tips. J. Phys. Chem. Lett. 2018, 9, 3074–3080. [Google Scholar] [CrossRef] [PubMed]
- Takashima, K.; Furukawa, Y. Vibrational Stark Effect of 9-Cyanoanthracene Dispersed in a Poly(methyl methacrylate) Film. Chem. Phys. Lett. 2015, 633, 252–255. [Google Scholar] [CrossRef]
- Oshiroa, M.; Takashim, K.; Furukawa, Y. Infrared Stark Spectra for a Nylon 6 Film. Chem. Phys. Lett. 2019, 728, 32–36. [Google Scholar] [CrossRef]
- Lim, J.H.; Cho, D.; Kang, H.; Lee, J.Y. Electronic and Nuclear Contributions to Vibrational Stark Shifts of Hydroxyl Stretching Frequencies of Water Clusters. J. Phys. Chem. C 2018, 122, 12970–12974. [Google Scholar] [CrossRef]
- Park, Y.; Lim, J.H.; Lee, J.Y.; Kang, H. Electric Field Effect on Condensed-Phase Molecular Systems. VII. Vibrational Stark Sensitivity of Spatially Oriented Water Molecules in an Argon Matrix. J. Phys. Chem. C 2019, 123, 9868–9874. [Google Scholar] [CrossRef]
- Kang, H.; Maurais, J.; Park, Y.; Ayotte, P.; Kang, H. Electric Field Effect on Condensed-Phase Molecular Systems. VIII. Vibrational Stark Effect and Dipolar Inversion in a Carbon Monoxide Crystal. J. Phys. Chem. C 2019, 123, 31262–31271. [Google Scholar] [CrossRef]
- Bishop, D.M. The Vibrational Stark Effect. J. Chem. Phys. 1993, 98, 3179–3184. [Google Scholar] [CrossRef]
- Andrews, S.S.; Boxer, S.G. Vibrational Stark Effects of Nitriles I. Methods and Experimental Results. J. Phys. Chem. A 2000, 104, 11853–11863. [Google Scholar] [CrossRef]
- Andrews, S.S.; Boxer, S.G. Vibrational Stark Effects of Nitriles II. Physical Origins of Stark Effects from Experiment and Perturbation Models. J. Phys. Chem. A 2002, 106, 469–477. [Google Scholar] [CrossRef]
- Wilson, E.B.; Decius, J.C.; Cross, P.C. Molecular Vibrations: The Theory of Infrared and Raman Vibrational Spectra; Dover Publications: Mineola, NY, USA, 2012. [Google Scholar]
- Woodward, L.A. Introduction to the Theory of Molecular Vibrations and Vibrational Spectroscopy; Oxford University Press: New York, NY, USA, 1972. [Google Scholar]
- Herzberg, G. Molecular Spectra and Molecular Structure. Volume II: Infrared and Raman Spectra of Polyatomic Molecules; Krieger Publishing Co: New York, NY, USA, 1991. [Google Scholar]
- Herzberg, G. Molecular Spectra and Molecular Structure. Volume I: 2nd Edition; Reitell Press: New York, NY, USA, 2008. [Google Scholar]
- Califano, S. Vibrational States; Wiley: New York, NY, USA, 1976. [Google Scholar]
- Konkoli, Z.; Cremer, D. A New Way of Analyzing Vibrational Spectra. I. Derivation of Adiabatic Internal Modes. Int. J. Quantum Chem. 1998, 67, 1–9. [Google Scholar] [CrossRef]
- Konkoli, Z.; Larsson, J.A.; Cremer, D. A New Way of Analyzing Vibrational Spectra. II. Comparison of Internal Mode Frequencies. Int. J. Quantum Chem. 1998, 67, 11–27. [Google Scholar] [CrossRef]
- Konkoli, Z.; Cremer, D. A New Way of Analyzing Vibrational Spectra. III. Characterization of Normal Vibrational Modes in terms of Internal Vibrational Modes. Int. J. Quantum Chem. 1998, 67, 29–40. [Google Scholar] [CrossRef]
- Konkoli, Z.; Larsson, J.A.; Cremer, D. A New Way of Analyzing Vibrational Spectra. IV. Application and Testing of Adiabatic Modes Within the Concept of the Characterization of Normal Modes. Int. J. Quantum Chem. 1998, 67, 41–55. [Google Scholar] [CrossRef]
- Zou, W.; Kalescky, R.; Kraka, E.; Cremer, D. Relating Normal Vibrational Modes to Local Vibrational Modes with the Help of an Adiabatic Connection Scheme. J. Chem. Phys. 2012, 137, 084114. [Google Scholar] [CrossRef] [Green Version]
- Tolman, C.A. Electron Donor-Acceptor Properties of Phosphorus Ligands. Substituent Additivity. J. Am. Chem. Soc. 1970, 92, 2953–2956. [Google Scholar] [CrossRef]
- Tolman, C.A. The 16 In addition, 18 Electron Rule in Organometallic Chemistry and Homogeneous Catalysis. Chem. Soc. Rev. 1972, 1, 337–353. [Google Scholar] [CrossRef]
- Tolman, C.A. Steric Effects of Phosphorus Ligands in Organometallic Chemistry and Homogeneous Catalysis. Chem. Rev. 1977, 77, 313–348. [Google Scholar] [CrossRef]
- Kalescky, R.; Kraka, E.; Cremer, D. New Approach to Tolman’s Electronic Parameter Based on Local Vibrational Modes. Inorg. Chem. 2013, 53, 478–495. [Google Scholar] [CrossRef]
- Setiawan, D.; Kalescky, R.; Kraka, E.; Cremer, D. Direct Measure of Metal-Ligand Bonding Replacing the Tolman Electronic Parameter. Inorg. Chem. 2016, 55, 2332–2344. [Google Scholar] [CrossRef]
- Cremer, D.; Kraka, E. Generalization of the Tolman Electronic Parameter: the Metal-Ligand Electronic Parameter and the Intrinsic Strength of the Metal-Ligand Bond. Dalton Trans. 2017, 46, 8323–8338. [Google Scholar] [CrossRef]
- Kraka, E.; Cremer, D. Dieter Cremer’s Contribution to the Field of Theoretical Chemistry. Int. J. Quantum Chem. 2019, 119, e25849. [Google Scholar] [CrossRef] [Green Version]
- Kraka, E. Preface: Dieter Cremer’s Scientific Journey. Mol. Phys. 2019, 117, 1047–1058. [Google Scholar] [CrossRef] [Green Version]
- Wilson, E.B. A Method of Obtaining the Expanded Secular Equation for the Vibration Frequencies of A Molecule. J. Chem. Phys. 1939, 7, 1047–1052. [Google Scholar] [CrossRef]
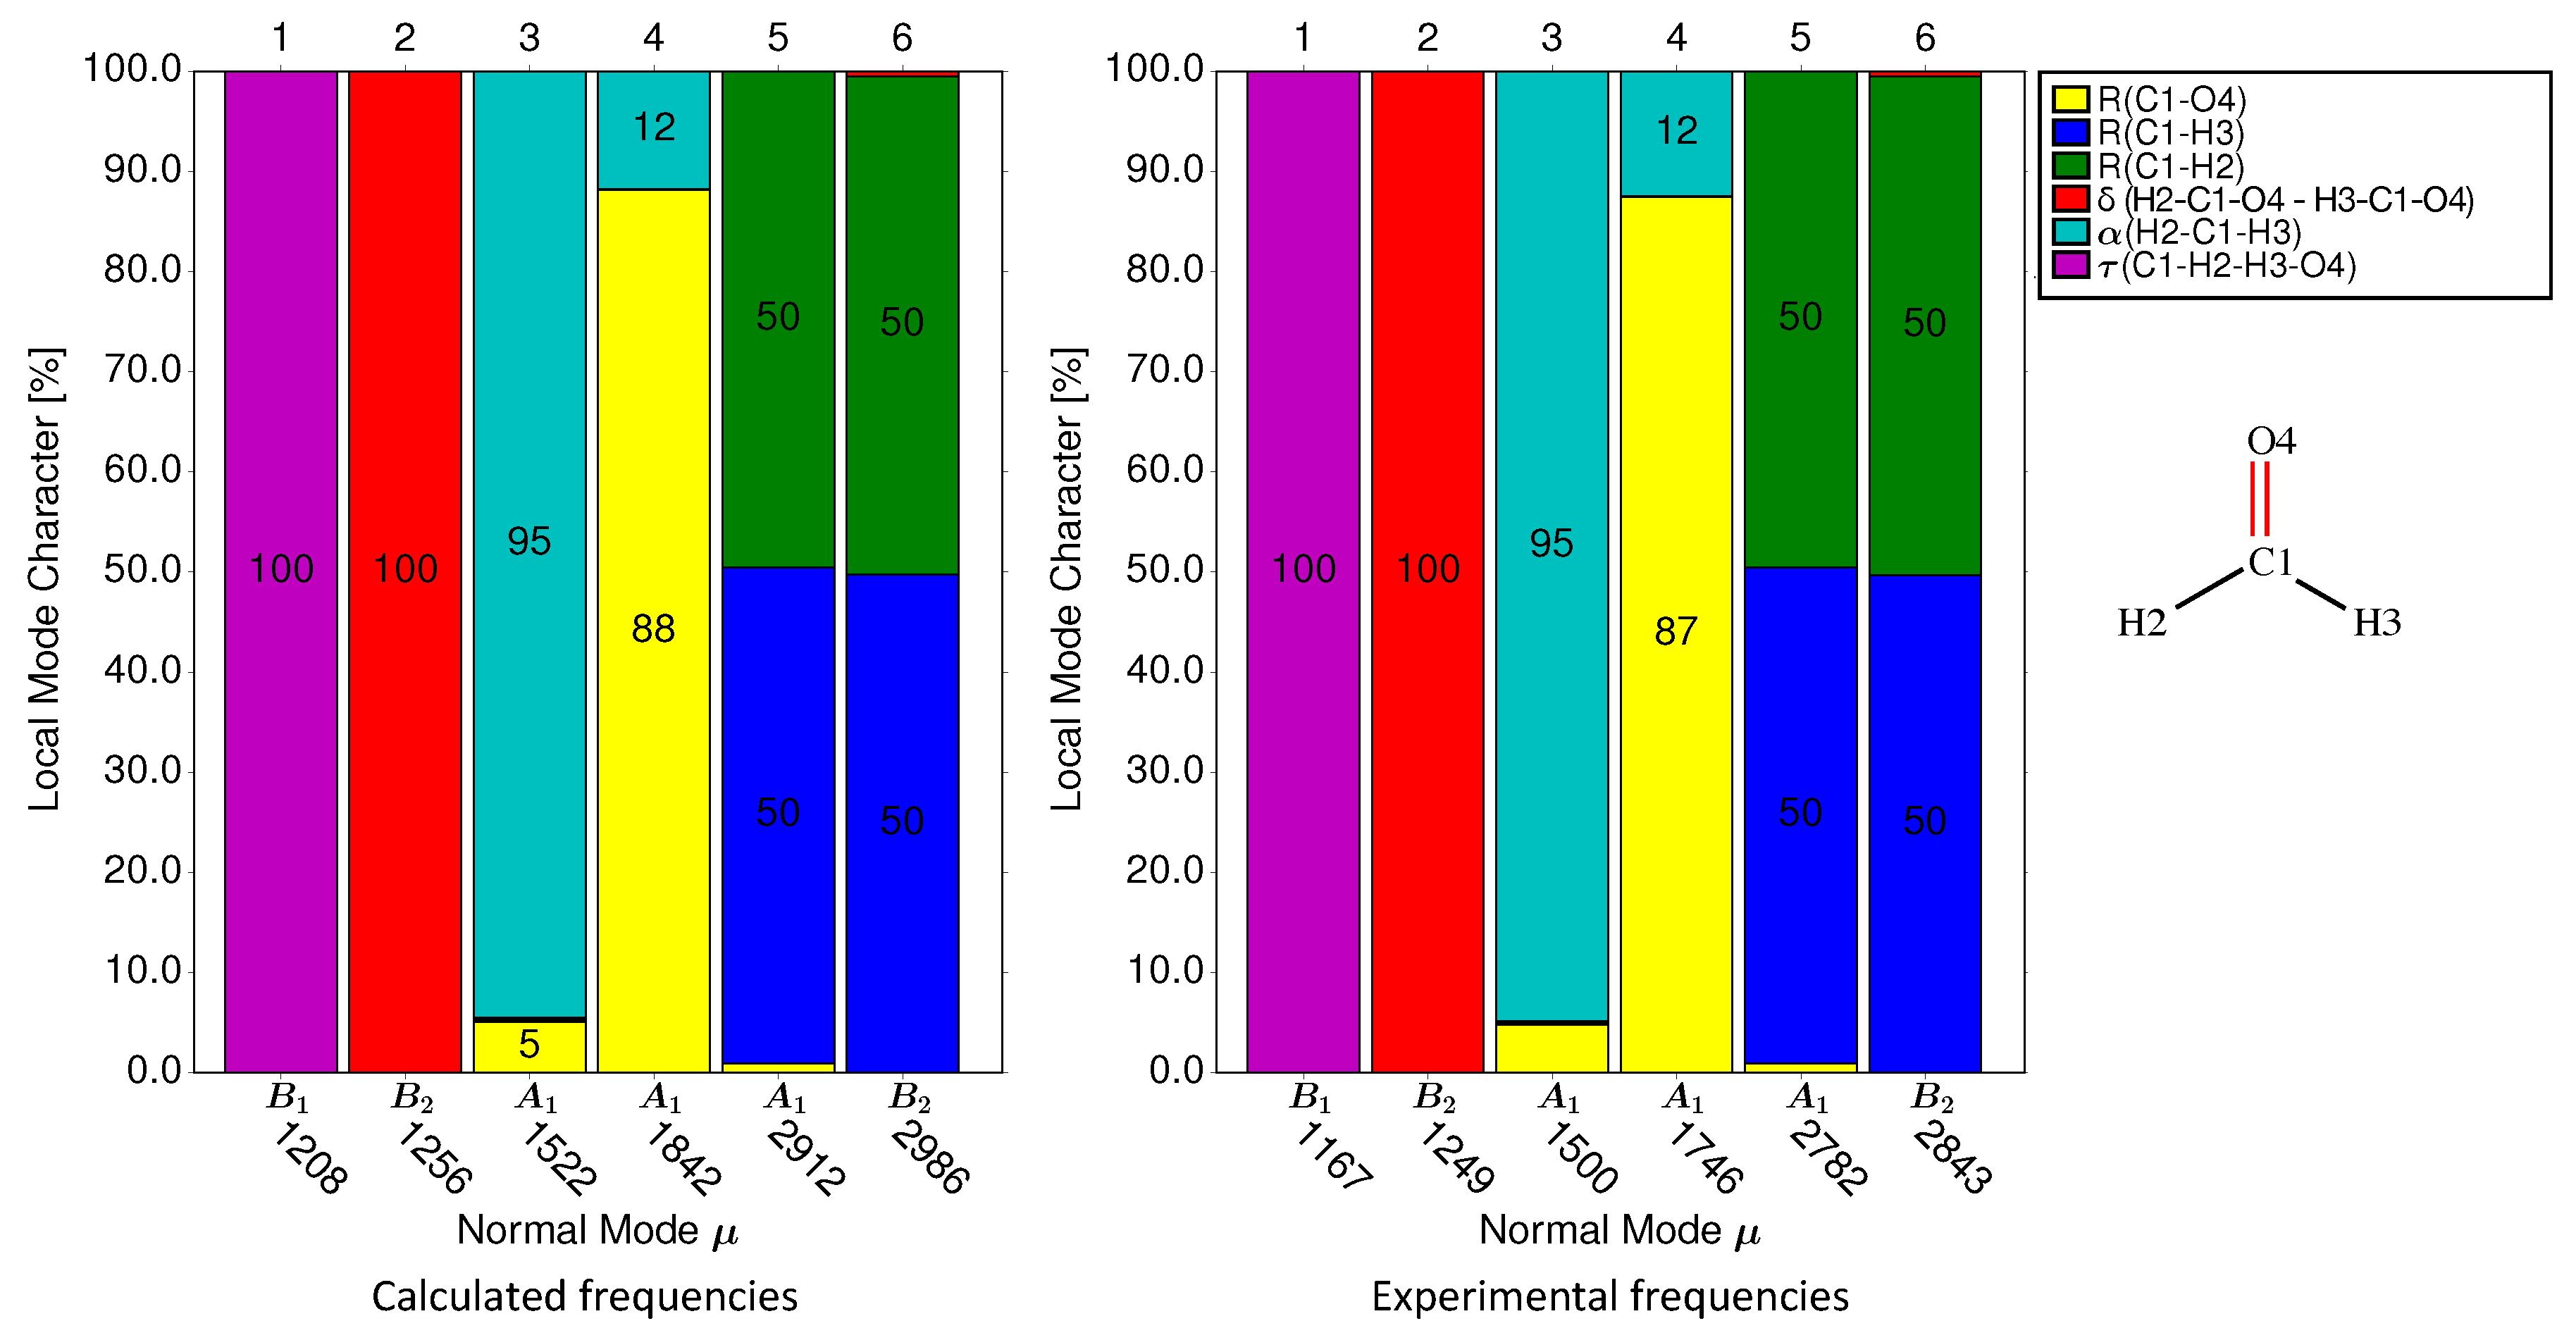
- Tao, Y.; Tian, C.; Verma, N.; Zou, W.; Wang, C.; Cremer, D.; Kraka, E. Recovering Intrinsic Fragmental Vibrations Using the Generalized Subsystem Vibrational Analysis. J. Chem. Theory Comput. 2018, 14, 2558–2569. [Google Scholar] [CrossRef] [PubMed]
- Tao, Y. Advances in Local Vibrational Mode Theory and Unified Reaction Valley Approach (URVA). Ph.D. Thesis, Southern Methodist University, Dallas, TX, USA, May 2018. [Google Scholar]
- Tao, Y.; Zou, W.; Sethio, D.; Verma, N.; Qiu, Y.; Tian, C.; Cremer, D.; Kraka, E. In Situ Measure of Intrinsic Bond Strength in Crystalline Structures: Local Vibrational Mode Theory for Periodic Systems. J. Chem. Theory Comput. 2019, 15, 1761–1776. [Google Scholar] [CrossRef]
- Kalescky, R.; Kraka, E.; Cremer, D. Local Vibrational Modes of the Formic Acid Dimer - The Strength of the Double Hydrogen Bond. Mol. Phys. 2013, 111, 1497–1510. [Google Scholar] [CrossRef]
- Cremer, D.; Larsson, J.A.; Kraka, E. New Developments in the Analysis of Vibrational Spectra on the use of Adiabatic Internal Vibrational Modes. In Theoretical and Computational Chemistry; Elsevier: Amsterdam, The Netherlands, 1998; pp. 259–327. [Google Scholar]
- Nakanaga, T.; Kondo, S.; Saëki, S. Infrared Band Intensities of Formaldehyde and Formaldehyde-d2. J. Chem. Phys. 1982, 76, 3860–3865. [Google Scholar] [CrossRef]
- Morino, Y.; Kuchitsu, K. A Note on the Classification of Normal Vibrations of Molecules. J. Chem. Phys. 1952, 20, 1809–1810. [Google Scholar] [CrossRef]
- Taylor, W.J. Distribution of Kinetic and Potential Energy in Vibrating Molecules. J. Chem. Phys. 1954, 22, 1780. [Google Scholar] [CrossRef]
- Miyazawa, T.; Shimanouchi, T.; Ichiro Mizushima, S. Normal Vibrations of N-Methylacetamide. J. Chem. Phys. 1958, 29, 611–616. [Google Scholar] [CrossRef]
- Zerbi, G.; Overend, J.; Crawford, B. Urey-Bradley Force Constants of Methanol. J. Chem. Phys. 1963, 38, 122–127. [Google Scholar] [CrossRef]
- Keresztury, G.; Jalsovszky, G. An Alternative Calculation of the Vibrational Potential Energy Distribution. J. Mol. Struct. 1971, 10, 304–305. [Google Scholar] [CrossRef]
- Jamróz, M.H. Vibrational Energy Distribution Analysis (VEDA): Scopes and Limitations. Spectrochim. Acta. A 2013, 114, 220–230. [Google Scholar] [CrossRef]
- Brewer, S.H.; Franzen, S. A Quantitative Theory and Computational Approach for the Vibrational Stark Effect. J. Chem. Phys. 2003, 119, 851–858. [Google Scholar] [CrossRef]
- Kraka, E.; Larsson, J.A.; Cremer, D. Generalization of the Badger Rule Based on the Use of Adiabatic Vibrational Modes. In Computational Spectroscopy; Wiley: New York, NY, USA, 2010; pp. 105–149. [Google Scholar]
- Frisch, M.J.; Trucks, G.W.; Schlegel, H.B.; Scuseria, G.E.; Robb, M.A.; Cheeseman, J.R.; Scalmani, G.; Barone, V.; Petersson, A.; Nakatsuji, H.; et al. Gaussian16 Revision A. 03; Gaussian Inc.: Wallingford, CT, USA, 2016. [Google Scholar]
- Chai, J.D.; Head-Gordon, M. Long-Range Corrected Hybrid Density Functionals with Damped Atom-atom Dispersion Corrections. Phys. Chem. Chem. Phys. 2008, 10, 6615–6620. [Google Scholar] [CrossRef] [Green Version]
- Dunning, T.H. Gaussian Basis Sets for use in Correlated Molecular Calculations. I. The Atoms Boron through Neon and Hydrogen. J. Phys. Chem. 1989, 90, 1007. [Google Scholar] [CrossRef]
- Woon, D.E.; Dunning, T.H. Gaussian Basis Sets for use in Correlated Molecular Calculations. III. The Atoms Aluminum through Argon. J. Phys. Chem. 1993, 98, 1358. [Google Scholar] [CrossRef] [Green Version]
- Wilson, A.K.; Woon, D.E.; Peterson, K.A.; Dunning, T.H. Gaussian Basis Sets for use in Correlated Molecular Calculations. IX. The Atoms Gallium through Krypton. J. Phys. Chem. 1999, 110, 7667. [Google Scholar] [CrossRef]
- Wang, Y.; Jin, X.; Yu, H.S.; Truhlar, D.G.; He, X. Revised M06-L Functional for Improved Accuracy on Chemical Reaction Barrier Heights, Noncovalent Interactions, and Solid-state Physics. Proc. Natl. Acad. Sci. USA 2017, 114, 8487–8492. [Google Scholar] [CrossRef] [PubMed] [Green Version]
- Zhao, Y.; Truhlar, D.G. A New Local Density Functional for Main-Group Thermochemistry, Transition Metal Bonding, Thermochemical Kinetics, and Noncovalent Interactions. J. Chem. Phys. 2006, 125, 194101. [Google Scholar] [CrossRef] [PubMed] [Green Version]
- Weigend, F.; Ahlrichs, R. Balanced Basis Sets of Split Valence, Triple Zeta Valence and Quadruple Zeta Valence Quality for H to Rn: Design and Assessment of Accuracy. Phys. Chem. Chem. Phys. 2005, 7, 3297. [Google Scholar] [CrossRef] [PubMed]
- Kraka, E.; Zou, W.; Filatov, M.; Tao, Y.; Grafenstein, J.; Izotov, D.; Gauss, J.; He, Y.; Wu, A.; Konkoli, Z.; et al. COLOGNE2019. 2019. Available online: http://www.smu.edu/catco (accessed on 19 December 2019).
- Zhao, Y.; Truhlar, D.G. The M06 Suite of Density Functionals for Main Group Thermochemistry, Thermochemical Kinetics, Noncovalent Interactions, Excited States, and Transition Elements: Two New Functionals and Systematic Testing of four M06-class Functionals and 12 other Functionals. Theor. Chem. Acc. 2008, 120, 215–241. [Google Scholar]
- Park, Y.; Kang, H.; Kang, H. Brute Force Orientation of Matrix-Isolated Molecules: Reversible Reorientation of Formaldehyde in An Argon Matrix toward Perfect Alignment. Angew. Chem. Int. Ed. Engl. 2016, 56, 1046–1049. [Google Scholar] [CrossRef]
- Park, E.S.; Boxer, S.G. Origins of the Sensitivity of Molecular Vibrations to Electric Fields: Carbonyl and Nitrosyl Stretches in Model Compounds and Proteins. J. Phys. Chem. B 2002, 106, 5800–5806. [Google Scholar] [CrossRef]
- Fried, S.D.; Wang, L.P.; Boxer, S.G.; Ren, P.; Pande, V.S. Calculations of the Electric Fields in Liquid Solutions. J. Phys. Chem. B 2013, 117, 16236–16248. [Google Scholar] [CrossRef] [Green Version]
- Dalosto, S.D.; Vanderkooi, J.M.; Sharp, K.A. Vibrational Stark Effects on Carbonyl, Nitrile, and Nitrosyl Compounds Including Heme Ligands, CO, CN, and NO, Studied with Density Functional Theory. J. Phys. Chem. B 2004, 108, 6450–6457. [Google Scholar] [CrossRef]
- McKean, D.C. Individual CH Bond Strengths in Simple Organic Compounds: Effects of Conformation and Substitution. Chem. Soc. Rev. 1978, 7, 399–422. [Google Scholar] [CrossRef]
- Lehle, H.; Kriegl, J.M.; Nienhaus, K.; Deng, P.; Fengler, S.; Nienhaus, G.U. Probing Electric Fields in Protein Cavities by Using the Vibrational Stark Effect of Carbon Monoxide. Biophys. J. 2005, 88, 1978–1990. [Google Scholar] [CrossRef] [Green Version]
- Reimers, J.R.; Hush, N.S. Vibrational Stark Spectroscopy 3. Accurate Benchmark ab Initio and Density Functional Calculations for CO and CN-. J. Phys. Chem. A 1999, 103, 10580–10587. [Google Scholar] [CrossRef]
- Okuda, M.; Higashi, M.; Ohta, K.; Saito, S.; Tominaga, K. Theoretical Investigation on Vibrational Frequency Fluctuations of SCN-Derivatized Vibrational Probe Molecule in Water. Chem. Phys. 2018, 512, 82–87. [Google Scholar] [CrossRef]
- El-Azhary, A.A.; Suter, H.U. Comparison Between Optimized Geometries and Vibrational Frequencies Calculated by the DFT Methods. J. Phys. Chem. 1996, 100, 15056–15063. [Google Scholar] [CrossRef]
- Kim, S.; Chen, J.; Cheng, T.; Gindulyte, A.; He, J.; He, S.; Li, Q.; Shoemaker, B.A.; Thiessen, P.A.; Yu, B.; et al. PubChem 2019 Update: Improved Access to Chemical Data. Nucleic Acids Res. 2018, 47, D1102–D1109. [Google Scholar] [CrossRef] [PubMed] [Green Version]
- Lide, D.R. Handbook of Chemistry and Physics (87 ed.); CRC Press: Boca Raton, FL, USA, 1998. [Google Scholar]
- Kashinski, D.O.; Chase, G.M.; Nelson, R.G.; Di Nallo, O.E.; Scales, A.N.; VanderLey, D.L.; Byrd, E.F.C. Harmonic Vibrational Frequencies: Approximate Global Scaling Factors for TPSS, M06, and M11 Functional Families Using Several Common Basis Sets. J. Phys. Chem. A 2017, 121, 2265–2273. [Google Scholar] [CrossRef] [PubMed]


| Group 1: C=O and C≡O Probes | |
|---|---|
| Mol. | Local mode contributions |
| 1-1 | 88.2% C1-O4, 11.8% H2-C1-H3 |
| 1-2 | 83.4% C1-O4, 10.4% (C1-F2, C1-F3), 6.2% F2-C1-F3 |
| 1-3 | 93.1% C1-O4 |
| 1-4 | 94.7% C1-O4 |
| 1-5 | 85.5% C1-O4 |
| 1-6 | 76.3% C3-O8, 18.7% (C3-C1, C3-C2) |
| 1-7 | 82.0% C3-O11, 6.9% C2-C3-C4 |
| 1-8 | 82.4% C4-O14, 8.3% C3-C4-C5 |
| 1-9 | 82.3% C1-O17, 5.2% C6-C1-C2 |
| 1-10 | 77.4% C1-O2, 5.3% C3-C1-C7 |
| 1-11 | 67.6% C1-O2, 7.0% C4-C1-C7, 5.6% C4-C1, 5.6% C7-C1 |
| 1-12 | 77.7% C5-O10, 7.3% C4-C5-C6 |
| 1-13 | 79.7% C1-O2, 6.2% C14-C1-C3 |
| 1-14 | 79.2% C1-O2, 6.2% C3-C1-C14 |
| 1-15 | 89.2% C1-O2 |
| 1-16 | 90.5% C1-O2 |
| 1-17 | 71.5% C1-O16, 10.7% N11-C1-C4, 7.5% N11-C1 |
| 1-18 | 80.6% C1-O2, 6.4% N3-C1, 6.4% N5-C1 |
| 1-19 | 91.2% C1-O2 |
| 1-20 | 81.9% C5-O6, 6.1% C5-C1, 5.5% O7-C5-C1 |
| 1-21 | 76.0% C1-O2, 7.1% C8-C1-O3, 5.7% C8-C1 |
| 1-22 | 87.2% C1-O2, 5.3% C1-C6 |
| 1-23 | 75.7% C1-O2, 6.9% N7-C1, 6.8% N7-C1-C3 |
| 1-24 | 93.3% C1-O2, 6.7% C1-Fe39 |
| 1-25 | 94.0% C1-O2 |
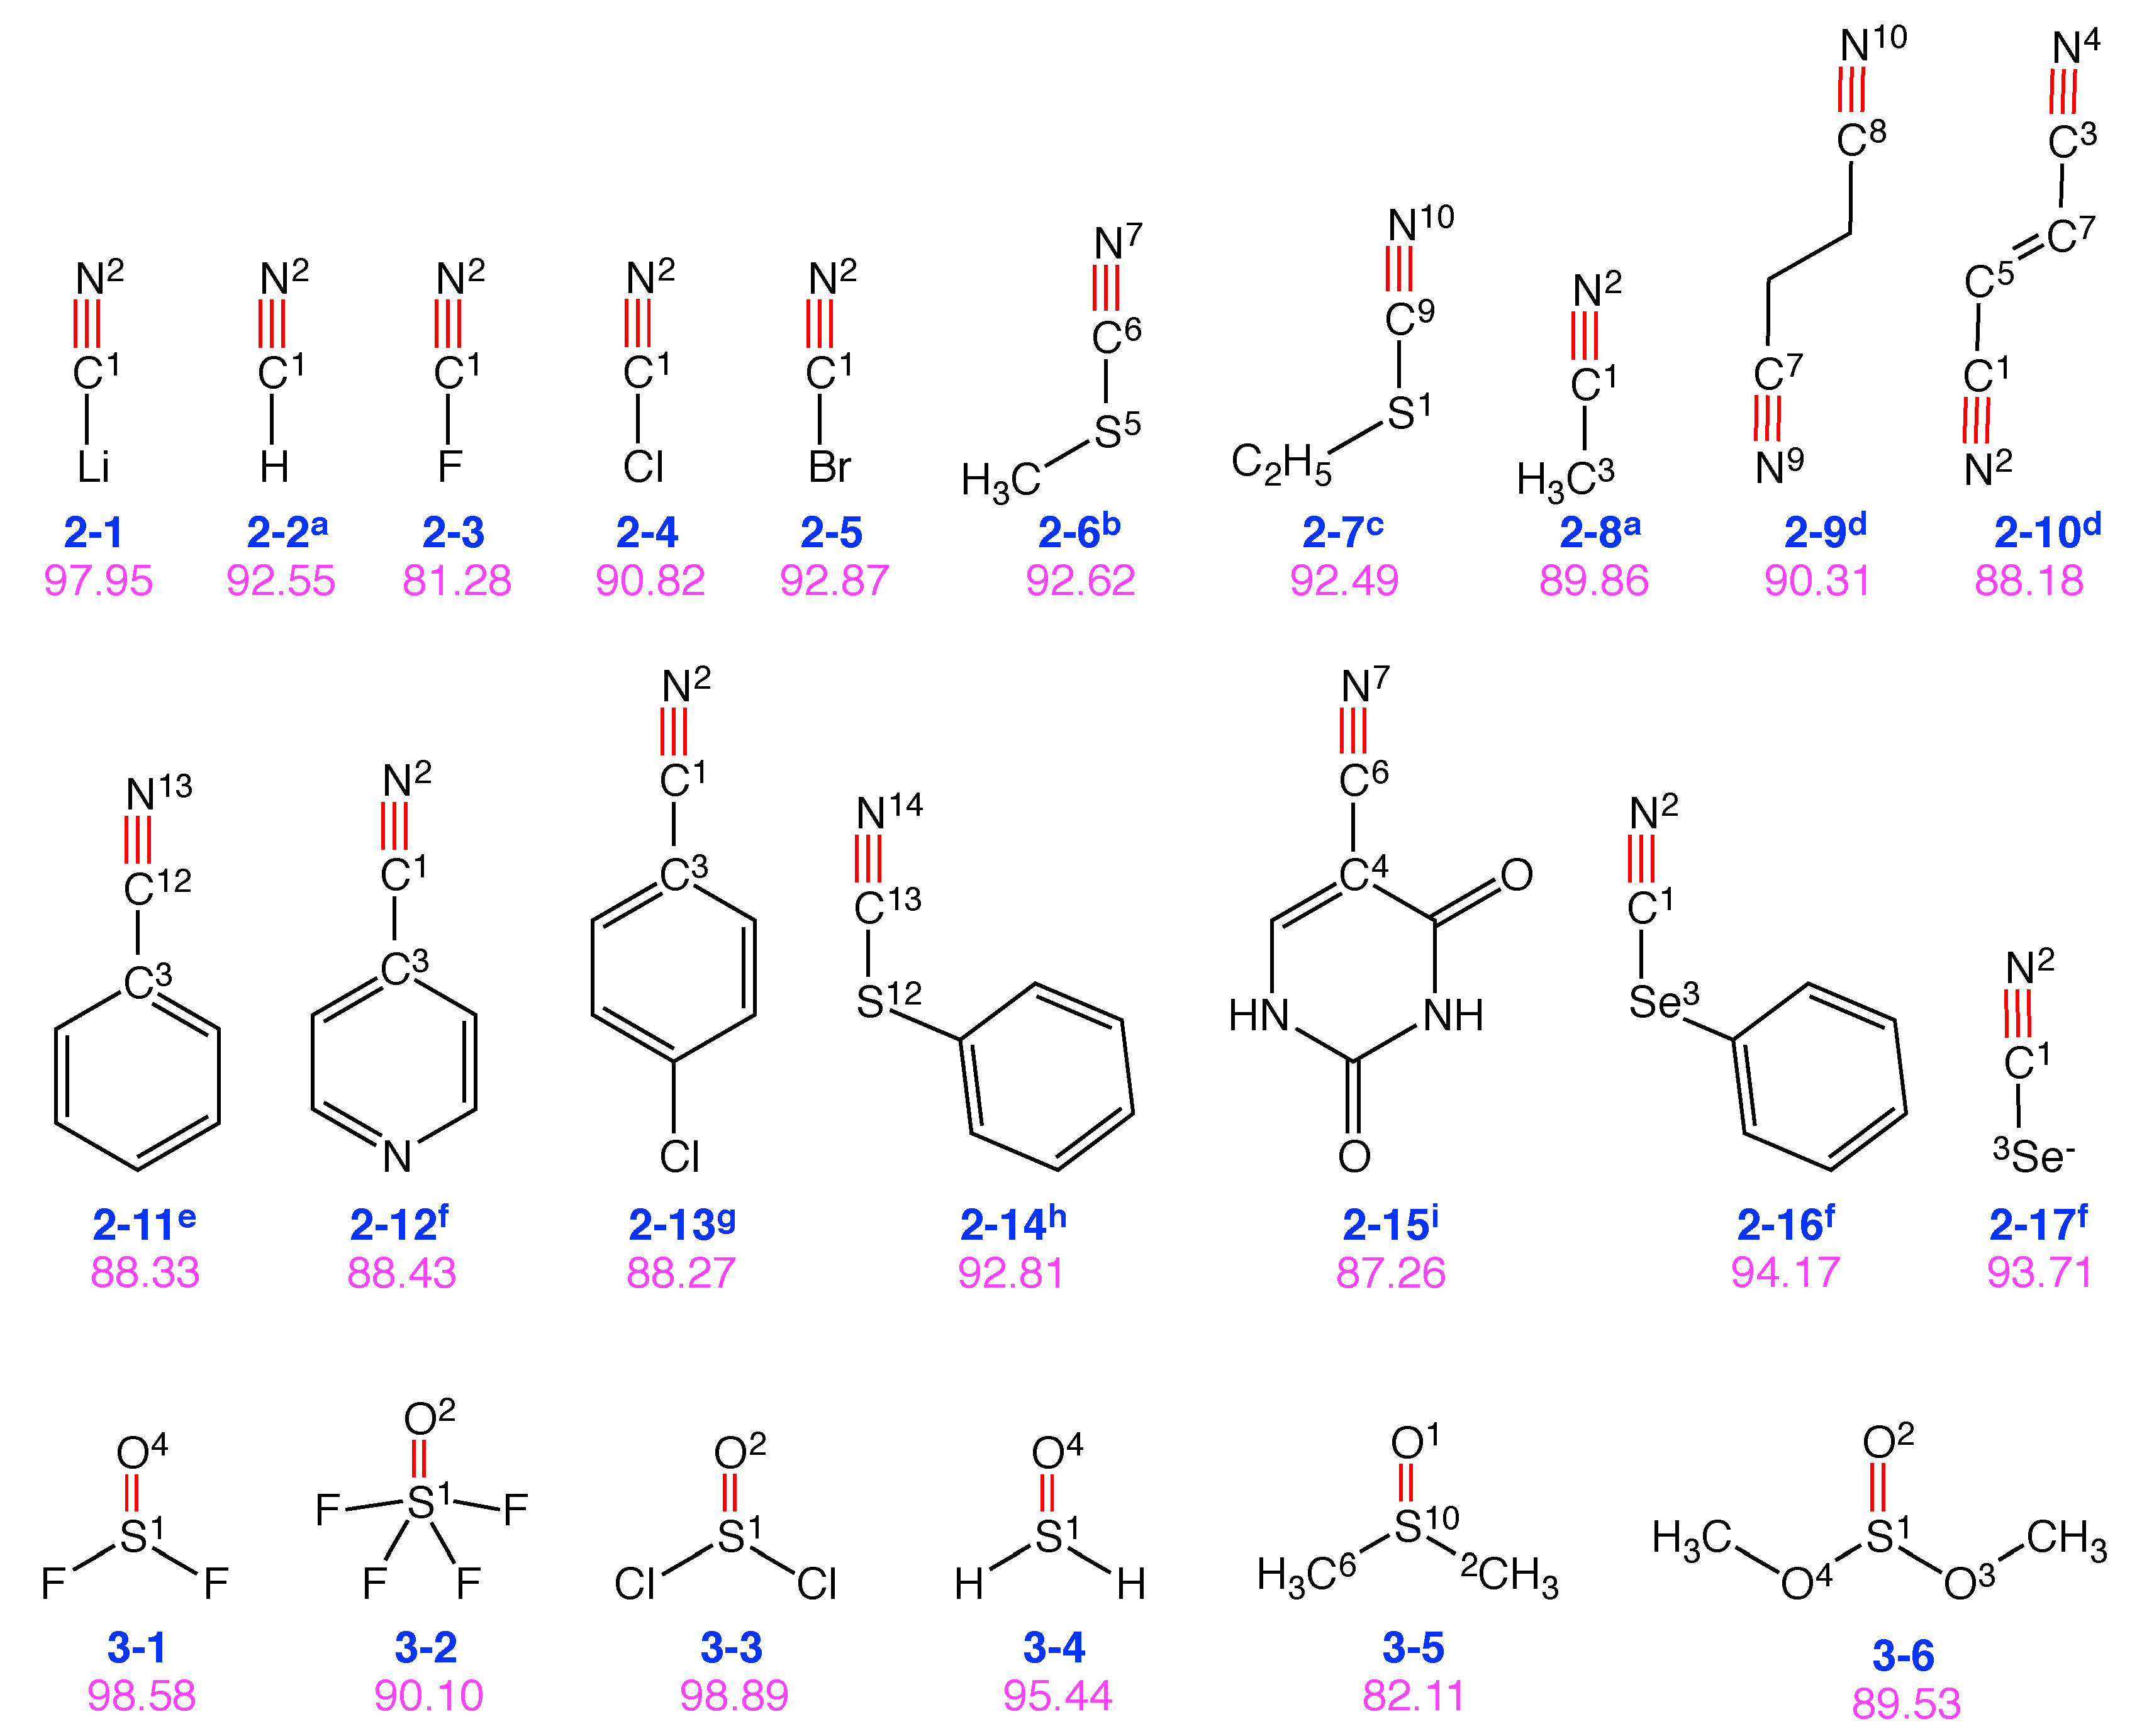
| Group 2: C≡N probes | |
| Mol. | Local mode contributions |
| 2-1 | 98.0% C1-N2 |
| 2-2 | 92.6% C1-N2, 7.4% H3-C1 |
| 2-3 | 81.3% C1-N2, 18.7% F3-C1 |
| 2-4 | 90.8% C1-N2, 9.2% Cl3-C1 |
| 2-5 | 92.9% C1-N2, 7.1% Br3-C1 |
| 2-6 | 92.6% N7-C6, 7.4% S5-C6 |
| 2-7 | 92.5% C9-N10, 7.5% C9-S1 |
| 2-8 | 89.9% C1-N2, 10.1% C3-C1 |
| 2-9 | 45.1% N9-C7, 45.1% C8-N10 |
| 2-10 | 44.1% C1-N2, 44.1% C3-N4, 11.6% (C3-C7, C5-C1) |
| 2-11 | 88.3% C12-N13, 11.3% C12-C3 |
| 2-12 | 88.4% N2-C1, 11.3% C3-C1 |
| 2-13 | 88.3% C1-N2, 11.5% C1-C3 |
| 2-14 | 92.8% C13-N14, 7.2% C13-S12 |
| 2-15 | 87.3% N7-C6, 12.5% C4-C6 |
| 2-16 | 94.2% N2-C1, 5.8% Se3-C1 |
| 2-17 | 93.7% C1-N2, 6.3% C1-Se3 |
| Group 3: S=O probes | |
| Mol. | Local mode contributions |
| 3-1 | 98.6% S1-O4 |
| 3-2 | 90.1% S1-O2 |
| 3-3 | 98.9% S1-O2 |
| 3-4 | 95.4% S1-O4 |
| 3-5 | 82.1% O1-S10, 5.2% pyra (S10-C6-O1-C2) |
| 3-6 | 89.5% S1-O2, 5.5% pyra (S1-O4-O2-O3) |
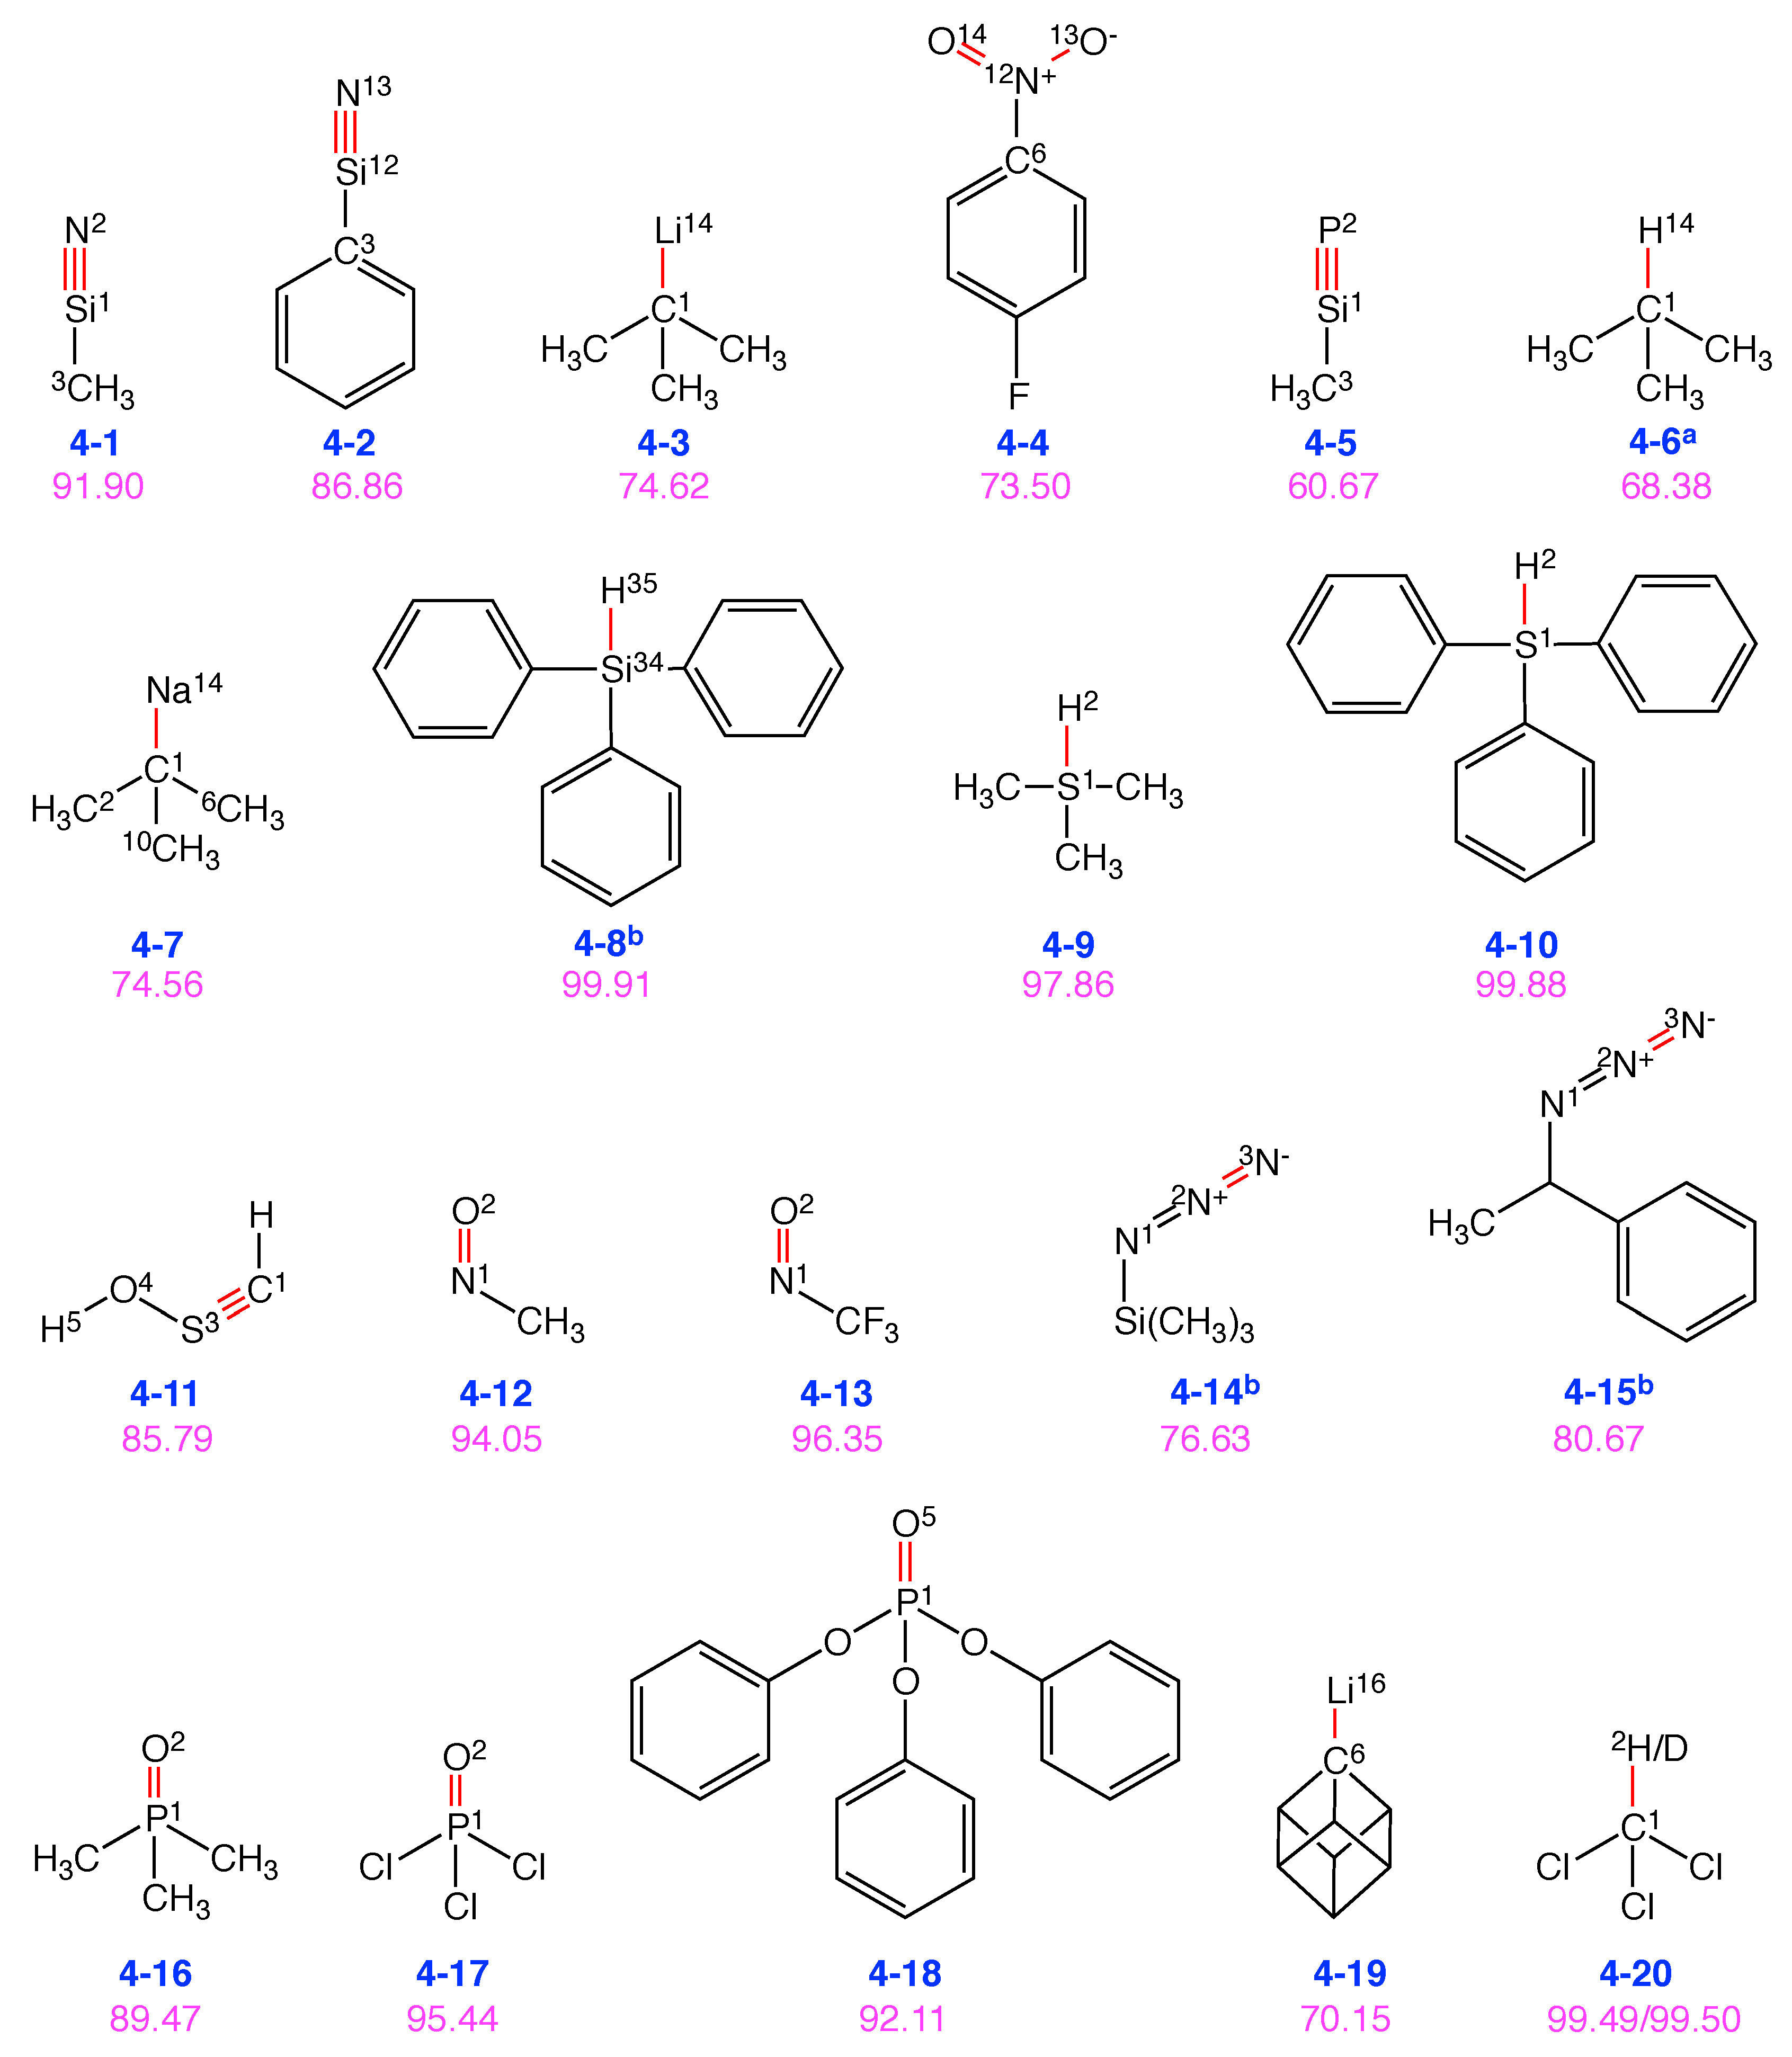
| Group 4: Other probes | |
| Mol. | Local mode contributions |
| 4-1 | 91.9% Si1-N2, 6.8% C3-Si1 |
| 4-2 | 86.9% Si12-N13, 9.2% Si12-C3 |
| 4-3 | 74.6% Li14-C1 |
| 4-4 | 36.8% O14-N12, 36.7% O13-N12, 17.5% N12-C6 |
| 4-5 | 60.7% Si1-P2, 39.2% Si1-C3 |
| 4-6 | 68.4% C1-H14 |
| 4-7 | 74.6% C1-Na14, 11.5% (C2-C1-C10, C6-C1-C10), 5.8% C2-C1-C6 |
| 4-8 | 99.9% H35-Si34 |
| 4-9 | 97.9% H2-S1 |
| 4-10 | 99.9% H2-S1 |
| 4-11 | 85.8% C1-S3, 10.6% S3-O4-H5 |
| 4-12 | 94.0% N1-O2 |
| 4-13 | 96.4% N1-O2 |
| 4-14 | 76.6% N3-N2, 23.2% N2-N1 |
| 4-15 | 80.7% N3-N2, 19.2% N2-N1 |
| 4-16 | 89.5% P1-O2 |
| 4-17 | 95.4% P1-O2 |
| 4-18 | 92.1% P1-O5 |
| 4-19 | 70.2% C6-Li16 |
| 4-20 | 99.5% C1-H2 |
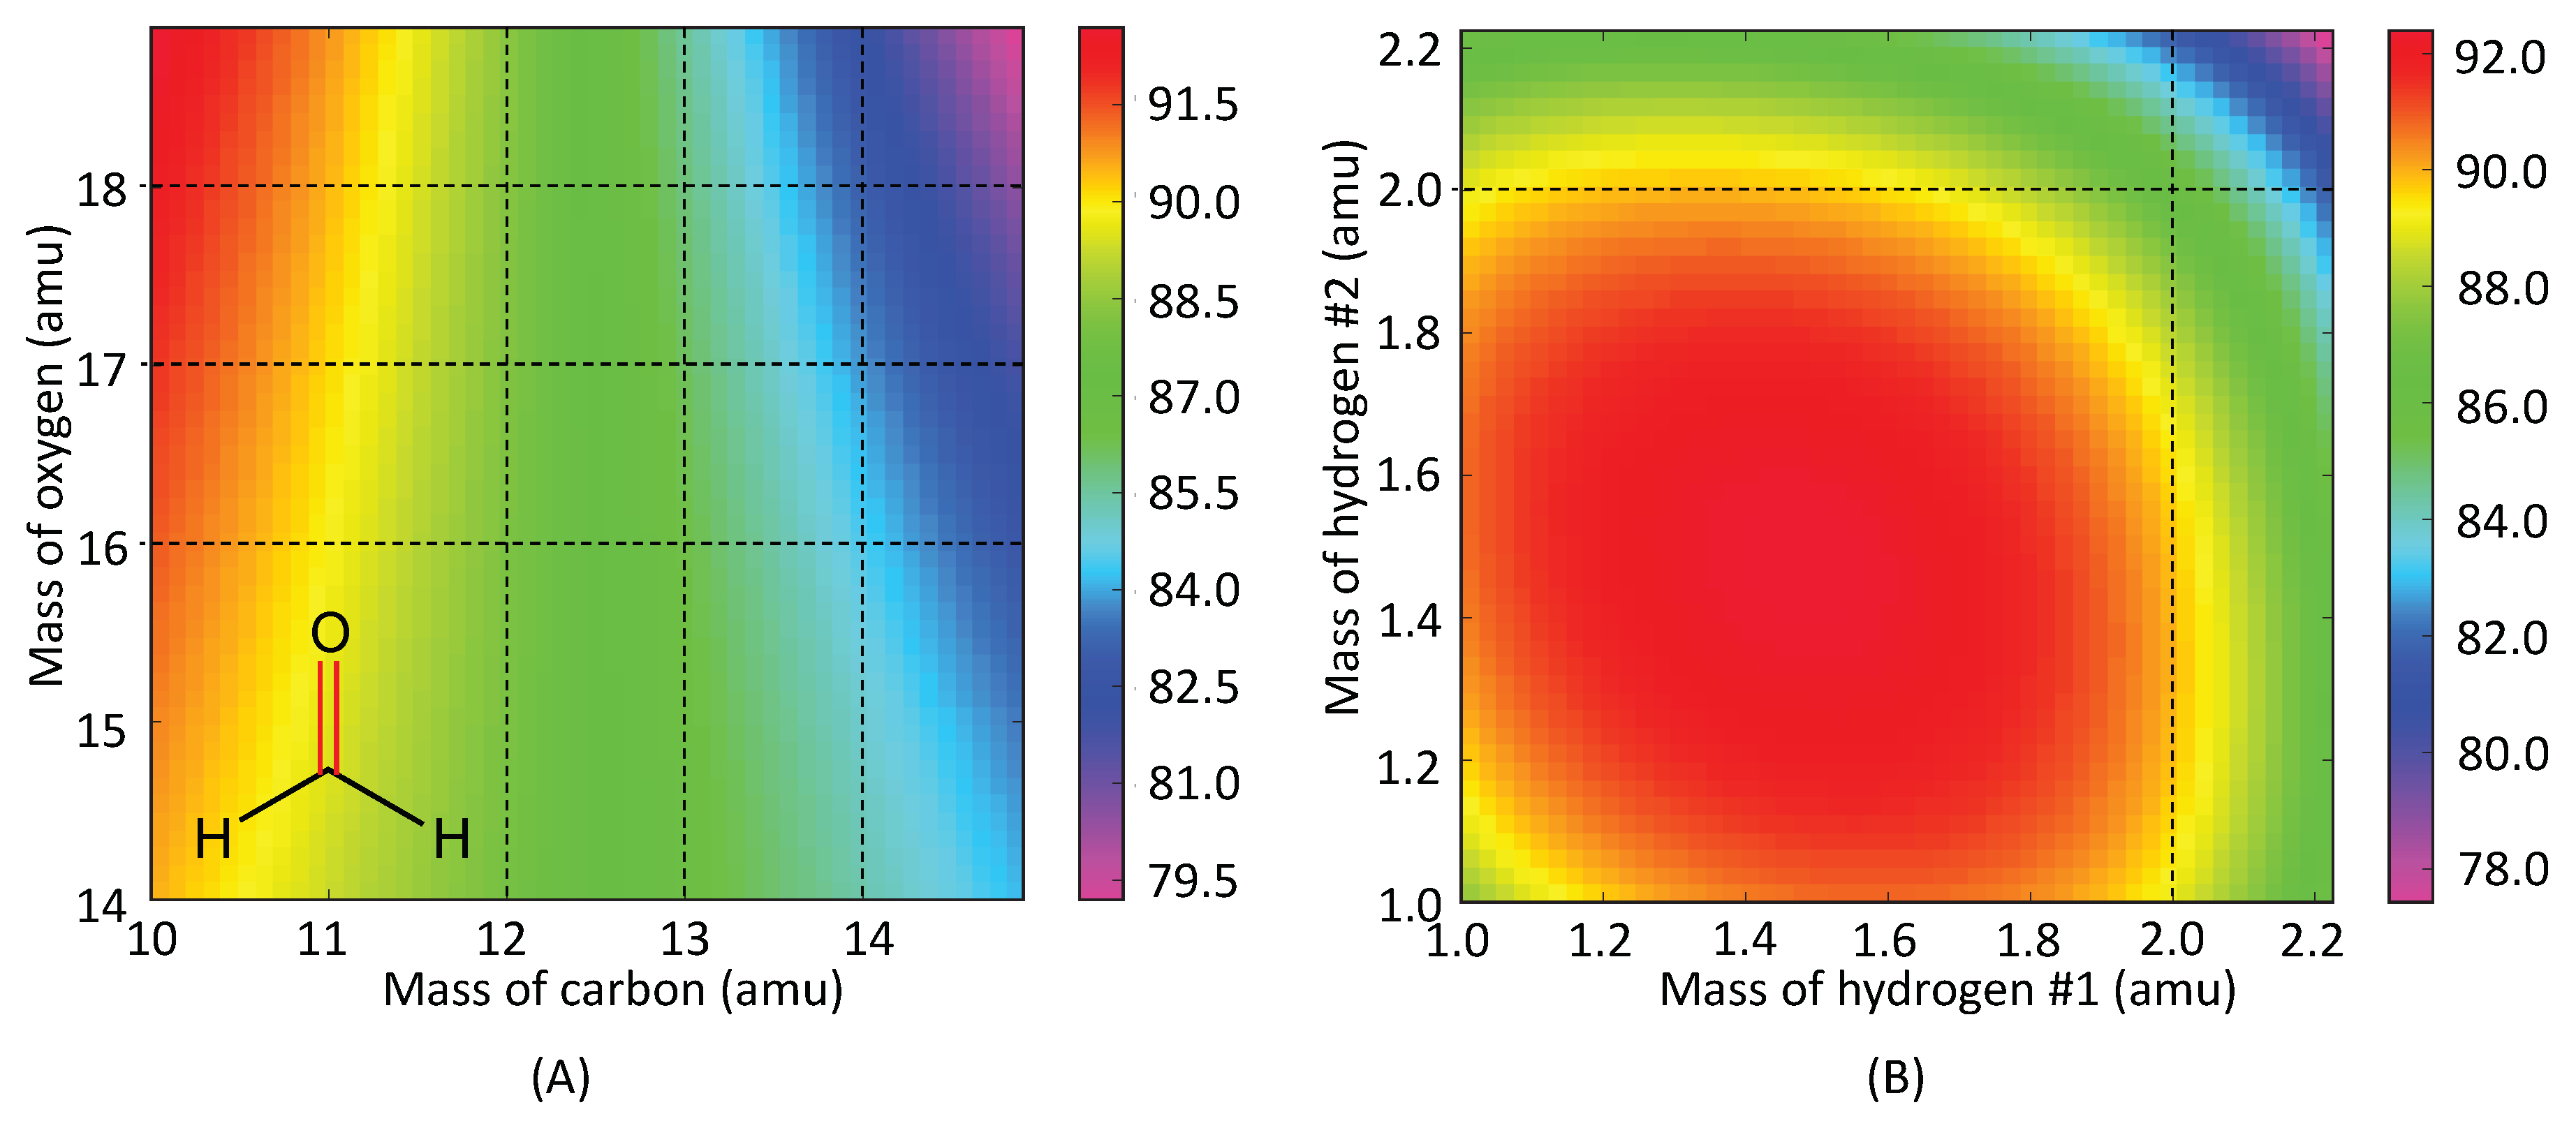
| Mass of X (amu) | HCO (1-1) | FCO (1-2) | ClCO (1-3) | BrCO (1-4) |
|---|---|---|---|---|
| 1.008 [H] | 88.16 | 73.35 | 92.89 | 94.06 |
| 18.998 [F] | 88.49 | 83.41 | 93.06 | 94.73 |
| 35.453 [Cl] | 89.04 | 84.38 | 93.12 | 94.73 |
| 79.904 [Br] | 89.36 | 84.91 | 93.15 | 94.74 |
| Probe Bond | Label | Score | Freq. | Solubility/Miscibility | Known Limitation |
|---|---|---|---|---|---|
| C=O | 1-1 | 88.2 | 1770 | water, ethanol, chloroform, ether, acetone, benzene | - |
| 1-3 | 93.1 | 1826 | benzene, toluene, glacial acetic acid, most liquid hydrocarbons, water | - | |
| 1-4 | 94.7 | 1829 | - | reacts with water | |
| 1-5 | 85.5 | 1754 | water, benzene, alcohol, dimethylformamide, ether | - | |
| 1-15 | 89.2 | 1706 | organic solvents | - | |
| 1-16 | 90.5 | 1759 | water, acetone, benzene, ethanol, ether | - | |
| 1-19 | 91.2 | 1919 | chloroform | insoluble in water | |
| 1-22 | 87.2 | 1723 | water, alcohol, ether, carbon tetrachloride | - | |
| 1-24 | 93.3 | 2145 | - | binds to specific proteins | |
| 1-25 | 94.0 | 1960 | - | binds to specific proteins | |
| C≡N | 2-1 | 98.0 | 2169 | water, DMF, THF | - |
| 2-2 | 92.5 | 2136 | water, alcohol | - | |
| 2-5 | 92.9 | 2250 | acetonitrile, dicholoromethane, ethanol, ether, benzene, chloroform | reacts slowly with water | |
| 2-6 | 92.6 | 2220 | |||
| 2-9 | 90.2 | 2301 | acetone, chloroform, dioxane, ehanol, benzene, ether, carbon sulfide | - | |
| 2-14 | 92.8 | 2219 | |||
| 2-16 | 94.2 | 2217 | THF, dichloromethane, acetonitrile | - | |
| S=O | 3-1 | 98.6 | 1248 | - | - |
| 3-3 | 98.9 | 1185 | - | - | |
| 3-4 | 95.4 | 988 | - | - | |
| 3-6 | 89.5 | 1158 | - | - | |
| Si≡N | 4-1 | 91.9 | 1244 | - | - |
| Si-H | 4-8 | 99.9 | 2111 | methanol | reacts with water |
| S-H | 4-9 | 97.9 | 1452 | - | - |
| 4-10 | 99.9 | 2350 | - | - | |
| S≡C | 4-11 | 85.8 | 1137 | - | - |
| N=O | 4-12 | 94.0 | 1676 | water | - |
| 4-13 | 96.3 | 1722 | water | - | |
| P=O | 4-16 | 89.5 | 1139 | polar organic solvents | - |
| 4-17 | 95.4 | 1226 | - | reacts with water | |
| 4-18 | 92.1 | 1250 | - | - |
© 2020 by the authors. Licensee MDPI, Basel, Switzerland. This article is an open access article distributed under the terms and conditions of the Creative Commons Attribution (CC BY) license (http://creativecommons.org/licenses/by/4.0/).
Share and Cite
Verma, N.; Tao, Y.; Zou, W.; Chen, X.; Chen, X.; Freindorf, M.; Kraka, E. A Critical Evaluation of Vibrational Stark Effect (VSE) Probes with the Local Vibrational Mode Theory. Sensors 2020, 20, 2358. https://0-doi-org.brum.beds.ac.uk/10.3390/s20082358
Verma N, Tao Y, Zou W, Chen X, Chen X, Freindorf M, Kraka E. A Critical Evaluation of Vibrational Stark Effect (VSE) Probes with the Local Vibrational Mode Theory. Sensors. 2020; 20(8):2358. https://0-doi-org.brum.beds.ac.uk/10.3390/s20082358
Chicago/Turabian StyleVerma, Niraj, Yunwen Tao, Wenli Zou, Xia Chen, Xin Chen, Marek Freindorf, and Elfi Kraka. 2020. "A Critical Evaluation of Vibrational Stark Effect (VSE) Probes with the Local Vibrational Mode Theory" Sensors 20, no. 8: 2358. https://0-doi-org.brum.beds.ac.uk/10.3390/s20082358