Photometric Sensing of Active Chlorine, Total Chlorine, and pH on a Microfluidic Chip for Online Swimming Pool Monitoring

 , ,
, ,
Abstract
:
1. Introduction
2. Materials and Methods
2.1. Materials
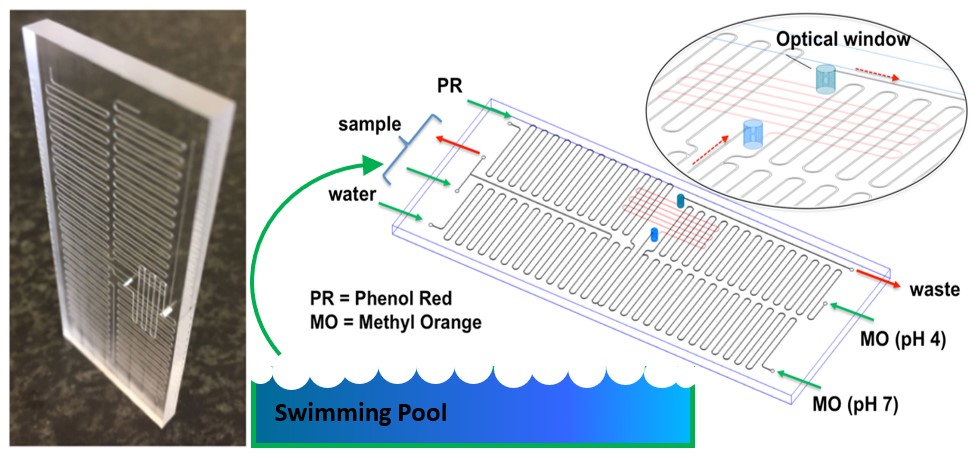
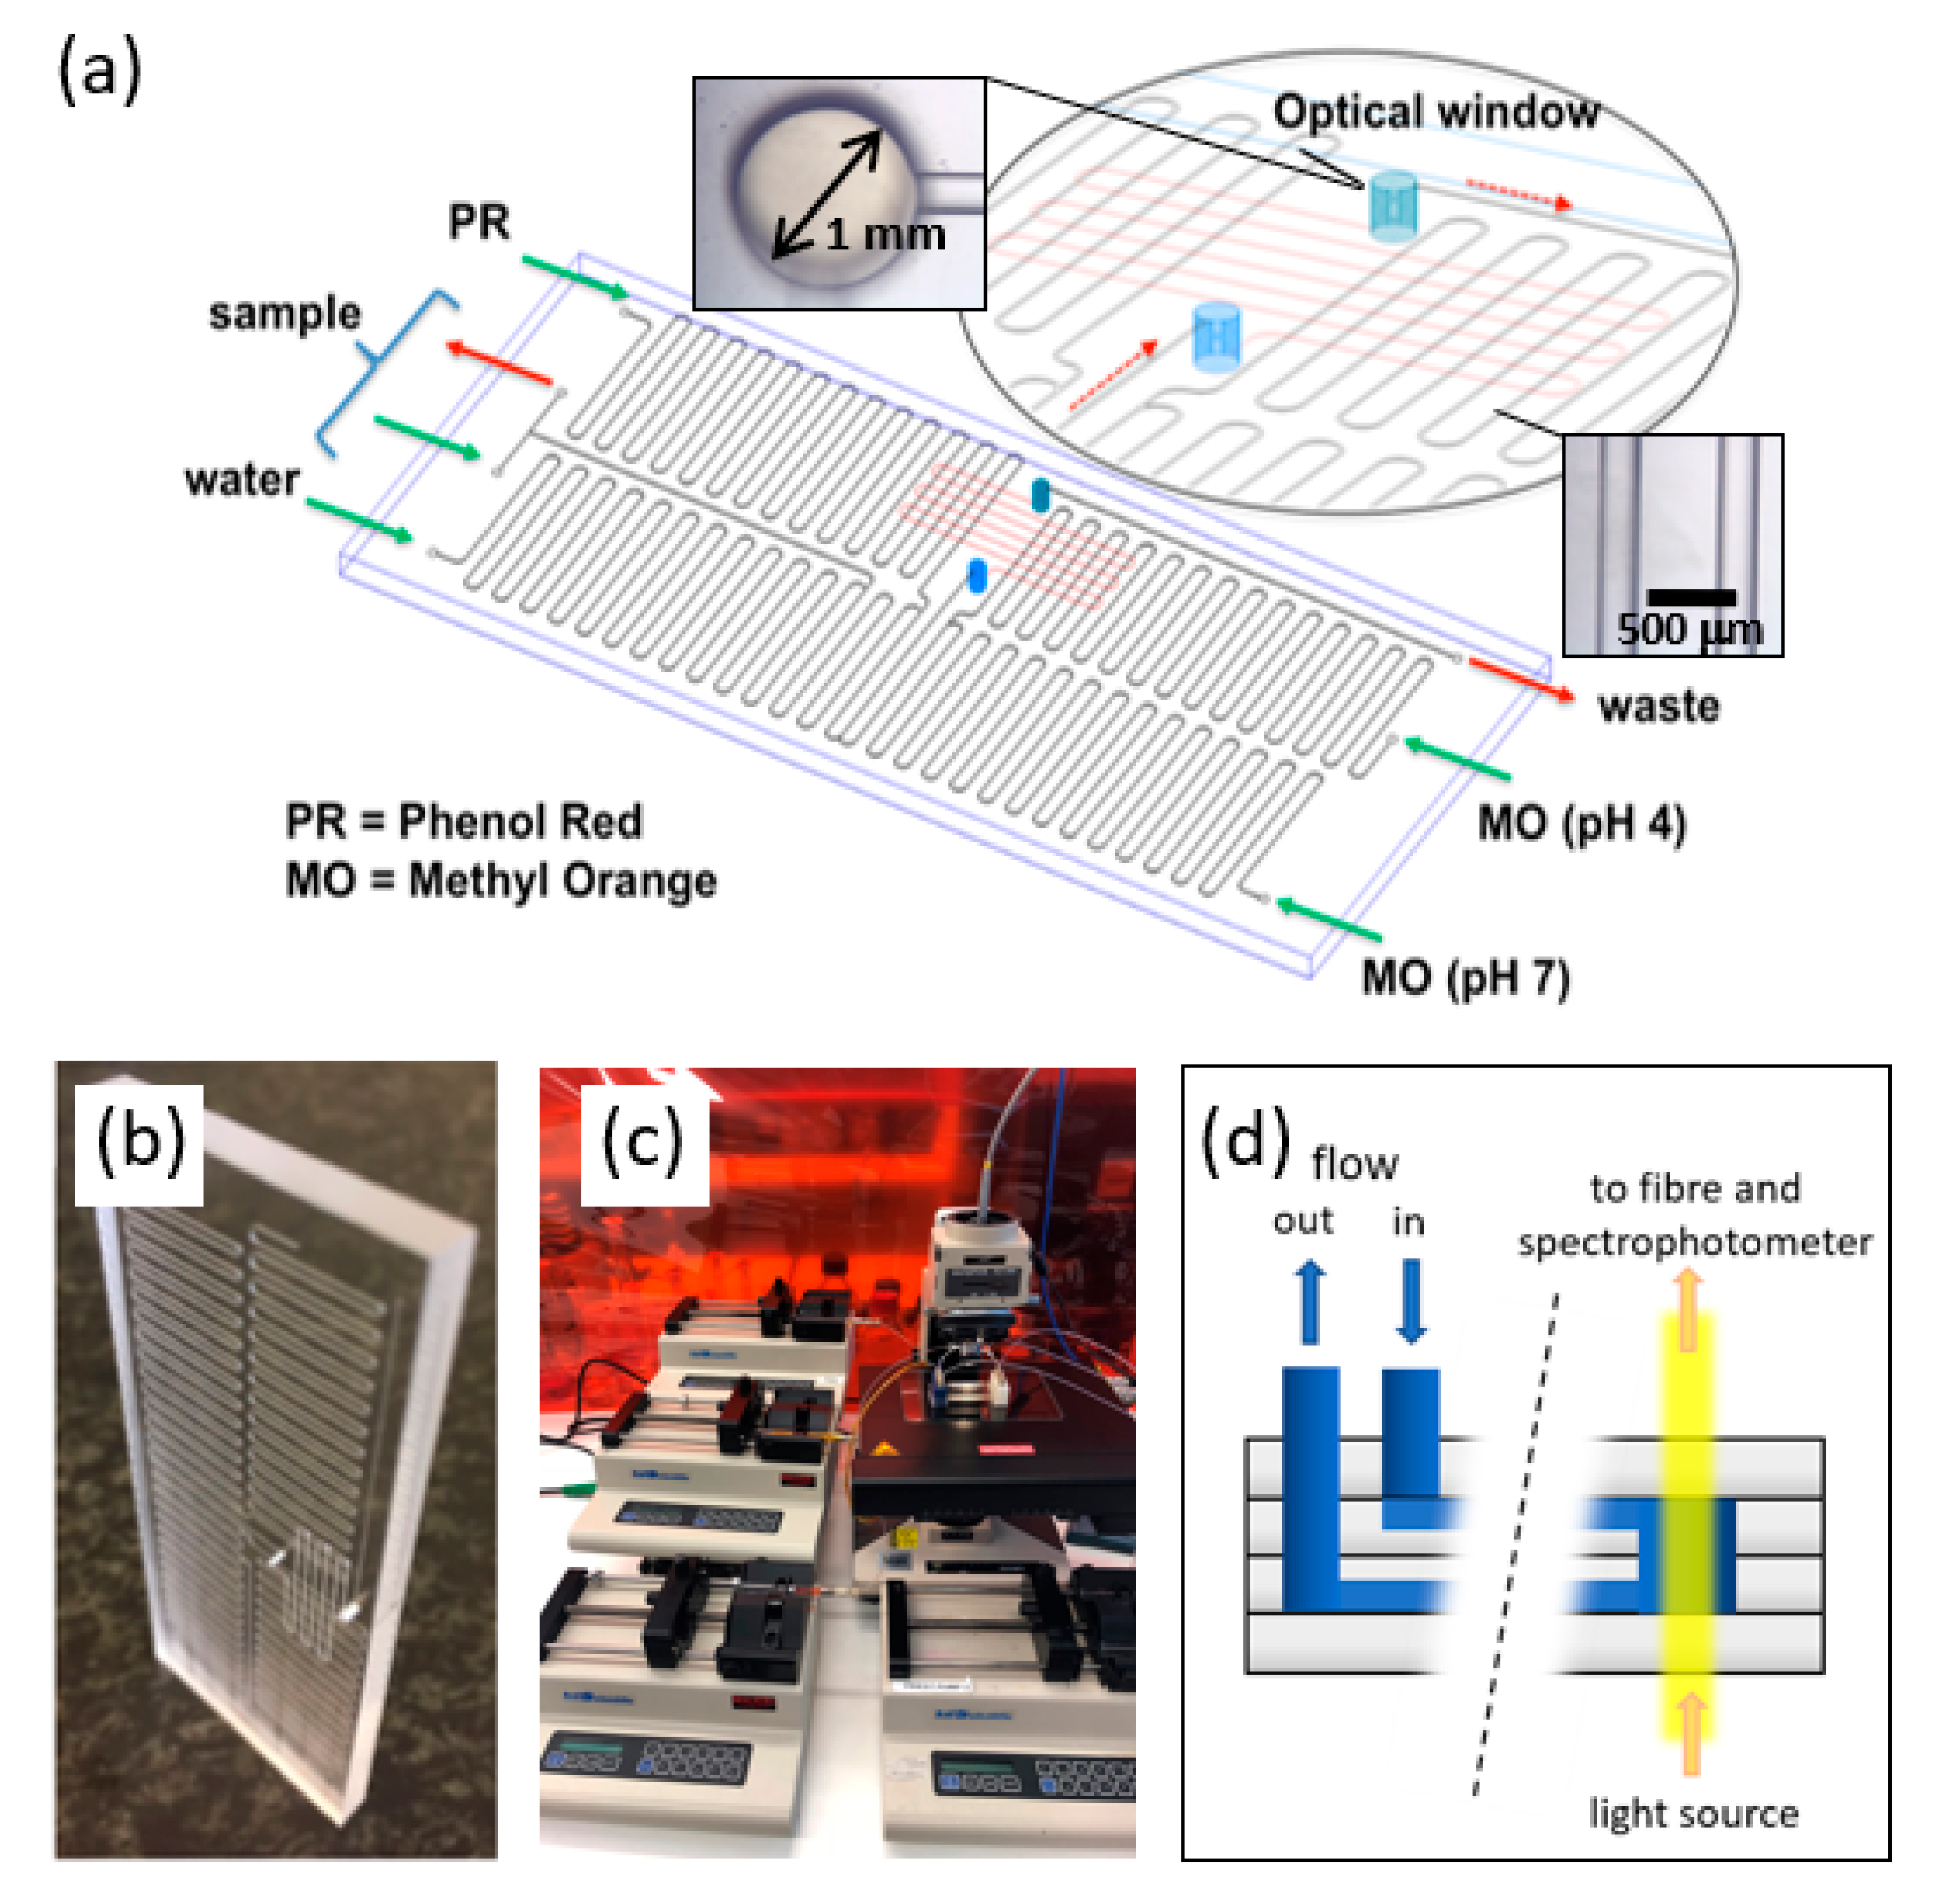
2.2. Chip Design and Preparation
2.3. Off-Chip Experiments
2.4. On-Chip Experiments
3. Results
3.1. Chip Function
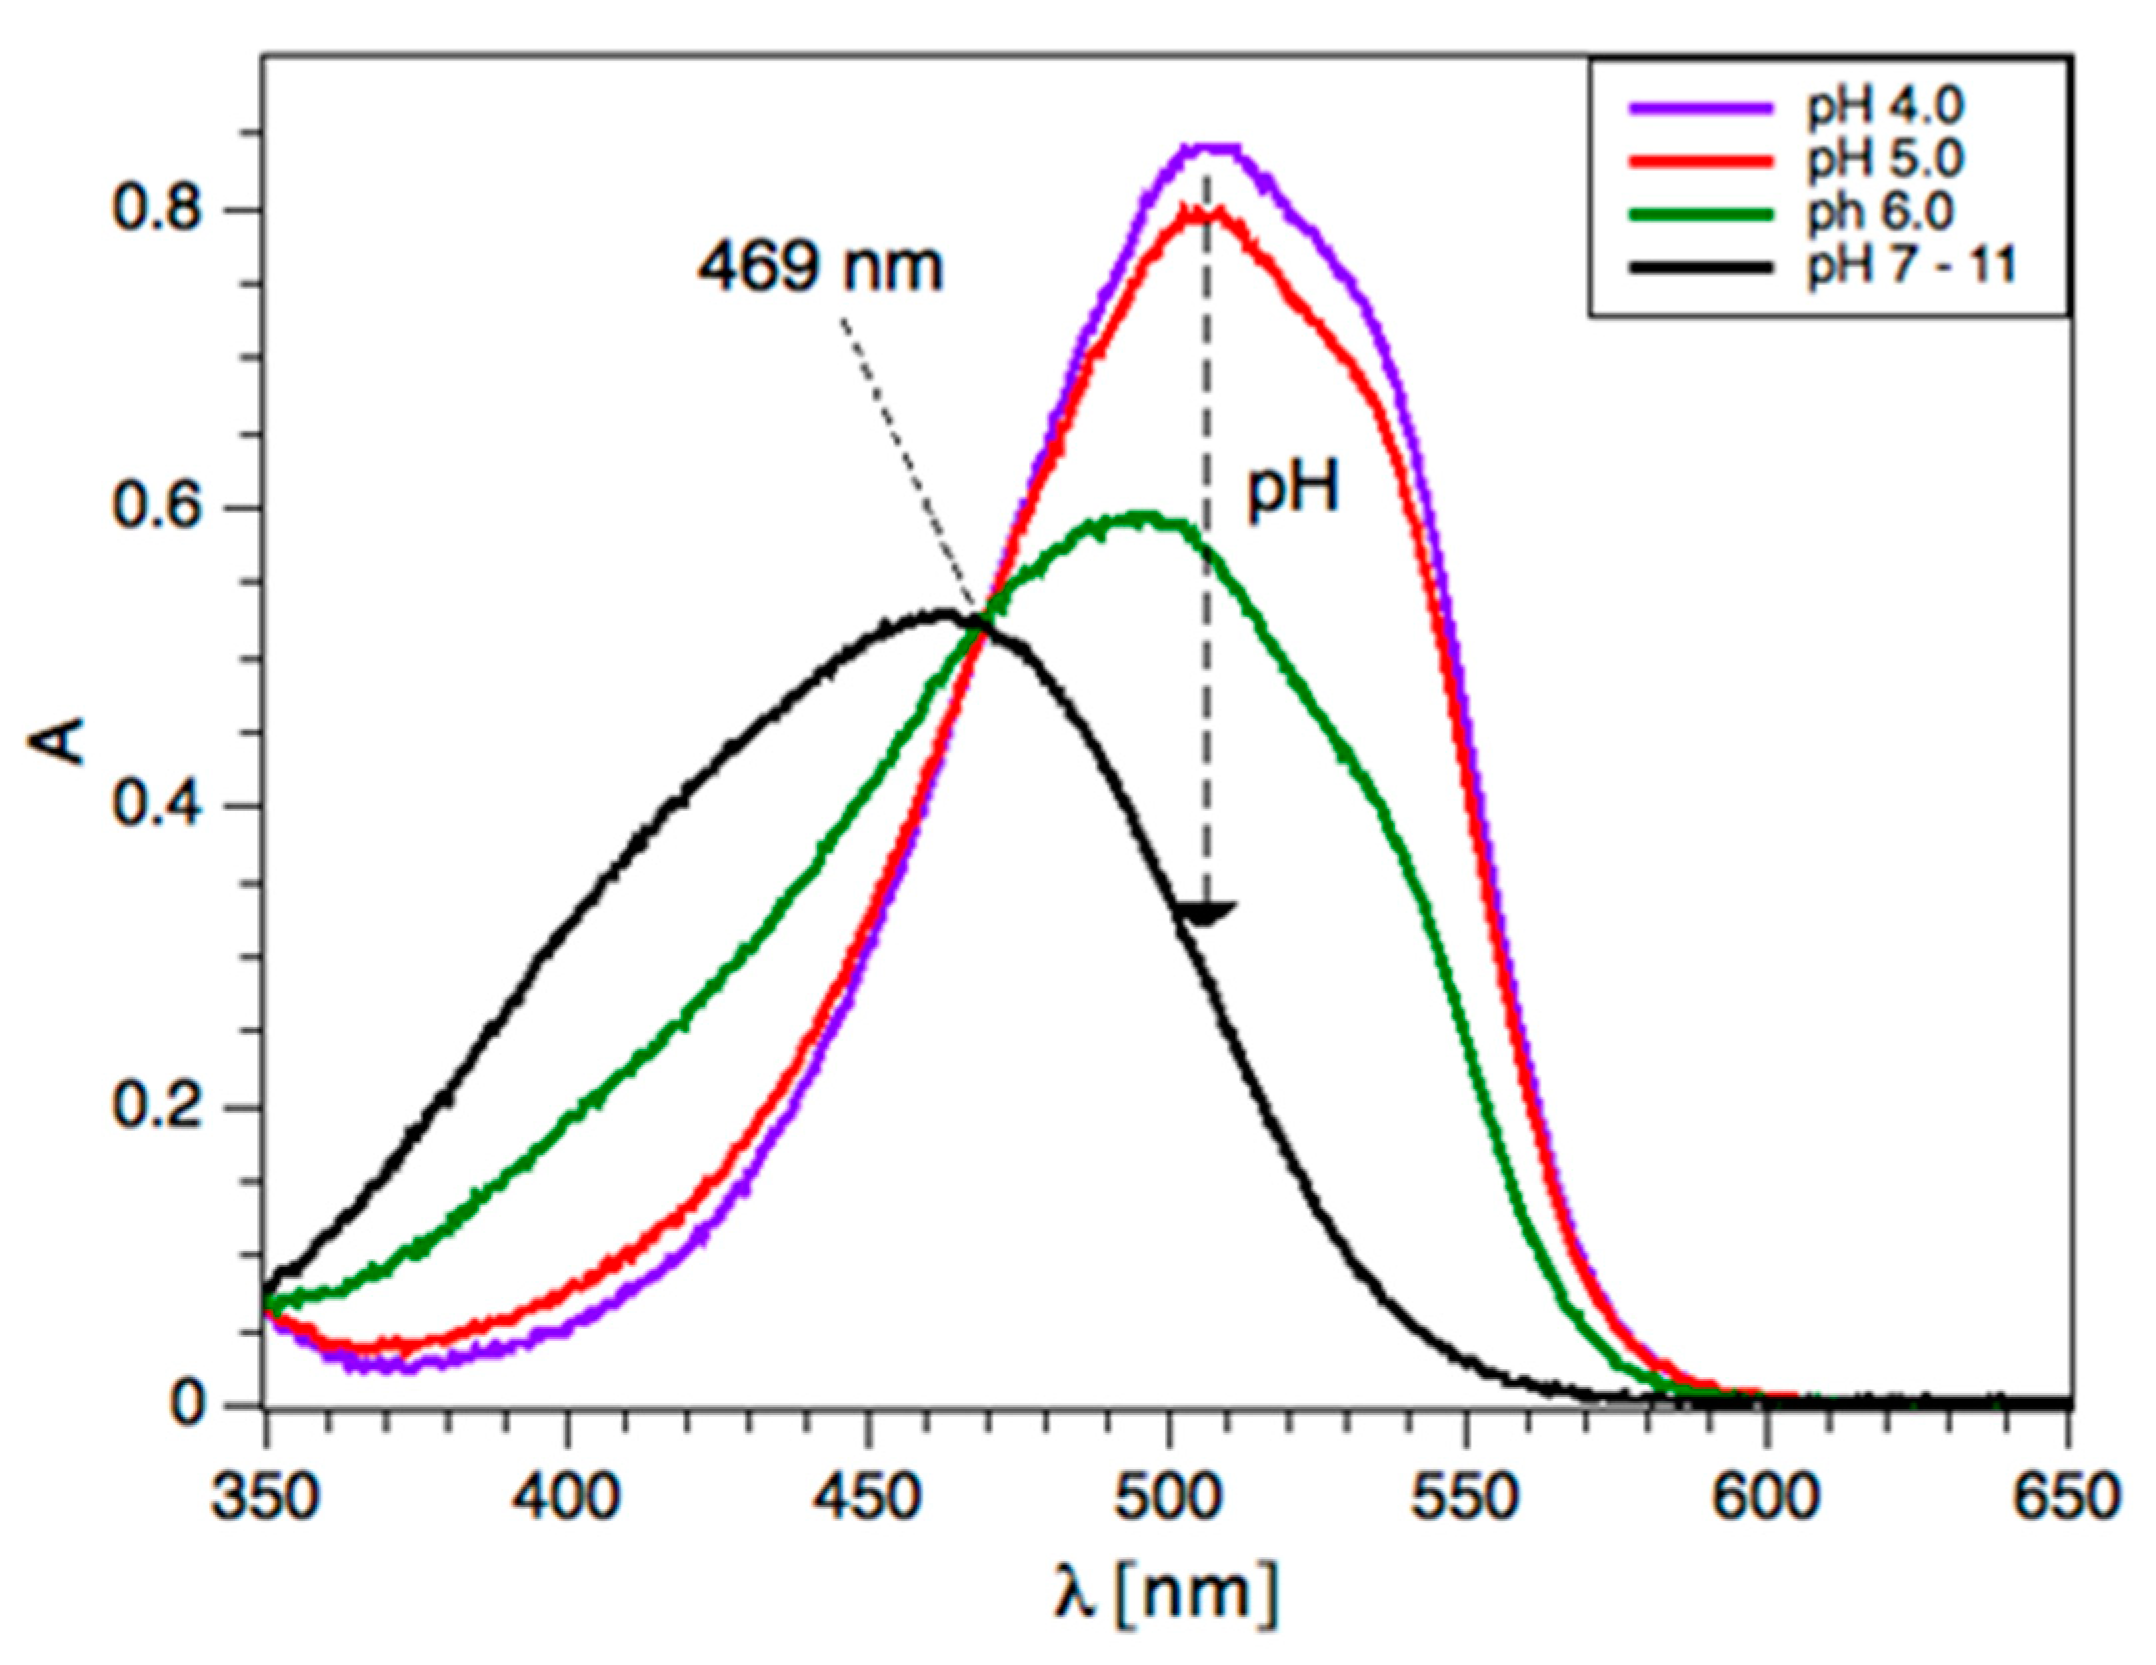
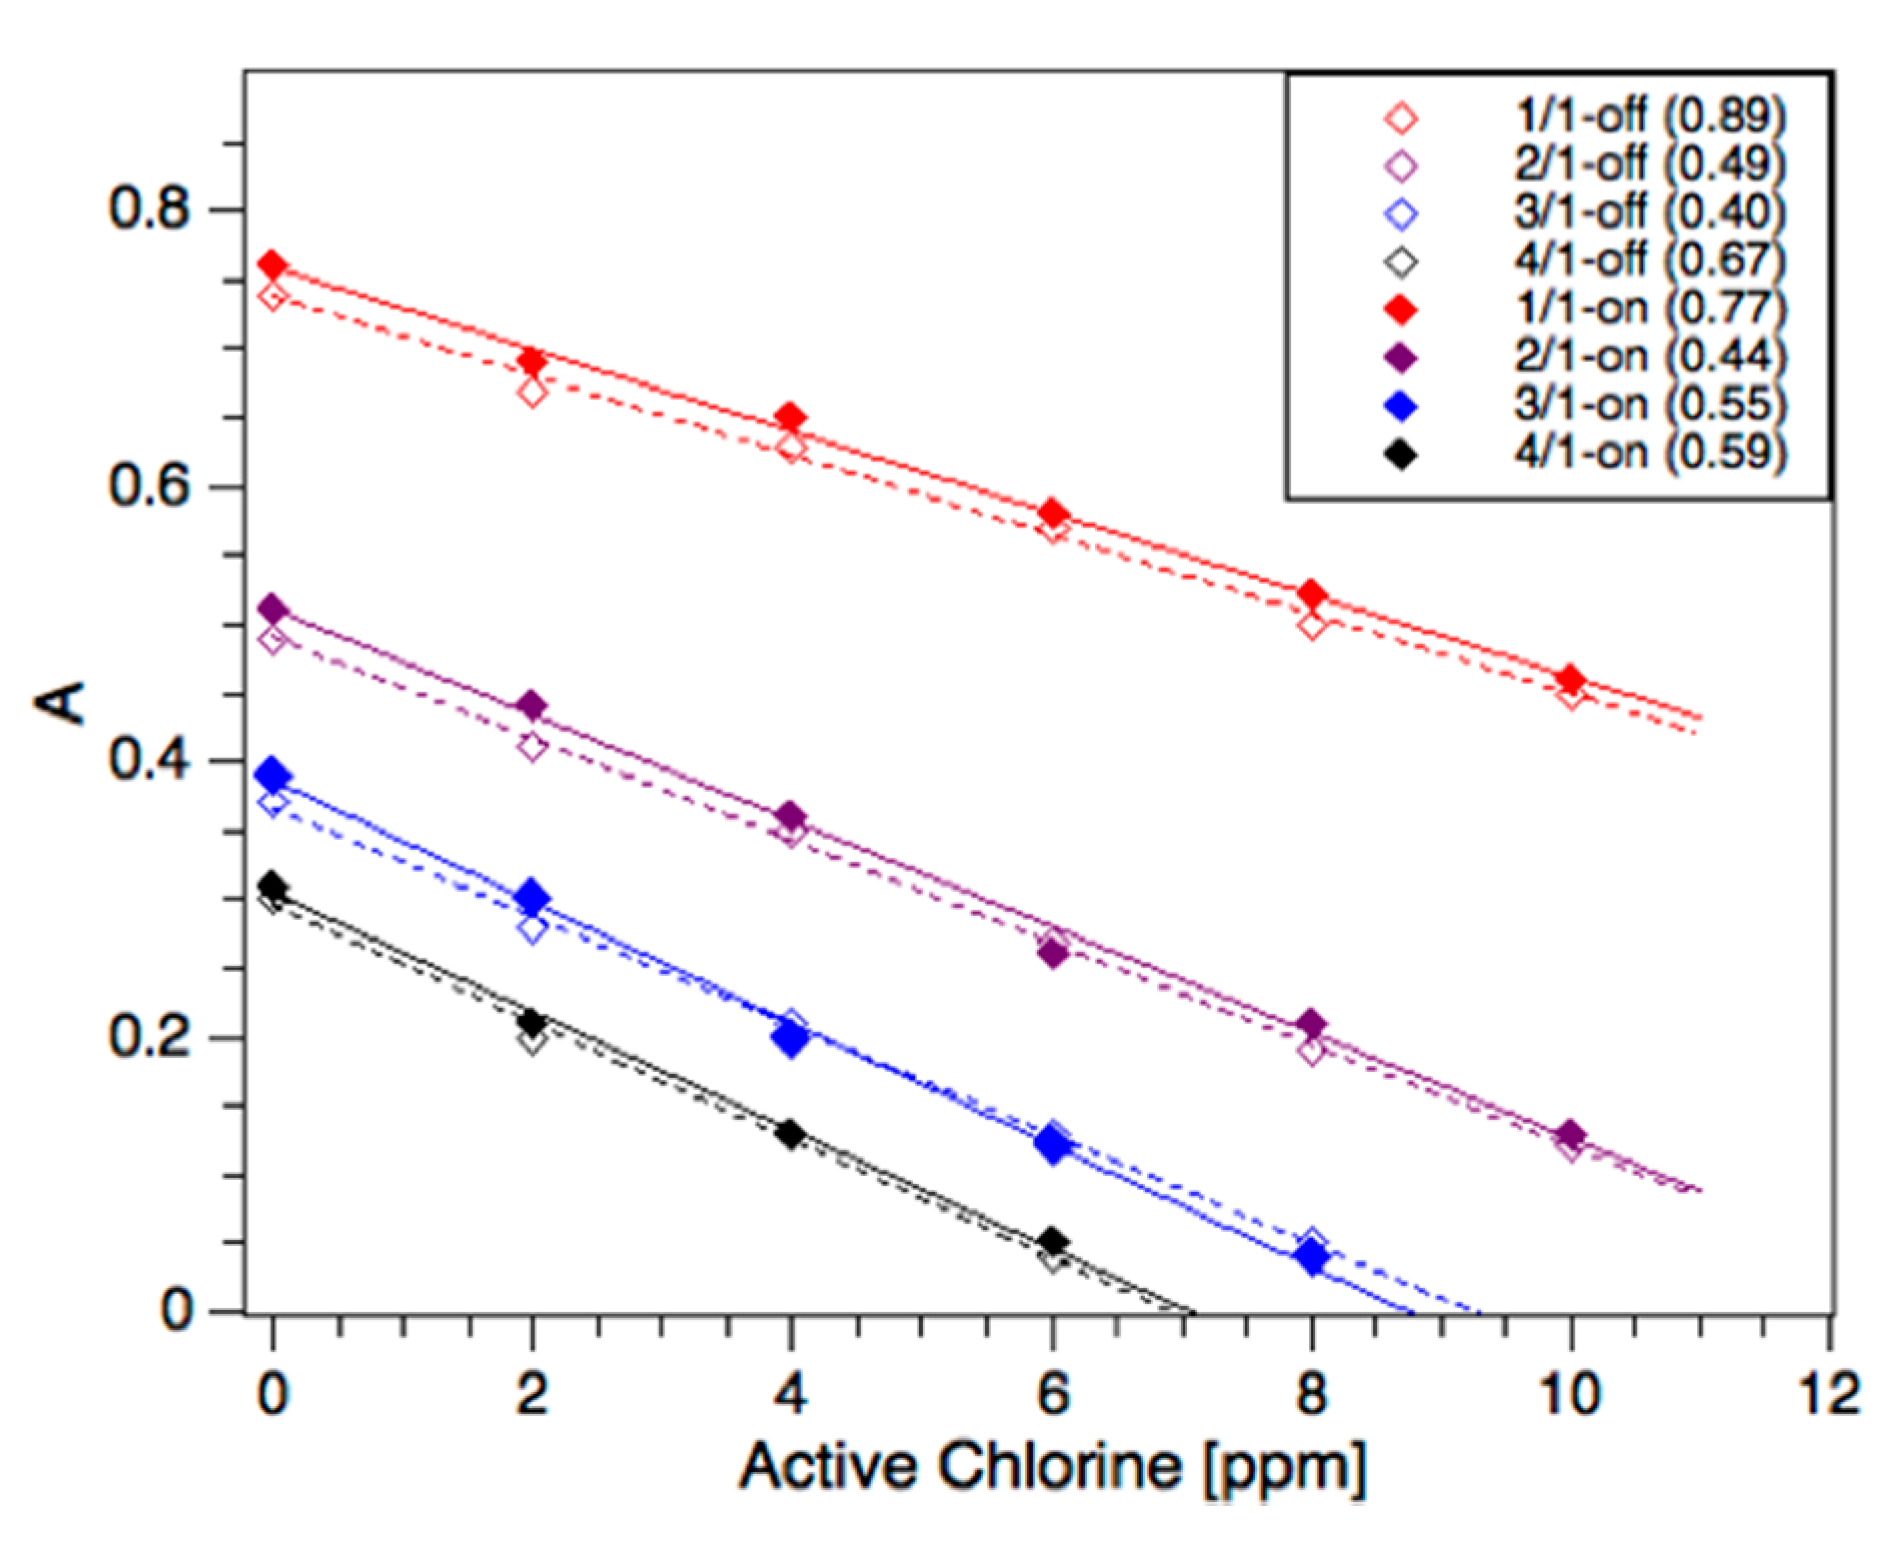
3.2. Active Chlorine
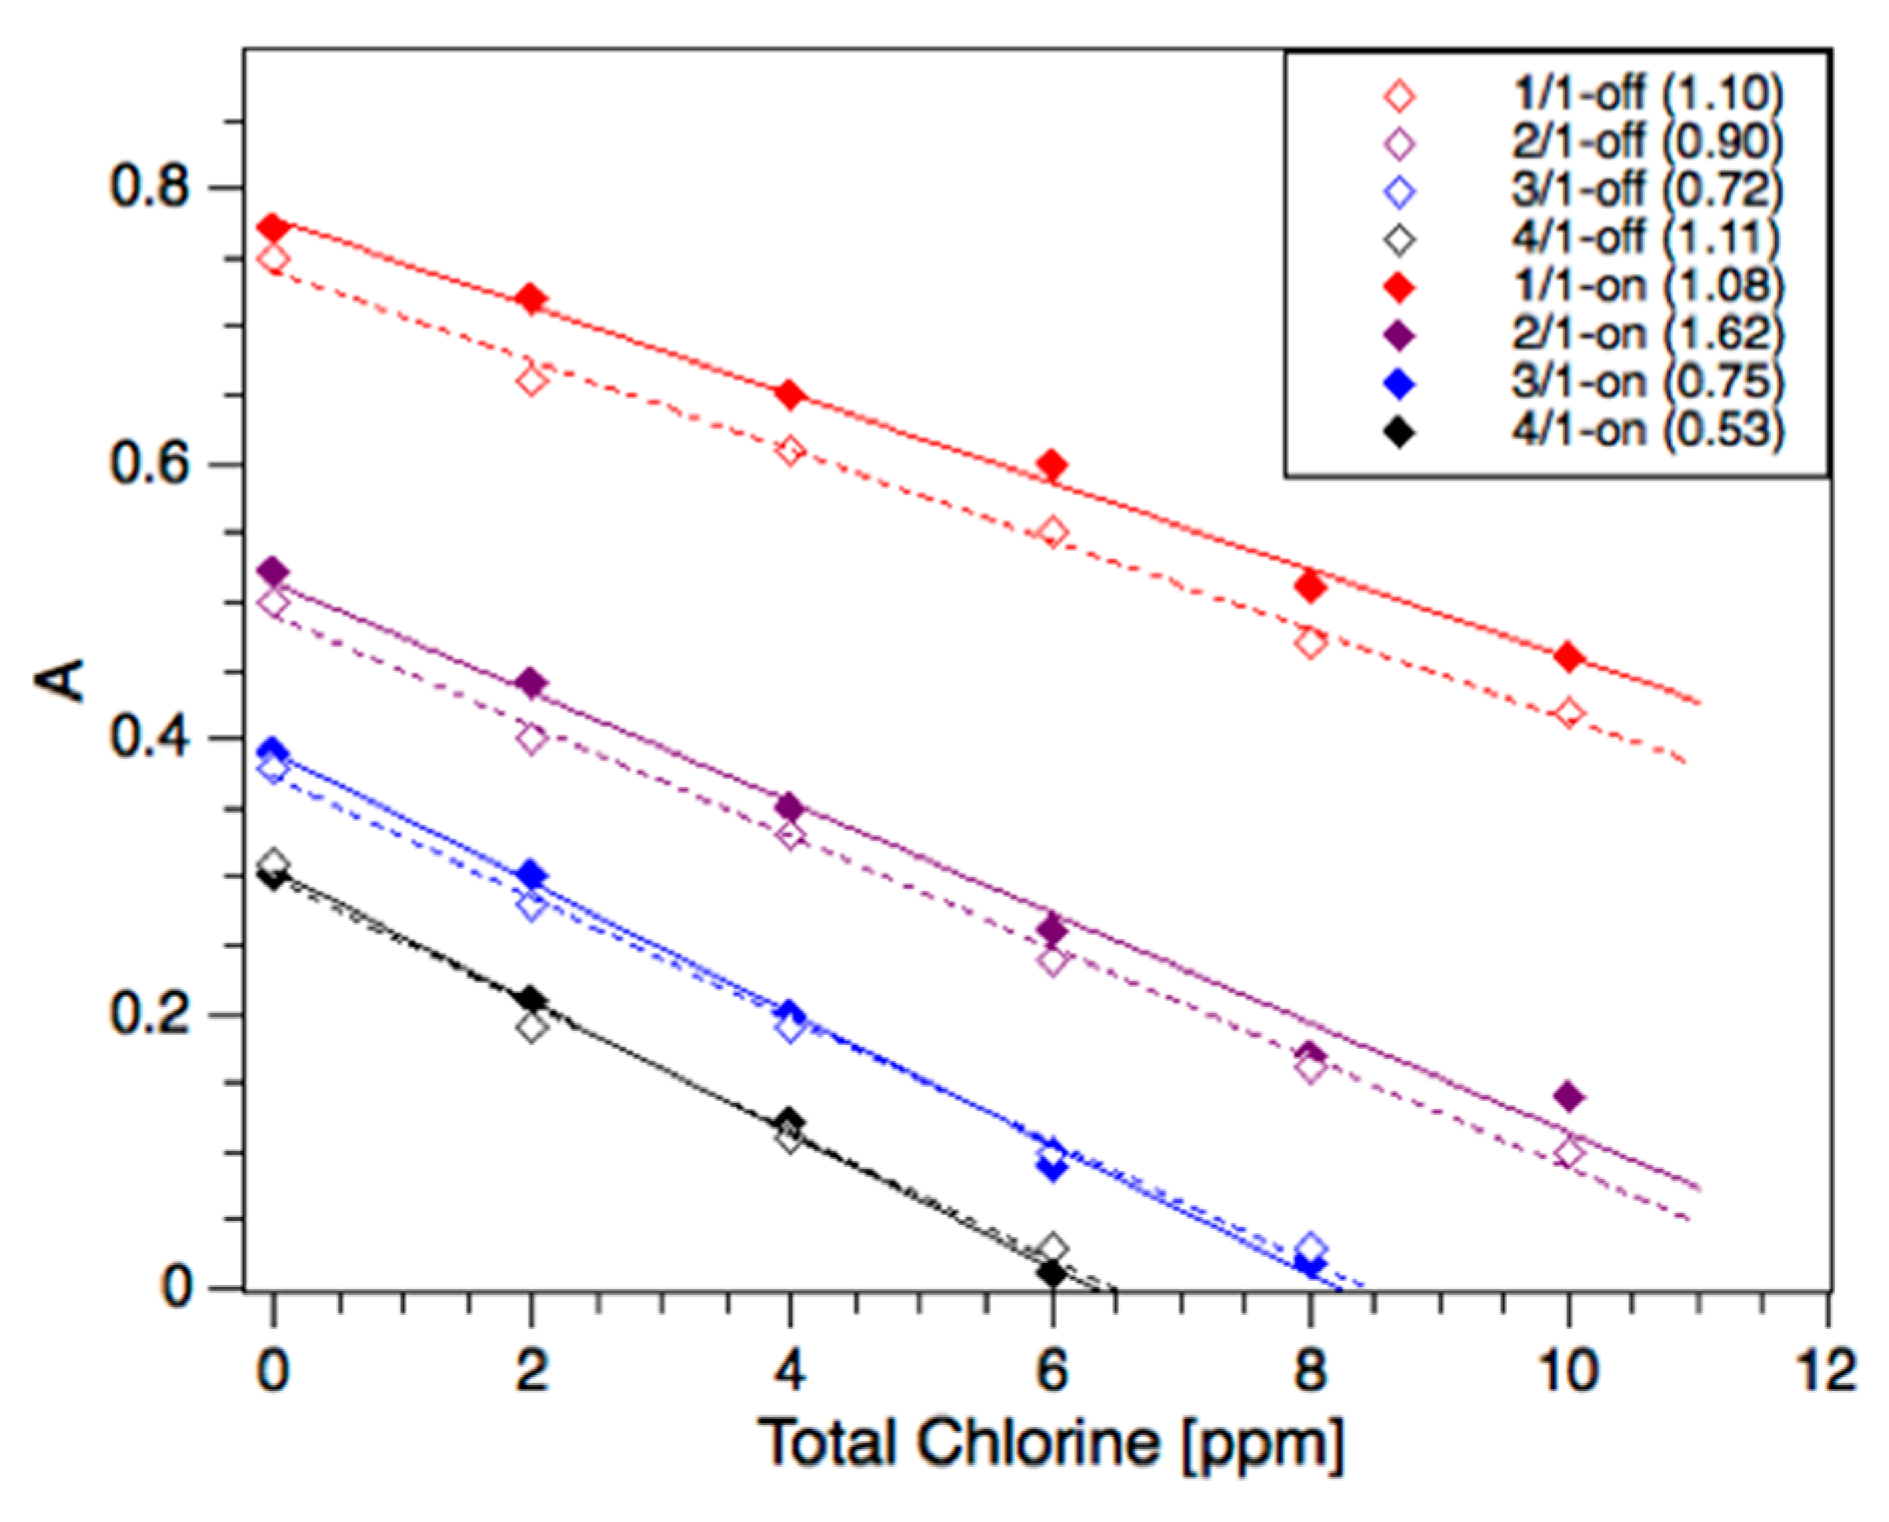
3.3. Total Chlorine
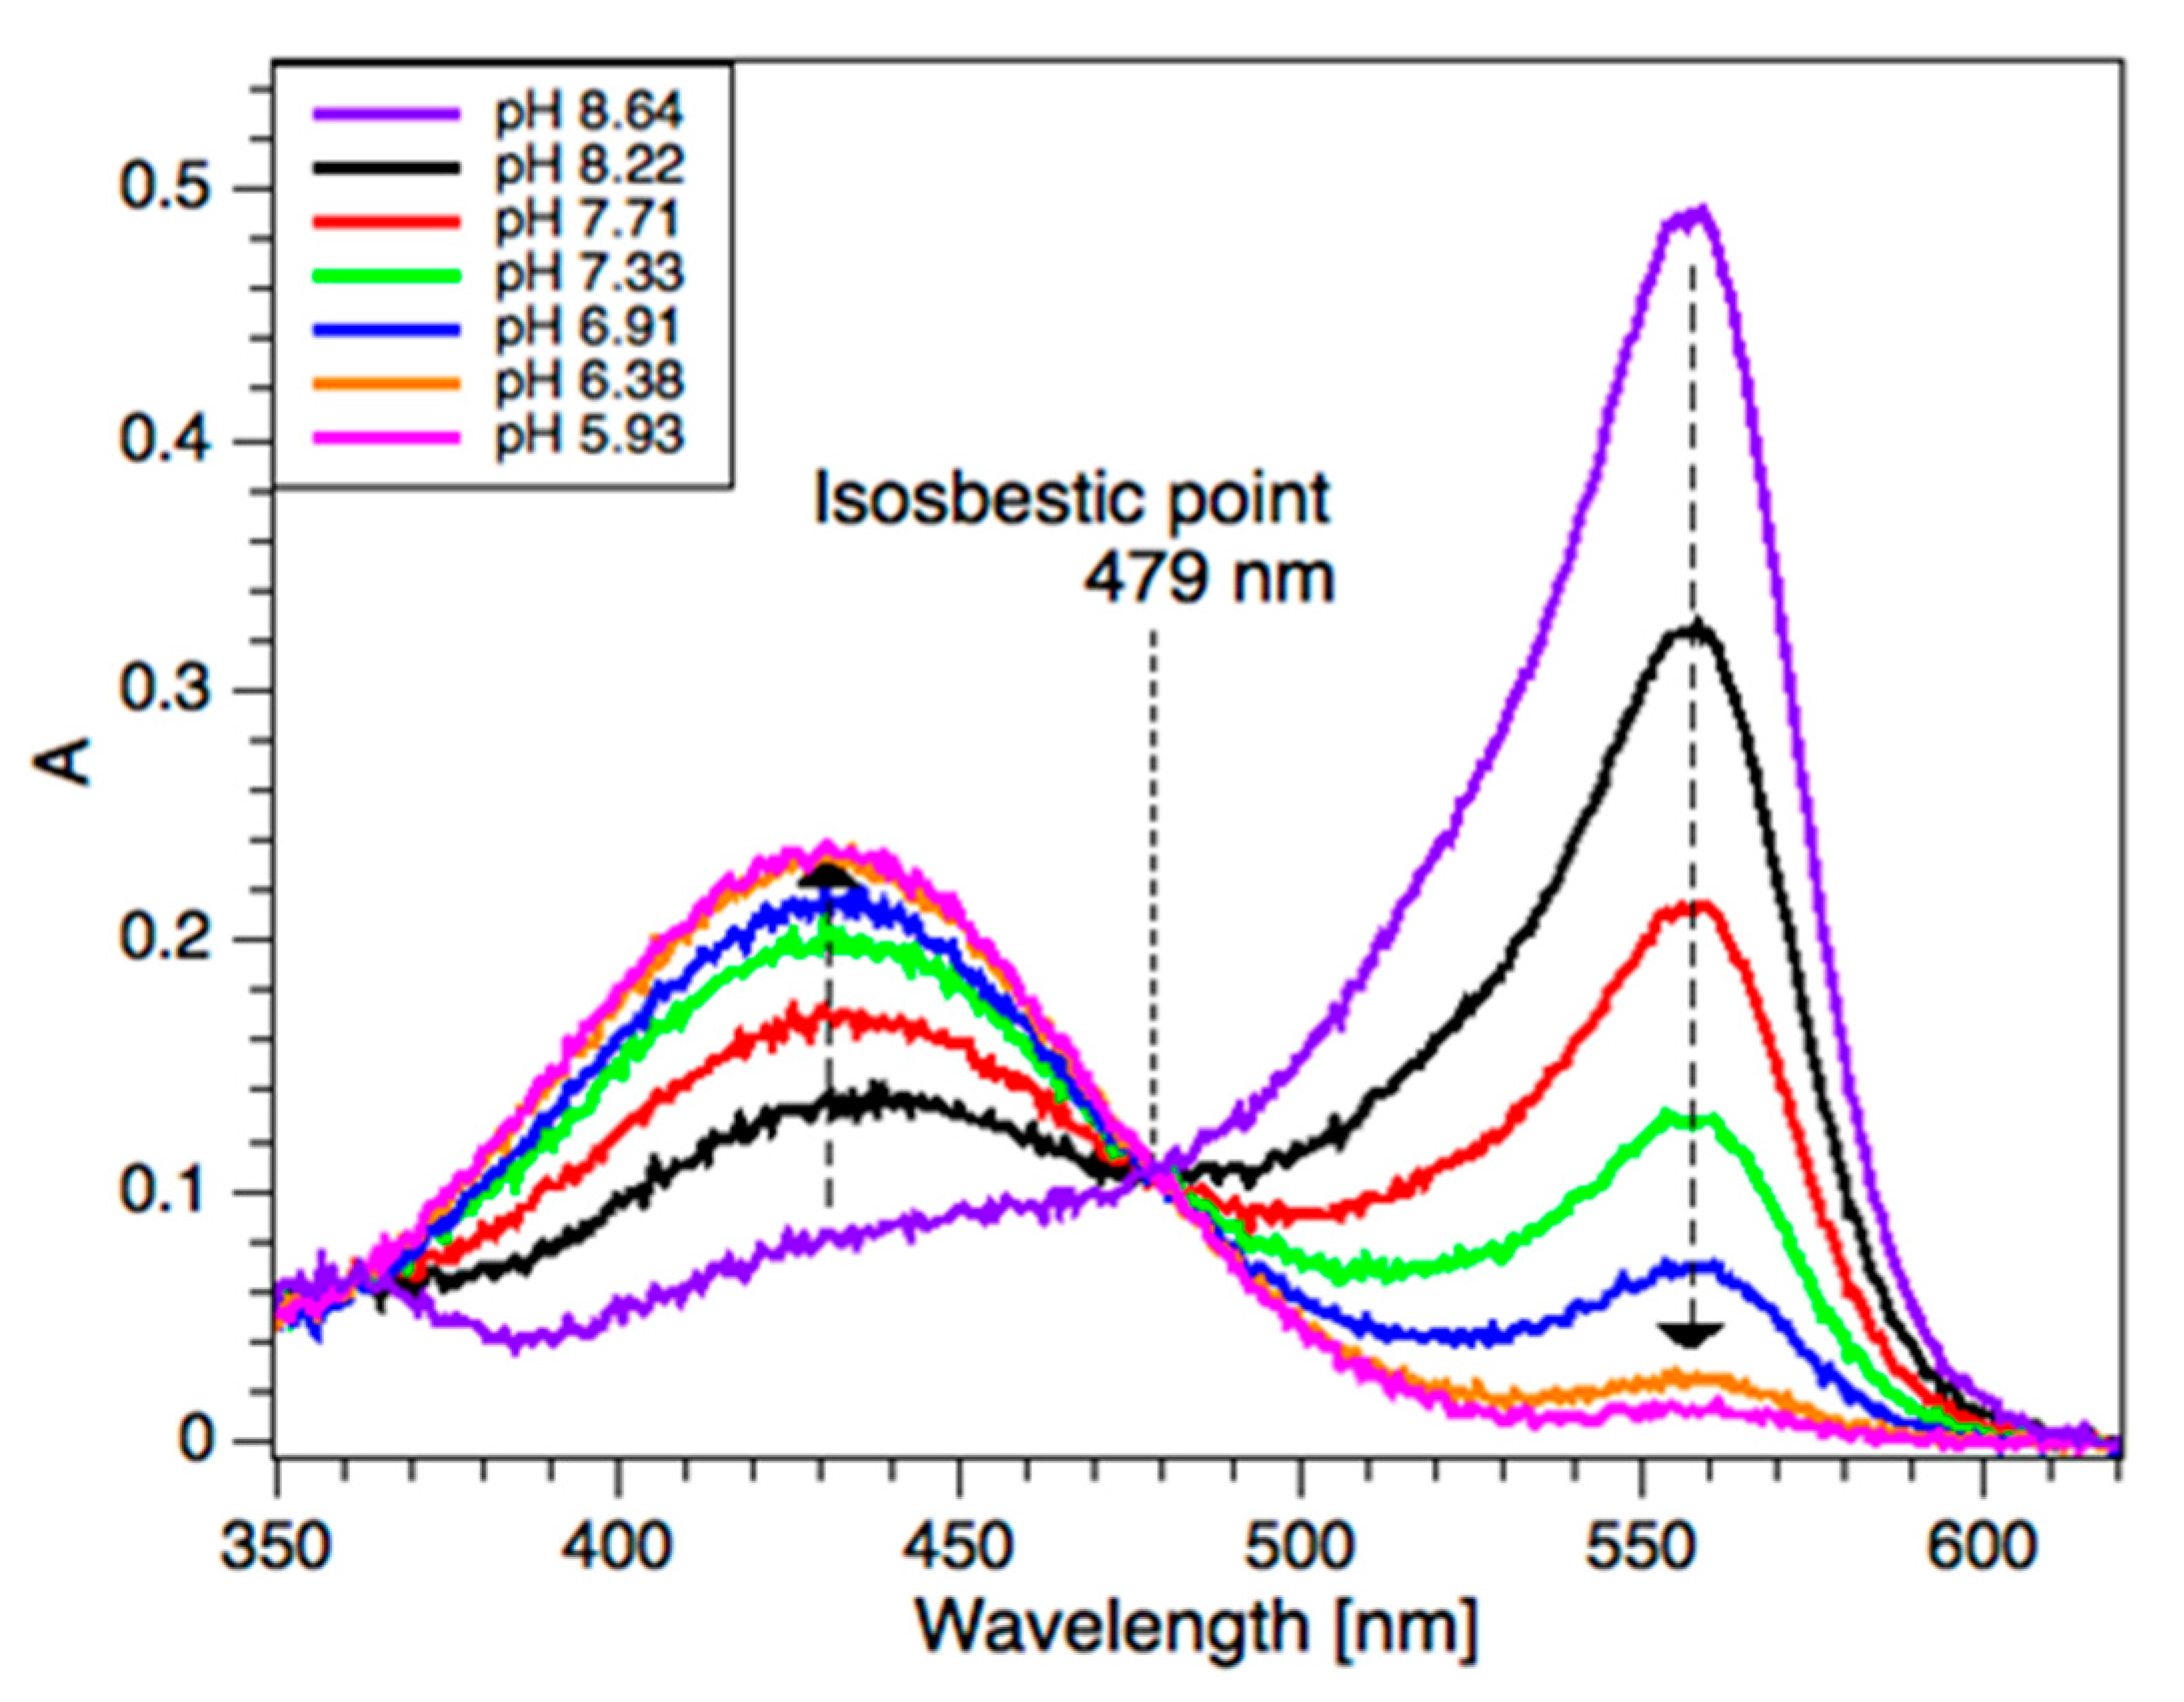
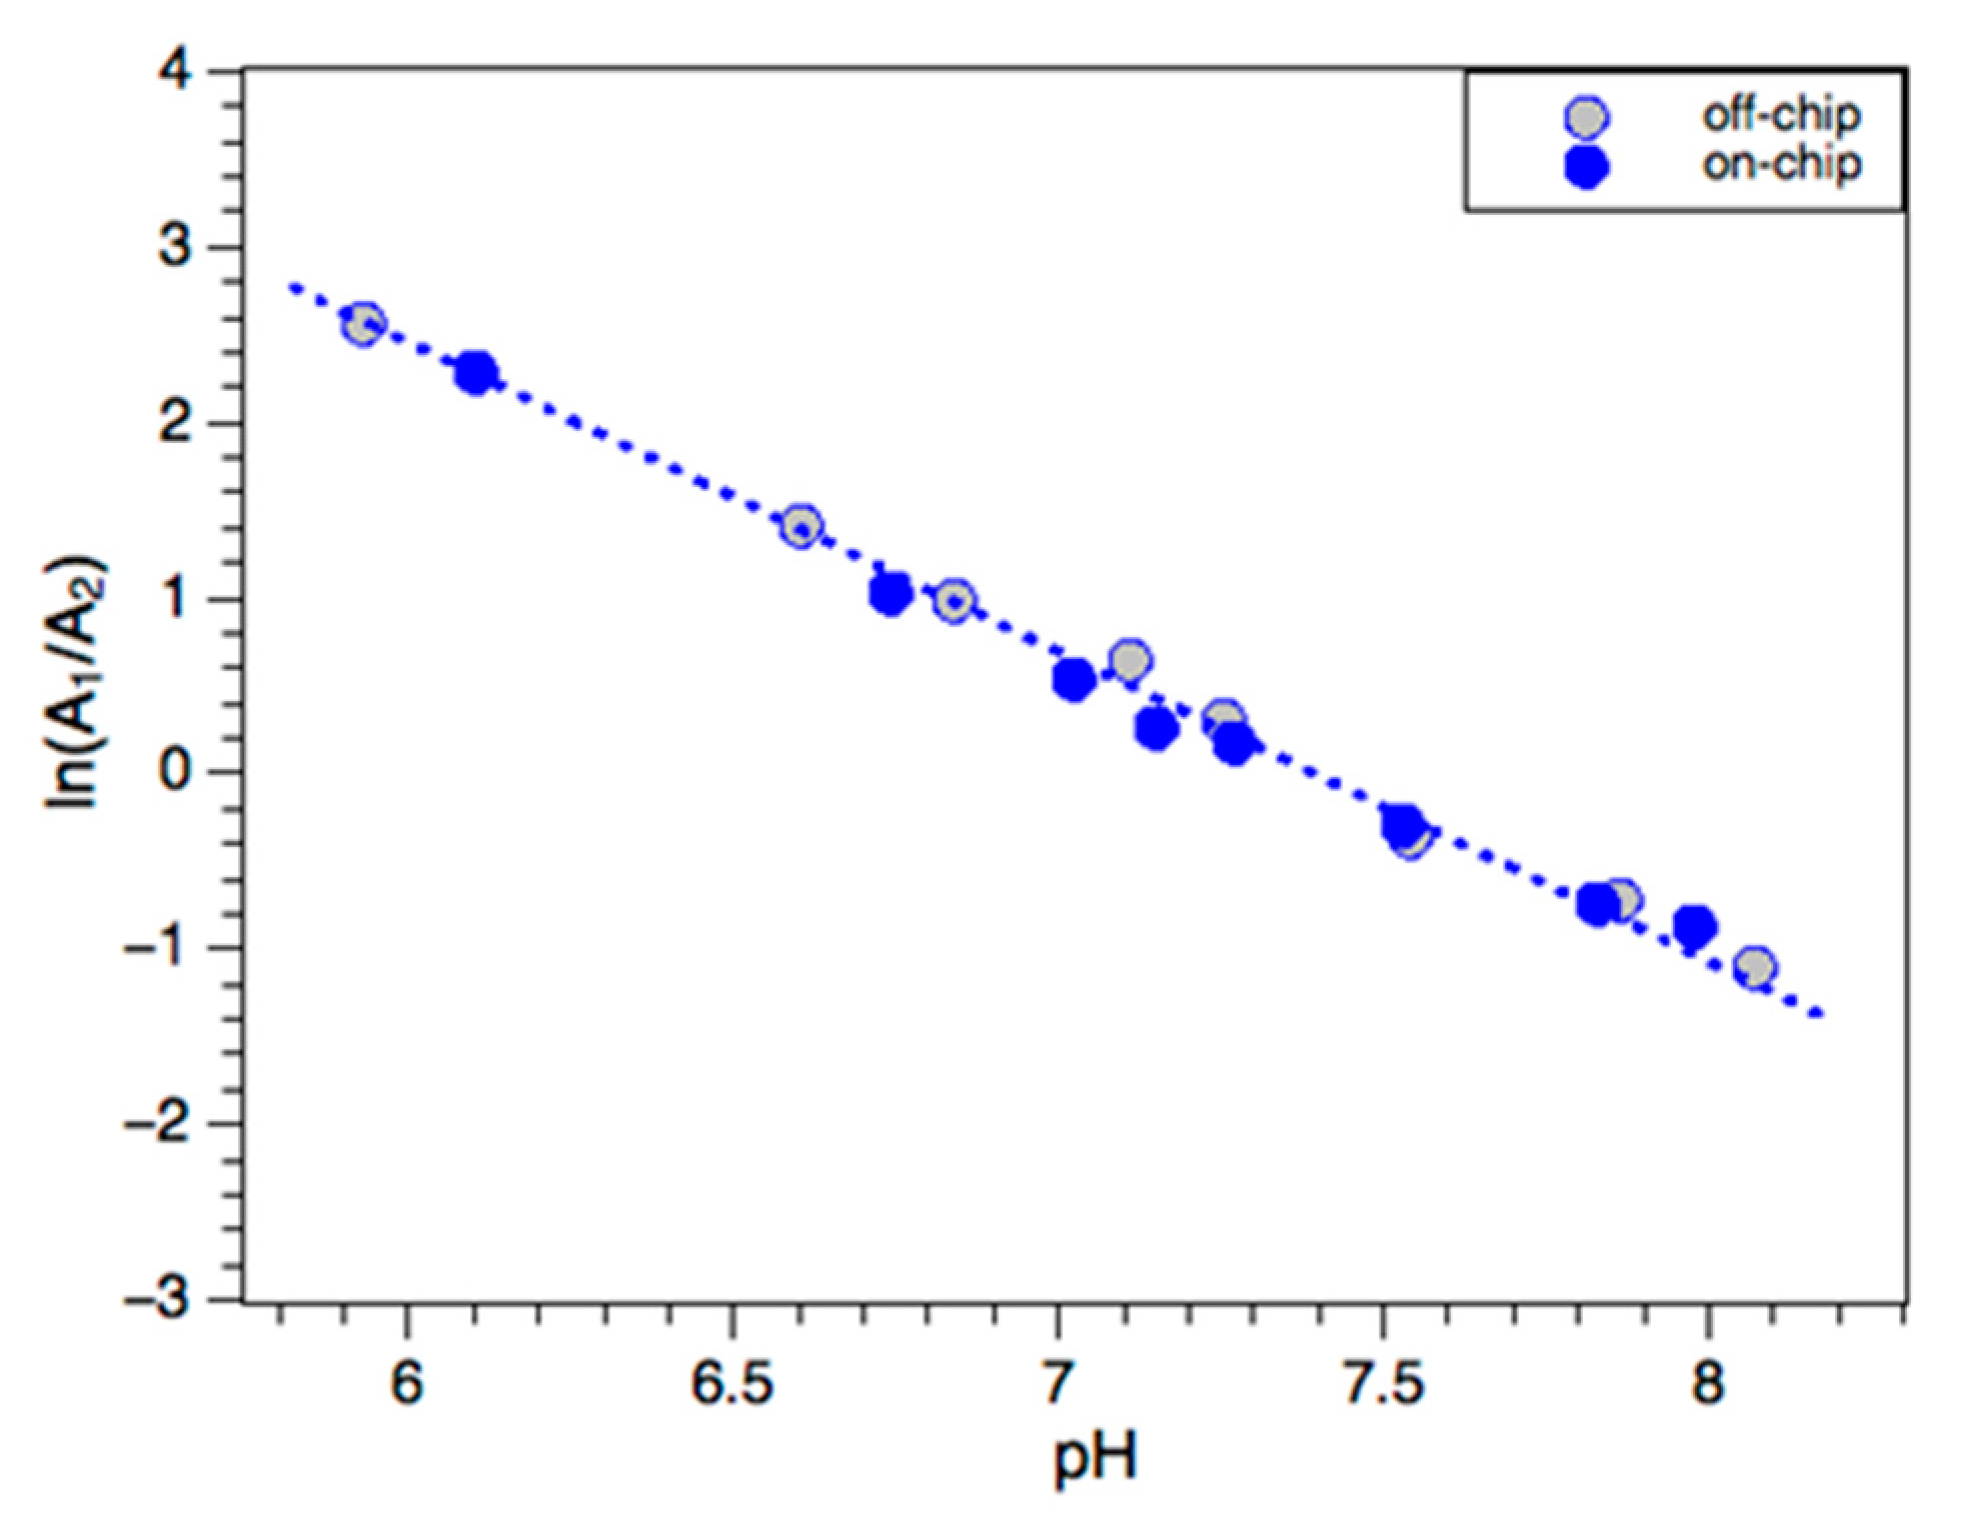
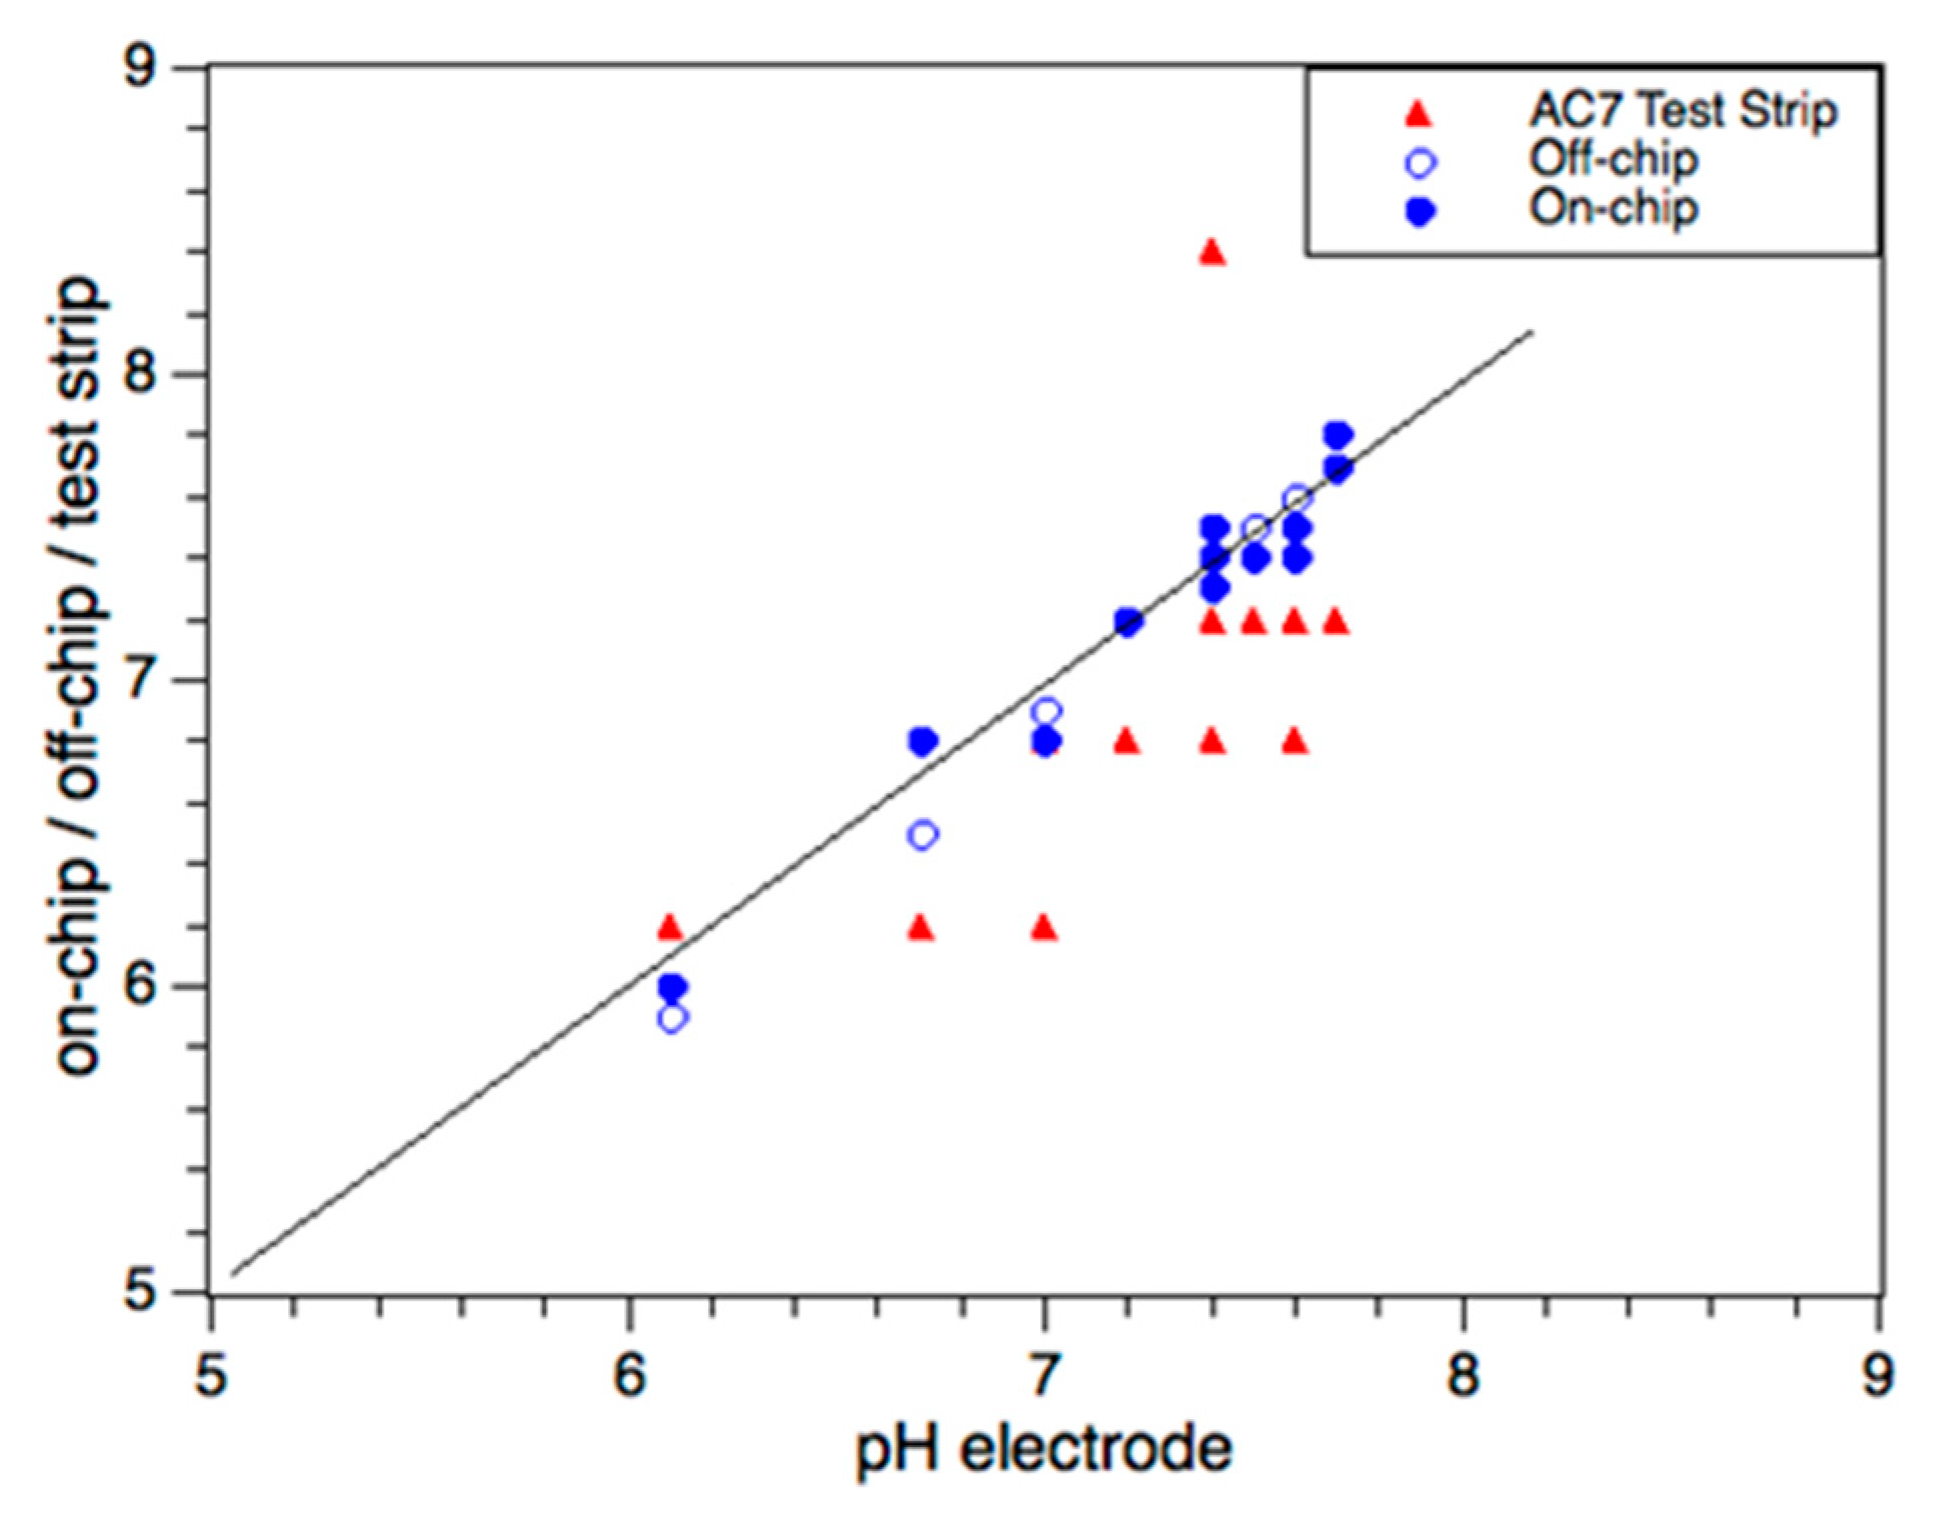
3.4. pH Analysis
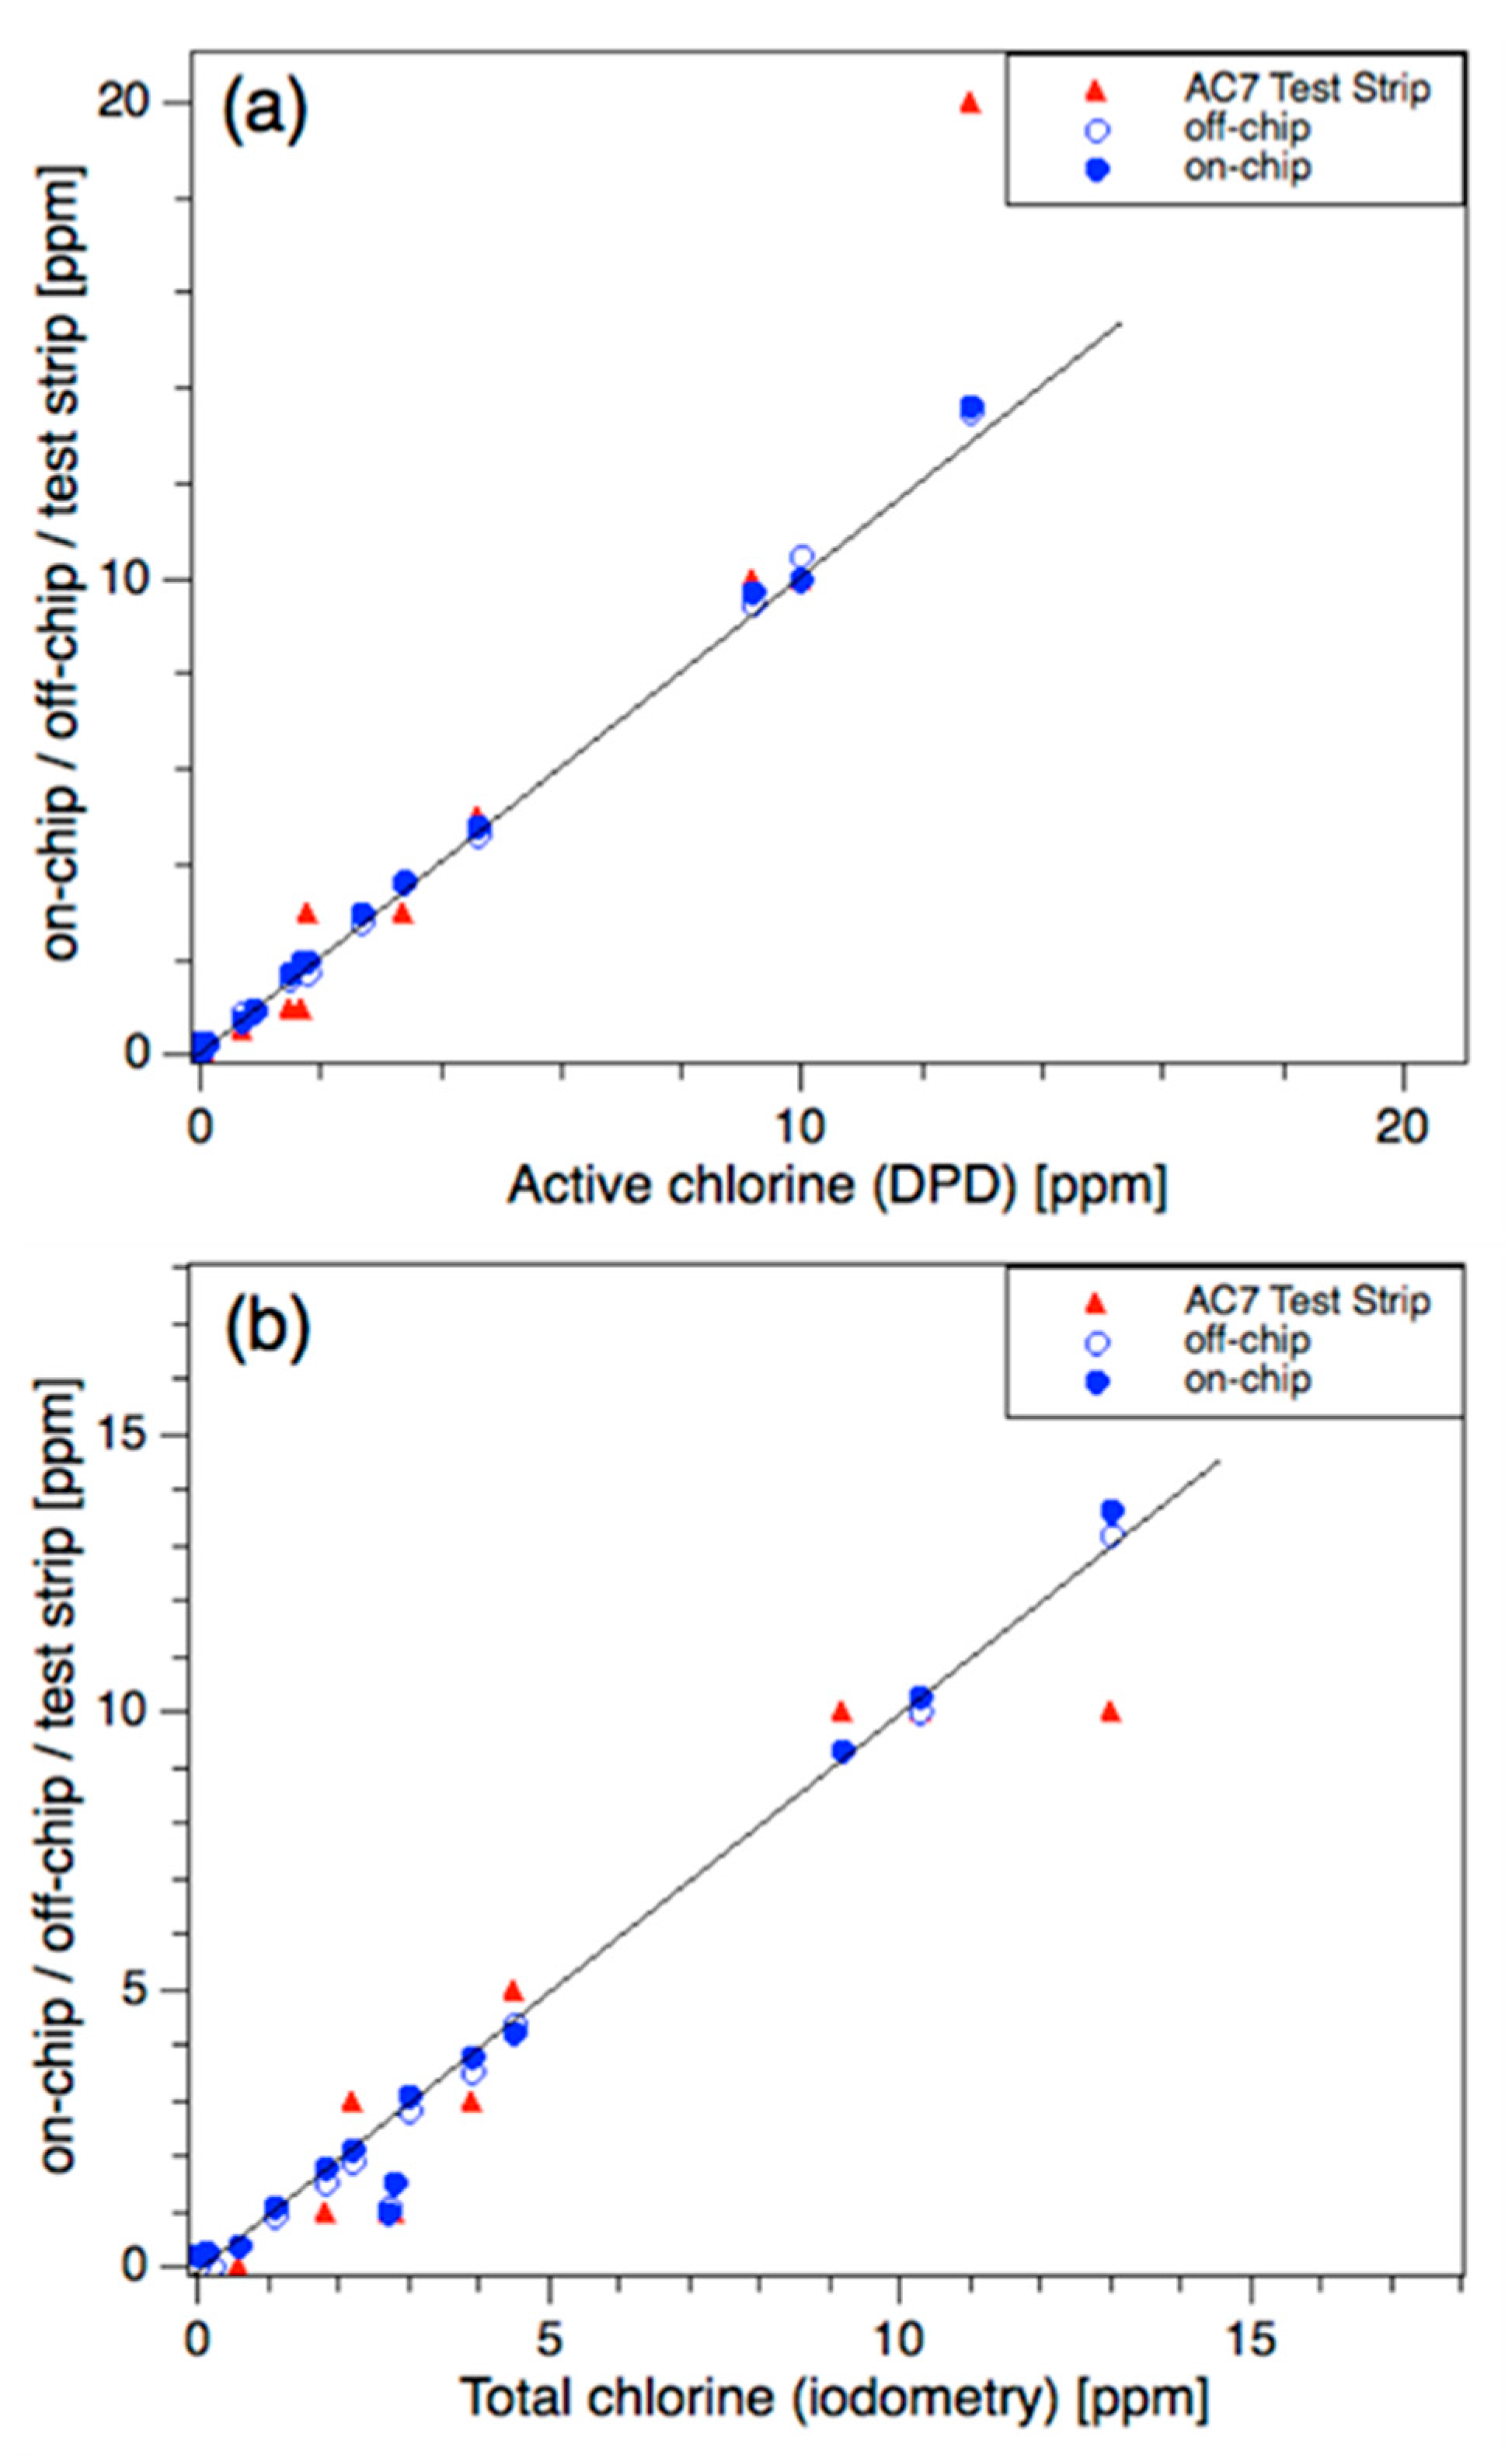
3.5. Testing Swimming Pools
4. Conclusions
Author Contributions
Funding
Acknowledgments
Conflicts of Interest
References
- Swimming Pool and Spa Water Chemistry. Swimming Pool and Spa Chemistry. Available online: https://www.nitt.edu/home/students/facilitiesnservices/sportscenter/swimmingpool/Swim-pool-chemistry.pdf (accessed on 28 April 2020).
- Public Swimming Pool and Spa Pool Advisory Document. Available online: http://www.health.nsw.gov.au/environment/Publications/Swimming-Pool-and-Spa-Advisory-doc.pdf (accessed on 28 April 2020).
- Gray, M.J.; Wholey, W.-Y.; Jakob, U. Bacterial Responses to Reactive Chlorine Species. Annu. Rev. Microbiol. 2013, 67, 141–160. [Google Scholar] [CrossRef] [PubMed] [Green Version]
- Bharate, S.B.; Khan, S.I.; Tekwani, B.L.; Jacob, M.; Khan, I.A.; Singh, I.P. S-Euglobals: Biomimetic synthesis, antileishmanial, antimalarial, and antimicrobial activities. Bioorg. Med. Chem. 2008, 16, 1328–1336. [Google Scholar] [CrossRef] [PubMed]
- Zanoni, M.V.B.; Sene, J.J.; Selcuk, H.; Anderson, M.A. Photoelectrocatalytic Production of Active Chlorine on Nanocrystalline Titanium Dioxide Thin-Film Electrodes. Environ. Sci. Technol. 2004, 38, 3203–3208. [Google Scholar] [CrossRef] [PubMed]
- Yao, X.; Liu, X.; Zhu, D.; Zhao, C.; Lu, L. Synthesis of cube-like Ag/AgCl plasmonic photocatalyst with enhanced visible light photocatalytic activity. Catal. Commun. 2015, 59, 151–155. [Google Scholar] [CrossRef]
- Wang, P.; Huang, B.; Qin, X.; Zhang, X.; Dai, Y.; Wei, J.; Whangbo, M.-H. Ag@AgCl: A Highly Efficient and Stable Photocatalyst Active under Visible Light. Angew. Chem. Int. Ed. 2008, 47, 7931–7933. [Google Scholar] [CrossRef]
- Zhang, H.; Fan, X.; Quan, X.; Chen, S.; Yu, H. Graphene Sheets Grafted Ag@AgCl Hybrid with Enhanced Plasmonic Photocatalytic Activity under Visible Light. Environ. Sci. Technol. 2011, 45, 5731–5736. [Google Scholar] [CrossRef]
- Elmas, S.; Ambroz, F.; Chugh, D.; Nann, T. Microfluidic Chip for the Photocatalytic Production of Active Chlorine. Langmuir 2016, 32, 4952–4958. [Google Scholar] [CrossRef]
- Kraft, A. Electrochemical Water Disinfection: A Short Review. Platin. Met. Rev. 2008, 52, 177–185. [Google Scholar] [CrossRef]
- Bergmann, M.E.H.; Koparal, A.S. Studies on electrochemical disinfectant production using anodes containing RuO2. J. Appl. Electrochem. 2005, 35, 1321–1329. [Google Scholar] [CrossRef]
- Bergmann, M.E.H.; Rollin, J. Product and by-product formation in laboratory studies on disinfection electrolysis of water using boron-doped diamond anodes. Catal. Today 2007, 124, 198–203. [Google Scholar] [CrossRef]
- Elmas, S.; Gedefaw, D.A.; Larsson, M.; Ying, Y.; Cavallaro, A.; Andersson, G.G.; Nydén, M.; Andersson, M.R. Porous PEI Coating for Copper Ion Storage and Its Controlled Electrochemical Release. Adv. Sustain. Syst. 2020, 4, 1900123. [Google Scholar] [CrossRef]
- Westerhoff, P.; Chao, P.; Mash, H. Reactivity of natural organic matter with aqueous chlorine and bromine. Water Res. 2004, 38, 1502–1513. [Google Scholar] [CrossRef] [PubMed]
- Nowell, L.H.; Hoigné, J. Photolysis of aqueous chlorine at sunlight and ultraviolet wavelengths-II. Hydroxyl radical production. Water Res. 1992, 26, 599–605. [Google Scholar] [CrossRef]
- Feng, Y.; Smith, D.W.; Bolton, J.R. Photolysis of aqueous free chlorine species (HOCl and OCl) with 254 nm ultraviolet light. J. Environ. Eng. Sci. 2007, 6, 277–284. [Google Scholar] [CrossRef] [Green Version]
- Watts, M.J.; Linden, K.G. Chlorine photolysis and subsequent OH radical production during UV treatment of chlorinated water. Water Res. 2007, 41, 2871–2878. [Google Scholar] [CrossRef]
- Simpson, K.L.; Hayes, K.P. Drinking water disinfection by-products: An Australian perspective. Water Res. 1998, 32, 1522–1528. [Google Scholar] [CrossRef]
- Theiss, J.C.; Stoner, G.D.; Shimkin, M.B.; Weisburger, E.K. Test for carcinogenicity of organic contaminants of United States drinking waters by pulmonary tumor response in strain A mice. Cancer Res. 1977, 37, 2717–2720. [Google Scholar]
- Emmanuel, E.; Keck, G.; Blanchard, J.-M.; Vermande, P.; Perrodin, Y. Toxicological effects of disinfections using sodium hypochlorite on aquatic organisms and its contribution to AOX formation in hospital wastewater. Environ. Int. 2004, 30, 891–900. [Google Scholar] [CrossRef]
- Murphy, K.; Heery, B.; Sullivan, T.; Zhang, D.; Paludetti, L.; Lau, K.T.; Diamond, D.; Costa, E.; O׳Connor, N.; Regan, F. A low-cost autonomous optical sensor for water quality monitoring. Talanta 2015, 132, 520–527. [Google Scholar] [CrossRef]
- Duffy, G.; Maguire, I.; Heery, B.; Gers, P.; Ducrée, J.; Regan, F. ChromiSense: A colourimetric lab-on-a-disc sensor for chromium speciation in water. Talanta 2018, 178, 392–399. [Google Scholar] [CrossRef]
- Dong, Y.; Li, G.; Zhou, N.; Wang, R.; Chi, Y.; Chen, G. Graphene Quantum Dot as a Green and Facile Sensor for Free Chlorine in Drinking Water. Anal. Chem. 2012, 84, 8378–8382. [Google Scholar] [CrossRef] [PubMed]
- Singh, K.; Mehta, S.K. Luminescent ZnO quantum dots as an efficient sensor for free chlorine detection in water. Analyst 2016, 141, 2487–2492. [Google Scholar] [CrossRef] [PubMed]
- American Society for Testing and Materials. Standard Test Methods of Sampling and Chemical Analysis of Chlorine-Containing Bleaches; ASTM International: West Conshohocken, PA, USA, 2008; pp. 1–9. [Google Scholar]
- Boily, J.-F.; Seward, T.M. On the Dissociation of Methyl Orange: Spectrophotometric Investigation in Aqueous Solutions from 10 to 90 °C and Theoretical Evidence for Intramolecular Dihydrogen Bonding. J. Solut. Chem. 2005, 34, 1387–1406. [Google Scholar] [CrossRef]
- Holzner, G.; Binder, C.; Kriel, F.H.; Priest, C. Directed Growth of Orthorhombic Crystals in a Micropillar Array. Langmuir 2017, 33, 1547–1551. [Google Scholar] [CrossRef]
- Kriel, F.H.; Holzner, G.; Grant, R.A.; Woollam, S.; Ralston, J.; Priest, C. Microfluidic solvent extraction, stripping, and phase disengagement for high-value platinum chloride solutions. Chem. Eng. Sci. 2015, 138, 827–833. [Google Scholar] [CrossRef]
- Sollo, F.W.J.; Larson, T.E. Determination of Free Chlorine by Methyl Orange. J. AWWA 1965, 57, 1575–1585. [Google Scholar] [CrossRef]
- Jovov, B.; Wills, N.K.; Lewis, S.A. A spectroscopic method for assessing confluence of epithelial cell cultures. Am. J. Physiol.-Cell Physiol. 1991, 261, C1196–C1203. [Google Scholar] [CrossRef]


| Protocol Step | Time (min) | Flow Rate (μL/min) | |||
|---|---|---|---|---|---|
| S | MO pH 7 | MO pH 4 | PR | ||
| Sample Flush | 2 | 50 | 0 | 0 | 0 |
| Active Cl (<8 ppm) # | 6 | 7.5 | 2.5 | 0 | 0 |
| Total Cl (<8 ppm) # | 6 | 7.5 | 0 | 2.5 | 0 |
| pH | 6 | 5 | 0 | 0 | 5 |
| ID | Sample Type [1] | Active Chlorine (ppm) | Total Chlorine (ppm) | pH | Notes | |||||||||
|---|---|---|---|---|---|---|---|---|---|---|---|---|---|---|
| On-chip | Off-chip | DPD1 | AC7® | On-chip | Off-chip | D2022 | AC7® | On-Chip | Off-chip | pH electrode | AC7® | |||
| 1 | P/I | 0.7 | 0.9 | 0.7 | 0.5 | 1.1 | 0.9 | 1.1 | 1 | 6.8 | 6.9 | 7 | 6.8 | - |
| 2 | P/I | 2 | 1.7 | 1.8 | 3 | 2.1 | 1.9 | 2.2 | 3 | 7.4 | 7.5 | 7.6 | 6.8 | - |
| 3 | P/O | 1 | 0.9 | 0.9 | 1 | 1 | 1.1 | 2.7 | 1 | 6.8 | 6.9 | 7 | 6.2 | - |
| 4 | D/O | 1.7 | 1.6 | 1.5 | 1 | 1.5 | 1.5 | 2.8 | 1 | 7.5 | 7.4 | 7.4 | 8.4 | - |
| 5 | D/O | 10 | 10.5 | 10 | 10 | 10.3 | 10 | 10.3 | 10 | 7.3 | 7.5 | 7.4 | 6.8 | High Cl |
| 6 | D/O | 2 | 1.8 | 1.7 | 1 | 1.8 | 1.5 | 1.8 | 1 | 7.4 | 7.4 | 7.4 | 7.2 | - |
| 7 | D/O | 4.8 | 4.6 | 4.6 | 5 | 4.2 | 4.4 | 4.5 | 5 | 7.4 | 7.5 | 7.5 | 7.2 | High Cl |
| 8 | D/O | −0.2 | 0 | −0.1 | 0 | −0.3 | 0 | 0.2 | 0 | 7.5 | 7.6 | 7.6 | 7.2 | Low Cl |
| 9 | D/O | 0.3 | 0 | −0.1 | 0 | 0.2 | 0 | 0 | 0 | 7.5 | 7.5 | 7.6 | 7.2 | Low Cl |
| 10 | D/O | 0.1 | 0 | 0 | 0 | 0.4 | 0.4 | 0.6 | 0 | 7.8 | 7.8 | 7.7 | 7.2 | Low Cl |
| 11a | D/O | 13.6 | 13.5 | 12.8 | 20 | 13.6 | 13.2 | 13 | 10 | 7.2 | 7.2 | 7.2 | 6.8 | High Cl |
| 11b | D/O | 9.7 | 9.5 | 9.2 | 10 | 9.3 | 9.3 | 9.2 | 10 | 7.4 | 7.5 | 7.5 | 7.2 | High Cl |
| 11c | D/O | 0.2 | 0.3 | 0.1 | 0 | 0.3 | 0.2 | 0.1 | 0 | 7.7 | 7.7 | 7.7 | 7.2 | Low Cl |
| 12a | D/O | 3.6 | 3.7 | 3.4 | 3 | 3.8 | 3.5 | 3.9 | 3 | 6.8 | 6.5 | 6.7 | 6.2 | - |
| 12b | D/O | 3 | 2.8 | 2.7 | 3 | 3.1 | 2.8 | 3 | 3 | 6 | 5.9 | 6.1 | 6.2 | - |
© 2020 by the authors. Licensee MDPI, Basel, Switzerland. This article is an open access article distributed under the terms and conditions of the Creative Commons Attribution (CC BY) license (http://creativecommons.org/licenses/by/4.0/).
Share and Cite
Elmas, S.; Pospisilova, A.; Sekulska, A.A.; Vasilev, V.; Nann, T.; Thornton, S.; Priest, C. Photometric Sensing of Active Chlorine, Total Chlorine, and pH on a Microfluidic Chip for Online Swimming Pool Monitoring. Sensors 2020, 20, 3099. https://0-doi-org.brum.beds.ac.uk/10.3390/s20113099
Elmas S, Pospisilova A, Sekulska AA, Vasilev V, Nann T, Thornton S, Priest C. Photometric Sensing of Active Chlorine, Total Chlorine, and pH on a Microfluidic Chip for Online Swimming Pool Monitoring. Sensors. 2020; 20(11):3099. https://0-doi-org.brum.beds.ac.uk/10.3390/s20113099
Chicago/Turabian StyleElmas, Sait, Aneta Pospisilova, Aneta Anna Sekulska, Vasil Vasilev, Thomas Nann, Stephen Thornton, and Craig Priest. 2020. "Photometric Sensing of Active Chlorine, Total Chlorine, and pH on a Microfluidic Chip for Online Swimming Pool Monitoring" Sensors 20, no. 11: 3099. https://0-doi-org.brum.beds.ac.uk/10.3390/s20113099