Low-Humidity Sensing Properties of Multi-Layered Graphene Grown by Chemical Vapor Deposition

 , ,
, ,
Abstract
:1. Introduction
2. Materials and Methods
3. Results and Discussion
4. Conclusions
Supplementary Materials
Author Contributions
Funding
Acknowledgments
Conflicts of Interest
References
- Zhang, D.; Chang, H.; Li, P.; Liu, R.; Xue, Q. Fabrication and characterization of an ultrasensitive humidity sensor based on metal oxide/graphene hybrid nanocomposite. Sens. Actuators B Chem. 2016, 225, 233–240. [Google Scholar] [CrossRef]
- Farahani, H.; Wagiran, R.; Hamidon, M.N. Humidity sensors principle, mechanism, and fabrication technologies: A comprehensive review. Sensors 2014, 14, 7881–7939. [Google Scholar] [CrossRef] [PubMed] [Green Version]
- Su, P.G.; Lin, Y. Te Low-humidity sensing properties of diamine- and β-cyclodextrin-functionalized graphene oxide films measured using a quartz-crystal microbalance. Sens. Actuators A Phys. 2016, 238, 344–350. [Google Scholar] [CrossRef]
- Song, X.; Qi, Q.; Zhang, T.; Wang, C. A humidity sensor based on KCl-doped SnO2 nanofibers. Sens. Actuators B Chem. 2009, 138, 368–373. [Google Scholar] [CrossRef]
- Dey, A. Semiconductor metal oxide gas sensors: A review. Mater. Sci. Eng. B Solid-State Mater. Adv. Technol. 2018, 229, 206–217. [Google Scholar] [CrossRef]
- Wang, C.; Yin, L.; Zhang, L.; Xiang, D.; Gao, R. Metal oxide gas sensors: Sensitivity and influencing factors. Sensors 2010, 10, 2088–2106. [Google Scholar] [CrossRef] [Green Version]
- Morsy, M.; Ibrahim, M.; Yuan, Z.; Meng, F. Graphene Foam Decorated with ZnO as a Humidity Sensor. IEEE Sens. J. 2020, 20, 1721–1729. [Google Scholar] [CrossRef]
- Korotcenkov, G.; Cho, B.K. Engineering approaches for the improvement of conductometric gas sensor parameters: Part 1. Improvement of sensor sensitivity and selectivity (short survey). Sens. Actuators B Chem. 2013, 188, 709–728. [Google Scholar] [CrossRef]
- Koziej, D. Water–oxygen interplay on tin dioxide surface: Implication on gas sensing. Chem. Phys. Lett. 2005, 410, 321–323. [Google Scholar] [CrossRef]
- Maier, K.; Helwig, A.; Müller, G.; Hille, P.; Eickhoff, M. Effect of water vapor and surface morphology on the low temperature response of metal oxide semiconductor gas sensors. Materials 2015, 8, 6570–6588. [Google Scholar] [CrossRef] [Green Version]
- De Luca, A.; Santra, S.; Ghosh, R.; Ali, S.Z.; Gardner, J.W.; Guha, P.K.; Udrea, F. Temperature-modulated graphene oxide resistive humidity sensor for indoor air quality monitoring. Nanoscale 2016, 8, 4565–4572. [Google Scholar] [CrossRef] [PubMed]
- Yang, S.; Jiang, C.; Wei, S. Gas sensing in 2D materials. Appl. Phys. Rev. 2017, 4, 021304. [Google Scholar] [CrossRef]
- Korotcenkov, G. Metal oxides for solid-state gas sensors: What determines our choice? Mater. Sci. Eng. B Solid-State Mater. Adv. Technol. 2007, 139, 1–23. [Google Scholar] [CrossRef]
- Korotcenkov, G. Gas response control through structural and chemical modification of metal oxide films: State of the art and approaches. Sens. Actuators B Chem. 2005, 107, 209–232. [Google Scholar] [CrossRef]
- Neri, G. First Fifty Years of Chemoresistive Gas Sensors. Chemosensors 2015, 3, 1–20. [Google Scholar] [CrossRef]
- Capone, S.; National, I.; Rella, R.; National, I.; Italian, S.; Aging, A.; Home, A.; View, E.; Capone, S. Solid State Gas Sensors: State of the Art and Future Activities. J. Optoelectron. Adv. Mater. 2003, 5, 1335–1348. [Google Scholar] [CrossRef]
- Chiesa, M.; Rigoni, F.; Paderno, M.; Borghetti, P.; Gagliotti, G.; Bertoni, M.; Ballarin Denti, A.; Schiavina, L.; Goldoni, A.; Sangaletti, L. Development of low-cost ammonia gas sensors and data analysis algorithms to implement a monitoring grid of urban environmental pollutants. J. Environ. Monit. 2012, 14, 1565–1575. [Google Scholar] [CrossRef]
- Phys, A.; Shi, C. Precise gas discrimination with cross- reactive graphene and metal oxide sensor arrays. Appl. Phys. Lett. 2018, 113, 222102. [Google Scholar]
- Dobrokhotov, V.; Larin, A.; Sowell, D. Vapor Trace Recognition Using a Single Nonspecific Chemiresistor. Sensors 2013, 13, 9016–9028. [Google Scholar] [CrossRef] [Green Version]
- Molinara, M.; Ferdinandi, M.; Ferrigno, L.; Massera, E. An end to end indoor air monitoring system based on machine learning and SENSIPLUS platform. IEEE Access 2020, 8, 72204–72215. [Google Scholar] [CrossRef]
- Ricciardella, F.; Vollebregt, S.; Polichetti, T.; Alfano, B.; Massera, E.; Sarro, P.M. An innovative approach to overcome saturation and recovery issues of CVD graphene-based gas sensors. In Proceedings of the IEEE Sensors 2017, Glasgow, UK, 29 October–1 November 2017; pp. 1224–1226. [Google Scholar] [CrossRef]
- Ricciardella, F.; Vollebregt, S.; Polichetti, T.; Alfano, B.; Massera, E.; Sarro, P.M. High sensitive gas sensors realized by a transfer-free process of CVD graphene. In Proceedings of the IEEE Sensors 2016, Orlando, FL, USA, 30 October–3 November 2016; pp. 697–699. [Google Scholar] [CrossRef] [Green Version]
- Ricciardella, F.; Vollebregt, S.; Polichetti, T.; Alfano, B.; Massera, E.; Sarro, P.M. Low Temperature CVD Grown Graphene for Highly Selective Gas Sensors Working under Ambient Conditions. Proceedings 2017, 1, 445. [Google Scholar] [CrossRef] [Green Version]
- Popov, V.I.; Nikolaev, D.V.; Timofeev, V.B.; Smagulova, S.A.; Antonova, I.V. Graphene-based humidity sensors: The origin of alternating resistance change. Nanotechnology 2017, 28, 355501. [Google Scholar] [CrossRef] [PubMed]
- Tammanoon, N.; Wisitsoraat, A.; Sriprachuabwong, C.; Phokharatkul, D.; Tuantranont, A.; Phanichphant, S.; Liewhiran, C. Ultrasensitive NO2 Sensor Based on Ohmic Metal-Semiconductor Interfaces of Electrolytically Exfoliated Graphene/Flame-Spray-Made SnO2 Nanoparticles Composite Operating at Low Temperatures. ACS Appl. Mater. Interfaces 2015, 7, 24338–24352. [Google Scholar] [CrossRef] [PubMed]
- Banhart, F.; Kotakoski, J.; Krasheninnikov, A.V. Structural defects in graphene. ACS Nano 2011, 5, 26–41. [Google Scholar] [CrossRef] [PubMed] [Green Version]
- Ricciardella, F.; Vollebregt, S.; Polichetti, T.; Miscuglio, M.; Alfano, B.; Miglietta, M.L.; Massera, E.; Di Francia, G.; Sarro, P.M. Effects of graphene defects on gas sensing properties towards NO2 detection. Nanoscale 2017, 9, 6085–6093. [Google Scholar] [CrossRef] [PubMed] [Green Version]
- Varghese, S.S.; Lonkar, S.; Singh, K.K.; Swaminathan, S.; Abdala, A. Recent advances in graphene based gas sensors. Sens. Actuators B Chem. 2015, 218, 160–183. [Google Scholar] [CrossRef]
- Lin, C.H.; Chen, W.T.; Huang, C.H.; Woon, W.Y.; Lin, C.T. Effects of Π-electron in humidity sensing of artificially stacked graphene bilayers modified with carboxyl and hydroxyl groups. Sens. Actuators B Chem. 2019, 301, 127020. [Google Scholar] [CrossRef]
- Zhang, Y.H.; Chen, Y.B.; Zhou, K.G.; Liu, C.H.; Zeng, J.; Zhang, H.L.; Peng, Y. Improving gas sensing properties of graphene by introducing dopants and defects: A first-principles study. Nanotechnology 2009, 20, 185504. [Google Scholar] [CrossRef] [PubMed] [Green Version]
- Cui, S.; Pu, H.; Mattson, E.C.; Wen, Z.; Chang, J.; Hou, Y.; Hirschmugl, C.J.; Chen, J. Ultrasensitive chemical sensing through facile tuning defects and functional groups in reduced graphene oxide. Anal. Chem. 2014, 86, 7516–7522. [Google Scholar] [CrossRef]
- Zhou, Q.; Yuan, L.; Yang, X.; Fu, Z.; Tang, Y.; Wang, C.; Zhang, H. DFT study of formaldehyde adsorption on vacancy defected graphene doped with B, N, and S. Chem. Phys. 2014, 440, 80–86. [Google Scholar] [CrossRef]
- Varghese, S.; Varghese, S.; Swaminathan, S.; Singh, K.; Mittal, V. Two-Dimensional Materials for Sensing: Graphene and Beyond. Electronics 2015, 4, 651–687. [Google Scholar] [CrossRef] [Green Version]
- Novoselov, K.S.; Fal, V.I.; Colombo, L.; Gellert, P.R.; Schwab, M.G.; Kim, K. A roadmap for graphene. Nature 2012, 490, 192–200. [Google Scholar] [CrossRef] [PubMed]
- Smith, A.D.; Elgammal, K.; Niklaus, F.; Delin, A.; Fischer, A.C.; Vaziri, S.; Forsberg, F.; Råsander, M.; Hugosson, H.; Bergqvist, L.; et al. Resistive graphene humidity sensors with rapid and direct electrical readout. Nanoscale 2015, 7, 19099–19109. [Google Scholar] [CrossRef] [Green Version]
- Schedin, F.; Geim, A.K.; Morozov, S.V.; Hill, E.W.; Blake, P.; Katsnelson, M.I.; Novoselov, K.S. Detection of individual gas molecules adsorbed on graphene. Nat. Mater. 2007, 6, 652–655. [Google Scholar] [CrossRef]
- Ghosh, A.; Late, D.J.; Panchakarla, L.S.; Govindaraj, A.; Rao, C.N.R. NO2 and humidity sensing characteristics of few-layer graphenes. J. Exp. Nanosci. 2009, 4, 313–322. [Google Scholar] [CrossRef] [Green Version]
- Fan, X.; Elgammal, K.; Smith, A.D.; Östling, M.; Delin, A.; Lemme, M.C.; Niklaus, F. Humidity and CO2 gas sensing properties of double-layer graphene. Carbon 2018, 127, 576–587. [Google Scholar] [CrossRef]
- Smith, A.D.; Östling, M.; Elgammal, K.; Delin, A.; Råsander, M.; Bergqvist, L.; Fan, X.; Schröder, S.; Fischer, A.C.; Niklaus, F.; et al. Graphene-based CO2 sensing and its cross-sensitivity with humidity. RSC Adv. 2017, 7, 22329–22339. [Google Scholar] [CrossRef] [Green Version]
- Kozbial, A.; Li, Z.; Sun, J.; Gong, X.; Zhou, F.; Wang, Y.; Xu, H.; Liu, H.; Li, L. Understanding the intrinsic water wettability of graphite. Carbon 2014, 74, 218–225. [Google Scholar] [CrossRef] [Green Version]
- Munz, M.; Giusca, C.E.; Myers-Ward, R.L.; Gaskill, D.K.; Kazakova, O. Thickness-Dependent Hydrophobicity of Epitaxial Graphene. ACS Nano 2015, 9, 8401–8411. [Google Scholar] [CrossRef] [Green Version]
- Kozbial, A.; Trouba, C.; Liu, H.; Li, L. Characterization of the intrinsic water wettability of graphite using contact angle measurements: Effect of defects on static and dynamic contact angles. Langmuir 2017, 33, 959–967. [Google Scholar] [CrossRef]
- Vollebregt, S.; Alfano, B.; Ricciardella, F.; Giesbers, A.J.M.; Grachova, Y.; Van Zeijl, H.W.; Polichetti, T.; Sarro, P.M. A transfer-free wafer-scale cvd graphene fabrication process for mems/nems sensors. In Proceedings of the 2016 IEEE 29th International Conference on Micro Electro Mechanical Systems (MEMS), Shanghai, China, 24–28 January 2016; pp. 17–20. [Google Scholar]
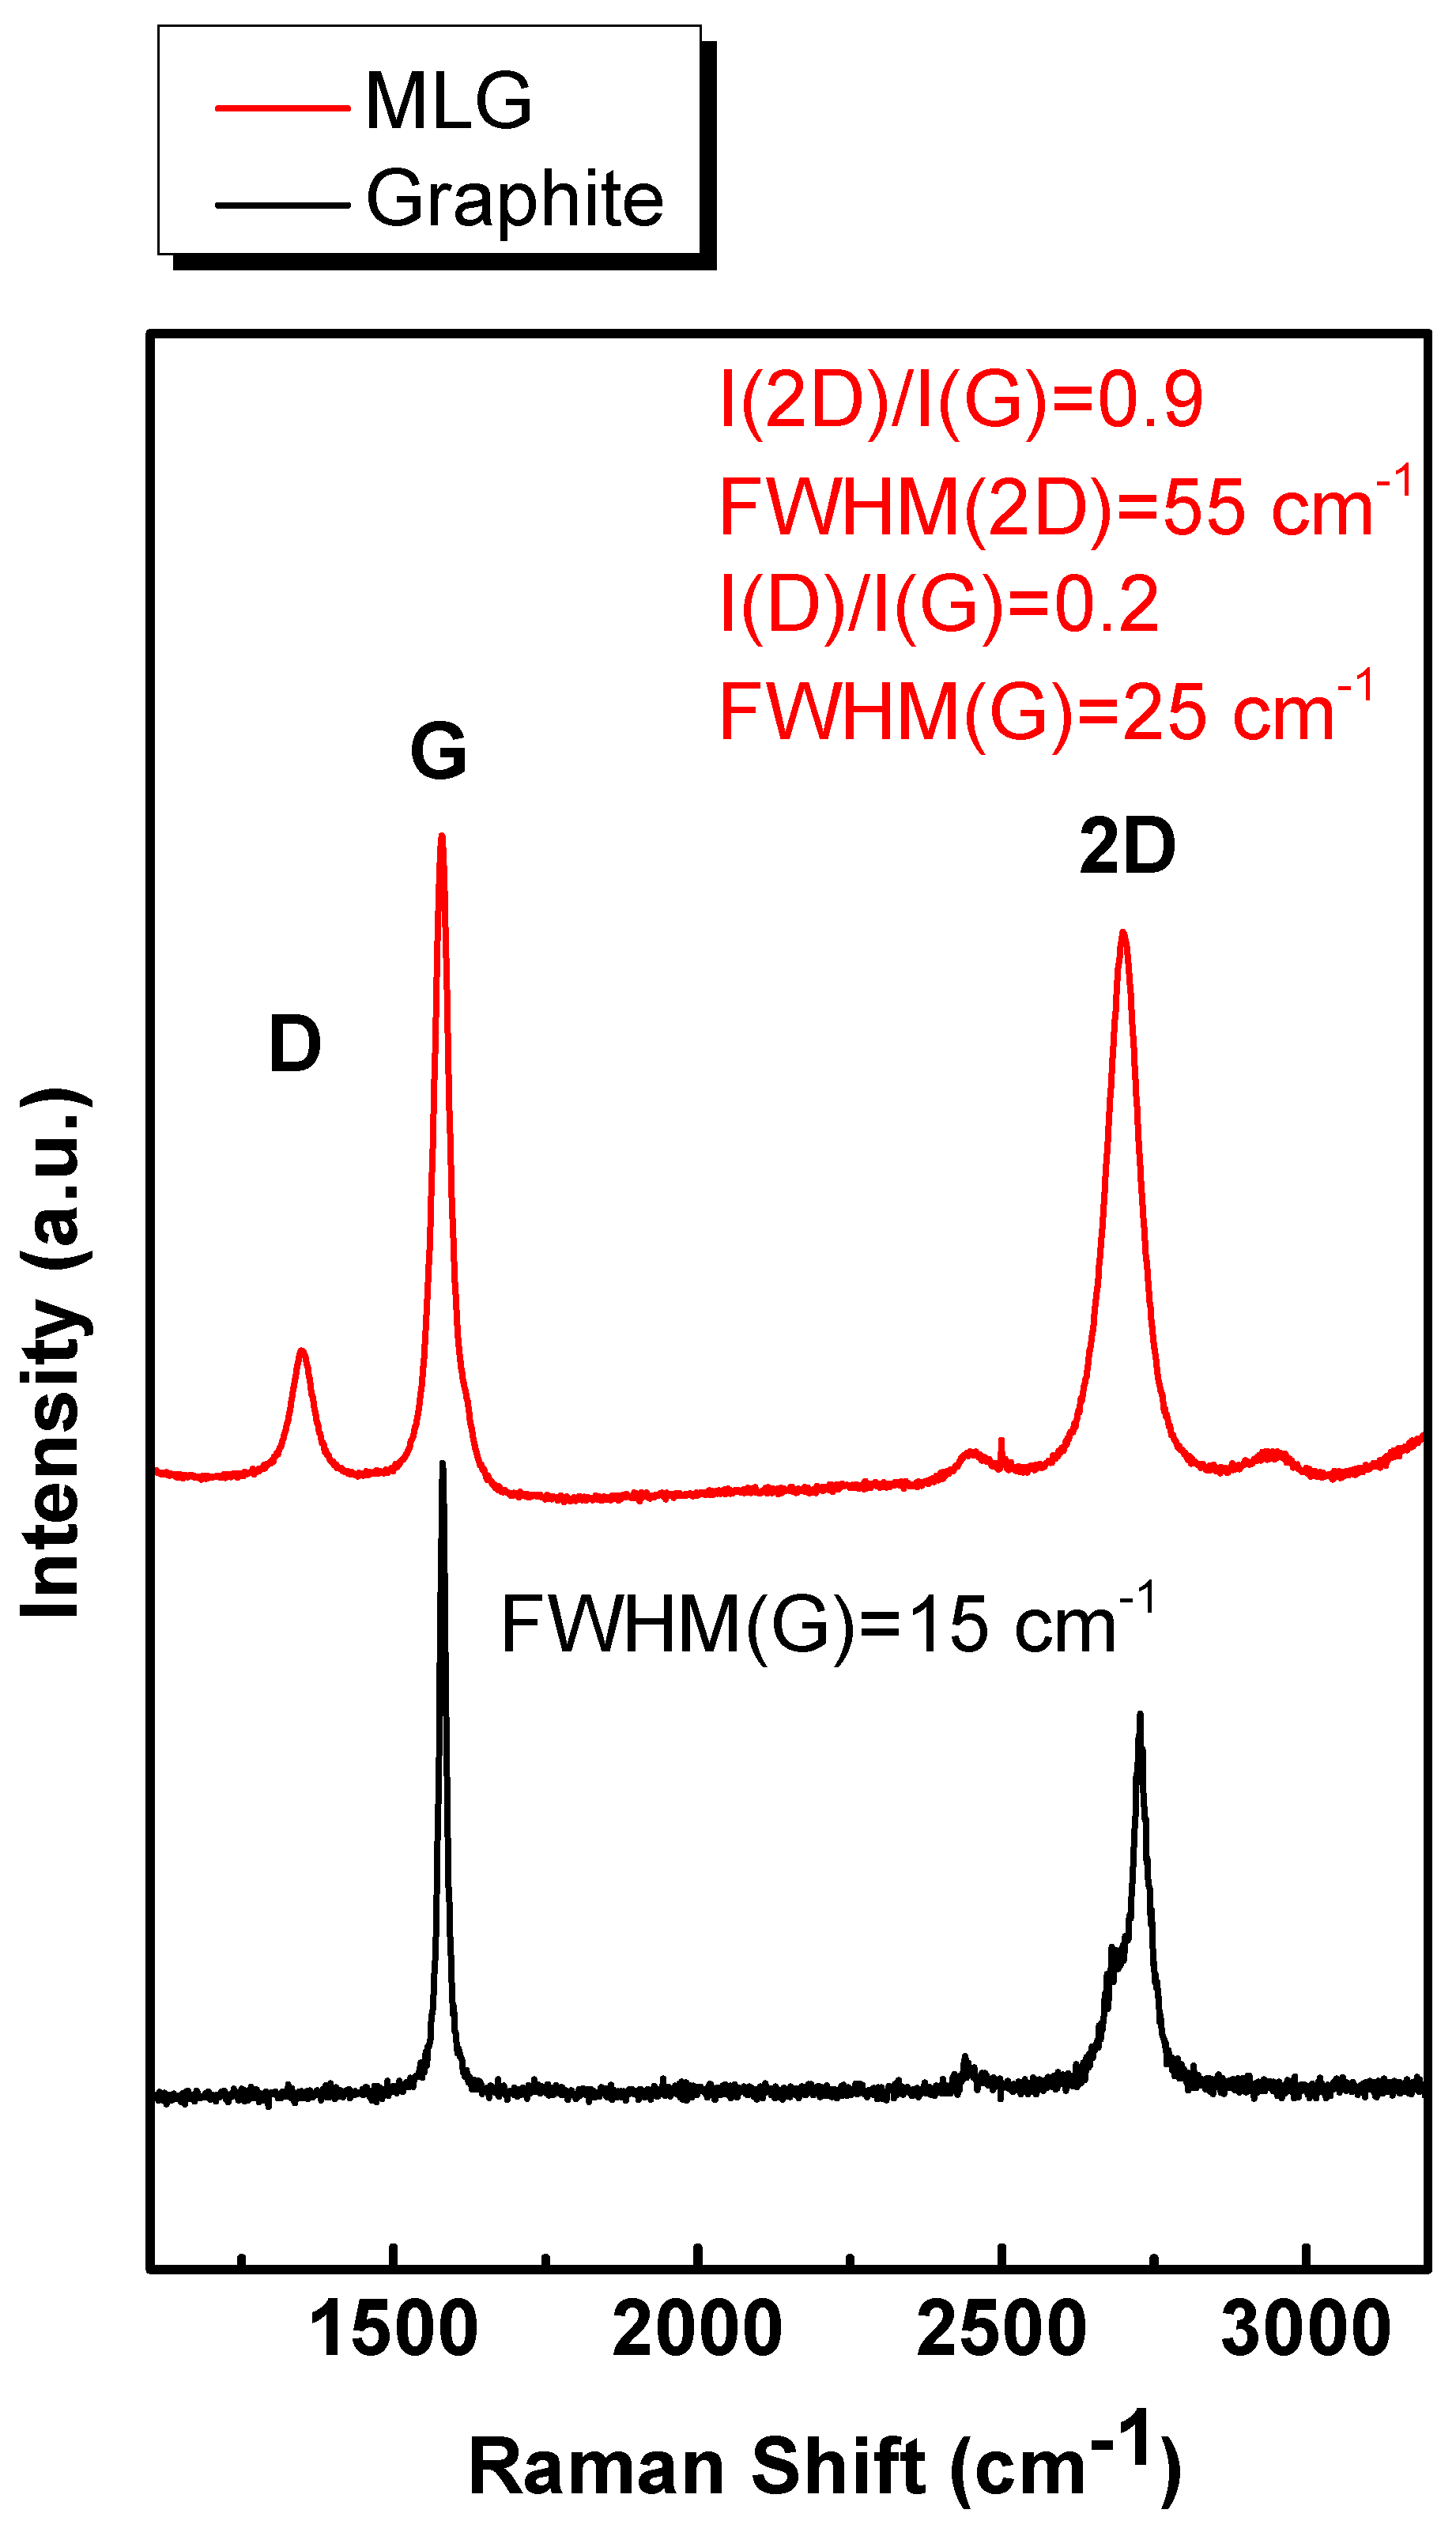
- Malard, L.M.; Pimenta, M.A.; Dresselhaus, G.; Dresselhaus, M.S. Raman spectroscopy in graphene. Phys. Rep. 2009, 473, 51–87. [Google Scholar] [CrossRef]
- Lespade, P.; Marchand, A.; Couzi, M.; Cruege, F. Characterization of carbon-carbon composites by Raman microprobe. Carbon 1984, 22, 375–385. [Google Scholar] [CrossRef]
- Pimenta, M.A.; Dresselhaus, G.; Dresselhaus, M.S.; Cançado, L.G.; Jorio, A.; Saito, R. Studying disorder in graphite-based systems by Raman spectroscopy. Phys. Chem. Chem. Phys. 2007, 9, 1276–1291. [Google Scholar] [CrossRef] [PubMed]
- Reina, A.; Jia, X.; Ho, J.; Nezich, D.; Son, H.; Bulovic, V.; Dresselhaus, M.S.; Kong, J. Large area, few-layer graphene films on arbitrary substrates by chemical vapor deposition. Nano Lett. 2009, 9, 30–35. [Google Scholar] [CrossRef] [PubMed]
- Romijn, J.; Vollebregt, S.; Dolleman, R.J.; Singh, M.; Van Der Zant, H.S.J.; Steeneken, P.G.; Sarro, P.M. A Miniaturized low power pirani pressure sensor based on suspended graphene. In Proceedings of the 2018 IEEE 13th Annual International Conference on Nano/Micro Engineered and Molecular Systems (NEMS), Singapore, 22–26 April 2018; pp. 11–14. [Google Scholar]
- Ricciardella, F.; Vollebregt, S.; Boshuizen, B.; Danzl, F.J.K.; Cesar, I. Wafer-scale transfer-free process of multi-layered graphene grown by chemical vapor deposition. Mater. Res. Express 2020, 7, 035001. [Google Scholar] [CrossRef]
- Ferrari, A.C.; Meyer, J.C.; Scardaci, V.; Casiraghi, C.; Lazzeri, M.; Mauri, F.; Piscanec, S.; Jiang, D.; Novoselov, K.S.; Roth, S.; et al. Raman spectrum of graphene and graphene layers. Phys. Rev. Lett. 2006, 97, 1–4. [Google Scholar] [CrossRef] [Green Version]
- Ricciardella, F.; Massera, E.; Polichetti, T.; Miglietta, M.L.; Di Francia, G. A calibrated graphene-based chemi-sensor for sub parts-per-million NO2 detection operating at room temperature. Appl. Phys. Lett. 2014, 104, 1–6. [Google Scholar] [CrossRef]
- Ali, S.; Hassan, A.; Hassan, G.; Bae, J.; Lee, C.H. All-printed humidity sensor based on graphene/methyl-red composite with high sensitivity. Carbon 2016, 105, 23–32. [Google Scholar] [CrossRef]
- Chen, M.C.; Hsu, C.L.; Hsueh, T.J. Fabrication of humidity sensor based on bilayer graphene. IEEE Electron Device Lett. 2014, 35, 590–592. [Google Scholar] [CrossRef]
- Lee, C.S.; Cojocaru, C.S.; Moujahid, W.; Lebental, B.; Chaigneau, M.; Châtelet, M.; Le Normand, F.; Maurice, J.L. Synthesis of conducting transparent few-layer graphene directly on glass at 450 °C. Nanotechnology 2012, 23, 265603. [Google Scholar] [CrossRef] [Green Version]
- Bointon, T.H.; Russo, S.; Craciun, M.F. Is graphene a good transparent electrode for photovoltaics and display applications? IET Circuits Devices Syst. 2015, 9, 403–412. [Google Scholar] [CrossRef] [Green Version]
- Quellmalz, A.; Smith, A.D.; Elgammal, K.; Fan, X.; Delin, A.; Östling, M.; Lemme, M.; Gylfason, K.B.; Niklaus, F. Influence of Humidity on Contact Resistance in Graphene Devices. ACS Appl. Mater. Interfaces 2018, 10, 41738–41746. [Google Scholar] [CrossRef] [PubMed] [Green Version]
- Melios, C.; Giusca, C.E.; Panchal, V.; Kazakova, O. Water on graphene: Review of recent progress. 2D Mater. 2018, 5, 022001. [Google Scholar] [CrossRef] [Green Version]
- Moser, J.; Verdaguer, A.; Jiḿnez, D.; Barreiro, A.; Bachtold, A. The environment of graphene probed by electrostatic force microscopy. Appl. Phys. Lett. 2008, 92, 123507. [Google Scholar] [CrossRef] [Green Version]
- Lin, Z.; Carvalho, B.R.; Kahn, E.; Lv, R.; Rao, R.; Terrones, H.; Pimenta, M.A.; Terrones, M. Defect engineering of two-dimensional transition metal dichalcogenides. 2D Mater. 2016, 3, 022002. [Google Scholar] [CrossRef]
- Terrones, H.; Lv, R.; Terrones, M.; Dresselhaus, M.S. The role of defects and doping in 2D graphene sheets and 1D nanoribbons. Rep. Prog. Phys. 2012, 75, 062501. [Google Scholar] [CrossRef] [PubMed]
- Nufer, S.; Large, M.J.; King, A.A.K.; Ogilvie, S.P.; Brunton, A.; Dalton, A.B. Edge-Selective Gas Detection Using Langmuir Films of Graphene Platelets. ACS Appl. Mater. Interfaces 2018, 10, 21740–21745. [Google Scholar] [CrossRef] [Green Version]
- Backes, C.; Abdelkader, A.M.; Alonso, C.; Andrieux-Ledier, A.; Arenal, R.; Azpeitia, J.; Balakrishnan, N.; Banszerus, L.; Barjon, J.; Bartali, R.; et al. Production and processing of graphene and related materials. 2D Mater. 2020, 7, 022001. [Google Scholar] [CrossRef]


| Material | Sensitivity (%/%RH) | Reference |
|---|---|---|
| CVD SLG | 0.3–1.3 | [35] |
| CVD BLG | 29 | [53] |
| FLG 1 | 93 | [37] |
| CVD MLG | 7–27 | [24] |
| PECVD MLG 2 | 8–35 | [54] |
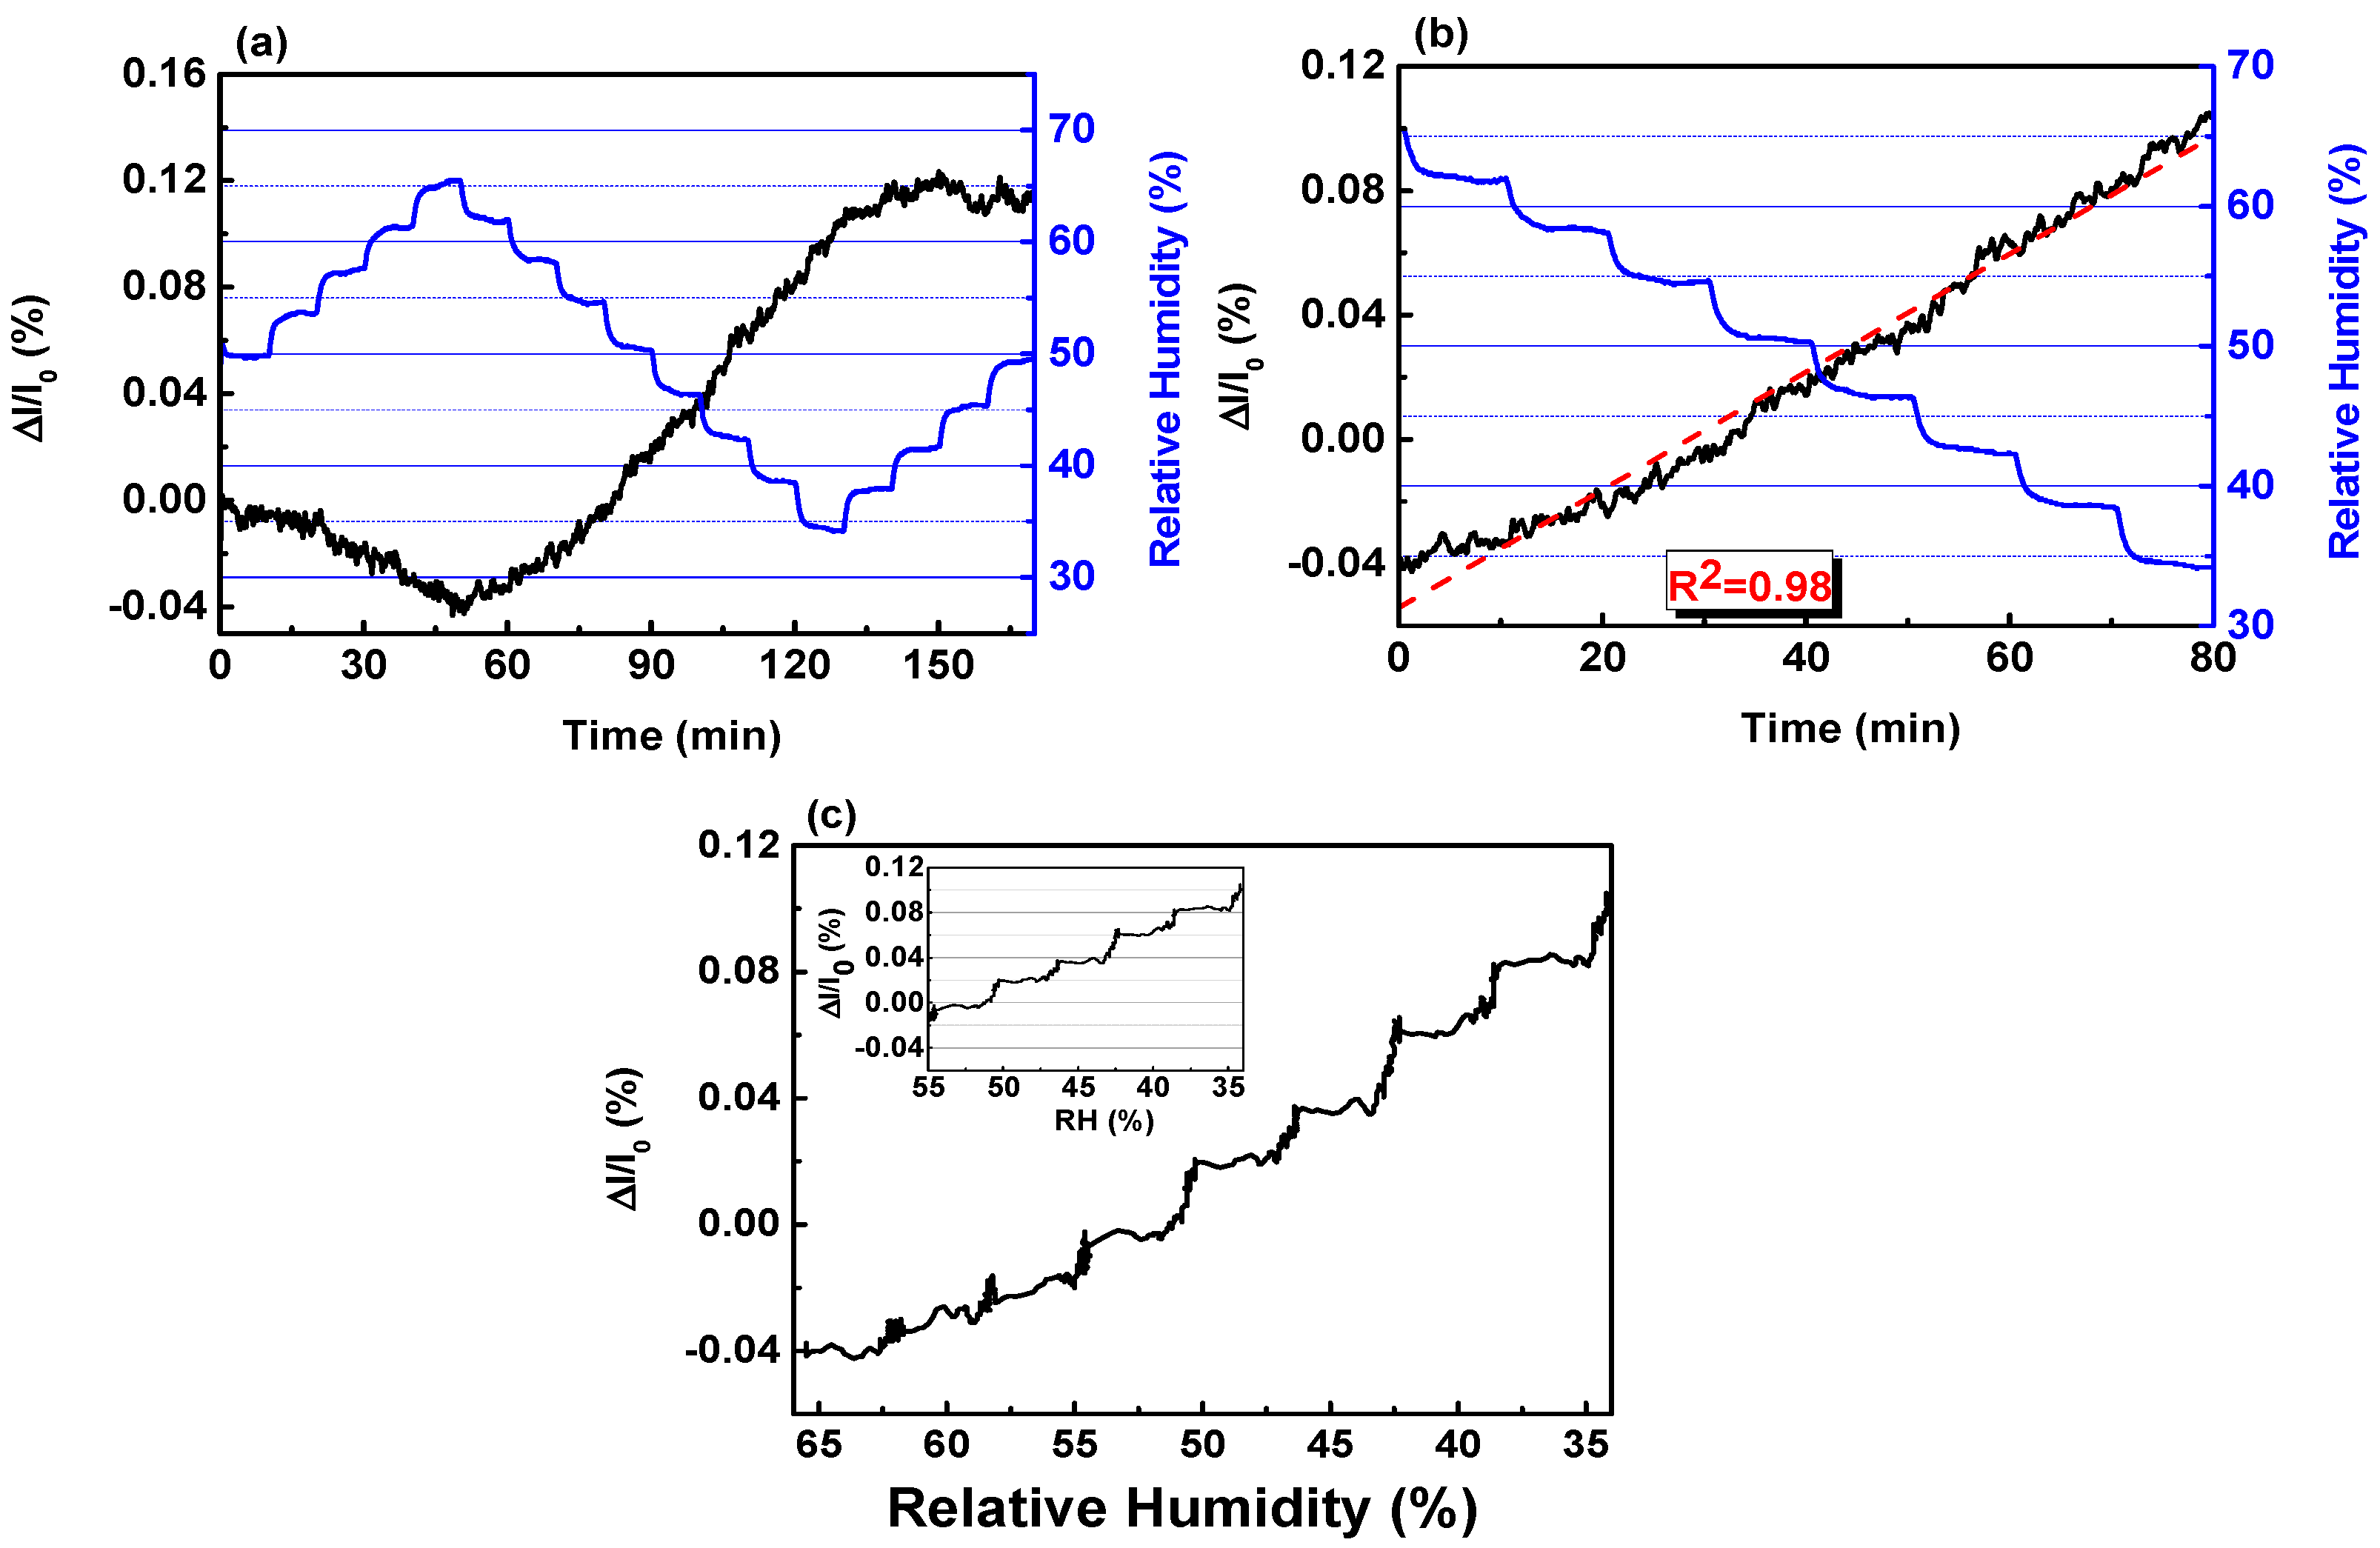
| CVD MLG | 0.005 | (this work) |
© 2020 by the authors. Licensee MDPI, Basel, Switzerland. This article is an open access article distributed under the terms and conditions of the Creative Commons Attribution (CC BY) license (http://creativecommons.org/licenses/by/4.0/).
Share and Cite
Ricciardella, F.; Vollebregt, S.; Polichetti, T.; Sarro, P.M.; Duesberg, G.S. Low-Humidity Sensing Properties of Multi-Layered Graphene Grown by Chemical Vapor Deposition. Sensors 2020, 20, 3174. https://0-doi-org.brum.beds.ac.uk/10.3390/s20113174
Ricciardella F, Vollebregt S, Polichetti T, Sarro PM, Duesberg GS. Low-Humidity Sensing Properties of Multi-Layered Graphene Grown by Chemical Vapor Deposition. Sensors. 2020; 20(11):3174. https://0-doi-org.brum.beds.ac.uk/10.3390/s20113174
Chicago/Turabian StyleRicciardella, Filiberto, Sten Vollebregt, Tiziana Polichetti, Pasqualina M. Sarro, and Georg S. Duesberg. 2020. "Low-Humidity Sensing Properties of Multi-Layered Graphene Grown by Chemical Vapor Deposition" Sensors 20, no. 11: 3174. https://0-doi-org.brum.beds.ac.uk/10.3390/s20113174