High-Sensitivity, Quantified, Linear and Mediator-Free Resonator-Based Microwave Biosensor for Glucose Detection


 , and
, and
Abstract
:1. Introduction
2. Materials and Methods
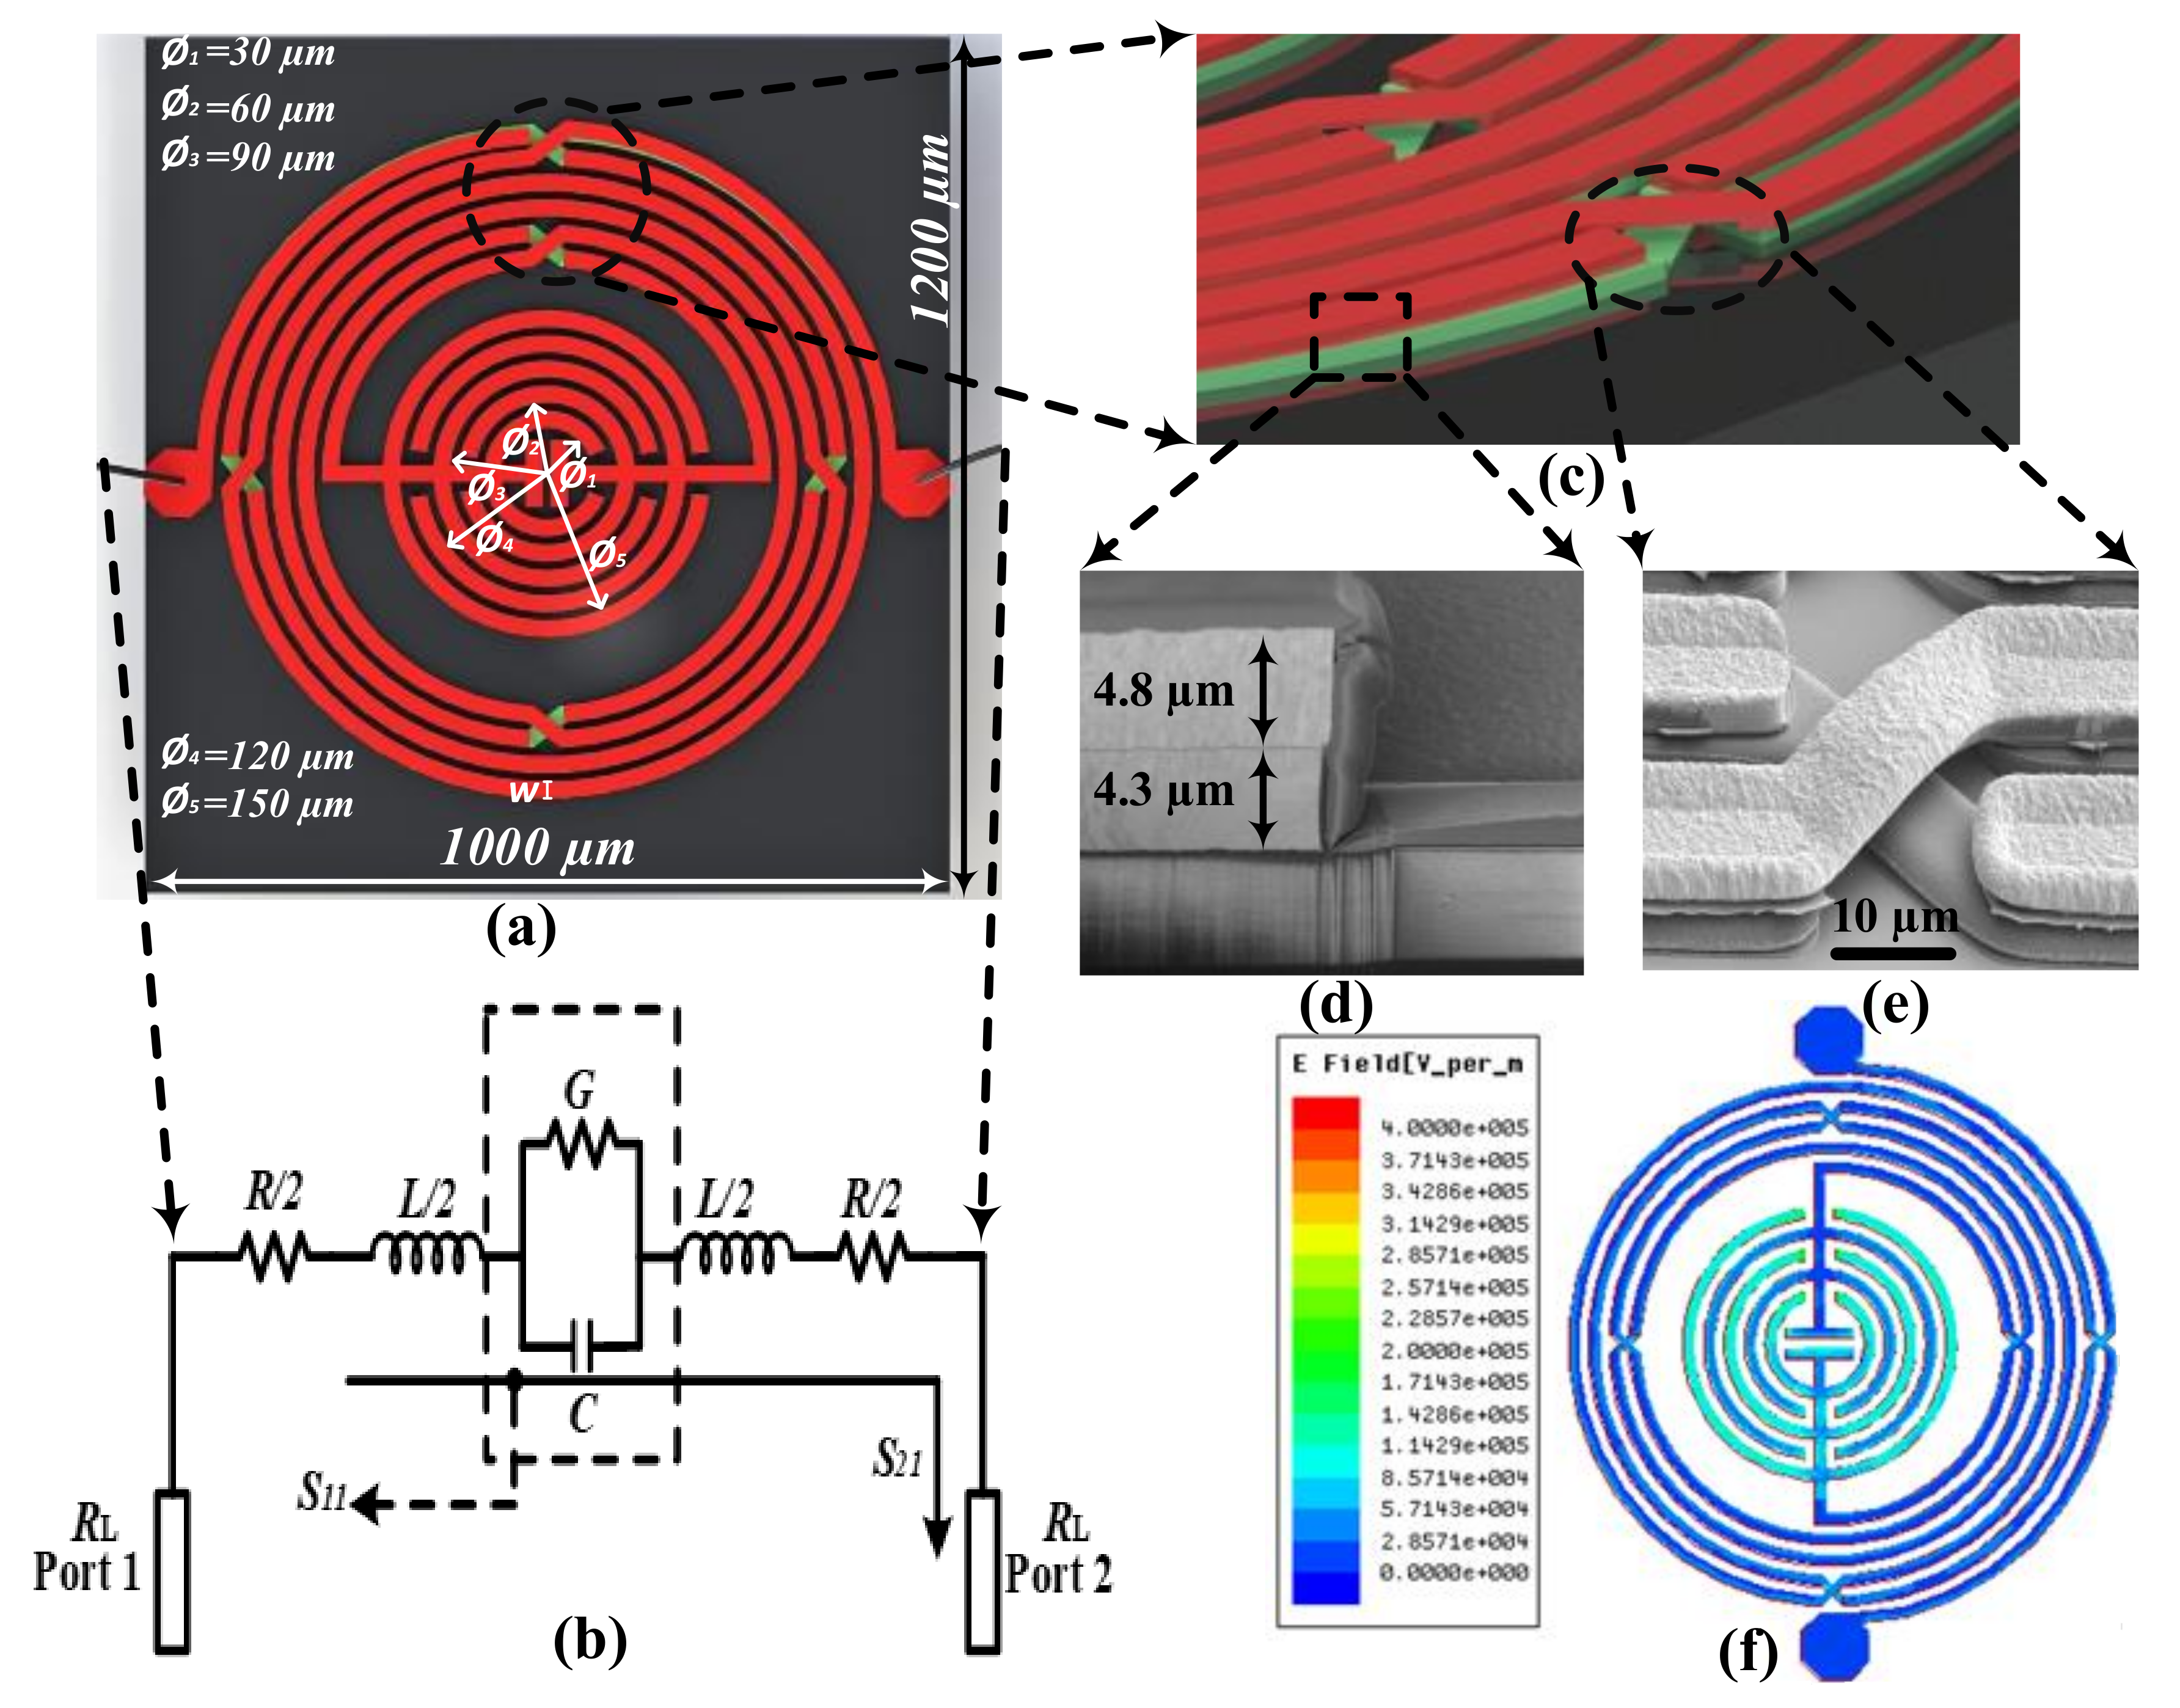
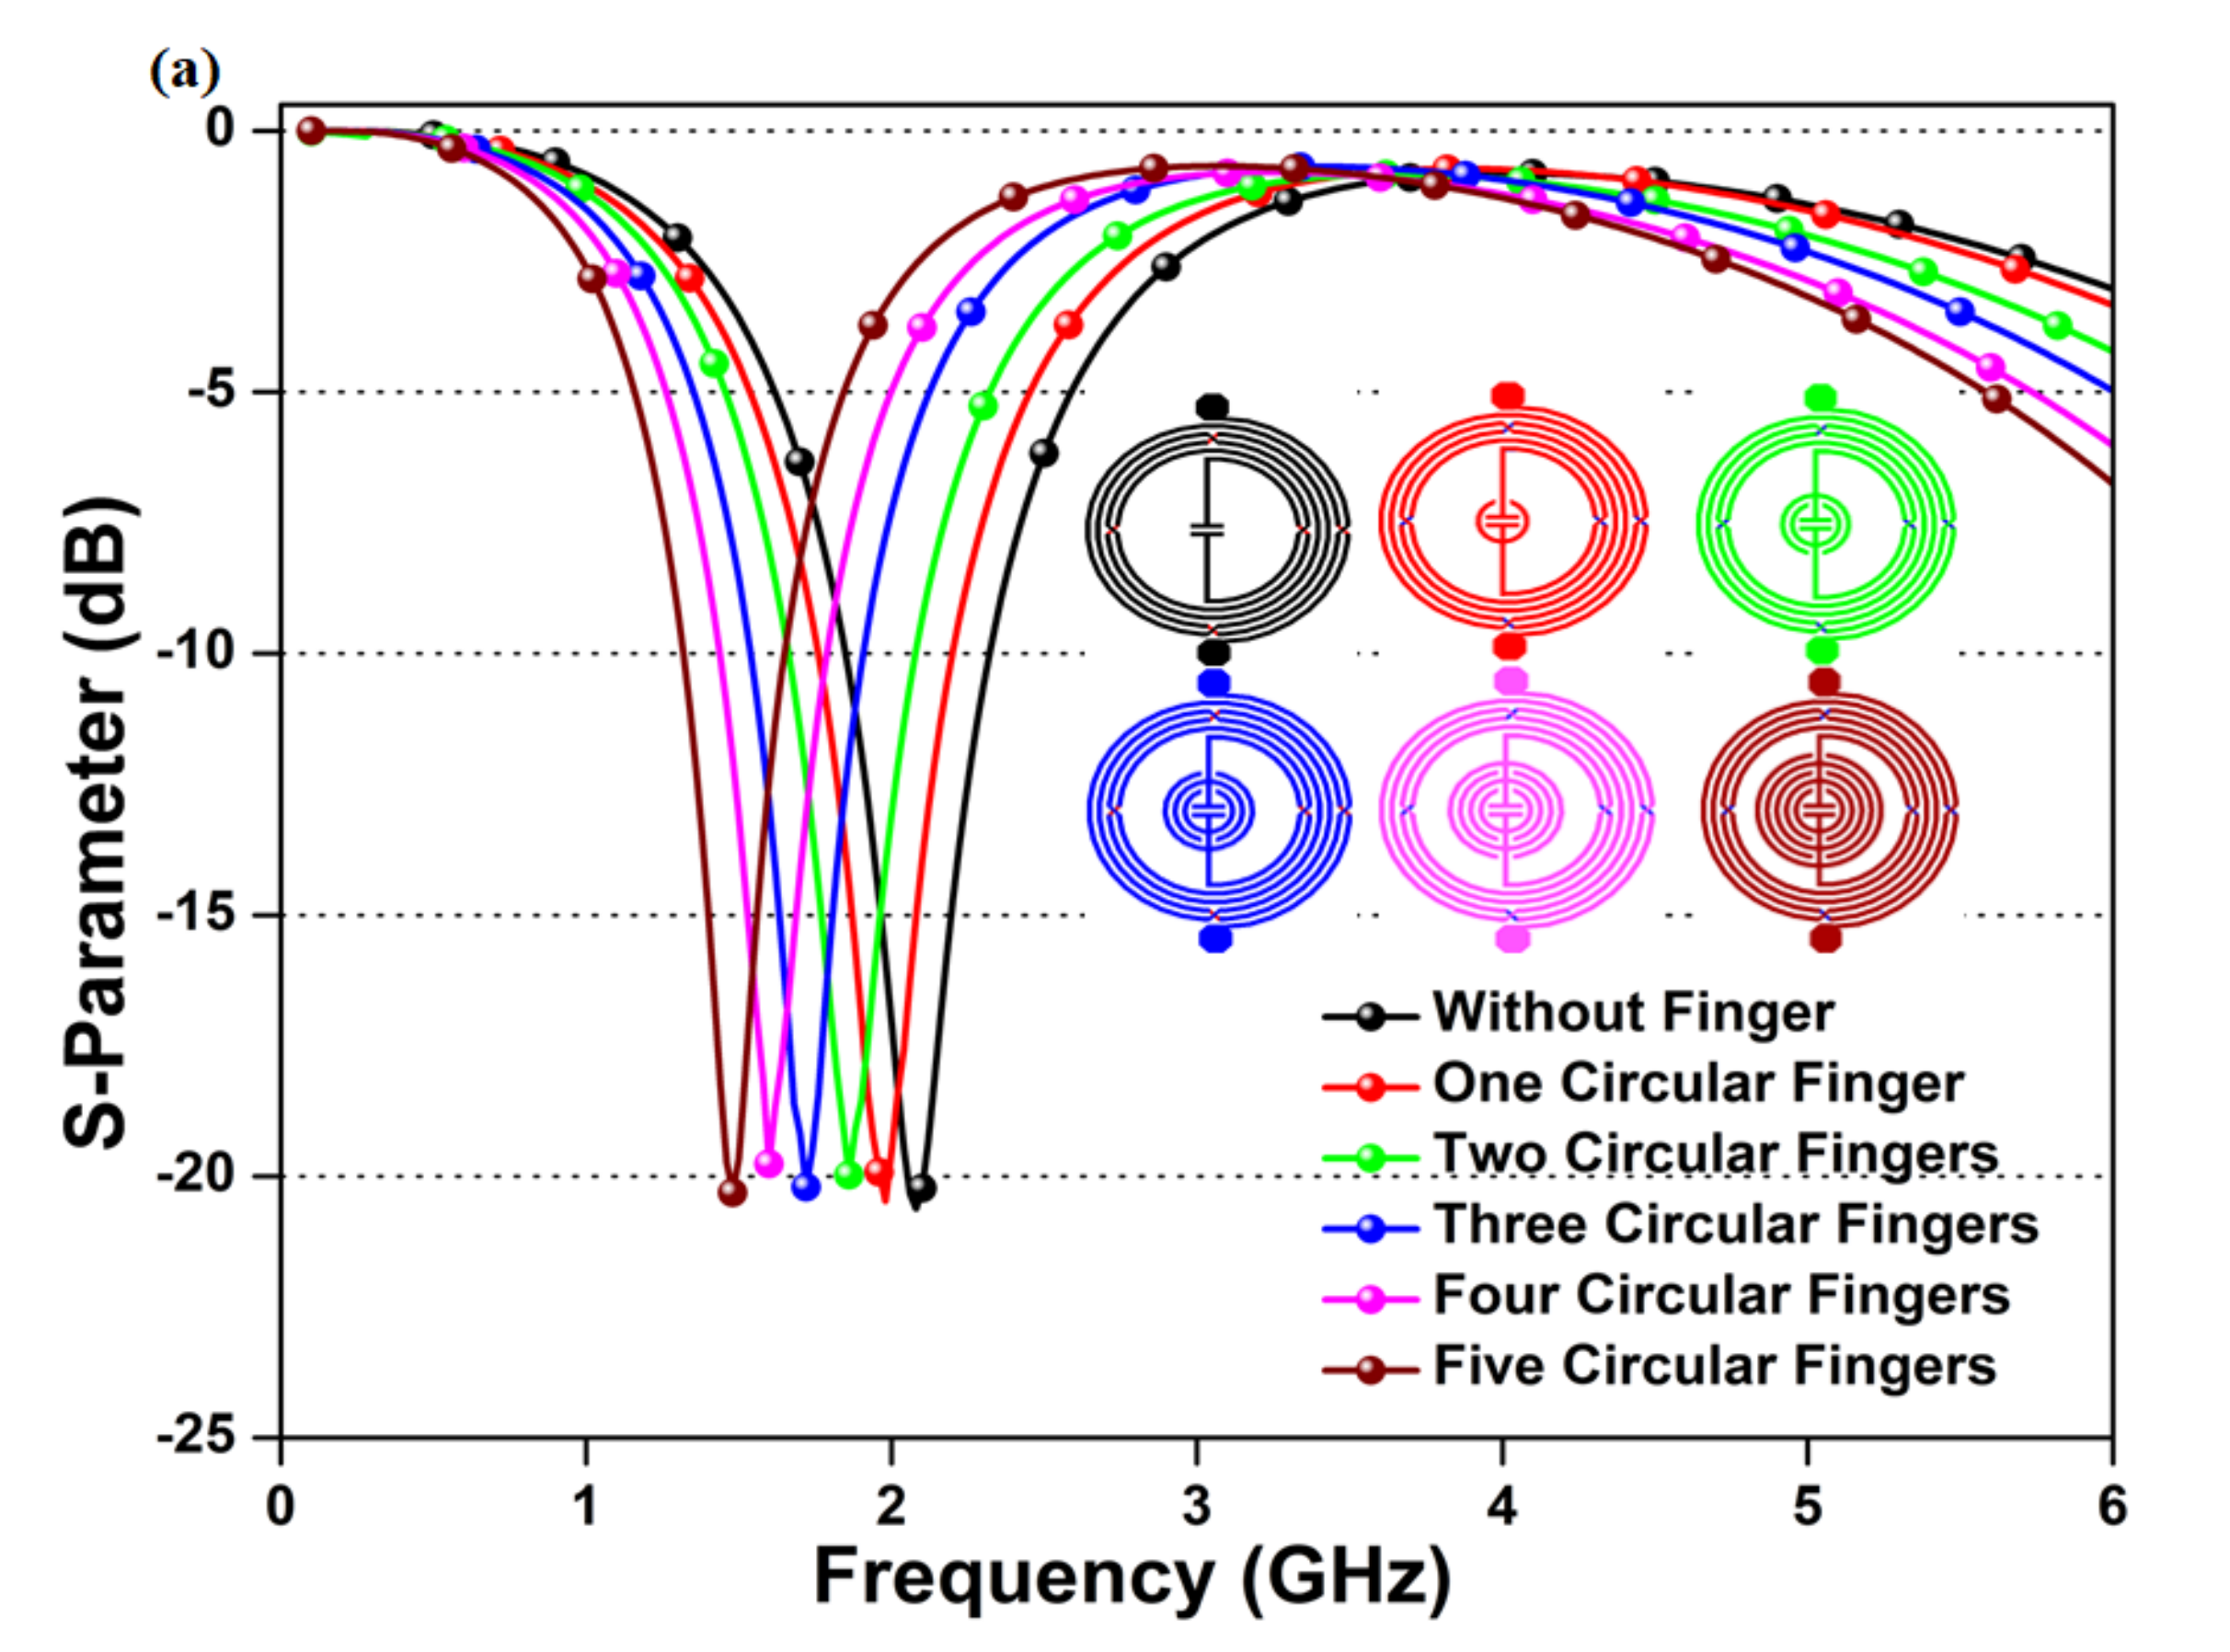
2.1. Proposed Microwave Biosensor Design
2.2. Advanced Micro-Fabrication of Proposed Microwave Biosensor
- Formation of first metal layer: First, the GaAs substrate was cleaned carefully with acetone, iso-propyl alcohol, and distilled water, respectively. The wet cleaning helps to reduce the surface defects and improve surface roughness to enhance the layer’s adhesion. Afterward, the SiNx layer of 0.2 µm thickness was deposited on the GaAs substrate as a wafer passivation layer through a plasma-enhanced chemical vapor deposition (PECVD) process. The first seed metal (Ti/Au) was sputtered with the thickness of (0.02 µm /0.08 µm) on the SiNx layer to increase the adhesion between the first metal layer and GaAs substrate. Subsequently, the photoresistor (PR) was patterned on the GaAs substrate to engrave the first metal layer with the desired structure. The first metal layer (Cu/Au) with the thickness of (4.5 µm /0.5 µm) was electroplated on the surface to design the first layer of the asymmetrical differential spiral inductor and circular finger-type inter-digital capacitor. The thicker layer of copper (4.5 µm) was preferred due to its high operational speed, better conductivity, and low cost. After that, the PR layer was stripped off through the lift-off process, and later dry etching was performed to remove the unwanted seed metal. Again, the 0.2 µm thick SiNx layer was deployed on the first metal layer using the PECVD technique to prevent short-circuiting between metals layers and protect sidewalls.
- Formation of the second metal layer and air-bridge post: Furthermore, the PR coating was deposited on the SiNx layer to craft the desired structure for the second metal layer. Afterward, reactive ion etching (RIE) was applied using a plasma etcher to remove the unwanted passivation layer. Then, PR removing was done to remove the PR layer using the lift-off process. In the next step, the PR layer was deposited to form an air-bridge post followed by a hard-baking process. Afterward, the second seed metal (Ti/Au) with the height of (0.02 µm /0.08 µm) was sputtered to enhance adhesiveness between the first metal layer and the second metal layer. Again, the PR layer is deposited to design the air-bridge metal layer. Subsequently, the second metal layer (Cu/Au) with a thickness of (4.5 µm/ 0.5 µm) is formed to create an air-bridge in the asymmetrical differential spiral inductor. Furthermore, the undesired second seed metal was removed through the RIE process, and the unwanted PR of the air-bridge post and air-bridge metal layer was etched using wet etching. In the last step, the final passivation layer of 0.3 µm was introduced to cover all fabricated component areas that protect them from environmental impurities such as dust, humidity, and scratches, among others.
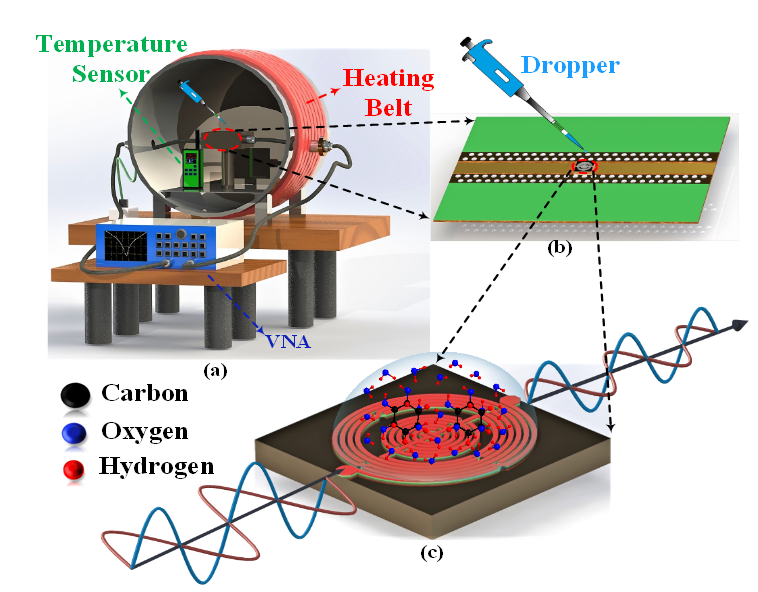
2.3. Proposed Microwave Biosensor Fabrication and Testing
2.4. Sample Preparation and Characterization
3. Result and Discussion
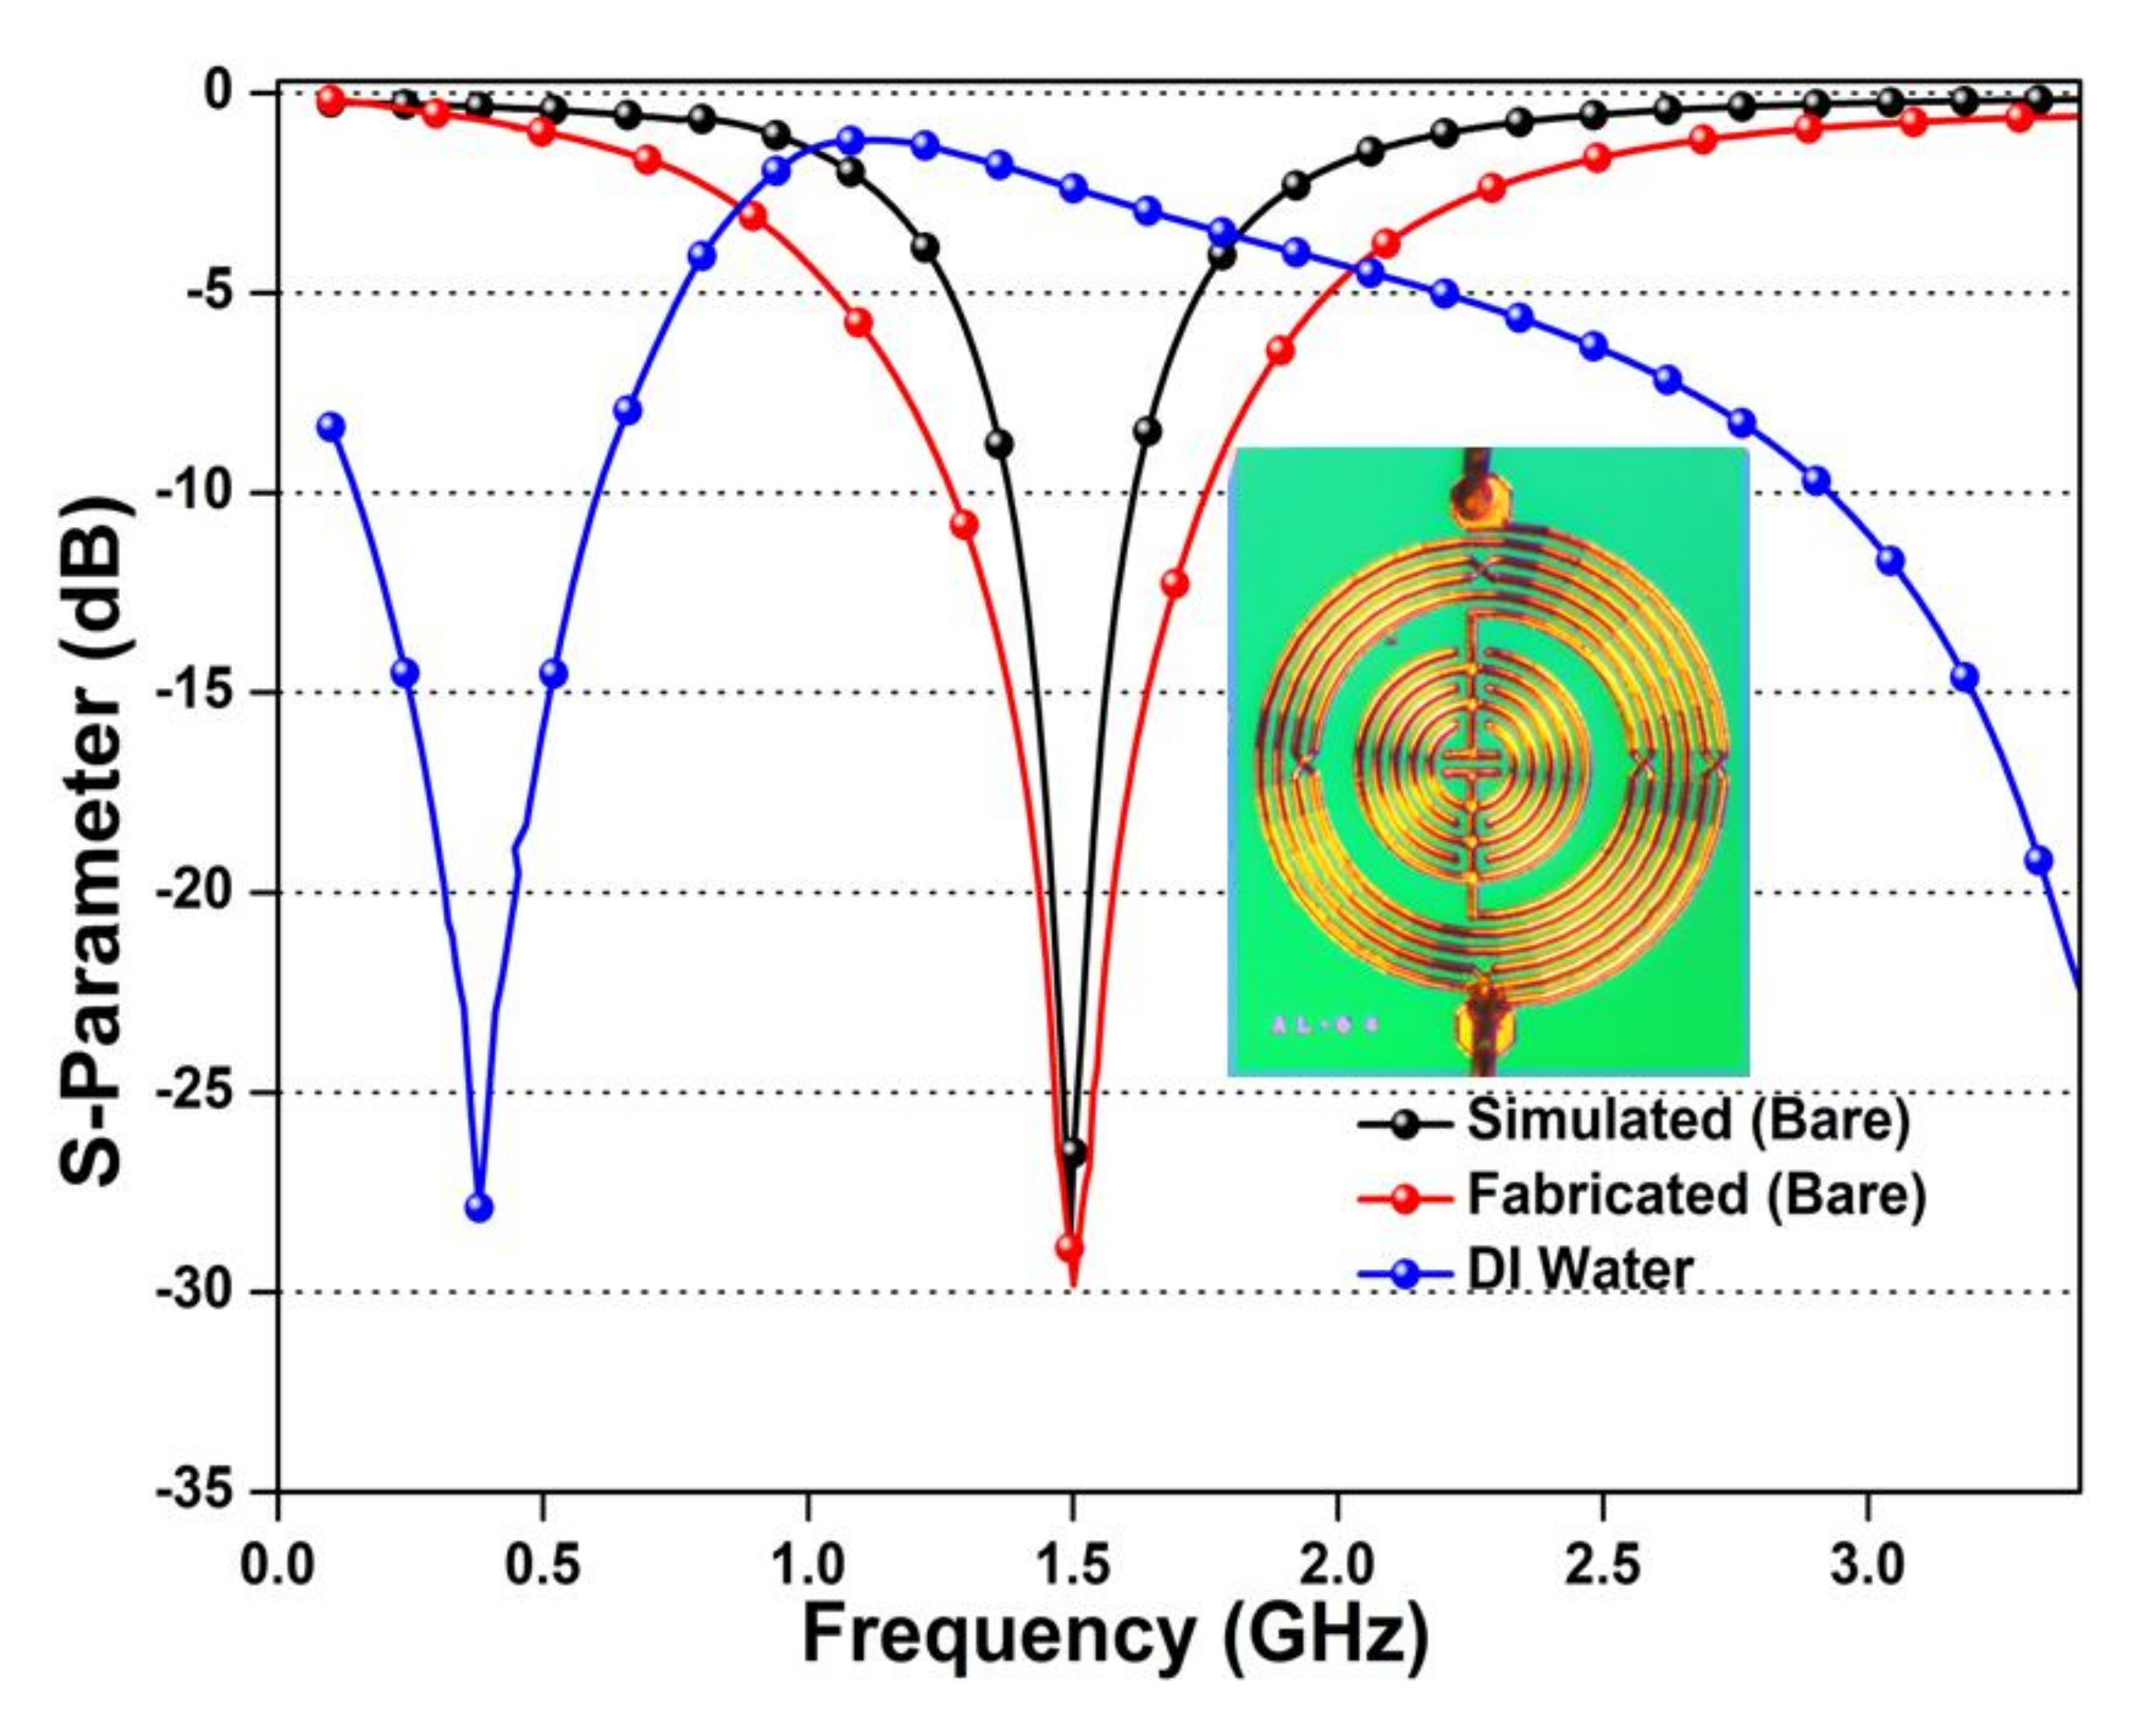
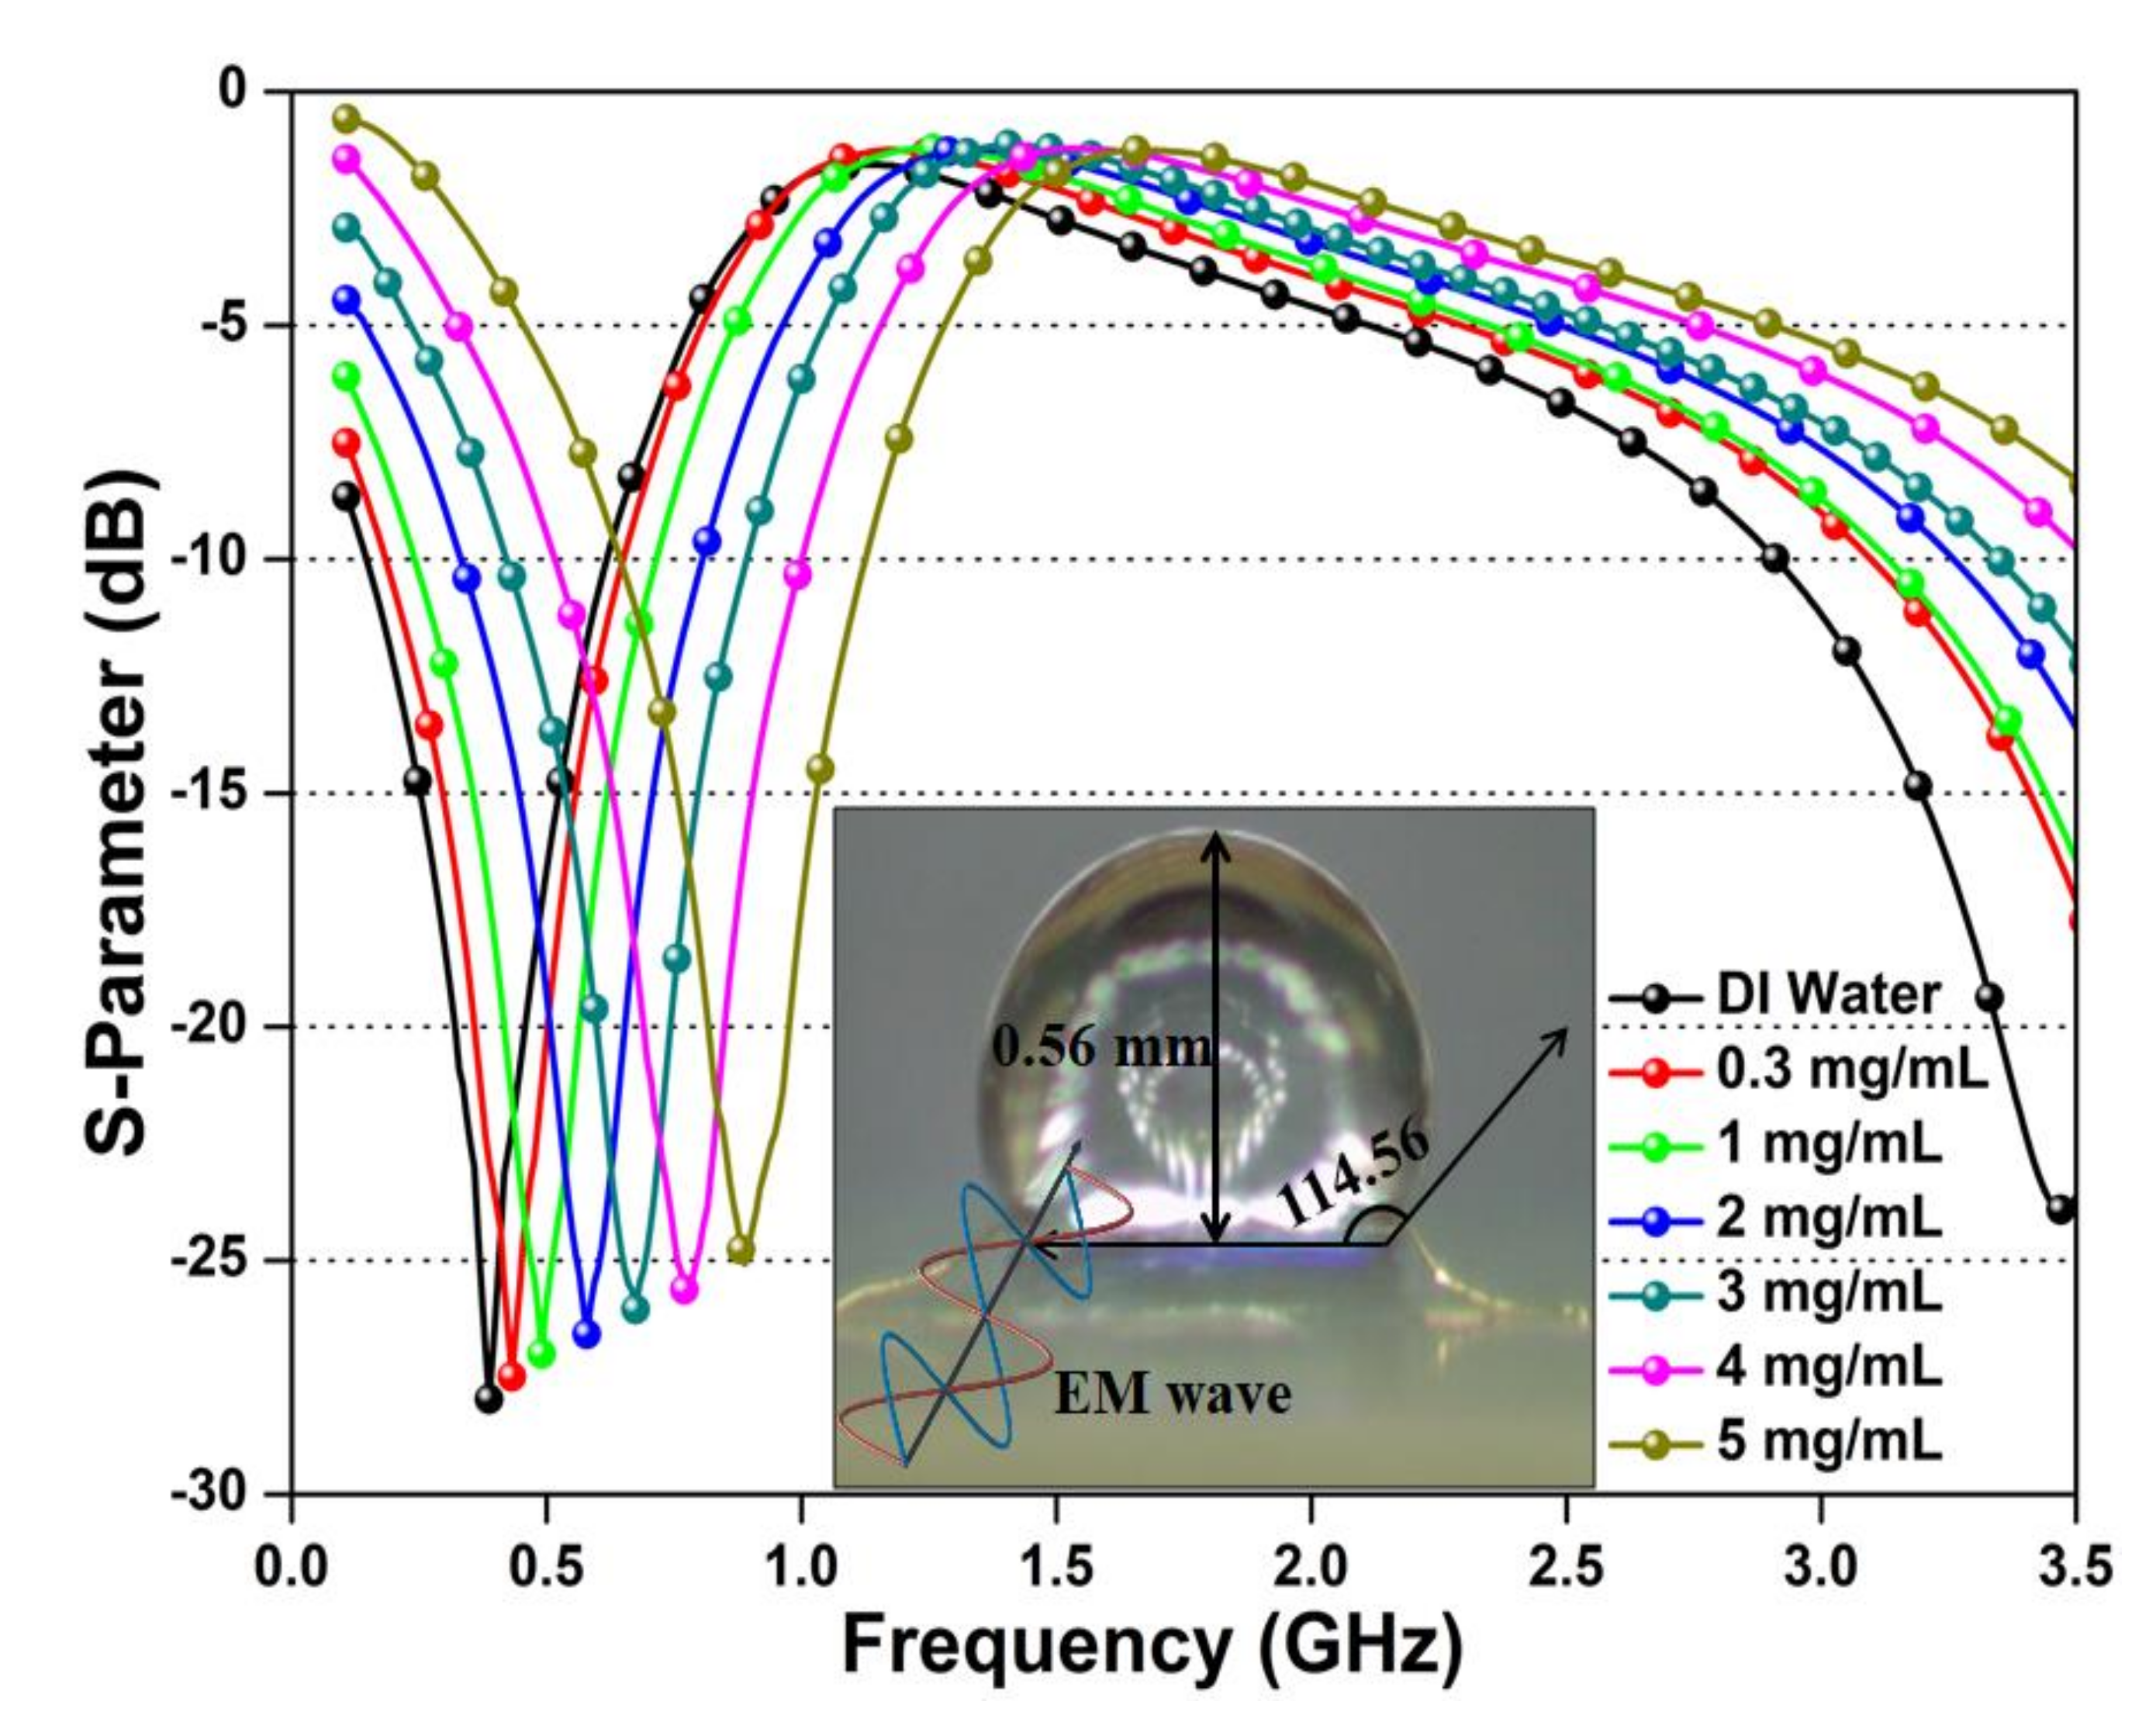
3.1. S Parameter Characterization of Glucose Solution
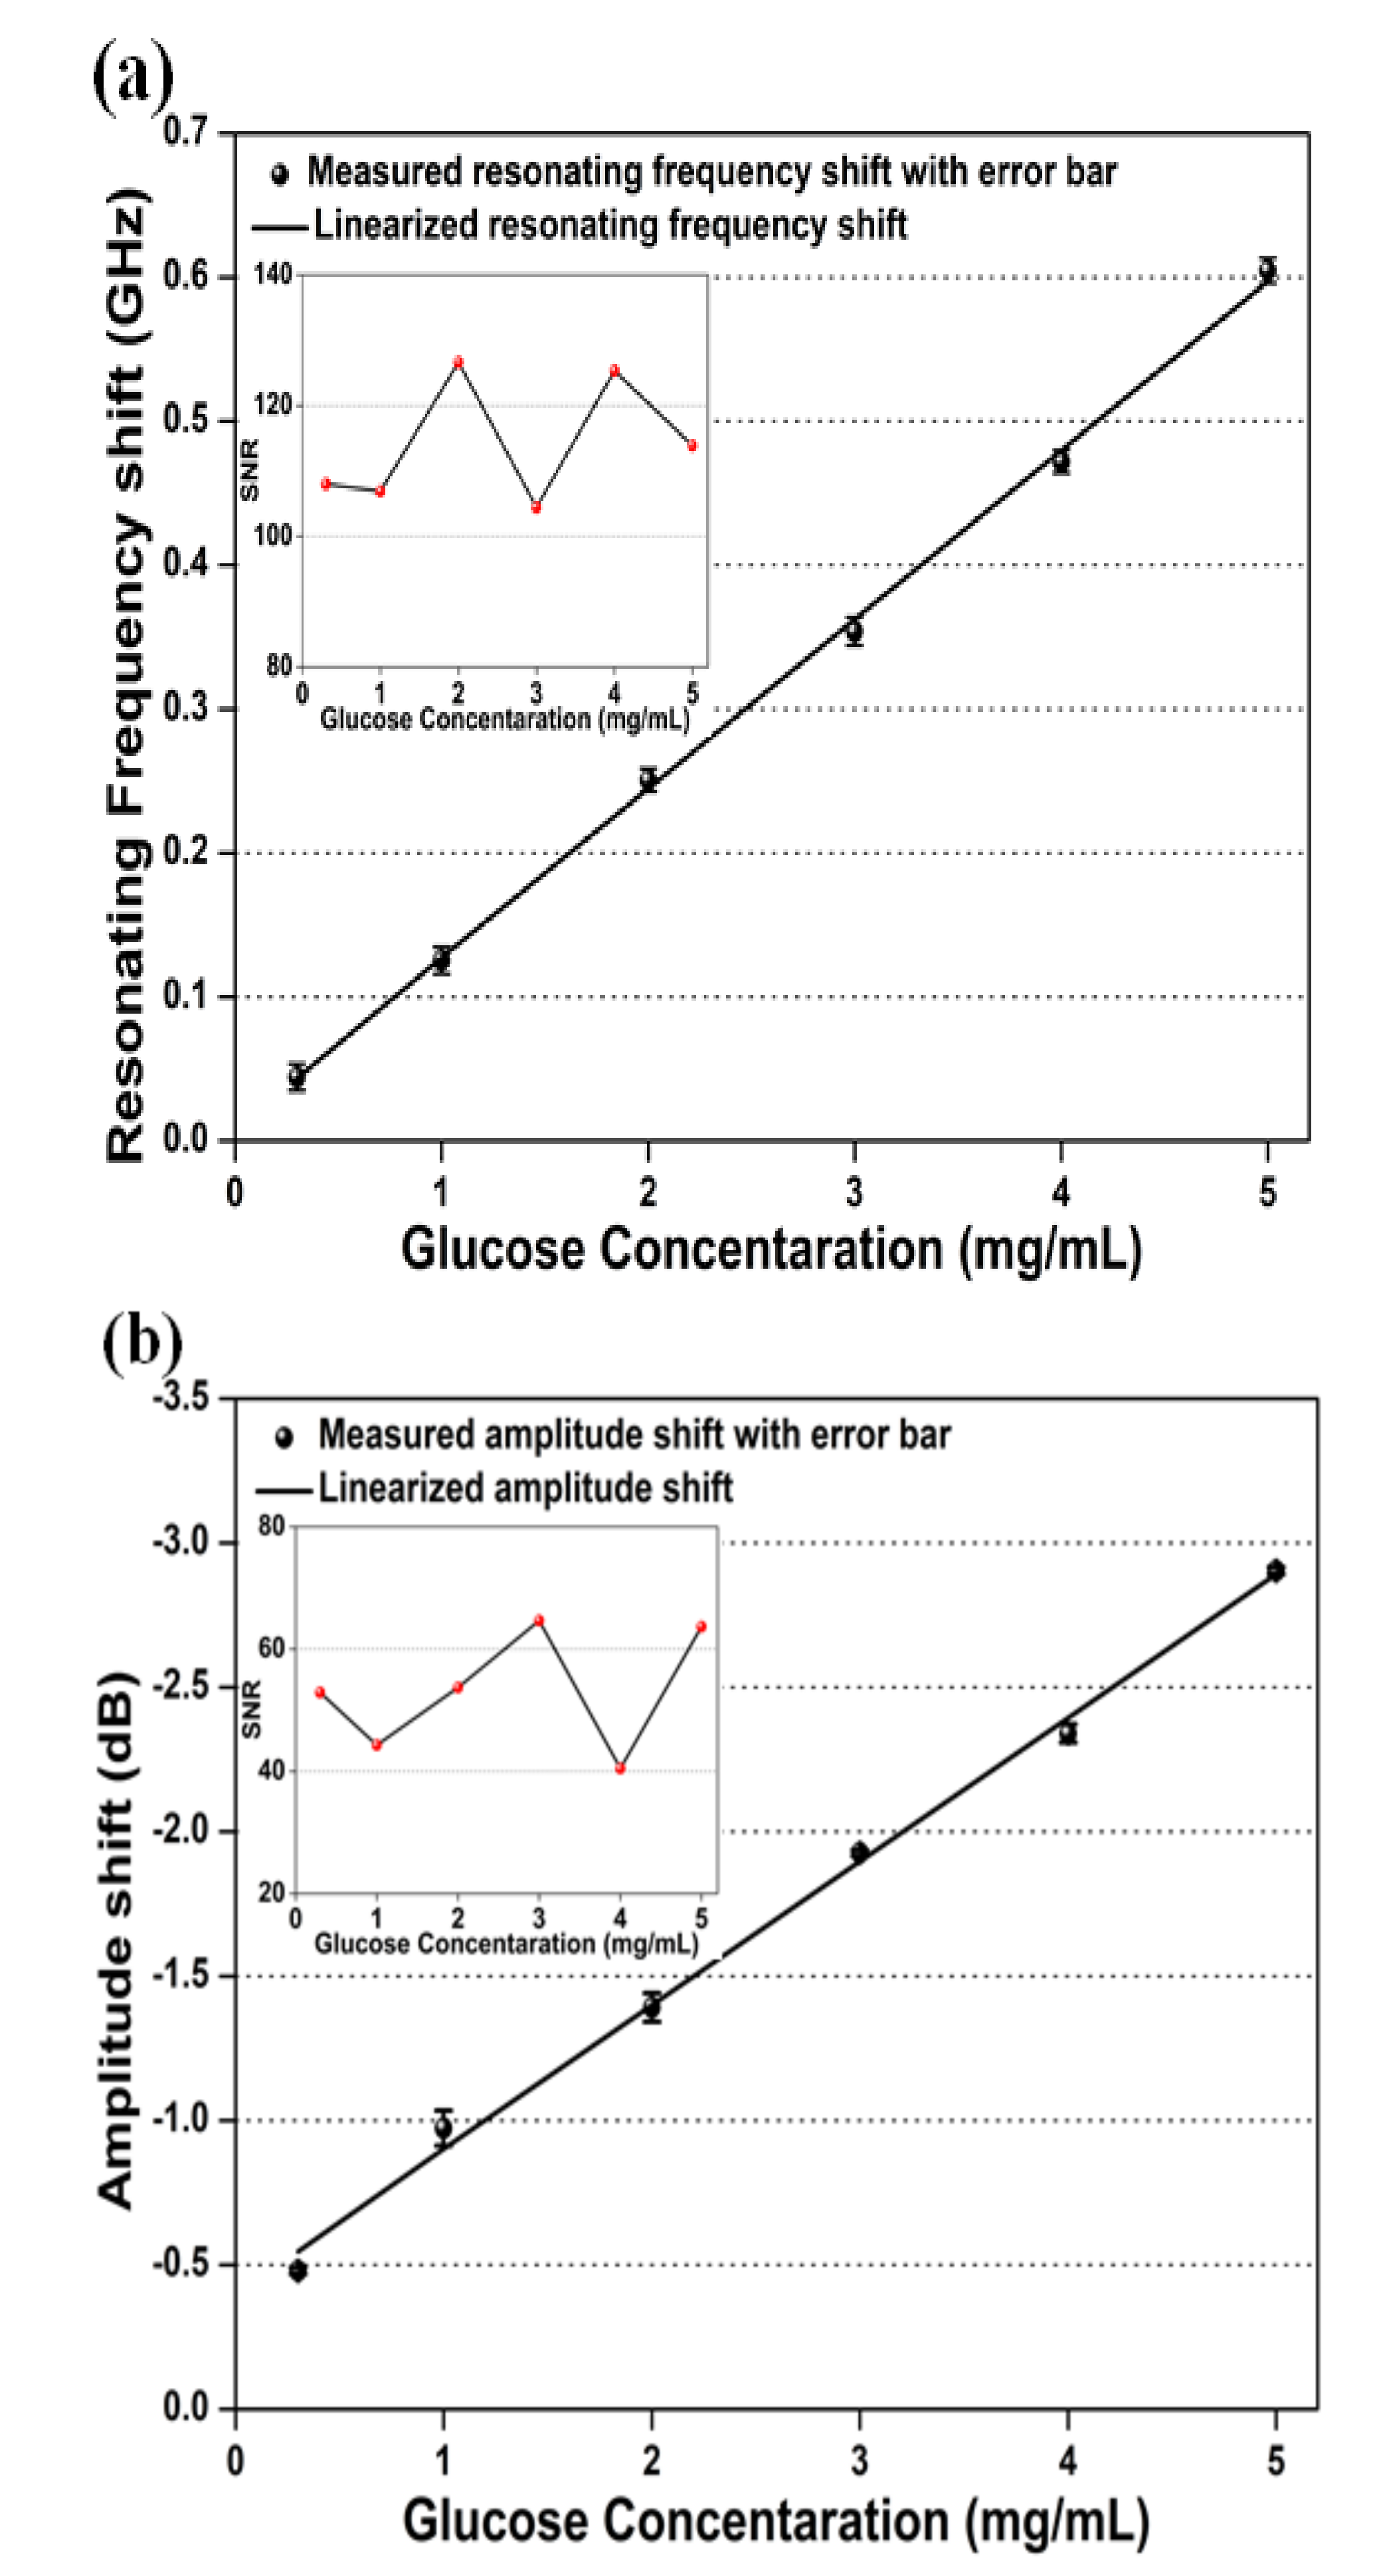
3.2. Linearization of Derived Parameters
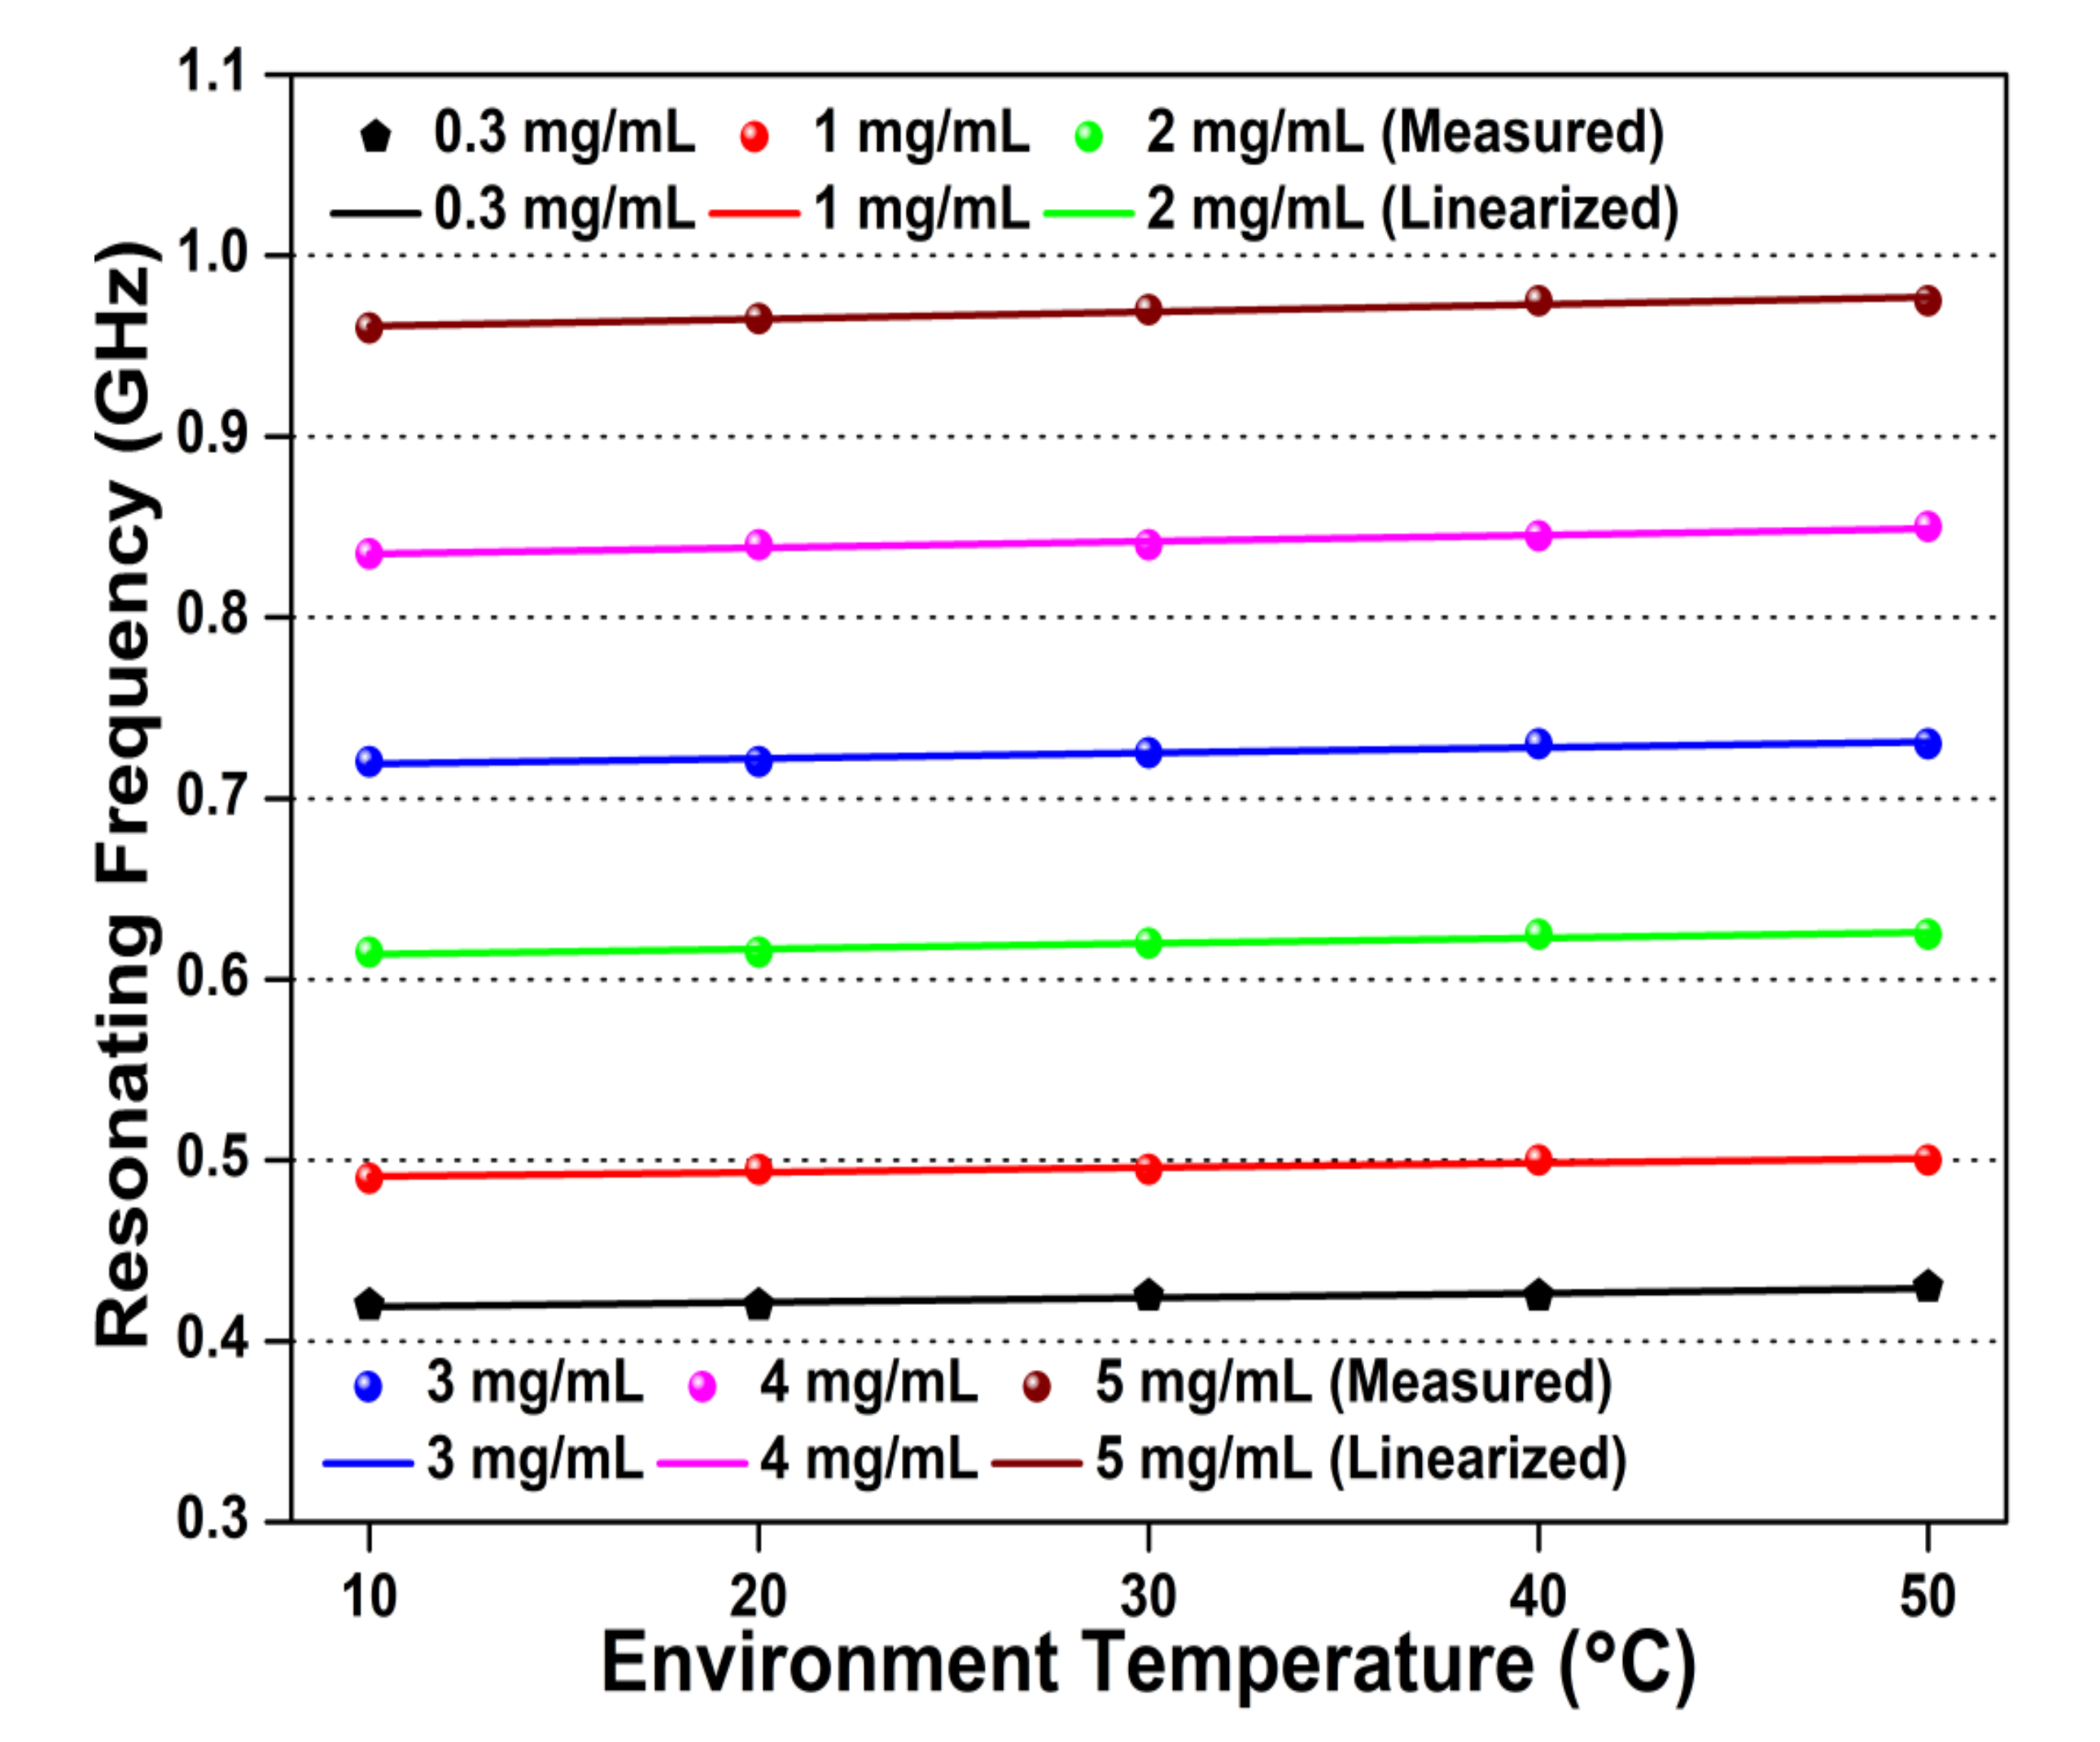
3.3. Temperature Effect
3.4. Modeling of the Microwave Biosensor
3.5. Sensing Mechanism of the Proposed Microwave Biosensor
4. Conclusions
Supplementary Materials
Author Contributions
Funding
Acknowledgments
Conflicts of Interest
References
- Chu, M.K.; Chen, J.; Gordijo, C.R.; Chiang, S.; Ivovic, A.; Koulajian, K.; Giacca, A.; Wu, X.Y.; Sun, Y. In vitro and in vivo testing of glucose-responsive insulin delivery microdevices in diabetic rats. Lab Chip 2012, 12, 2533–2539. [Google Scholar] [CrossRef] [PubMed] [Green Version]
- Sharma, T.; Hu, Y.; Stoller, M.; Feldman, M.; Ruoff, R.S.; Ferrari, M.; Zhang, X. Mesoporous silica as a membrane for ultra-thin implantable direct glucose fuel cells. Lab Chip 2011, 11, 2460–2465. [Google Scholar] [CrossRef] [PubMed]
- Ricci, F.; Moscone, D.; Tuta, C.S.; Palleschi, G.; Amine, A.; Poscia, A.; Valgimigli, F.; Messeri, D. Novel planar glucose biosensors for continuous monitoring use. Biosen. Bioelect. 2005, 20, 1993–2000. [Google Scholar] [CrossRef] [Green Version]
- Zhang, Z.; Chen, Z.; Cheng, F.; Zhang, Y.; Chen, L. Highly sensitive on-site detection of glucose in human urine with naked eye based on enzymatic-like reaction mediated etching of gold nanorods. Biosen. Bioelect. 2017, 89, 932–936. [Google Scholar] [CrossRef]
- Radhakumary, C.; Sreenivasan, K. Naked eye detection of glucose in urine using glucose oxidase immobilized gold nanoparticles. Anal. Chem. 2011, 83, 2829–2833. [Google Scholar] [CrossRef]
- Cho, J.K.N.H.; Mbanya, J.C.; Ogurstova, K.; Guariguata, L.; Rathmann, W.; Roglic, G.; Forouhi, N.; Dajani, R.; Esteghamati, A.; Boyko, E.; et al. IDF Diabetes Atlas, 8th ed.; International Diabetes Federation: Brussels, Belgium, 2017. [Google Scholar]
- Kawada, T. Depression and type 2 diabetes. Prim. Care Diabetes 2017, 11, 212–222. [Google Scholar] [CrossRef]
- Xiang, Y.; Lu, Y. Using personal glucose meters and functional DNA sensor to quantify a variety of analytical targets. Nat. Chem. 2011, 3, 697–703. [Google Scholar] [CrossRef]
- Basu, D.; Sarkar, T.; Sen, K.; Hossain S., M.; Das, J. Multi-Parametric Optical Glucose Sensor Based on Surface Functionalized Nano-Porous Silicon. IEEE Sens. J. 2018, 18, 9940–9947. [Google Scholar] [CrossRef]
- Tripathy, H.P.; Pattanaik, P.; Kamilla S., K.; Tripathy, R.K. A Simulation Approach to Study the Effect of Ultrasonic MEMS Based Receiver for Blood Glucose Sensing Applications. IEEE Sens. Lett. 2017, 1, 1–4. [Google Scholar] [CrossRef]
- Puttananjegowda, K.; Takshi, A.; Thomas, S. An Electrospun Nanofibrous Membrane Based Electrochemical Glucose Sensor. IEEE Sens. Lett. 2020, 4, 1–4. [Google Scholar] [CrossRef]
- Kim, N.Y.; Dhakal, R.; Adhikari Kim, E.S.; Wang, C. A reusable robust radio frequency biosensor using microwave resonator by integrated passive device technology for quantitative detection of glucose level. Biosens. Bioelect. 2015, 67, 687–693. [Google Scholar] [CrossRef] [Green Version]
- Hartono, A.; Sanjaya, E.; Ramli, R. Glucose Sensing Using Capacitive Biosensor Based on Polyvinylidene Fluoride Thin Film. Biosensors 2018, 8, 12. [Google Scholar] [CrossRef] [PubMed] [Green Version]
- Zarifi, M.H.; Sadabadi, H.; Hejazi, S.H.; Daneshmand, M.; Sanati-Nezhad, A. Noncontact and nonintrusive microwave microfluidic flow sensor for energy and biomedical engineering. Sci. Rep. 2018, 8, 139. [Google Scholar] [CrossRef] [PubMed] [Green Version]
- Wiltshire, B.D.; Zarifi, T.; Zarifi, M.H. Passive split ring resonator tag configuration for RFID-based wireless permittivity sensing. IEEE Sens. J. 2020, 20, 1904–1911. [Google Scholar] [CrossRef]
- Narang, R.; Mohammadi, S.; Ashani, M.M.; Sadabadi, H.; Hejazi, H.; Zarifi M., H.; Nezhad, A.S. Sensitive, real-time and non-intrusive detection of concentration and growth of pathogenic bacteria using microfluidic microwave ring resonator biosensor. Sci. Rep. 2018, 8, 15807. [Google Scholar] [CrossRef]
- Lee, H.J.; Lee, J.H.; Moon, H.S.; Jang, I.S.; Choi, J.S.; Yook, J.G.; Jung, H.I. A planar split-ring resonator-based microwave biosensor for label-free detection of biomolecules. Sens. Act. B Chem. 2012, 169, 26–31. [Google Scholar] [CrossRef]
- Omkar Yu, W.; Huang, S.Y. T-Shaped Patterned Microstrip Line for Noninvasive Continuous Glucose Sensing. IEEE Microwave Wireless Compon. Lett. 2018, 28, 942–944. [Google Scholar] [CrossRef]
- Jang, C.; Park, J.K.; Lee, H.J.; Yun G., H.; Yook, J.G. Temperature-Corrected Fluidic Glucose Sensor Based on Microwave Resonator. Sensors 2018, 18, 3850. [Google Scholar] [CrossRef] [Green Version]
- Babajanyan, A.; Lee, K.; Khachatryan, R.; Nerkararyan, K. Sensing of glucose concentration by using a surface plasmon polariton. J. Kor. Phys. Soc. 2008, 52, 440–443. [Google Scholar] [CrossRef]
- Ebrahimi, A.; Scott, J.; Ghorbani, K. Microwave Reflective Biosensor for Glucose Level Detection in Aqueous Solutions. Sens. Act. B Phys. 2020, 301, 111662. [Google Scholar] [CrossRef]
- Lee, H.J.; Choi, H.H. Microwave transmission properties of D-(+)-glucose solution with concentration variations. J. Phys. D Appl. Phys. 2019, 52, 385401. [Google Scholar] [CrossRef]
- Kumari, R.; Patel P., N.; Yadav, R. An ENG resonator-based microwave sensor for the characterization of aqueous glucose. J. Phys. D Appl. Phys. 2018, 51, 217–222. [Google Scholar] [CrossRef]
- Hassan, R.S.; Lee, J.; Kim, S. A Minimally Invasive Implantable Sensor for Continuous Wireless Glucose Monitoring Based on a Passive Resonator. IEEE Antennas Wirel. Propag. Lett. 2020, 19, 124–128. [Google Scholar] [CrossRef]
- Liu, L.W.Y.; Kandwal, A.; Kogut, A.; Eremenko, Z.E.; Kogut, E.; Islam, M.T.; Dolia, R.; Nosatiuk, S.; Nguyen, S.T. In-Vivo and Ex-Vivo Measurements of Blood Glucose Using Whispering Gallery Modes. Sensors 2020, 20, 830. [Google Scholar] [CrossRef] [PubMed] [Green Version]
- Yee, S.K.; Lim, S.C.J.; Pong, P.S.; Dahlan, S.H. Microstrip Defected Ground Structure for Determination of Blood Glucose Concentration. Prog. Electromagnet. Res. 2020, 99, 35–48. [Google Scholar] [CrossRef] [Green Version]
- Adhikari K., K.; Kim, N.Y. Ultrahigh-Sensitivity Mediator-Free Biosensor Based on a Microfabricated Microwave Resonator for the Detection of Micromolar Glucose Concentrations. IEEE Trans. Microwave Theory Tech. 2016, 64, 319–327. [Google Scholar] [CrossRef]
- Li, Y.; Yao, Z.; Yue, W.; Zhang, C.; Gao, S.; Wang, C. Reusable, Non-Invasive, and Ultrafast Radio Frequency Biosensor Based on Optimized Integrated Passive Device Fabrication Process for Quantitative Detection of Glucose Levels. Sensors 2020, 20, 1565. [Google Scholar] [CrossRef] [Green Version]
- Kandwal, A.; Igbe, T.; Li, J.; Liu, Y.; Li, S.; Liu, L.W.Y.; Nie, Z. Highly Sensitive Closed Loop Enclosed Split Ring Biosensor with High Field Confinement for Aqueous and Blood-Glucose Measurements. Scient. Rep. 2020, 10, 4081. [Google Scholar] [CrossRef]
- Cui, Y.; Wang, P. The design and operation of ultra-sensitive and tunable radio-frequency interferometers. IEEE Trans. Microwave Theory Tech. 2014, 62, 3172–3182. [Google Scholar] [CrossRef]
- Abduljabar, A.A.; Clark, N.; Lees, J.; Porch, A. Dual Mode Microwave Microfluidic Sensor for Temperature Variant Liquid Characterization. IEEE Trans. Microwave Theory Tech. 2017, 65, 2572–2582. [Google Scholar] [CrossRef] [Green Version]
- Naylon, J. Microwave resonant sensors. Ph.D. Thesis, Cardiff University, Cardiff, UK, 2011. [Google Scholar]
- Juan, C.G.; Bronchalo, E.; Potelon, B.; Quendo, C.; Navarro, E.Á.; Navarro, J.M.S. Concentration Measurement of Microliter-Volume Water–Glucose Solutions Using Q Factor of Microwave Sensors. IEEE Trans. Instrum. Meas. 2019, 68, 2621–2634. [Google Scholar] [CrossRef]
- Adhikari, K.K.; Chuluunbaatar, Z.; Park, H.; Jung, Y.; Cho, G.; Jo, Y.H.; Kim, S.S.; Kim, N.Y. Flexible screen-printed biosensor with high-Q microwave resonator for rapid and sensitive detection of glucose. Proceedings of IEEE MTT-S International Microwave Workshop Series on RF and Wireless Technologies for Biomedical and Healthcare Applications (IMWS-Bio2014), London, UK, 8–10 December 2014; pp. 1–3. [Google Scholar]
- Salema, A.A.; Yeow, Y.K.; Ishaque, K.; Ani, F.N.; Afzal, M.T.; Hassane, A. Dielectric properties and microwave heating of oil palm biomass and biochar. Ind. Crops Prod. 2013, 50, 366–374. [Google Scholar] [CrossRef]
- Zhang, R.; Liu, S.; Jin, H.; Luo, Y.; Zheng, Z.; Gao, F.; Zheng, Y. Noninvasive Electromagnetic Wave Sensing of Glucose. Sensors 2019, 19, 1151. [Google Scholar] [CrossRef] [PubMed] [Green Version]
- Fuchs, J.; Herrling, T.; Groth, N. Detection of Free Radicals in Skin: A Review of the Literature and New Developments. In Oxidants and Antioxidants in Cutaneous Biology; Karger Publisher: Basel, Switzerland, 2001. [Google Scholar]
- Tseng, P.; Napier, B.; Garbarini, L.; Kaplan, D.L.; Omenetto, F.G. Functional, RF-Trilayer Sensors for Tooth-Mounted, Wireless Monitoring of the Oral Cavity and Food Consumption. Adv. Mater. 2018, 30, 1703257. [Google Scholar] [CrossRef]
- Sanz, D.A.; Unigarro, E.A.; Osma, J.F.; Quijano, F.S. Low cost wireless passive microsensors for the detection of hazardous compounds in water systems for control and monitoring. Sens. Act. B: Chem. 2013, 178, 26–33. [Google Scholar] [CrossRef]
- Brady, A.; McCabe, C.; McCann, M. Fundamentals of Medical-Surgical Nursing: A Systems Approach. John Wiley & Sons: New York, NY, USA, 2013. [Google Scholar]
- Odabashyan, L.; Babajanyan, A.; Baghdasaryan, Z.; Kim, S.; Kim, J.; Friedman, B.; Lee, J.H.; Lee, K. Real-Time Noninvasive Measurement of Glucose Concentration Using a Modified Hilbert Shaped Microwave Sensor. Sensors 2019, 19, 5525. [Google Scholar] [CrossRef] [PubMed] [Green Version]
- Kim, J.; Babajanyan, A.; Hovsepyan, A.; Lee, K.; Friedman, B. Microwave dielectric resonator biosensor for aqueous glucose solution. Rev. Sci. Instrum. 2008, 79, 086107. [Google Scholar] [CrossRef] [PubMed]
- Chen, J. On-Chip Spiral Inductor Transformer Design and Modeling for RF Applications. Ph.D. Thesis, University of Central Florida, Orlando, FL, USA, 2006. [Google Scholar]
- Adhikari, K.K.; Wang, C.; Qiang, T.; Kumar, A.; Wu, Q.; Maharjan, S.; Kim, N.Y. Real-time accurate quantification of nanoliter ethanol using performance-optimized micro-fabricated microwave resonant sensor. J. Phys. D Appl. Phys. 2019, 53, 085402. [Google Scholar] [CrossRef]
- Turgul, V.; Kale, I. Permittivity Extraction of Glucose Solutions through Artificial Neural Networks and Non-invasive Microwave Glucose Sensing. Sens. Act. A Phys. 2018, 277, 65–72. [Google Scholar] [CrossRef] [Green Version]
- Adhikari, K.K.; Qiang, T.; Wang, C.; Sung, H.K.; Wang, L.; Wu, Q. High-sensitivity radio frequency noncontact sensing and accurate quantification of uric acid in temperature-variant aqueous solutions. App. Phys. Exp. 2018, 11, 117001. [Google Scholar] [CrossRef]
- Wu, Y.M.; Qiang, T.; Wang, C.; Adhikari, K.K.; Lv, X.; Wu, Y. GaAs-Based IPD-Fabricated Center-Frequency-Controllable Bandpass Filter with Asymmetrical Differential Inductor and Air-Bridge Enhanced Capacitor. IEEE Access 2019, 7, 137784–137793. [Google Scholar] [CrossRef]
- Wang, C.; Lee, W.S.; Zhang, F.; Kim, N.Y. A novel method for the fabrication of integrated passive devices on SI-GaAs substrate. Int. J. Adv. Manuf. Technol. 2011, 52, 1011–1018. [Google Scholar] [CrossRef]
- Kumar, A.; Meng, F.Y.; Wang, C.; Adhikari, K.K.; Qiang, T.; Wu, Q.; Wu, Y. Design Analysis of Integrated Passive Device-Based Balun Devices with High Selectivity for Mobile Application. IEEE Access 2019, 7, 23169–23176. [Google Scholar] [CrossRef]
- Dilgam, H. Normal blood sugar level. AFDiabetics. 2017. Available online: https://www.afdiabetics.com/normal-blood-sugar-level/ (accessed on 27 May 2020).
- Ebrahimi, A.; Withayachumnankul, W.; Sarawi, S.A.; Abbott, D. High-Sensitivity Metamaterial-Inspired Sensor for Microfluidic Dielectric Characterization. IEEE Sen. J. 2014, 14, 1345–1351. [Google Scholar] [CrossRef] [Green Version]
- Chaplin, M. Water Structure and Science. Jisc. 2007. Available online: www1.lsbu.ac.uk/water/water_structure_science.html. (accessed on 28 May 2020).


| 0.3 mg/mL | 1 mg/mL | 2mg/mL | 3 mg/mL | 4 mg/mL | 5 mg/mL | |
|---|---|---|---|---|---|---|
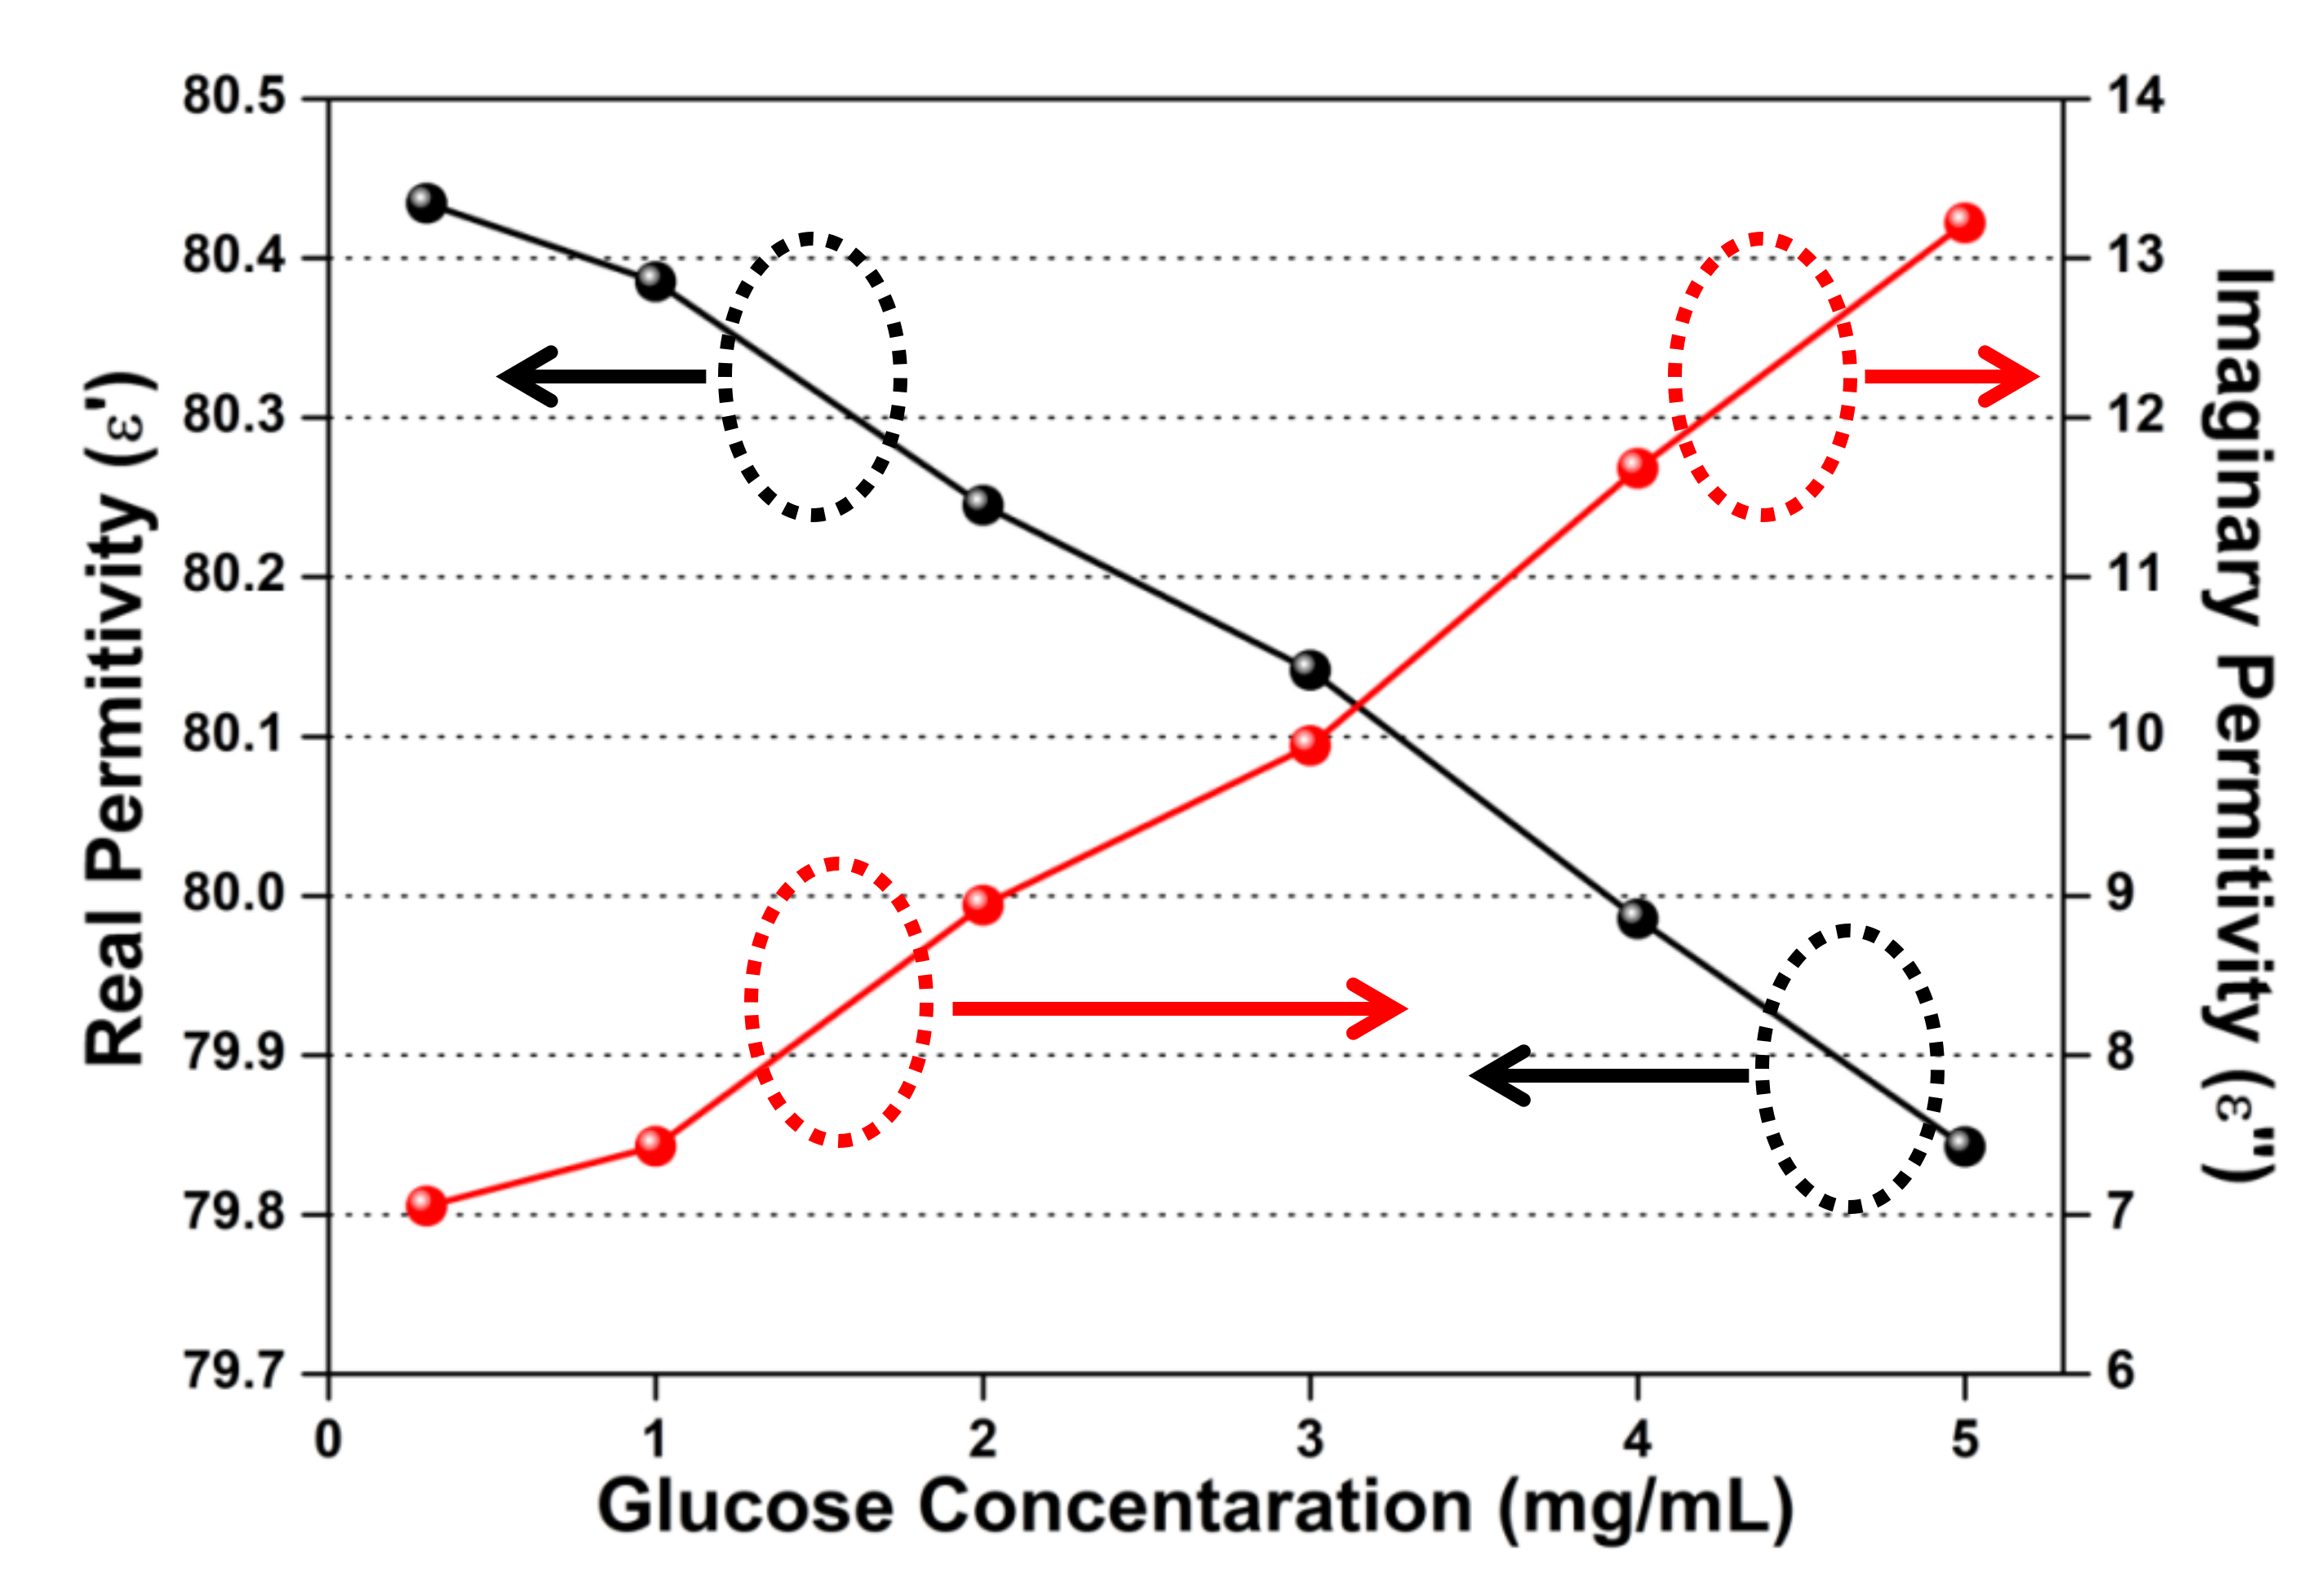
| Real Permittivity | 80.434 | 80.385 | 80.244 | 80.141 | 79.985 | 79.842 |
| Imaginary Permittivity | 7.052 | 7.427 | 8.942 | 9.9433 | 11.679 | 13.221 |
| Ref. | Biosensor Structure | Concentration (mg/mL) | Size (λ0×λ0) | Sample Concentration (µL) | Sensitivity (MHz/mg/mL) | Sensitivity (dB/mg/mL) | Limit of Detection (mg/mL) |
|---|---|---|---|---|---|---|---|
| 12 | LC-Resonator | 0.25–5 | 0.026 × 0.060 | 1 | 108 | NA | 0.8 |
| 19 | CSRR Resonator | 0.3–4 | 0.251 × 0.386 | NA | NA | 0.03 | NA |
| 21 | CSRR Resonator | 0–5 | NA | 70 | 0.5 | 0.5 | NA |
| 23 | ENG Resonator | 20–100 | 0.273 × 0.136 | 2 | 1.7 | 0.1 | 0.4 |
| 41 | Hilbert-shaped resonator | 0.5–2.5 | 0.408 × 0.808 | 500 | NA | 0.0156 | 0.192 |
| This work | LC-Resonator | 0.3–5 | 0.006 × 0.005 | 0.1 | 117.5 | 0.49 | 0.35 |
© 2020 by the authors. Licensee MDPI, Basel, Switzerland. This article is an open access article distributed under the terms and conditions of the Creative Commons Attribution (CC BY) license (http://creativecommons.org/licenses/by/4.0/).
Share and Cite
Kumar, A.; Wang, C.; Meng, F.-Y.; Zhou, Z.-L.; Zhao, M.; Yan, G.-F.; Kim, E.-S.; Kim, N.-Y. High-Sensitivity, Quantified, Linear and Mediator-Free Resonator-Based Microwave Biosensor for Glucose Detection. Sensors 2020, 20, 4024. https://0-doi-org.brum.beds.ac.uk/10.3390/s20144024
Kumar A, Wang C, Meng F-Y, Zhou Z-L, Zhao M, Yan G-F, Kim E-S, Kim N-Y. High-Sensitivity, Quantified, Linear and Mediator-Free Resonator-Based Microwave Biosensor for Glucose Detection. Sensors. 2020; 20(14):4024. https://0-doi-org.brum.beds.ac.uk/10.3390/s20144024
Chicago/Turabian StyleKumar, Alok, Cong Wang, Fan-Yi Meng, Zhong-Liang Zhou, Meng Zhao, Guo-Feng Yan, Eun-Seong Kim, and Nam-Young Kim. 2020. "High-Sensitivity, Quantified, Linear and Mediator-Free Resonator-Based Microwave Biosensor for Glucose Detection" Sensors 20, no. 14: 4024. https://0-doi-org.brum.beds.ac.uk/10.3390/s20144024