Experimental Investigation on Choosing a Proper Sensor System for Guided Waves to Check the Integrity of Seven-Wire Steel Strands


Abstract
:1. Introduction
2. Theoretical Background
2.1. Theory of Magnetostrictive Sensor
2.2. Theory of Piezoelectric Transducer
2.3. Theory of Laser-Generated Ultrasound
3. Experiments and Analysis on Three Sensors
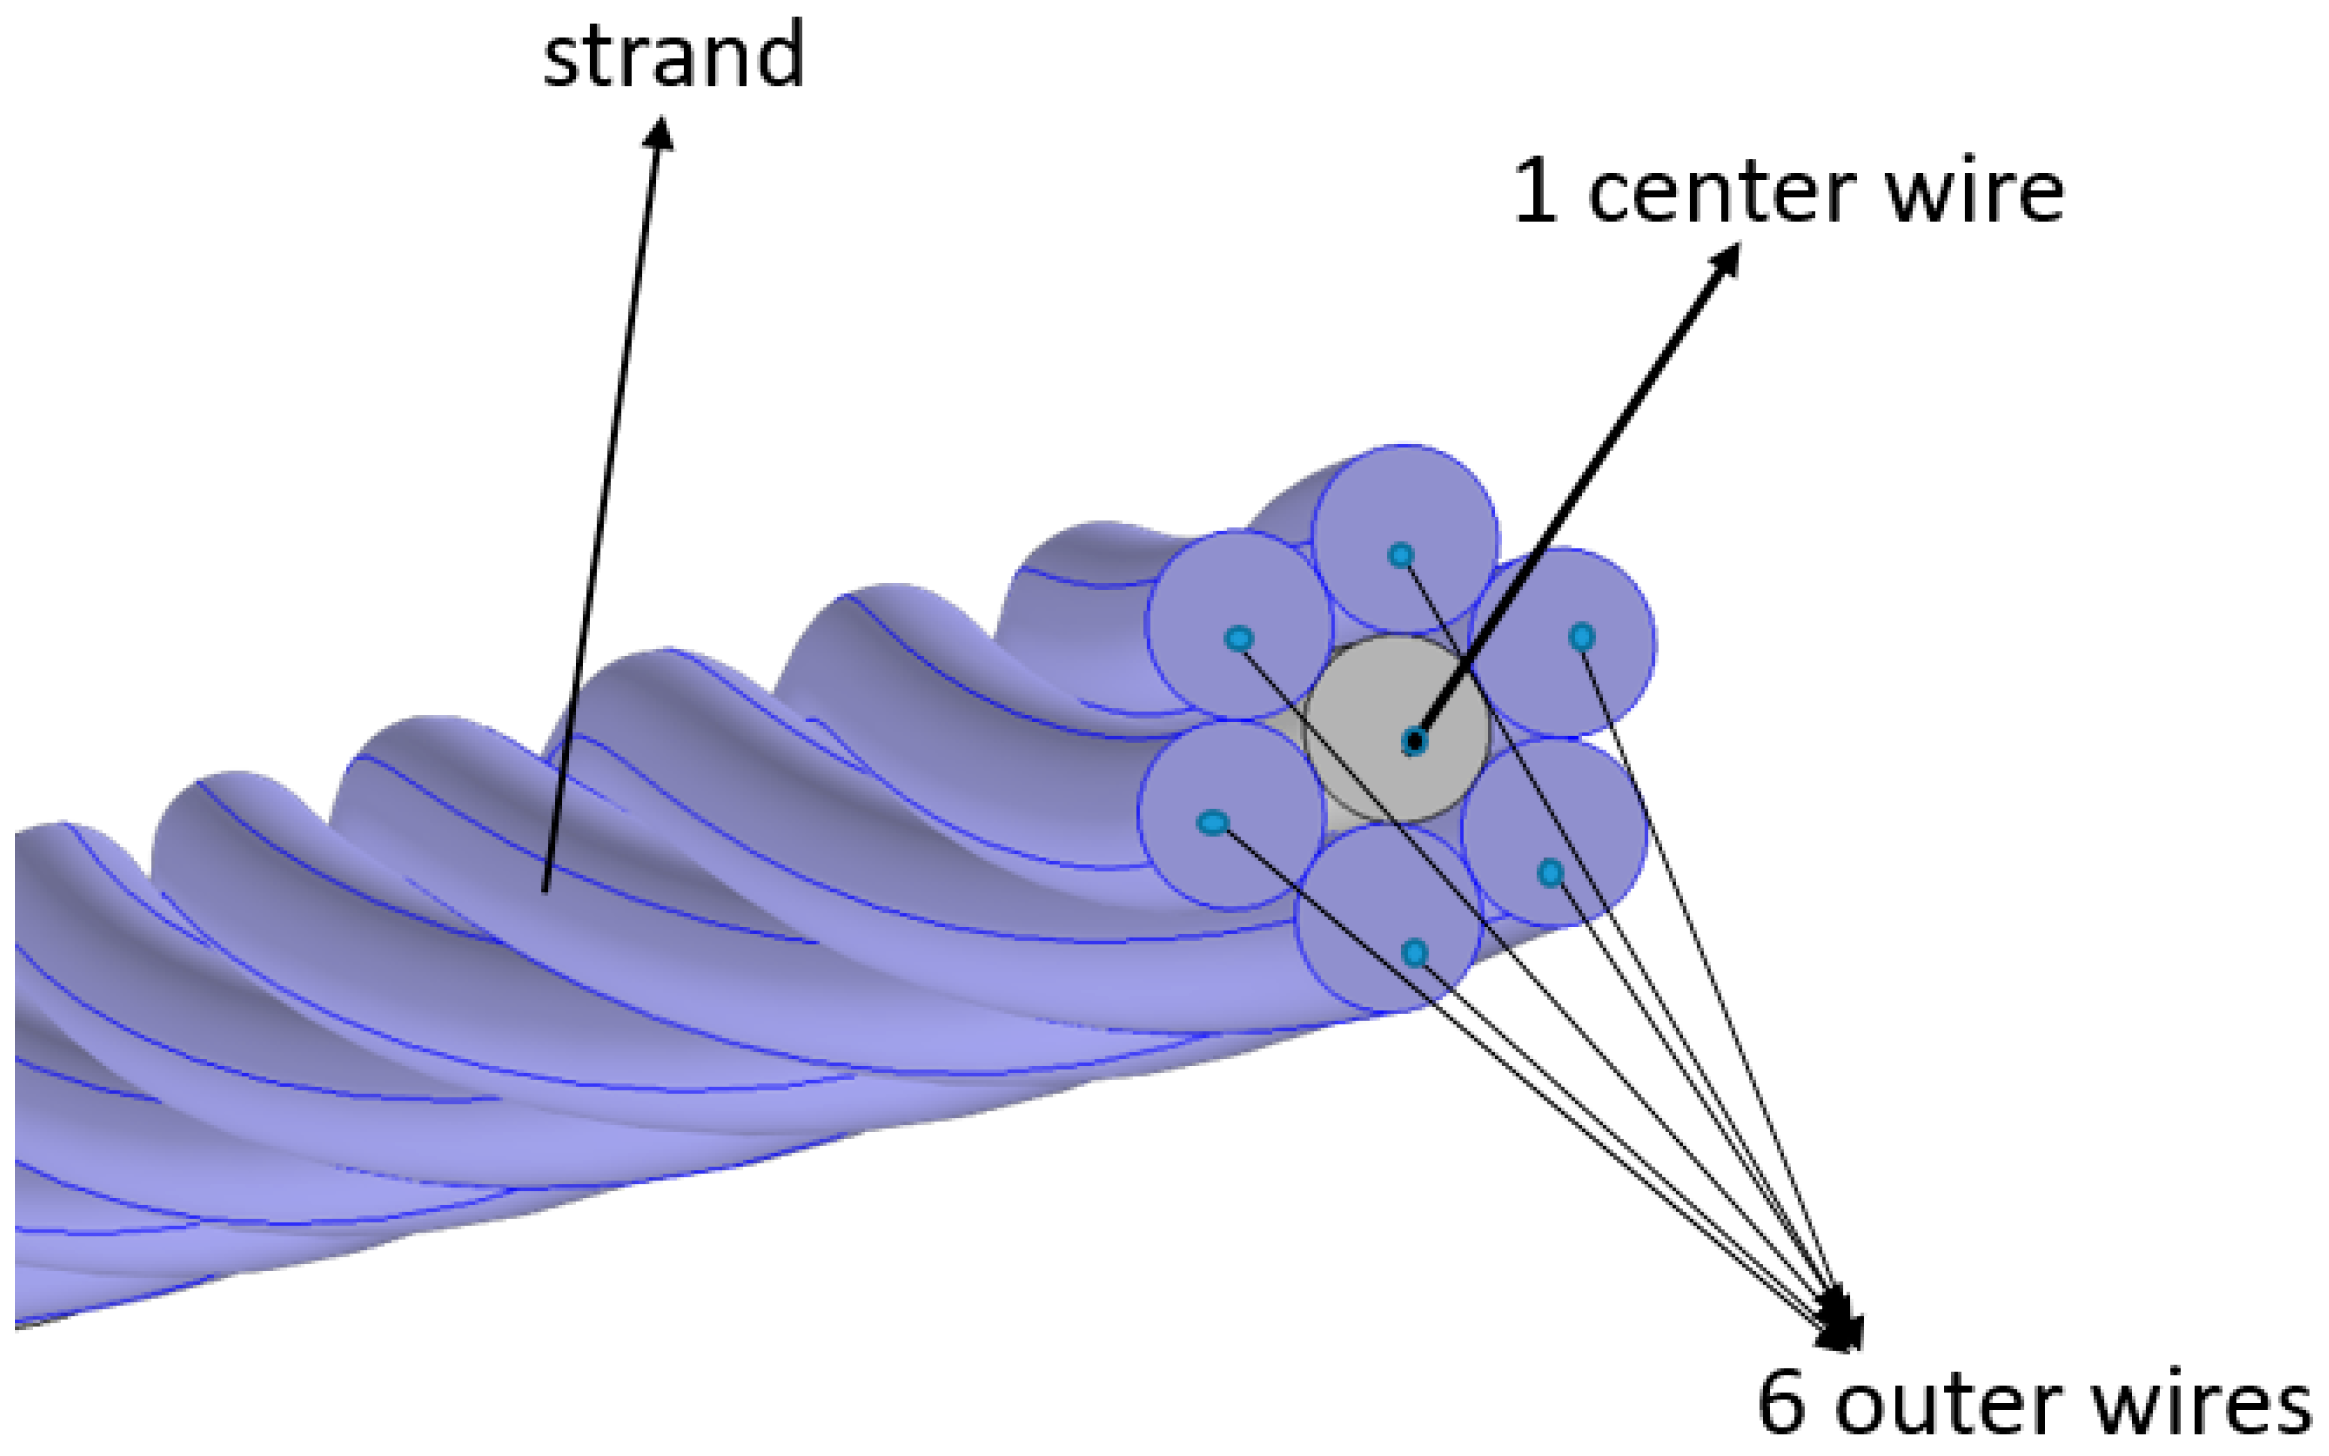
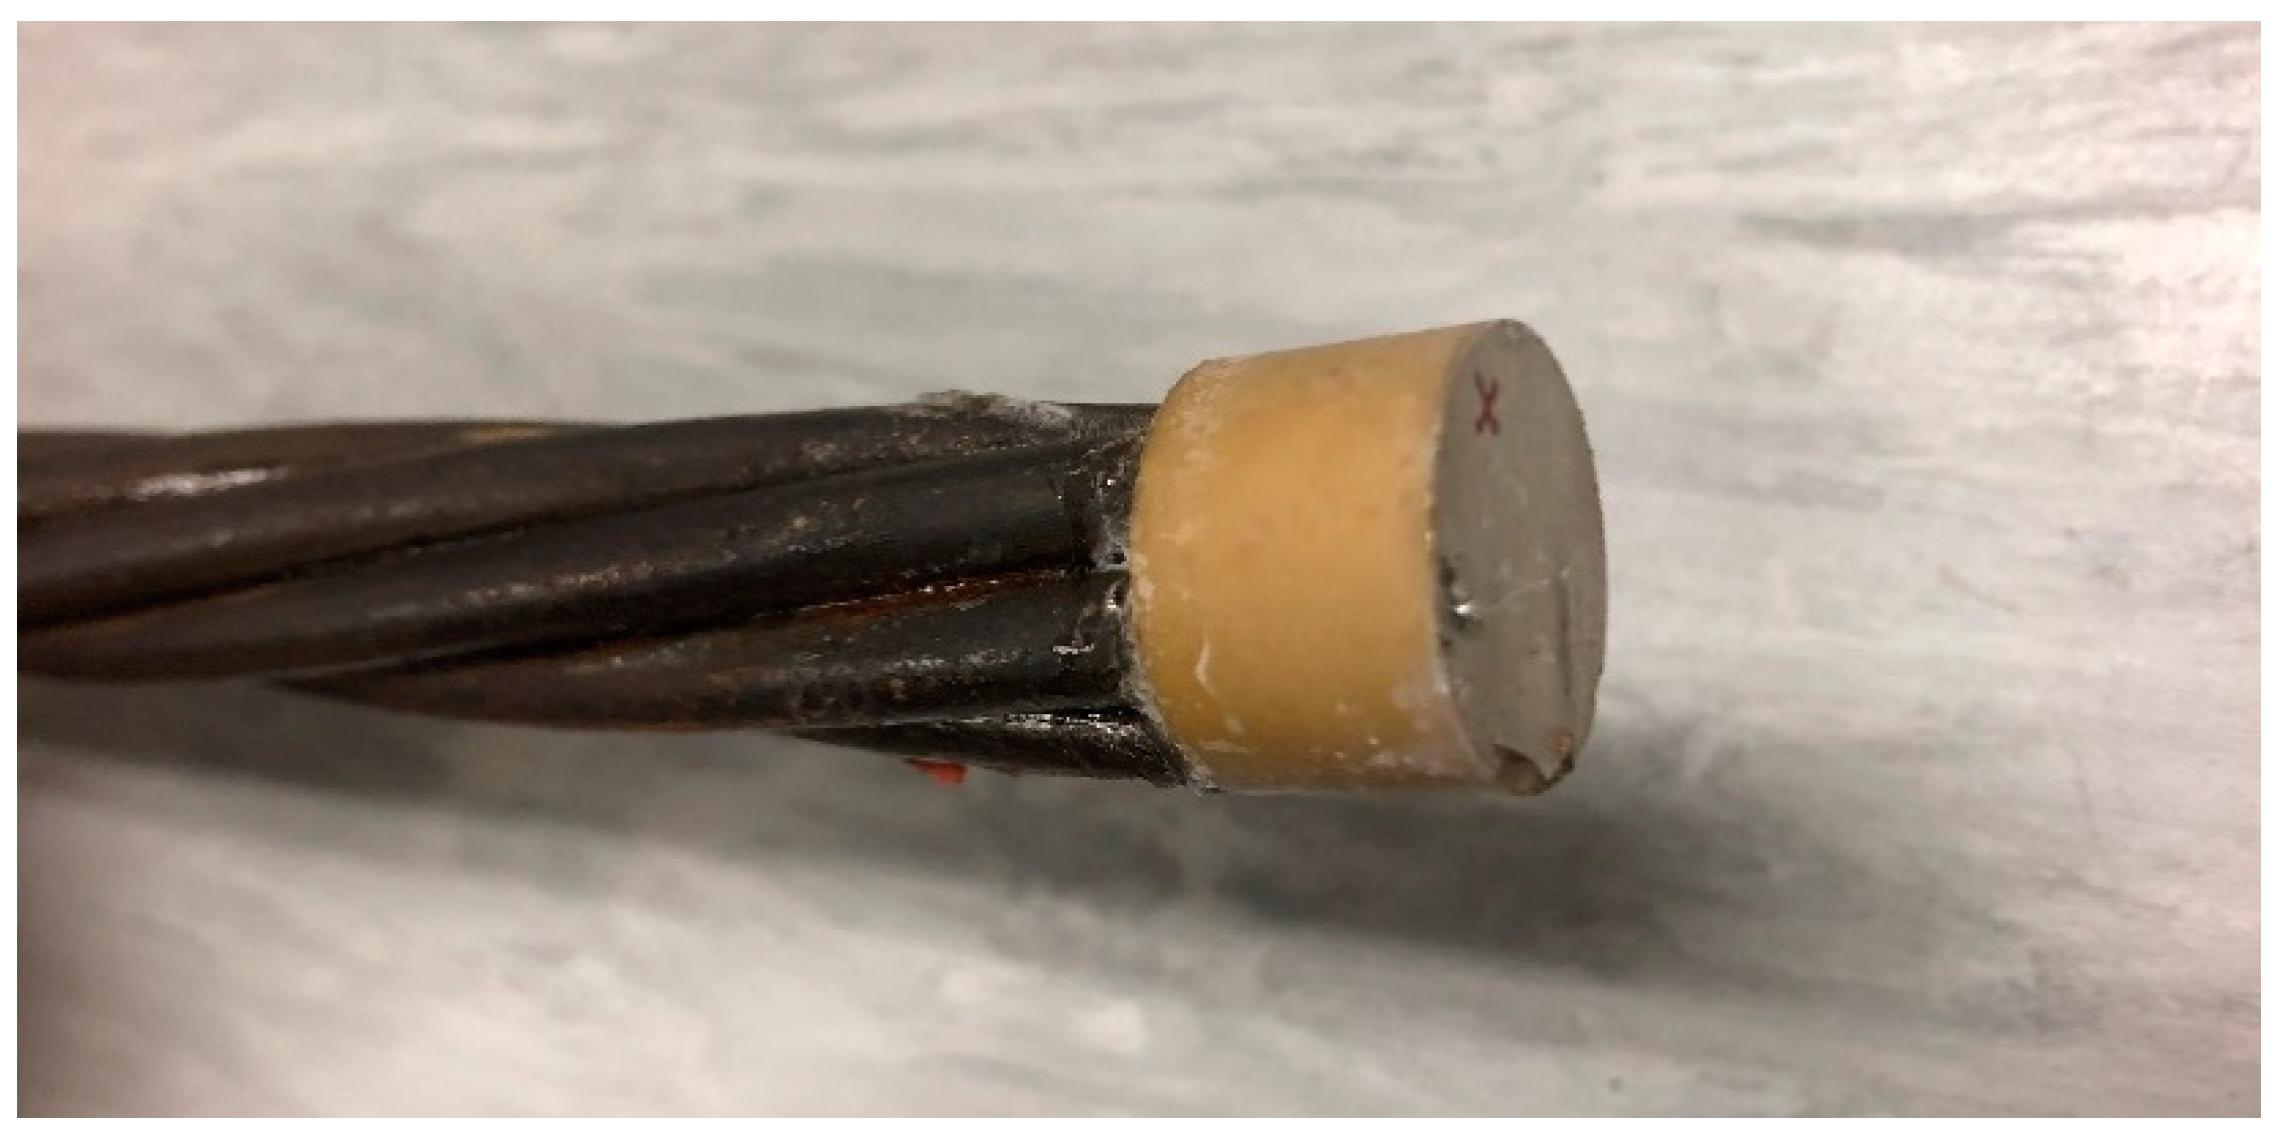
3.1. Cable Information
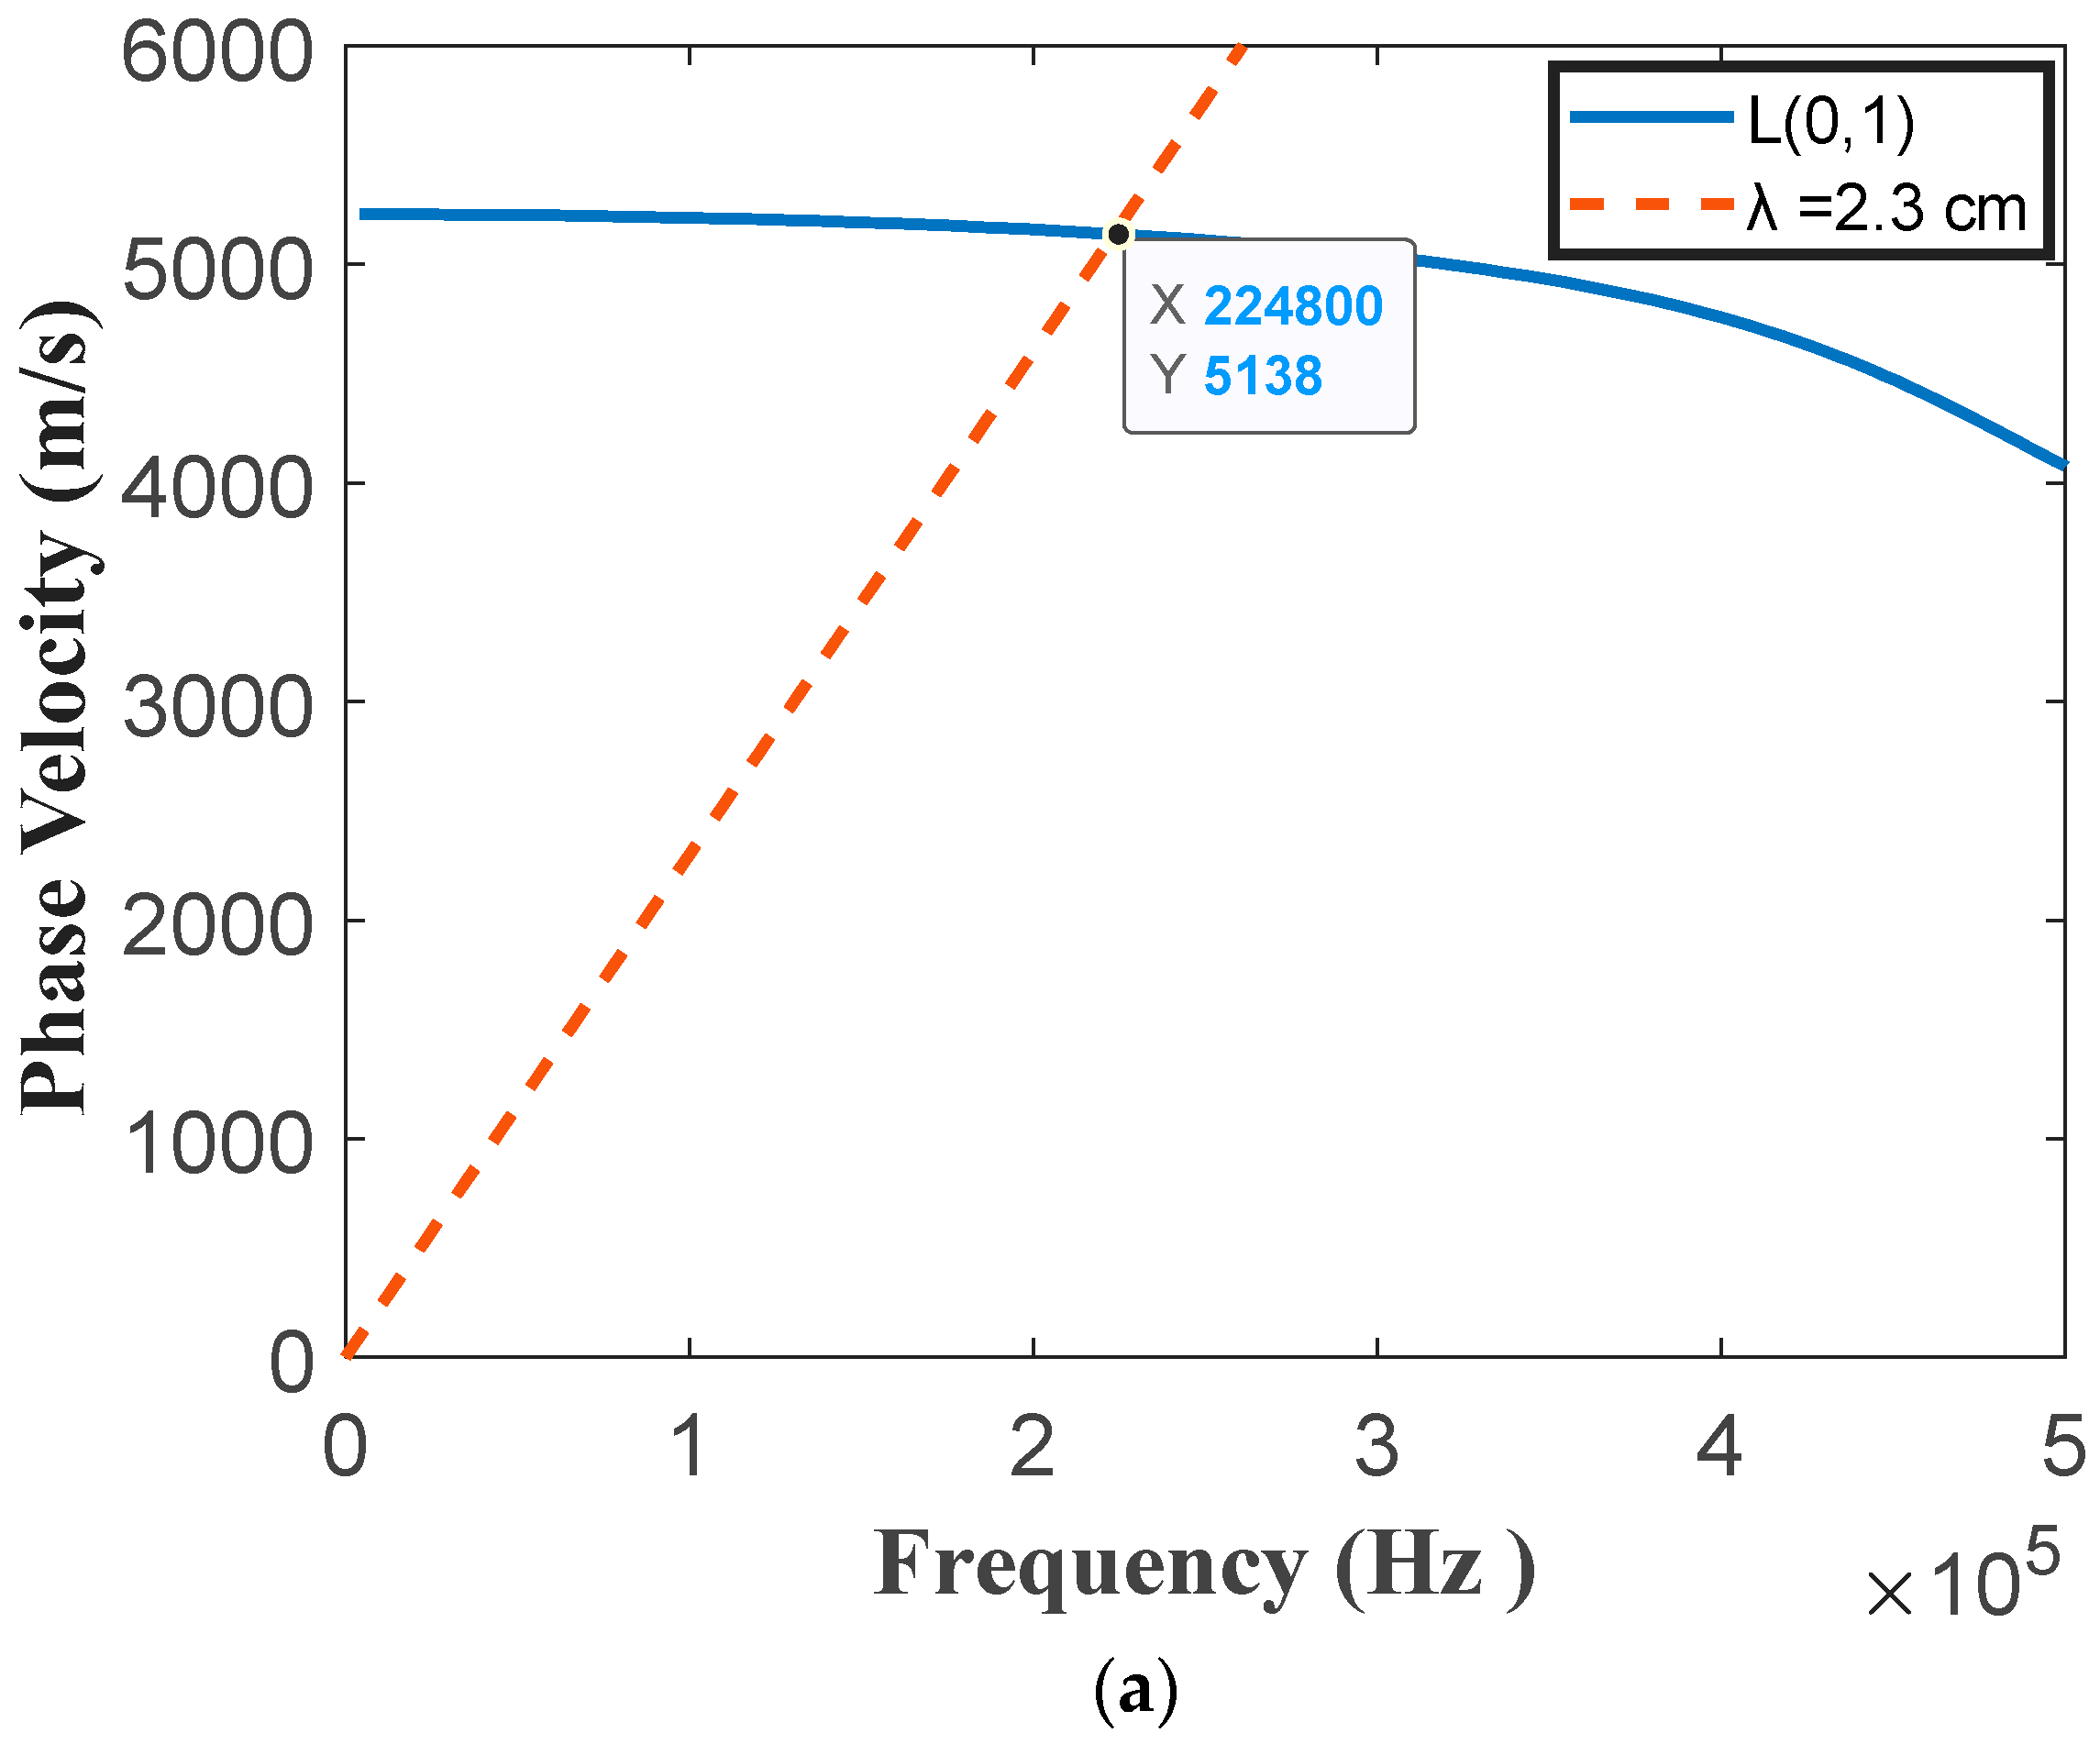
3.2. Dispersion Curves of a Seven-Wire Strand
3.3. Experiments for Seven-Wire Twisted Steel Strand Defects Detection
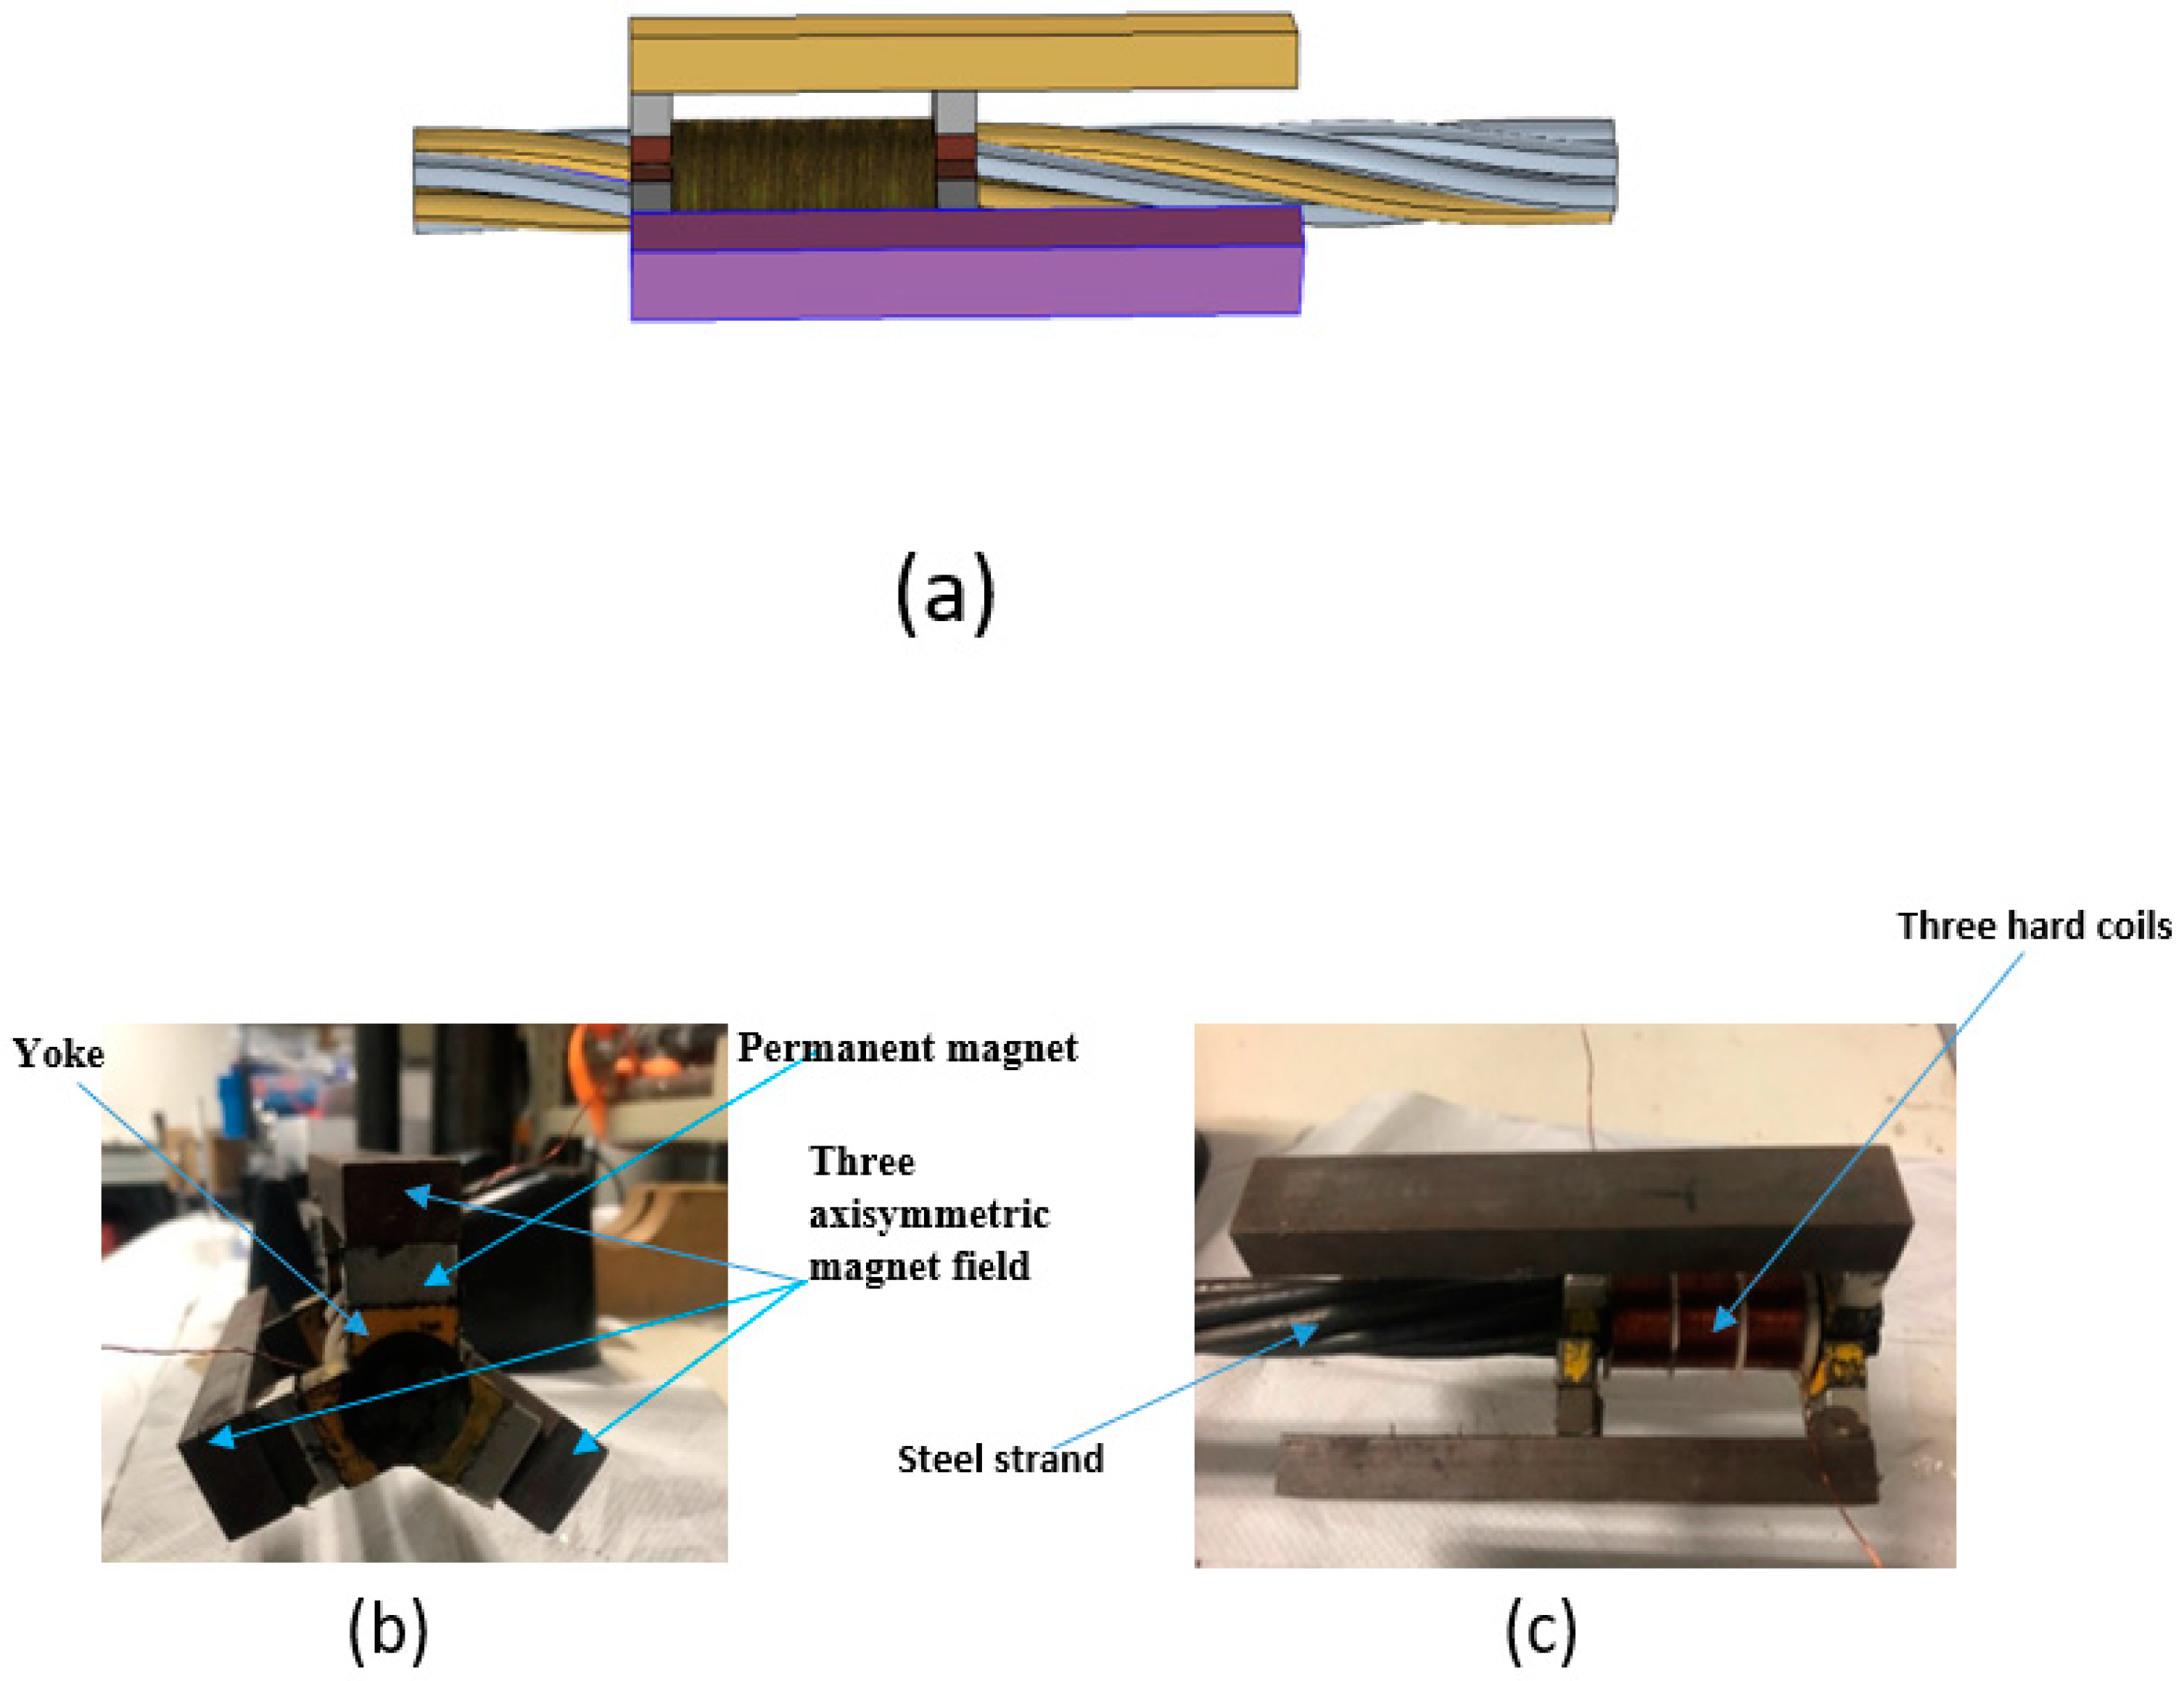
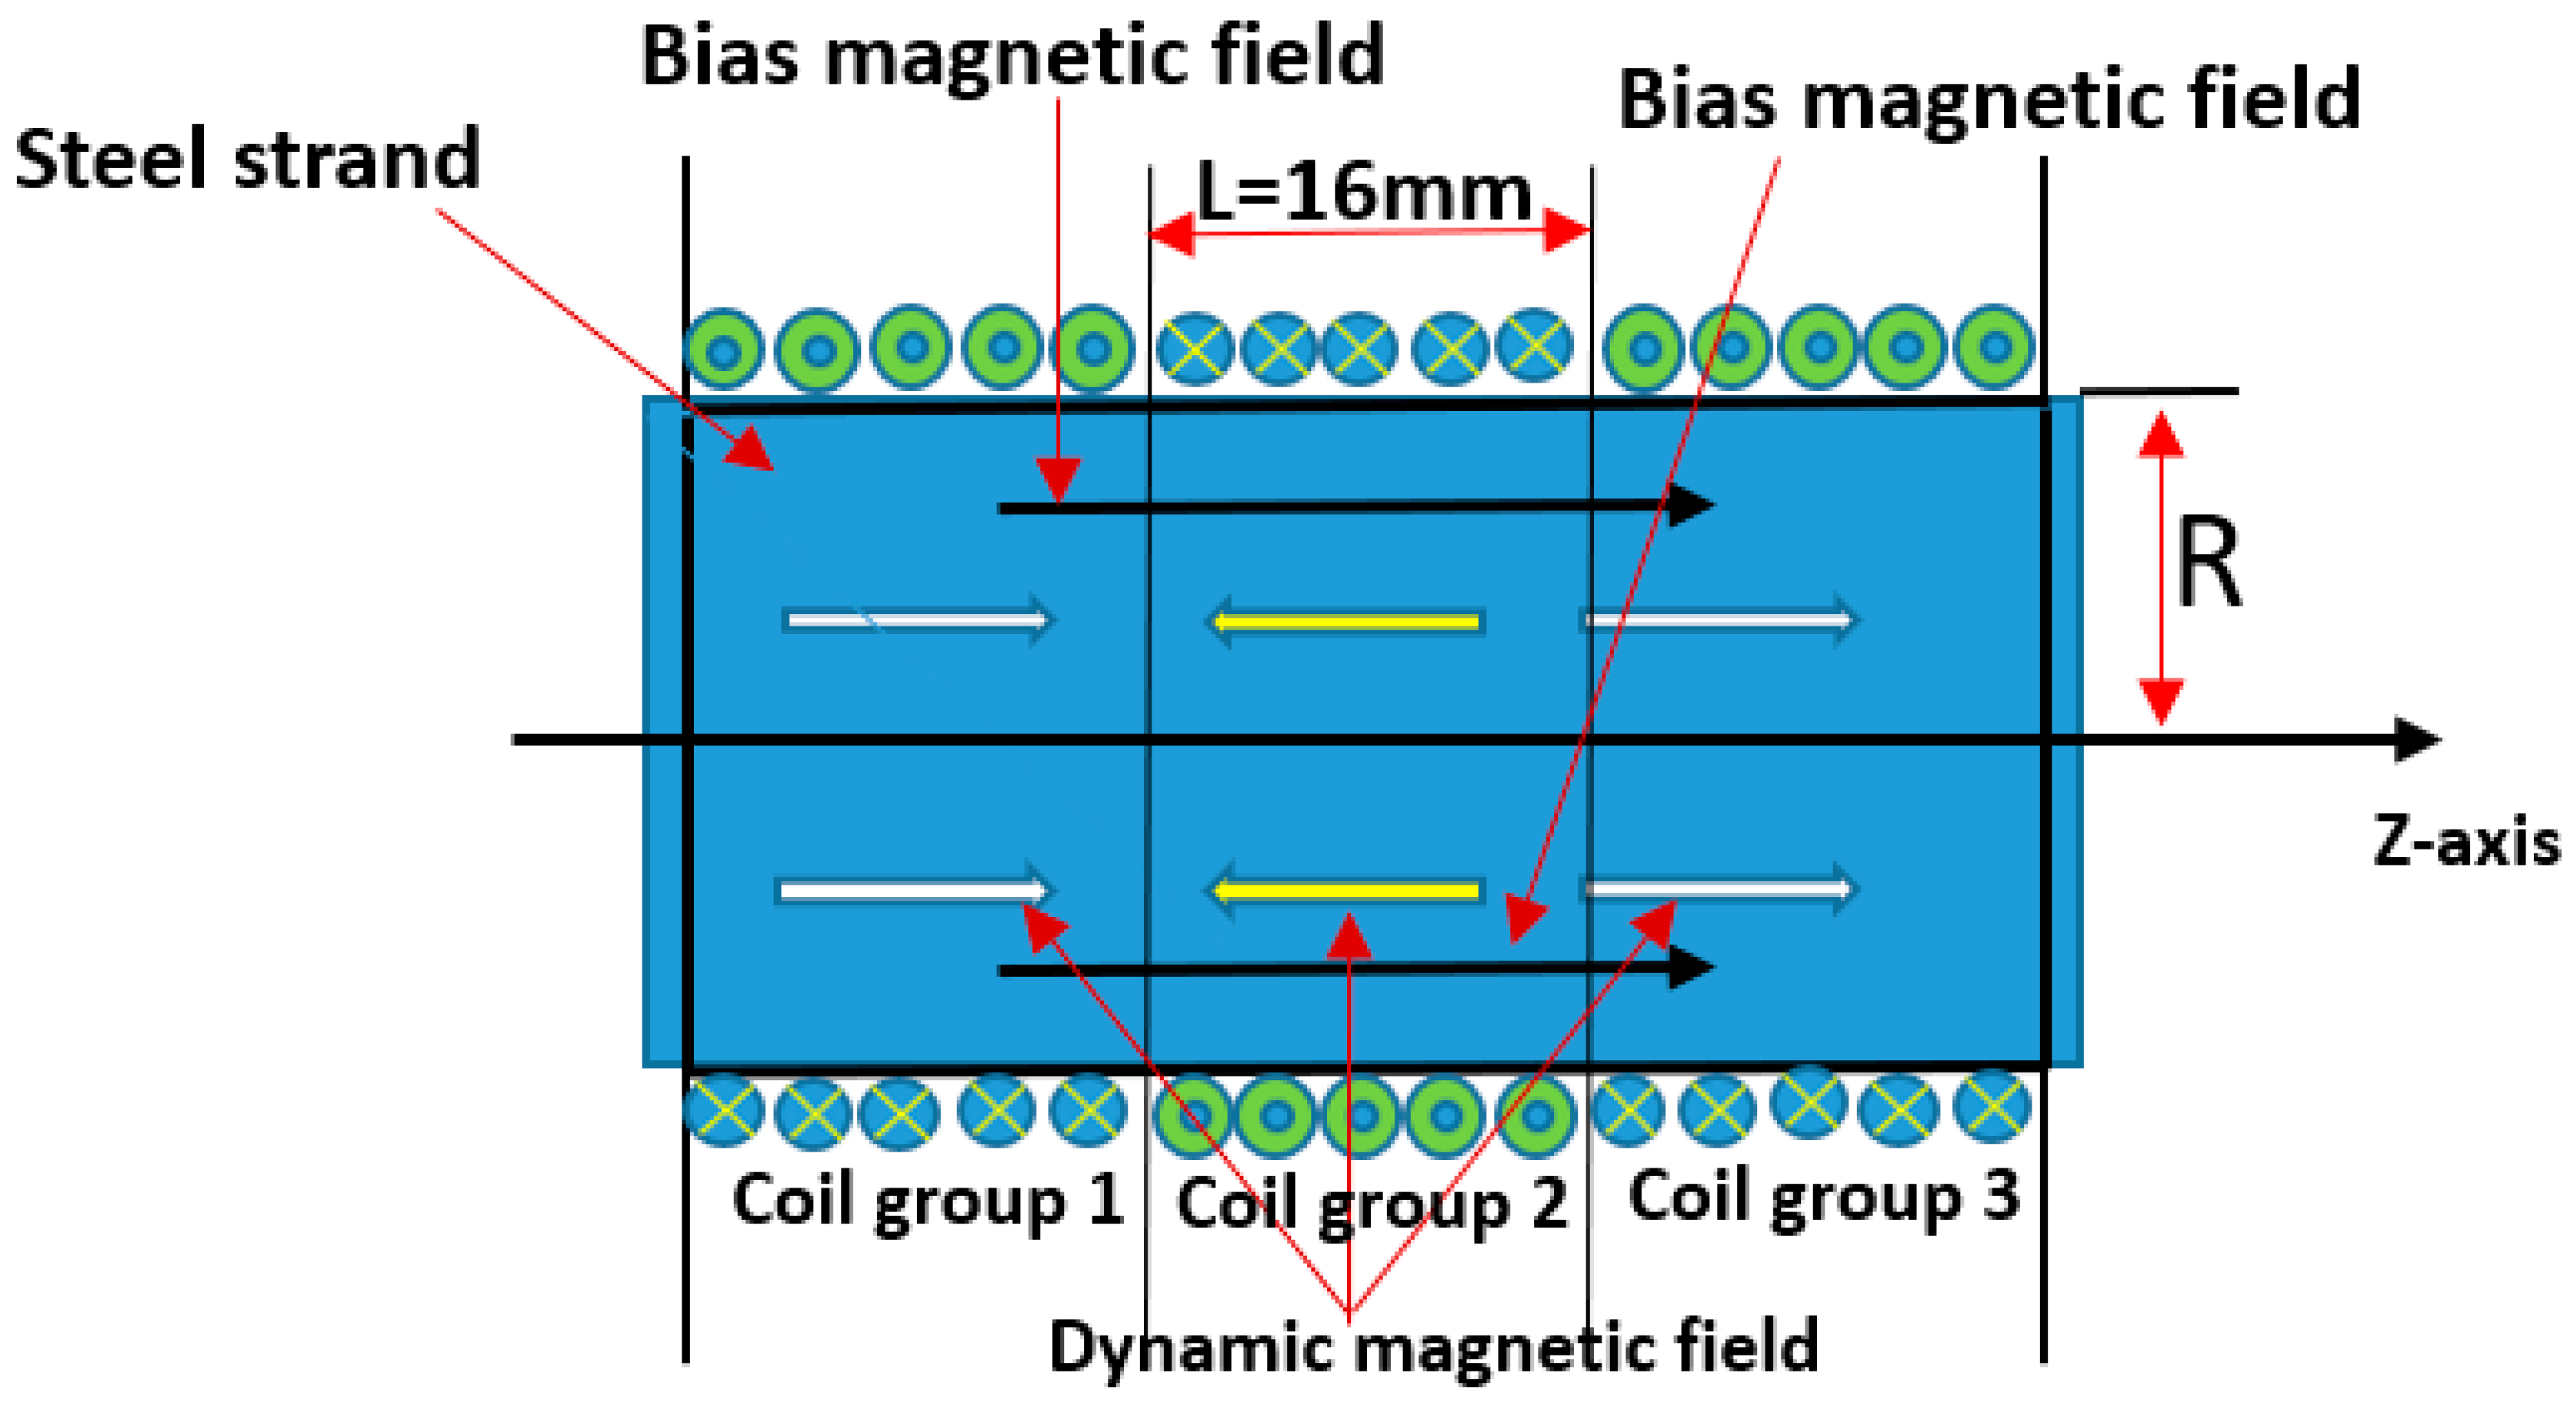
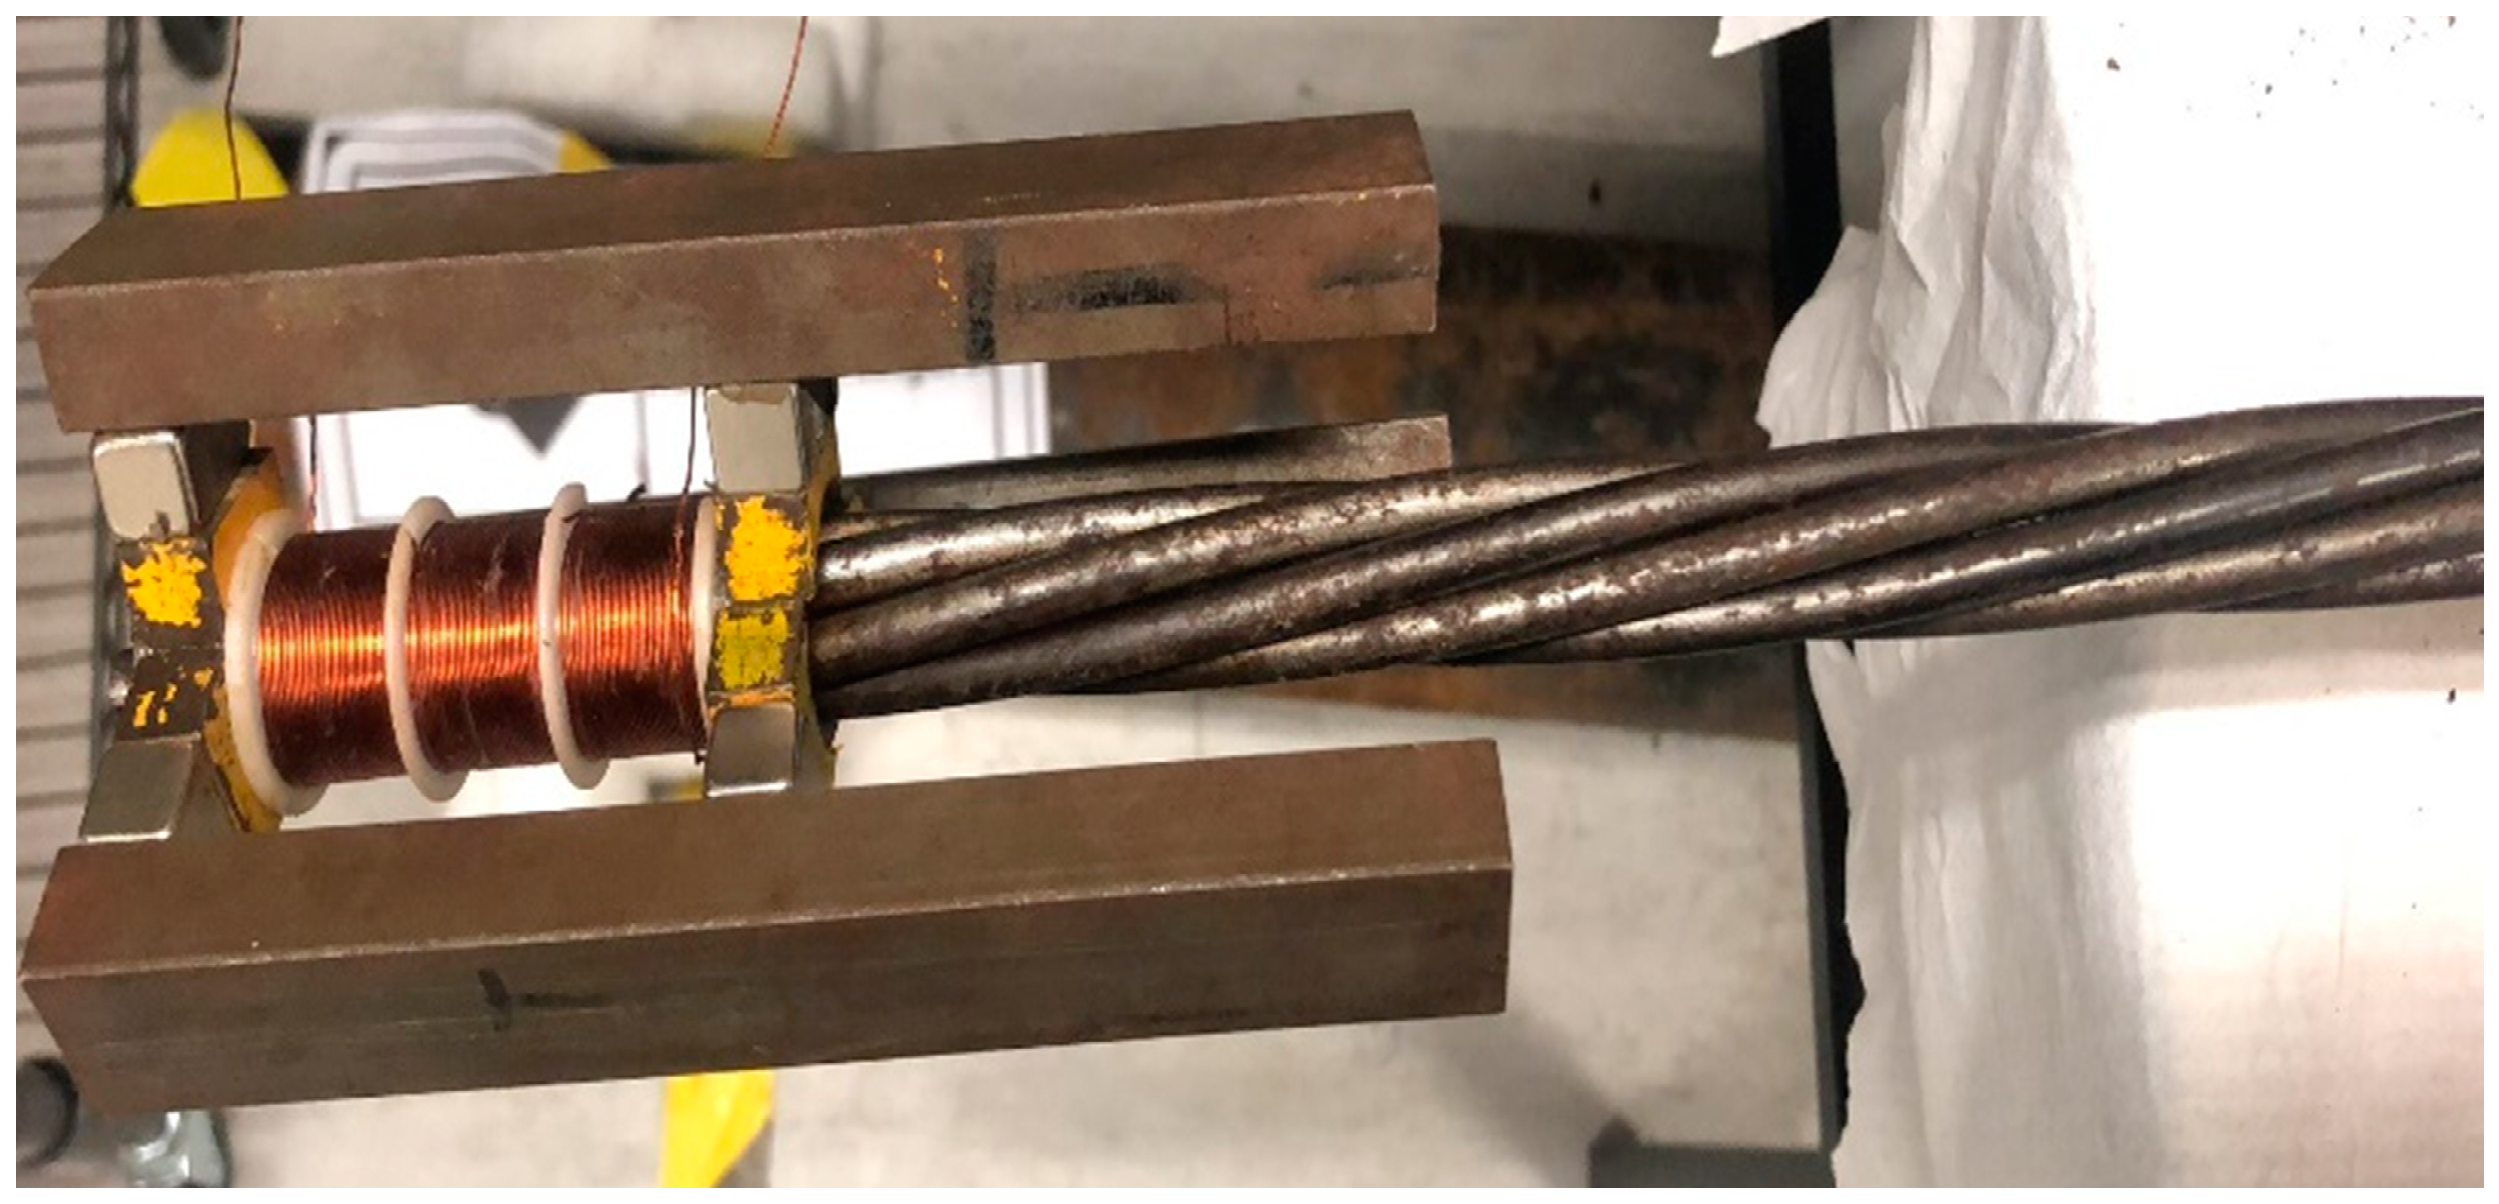
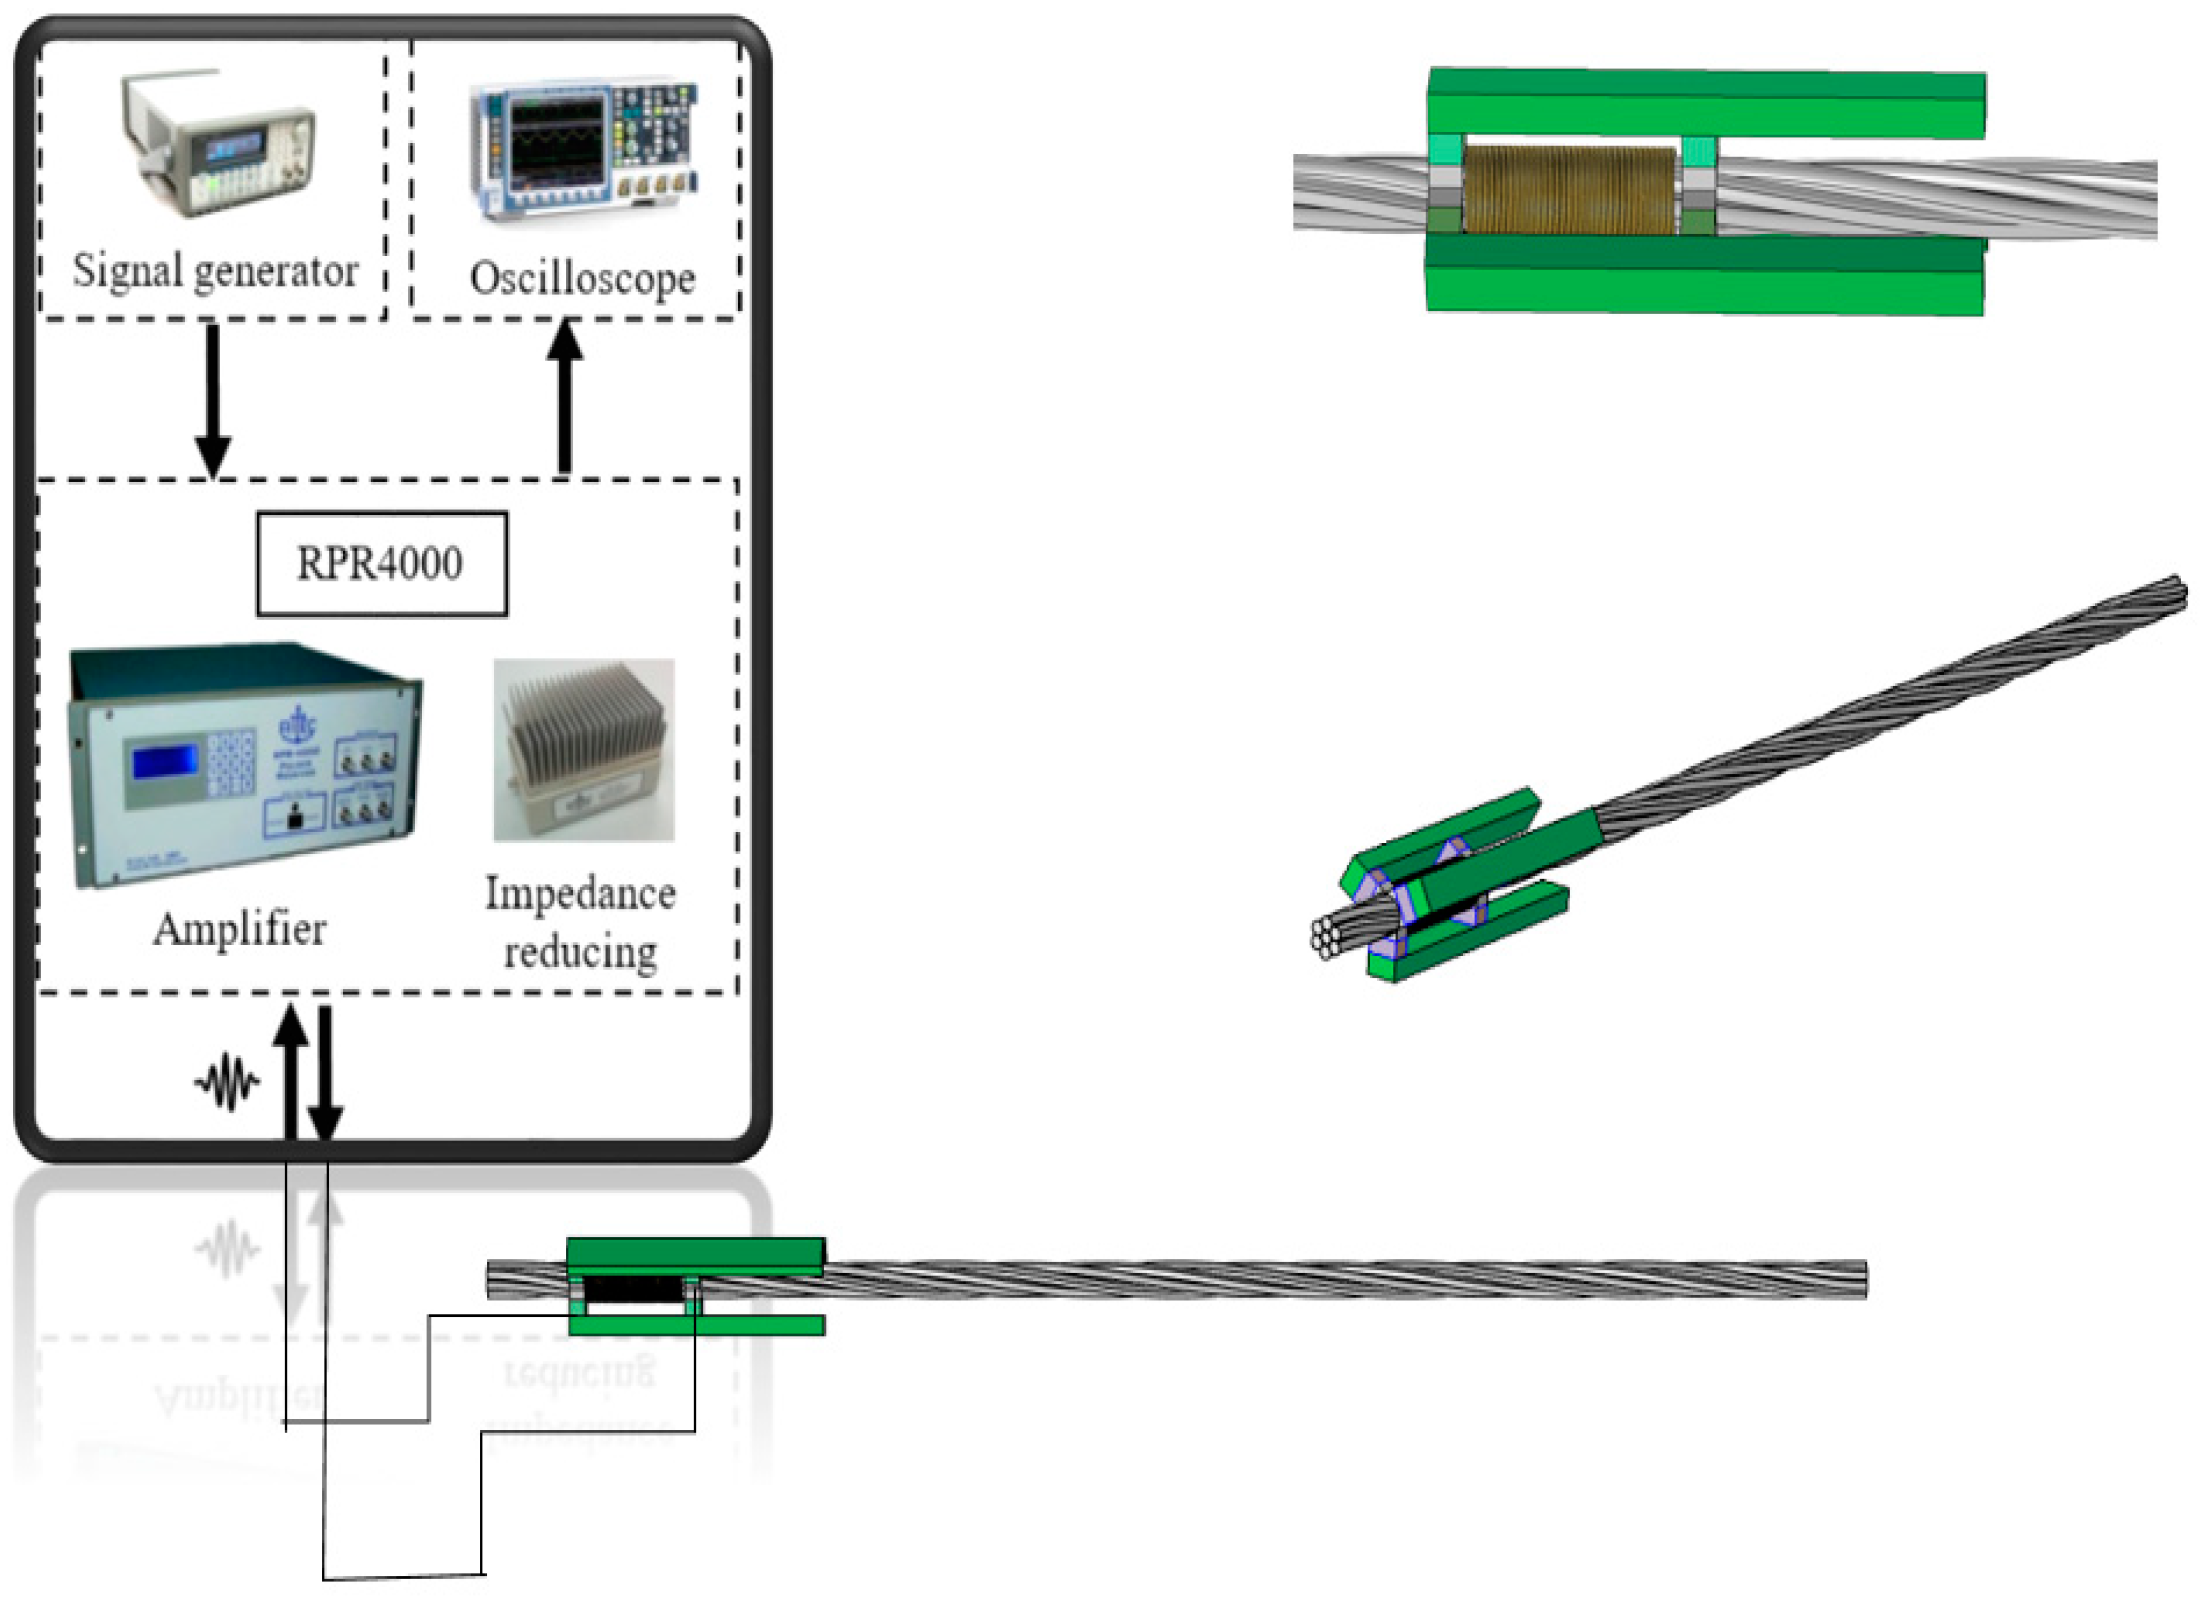
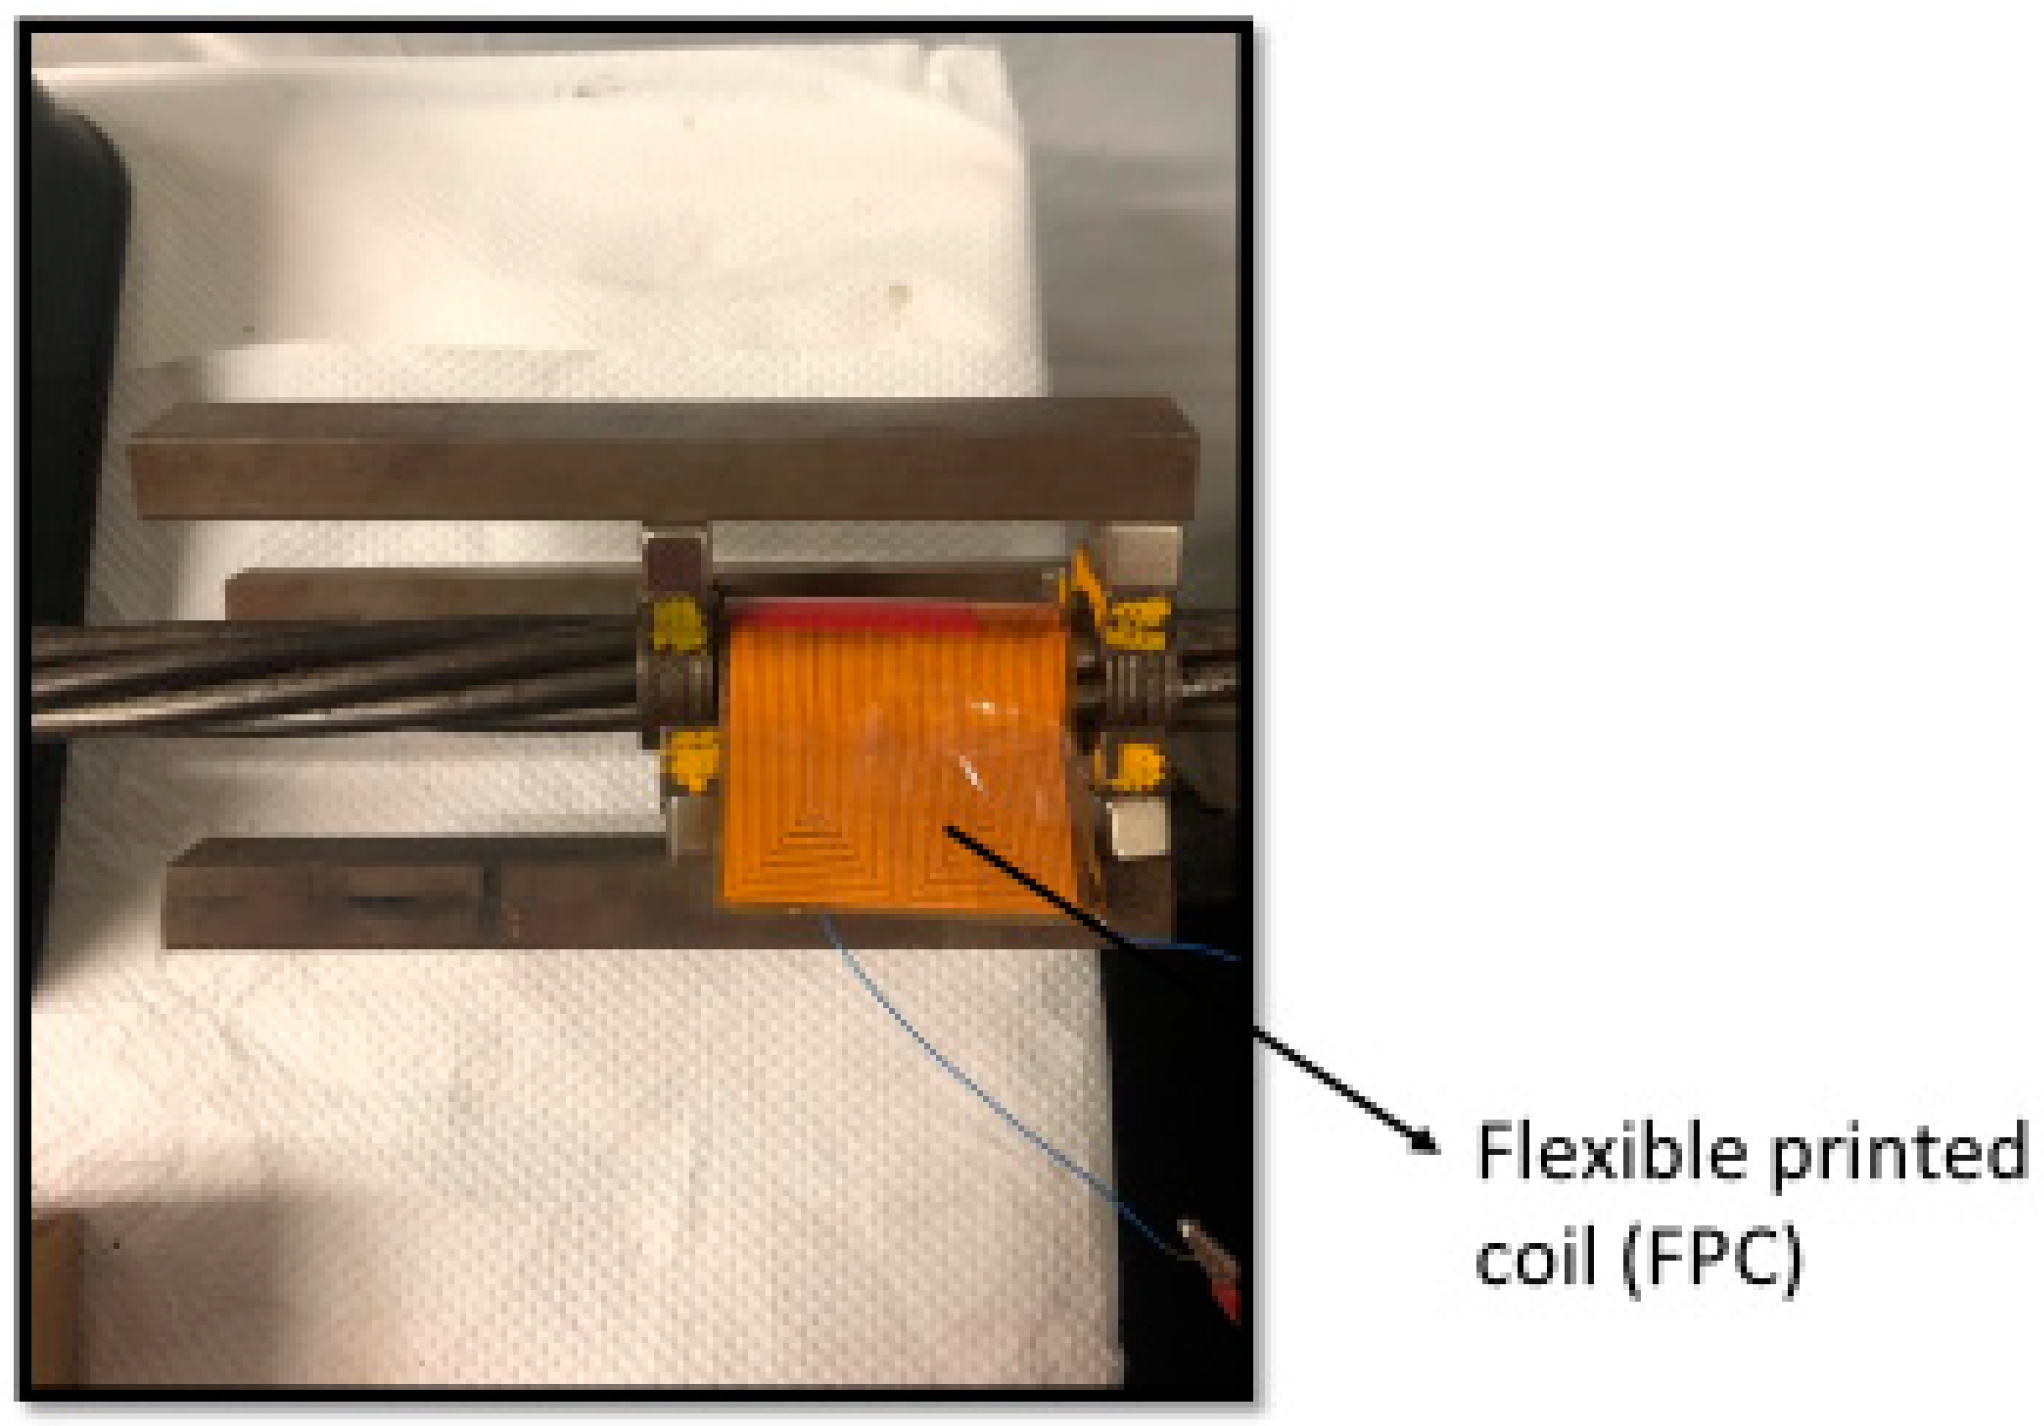
3.3.1. Magnetostrictive Sensor (MsS)
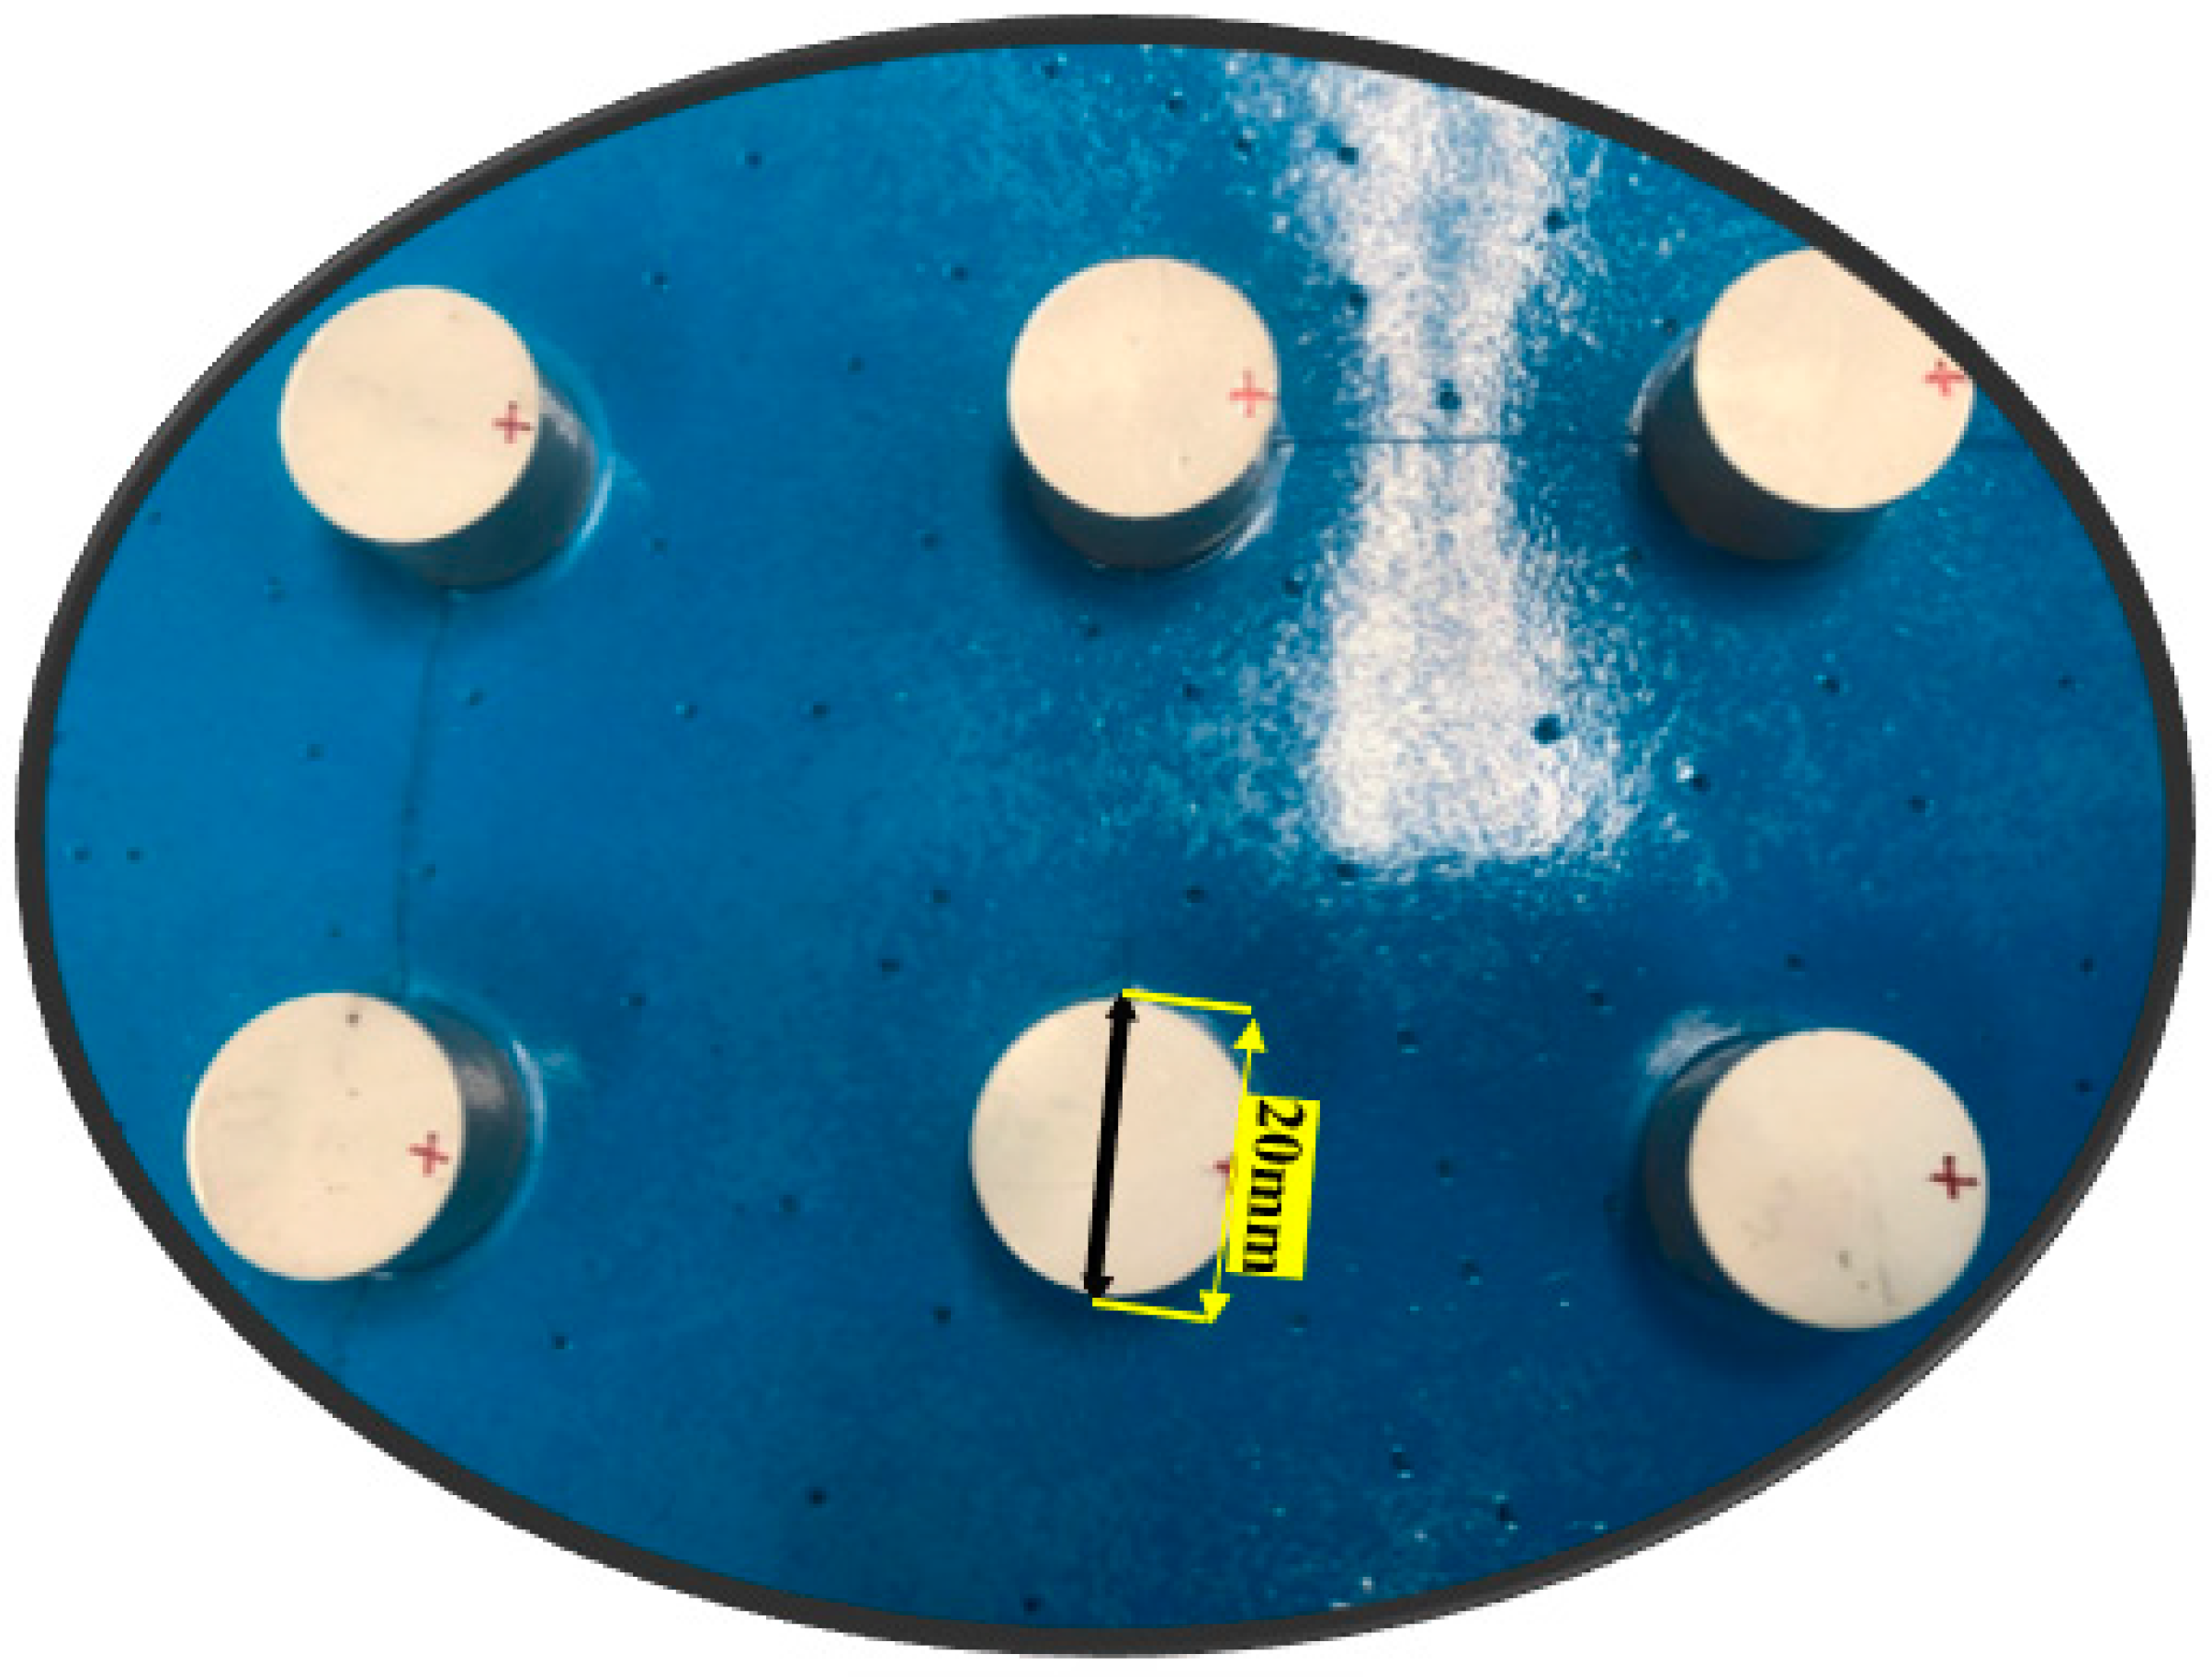
3.3.2. Piezoelectric Transducer (PZT)
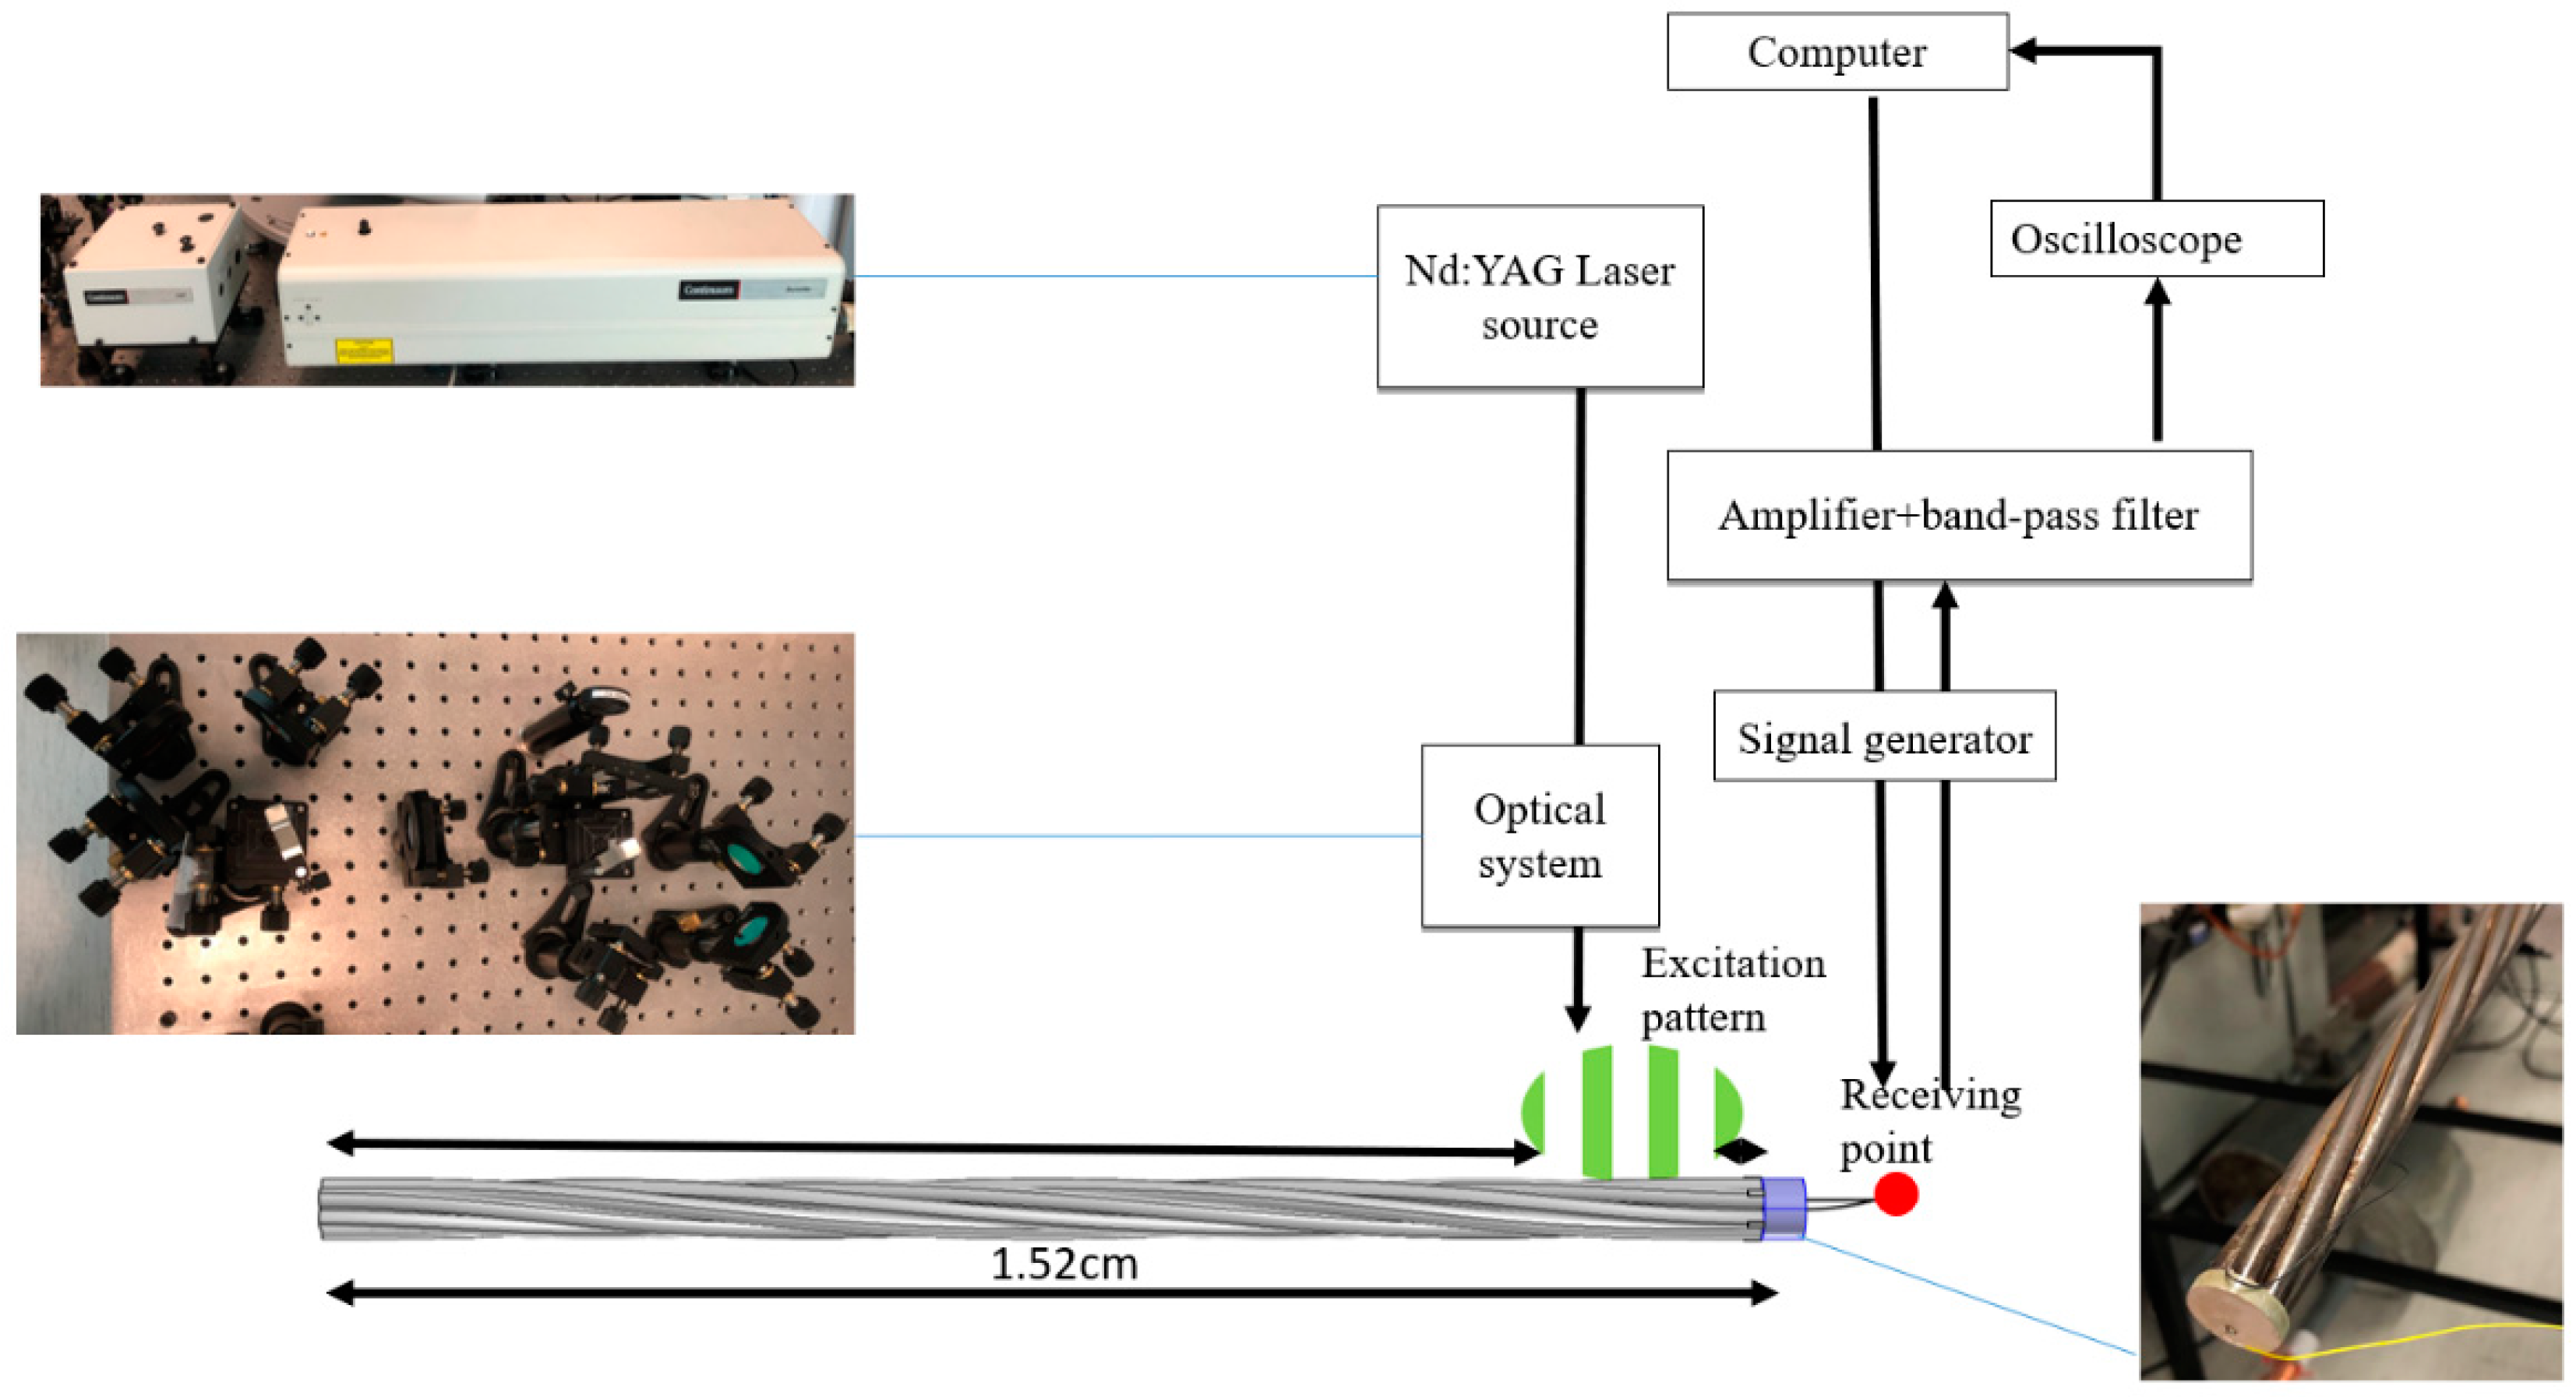
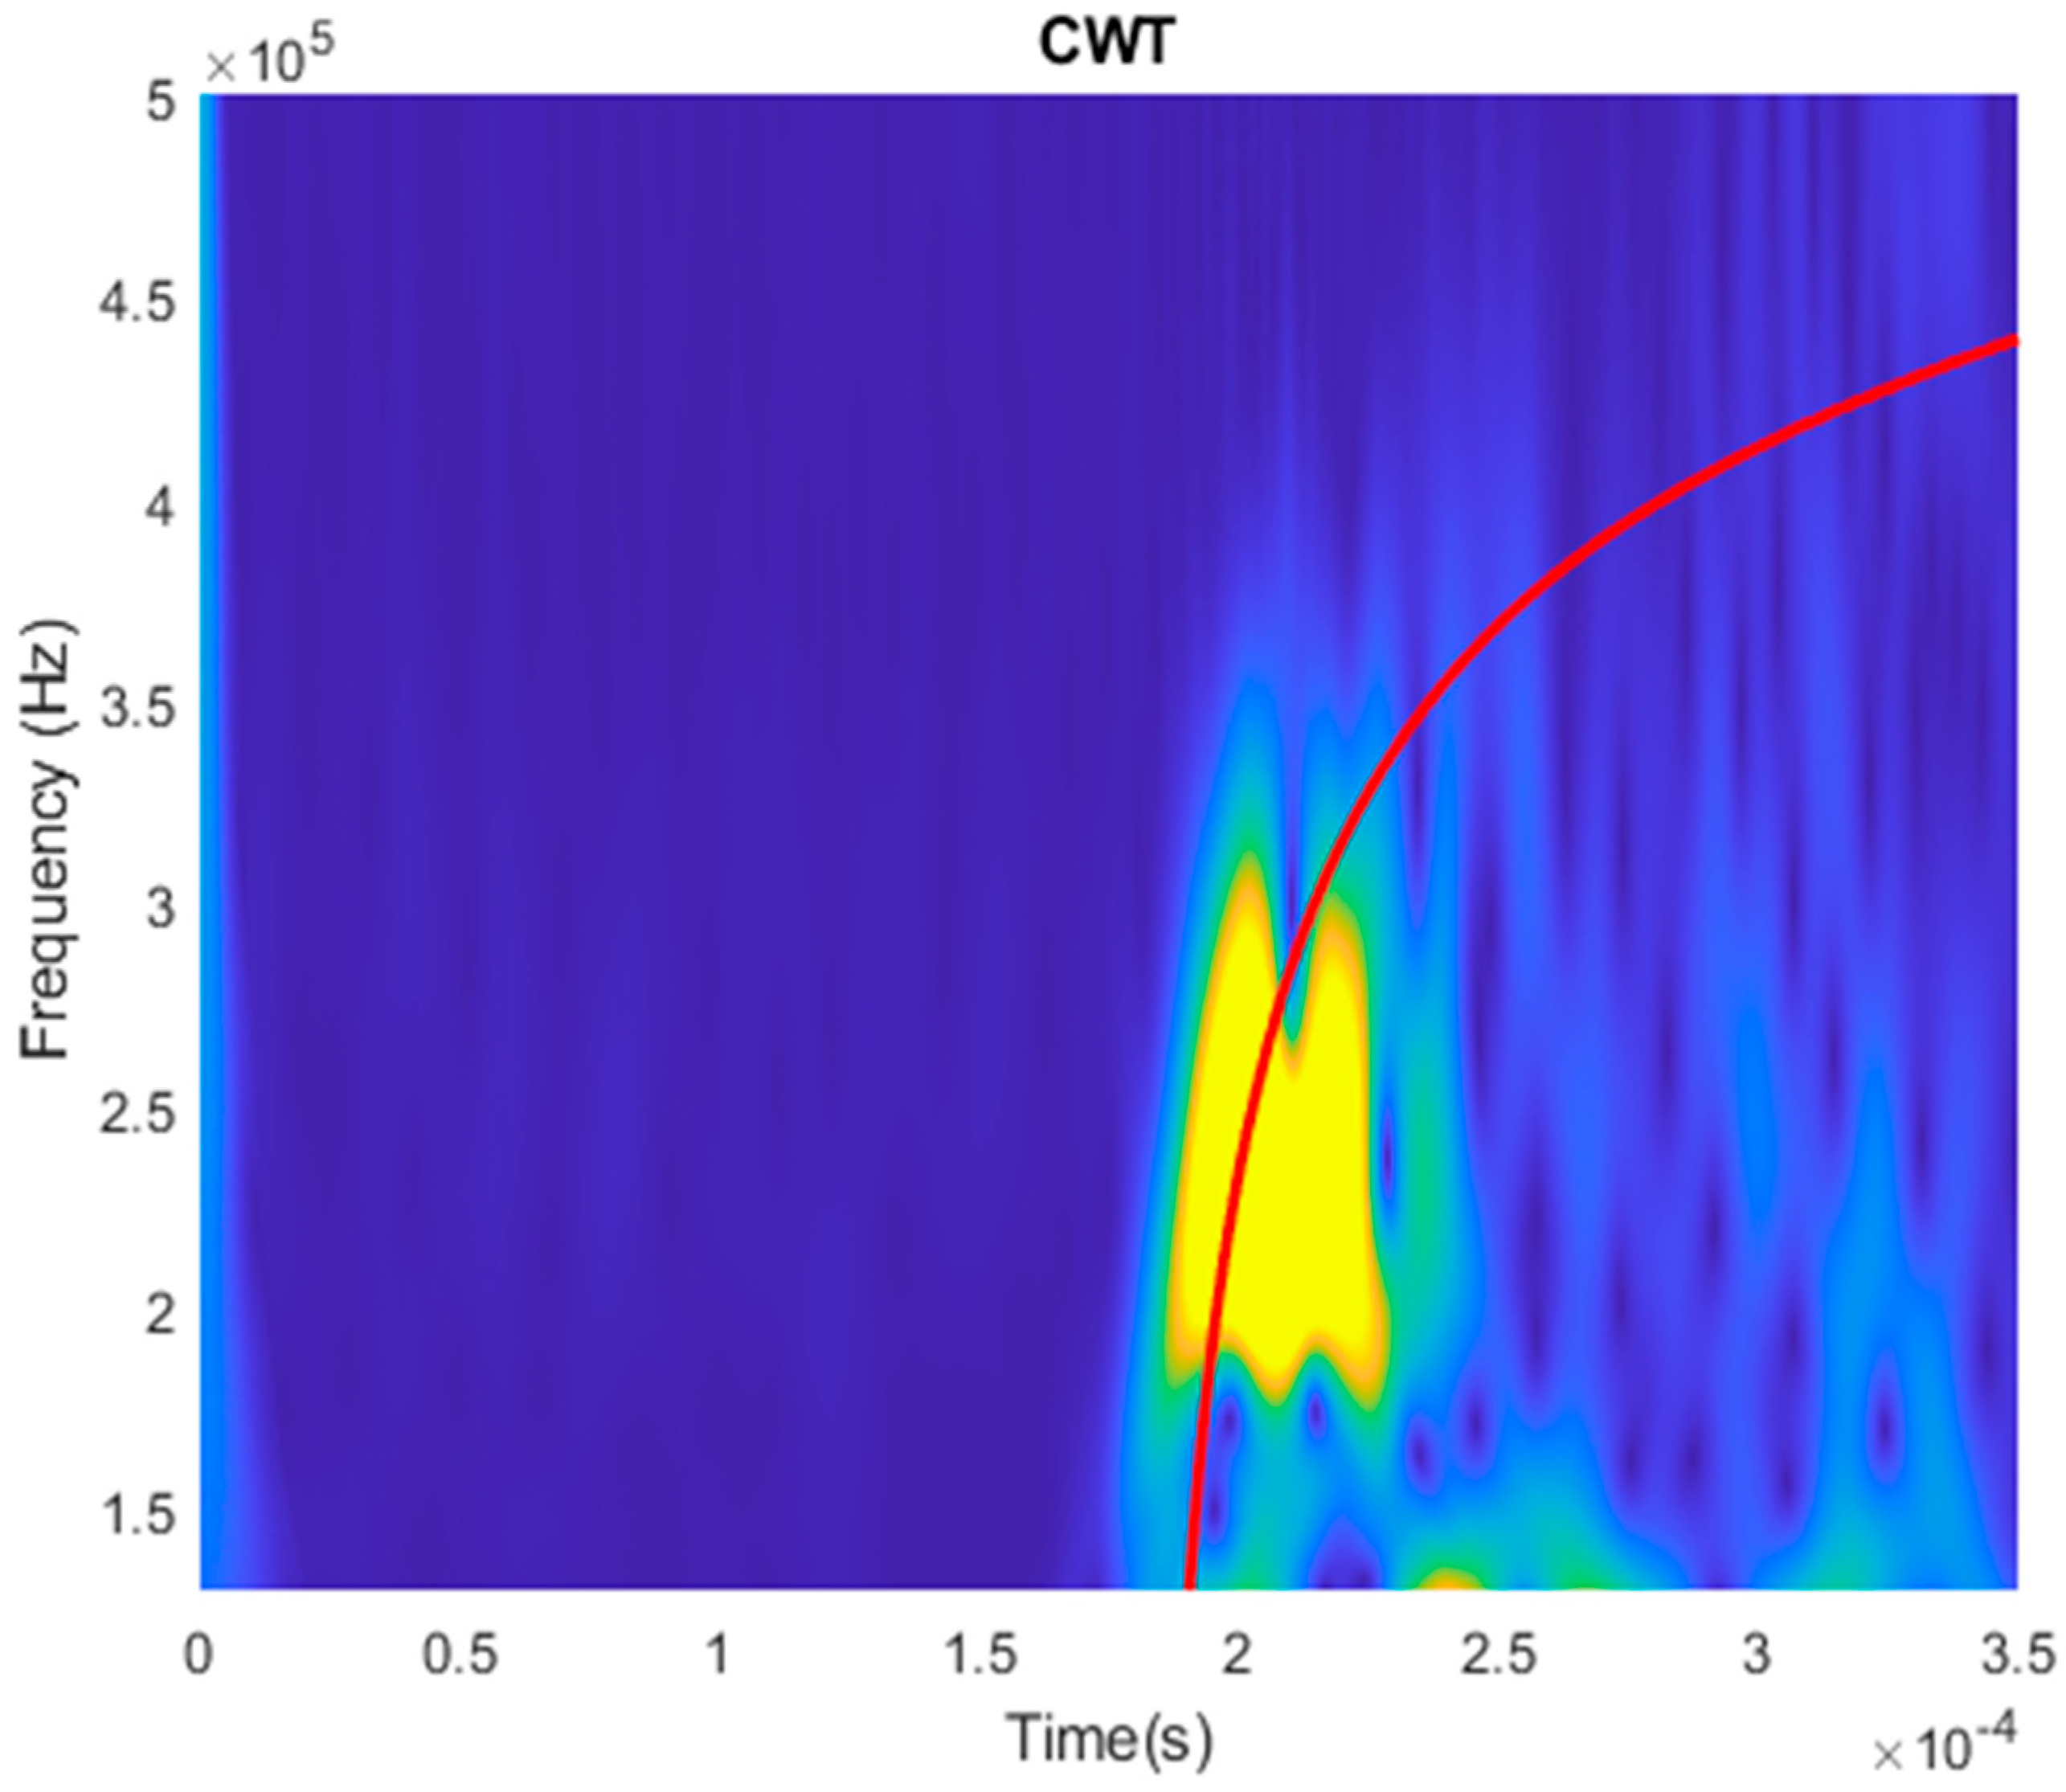
3.3.3. Laser-Generated Guided Waves
3.3.4. Comparison and Analysis of Results
4. Results and Discussion
5. Conclusions
Author Contributions
Funding
Acknowledgments
Conflicts of Interest
References
- McCann, M.; Zaleski, N. Deaths and Injuries Involving Elevators and Escalators. Available online: http://www.cpwr.com/sites/default/files/publications/elevatorconstructors2006 (accessed on 30 May 2017).
- South China Morning Post. Seven Injured in Lift Accident in North Point Building. Available online: http://www.scmp.com/news/hong-kong/article/1171188/seven-injured-lift-accident-north-point-building (accessed on 30 May 2017).
- Qu, Y.; Zhang, H.; Zhao, R.; Liao, L.; Zhou, Y. Research on the method of predicting corrosion width of cables based on the spontaneous magnetic flux leakage. Materials 2019, 12, 2154. [Google Scholar] [CrossRef] [PubMed] [Green Version]
- Li, X.; Gao, C.; Guo, Y.; He, F.; Shao, Y. Cable surface damage detection in cable-stayed bridges using optical techniques and image mosaicking. Opt. Laser Technol. 2019, 110, 36–43. [Google Scholar] [CrossRef]
- Ebrahimkhanlou, A.; Salamone, S. Acoustic emission source localization in thin metallic plates: A single-sensor approach based on multimodal edge reflections. Ultrasonics 2017, 78, 134–145. [Google Scholar] [CrossRef] [PubMed] [Green Version]
- Pan, Y.D.; Jin, J.; Yang, F.; Chen, W.Z. Damage detection using high order longitudinal guided waves (HOLGW) in the anchorage zone of stayed cable. AIP Conf. Proc. 2017, 1806. [Google Scholar]
- Rostami, J.; Tse, P.W.; Yuan, M. Detection of broken wires in elevator wire ropes with ultrasonic guided waves and tone-burst wavelet. Struct. Health Monit. 2020, 19, 481–494. [Google Scholar] [CrossRef]
- Schaal, C.; Bischoff, S.; Gaul, L. Damage detection in multi-wire cables using guided ultrasonic waves. Struct. Health Monit. 2016, 15, 279–288. [Google Scholar] [CrossRef]
- Onipede, O.; Dong, S.B. Propagating waves and end modes in pre-twisted beams. J. Sound. Vib. 1996, 195, 313–330. [Google Scholar] [CrossRef]
- Kwun, H.; Bartels, K.A.; Hanley, J.J. Effects of tensile loading on the properties of elastic-wave propagation in a strand. J. Acoust. Soc. Am. 1998, 103, 3370–3375. [Google Scholar] [CrossRef]
- Chaki, S.; Bourse, G. Non-destructive evaluation of the stress levels in prestressed steel strands using acoustoelastic effect. In Proceedings of the Non-Destructive Testing in Civil Engineering (NDTCE’09), Nantes, France, 30 June–3 July 2009; pp. 85–92. [Google Scholar]
- Raisutis, R.; Kazys, R.; Mazeika, L.; Samaitis, V.; Zukauskas, E. Propagation of ultrasonic guided waves in composite multi-wire ropes. Materials 2016, 9, 451. [Google Scholar] [CrossRef] [Green Version]
- Rizzo, P. Ultrasonic wave propagation in progressively loaded multi-wire strands. Exp. Mech. 2006, 46, 297–306. [Google Scholar] [CrossRef]
- Bartoli, I.; Phillips, R.; di Scalea, F.L.; Salamone, S.; Coccia, S.; Sikorsky, C.S. Load monitoring in multiwire strands by interwire ultrasonic measurements. In Proceedings of the Sensors Smart Structures Technologies for Civil, Mechanical, and Aerospace Systems 2008, San Diego, CA, USA, 10–13 March 2008; Volume 6932, p. 693209. [Google Scholar]
- Xu, J.; Wu, X.; Sun, P. Detecting broken-wire flaws at multiple locations in the same wire of prestressing strands using guided waves. Ultrasonics 2013, 53, 150–156. [Google Scholar] [CrossRef] [PubMed]
- Trane, G.; Mijarez, R.; Guevara, R.; Baltazar, A. PZT guided waves sensor permanently attached on multi-wire AWG12 cables used as communication medium. AIP Conf. Proc. 2015, 1650, 631–639. [Google Scholar]
- Shokry, M.A.; Khamlichi, A.; Garnacho, F.; Malo, J.M.; Alvarez, F. Detection and localization of defects in cable sheath of cross-bonding configuration by sheath currents. IEEE Trans. Power Deliv. 2019, 34, 1401–1411. [Google Scholar]
- Junping, C.; Hang, J.; Shaohua, W.; Yong, Y.; Luyao, Z.; Peng, J.S. Research of non-destructive testing for aluminum sheaths of HV cables using ultrasonic-guided waves. J. Eng. 2019, 2019, 2078–2083. [Google Scholar]
- Wan, X.; Liu, M.; Zhang, X.; Fan, H.; Tse, P.W.; Dong, M.; Wang, X.; Wei, H.; Xu, C.; Ma, H. The use of ultrasonic guided waves for the inspection of square tube structures: Dispersion analysis and numerical and experimental studies. Struct. Health Monit. 2020. [Google Scholar] [CrossRef]
- Wang, X.Y.; Meng, X.B.; Wang, J.X.; Sun, Y.H.; Gao, K. Mathematical modeling and geometric analysis for wire rope strands. Appl. Math. Model. 2015, 39, 1019–1032. [Google Scholar] [CrossRef]
- Li, F.; Qu, Y.; Zhao, Y.; Lu, R. Numerical simulation method for fracture effect of corroded steel strand under tension. In Proceedings of the 4th International Conference on the Durability of Concrete Structures ICDCS 2014, West Lafayette, Indiana, 23–26 July 2014; pp. 109–115. [Google Scholar]
- Kastratović, G.; Vidanović, N.; Bakić, V.; Rašuo, B. On finite element analysis of sling wire rope subjected to axial loading. Ocean. Eng. 2014, 88, 480–487. [Google Scholar] [CrossRef]
- Nguyen, K.L.; Treyssède, F. Numerical investigation of leaky modes in helical structural waveguides embedded into a solid medium. Ultrasonics 2015, 57, 125–134. [Google Scholar] [CrossRef] [Green Version]
- Zhang, J.; Zhang, Y.; Guan, Y. Analysis of Time-Domain Reflectometry Combined with Wavelet Transform for Fault Detection in Aircraft Shielded Cables. IEEE Sens. J. 2016, 16, 4579–4586. [Google Scholar] [CrossRef]
- Hernandez-Salazar, C.D.; Baltazar, A.; Aranda-Sanchez, J.I. Damage detection in multi-wire cables using continuous wavelet transform analysis of ultrasonic guided waves. In Proceedings of the 2009 Electronics, Robotics and Automotive Mechanics Conference (CERMA), Cuernavaca, Mexico, 22–25 September 2009; pp. 250–255. [Google Scholar]
- Zhang, Y.; Li, D.; Zhou, Z. Time reversal method for guided waves with multimode and multipath on corrosion defect detection in wire. Appl. Sci. 2017, 7, 424. [Google Scholar] [CrossRef] [Green Version]
- Ho, H.N.; Kim, K.D.; Park, Y.S.; Lee, J.J. An efficient image-based damage detection for cable surface in cable-stayed bridges. NDT E Int. 2013, 58, 18–23. [Google Scholar] [CrossRef]
- Fang, Z. Novel Design of Magnetostrictive Patch Transducers Based on Demagnetizing Theory to Efficiently Emit and Receive Guided Waves for Detecting Defects Occurring in Cylindroid Structures. Ph.D. Thesis, City University of Hong Kong, Hong Kong, China, December 2019. [Google Scholar]
- Di Scalea, F.L.; Matt, H.; Bartoli, I. The response of rectangular piezoelectric sensors to Rayleigh and Lamb ultrasonic waves. J. Acoust. Soc. Am. 2007, 121, 175–187. [Google Scholar] [CrossRef]
- Xu, B.; Shen, Z.; Ni, X.; Lu, J. Numerical simulation of laser-generated ultrasound by the finite element method. J. Appl. Phys. 2004, 95, 2116–2122. [Google Scholar] [CrossRef]
- Ng, K.; Tse, P.W. Design of a remote and integrated Sagnac interferometer that can generate narrowband guided wave through the use of laser and effective optics to detect defects occurred in plates. Opt. Laser Technol. 2020, 123, 105923. [Google Scholar] [CrossRef]
- Treyssède, F. Numerical investigation of elastic modes of propagation in helical waveguides. J. Acoust. Soc. Am. 2007, 121, 3398. [Google Scholar] [CrossRef] [Green Version]
- Treyssède, F. Elastic waves in helical waveguides. Wave Motion 2008, 45, 457–470. [Google Scholar] [CrossRef] [Green Version]
- Peter, W.T.; Liu, X.C.; Liu, Z.H.; Wu, B.; He, C.F.; Wang, X.J. An innovative design for using flexible printed coils for magnetostrictive-based longitudinal guided wave sensors in steel strand inspection. Smart Mater. Struct. 2011, 20, 55001. [Google Scholar]
- Liu, Z.; Zhao, J.; Wu, B.; Zhang, Y.; He, C. Configuration optimization of magnetostrictive transducers for longitudinal guided wave inspection in seven-wire steel strands. NDT E Int. 2010, 43, 484–492. [Google Scholar] [CrossRef]
- Peter, W.T.; Fang, Z.; Ng, K. Novel design of a smart and harmonized flexible printed coil sensor to enhance the ability to detect defects in pipes. NDT E Int. 2019, 103, 48–61. [Google Scholar]
- Chen, J.; Rostami, J.; Tse, P.W.; Wan, X. The design of a novel mother wavelet that is tailor-made for continuous wavelet transform in extracting defect-related features from reflected guided wave signals. Meas. J. Int. Meas. Confed. 2017, 110, 176–191. [Google Scholar] [CrossRef]
- Ng, K.M.; Masurkar, F.; Peter, W.T.; Nitesh, P.Y. Design of a new optical system to generate narrowband guided waves with an application for evaluating the health status of rail material. Opt. Lett. 2019, 44, 5695–5698. [Google Scholar] [CrossRef] [PubMed]
- Tse, P.W.; Masurkar, F.; Ng, K.M. Feasibility of using a 3D laser-based transduction system for monitoring the integrity of I-beams using Rayleigh waves. AIP Conf. Proc. 2019, 2102, 060003. [Google Scholar]
- Ma, Y.; Yang, Z.; Zhang, J.; Liu, K.; Wu, Z.; Ma, S. Axial stress monitoring strategy in arbitrary cross-section based on acoustoelastic guided waves using PZT sensors. AIP Adv. 2019, 9, 125304. [Google Scholar] [CrossRef] [Green Version]
- Satyarnarayan, L.; Chandrasekaran, J.; Maxfield, B.; Balasubramaniam, K. Circumferential higher-order guided wave modes for the detection and sizing of cracks and pinholes in pipe support regions. NDT E Int. 2008, 41, 32–43. [Google Scholar] [CrossRef]
- Ratnam, D.; Balasubramaniam, K.; Maxfield, A.B.W. Generation and Detection of Higher-Order Mode Clusters of Guided Waves (HOMC-GW) Using Meander-Coil EMATs. IEEE Trans. Ultrason. Ferroelectr. Freq. Control 2012, 59, 727–737. [Google Scholar] [CrossRef] [PubMed]
- Dhayalan, R.; Murthy, V.S.N.; Krishnamurthy, C.; Balasubramaniam, K. Improving the signal amplitude of meandering coil EMATs by using ribbon soft magnetic flux concentrators (MFC). Ultrasonics 2011, 51, 675–682. [Google Scholar] [CrossRef]
- Ma, S.; Wu, Z.; Wang, Y.; Liu, K. The reflection of guided waves from simple dents in pipes. Ultrasonics 2015, 57, 190–197. [Google Scholar] [CrossRef]
- Verma, B.; Mishra, T.K.; Balasubramaniam, K.; Rajagopal, P. Interaction of low-frequency axisymmetric ultrasonic guided waves with bends in pipes of arbitrary bend angle and general bend radius. Ultrasonics 2014, 54, 801–808. [Google Scholar] [CrossRef]
- Kim, Y.Y.; Park, C.I.; Cho, S.H.; Han, A.S.W. Torsional wave experiments with a new magnetostrictive transducer configuration. J. Acoust. Soc. Am. 2005, 117, 3459–3468. [Google Scholar] [CrossRef]
- Park, C.I.; Kim, W.; Cho, S.H.; Kim, A.Y.Y. Surface-detached V-shaped yoke of obliquely bonded magnetostrictive strips for high transduction of ultrasonic torsional waves. Appl. Phys. Lett. 2005, 87, 224105. [Google Scholar] [CrossRef]
- Polytec. PSV-500-3D Scanning Vibrometer Full-field 3D Vibration Measurement Datasheet. Available online: https://www.polytec.com/fileadmin/d/Vibrometrie/OM_DS_PSV-500-3D_E_42447 (accessed on 26 August 2020).


| Nominal Diameter (mm) | Diameter Tolerance (mm) | Grade (MPa) | Nominal Weight (g/m) | Nominal Steel Area (mm2) | Minimum Breaking Strength (kN) | Yield Strength Minimum Load at 1% Extension (kN) |
|---|---|---|---|---|---|---|
| 15.24 | –0.15/+0.65 | 1860 | 1102 | 140.0 | 260.7 | 234.6 |
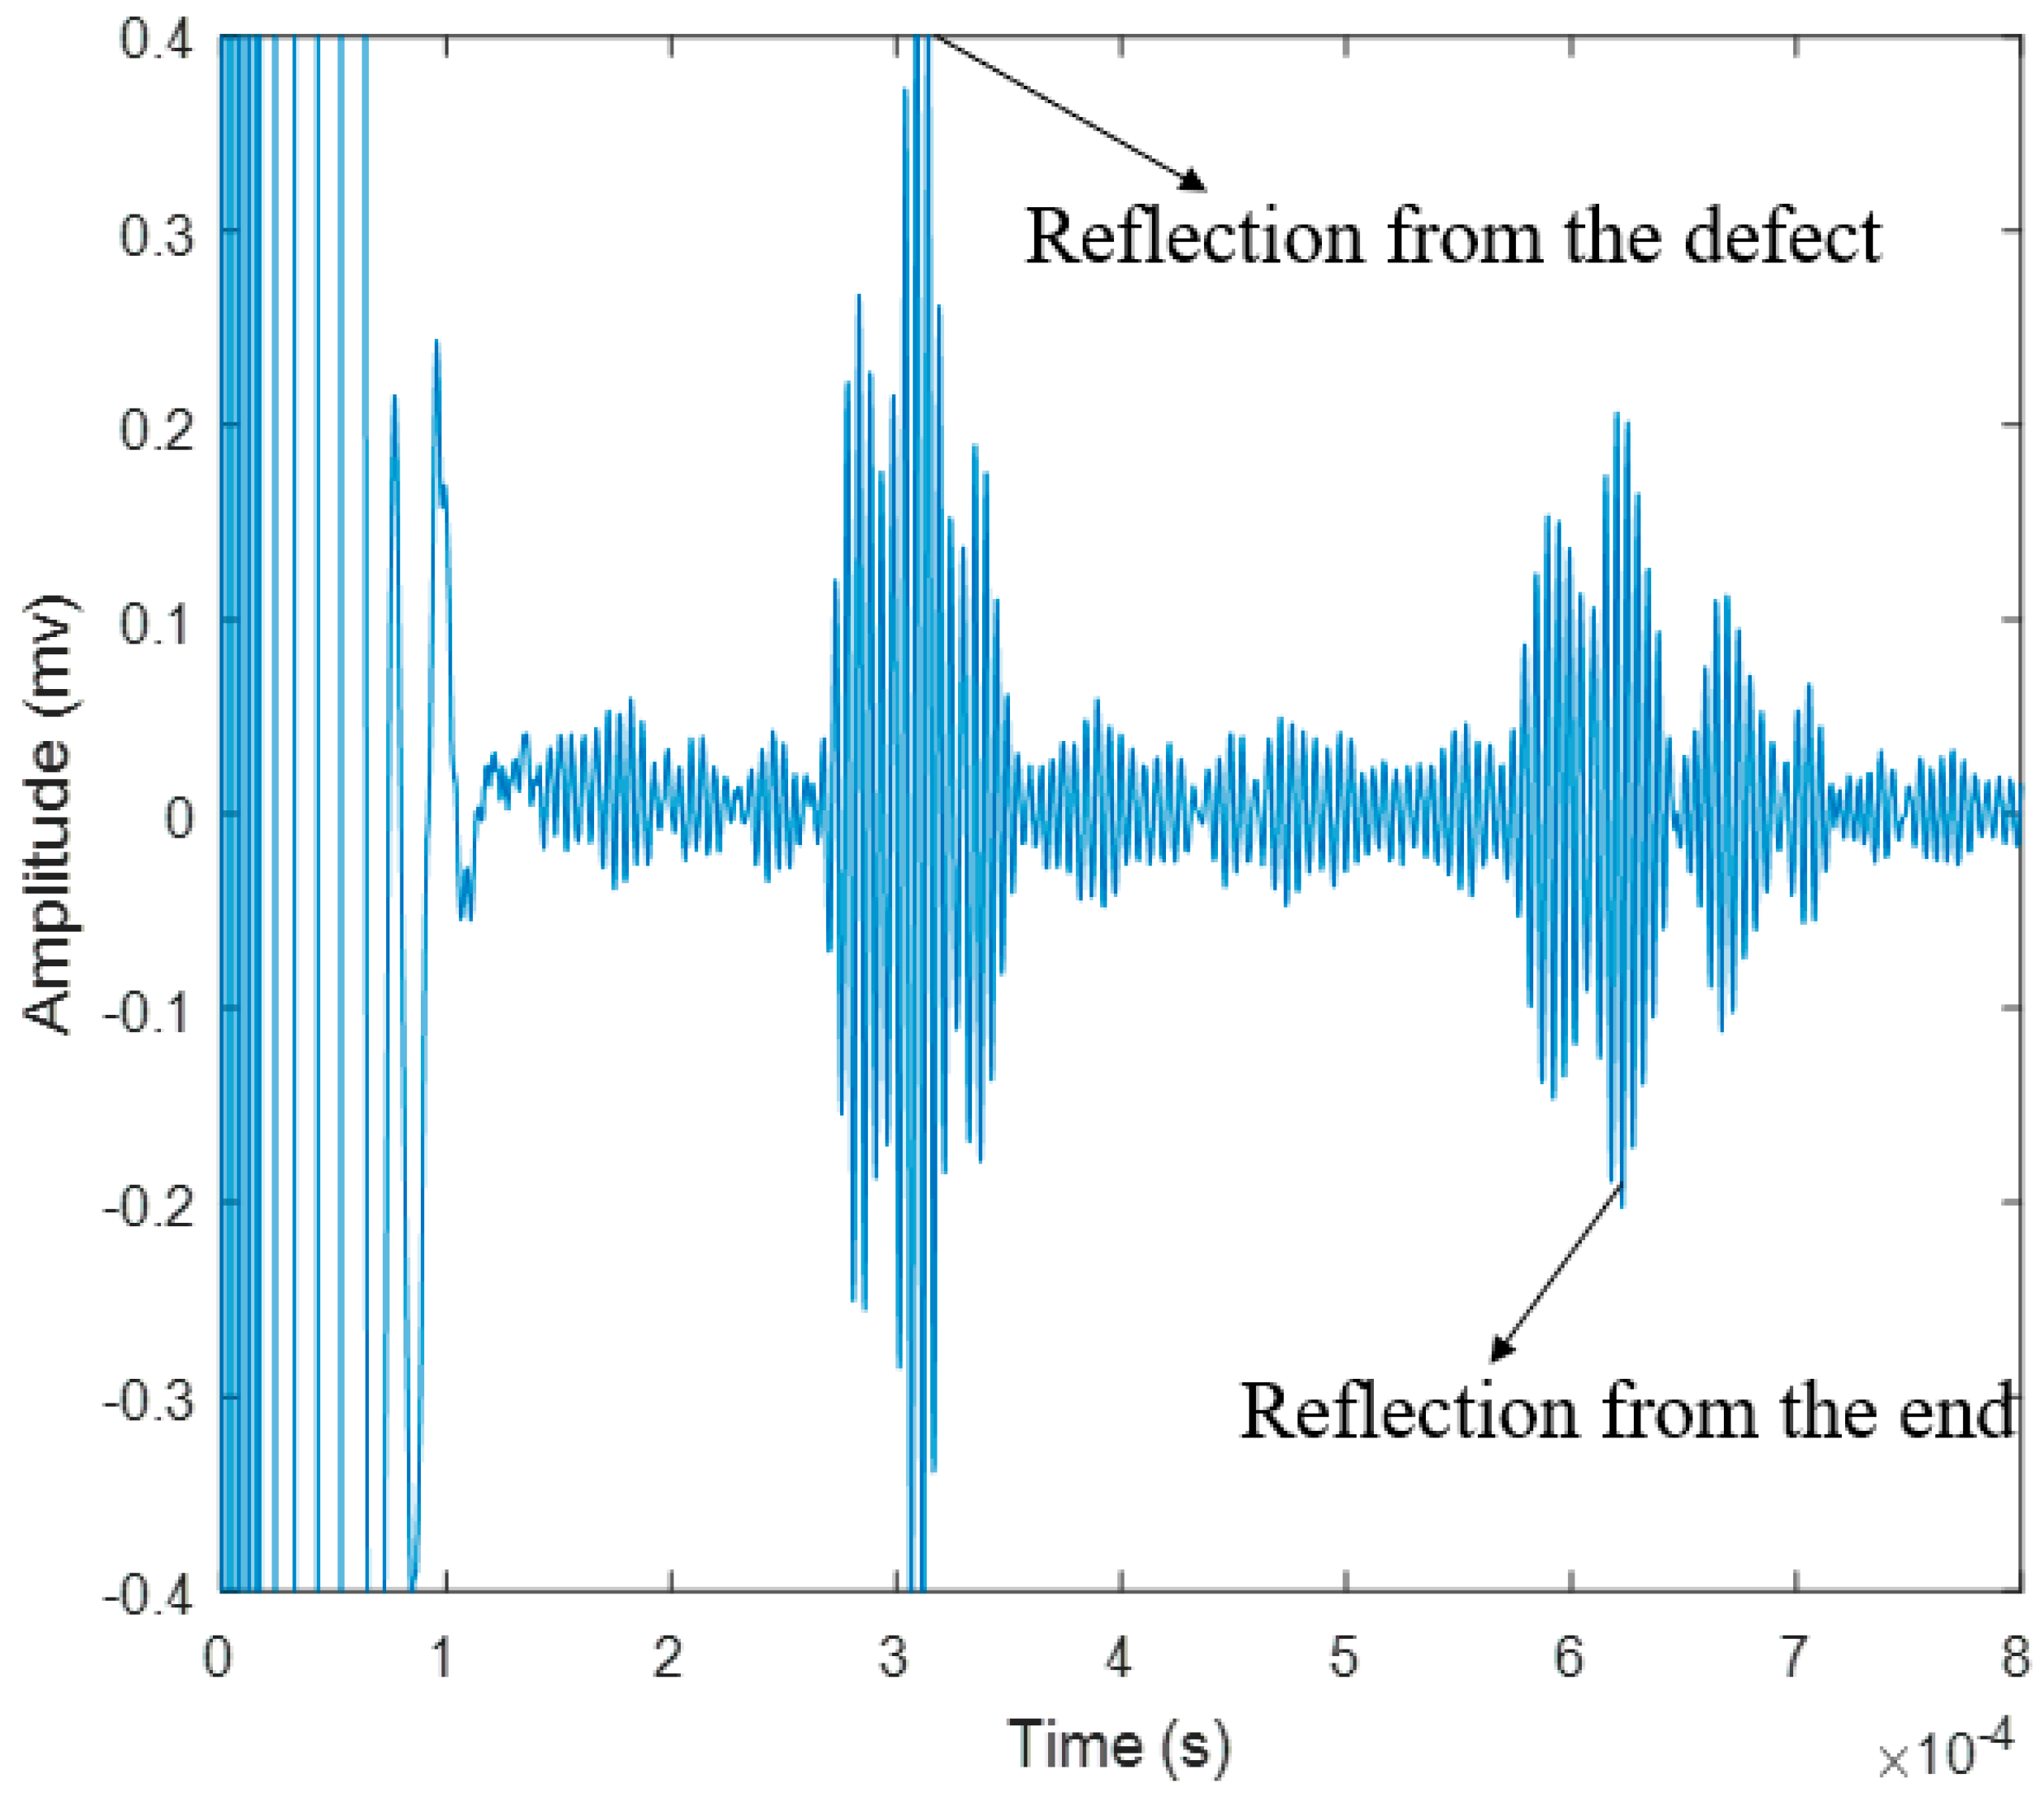
| NDT Methods | Time Arrival of Defect-Reflected Signal (Peak to Peak Amplitude) (s) | Estimated Defect Location (m) | Deviation from Actual Location (%) |
|---|---|---|---|
| Hard coil MsS | 0.7741 | 1.59 | |
| FPC-MsS | 0.7771 | 1.99 | |
| PZT | 0.7818 | 2.60 | |
| Laser-based GW | 0.7863 | 3.19 |
| NDT Method | FPC-MsS | PZT | Laser-Based GW System | |
|---|---|---|---|---|
| Evaluation Index | ||||
| Feasibility of NDT methods available | H | M | L | |
| Cost of equipment and Related maintenance or employee costs | L | M | H | |
| Testing instrument stability, detectable distance, and range | L | M | H | |
| Requirements regarding reliable and safe operation | M | L | H | |
| The accuracy of defect location | H | M | L | |
© 2020 by the authors. Licensee MDPI, Basel, Switzerland. This article is an open access article distributed under the terms and conditions of the Creative Commons Attribution (CC BY) license (http://creativecommons.org/licenses/by/4.0/).
Share and Cite
Hou, E.Z.Y.; Rostami, J.; Ng, K.M.; Tse, P.W. Experimental Investigation on Choosing a Proper Sensor System for Guided Waves to Check the Integrity of Seven-Wire Steel Strands. Sensors 2020, 20, 5025. https://0-doi-org.brum.beds.ac.uk/10.3390/s20185025
Hou EZY, Rostami J, Ng KM, Tse PW. Experimental Investigation on Choosing a Proper Sensor System for Guided Waves to Check the Integrity of Seven-Wire Steel Strands. Sensors. 2020; 20(18):5025. https://0-doi-org.brum.beds.ac.uk/10.3390/s20185025
Chicago/Turabian StyleHou, Edison Z.Y., Javad Rostami, Kim Ming Ng, and Peter W. Tse. 2020. "Experimental Investigation on Choosing a Proper Sensor System for Guided Waves to Check the Integrity of Seven-Wire Steel Strands" Sensors 20, no. 18: 5025. https://0-doi-org.brum.beds.ac.uk/10.3390/s20185025