
Investigation of the Incorporation of Cerium Ions in MCVD-Silica Glass Preforms for Remote Optical Fiber Radiation Dosimetry

 ,
,  , , , ,
Abstract
:1. Introduction
2. Materials and Methods
3. Results and Discussion
3.1. Ce-Doped Preforms
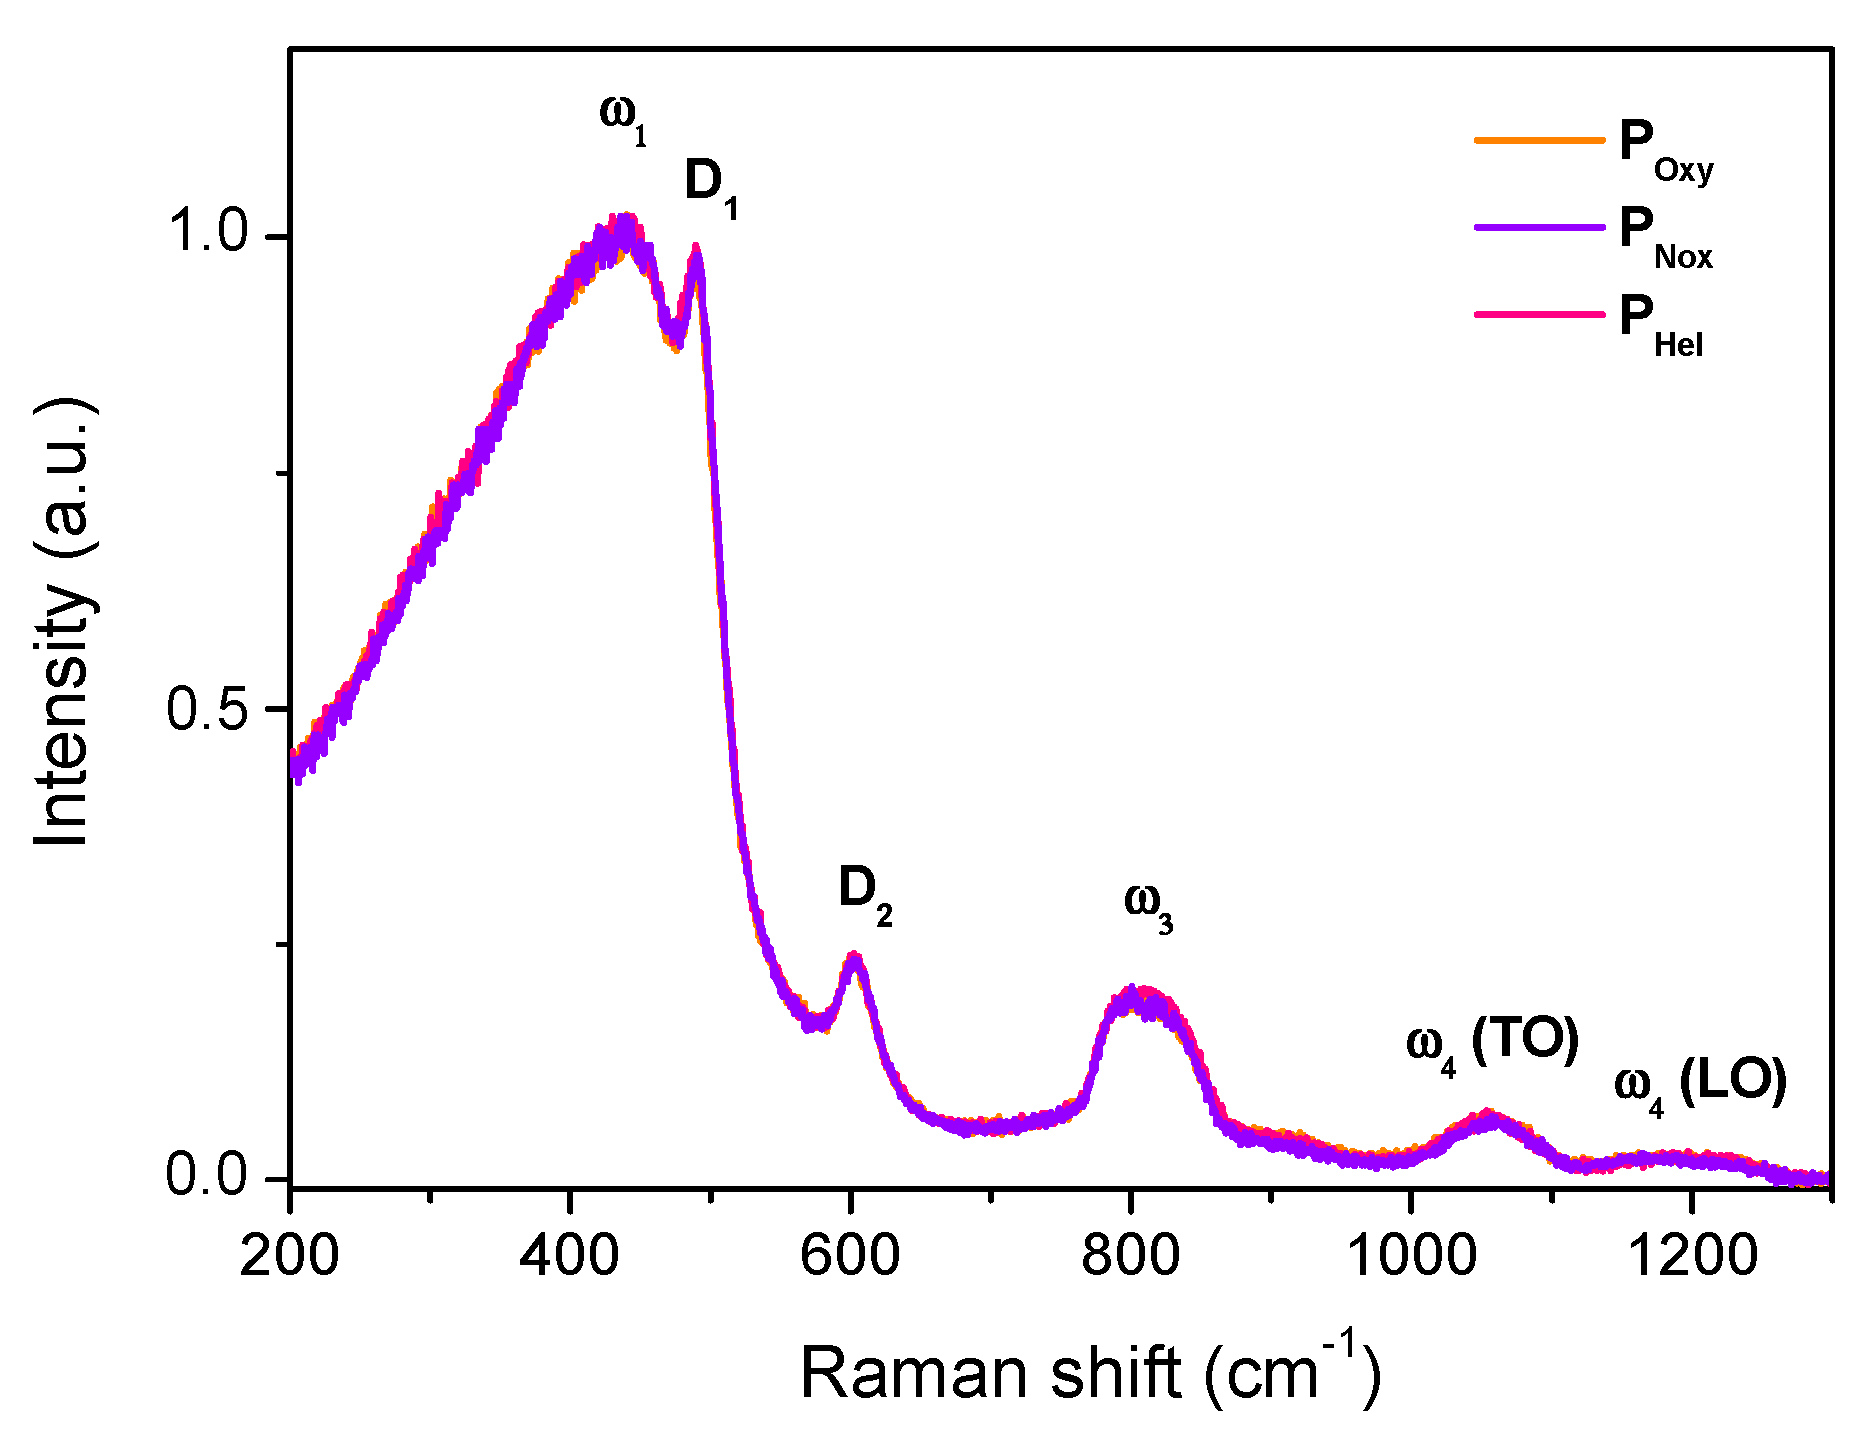
3.1.1. Composition and Structural Properties
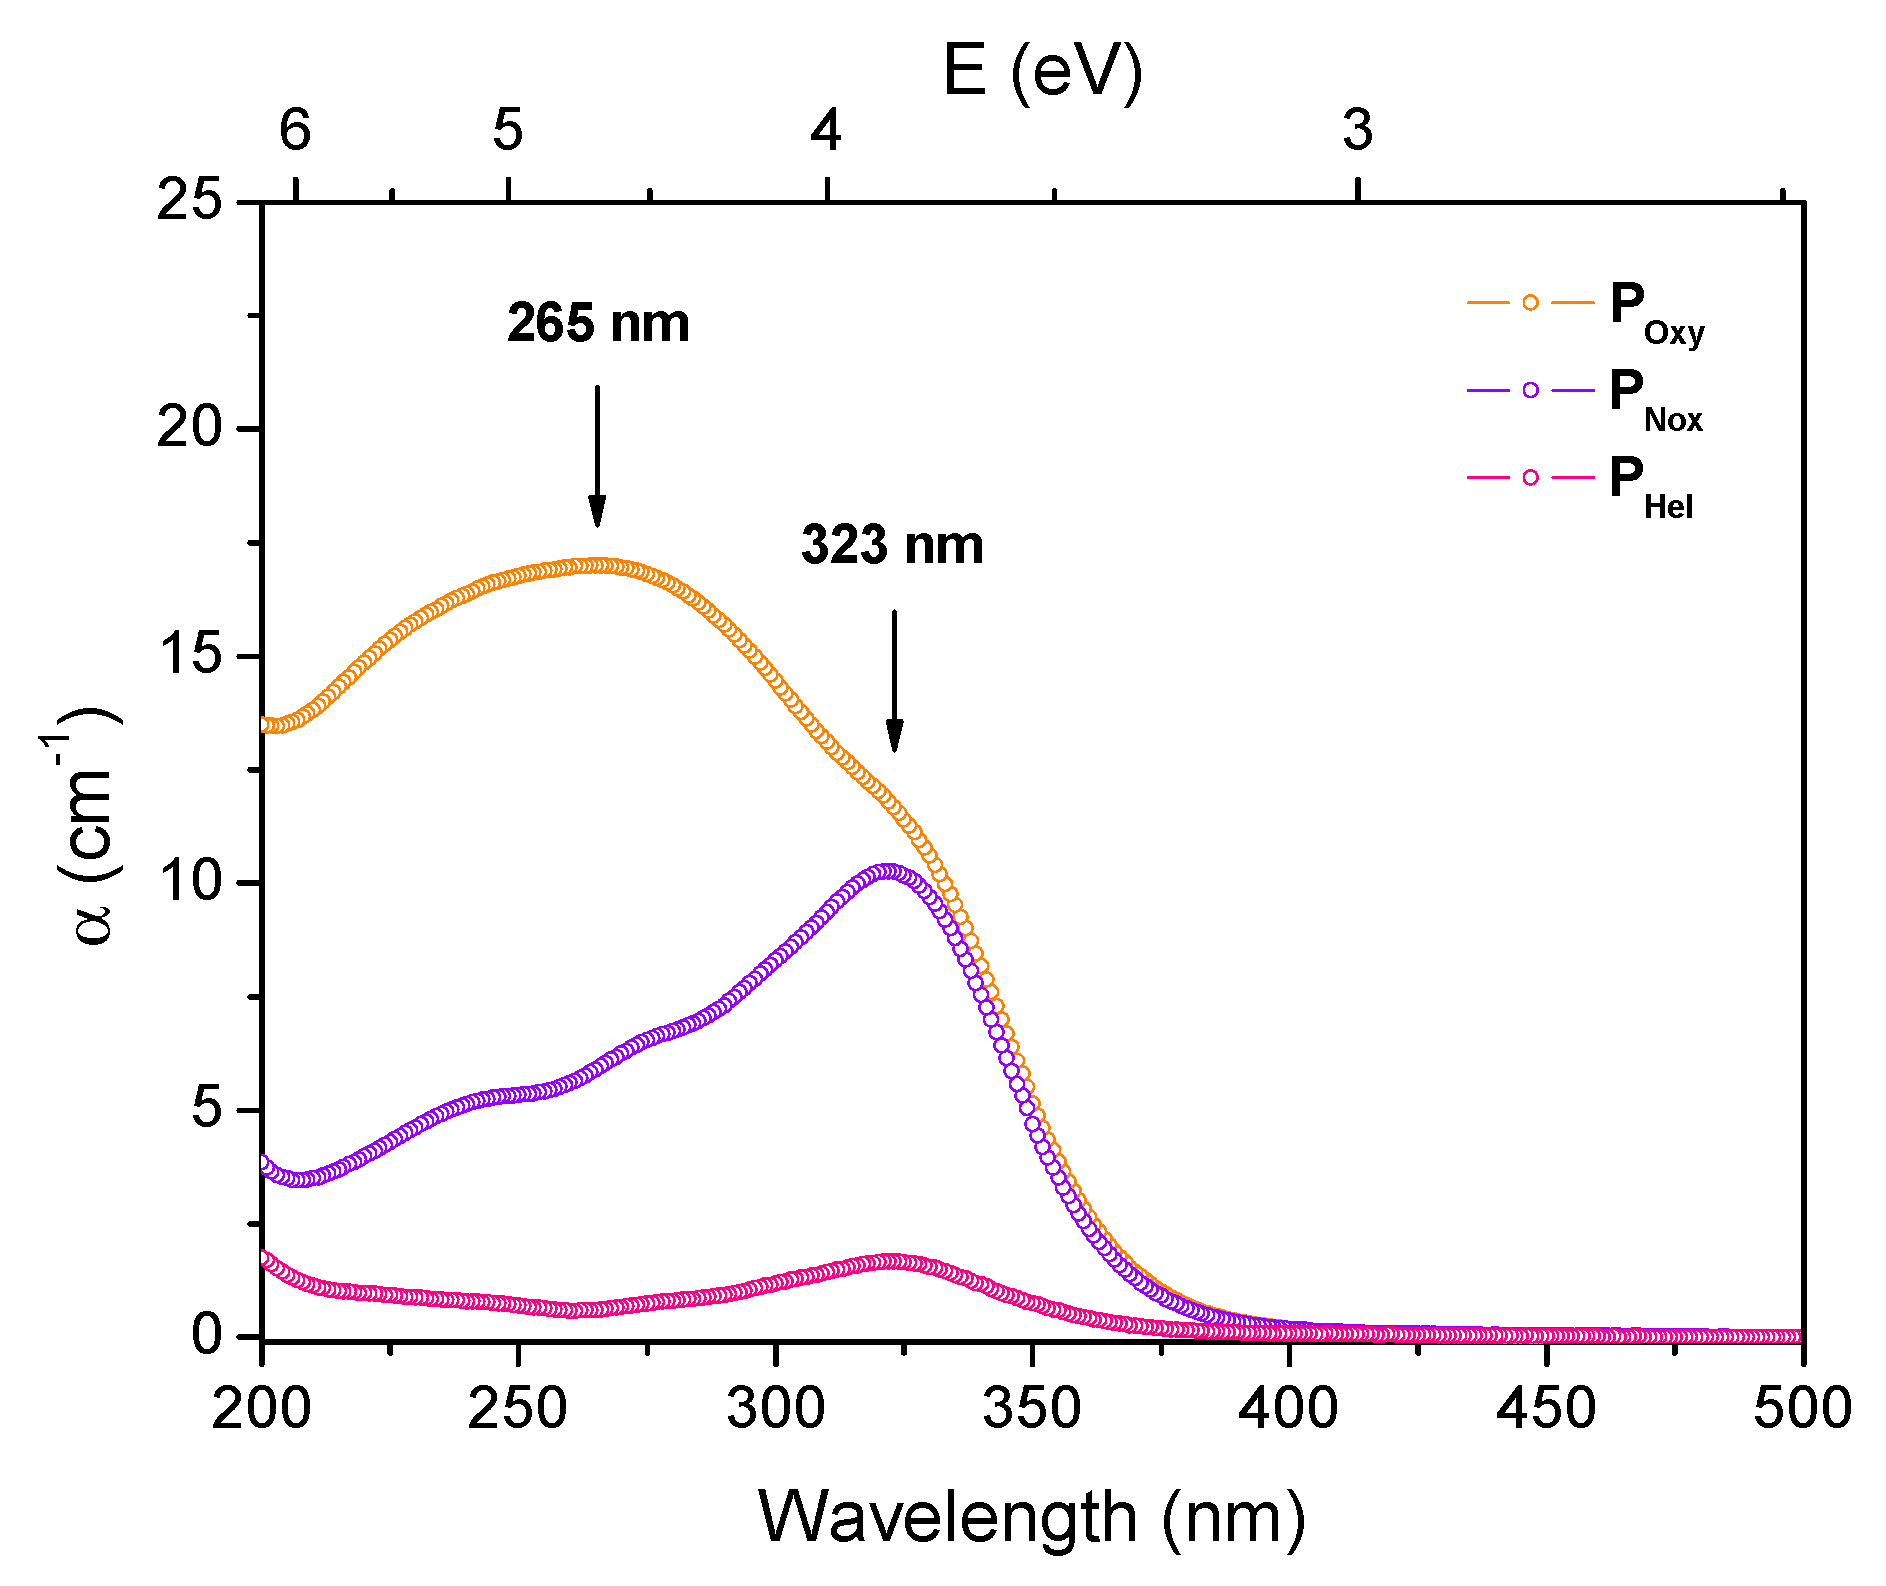
3.1.2. Optical Absorption
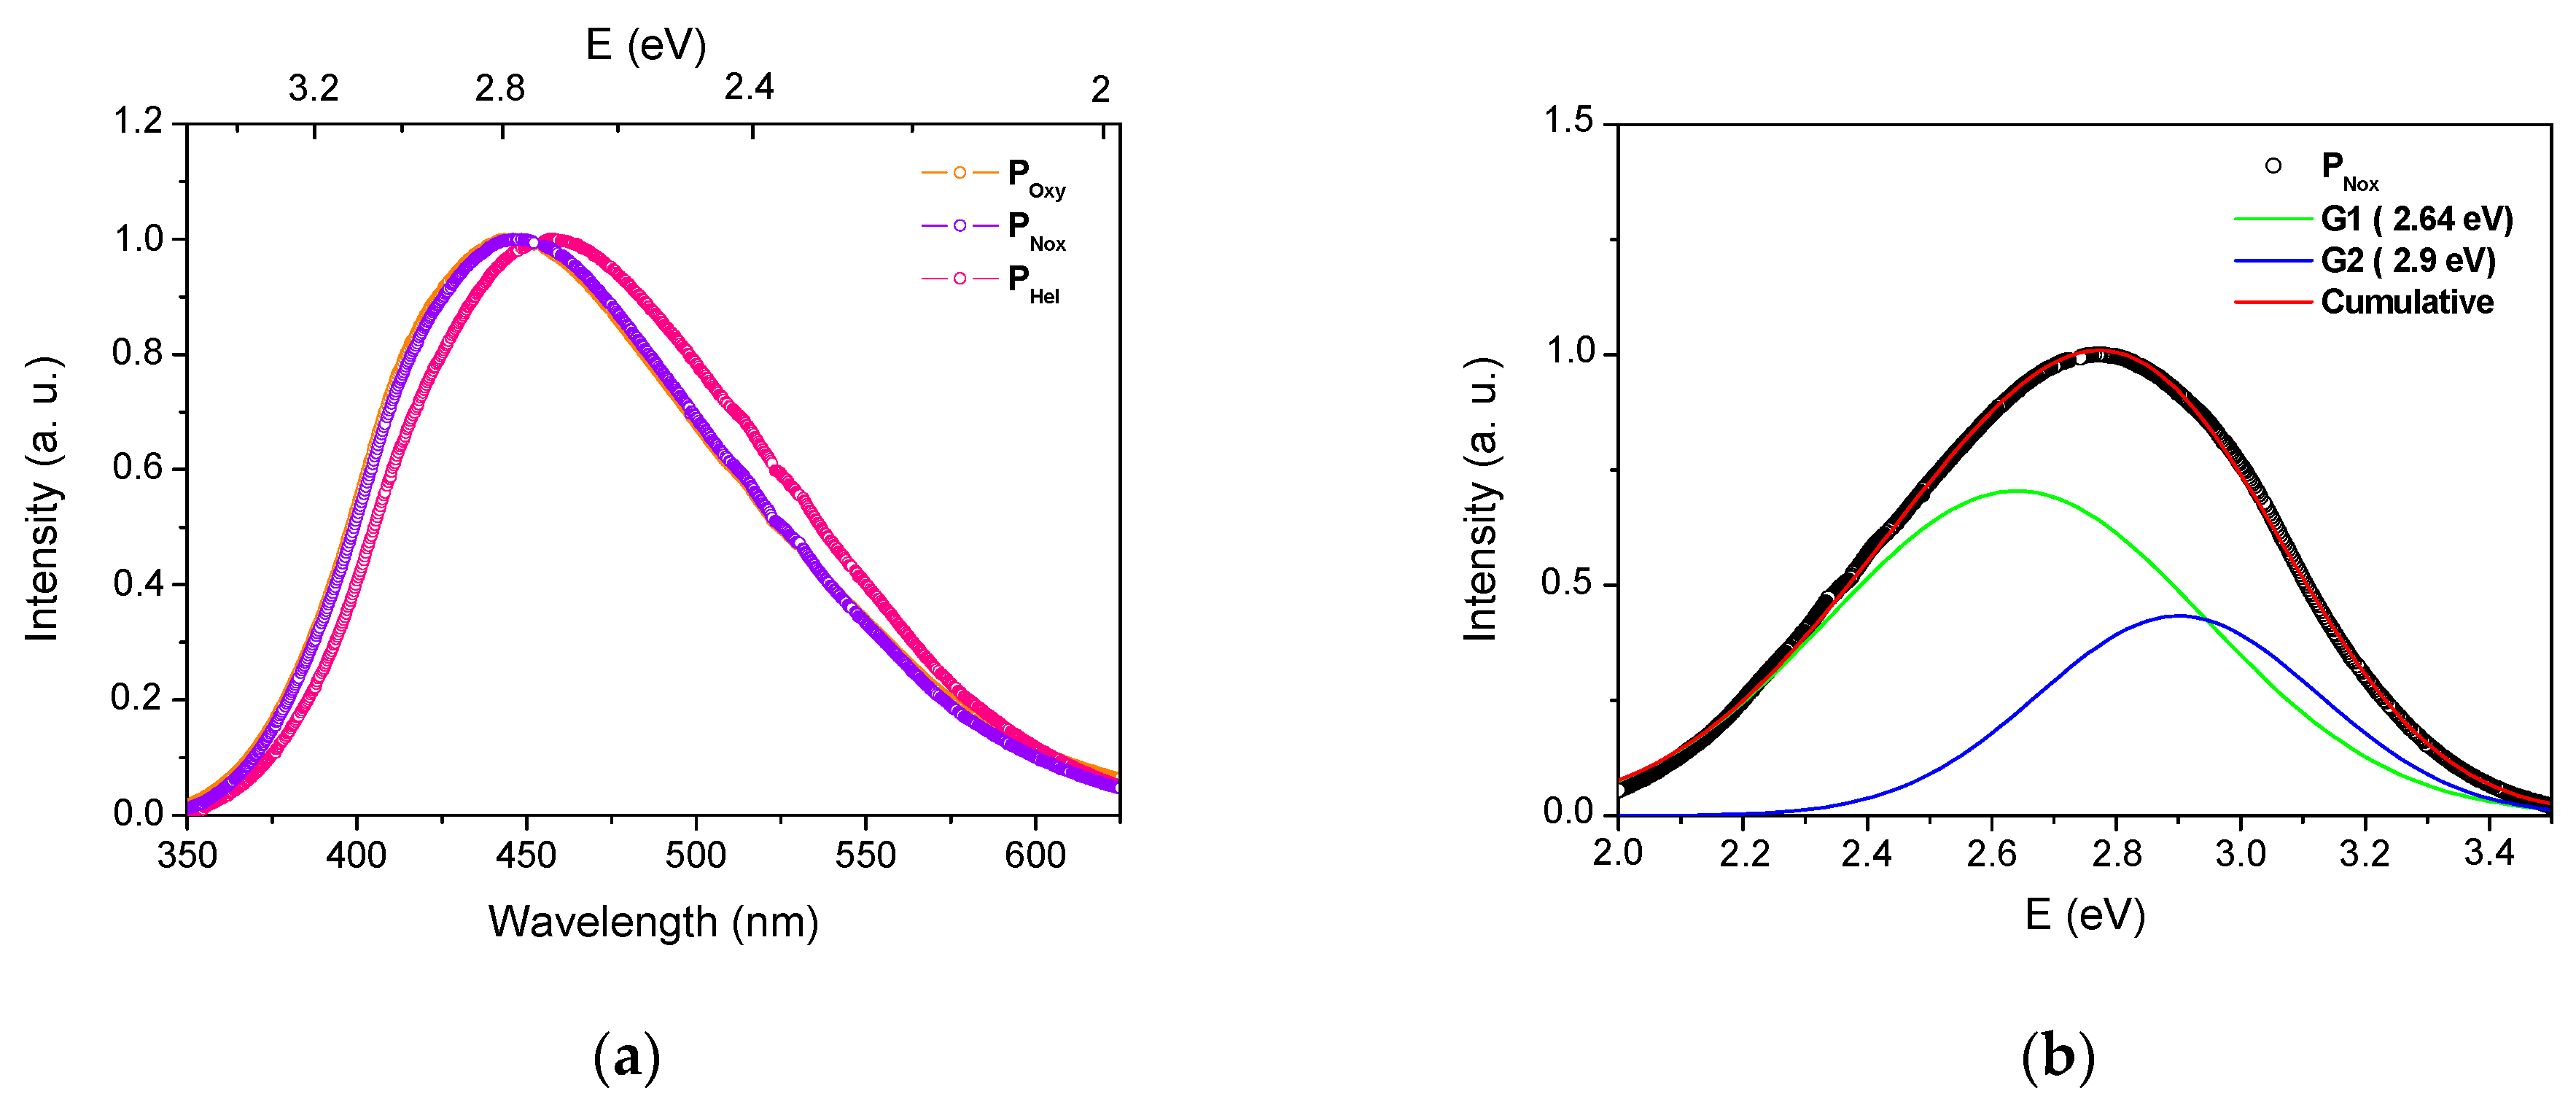
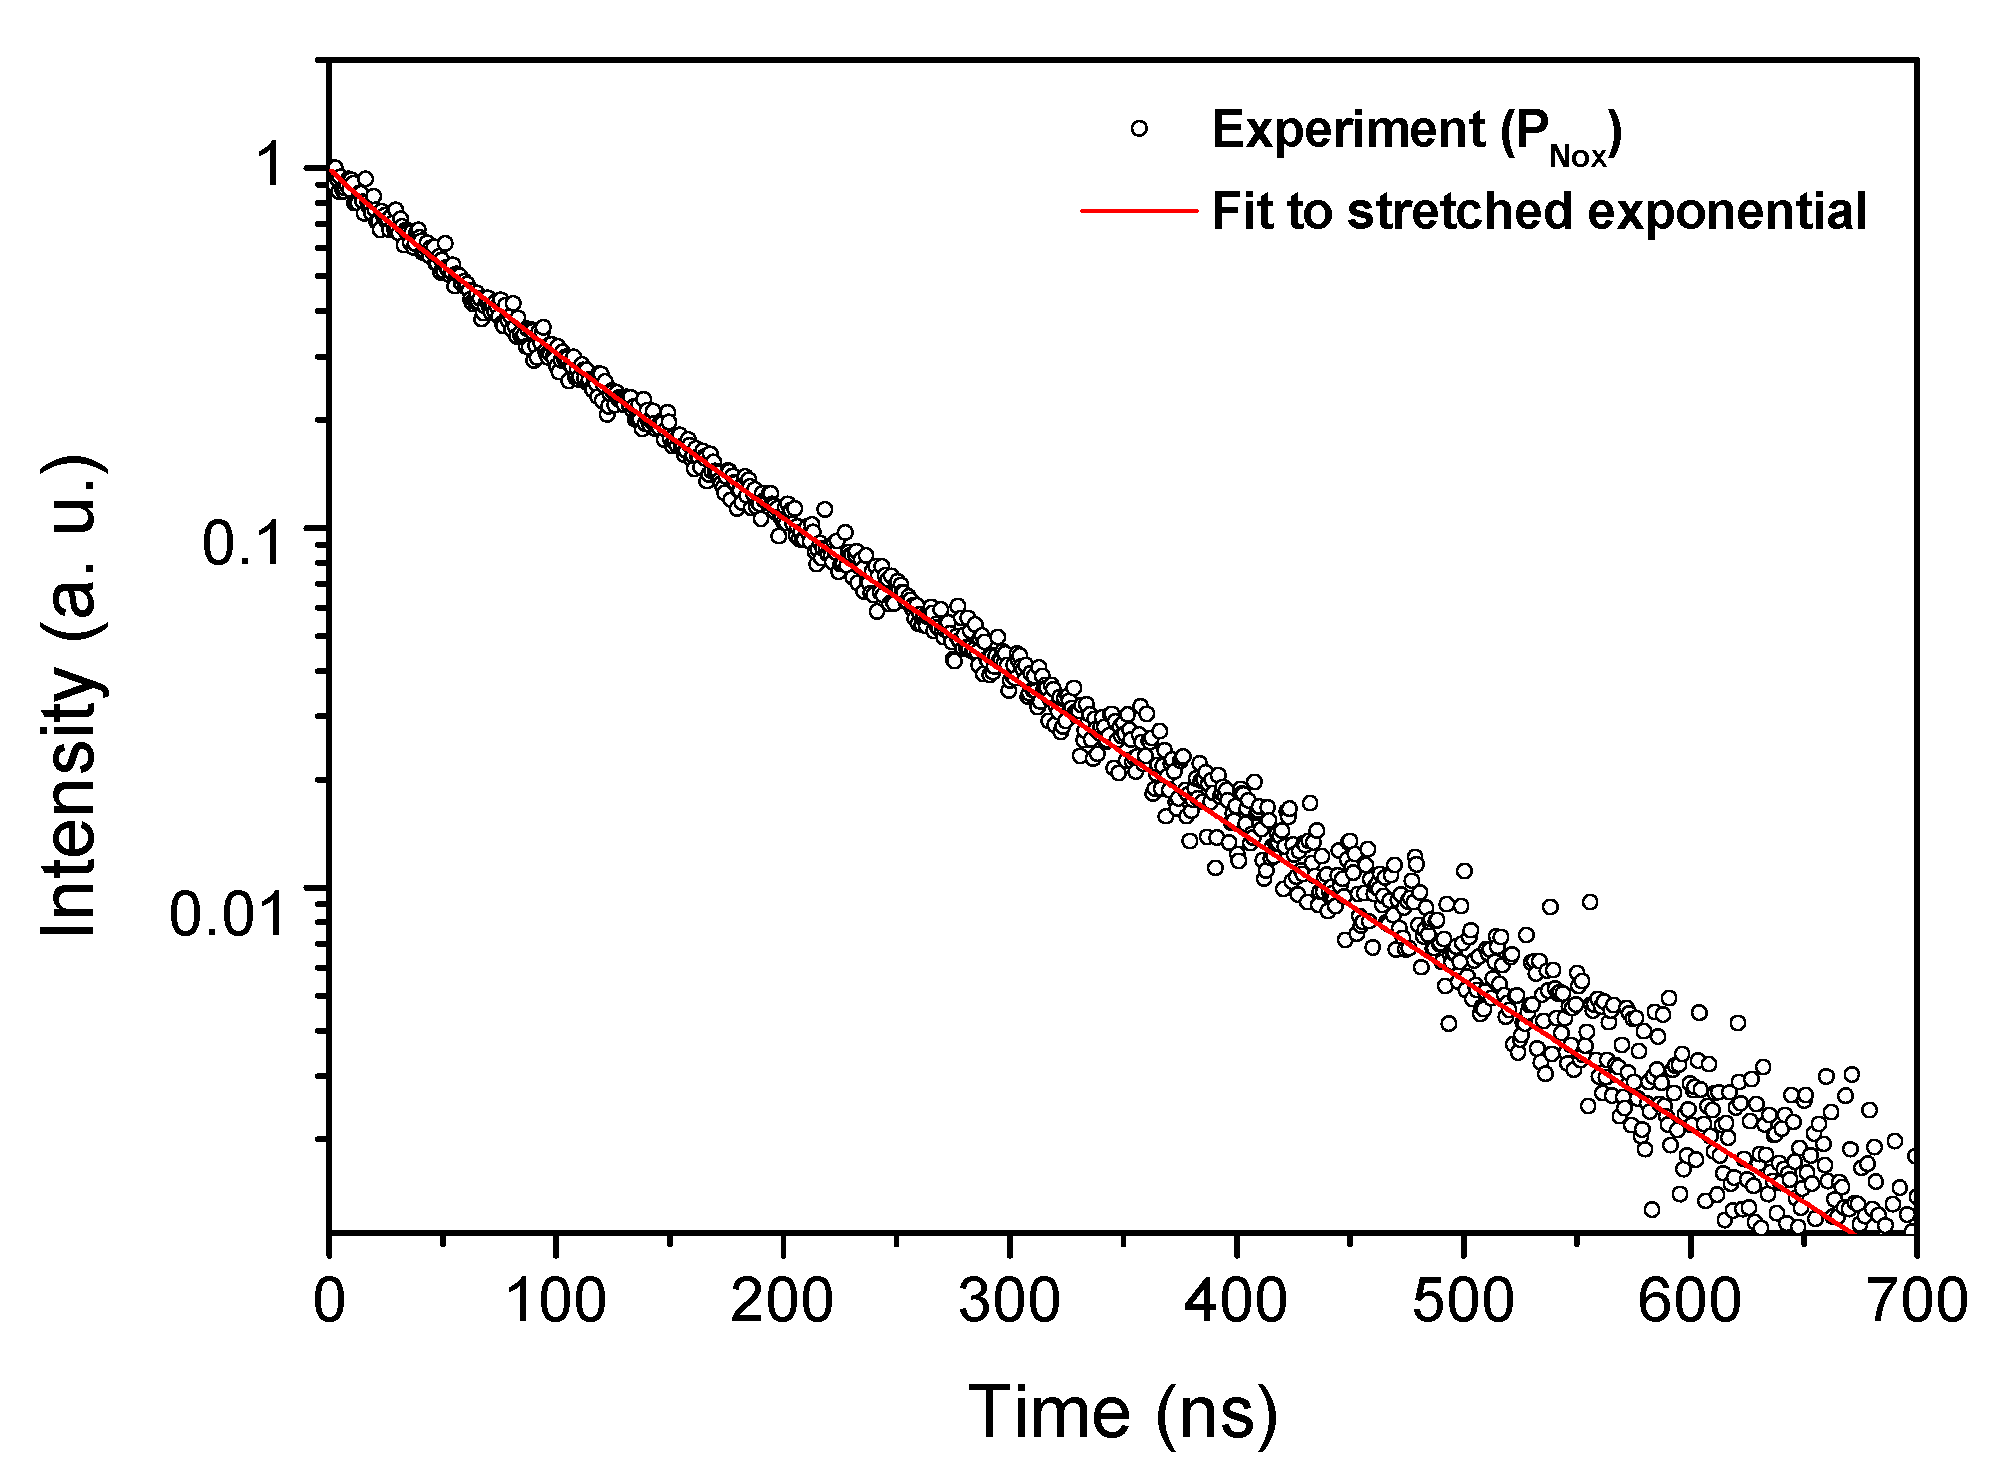
3.1.3. Photoluminescence Properties
3.2. Ce-Doped Fibers
4. Conclusions
Author Contributions
Funding
Institutional Review Board Statement
Informed Consent Statement
Data Availability Statement
Acknowledgments
Conflicts of Interest
References
- Radvanyi, P.; Villain, J. The discovery of radioactivity. Comptes Rendus Phys. 2017, 18, 544–550. [Google Scholar] [CrossRef]
- Ribeiro, A.; Husson, O.; Drey, N.; Murray, I.; May, K.; Thurston, J.; Oyen, W. Ionising radiation exposure from medical imaging—A review of Patient’s (un) awareness. Radiography 2020, 26, e25–e30. [Google Scholar] [CrossRef] [PubMed] [Green Version]
- Darafsheh, A. Fiber Optic Radioluminescent Probes for Radiation Therapy Dosimetry; SPIE BiOS: San Francisco, CA, USA, 2019. [Google Scholar] [CrossRef]
- O’Keeffe, S.; Fitzpatrick, C.; Lewis, E.; Al-Shamma’A, A.I. A review of optical fibre radiation dosimeters. Sens. Rev. 2008, 28, 136–142 [. [Google Scholar] [CrossRef]
- O’Keeffe, S.; McCarthy, D.; Woulfe, P.; Grattan, M.W.D.; Hounsell, A.R.; Sporea, D.; Mihai, L.; Vata, I.; Leen, G.; Lewis, E. A review of recent advances in optical fibre sensors for in vivo dosimetry during radiotherapy. Br. J. Radiol. 2015, 88. [Google Scholar] [CrossRef] [Green Version]
- Abdulla, Y.A.; Amin, Y.M.; Bradley, D.A. The thermoluminescence response of Ge-doped optical fibre subjected to photon irradiation. Radiat. Phys. Chem. 2001, 61, 409–410. [Google Scholar] [CrossRef]
- Zubair, H.T.; Begum, M.; Moradi, F.; Rahman, A.K.M.M.; Mahdiraji, G.A.; Oresegun, A.; Louay, G.T.; Omar, N.Y.M.; Khandaker, M.U.; Adikan, F.R.M.; et al. Recent Advances in Silica Glass Optical Fiber for Dosimetry Applications. IEEE Photonics J. 2020, 12. [Google Scholar] [CrossRef]
- Baccaro, S.; Cemmi, A.; Di Sarcina, I.; Menchini, F. Gamma rays effects on the optical properties of Cerium-doped glasses. Int. J. Appl. Glass Sci. 2015, 6, 295–301. [Google Scholar] [CrossRef]
- Akchurin, N.; Kendir, E.; Yaltkaya, S.; Damgov, J.; Du Guio, F.; Kunori, S. Radiation-hardness studies with cerium-doped fused-silica fibers. J. Inst. 2019, 14, P03020. [Google Scholar] [CrossRef]
- Girard, S.; Vivona, M.; Laurent, A.; Cadier, B.; Marcandella, C.; Robin, T.; Pinsard, E.; Boukenter, A.; Ouerdane, Y. Radiation hardening techniques for Er/Yb doped optical fibers and amplifiers for space application. Opt. Express 2012, 20, 8457–8465. [Google Scholar] [CrossRef]
- Shao, C.Y.; Xu, W.B.; Ollier, N.; Guzik, M.; Boulon, G.; Yu, L.; Zhang, L.; Yu, C.L.; Wang, S.K.; Hu, L.L. Suppression mechanism of radiation-induced darkening by Ce doping in Al/Yb/Ce-doped silica glasses: Evidence from optical spectroscopy, EPR and XPS analyses. J. Appl. Phys. 2016, 120, 153101. [Google Scholar] [CrossRef]
- Liu, X.; Liu, C.; Chen, G.; Haiqing, L. Influence of cerium ions on thermal bleaching of photo-darkened ytterbium-doped fibers. Front. Optoelectron. 2018, 11, 394–399. [Google Scholar] [CrossRef]
- van Eijk, C.W.E.; Andriessen, J.; Dorenbos, P.; Visser, R. Ce3+ doped inorganic scintillators. Nucl. Instrum. Methods A 1994, 348, 546–550. [Google Scholar] [CrossRef]
- Fasoli, M.; Vedda, A.; Lauria, A.; Moretti, F.; Rizzelli, E.; Chiodini, N.; Meinardi, F.; Nikl, M. Effect of reducing sintering atmosphere on Ce-doped sol-gel silica glasses. J. Non Cryst. Solids 2009, 355, 1140–1144. [Google Scholar] [CrossRef]
- Herrmann, A.; Othman, H.A.; Assadi, A.A.; Tiegel, M.; Kuhn, S.; Rüssel, C. Spectroscopic properties of cerium-doped aluminosilicate glasses. Opt. Mater. Express 2015, 5, 720–732. [Google Scholar] [CrossRef]
- Ishii, Y.; Arai, K.; Namikawa, H.; Tanaka, M.; Negishi, A.; Handa, T. Preparation of Cerium-Activated Silica Glasses: Phosphorus and Aluminum Codoping Effects on Absorption and Fluorescence Properties. J. Am. Ceram. Soc. 1987, 70, 72–77. [Google Scholar] [CrossRef]
- Cicconi, M.R.; Neuville, D.R.; Blanc, W.; Lupi, J.F.; Vermillac, M.; de Ligny, D. Cerium/aluminum correlation in aluminosilicate glasses and optical silica fiber preforms. J. Non Cryst. Solids 2017, 475, 85–95. [Google Scholar] [CrossRef] [Green Version]
- Engholm, M.; Jelger, P.; Laurell, F.; Norin, L. Improved photodarkening resistivity in ytterbium-doped fiber lasers by cerium codoping. Opt. Lett. 2009, 34, 1285–1287. [Google Scholar] [CrossRef]
- Unger, S.; Schwuchow, A.; Jetschke, S.; Grimm, S.; Scheffel, A.; Kirchhof, J. Optical properties of cerium-codoped high power laser fibers. In Proceedings of the SPIE 8621, Optical Components and Materials X, 862116, San Francisco, CA, USA, 11 March 2013. [Google Scholar] [CrossRef]
- Chiodini, N.; Vedda, A.; Fasoli, M.; Moretti, F.; Lauria, A.; Cantone, M.C.; Veronese, I.; Tosi, G.; Brambilla, M.; Cannillo, B.; et al. Ce-doped SiO2 optical fibers for remote radiation sensing and measurement. Fiber Opt. Sens. Appl. VI 2009, 7316, 731616. [Google Scholar] [CrossRef] [Green Version]
- Canevali, C.; Mattoni, M.; Morazzoni, F.; Scotti, R.; Casu, M.; Musinu, A.; Krsmanovic, R.; Polizzi, S.; Speghini, A.; Bettinelli, M. Stability of Luminescent Trivalent Cerium in Silica Host Glasses Modified by Boron and Phosphorus. J. Am. Chem. Soc. 2005, 127, 14681–14691. [Google Scholar] [CrossRef]
- Girard, S.; Alessi, A.; Richard, N.; Martin-Samos, L.; De Michele, V.; Giacomazzi, L.; Agnello, S.; Di Francesca, D.; Morana, A.; Winkler, B.; et al. Overview of radiation induced point defects in silica-based optical fibers. Rev. Phys. 2019, 4, 100032. [Google Scholar] [CrossRef]
- Mady, F.; Guttilla, A.; Benabdesselam, M.; Blanc, W. Systematic investigation of composition effects on the radiation-induced attenuation mechanisms of aluminosilicate, Yb-doped silicate, Yb- and Yb,Ce-doped aluminosilicate fiber preforms [Invited]. Opt. Mater. Express 2019, 9, 2466–2489. [Google Scholar] [CrossRef] [Green Version]
- Vedda, A.; Chiodini, N.; Di Martino, D.; Fasoli, M.; Morazzoni, F.; Moretti, F.; Scotti, R.; Spinolo, G.; Baraldi, A.; Capelletti, R.; et al. Insights into microstructural features governing Ce3+ luminescence efficiency in Sol-Gel silica glasses. Chem. Mater. 2006, 18, 6178–6185. [Google Scholar] [CrossRef]
- Vedda, A.; Chiodini, N.; Di Martino, D.; Fasoli, M.; Keffer, S.; Lauria, A.; Martini, M.; Moretti, F.; Spinolo, G.; Nikl, M.; et al. Ce3+-doped fibers for remote radiation dosimetry. Appl. Phys. Lett. 2004, 85, 6356–6538. [Google Scholar] [CrossRef]
- Al Helou, N.; El Hamzaoui, H.; Capoen, B.; Bouwmans, G.; Cassez, A.; Ouerdane, Y.; Boukenter, A.; Girard, S.; Chadeyron, G.; Mahiou, R.; et al. Radioluminescence and Optically Stimulated Luminescence Responses of a Cerium-doped Sol-gel Silica Glass under X-ray Beam Irradiation. IEEE Trans. Nucl. Sci. 2018, 65, 1591–1597. [Google Scholar] [CrossRef]
- Bahout, J.; Ouerdane, Y.; El Hamzaoui, H.; Bouwmans, G.; Bouazaoui, M.; Cassez, A.; Baudelle, K.; Habert, R.; Morana, A.; Boukenter, A.; et al. Remote Measurements of X-Rays Dose Rate Using a Cerium-Doped Air-Clad Optical Fiber. IEEE Trans. Nucl. Sci. 2020, 67, 1658–1662. [Google Scholar] [CrossRef]
- Hubbell, J.H.; Seltzer, S.M. X-ray Mass Attenuation Coefficients, Radiation Physics Division; PML, NIST: Gaithersburg, MD, USA, 1996. [Google Scholar] [CrossRef]
- Lindner, F.; Kriltz, A.; Scheffel, A.; Dellith, A.; Dellith, J.; Wondraczek, K.; Bartelt, H. Influence of process parameters on the incorporation of phosphorus into silica soot material during MCVD process. Opt. Mater. Express 2020, 10, 763. [Google Scholar] [CrossRef]
- El Hamzaoui, H.; Bouazaoui, M.; Capoen, B. Raman investigation of germanium- and phosphorus-doping effects on the structure of sol–gel silica-based optical fiber preforms. J. Mol. Struct. 2015, 1099, 77–82. [Google Scholar] [CrossRef]
- Paul, A.; Mulholland, M.; Zaman, M.S. Ultraviolet absorption of cerium(III) and cerium(IV) in some simple glasses. J. Mater. Sci. 1976, 11, 2082–2086. [Google Scholar] [CrossRef]
- Bahadur, A.; Dwivedi, Y.; Rai, S.B. Optical properties of cerium doped oxyfluoroborate glass. Spectrochim. Acta A Mol. Biomol. Spectrosc. 2013, 110, 400–403. [Google Scholar] [CrossRef] [PubMed]
- Wei, R.F.; Zhang, H.; Li, F.; Guo, H. Blue-White-Green Tunable Luminescence of Ce3+, Tb3+ Co-Doped Sodium Silicate Glasses for White LEDs. J. Am. Ceram. Soc. 2012, 95, 34–36. [Google Scholar] [CrossRef]
- Cardona, M.; Chamberlin, R.; Marx, W. The history of the stretched exponential function. Ann. Phys. 2007, 16, 842–845. [Google Scholar] [CrossRef]
- Berberan-Santos, M.; Bodunov, E.; Valeur, B. History of the Kohlrausch (stretched exponential) function: Pioneering work in luminescence. Ann. Phys. 2008, 17, 460–461. [Google Scholar] [CrossRef] [Green Version]
- Johnston, D.C. Stretched exponential relaxation arising from a continuous sum of exponential decays. Phys. Rev. B 2006, 74, 184430. [Google Scholar] [CrossRef] [Green Version]
- Bahout, J.; Ouerdane, Y.; El Hamzaoui, H.; Bouwmans, G.; Bouazaoui, M.; Cassez, A.; Baudelle, K.; Habert, R.; Morana, A.; Boukenter, A.; et al. Cu/Ce-co-Doped Silica Glass as Radioluminescent Material for Ionizing Radiation Dosimetry. Materials 2020, 13, 2611. [Google Scholar] [CrossRef]
- Sun, X.; Wen, J.; Guo, Q.; Pang, F.; Chen, Z.; Luo, Y.; Peng, G.; Wang, T. Fluorescence properties and energy level structure of Ce-doped silica fiber materials. Opt. Mater. Express 2017, 7, 751–759. [Google Scholar] [CrossRef]
- Dorenbos, P. 5d-level energies of Ce3+ and the crystalline environment. III. Oxides containing ionic complexes. Phys. Rev. B 2001, 64, 125117. [Google Scholar] [CrossRef] [Green Version]
- Friebele, E.J.; Sigel, G.H., Jr.; Griscom, D.L. Drawing-induced defect centers in a fused silica core fiber. Appl. Phys. Lett. 1976, 28, 516–518. [Google Scholar] [CrossRef]
- Hibino, Y.; Hanafusa, H. Defect structure and formation mechanism of drawing-induced absorption at 630 nm in silica optical fibers. J. Appl. Phys. 1986, 60, 1797–1801. [Google Scholar] [CrossRef]


| Gaussian Band | POxy | PNox | PHel |
|---|---|---|---|
| G1 (2.64 eV) | 67.85 | 68.59 | 85.51 |
| G2 (2.9 eV) | 32.15 | 31.41 | 14.49 |
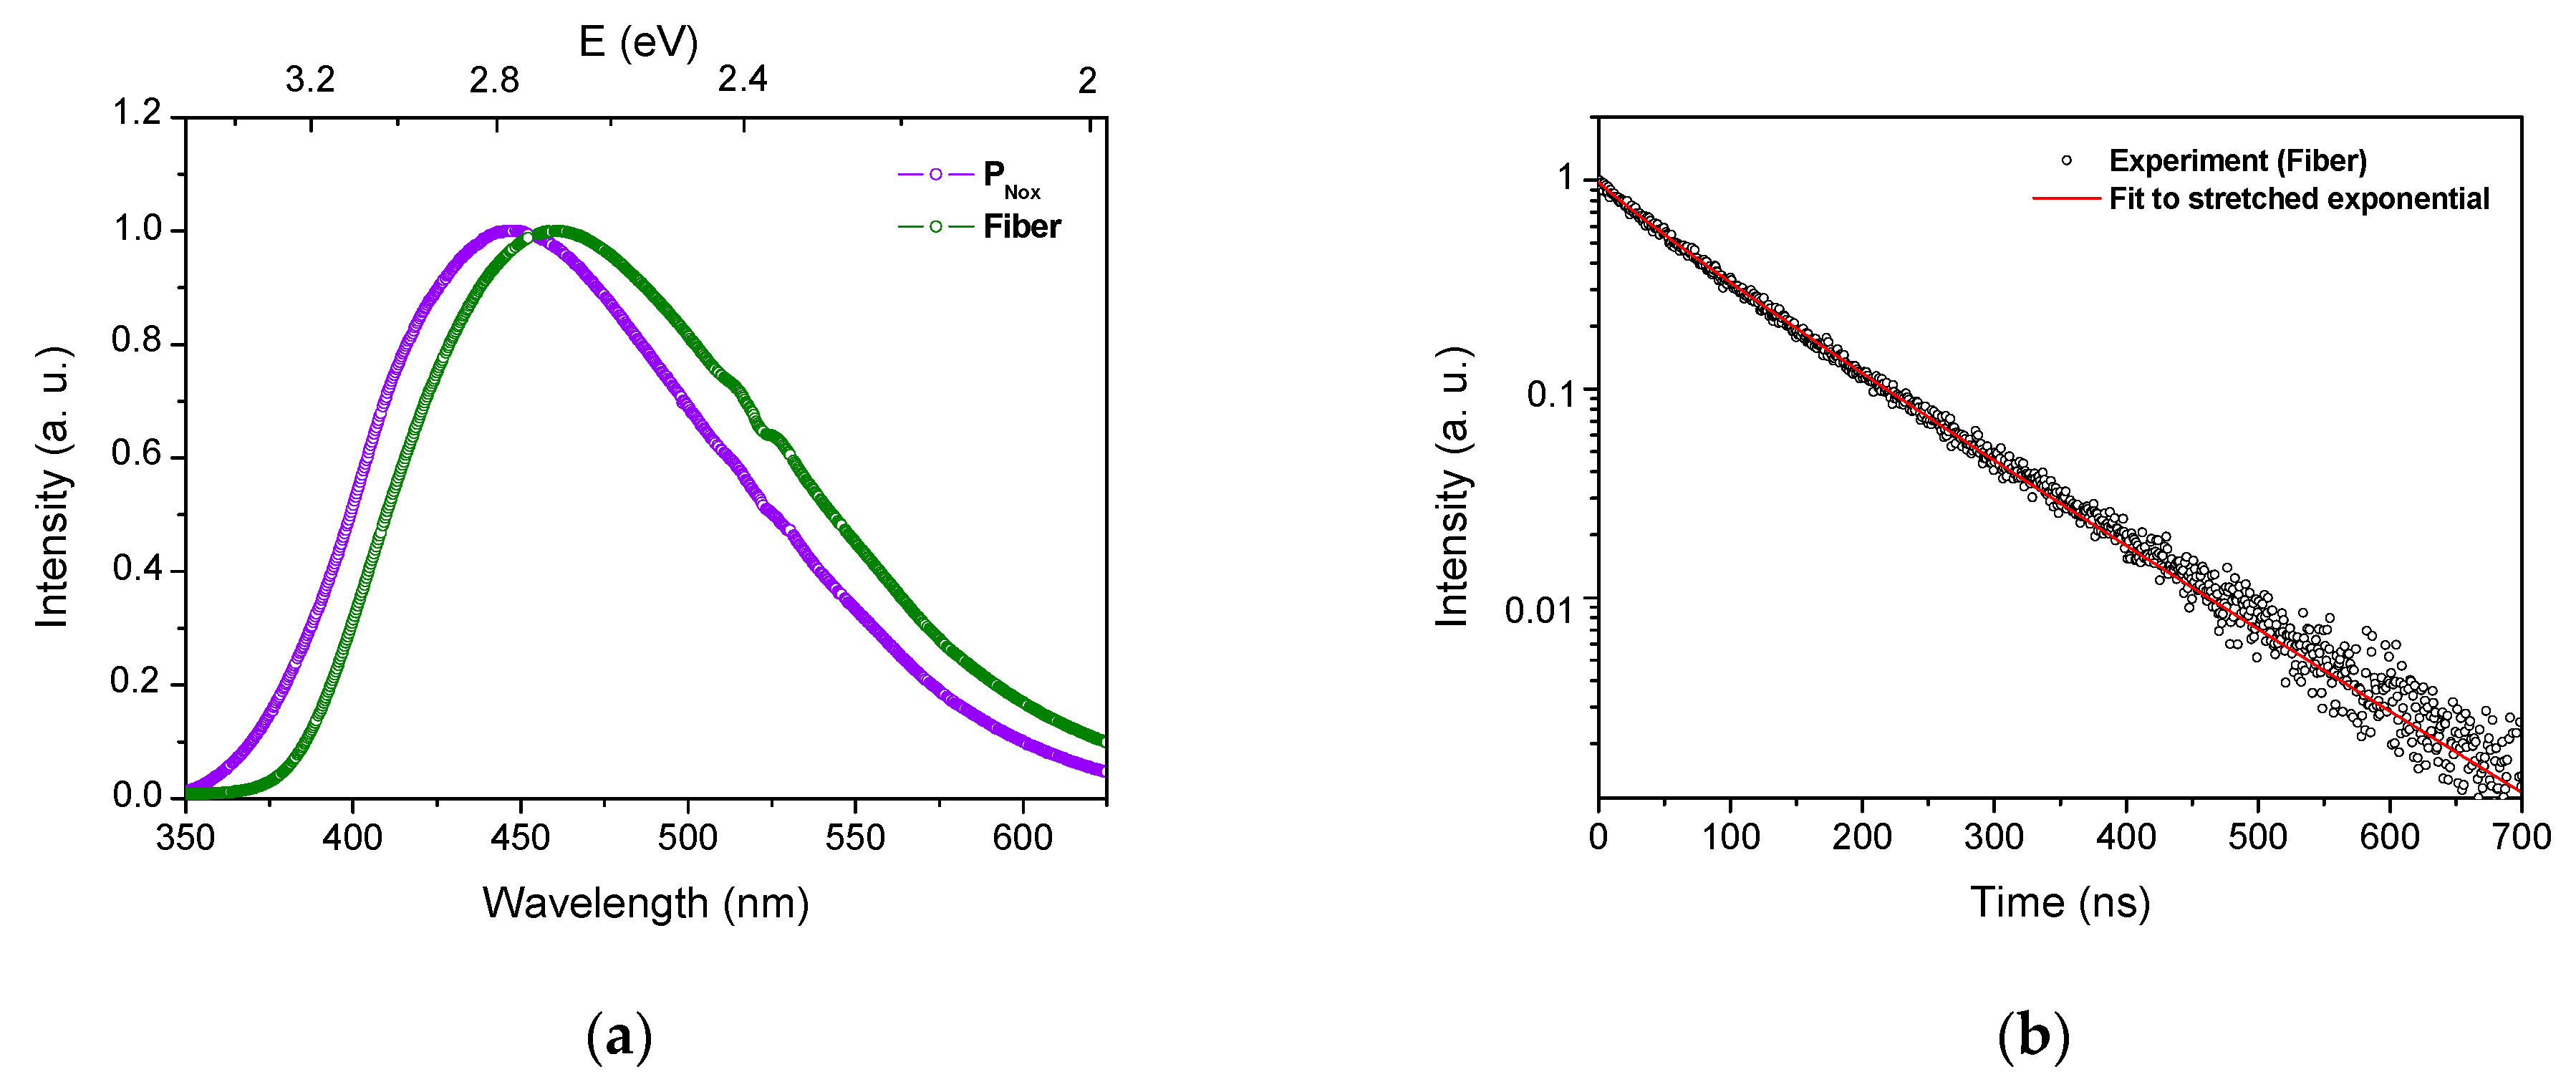
| Sample | τ [ns] | β |
|---|---|---|
| POxy | 79.6 ± 0.5 | 0.904 ± 0.005 |
| PNox | 83.3 ± 0.5 | 0.920 ± 0.006 |
| PHel | 92.3 ± 0.6 | 0.945 ± 0.006 |
Publisher’s Note: MDPI stays neutral with regard to jurisdictional claims in published maps and institutional affiliations. |
© 2021 by the authors. Licensee MDPI, Basel, Switzerland. This article is an open access article distributed under the terms and conditions of the Creative Commons Attribution (CC BY) license (https://creativecommons.org/licenses/by/4.0/).
Share and Cite
Cieslikiewicz-Bouet, M.; El Hamzaoui, H.; Ouerdane, Y.; Mahiou, R.; Chadeyron, G.; Bigot, L.; Delplace-Baudelle, K.; Habert, R.; Plus, S.; Cassez, A.; et al. Investigation of the Incorporation of Cerium Ions in MCVD-Silica Glass Preforms for Remote Optical Fiber Radiation Dosimetry. Sensors 2021, 21, 3362. https://0-doi-org.brum.beds.ac.uk/10.3390/s21103362
Cieslikiewicz-Bouet M, El Hamzaoui H, Ouerdane Y, Mahiou R, Chadeyron G, Bigot L, Delplace-Baudelle K, Habert R, Plus S, Cassez A, et al. Investigation of the Incorporation of Cerium Ions in MCVD-Silica Glass Preforms for Remote Optical Fiber Radiation Dosimetry. Sensors. 2021; 21(10):3362. https://0-doi-org.brum.beds.ac.uk/10.3390/s21103362
Chicago/Turabian StyleCieslikiewicz-Bouet, Monika, Hicham El Hamzaoui, Youcef Ouerdane, Rachid Mahiou, Geneviève Chadeyron, Laurent Bigot, Karen Delplace-Baudelle, Rémi Habert, Stéphane Plus, Andy Cassez, and et al. 2021. "Investigation of the Incorporation of Cerium Ions in MCVD-Silica Glass Preforms for Remote Optical Fiber Radiation Dosimetry" Sensors 21, no. 10: 3362. https://0-doi-org.brum.beds.ac.uk/10.3390/s21103362