
Monitoring the Cortical Activity of Children and Adults during Cognitive Task Completion

 , , , , , ,
  , , and
Abstract
:1. Introduction
2. Materials and Methods
2.1. Participants
2.2. Experimental Task and Related Discussions
2.3. Experimental Procedure
2.4. EEG Recording and Processing
2.5. Statistical Analysis
3. Results
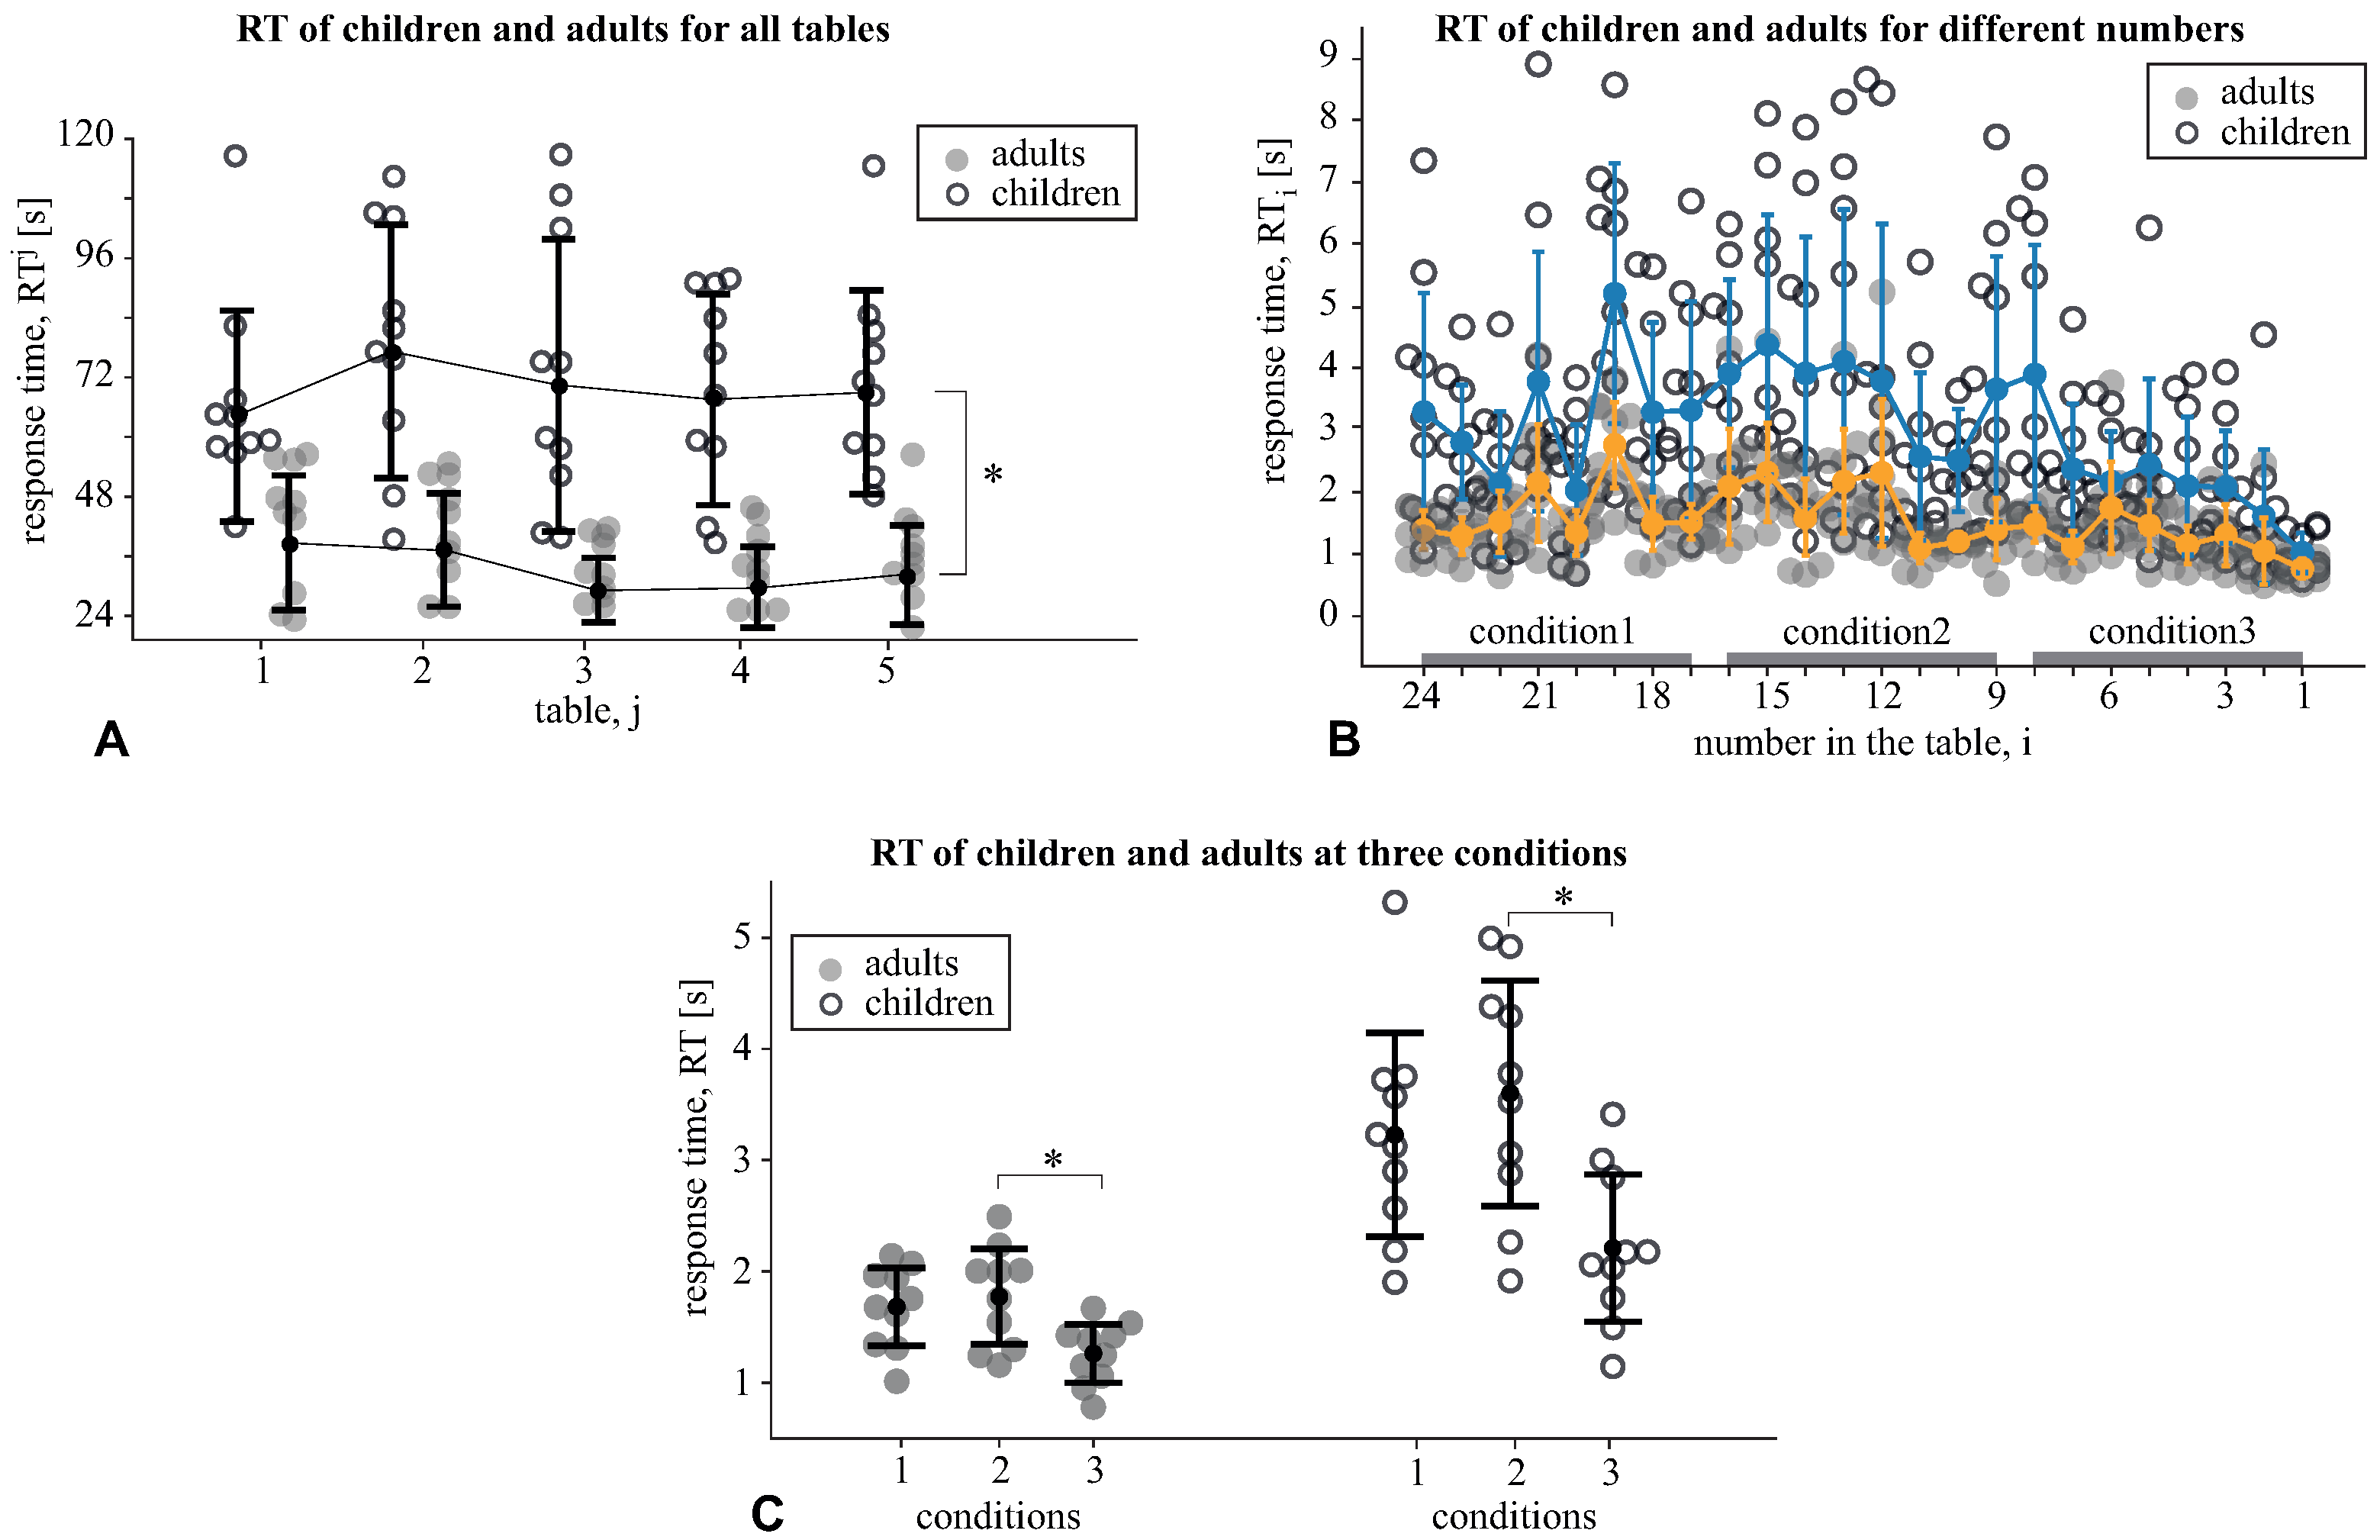
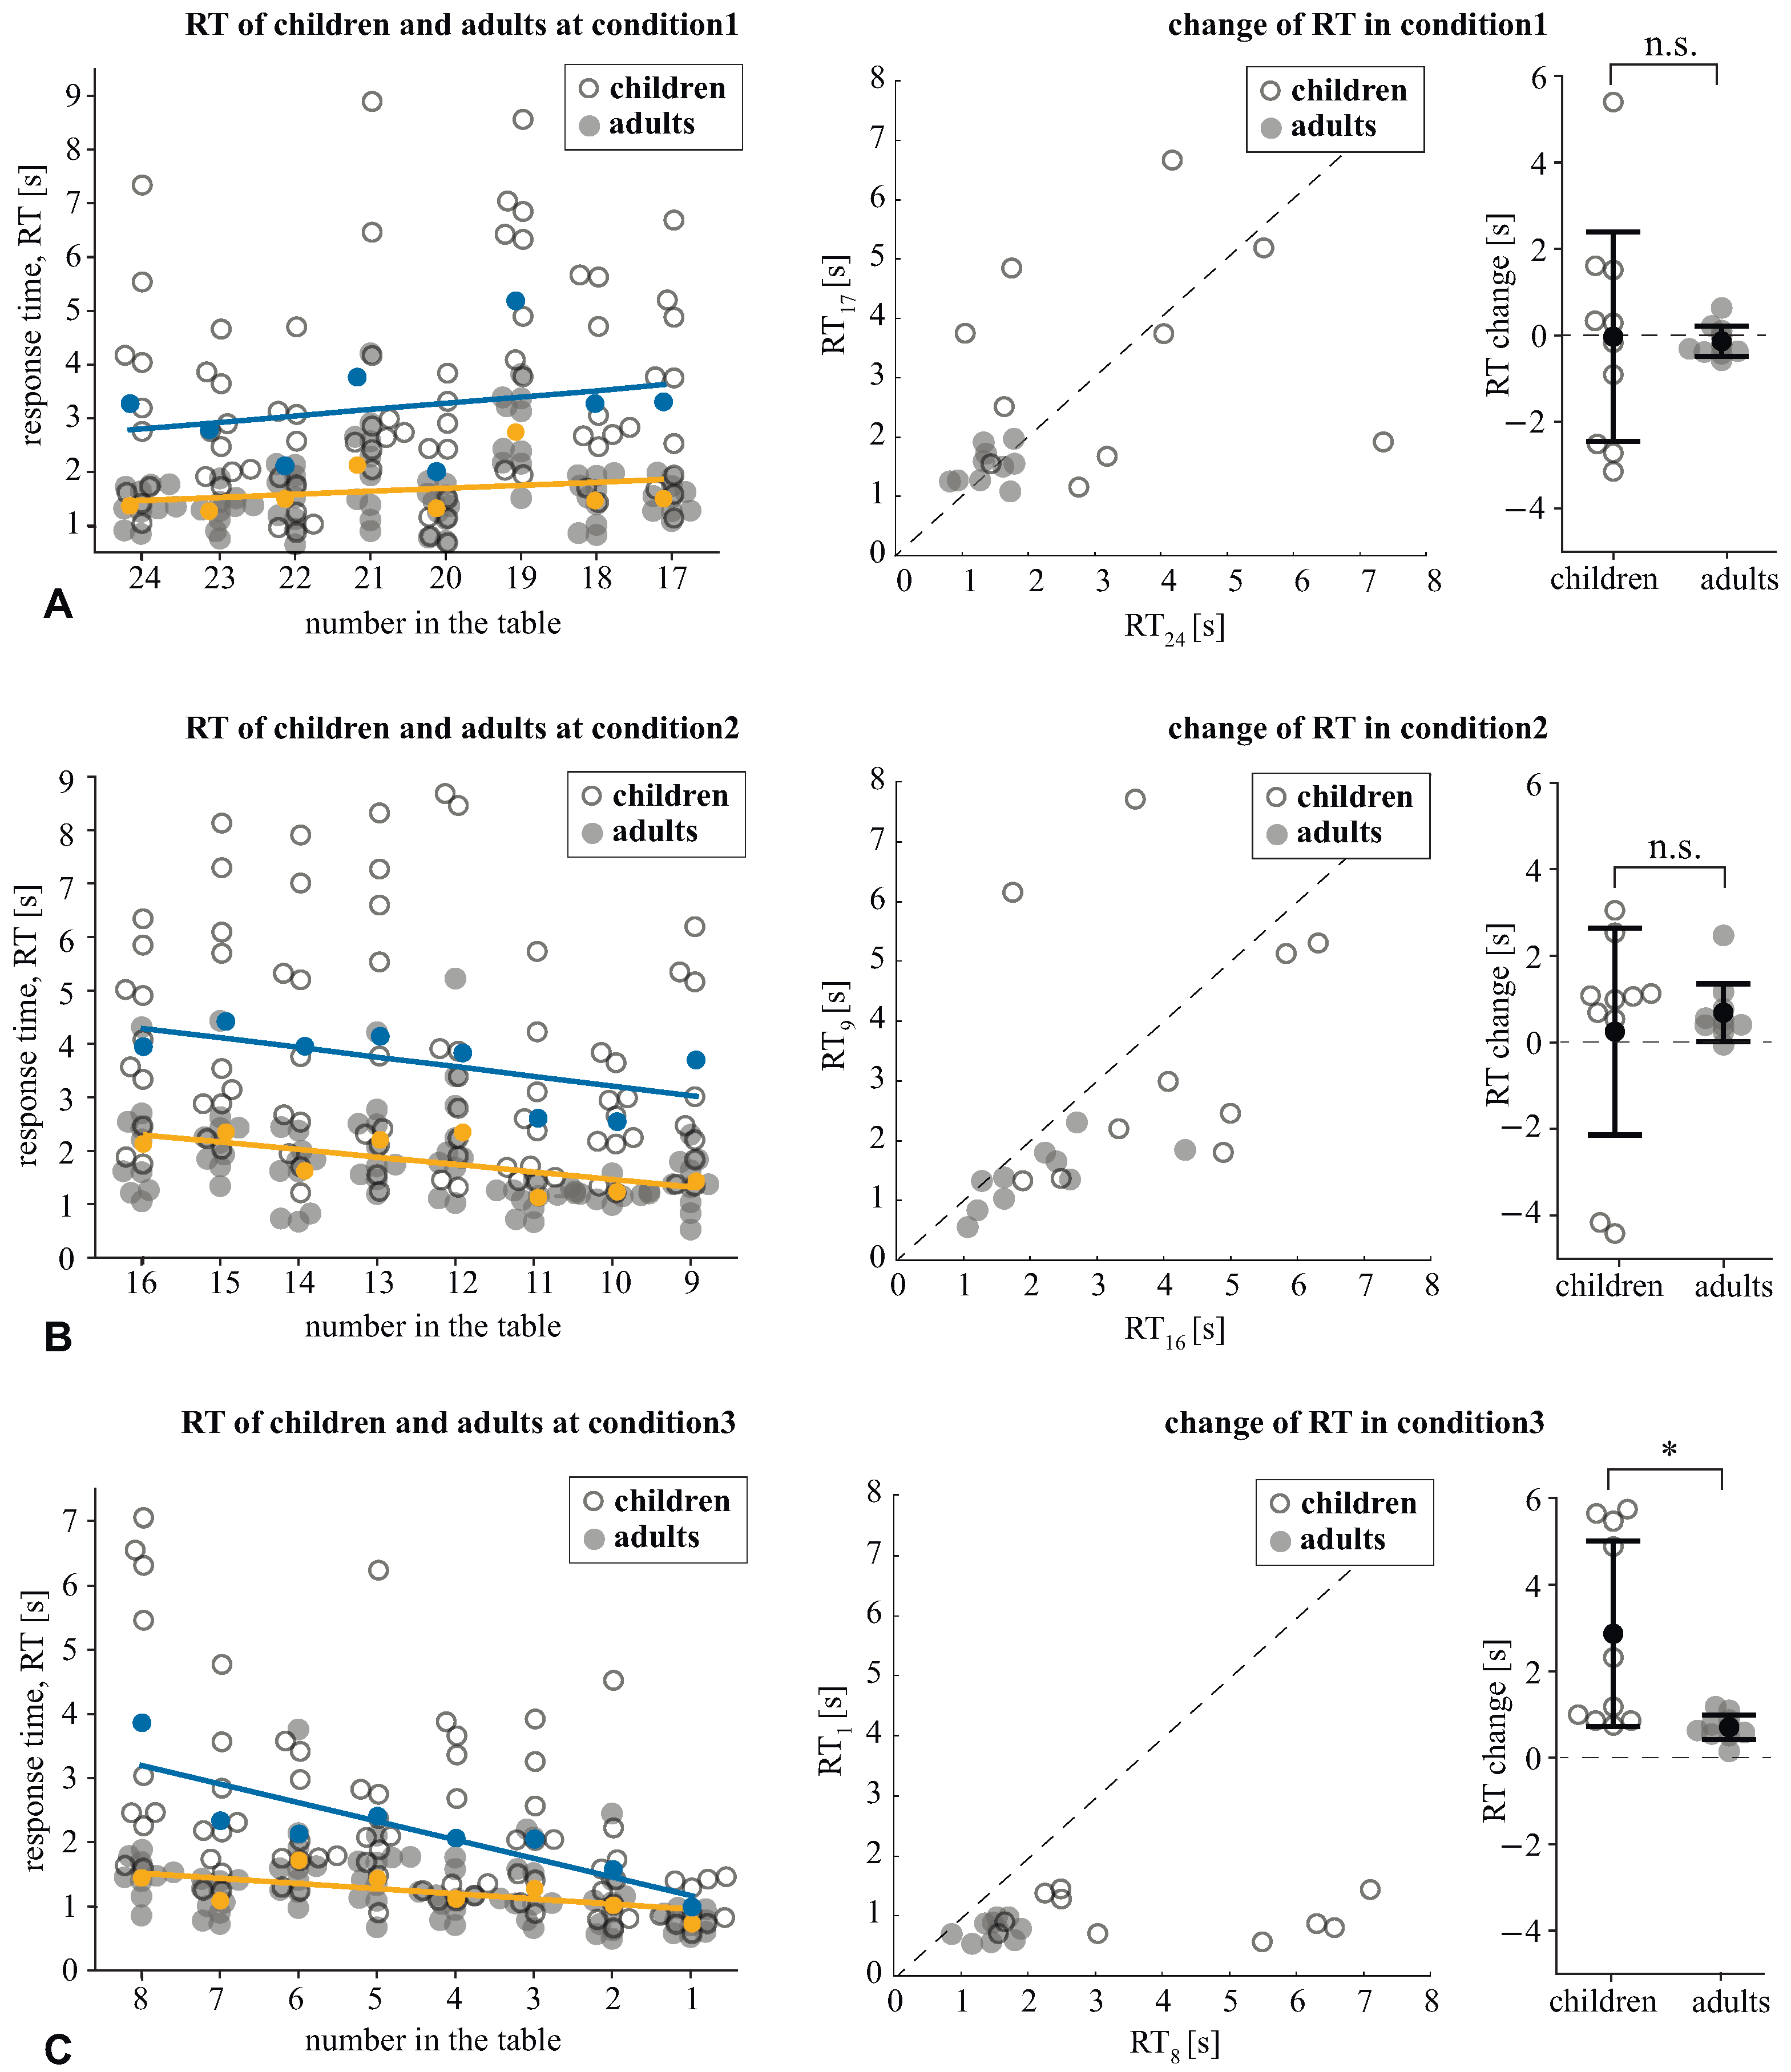
3.1. Response Time
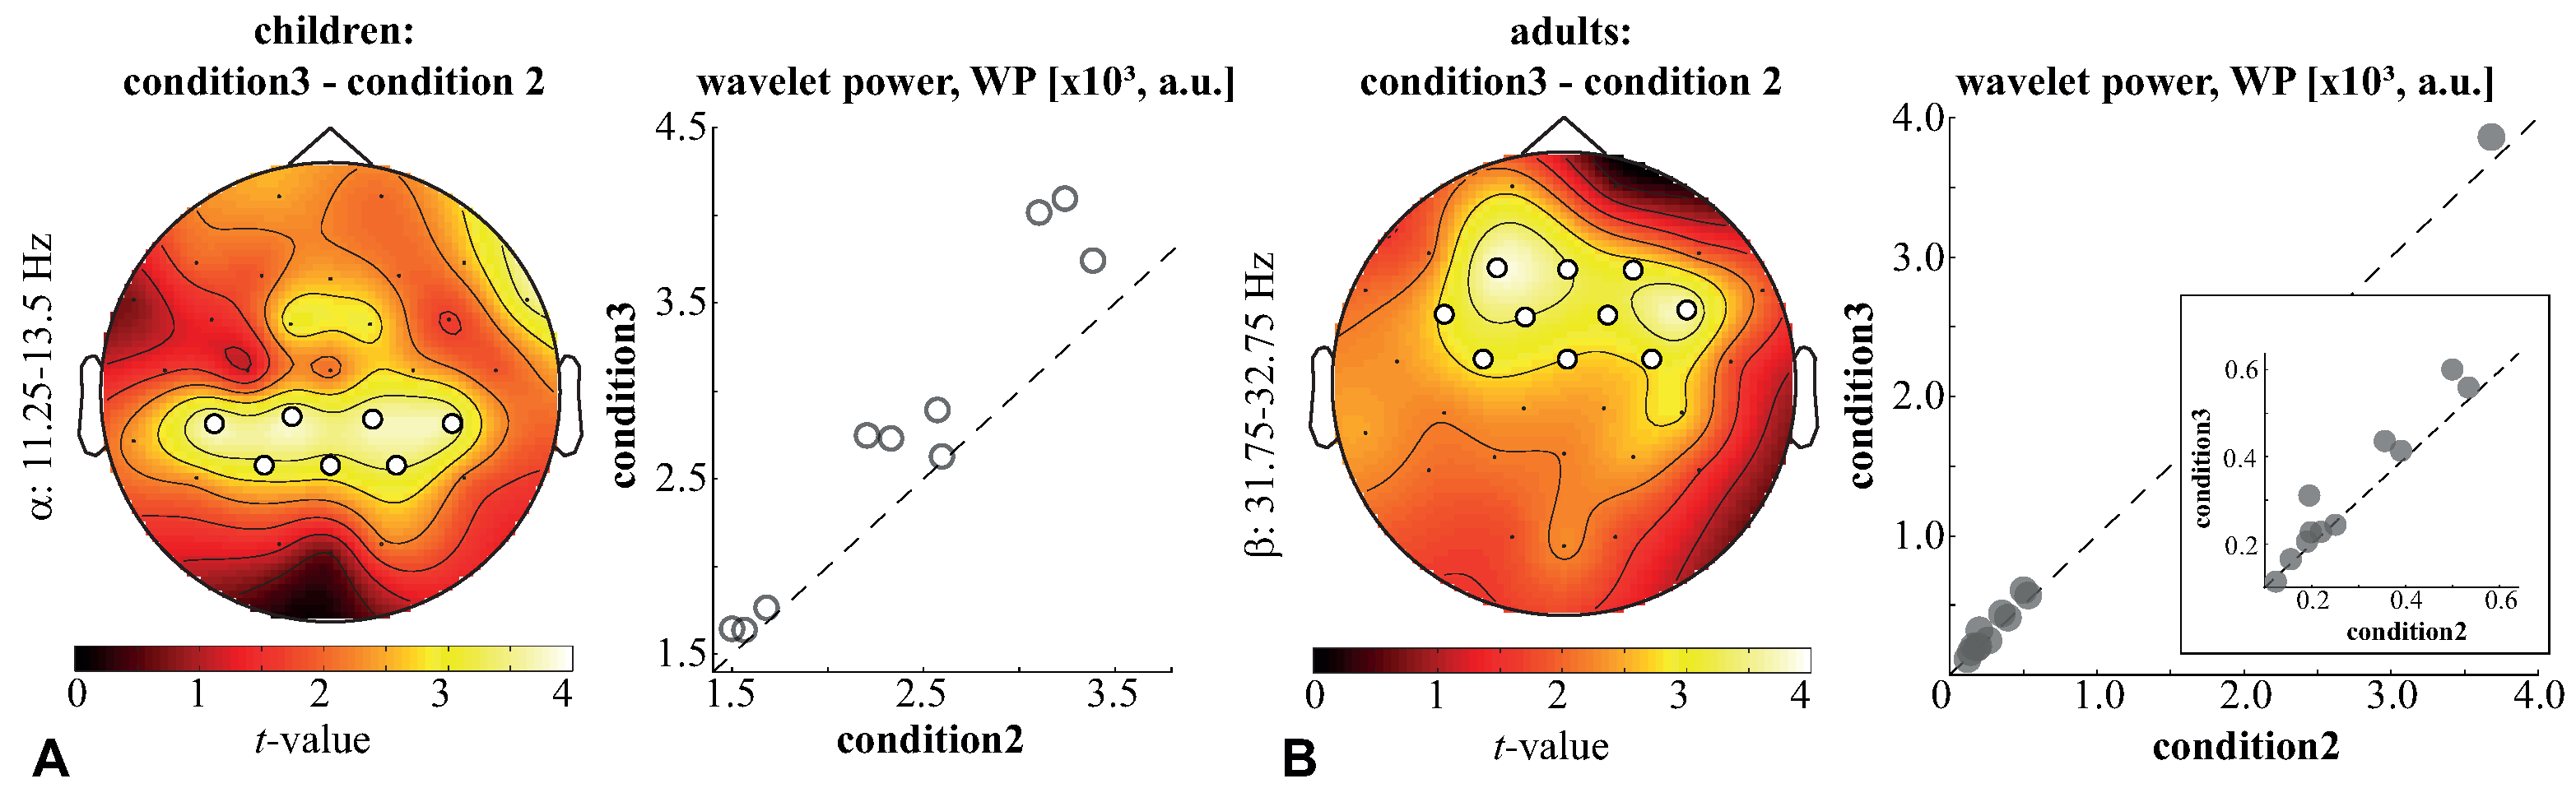
3.2. Brain Activity
4. Discussion
4.1. Behavioral Results
4.2. Results of EEG Analysis and Brain Activity
4.3. Educational Aspects
5. Conclusions
Author Contributions
Funding
Institutional Review Board Statement
Informed Consent Statement
Data Availability Statement
Conflicts of Interest
Abbreviations
| EEG | Electroencephalogram |
| ANOVA | Analysis of variance |
| ST | Schulte table |
| RT | Response time |
| ZVT | Zahlen–Verbindungs-test |
| SD | Standard deviation |
| SE | Standard error |
| ICA | Independent component analysis |
| WP | Wavelet power |
| NWP | Normalized wavelet power |
| ERD | Event-related desynchronization |
| fMRI | Functional magnetic resonance imaging |
| IPS | Intraparietal sulcus |
| SPL | Superior parietal lobule |
| AG | Angular gyrus |
References
- Lenroot, R.K.; Giedd, J.N. Brain development in children and adolescents: Insights from anatomical magnetic resonance imaging. Neurosci. Biobehav. Rev. 2006, 30, 718–729. [Google Scholar] [CrossRef]
- Blakemore, S.J. Imaging brain development: The adolescent brain. Neuroimage 2012, 61, 397–406. [Google Scholar] [CrossRef] [PubMed]
- Fuhrmann, D.; Knoll, L.J.; Blakemore, S.J. Adolescence as a sensitive period of brain development. Trends Cogn. Sci. 2015, 19, 558–566. [Google Scholar] [CrossRef] [Green Version]
- Tamnes, C.K.; Østby, Y.; Fjell, A.M.; Westlye, L.T.; Due-Tønnessen, P.; Walhovd, K.B. Brain maturation in adolescence and young adulthood: Regional age-related changes in cortical thickness and white matter volume and microstructure. Cereb. Cortex 2010, 20, 534–548. [Google Scholar] [CrossRef] [PubMed] [Green Version]
- Tamnes, C.K.; Walhovd, K.B.; Dale, A.M.; Østby, Y.; Grydeland, H.; Richardson, G.; Westlye, L.T.; Roddey, J.C.; Hagler, D.J., Jr.; Due-Tønnessen, P.; et al. Brain development and aging: Overlapping and unique patterns of change. Neuroimage 2013, 68, 63–74. [Google Scholar] [CrossRef] [PubMed] [Green Version]
- Pfefferbaum, A.; Rohlfing, T.; Rosenbloom, M.J.; Chu, W.; Colrain, I.M.; Sullivan, E.V. Variation in longitudinal trajectories of regional brain volumes of healthy men and women (ages 10 to 85 years) measured with atlas-based parcellation of MRI. Neuroimage 2013, 65, 176–193. [Google Scholar] [CrossRef] [PubMed] [Green Version]
- Schmithorst, V.J.; Wilke, M.; Dardzinski, B.J.; Holland, S.K. Cognitive functions correlate with white matter architecture in a normal pediatric population: A diffusion tensor MRI study. Hum. Brain Mapp. 2005, 26, 139–147. [Google Scholar] [CrossRef] [PubMed] [Green Version]
- Tamnes, C.K.; Walhovd, K.B.; Grydeland, H.; Holland, D.; Østby, Y.; Dale, A.M.; Fjell, A.M. Longitudinal working memory development is related to structural maturation of frontal and parietal cortices. J. Cogn. Neurosci. 2013, 25, 1611–1623. [Google Scholar] [CrossRef] [Green Version]
- Mulder, H.; Pitchford, N.J.; Hagger, M.S.; Marlow, N. Development of executive function and attention in preterm children: A systematic review. Dev. Neuropsychol. 2009, 34, 393–421. [Google Scholar] [CrossRef]
- Squeglia, L.M.; Jacobus, J.; Sorg, S.F.; Jernigan, T.L.; Tapert, S.F. Early adolescent cortical thinning is related to better neuropsychological performance. J. Int. Neuropsychol. Soc. 2013, 19, 962–970. [Google Scholar] [CrossRef] [Green Version]
- Maksimenko, V.A.; Frolov, N.S.; Hramov, A.E.; Runnova, A.E.; Grubov, V.V.; Kurths, J.; Pisarchik, A.N. Neural Interactions in a Spatially-Distributed Cortical Network during Perceptual Decision-Making. Front. Behav. Neurosci. 2019, 13, 220. [Google Scholar] [CrossRef] [PubMed] [Green Version]
- Knudsen, E.I. Neural circuits that mediate selective attention: A comparative perspective. Trends Neurosci. 2018, 41, 789–805. [Google Scholar] [CrossRef] [PubMed]
- Konstantinou, N.; Beal, E.; King, J.R.; Lavie, N. Working memory load and distraction: Dissociable effects of visual maintenance and cognitive control. Atten. Percept. Psychophys. 2014, 76, 1985–1997. [Google Scholar] [CrossRef] [PubMed] [Green Version]
- Michel, C.M.; Murray, M.M. Towards the utilization of EEG as a brain imaging tool. Neuroimage 2012, 61, 371–385. [Google Scholar] [CrossRef] [PubMed]
- Xu, J.; Zhong, B. Review on portable EEG technology in educational research. Comput. Hum. Behav. 2018, 81, 340–349. [Google Scholar] [CrossRef]
- Kannathal, N.; Acharya, U.R.; Lim, C.M.; Sadasivan, P. Characterization of EEG—A comparative study. Comput. Methods Programs Biomed. 2005, 80, 17–23. [Google Scholar] [CrossRef]
- Hramov, A.E.; Maksimenko, V.A.; Pisarchik, A.N. Physical principles of brain–computer interfaces and their applications for rehabilitation, robotics and control of human brain states. Phys. Rep. 2021, 918, 1–133. [Google Scholar] [CrossRef]
- Jamil, N.; Belkacem, A.N.; Ouhbi, S.; Lakas, A. Noninvasive Electroencephalography Equipment for Assistive, Adaptive, and Rehabilitative Brain–Computer Interfaces: A Systematic Literature Review. Sensors 2021, 21, 4754. [Google Scholar] [CrossRef]
- Park, S.; Han, C.H.; Im, C.H. Design of wearable EEG devices specialized for passive brain–computer interface applications. Sensors 2020, 20, 4572. [Google Scholar] [CrossRef]
- Ashcraft, M.H.; Guillaume, M.M. Mathematical cognition and the problem size effect. Psychol. Learn. Motiv. 2009, 51, 121–151. [Google Scholar]
- Pauli, P.; Lutzenberger, W.; Rau, H.; Birbaumer, N.; Rickard, T.C.; Yaroush, R.A.; Bourne, L.E., Jr. Brain potentials during mental arithmetic: Effects of extensive practice and problem difficulty. Cogn. Brain Res. 1994, 2, 21–29. [Google Scholar] [CrossRef] [Green Version]
- Woods, A.J.; Göksun, T.; Chatterjee, A.; Zelonis, S.; Mehta, A.; Smith, S.E. The development of organized visual search. Acta Psychol. 2013, 143, 191–199. [Google Scholar] [CrossRef] [PubMed] [Green Version]
- Donnelly, N.; Cave, K.; Greenway, R.; Hadwin, J.A.; Stevenson, J.; Sonuga-Barke, E. Visual search in children and adults: Top-down and bottom-up mechanisms. Q. J. Exp. Psychol. 2007, 60, 120–136. [Google Scholar] [CrossRef] [PubMed]
- Luna, B.; Garver, K.E.; Urban, T.A.; Lazar, N.A.; Sweeney, J.A. Maturation of cognitive processes from late childhood to adulthood. Child Dev. 2004, 75, 1357–1372. [Google Scholar] [CrossRef] [PubMed]
- Olesen, P.J.; Macoveanu, J.; Tegnér, J.; Klingberg, T. Brain activity related to working memory and distraction in children and adults. Cereb. Cortex 2007, 17, 1047–1054. [Google Scholar] [CrossRef] [PubMed] [Green Version]
- Kawashima, R.; Taira, M.; Okita, K.; Inoue, K.; Tajima, N.; Yoshida, H.; Sasaki, T.; Sugiura, M.; Watanabe, J.; Fukuda, H. A functional MRI study of simple arithmetic—A comparison between children and adults. Cogn. Brain Res. 2004, 18, 227–233. [Google Scholar] [CrossRef]
- Campbell, J.I. What Everyone Finds: The Problem-Size Effect. In The Handbook of Mathematical Cognition; Psychology Press: New York, NY, USA, 2005; pp. 349–364. [Google Scholar]
- Rivera, S.M.; Reiss, A.; Eckert, M.A.; Menon, V. Developmental changes in mental arithmetic: Evidence for increased functional specialization in the left inferior parietal cortex. Cereb. Cortex 2005, 15, 1779–1790. [Google Scholar] [CrossRef]
- De Smedt, B.; Holloway, I.D.; Ansari, D. Effects of problem size and arithmetic operation on brain activation during calculation in children with varying levels of arithmetical fluency. Neuroimage 2011, 57, 771–781. [Google Scholar] [CrossRef] [PubMed]
- DeStefano, D.; LeFevre, J.A. The role of working memory in mental arithmetic. Eur. J. Cogn. Psychol. 2004, 16, 353–386. [Google Scholar] [CrossRef]
- Adams, J.W.; Hitch, G.J. Working memory and children’s mental addition. J. Exp. Child Psychol. 1997, 67, 21–38. [Google Scholar] [CrossRef] [Green Version]
- Butkevičiūtė, E.; Bikulčienė, L.; Sidekerskienė, T.; Blažauskas, T.; Maskeliūnas, R.; Damaševičius, R.; Wei, W. Removal of movement artefact for mobile EEG analysis in sports exercises. IEEE Access 2019, 7, 7206–7217. [Google Scholar] [CrossRef]
- Hramov, A.E.; Koronovskii, A.A.; Makarov, V.A.; Maksimenko, V.A.; Pavlov, A.N.; Sitnikova, E. Wavelets in Neuroscience, 2nd ed.; Springer: Berlin/Heidelberg, Germany, 2021. [Google Scholar]
- Oostenveld, R.; Fries, P.; Maris, E.; Schoffelen, J.M. FieldTrip: Open source software for advanced analysis of MEG, EEG, and invasive electrophysiological data. Comput. Intell. Neurosci. 2011, 2011, 156869. [Google Scholar] [CrossRef]
- Maris, E.; Oostenveld, R. Nonparametric statistical testing of EEG-and MEG-data. J. Neurosci. Methods 2007, 164, 177–190. [Google Scholar] [CrossRef]
- Maksimenko, V.; Kuc, A.; Frolov, N.; Kurkin, S.; Hramov, A. Effect of repetition on the behavioral and neuronal responses to ambiguous Necker cube images. Sci. Rep. 2021, 11, 3454. [Google Scholar] [CrossRef]
- Horowitz, T.S.; Wolfe, J.M. Visual search has no memory. Nature 1998, 394, 575–577. [Google Scholar] [CrossRef] [PubMed]
- Campbell, J.I.; Xue, Q. Cognitive arithmetic across cultures. J. Exp. Psychol. Gen. 2001, 130, 299. [Google Scholar] [CrossRef] [PubMed]
- LeFevre, J.A.; Sadesky, G.S.; Bisanz, J. Selection of procedures in mental addition: Reassessing the problem size effect in adults. J. Exp. Psychol. Learn. Mem. Cogn. 1996, 22, 216. [Google Scholar] [CrossRef]
- Hinault, T.; Lemaire, P. What does EEG tell us about arithmetic strategies? A review. Int. J. Psychophysiol. 2016, 106, 115–126. [Google Scholar] [CrossRef]
- Grabner, R.H.; De Smedt, B. Neurophysiological evidence for the validity of verbal strategy reports in mental arithmetic. Biol. Psychol. 2011, 87, 128–136. [Google Scholar] [CrossRef] [PubMed]
- Grabner, R.H.; De Smedt, B. Oscillatory EEG correlates of arithmetic strategies: A training study. Front. Psychol. 2012, 3, 428. [Google Scholar] [CrossRef] [Green Version]
- Soltanlou, M.; Artemenko, C.; Ehlis, A.C.; Huber, S.; Fallgatter, A.J.; Dresler, T.; Nuerk, H.C. Reduction but no shift in brain activation after arithmetic learning in children: A simultaneous fNIRS-EEG study. Sci. Rep. 2018, 8, 1707. [Google Scholar] [CrossRef] [PubMed] [Green Version]
- De Smedt, B.; Grabner, R.H.; Studer, B. Oscillatory EEG correlates of arithmetic strategy use in addition and subtraction. Exp. Brain Res. 2009, 195, 635–642. [Google Scholar] [CrossRef] [PubMed]
- Stoll, F.M.; Wilson, C.R.; Faraut, M.C.; Vezoli, J.; Knoblauch, K.; Procyk, E. The effects of cognitive control and time on frontal beta oscillations. Cereb. Cortex 2016, 26, 1715–1732. [Google Scholar] [CrossRef] [PubMed] [Green Version]
- Lee, J.H.; Whittington, M.A.; Kopell, N.J. Top-down beta rhythms support selective attention via interlaminar interaction: A model. PLoS Comput. Biol. 2013, 9, e1003164. [Google Scholar] [CrossRef] [Green Version]
- Matejko, A.A.; Ansari, D. The neural association between arithmetic and basic numerical processing depends on arithmetic problem size and not chronological age. Dev. Cogn. Neurosci. 2019, 37, 100653. [Google Scholar] [CrossRef]
- Halberda, J.; Ly, R.; Wilmer, J.B.; Naiman, D.Q.; Germine, L. Number sense across the lifespan as revealed by a massive Internet-based sample. Proc. Natl. Acad. Sci. USA 2012, 109, 11116–11120. [Google Scholar] [CrossRef] [PubMed] [Green Version]
- Gilmore, C.K.; McCarthy, S.E.; Spelke, E.S. Symbolic arithmetic knowledge without instruction. Nature 2007, 447, 589–591. [Google Scholar] [CrossRef] [Green Version]
- Geary, D.C. From infancy to adulthood: The development of numerical abilities. Eur. Child Adolesc. Psychiatry 2000, 9, S11–S16. [Google Scholar] [CrossRef]
- Zander, T.O.; Kothe, C. Towards passive brain–computer interfaces: Applying brain–computer interface technology to human–machine systems in general. J. Neural Eng. 2011, 8, 025005. [Google Scholar] [CrossRef]


Publisher’s Note: MDPI stays neutral with regard to jurisdictional claims in published maps and institutional affiliations. |
© 2021 by the authors. Licensee MDPI, Basel, Switzerland. This article is an open access article distributed under the terms and conditions of the Creative Commons Attribution (CC BY) license (https://creativecommons.org/licenses/by/4.0/).
Share and Cite
Khramova, M.V.; Kuc, A.K.; Maksimenko, V.A.; Frolov, N.S.; Grubov, V.V.; Kurkin, S.A.; Pisarchik, A.N.; Shusharina, N.N.; Fedorov, A.A.; Hramov, A.E. Monitoring the Cortical Activity of Children and Adults during Cognitive Task Completion. Sensors 2021, 21, 6021. https://0-doi-org.brum.beds.ac.uk/10.3390/s21186021
Khramova MV, Kuc AK, Maksimenko VA, Frolov NS, Grubov VV, Kurkin SA, Pisarchik AN, Shusharina NN, Fedorov AA, Hramov AE. Monitoring the Cortical Activity of Children and Adults during Cognitive Task Completion. Sensors. 2021; 21(18):6021. https://0-doi-org.brum.beds.ac.uk/10.3390/s21186021
Chicago/Turabian StyleKhramova, Marina V., Alexander K. Kuc, Vladimir A. Maksimenko, Nikita S. Frolov, Vadim V. Grubov, Semen A. Kurkin, Alexander N. Pisarchik, Natalia N. Shusharina, Alexander A. Fedorov, and Alexander E. Hramov. 2021. "Monitoring the Cortical Activity of Children and Adults during Cognitive Task Completion" Sensors 21, no. 18: 6021. https://0-doi-org.brum.beds.ac.uk/10.3390/s21186021