
Toward the Development of Combined Artificial Sensing Systems for Food Quality Evaluation: A Review on the Application of Data Fusion of Electronic Noses, Electronic Tongues and Electronic Eyes


Abstract
:1. Introduction
2. Artificial Sensors
2.1. Electronic Nose
2.2. Electronic Tongue
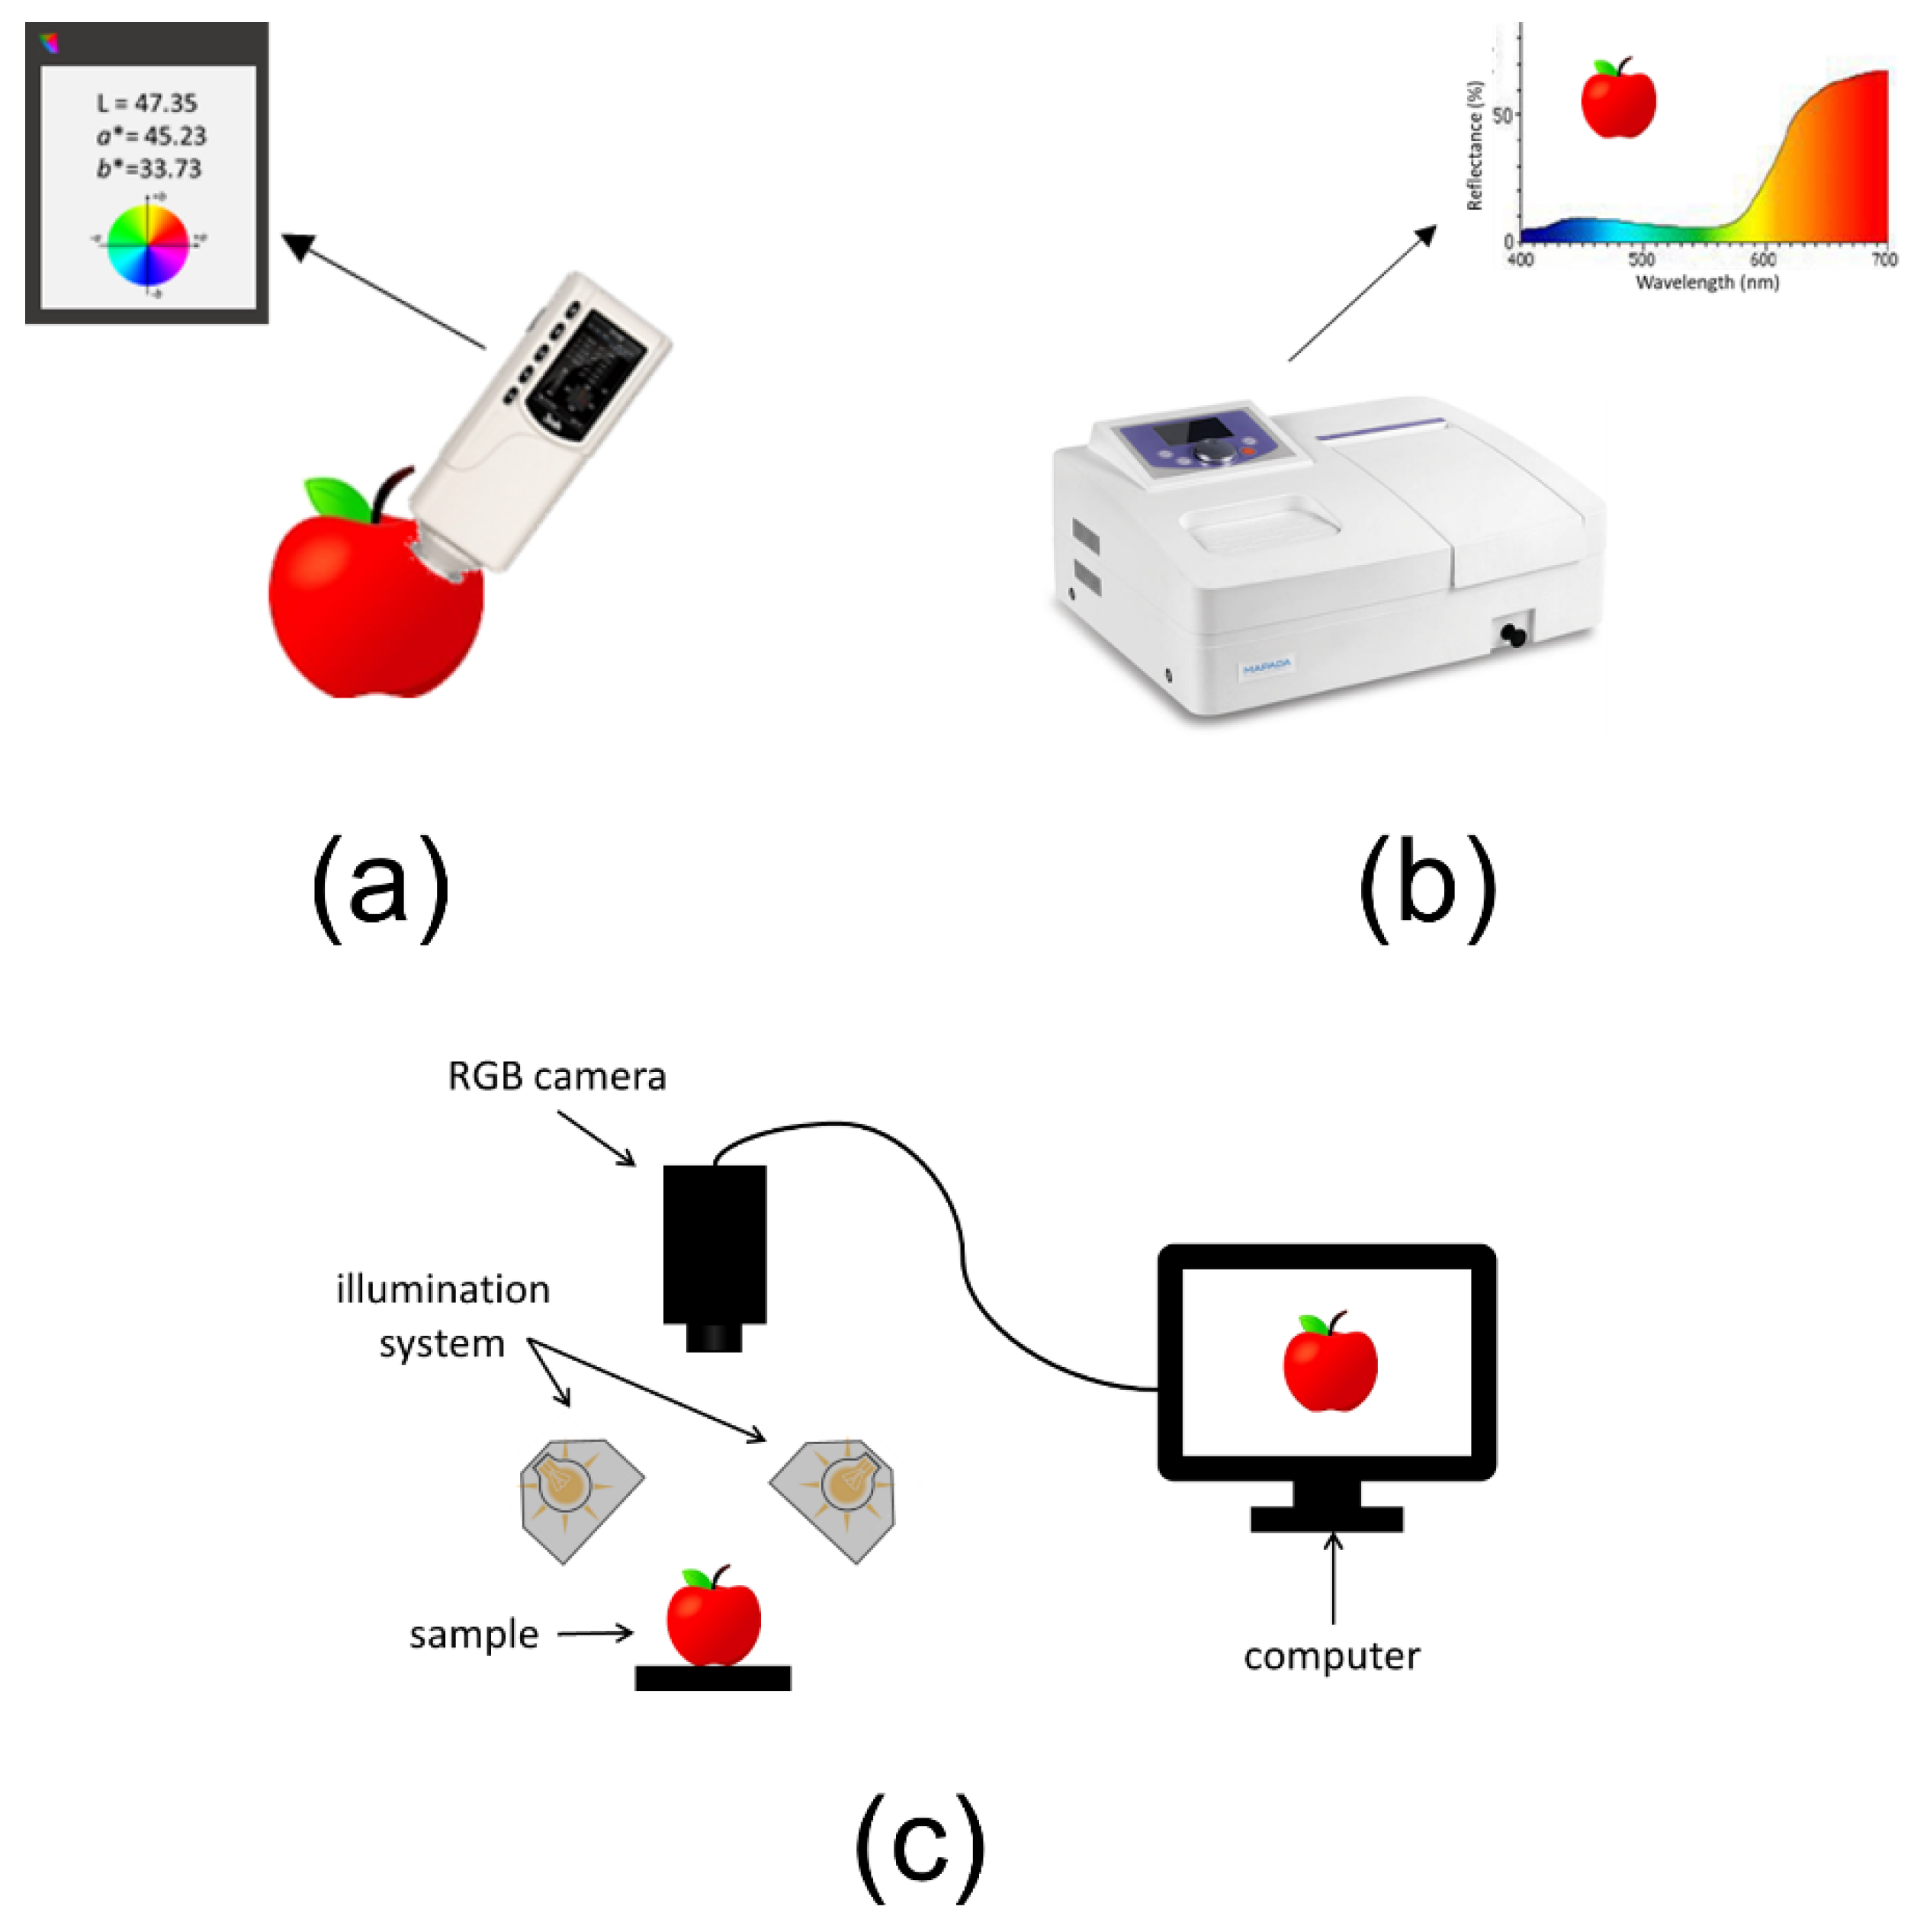
2.3. Electronic Eye
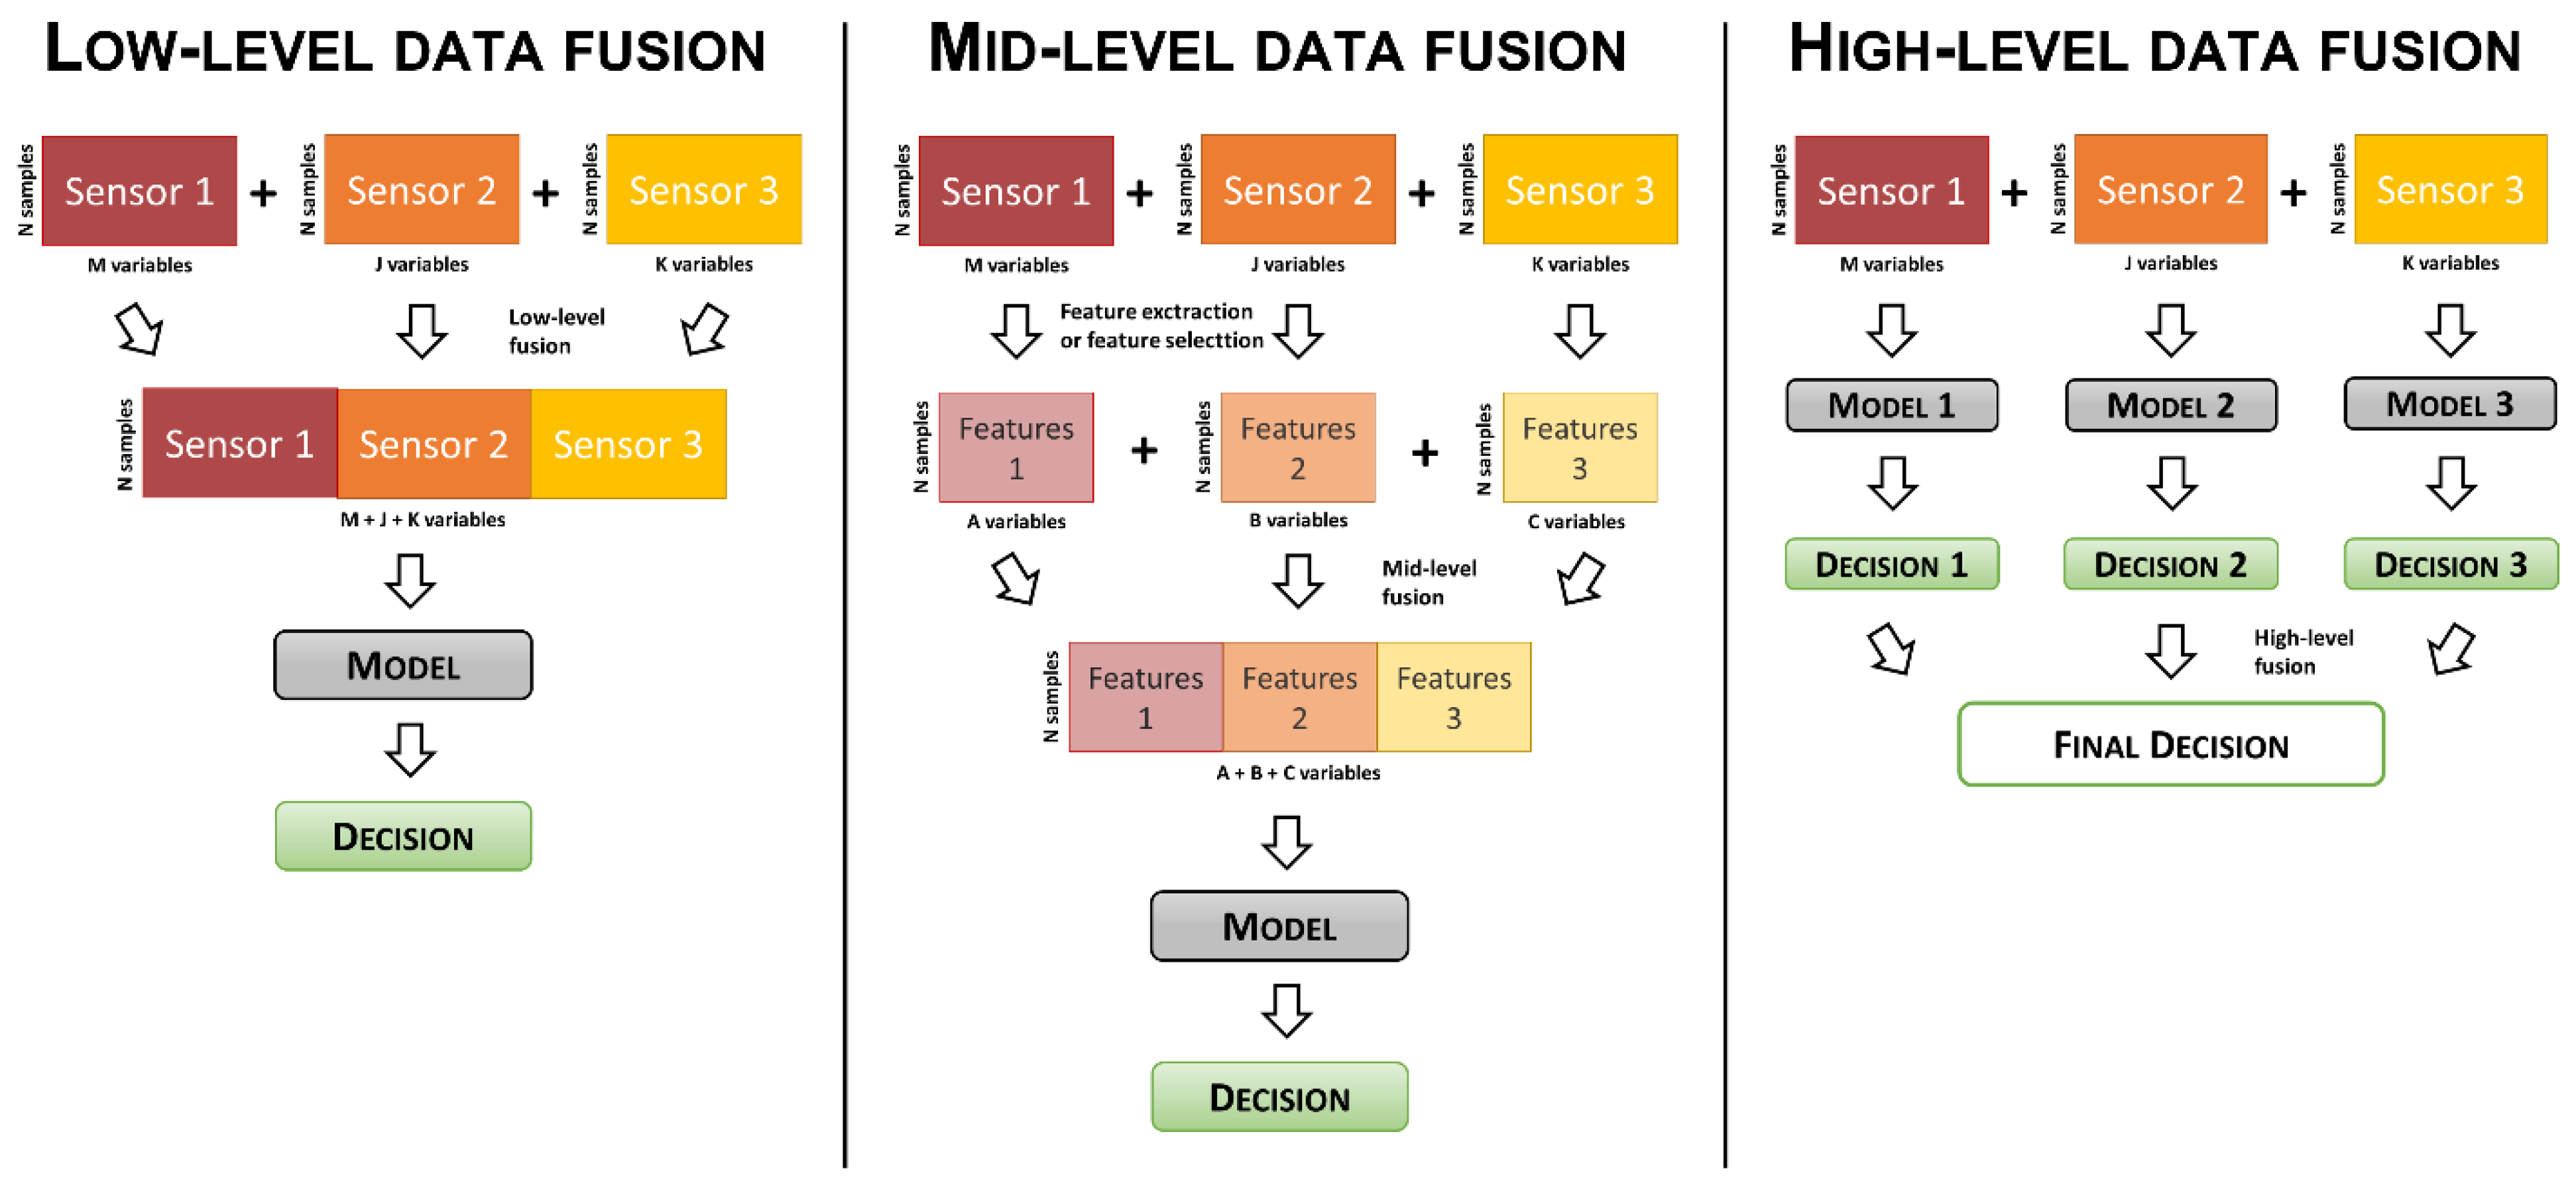
3. Data Fusion
3.1. Low-Level Data Fusion
3.2. Mid-Level DATA Fusion
3.3. High-Level Data Fusion
4. Applications
4.1. EN + ET
4.2. EN + EE
4.3. ET + EE
4.4. ET + EN + EE
5. Conclusions
Author Contributions
Funding
Institutional Review Board Statement
Informed Consent Statement
Data Availability Statement
Conflicts of Interest
References
- Borràs, E.; Ferré, J.; Boqué, R.; Mestres, M.; Aceña, L.; Busto, O. Data Fusion Methodologies for Food and Beverage Authentication and Quality Assessment—A Review. Anal. Chim. Acta 2015, 891, 1–14. [Google Scholar] [CrossRef] [PubMed]
- Gutiérrez, J.; Horrillo, M.C. Advances in Artificial Olfaction: Sensors and Applications. Talanta 2014, 124, 95–105. [Google Scholar] [CrossRef] [PubMed]
- Loutfi, A.; Coradeschi, S.; Mani, G.K.; Shankar, P.; Rayappan, J.B.B. Electronic Noses for Food Quality: A Review. J. Food Eng. 2015, 144, 103–111. [Google Scholar] [CrossRef]
- Escuder-Gilabert, L.; Peris, M. Review: Highlights in Recent Applications of Electronic Tongues in Food Analysis. Anal. Chim. Acta 2010, 665, 15–25. [Google Scholar] [CrossRef]
- Tahara, Y.; Toko, K. Electronic Tongues-a Review. IEEE Sens. J. 2013, 13, 3001–3011. [Google Scholar] [CrossRef]
- Jackman, P.; Sun, D.-W. Recent Advances in Image Processing Using Image Texture Features for Food Quality Assessment. Trends Food Sci. Technol. 2013, 29, 35–43. [Google Scholar] [CrossRef]
- Wu, D.; Sun, D.-W. Colour Measurements by Computer Vision for Food Quality Control—A Review. Trends Food Sci. Technol. 2013, 29, 5–20. [Google Scholar] [CrossRef]
- Krantz-Rülcker, C.; Stenberg, M.; Winquist, F.; Lundström, I. Electronic Tongues for Environmental Monitoring Based on Sensor Arrays and Pattern Recognition: A Review. Anal. Chim. Acta 2001, 426, 217–226. [Google Scholar] [CrossRef]
- Deisingh, A.K.; Stone, D.C.; Thompson, M. Applications of Electronic Noses and Tongues in Food Analysis. Int. J. Food Sci. Technol. 2004, 39, 587–604. [Google Scholar] [CrossRef]
- Patel, H.K.; Kunpara, M.J. Electronic Nose Sensor Response and Qualitative Review of E-Nose Sensors. In Proceedings of the 2011 Nirma University International Conference on Engineering: Current Trends in Technology, NUiCONE 2011, Ahmedabad, India, 8–10 December 2011. [Google Scholar]
- Fitzgerald, J.E.; Bui, E.T.H.; Simon, N.M.; Fenniri, H. Artificial Nose Technology: Status and Prospects in Diagnostics. Trends Biotechnol. 2017, 35, 33–42. [Google Scholar] [CrossRef] [PubMed]
- Pathare, P.B.; Opara, U.L.; Al-Said, F.A.-J. Colour Measurement and Analysis in Fresh and Processed Foods: A Review. Food Bioprocess Technol. 2013, 6, 36–60. [Google Scholar] [CrossRef]
- Zhang, J.; Li, L.; Gao, N.; Wang, D.; Gao, Q.; Jiang, S. Feature Extraction and Selection from Volatile Compounds for Analytical Classification of Chinese Red Wines from Different Varieties. Anal. Chim. Acta 2010, 662, 137–142. [Google Scholar] [CrossRef]
- Pizarro, C.; Rodríguez-Tecedor, S.; Pérez-del-Notario, N.; González-Sáiz, J.M. Recognition of Volatile Compounds as Markers in Geographical Discrimination of Spanish Extra Virgin Olive Oils by Chemometric Analysis of Non-Specific Chromatography Volatile Profiles. J. Chromatogr. A 2011, 1218, 518–523. [Google Scholar] [CrossRef]
- Pacioni, G.; Cerretani, L.; Procida, G.; Cichelli, A. Composition of Commercial Truffle Flavored Oils with GC-MS Analysis and Discrimination with an Electronic Nose. Food Chem. 2014, 146, 30–35. [Google Scholar] [CrossRef] [PubMed]
- Kiani, S.; Minaei, S.; Ghasemi-Varnamkhasti, M. Fusion of Artificial Senses as a Robust Approach to Food Quality Assessment. J. Food Eng. 2016, 171, 230–239. [Google Scholar] [CrossRef]
- di Rosa, A.R.; Leone, F.; Cheli, F.; Chiofalo, V. Fusion of Electronic Nose, Electronic Tongue and Computer Vision for Animal Source Food Authentication and Quality Assessment—A Review. J. Food Eng. 2017, 210, 62–75. [Google Scholar] [CrossRef]
- Silvestri, M.; Elia, A.; Bertelli, D.; Salvatore, E.; Durante, C.; Li Vigni, M.; Marchetti, A.; Cocchi, M. A Mid Level Data Fusion Strategy for the Varietal Classification of Lambrusco PDO Wines. Chemom. Intell. Lab. Syst. 2014, 137, 181–189. [Google Scholar] [CrossRef] [Green Version]
- Casale, M.; Casolino, C.; Oliveri, P.; Forina, M. The Potential of Coupling Information Using Three Analytical Techniques for Identifying the Geographical Origin of Liguria Extra Virgin Olive Oil. Food Chem. 2010, 118, 163–170. [Google Scholar] [CrossRef]
- Calvini, R.; Foca, G.; Ulrici, A. Data Dimensionality Reduction and Data Fusion for Fast Characterization of Green Coffee Samples Using Hyperspectral Sensors. Anal. Bioanal. Chem. 2016, 408, 7351–7366. [Google Scholar] [CrossRef]
- Forshed, J.; Idborg, H.; Jacobsson, S.P. Evaluation of Different Techniques for Data Fusion of LC/MS and 1H-NMR. Chemom. Intell. Lab. Syst. 2007, 85, 102–109. [Google Scholar] [CrossRef]
- Banerjee, R.; Chattopadhyay, P.; Tudu, B.; Bhattacharyya, N.; Bandyopadhyay, R. Artificial Flavor Perception of Black Tea Using Fusion of Electronic Nose and Tongue Response: A Bayesian Statistical Approach. J. Food Eng. 2014, 142, 87–93. [Google Scholar] [CrossRef]
- Haddi, Z.; Alami, H.; el Bari, N.; Tounsi, M.; Barhoumi, H.; Maaref, A.; Jaffrezic-Renault, N.; Bouchikhi, B. Electronic Nose and Tongue Combination for Improved Classification of Moroccan Virgin Olive Oil Profiles. Food Res. Int. 2013, 54, 1488–1498. [Google Scholar] [CrossRef]
- Peris, M.; Escuder-Gilabert, L. On-Line Monitoring of Food Fermentation Processes Using Electronic Noses and Electronic Tongues: A Review. Anal. Chim. Acta 2013, 804, 29–36. [Google Scholar] [CrossRef] [PubMed]
- Rodríguez-Méndez, M.L.; de Saja, J.A.; González-Antón, R.; García-Hernández, C.; Medina-Plaza, C.; García-Cabezón, C.; Martín-Pedrosa, F. Electronic Noses and Tongues in Wine Industry. Front. Bioeng. Biotechnol. 2016, 4, 1–12. [Google Scholar] [CrossRef] [PubMed] [Green Version]
- Baldwin, E.A.; Bai, J.; Plotto, A.; Dea, S. Electronic Noses and Tongues: Applications for the Food and Pharmaceutical Industries. Sensors 2011, 11, 4744–4766. [Google Scholar] [CrossRef]
- Rudnitskaya, A.; Legin, A. Using Electronic Tongues and Noses to Assess Food. CAB Rev. Perspect. Agric. Vet. Sci. Nutr. Nat. Resour. 2010, 5, 1–20. [Google Scholar] [CrossRef]
- Apetrei, C.; Apetrei, I.M.; Villanueva, S.; de Saja, J.A.; Gutierrez-Rosales, F.; Rodriguez-Mendez, M.L. Combination of an E-Nose, an e-Tongue and an e-Eye for the Characterisation of Olive Oils with Different Degree of Bitterness. Anal. Chim. Acta 2010, 663, 91–97. [Google Scholar] [CrossRef]
- Ouyang, Q.; Zhao, J.; Chen, Q. Instrumental Intelligent Test of Food Sensory Quality as Mimic of Human Panel Test Combining Multiple Cross-Perception Sensors and Data Fusion. Anal. Chim. Acta 2014, 841, 68–76. [Google Scholar] [CrossRef]
- Buratti, S.; Malegori, C.; Benedetti, S.; Oliveri, P.; Giovanelli, G. E-Nose, e-Tongue and e-Eye for Edible Olive Oil Characterization and Shelf Life Assessment: A Powerful Data Fusion Approach. Talanta 2018, 182, 131–141. [Google Scholar] [CrossRef]
- Gardner, P.N.; Bartlett, J.W. Electronic Noses. Principles and Applications. Meas. Sci. Technol. 2000, 11, 1087. [Google Scholar] [CrossRef]
- Jeong, S.-Y.; Kim, J.-S.; Lee, J.-H. Rational Design of Semiconductor-Based Chemiresistors and Their Libraries for Next-Generation Artificial Olfaction. Adv. Mater. 2020, 32, 2002075. [Google Scholar] [CrossRef] [PubMed]
- Chang, Y.-P.; Liu, W.-C.; Tseng, M.-C.; Chu, Y.-H. Ionic Liquids Tailored for Reaction-Based Gas Sensing on Quartz Crystal Microbalance. Rev. Anal. Chem. 2015, 34, 77–86. [Google Scholar] [CrossRef]
- James, D.; Scott, S.M.; Ali, Z.; O’Hare, W.T. Chemical Sensors for Electronic Nose Systems. Microchim. Acta 2005, 149, 1–17. [Google Scholar] [CrossRef]
- Karakaya, D.; Ulucan, O.; Turkan, M. Electronic Nose and Its Applications: A Survey. Int. J. Autom. Comput. 2020, 17, 179–209. [Google Scholar] [CrossRef] [Green Version]
- Wilson, A.D.; Baietto, M. Applications and Advances in Electronic-Nose Technologies. Sensors 2009, 9, 5099–5148. [Google Scholar] [CrossRef]
- Peris, M.; Escuder-Gilabert, L. A 21st Century Technique for Food Control: Electronic Noses. Anal. Chim. Acta 2009, 638, 1–15. [Google Scholar] [CrossRef]
- Majchrzak, T.; Wojnowski, W.; Dymerski, T.; Gębicki, J.; Namieśnik, J. Electronic Noses in Classification and Quality Control of Edible Oils: A Review. Food Chem. 2018, 246, 192–201. [Google Scholar] [CrossRef] [PubMed]
- Shi, H.; Zhang, M.; Adhikari, B. Advances of Electronic Nose and Its Application in Fresh Foods: A Review. Crit. Rev. Food Sci. Nutr. 2018, 58, 2700–2710. [Google Scholar] [CrossRef]
- Sanaeifar, A.; ZakiDizaji, H.; Jafari, A.; Guardia, M.D.L. Early Detection of Contamination and Defect in Foodstuffs by Electronic Nose: A Review. TrAC Trends Anal. Chem. 2017, 97, 257–271. [Google Scholar] [CrossRef]
- Legin, A.; Rudnitskaya, A.; Vlasov, Y. Electronic Tongues: Sensors, Systems, Applications. Sens. Update 2002, 10, 143–188. [Google Scholar] [CrossRef]
- Toko, K. Electronic Sensing of Tastes. Electroanalysis 1998, 10, 657–669. [Google Scholar] [CrossRef]
- Ciosek, P.; Wróblewski, W. Sensor Arrays for Liquid Sensing—Electronic Tongue Systems. Analyst 2007, 132, 963–978. [Google Scholar] [CrossRef]
- del Valle, M. Electronic Tongues Employing Electrochemical Sensors. Electroanalysis 2010, 22, 1539–1555. [Google Scholar] [CrossRef] [Green Version]
- Legin, A.; Rudnitskaya, A.; Vlasov, Y.; di Natale, C.; Mazzone, E.; D’Amico, A. Application of Electronic Tongue for Qualitative and Quantitative Analysis of Complex Liquid Media. Sens. Actuators B Chem. 2000, 65, 232–234. [Google Scholar] [CrossRef]
- Cortina, M.; Gutés, A.; Alegret, S.; del Valle, M. Sequential Injection System with Higher Dimensional Electrochemical Sensor Signals: Part 2. Potentiometric e-Tongue for the Determination of Alkaline Ions. Talanta 2005, 66, 1197–1206. [Google Scholar] [CrossRef]
- Ciosek, P.; Brzózka, Z.; Wróblewski, W. Classification of Beverages Using a Reduced Sensor Array. Sens. Actuators B Chem. 2004, 103, 76–83. [Google Scholar] [CrossRef]
- Podrażka, M.; Bączyńska, E.; Kundys, M.; Jeleń, P.S.; Witkowska Nery, E. Electronic Tongue—A Tool for All Tastes? Biosensors 2018, 8, 3. [Google Scholar] [CrossRef] [Green Version]
- Jiang, H.; Zhang, M.; Bhandari, B.; Adhikari, B. Application of Electronic Tongue for Fresh Foods Quality Evaluation: A Review. Food Rev. Int. 2018, 34, 746–769. [Google Scholar] [CrossRef]
- Pérez-Ràfols, C.; Serrano, N.; Ariño, C.; Esteban, M.; Díaz-Cruz, J.M. Voltammetric Electronic Tongues in Food Analysis. Sensors 2019, 19, 4261. [Google Scholar] [CrossRef] [Green Version]
- Śliwińska, M.; Wiśniewska, P.; Dymerski, T.; Namieśnik, J.; Wardencki, W. Food Analysis Using Artificial Senses. J. Agric. Food Chem. 2014, 62, 1423–1448. [Google Scholar] [CrossRef]
- Brosnan, T.; Sun, D.-W. Improving Quality Inspection of Food Products by Computer Vision—A Review. J. Food Eng. 2004, 61, 3–16. [Google Scholar] [CrossRef]
- Du, C.J.; Sun, D.W. Learning Techniques Used in Computer Vision for Food Quality Evaluation: A Review. J. Food Eng. 2006, 72, 39–55. [Google Scholar] [CrossRef]
- Pagnin, L.; Calvini, R.; Wiesinger, R.; Weber, J.; Schreiner, M. Photodegradation Kinetics of Alkyd Paints: The Influence of Varying Amounts of Inorganic Pigments on the Stability of the Synthetic Binder. Front. Mater. 2020, 7. [Google Scholar] [CrossRef]
- Valous, N.A.; Mendoza, F.; Sun, D.-W.; Allen, P. Colour Calibration of a Laboratory Computer Vision System for Quality Evaluation of Pre-Sliced Hams. Meat Sci. 2009, 81, 132–141. [Google Scholar] [CrossRef]
- Larraín, R.E.; Schaefer, D.M.; Reed, J.D. Use of Digital Images to Estimate CIE Color Coordinates of Beef. Food Res. Int. 2008, 41, 380–385. [Google Scholar] [CrossRef]
- Gonçalves Dias Diniz, P.H. Chemometrics-Assisted Color Histogram-Based Analytical Systems. J. Chemom. 2020, 34. [Google Scholar] [CrossRef]
- Calvini, R.; Orlandi, G.; Foca, G.; Ulrici, A. Colourgrams GUI: A Graphical User-Friendly Interface for the Analysis of Large Datasets of RGB Images. Chemom. Intell. Lab. Syst. 2020, 196, 103915–103926. [Google Scholar] [CrossRef]
- Savitzky, A.; Golay, M.J.E. Smoothing and Differentiation of Data by Simplified Least Squares Procedures. Anal. Chem. 1964, 36, 1627–1639. [Google Scholar] [CrossRef]
- Oliveri, P.; Malegori, C.; Simonetti, R.; Casale, M. The Impact of Signal Pre-Processing on the Final Interpretation of Analytical Outcomes—A Tutorial. Anal. Chim. Acta 2019, 1058, 9–17. [Google Scholar] [CrossRef] [PubMed]
- Barnes, R.J.; Dhanoa, M.S.; Lister, S.J. Standard Normal Variate Transformation and De-Trending of near-Infrared Diffuse Reflectance Spectra. Appl. Spectrosc. 1989, 43, 772–777. [Google Scholar] [CrossRef]
- Kohler, A.; Zimonja, M.; Segtnan, V.; Martens, H. Standard Normal Variate, Multiplicative Signal Correction and Extended Multiplicative Signal Correction Preprocessing in Biospectroscopy. In Comprehensive Chemometrics; Elsevier: Amsterdam, The Netherlands, 2009; Volume 2, pp. 139–162. [Google Scholar]
- Mehmood, T.; Liland, K.H.; Snipen, L.; Sæbø, S. A Review of Variable Selection Methods in Partial Least Squares Regression. Chemom. Intell. Lab. Syst. 2012, 118, 62–69. [Google Scholar] [CrossRef]
- Osborne, S.D.; Jordan, R.B.; Künnemeyer, R. Method of Wavelength Selection for Partial Least Squares. Analyst 1997, 122, 1531–1537. [Google Scholar] [CrossRef]
- Chong, I.-G.; Jun, C.-H. Performance of Some Variable Selection Methods When Multicollinearity Is Present. Chemom. Intell. Lab. Syst. 2005, 78, 103–112. [Google Scholar] [CrossRef]
- Prieto, N.; Oliveri, P.; Leardi, R.; Gay, M.; Apetrei, C.; Rodriguez-Méndez, M.L.; de Saja, J.A. Application of a GA-PLS Strategy for Variable Reduction of Electronic Tongue Signals. Sens. Actuators B Chem. 2013, 183, 52–57. [Google Scholar] [CrossRef]
- Nørgaard, L.; Saudland, A.; Wagner, J.; Nielsen, J.P.; Munck, L.; Engelsen, S.B. Interval Partial Least-Squares Regression (IPLS): A Comparative Chemometric Study with an Example from near-Infrared Spectroscopy. Appl. Spectrosc. 2000, 54, 413–419. [Google Scholar] [CrossRef]
- Calvini, R.; Ulrici, A.; Amigo, J.M. Practical Comparison of Sparse Methods for Classification of Arabica and Robusta Coffee Species Using near Infrared Hyperspectral Imaging. Chemom. Intell. Lab. Syst. 2015, 146, 503–511. [Google Scholar] [CrossRef] [Green Version]
- Kuncheva, L.I. Combining Pattern Classifiers: Methods and Algorithms, 2nd ed.; John Wiley & Sons, Inc.: Hoboken, NJ, USA, 2014; Volume 9781118315, ISBN 9781118914564. [Google Scholar]
- Roussel, S.; Bellon-Maurel, V.; Roger, J.-M.; Grenier, P. Fusion of Aroma, FT-IR and UV Sensor Data Based on the Bayesian Inference. Application to the Discrimination of White Grape Varieties. Chemom. Intell. Lab. Syst. 2003, 65, 209–219. [Google Scholar] [CrossRef]
- Shafer, G. A Mathematical Theory of Evidence; Princeton University Press: Princeton, NJ, USA, 2021; ISBN 9780691214696. [Google Scholar]
- Zhang, H.; Shao, W.; Qiu, S.; Wang, J.; Wei, Z. Collaborative Analysis on the Marked Ages of Rice Wines by Electronic Tongue and Nose Based on Different Feature Data Sets. Sensors 2020, 20, 1065. [Google Scholar] [CrossRef] [Green Version]
- Dong, W.; Zhao, J.; Hu, R.; Dong, Y.; Tan, L. Differentiation of Chinese Robusta Coffees According to Species, Using a Combined Electronic Nose and Tongue, with the Aid of Chemometrics. Food Chem. 2017, 229, 743–751. [Google Scholar] [CrossRef]
- Banerjee, M.B.; Roy, R.B.; Tudu, B.; Bandyopadhyay, R.; Bhattacharyya, N. Black Tea Classification Employing Feature Fusion of E-Nose and E-Tongue Responses. J. Food Eng. 2019, 244, 55–63. [Google Scholar] [CrossRef]
- Zakaria, A.; Md. Shakaff, A.Y.; Adom, A.H.; Ahmad, M.N.; Masnan, M.J.; Aziz, A.H.A.; Fikri, N.A.; Abdullah, A.H.; Kamarudin, L.M. Improved Classification of Orthosiphon Stamineus by Data Fusion of Electronic Nose and Tongue Sensors. Sensors 2010, 10, 8782–8796. [Google Scholar] [CrossRef]
- Tian, X.; Wang, J.; Ma, Z.; Li, M.; Wei, Z.; Díaz-Cruz, J.M. Combination of an E-Nose and an E-Tongue for Adulteration Detection of Minced Mutton Mixed with Pork. J. Food Qual. 2019, 2019. [Google Scholar] [CrossRef] [Green Version]
- Hong, X.; Wang, J. Detection of Adulteration in Cherry Tomato Juices Based on Electronic Nose and Tongue: Comparison of Different Data Fusion Approaches. J. Food Eng. 2014, 126, 89–97. [Google Scholar] [CrossRef]
- Men, H.; Chen, D.; Zhang, X.; Liu, J.; Ning, K. Data Fusion of Electronic Nose and Electronic Tongue for Detection of Mixed Edible-Oil. J. Sens. 2014, 2014, 840685. [Google Scholar] [CrossRef] [Green Version]
- Dai, C.; Huang, X.; Huang, D.; Lv, R.; Sun, J.; Zhang, Z.; Ma, M.; Aheto, J.H. Detection of Submerged Fermentation of Tremella Aurantialba Using Data Fusion of Electronic Nose and Tongue. J. Food Process Eng. 2019, 42, 1–7. [Google Scholar] [CrossRef]
- Huang, L.; Zhao, J.; Chen, Q.; Zhang, Y. Nondestructive Measurement of Total Volatile Basic Nitrogen (TVB-N) in Pork Meat by Integrating near Infrared Spectroscopy, Computer Vision and Electronic Nose Techniques. Food Chem. 2014, 145, 228–236. [Google Scholar] [CrossRef] [PubMed]
- Korel, F.; Luzuriaga, D.A.; Balaban, M.Ö. Objective Quality Assessment of Raw Tilapia (Oreochromis Niloticus) Fillets Using Electronic Nose and Machine Vision. J. Food Sci. 2001, 66, 1018–1024. [Google Scholar] [CrossRef]
- Xu, M.; Wang, J.; Gu, S. Rapid Identification of Tea Quality by E-Nose and Computer Vision Combining with a Synergetic Data Fusion Strategy. J. Food Eng. 2019, 241, 10–17. [Google Scholar] [CrossRef]
- Huang, X.-Y.; Pan, S.-H.; Sun, Z.-Y.; Ye, W.-T.; Aheto, J.H. Evaluating Quality of Tomato during Storage Using Fusion Information of Computer Vision and Electronic Nose. J. Food Process Eng. 2018, 41, 1–7. [Google Scholar] [CrossRef]
- Liu, Q.; Sun, K.; Zhao, N.; Yang, J.; Zhang, Y.; Ma, C.; Pan, L.; Tu, K. Information Fusion of Hyperspectral Imaging and Electronic Nose for Evaluation of Fungal Contamination in Strawberries during Decay. Postharvest Biol. Technol. 2019, 153, 152–160. [Google Scholar] [CrossRef]
- Aheto, J.H.; Huang, X.; Tian, X.; Ren, Y.; Ernest, B.; Alenyorege, E.A.; Dai, C.; Hongyang, T.; Xiaorui, Z.; Wang, P. Multi-Sensor Integration Approach Based on Hyperspectral Imaging and Electronic Nose for Quantitation of Fat and Peroxide Value of Pork Meat. Anal. Bioanal. Chem. 2020, 412, 1169–1179. [Google Scholar] [CrossRef]
- Gutiérrez, M.; Llobera, A.; Vila-Planas, J.; Capdevila, F.; Demming, S.; Büttgenbach, S.; Mínguez, S.; Jiménez-Jorquera, C. Hybrid Electronic Tongue Based on Optical and Electrochemical Microsensors for Quality Control of Wine. Analyst 2010, 135, 1718–1725. [Google Scholar] [CrossRef]
- Gutiérrez, M.; Domingo, C.; Vila-Planas, J.; Ipatov, A.; Capdevila, F.; Demming, S.; Büttgenbach, S.; Llobera, A.; Jiménez-Jorquera, C. Hybrid Electronic Tongue for the Characterization and Quantification of Grape Variety in Red Wines. Sens. Actuators B Chem. 2011, 156, 695–702. [Google Scholar] [CrossRef]
- Gutiérrez-Capitán, M.; Santiago, J.-L.; Vila-Planas, J.; Llobera, A.; Boso, S.; Gago, P.; Martínez, M.-C.; Jiménez-Jorquera, C. Classification and Characterization of Different White Grape Juices by Using a Hybrid Electronic Tongue. J. Agric. Food Chem. 2013, 61, 9325–9332. [Google Scholar] [CrossRef] [Green Version]
- Bulbarello, A.; Cuenca, M.; Schweikert, L.; Mannino, S.; Scampicchio, M. Hybrid E-Tongue for the Evaluation of Sweetness and Bitterness of Soft Drinks Fortified with Epigallocatechin Gallate. Electroanalysis 2012, 24, 1989–1994. [Google Scholar] [CrossRef]
- Orlandi, G.; Calvini, R.; Foca, G.; Pigani, L.; Vasile Simone, G.; Ulrici, A. Data Fusion of Electronic Eye and Electronic Tongue Signals to Monitor Grape Ripening. Talanta 2019, 195, 181–189. [Google Scholar] [CrossRef]
- Pigani, L.; Vasile Simone, G.; Foca, G.; Ulrici, A.; Masino, F.; Cubillana-Aguilera, L.; Calvini, R.; Seeber, R. Prediction of Parameters Related to Grape Ripening by Multivariate Calibration of Voltammetric Signals Acquired by an Electronic Tongue. Talanta 2018, 178, 178–187. [Google Scholar] [CrossRef]
- Orlandi, G.; Calvini, R.; Pigani, L.; Foca, G.; Vasile Simone, G.; Antonelli, A.; Ulrici, A. Electronic Eye for the Prediction of Parameters Related to Grape Ripening. Talanta 2018, 186, 381–388. [Google Scholar] [CrossRef]
- di Rosa, A.R.; Leone, F.; Scattareggia, C.; Chiofalo, V. Botanical Origin Identification of Sicilian Honeys Based on Artificial Senses and Multi-Sensor Data Fusion. Eur. Food Res. Technol. 2018, 244, 117–125. [Google Scholar] [CrossRef]
- Apetrei, I.M.; Rodríguez-Méndez, M.L.; Apetrei, C.; Nevares, I.; del Alamo, M.; de Saja, J.A. Monitoring of Evolution during Red Wine Aging in Oak Barrels and Alternative Method by Means of an Electronic Panel Test. Food Res. Int. 2012, 45, 244–249. [Google Scholar] [CrossRef]
- Xu, M.; Wang, J.; Zhu, L. The Qualitative and Quantitative Assessment of Tea Quality Based on E-Nose, E-Tongue and E-Eye Combined with Chemometrics. Food Chem. 2019, 289, 482–489. [Google Scholar] [CrossRef]
- Prieto, N.; Gay, M.; Vidal, S.; Aagaard, O.; de Saja, J.A.; Rodriguez-Mendez, M.L. Analysis of the Influence of the Type of Closure in the Organoleptic Characteristics of a Red Wine by Using an Electronic Panel. Food Chem. 2011, 129, 589–594. [Google Scholar] [CrossRef]


| Artificial Senses | Biological Senses | Sensory Properties | Analytical Instruments |
|---|---|---|---|
| Electronic tongue | Tongue | Taste/Flavor | Electrochemical sensors, optical sensors, gravimetric sensors |
| Electronic nose | Nose | Odor/Aroma | Electrochemical sensors, optical sensors, gravimetric sensors |
| Electronic eye | Eye | Color | Colorimeter, spectrophotometer, RGB camera |
| Food Matrix | Aim of the Study | ET | EN | Data-Fusion Method | Ref. |
|---|---|---|---|---|---|
| Black tea | Quality assessment of black tea | 5 electrodes made of 5 different noble metals | 5 commercial MOS sensors | Mid-level of extracted features (wavelet) | [22] |
| Virgin olive oils | Characterize virgin olive oils from different geographical areas | 4 electrodes of different metals | 5 commercial MOS sensors | Low-level | [23] |
| Rice wines | Evaluating the marked ages of rice wines | 3 types of modified electrodes with conducting polymer | 12 MOS sensors | Low-level | [72] |
| Chinese Robusta coffees | Characterizationand classification of Chinese Robusta coffee cultivars | Commercial e-tongue | Commercial e-nose | Low-level | [73] |
| Black tea | Classification of different grade of black tea | 5 electrodes made of 5 different noble metals | 5 commercial MOS sensors | Mid-level of extracted features (wavelets) | [74] |
| Orthosiphon stamineus | Classification of Orthosiphon stamineus | 7 commercial ion-selective sensors | Commercial e-nose | Low-level | [75] |
| Meat | Recognition of organoleptic characteristics of minced mutton adulterated with pork | Commercial taste system | Commercial e-nose | Low-level fusion and mid-level fusion | [76] |
| Cherry tomato juices | Authentication of fresh cherry tomato juices adulterated with overripe tomato juices | Commercial e-tongue | Commercial e-nose | Low-level; mid-level with selected features (PCA scores, F selection, stepwise selection) | [77] |
| Edible oil | Detection of the blending ratio of old frying oil and new edible-oil | Gold electrode | 8 commercial gas sensors | Low-level | [78] |
| Mushroom | Detection of submerged fermentation | Commercial e-tongue | 10 commercial MOS sensors | Low-level | [79] |
| Food Matrix | Aim of the Study | EN | EE | Data-Fusion Method | Ref. |
|---|---|---|---|---|---|
| Pork meat | Determination of total volatile basic nitrogen content for evaluating pork freshness | 11 commercial MOS sensors | CCD camera | Mid-level with selected features | [80] |
| Tilapia fillets | Characterization of fresh and spoiled tilapia fillets | 12 commercial MOS sensors | CCD camera | Low-level | [81] |
| Longjing tea | Quality grading of tea samples | Commercial e-nose | CMOS camera | Mid-level with both feature extraction and feature selection High-level data fusion | [82] |
| Tomatoes | Prediction of ripening stage and quality parameters | 10 MOS sensors | CCD camera | Mid-level, fusion of first PCs of each block | [83] |
| Strawberries | Evaluation of fungal contamination on strawberries during decay and determination of quality attributes | Commercial e-nose | Vis-NIR hyperspectral imaging system (400–1000 nm) | Low-level Mid-level with extracted features (PCA scores) | [84] |
| Pork meat | Quantification of intramuscular fat and peroxide value | Commercial e-nose | Vis-NIR hyperspectral imaging system (400–1000 nm) | Mid-level with extracted features (PCA scores after variable selection) | [85] |
| Food Matrix | Aim of the Study | ET | EE | Data-Fusion Method | Ref. |
|---|---|---|---|---|---|
| Wine | Determination of quality parameters in red and white wines | Set of ISFET sensors | Spectrometer (200–1100 nm) | Mid-level with selected features | [86] |
| Wine | Characterization and quantification of grape varieties in red wines | Set of ISFET sensors | Spectrometer (200–1100 nm) | Mid-level with selected features | [87] |
| White grape juices | Discrimination of juices obtained from different grape varieties | Set of IFSET sensors | Lab-on-a-chip spectrophotometer (200–1100 nm) | Mid-level with selected features | [88] |
| Soft drinks fortified with extracts of green tea | Characterization of different formulations and prediction of sweetness and bitterness | 2 screen printed sensors | UV–Vis spectrometer | Low-level and mid-level | [89] |
| Grape must | Quantification of the chemical parameters used to assess phenolic ripening in grapes | PEDOT electrode and SNGC-electrode | Flatbed scanner | Low-level; mid-level with selected features Mid-level with extracted features (PLS scores) | [90] |
| Food Matrix | Aim of the Study | ET | EN | EE | Data-Fusion Method | Ref. |
|---|---|---|---|---|---|---|
| Extra virgin olive oils | Characterization of virgin olive oils from different varieties of olives and different degree of bitterness | Carbon paste Electrodes modified with olive oils | 13 commercial MOS sensors | Spectrophotometer (380–780 nm) | Low-level | [28] |
| Rice wines | Prediction of human sensory attributes of rice wine | Commercial e-tongue | Portable e-nose | Colorimeter | Low-level | [29] |
| Olive oils | Characterization of edible olive oils and quality decay assessment of extra virgin olive oil and olive oil during shelf-life tests | Commercial e-tongue | Commercial e-nose | Spectrophotometer (380–780 nm) | Mid-level with extracted features (PCA scores) | [30] |
| Longjing green tea | Classification of quality grades and quantification of quality indices | Commercial e-tongue | Commercial e-nose | Colorimeter | Low-level | [95] |
| Wine | Discrimination of wines with different oxygen levels and antioxidant capabilities | Modified carbon paste electrodes | 15 MOS sensors | UV–Vis spectrophotometer | Low-level | [96] |
Publisher’s Note: MDPI stays neutral with regard to jurisdictional claims in published maps and institutional affiliations. |
© 2022 by the authors. Licensee MDPI, Basel, Switzerland. This article is an open access article distributed under the terms and conditions of the Creative Commons Attribution (CC BY) license (https://creativecommons.org/licenses/by/4.0/).
Share and Cite
Calvini, R.; Pigani, L. Toward the Development of Combined Artificial Sensing Systems for Food Quality Evaluation: A Review on the Application of Data Fusion of Electronic Noses, Electronic Tongues and Electronic Eyes. Sensors 2022, 22, 577. https://0-doi-org.brum.beds.ac.uk/10.3390/s22020577
Calvini R, Pigani L. Toward the Development of Combined Artificial Sensing Systems for Food Quality Evaluation: A Review on the Application of Data Fusion of Electronic Noses, Electronic Tongues and Electronic Eyes. Sensors. 2022; 22(2):577. https://0-doi-org.brum.beds.ac.uk/10.3390/s22020577
Chicago/Turabian StyleCalvini, Rosalba, and Laura Pigani. 2022. "Toward the Development of Combined Artificial Sensing Systems for Food Quality Evaluation: A Review on the Application of Data Fusion of Electronic Noses, Electronic Tongues and Electronic Eyes" Sensors 22, no. 2: 577. https://0-doi-org.brum.beds.ac.uk/10.3390/s22020577